optimization of ultrasonic-assisted extraction of...
TRANSCRIPT
Optimization of Ultrasonic-Assisted Extraction of PhenolicCompounds from Apples
Lidija Jakobek1& Martina Boc1 & Andrew R. Barron2
Received: 20 October 2014 /Accepted: 18 March 2015 /Published online: 8 April 2015# Springer Science+Business Media New York 2015
Abstract In order to optimize conditions for the extraction ofpolyphenols from apples, peel and flesh of apples were sub-jected to an extraction process with different solventsconsisting of various ratios of methanol and water (40, 60,80 %), 100 % methanol, or with methanol acidified with hy-drochloric acid (0.1 %). Extractions were performed using anultrasonic bath with time periods from 5 to 15 min. Totalpolyphenols and total anthocyanins were analyzed using theFolin-Ciocalteau or the pH differential method, respectively.Individual polyphenols were analyzed with reversed-phasehigh-performance liquid chromatography with photodiode ar-ray detection (RP-HPLC-PDA). The differences in polyphe-nol content were statistically analyzed using t tests, associatedwith a regression model. The results showed that an efficientextraction from the peel could be performed with 80 % meth-anol to extract flavonols, anthocyanins, dihydrochalcones,and flavan-3-ols. Acidified methanol could also be useful forthe extraction of anthocyanins and flavonols from the peel.For the flesh, 80 % methanol could be a solvent of choicefor flavan-3-ols, dihydrochalcones, and hydroxycinnamicacids.
Keywords Ultrasonic extraction . RP-HPLC . Apples . Oldvarieties . Phenolic compounds
Introduction
Apples are a type of fruit used commonly in the human dietdue to their availability during the whole year, pleasant taste,and presence of many nutrients like vitamins and other bioac-tive compounds. Many studies have associated apples andtheir nutrients with the positive influence on the human health.Bioactive polyphenols from apples have shown antiviral prop-erties (Suárez et al. 2010), the inhibition of Helicobacterpylory (Pastene et al. 2009), and anticarcinogenic properties(Veeriah et al. 2007). Due to many positive effects, apples arestudied intensively.
Polyphenolic compounds are found in apples in highamounts (Escarpa and González 1998; Tsao et al. 2003;Veberic et al. 2005; Khanizadeh et al. 2008; Wojdylo et al.2008). The major polyphenolic groups are polimericproanthocyanidins composed of several flavan-3-ol mole-cules, monomeric flavan-3-ols (flavanols), flavonols, antho-cyanins, dihydrochalcones, and hydroxycinnamic acids(Escarpa and González 1998; Tsao et al. 2003; Veberic et al.2005; Khanizadeh et al. 2008;Wojdylo et al. 2008). Flavonolsand anthocyanins are usually found in the peel, although somered fleshed apples can have anthocyanins in the flesh as well(Jakobek et al. 2013). Proanthocyanidins/flavan-3-ols,dihydrochalcones, and hydroxycinnamic acids are the majorpolyphenol groups found in the apple flesh (Tsao et al. 2003;Khanizadeh et al. 2008; Lamperi et al. 2008; Balázs et al.2012; Jakobek et al. 2013).
Polyphenols are usually extracted from homogenized applesamples by liquid–solid extraction with different solvents.Solvents usually used are methanol (van der Sluis et al.2001; Napolitano et al. 2004), various ratios of water andmethanol (Arts and Hollman 1998; Escarpa and González1998; Tsao et al. 2003; Veberic et al. 2005; Khanizadehet al. 2008; Lamperi et al. 2008; Iacopini et al. 2010; Suárez
* Lidija [email protected]
1 Department of Applied Chemistry and Ecology, Faculty of FoodTechnology Osijek, J. J. Strossmayer University of Osijek, Kuhačeva20, 31000 Osijek, Croatia
2 Department of Statistics, Yale University, 24 Hillhouse Ave.,New Haven, CT 06511, USA
Food Anal. Methods (2015) 8:2612–2625DOI 10.1007/s12161-015-0161-3

et al. 2010), various ratios of water and acetone (Vanzani et al.2005; Suárez et al. 2010), various ratios of water, acetone, andmethanol (Hellström and Mattila 2008), or ratios of water,methanol acidified with hydrochloric acid (Wojdylo et al.2008), acetic acid (Alonso-Salces et al. 2004, 2005), or formicacid (Łata and Tomala 2007). The extraction is sometimesperformed by homogenizing solvent and apple materialin different periods of time (Tsao et al. 2003; Łata andTomala 2007; Khanizadeh et al. 2008; Lamperi et al.2008; Iacopini et al. 2010; Suárez et al. 2010) afterwhich extract are separated from apple material by fil-tration. The homogenization of apple material and sol-vents can be performed even with various shakers (Artsand Hollman 1998). Some studies used ultrasonic ex-traction (Escarpa and González 1998; van der Sluiset al. 2001; Napolitano et al. 2004; Alonso-Salceset al. 2005; Veberic et al. 2005; Wojdylo et al. 2008)which is more efficient and the extraction lasts shorterperiod of time. Usually, polyphenol extraction is per-formed separately from the apple peel and flesh(Escarpa and González 1998; Tsao et al. 2003;Alonso-Salces et al. 2005; Veberic et al. 2005;Khanizadeh et al. 2008; Lamperi et al. 2008) due todifferent polyphenol group found in peel and flesh, orit can be done in the whole apples (van der Sluis et al.2001; Vanzani et al. 2005; Wojdylo et al. 2008).
Since extraction process is the most important process forthe right determination of the polyphenol content, it is impor-tant to adjust extraction parameters which will perform thebest isolation of polyphenols. The improper extraction time,solvent, and plant material/solvent ratio could lead to insuffi-cient extraction of polyphenols. That is why for the properdetermination and quantification of polyphenols, the properextraction parameters should be chosen and optimized.
In this work, the extraction of polyphenolic compoundsfrom apples was studied. The polyphenols were extracted byusing different ratios of methanol and water and acidifiedmethanol, in different time periods. Extractions were per-formed by the help of ultrasonic bath. The polyphenolic com-pound content was determined spectrophotometrically (Folin-Ciocalteau method for total polyphenols and pH differentialmethod for total anthocyanins) and with reversed-phase high-performance liquid chromatography with photodiode arraydetection (RP-HPLC-PDA).
Materials and Methods
Samples and Sample Preparation
Two varieties of apples were used in this study: Lještarka andIdared. Old local apple (Malus domestica) variety BLještarka^was harvested in Croatia, region Slavonia, in a family orchard
(M. Veić) in Mihaljevci, near Požega. Apple had a dark redcolor. Apple Idared was purchased in a local supermarket.Samples of both varieties were prepared in the same way.Approximately, 1 kg of apples was peeled. The peeled fruitswere cut into quarters, seeds and core were removed, and fleshwas cut into smaller pieces. Flesh and peel were separatelyhomogenized by using a stick blender. Samples were kept in afreezer at −18 °C no more than 1 month.
Chemicals
Chemicals used in this study were purchased from severalfirms: gallic acid monohydrate (398225), (+)-catechin hydrate(C1251), (−)-epicatechin (E1753), chlorogenic acid (C3878),quercetin dihydrate (Q0125), and quercetin-3-β-D-glucoside(isoquercitrin—17793) were purchased from Sigma-Aldrich(St. Louis, MO, USA); procyanidin B1 (epicatechin(4β-8)cat-echin—0983), procyanidin B2 (epicatechin(4β-8)epicate-chin—0984), cyanidin-3-O-galactoside chloride (ideain chlo-ride—0923 S), cyanidin-3-O-glucoside chloride (kuromaninchloride—0915 S), quercetin-3-O-galactoside (hyperoside—1027 S), quercetin-3-O-rhamnoside (quercitrin—1236 S),phloretin-2′-O-glucoside (phloridzin—1046), and phloretin(1044) from Extrasynthese (Genay, France); orto-phosphoricacid (85 %) from Fluka (Buchs, Switzerland); HPLC grademethanol from J.T. Baker (Netherlands); hydrochloric acid(36.2 %), potassium chloride, sodium acetate trihydrate, sodi-um carbonate, and Folin-Ciocalteu reagent from Kemika (Za-greb, Croatia).
Extraction of Phenolic Compounds
The aim was to study the influence of extraction solvent, ex-traction time, and fruit weight/solvent ratio on the efficiencyof the total polyphenol and total anthocyanin extraction, sep-arately from flesh and peel. This part of the experiment wasconducted on the apple Idared. The extraction was performedin different time intervals, from 5 to 15 min, with the help ofvarious extraction solvents which included different ratios ofmethanol and water (40 % methanol, 60 % methanol, 80 %methanol), 100 % methanol, and acidified methanol (0.1 %HCl in methanol)). Shortly, samples of flesh (0.2 g) or peel(0.5 g) were weight, mixed with 5 ml of different extractionsolvents, vortexed, and placed in the ultrasonic bath for 5, 10,or 15 min. Extracts were filtered and used for the analysis oftotal polyphenols and total anthocyanins. The ratio of the fleshor peel weight to the solvent volume that efficiently extract themajority of polyphenols was examined too. Flesh and peel ofdifferent weight (0.1, 0.2, 0.5, and 0.75 g) in 5 ml of 80 %methanol were extracted 15 min by ultrasonic bath, and totalpolyphenols and total anthocyanins were analyzed in extracts.Additionally, to see how many polyphenols are left in theresidue, residues that gave the highest amount of polyphenols
Food Anal. Methods (2015) 8:2612–2625 2613
(0.1 and 0.2 g of flesh and peel) were subjected to a second(2 ml 80 % methanol) and third extraction (1 ml 80 %methanol).
The effect of extraction solvents on the individualpolyphenols was studied in two varieties: Lještarka andIdared. Flesh (0.5 g) and peel (0.5 g) were extracted inall extraction solvents for 15 min in an ultrasonic bath.Extracts were additionally filtered through a 0.45-μmPTFE syringe filter, and 20 μl was directly injected intothe RP-HPLC-PDA system.
Total Polyphenol and Total Anthocyanin Determination
Total polyphenols were determined by Folin-Ciocalteaumicro method (Waterhouse 2014). An aliquot (20 μl) ofextract was mixed with 1580 μl of distilled water and100 μl of Folin-Ciocalteau reagent. Three hundred mi-croliter of sodium carbonate solution (200 g l−1) wasadded to the mixture. The mixture was incubated at40 °C for 30 min in the water bath. The absorbancewas read at 765 nm on a UV–vis spectrophotometer(JP Selecta UV 2005, Barcelona, Spain). Solutions ofgallic acid from 0 to 500 mg l−1 were measured withthe same procedure, for the creation of the calibrationcurve. Total polyphenolics were expressed as milligramof gallic acid equivalents (GAE) per kilogram of freshfruit weight (FW).
Total anthocyanins were estimated by a pH differen-tial method (Giusti and Wrolstad 2001). Each extractwas diluted with two buffers: one was potassium chlo-ride buffer (pH 1.0) (1.86 g KCl in 1 l of distilledwater, pH value adjusted to 1.0 with concentratedHCl) and the other sodium acetate buffer (pH 4.5)(54.43 g CH3CO2Na·3H2O in 1 l of distilled water,pH value adjusted to 4.5 with concentrated HCl). Thedilution factor (DF) was 20. Extracts were incubated inthe dark for 15 min at room temperature. Absorbance ofboth dilutions was measured at 510 and 700 nm on aUV–vis spectrophotometer (JP Selecta UV 2005, Barce-lona, Spain). The absorbance of the extract was calcu-lated as Aextract=(A510−A700)pH 1,0− (A510−A700)pH 4,5.
The content of total anthocyanins was calculated accord-ing to the following equation:
Total anthocyanins mg l−1� � ¼ Aextract �MW � DF � 1000ð Þ= ε� lð Þ
where (ε) is the molar extinction coefficient ofcyanidin-3-glucoside (26,900 l mol−1 cm−1), MW isthe molar weight cyanidin-3-glucoside (449.2 g mol−1),DF is the dilution factor, and l is the cuvette pathlength (1 cm). The results were expressed in milligramof cyanidin-3-glucoside equivalents (CGEs) per kilo-gram of fresh fruit.
High-Performance Liquid ChromatographyMeasurement
Individual polyphenols in extracts were determined by usingRP-HPLC-PDA. Analytical system consisted of a Varian sys-tem (USA) equippedwith a ProStar 230 solvent deliverymod-ule and a ProStar 330 PDA Detector. Compounds were sepa-rated on an OmniSpher C18 column (250×4.6 mm inner di-ameter, 5 μm, Varian, USA) protected with guard column(ChromSep 1 cm×3 mm, Varian, USA). Mobile phase Awas 0.1 % phosphoric acid in water and mobile phase B100 % HPLC grade methanol. Gradient was as follows:0 min 5 % B; 0 to 5 min from 5 to 25 % B, 5 to 14 min from25 to 34 % B, 14 to 25 min from 34 to 37 % B, 25 to 30 minfrom 37 to 40 % B, 30 to 34 min from 40 to 49 % B, 34 to35min from 49 to 50%B, 35 to 58min from 50 to 51%B, 58to 60 min from 51 to 55% B, 60 to 62 min from 55 to 80% B,62 to 65 min 80 % B, 65 to 67 min from 80 to 5 % B, 67 to72 min 5 % B; with flow rate=0.8 ml min−1. Injection volumefor samples and standards was 20 μl; compounds were sepa-rated at room temperature. A 10-min re-equilibration periodwas used between individual runs. UV–vis spectra were re-corded in wavelength range from 190 to 600 nm. The detec-tion wavelength was 280 nm for procyanidins, monomericflavan-3-ols, and dihydrochalcones, 320 nm for phenolicacids, 360 nm for flavonols, and 510 nm for anthocyanins.
Identification was based on the comparison of retentiontimes and spectral data with those of authentic standards. Fur-thermore, extracts were spiked with polyphenol standardswhich gave additional information on polyphenol identifica-tion. Calibration curves of the standards were made by pre-paring stock standards in 100 % methanol ((+)-catechin, (−)-epicatechin, chlorogenic acid, quercetin, quercetin-3-rhamnoside, quercetin-3-galactoside, quercetin-3-glucoside),in ethanol (phloretin, phloridzin), in water (procyanidin B1,procyanidin B2), or in acidified methanol (0.1%HCl in meth-anol—cyanidin-3-galactoside, cyanidin-3-glucoside). Then,stock solutions were diluted and injected into RP-HPLC-PDA (0.8–160 mg l−1 (procyanidin B1); 1–225 mg l−1
(procyanidin B2); 2–250 mg l−1 ((+)-catechin, (−)-epicate-chin); 1–200 mg l−1 (phloretin, phloridzin); 1–132 mg l−1
(quercetin); 5–180 mg l−1 (quercetin-3-rhamnoside, querce-tin-3-glucoside, quercetin-3-galactoside); 1–240 mg l−1
(cyanidin-3-galactoside, cyanidin-3-glucoside); and 1–92 mg l−1 (chlorogenic acid). Identified compounds werequantified using calibration curves of authentic standards.All phenolic compounds showed a linear response withinrange studied (r2=0.9702–0.9999). Precision of the methodwas evaluated by determining within-day variation of theHPLC analysis (within-day precision). Coefficients of varia-tion (CV) of peak areas varied between 0.92 and 10.3 %. Todetermine recoveries, known amounts of standards (10–30 mg l−1) were added to extracts prior to HPLC analysis.
2614 Food Anal. Methods (2015) 8:2612–2625
The recoveries were in all cases higher than 92 %. In thecalculation of final results, no correction for recovery wasapplied to data.
Statistical Analysis
All extracts were made in duplicate and analyzed two timesfor total polyphenols and total anthocyanins or once with RP-HPLC-PDA. Data presented are mean±standard deviation(SD). The results for total polyphenols and total anthocyaninsafter 15 min of extraction and the RP-HPLC-PDA results forindividual polyphenols were analyzed using a regressionmodel using contrasts for comparing different sets of solventtype, with phenolic compound indicators included for statisti-cal control. Significance of differences of sets of solvent typein the regression model is determined by the T value in certainrows of the regression table and its associated p value at the0.05 and 0.01 levels for significance and strong significance.
Results and Discussions
The aim of the study was to find extraction conditions for theanalysis of polyphenols in apples. Since the extraction proce-dures can be time-consuming, with many steps likeliophilization, extraction, evaporation, cleaning procedures,the aim of this study was to find conditions which will avoidtoo many steps and still give good results. To avoidliophilization, the extraction was studied in fresh apple mate-rial. The extractions were obtained separately in the peel andflesh of apples due to different compounds found in thesematerials. To reach a good extractability of compounds, fruitweight to solvent ratio, appropriate solvent, and extractiontime were determined.
The Influence of the Extraction Solvent
Various solvents were examined for their extractability ofpolyphenols (40 %methanol, 60%methanol, 80%methanol,100 % methanol, and acidified methanol (0.1 % HCl in meth-anol)), in different time periods, from 5 to 15 min in the ultra-sonic bath (Tables 1 and 2). Total polyphenols were measuredwith the Folin-Ciocalteau method and total anthocyanins withthe pH differential method. With respect to the time of theextraction, generally it could be seen that the amount of totalpolyphenols and total anthocyanins from both peel and fleshincreased as the extraction time increased, for all solventsused. Extraction lasting for 30 min was also examined, andthe results were almost equal to the results obtained after15 min (data not shown). According to these results, 15 minin ultrasonic bath should be enough to efficiently extract poly-phenols from flesh and peel.
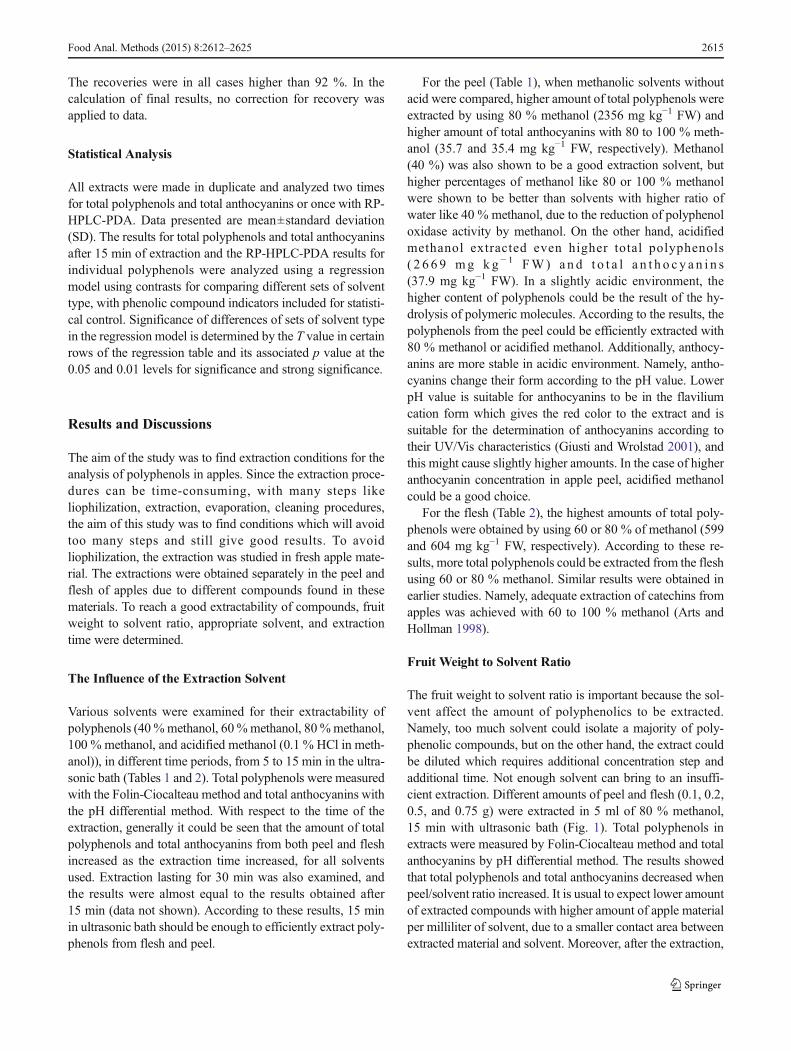
For the peel (Table 1), when methanolic solvents withoutacid were compared, higher amount of total polyphenols wereextracted by using 80 % methanol (2356 mg kg−1 FW) andhigher amount of total anthocyanins with 80 to 100 % meth-anol (35.7 and 35.4 mg kg−1 FW, respectively). Methanol(40 %) was also shown to be a good extraction solvent, buthigher percentages of methanol like 80 or 100 % methanolwere shown to be better than solvents with higher ratio ofwater like 40 % methanol, due to the reduction of polyphenoloxidase activity by methanol. On the other hand, acidifiedmethanol extracted even higher total polyphenols( 2 6 6 9 mg kg − 1 FW ) a n d t o t a l a n t h o c y a n i n s(37.9 mg kg−1 FW). In a slightly acidic environment, thehigher content of polyphenols could be the result of the hy-drolysis of polymeric molecules. According to the results, thepolyphenols from the peel could be efficiently extracted with80 % methanol or acidified methanol. Additionally, anthocy-anins are more stable in acidic environment. Namely, antho-cyanins change their form according to the pH value. LowerpH value is suitable for anthocyanins to be in the flaviliumcation form which gives the red color to the extract and issuitable for the determination of anthocyanins according totheir UV/Vis characteristics (Giusti and Wrolstad 2001), andthis might cause slightly higher amounts. In the case of higheranthocyanin concentration in apple peel, acidified methanolcould be a good choice.
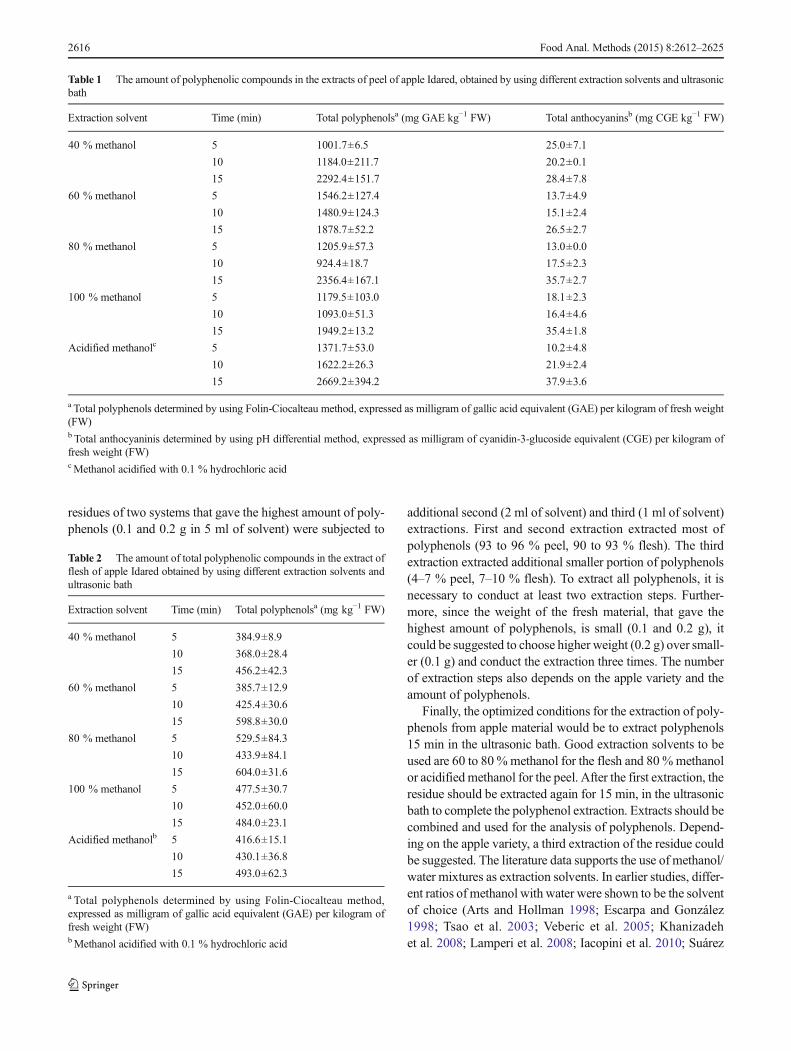
For the flesh (Table 2), the highest amounts of total poly-phenols were obtained by using 60 or 80 % of methanol (599and 604 mg kg−1 FW, respectively). According to these re-sults, more total polyphenols could be extracted from the fleshusing 60 or 80 % methanol. Similar results were obtained inearlier studies. Namely, adequate extraction of catechins fromapples was achieved with 60 to 100 % methanol (Arts andHollman 1998).
Fruit Weight to Solvent Ratio
The fruit weight to solvent ratio is important because the sol-vent affect the amount of polyphenolics to be extracted.Namely, too much solvent could isolate a majority of poly-phenolic compounds, but on the other hand, the extract couldbe diluted which requires additional concentration step andadditional time. Not enough solvent can bring to an insuffi-cient extraction. Different amounts of peel and flesh (0.1, 0.2,0.5, and 0.75 g) were extracted in 5 ml of 80 % methanol,15 min with ultrasonic bath (Fig. 1). Total polyphenols inextracts were measured by Folin-Ciocalteau method and totalanthocyanins by pH differential method. The results showedthat total polyphenols and total anthocyanins decreased whenpeel/solvent ratio increased. It is usual to expect lower amountof extracted compounds with higher amount of apple materialper milliliter of solvent, due to a smaller contact area betweenextracted material and solvent. Moreover, after the extraction,
Food Anal. Methods (2015) 8:2612–2625 2615
residues of two systems that gave the highest amount of poly-phenols (0.1 and 0.2 g in 5 ml of solvent) were subjected to
additional second (2 ml of solvent) and third (1 ml of solvent)extractions. First and second extraction extracted most ofpolyphenols (93 to 96 % peel, 90 to 93 % flesh). The thirdextraction extracted additional smaller portion of polyphenols(4–7 % peel, 7–10 % flesh). To extract all polyphenols, it isnecessary to conduct at least two extraction steps. Further-more, since the weight of the fresh material, that gave thehighest amount of polyphenols, is small (0.1 and 0.2 g), itcould be suggested to choose higher weight (0.2 g) over small-er (0.1 g) and conduct the extraction three times. The numberof extraction steps also depends on the apple variety and theamount of polyphenols.
Finally, the optimized conditions for the extraction of poly-phenols from apple material would be to extract polyphenols15 min in the ultrasonic bath. Good extraction solvents to beused are 60 to 80%methanol for the flesh and 80%methanolor acidified methanol for the peel. After the first extraction, theresidue should be extracted again for 15 min, in the ultrasonicbath to complete the polyphenol extraction. Extracts should becombined and used for the analysis of polyphenols. Depend-ing on the apple variety, a third extraction of the residue couldbe suggested. The literature data supports the use of methanol/water mixtures as extraction solvents. In earlier studies, differ-ent ratios of methanol with water were shown to be the solventof choice (Arts and Hollman 1998; Escarpa and González1998; Tsao et al. 2003; Veberic et al. 2005; Khanizadehet al. 2008; Lamperi et al. 2008; Iacopini et al. 2010; Suárez
Table 1 The amount of polyphenolic compounds in the extracts of peel of apple Idared, obtained by using different extraction solvents and ultrasonicbath
Extraction solvent Time (min) Total polyphenolsa (mg GAE kg−1 FW) Total anthocyaninsb (mg CGE kg−1 FW)
40 % methanol 5 1001.7±6.5 25.0±7.1
10 1184.0±211.7 20.2±0.1
15 2292.4±151.7 28.4±7.8
60 % methanol 5 1546.2±127.4 13.7±4.9
10 1480.9±124.3 15.1±2.4
15 1878.7±52.2 26.5±2.7
80 % methanol 5 1205.9±57.3 13.0±0.0
10 924.4±18.7 17.5±2.3
15 2356.4±167.1 35.7±2.7
100 % methanol 5 1179.5±103.0 18.1±2.3
10 1093.0±51.3 16.4±4.6
15 1949.2±13.2 35.4±1.8
Acidified methanolc 5 1371.7±53.0 10.2±4.8
10 1622.2±26.3 21.9±2.4
15 2669.2±394.2 37.9±3.6
a Total polyphenols determined by using Folin-Ciocalteau method, expressed as milligram of gallic acid equivalent (GAE) per kilogram of fresh weight(FW)b Total anthocyaninis determined by using pH differential method, expressed as milligram of cyanidin-3-glucoside equivalent (CGE) per kilogram offresh weight (FW)cMethanol acidified with 0.1 % hydrochloric acid
Table 2 The amount of total polyphenolic compounds in the extract offlesh of apple Idared obtained by using different extraction solvents andultrasonic bath
Extraction solvent Time (min) Total polyphenolsa (mg kg−1 FW)
40 % methanol 5 384.9±8.9
10 368.0±28.4
15 456.2±42.3
60 % methanol 5 385.7±12.9
10 425.4±30.6
15 598.8±30.0
80 % methanol 5 529.5±84.3
10 433.9±84.1
15 604.0±31.6
100 % methanol 5 477.5±30.7
10 452.0±60.0
15 484.0±23.1
Acidified methanolb 5 416.6±15.1
10 430.1±36.8
15 493.0±62.3
a Total polyphenols determined by using Folin-Ciocalteau method,expressed as milligram of gallic acid equivalent (GAE) per kilogram offresh weight (FW)bMethanol acidified with 0.1 % hydrochloric acid
2616 Food Anal. Methods (2015) 8:2612–2625

et al. 2010). Furthermore, methanol can reduce the polyphenoloxidase activity, which can catalyze the oxidation and poly-merization of polyphenols to brown pigments (Arts andHollman 1998). By reducing polyphenol oxidase activity,methanol can protect polyphenols and allow better extraction.Acidified methanol was also used as a solvent (Ceymann et al.2012), and it could be a good solution in the case of apple peel
that contain anthocyanins. On the other hand, acetone wasshown to be suitable for the extraction of polymericproanthocyanidins (Hellström and Mattila 2008), but thesecompounds were not the aim of this study. The extraction ofpolymeric procyanidins from apples with different solventswill be the aim of the future study.
Analysis of Extracts with RP-HPLC-PDA
The RP-HPLC-PDA method was developed and validated forthe determination of individual polyphenols. Compoundswere identified by using spectral data and retention times ofauthentic standards. Additionally, extracts were spiked withknown standards to confirm the identification. Some of themwere tentatively identified by using literature data, likephloretin-2′-xyloglucoside (Tsao et al. 2003; Alonso-Salceset al. 2004; Pastene et al. 2009; Balázs et al. 2012; Jakobeket al. 2013), quercetin-3-xyloside (Jakobek et al. 2013), and p-coumaroylquinic acid (Tsao et al. 2003; Jakobek et al. 2013).Identified compounds are shown in Fig. 2. In the apple peel(Fig. 2), the most dominant compounds were quercetin deriv-atives. Several peaks could belong to kaempferol or(iso)rhamnetin derivatives, but they were not identified. Be-sides flavonols (quercetin derivatives), peel containedchlorogenic acid from the hydroxycinnamic acid group,cyanidin-3-galactoside from the anthocyanin group, someflavan-3-ols like (+)-catechin, (−)-epicatechin, procyanidinB2, and phloridzin from the dihydrochalcone group. All ofthese compounds were found in apple peel in earlier studies(Escarpa and González 1998; Tsao et al. 2003; Khanizadehet al. 2008; Lamperi et al. 2008; Balázs et al. 2012; Jakobeket al. 2013). Favonols and anthocyanins are characteristiccompounds of the peel. Earlier studies reported galactoside,glucoside, xyloside, arabonoside, and rhamnoside derivativesof quercetin (van der Sluis et al. 2001; Tsao et al. 2003;Khanizadeh et al. 2008; Lamperi et al. 2008) and various(iso)rhamnetin and kaempferol derivatives (Alonso-Salceset al. 2004; Jakobek et al. 2013). Anthocyanins reported inthe peel are galactoside of cyanidin (van der Sluis et al. 2001;Tsao et al. 2003; Alonso-Salces et al. 2004; Khanizadeh et al.2008), other cyanidin derivatives (Lamperi et al. 2008; Balázset al. 2012; Jakobek et al. 2013), and even malvidin deriva-tives (Balázs et al. 2012).
In the flesh (Fig. 2), the most dominant compounds werephloridzin and phloretin-2′-xyloglucoside that belong to thegroup of dihydrochalchones, chlorogenic acid, and p-coumaroylquinic acid from hydrocycinnamic acid group,(+)-catechin, (−)-epicatechin from monomeric flavan-3-ols, and procyanidin B1 and procyanidin B2 from thedimeric procyanidins. The same compounds were iden-tified in earlier studies (Escarpa and González 1998;Tsao et al. 2003; Napolitano et al. 2004; Khanizadehet al. 2008; Lamperi et al. 2008; Ceymann et al.
a
b
c
0
20
40
60
80
100
0 0.1 0.2
% o
f th
e h
igh
est a
mo
un
t
g fresh peel / ml solvent
Peel
total polyphenols
0
20
40
60
80
100
0 0.1 0.2
% o
f th
e h
igh
est a
mo
un
t
g fresh peel/ ml solvent
Peel
total anthocyanins
0
20
40
60
80
100
0 0.1 0.2% o
f th
e h
igh
est a
mo
un
t
g fresh flesh / ml solvent
Flesh
total polyphenols
Fig. 1 The influence of fruit weight/solvent volume on the extractabilityof a total polyphenols from peel, b total anthocyanins from peel, c totalpolyphenols from flesh (Idared). Total polyphenols and totalanthocyanins determined by using Folin-Ciocalteau and pH differentialmethods, respectively
Food Anal. Methods (2015) 8:2612–2625 2617
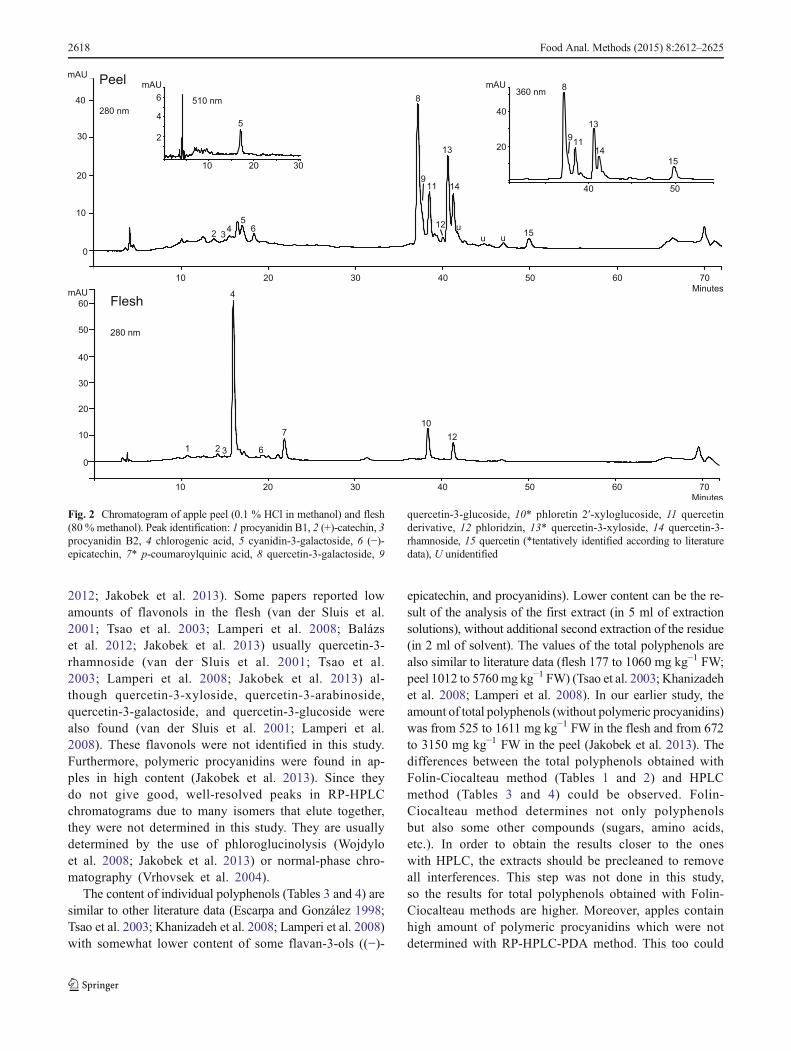
2012; Jakobek et al. 2013). Some papers reported lowamounts of flavonols in the flesh (van der Sluis et al.2001; Tsao et al. 2003; Lamperi et al. 2008; Balázset al. 2012; Jakobek et al. 2013) usually quercetin-3-rhamnoside (van der Sluis et al. 2001; Tsao et al.2003; Lamperi et al. 2008; Jakobek et al. 2013) al-though quercetin-3-xyloside, quercetin-3-arabinoside,quercetin-3-galactoside, and quercetin-3-glucoside werealso found (van der Sluis et al. 2001; Lamperi et al.2008). These flavonols were not identified in this study.Furthermore, polymeric procyanidins were found in ap-ples in high content (Jakobek et al. 2013). Since theydo not give good, well-resolved peaks in RP-HPLCchromatograms due to many isomers that elute together,they were not determined in this study. They are usuallydetermined by the use of phloroglucinolysis (Wojdyloet al. 2008; Jakobek et al. 2013) or normal-phase chro-matography (Vrhovsek et al. 2004).
The content of individual polyphenols (Tables 3 and 4) aresimilar to other literature data (Escarpa and González 1998;Tsao et al. 2003; Khanizadeh et al. 2008; Lamperi et al. 2008)with somewhat lower content of some flavan-3-ols ((−)-
epicatechin, and procyanidins). Lower content can be the re-sult of the analysis of the first extract (in 5 ml of extractionsolutions), without additional second extraction of the residue(in 2 ml of solvent). The values of the total polyphenols arealso similar to literature data (flesh 177 to 1060 mg kg−1 FW;peel 1012 to 5760mg kg−1 FW) (Tsao et al. 2003; Khanizadehet al. 2008; Lamperi et al. 2008). In our earlier study, theamount of total polyphenols (without polymeric procyanidins)was from 525 to 1611 mg kg−1 FW in the flesh and from 672to 3150 mg kg−1 FW in the peel (Jakobek et al. 2013). Thedifferences between the total polyphenols obtained withFolin-Ciocalteau method (Tables 1 and 2) and HPLCmethod (Tables 3 and 4) could be observed. Folin-Ciocalteau method determines not only polyphenolsbut also some other compounds (sugars, amino acids,etc.). In order to obtain the results closer to the oneswith HPLC, the extracts should be precleaned to removeall interferences. This step was not done in this study,so the results for total polyphenols obtained with Folin-Ciocalteau methods are higher. Moreover, apples containhigh amount of polymeric procyanidins which were notdetermined with RP-HPLC-PDA method. This too could
Fig. 2 Chromatogram of apple peel (0.1 % HCl in methanol) and flesh(80 % methanol). Peak identification: 1 procyanidin B1, 2 (+)-catechin, 3procyanidin B2, 4 chlorogenic acid, 5 cyanidin-3-galactoside, 6 (−)-epicatechin, 7* p-coumaroylquinic acid, 8 quercetin-3-galactoside, 9
quercetin-3-glucoside, 10* phloretin 2′-xyloglucoside, 11 quercetinderivative, 12 phloridzin, 13* quercetin-3-xyloside, 14 quercetin-3-rhamnoside, 15 quercetin (*tentatively identified according to literaturedata), U unidentified
2618 Food Anal. Methods (2015) 8:2612–2625

Tab
le3
The
amount
ofindividualpolyphenoliccompounds
determ
ined
with
RP-HPL
C-PDAin
extractsof
peelobtained
bydifferentextractionsolventsandultrasonicbath
for15
min
Phenoliccompound
Polyphenols
(mgkg
−1FW)
40%
methanol
60%
methanol
80%
methanol
100%
methanol
Acidified
methanol
Lještarka
Idared
Lještarka
Idared
Lještarka
Idared
Lještarka
Idared
Lještarka
Idared
Flavonols
Quercetin-3-galactoside
399.2±6.6
237.1±10.4
345.1±17.7
205.1±12.6
370.9±9.1
254.3±8.5
305.6±4.7
237.1±10.1
347.7±7.6
268.6±14.6
Quercetin-3-glucoside
103.1±6.5
106.6±8.4
78.2±2.2
74.0±9.1
87.6±4.1
105.0±4.7
79.2±2.3
86.9±18.9
64.5±5.9
92.1±0.2
Quercetin
derivativ
e1
19.9±1.8
12.1±1.1
24.7±3.4
6.9±0.7
27.9±1.4
12.3±5.0
21.1±2.2
10.0±1.7
28.1±0.1
14.2±2.4
Quercetin-xylosidea
48.7±5.9
35.8±3.9
58.4±4.2
30.9±1.3
67.9±3.5
39.6±8.4
53.1±4.2
36.8±4.8
48.8±4.6
31.7±6.6
Quercetin-3-rhamnoside
48.4±1.8
46.4±2.1
72.5±1.7
40.1±0.0
90.3±7.4
49.1±7.5
74.4±0.2
46.2±6.6
81.9±2.3
56.8±8.4
Quercetin
bdl
ndbdl
ndbdl
ndbdl
nd29.0±3.3
11.3±1.2
Dihydrochalcones
Phloridzin
9.0±0.5
12.1±0
10.7±0.7
12.1±1.3
11.4±1.1
15.7±3.4
9.9±0.5
13.3±1.5
9.8±1.3
24.7±6.1
Anthocyanins
Cyanidin-3-galactoside
1.4±0.3
7.0±0.7
6.8±0.4
9.3±0.4
7.7±0.6
44.3±8.6
1.0±0.4
22.5±7.3
4.0±2.1
33.5±4.6
Flavan-3-ols
ProcyanidinB1
nd12.6±1.4
nd7.3±1.0
nd7.4±0.8
nd7.2±2.2
nd19.4±1.3
(+)-Catechin
bdl
14.4±0.5
bdl
13.9±0.4
bdl
11.3±1.5
bdl
10.4±2.9
22.2±2.0
18.0±2.8
ProcyanidinB2
22.1±9.9
29.5±1.8
28.7±3.6
32.0±0.5
27.2±2.5
38.1±4.2
nd33.0±0.8
22.9±1.8
37.3±2.2
(−)-Epicatechin
9.4±1.1
5.0±0.7
6.4±1.3
9.5±1.3
6.1±0.4
13.3±2.0
3.4±0.1
9.2±2.6
47.2±2.3
42.0±8.6
Hydroxycinnam
icacids
Chlorogenicacid
3.1±0.1
7.9±0.2
3.2±0.1
8.9±0.5
3.7±0.2
12.8±7.3
3.9±0.3
8.9±1.0
3.8±0.1
14.7±0.2
Total
664.6±33.9
526.5±31.3
634.7±23.1
449.9±29.2
700.7±29.9
603.2±61.8
551.6±13.1
521.6±60.5
681.0±25.7
653.2±58.4
bdlb
elow
detectionlim
it,nd
notd
etected
aTentativelyidentified
Food Anal. Methods (2015) 8:2612–2625 2619
Tab
le4
The
amount
ofindividualpolyphenoliccompounds
determ
ined
with
RP-HPL
C-PDAin
extractsof
fleshobtained
bydifferentextractionsolventsandultrasonicbath
for15
min
Phenoliccompound
Polyphenols
mgkg
−1FW
40%
methanol
60%
methanol
80%
methanol
100%
methanol
Acidified
methanol
Lještarka
Idared
Lještarka
Idared
Lještarka
Idared
Lještarka
Idared
Lještarka
Idared
Flavan-3-ols
ProcyanidinB1
7.0±0.1
5.4±0.7
7.7±0.3
5.1±1.1
13.9±1.1
4.4±0.3
9.9±1.2
4.0±0.2
6.6±0.6
5.6±0.7
(+)-Catechin
9.8±0.8
6.8±1.4
4.3±0.6
4.4±0.8
14.8±1.6
10.9±2.1
10.4±0.9
3.5±0.9
18.1±0.8
13.7±2.3
ProcyanidinB2
nd31.0±2.3
nd28.5±2.6
28.1±1.7
31.0±5.8
23.0±0.5
23.3±1.6
24.7±0.6
26.9±1.8
(−)-Epicatechin
8.8±0.7
2.4±0.3
4.6±0.4
3.3±0.4
7.9±0.9
5.7±1.6
4.9±0.9
2.3±1.0
28.9±0.5
3.4±1.2
Dihydrochalcones
Phloretin
-2′-x
yloglucoside
a27.1±3.5
16.3±2.0
31.3±1.0
16.3±2.7
33.7±1.2
16.3±2.9
27.2±0.9
14.6±0.9
29.7±0.2
15.8±1.0
Phloridzin
22.8±2.1
10.4±2.4
23.7±4.4
11.0±2.9
26.5±1.3
12.1±1.7
21.8±2.1
12.5±2.7
24.0±2.3
16.7±5.1
Hydroxycinnam
icacids
Chlorogenicacid
158.3±4.3
5.6±2.7
212.0±4.8
9.1±0.6
242.9±9.4
12.2±4.0
192.1±6.4
10.4±3.0
162.4±10.7
6.8±1.0
p-Coumaroylquinicacida
9.0±0.7
8.8±0.1
10.3±0.4
7.8±0.5
5.6±0.7
Total
242.8±12.2
77.8±11.7
291.7±11.6
77.7±11.2
378.1±17.6
92.6±18.4
297.1±13.4
70.5±10.3
300.0±16.4
88.9±13.1
ndnotd
etected
aTentativelyidentified
2620 Food Anal. Methods (2015) 8:2612–2625

affect somewhat lower content of total polyphenols de-termined with HPLC method.
The Influence of the Extraction Solvent on IndividualPolyphenols
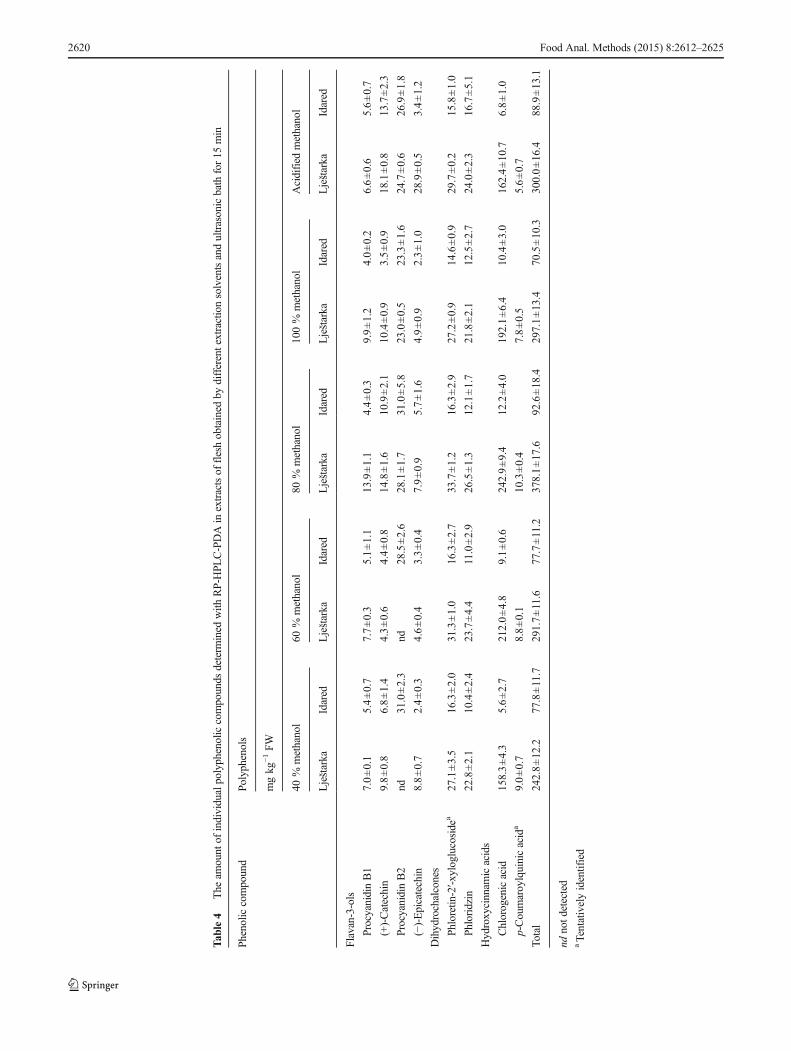
The influence of the solvent on the extractability of individualpolyphenols was studied in two varieties: Lještarka andIdared. In the apple peel (Table 3), somewhat higher contentof individual polyphenols was extracted with 80 % methanol(quercetin derivatives, phloridzin, cyanidin-3-glucoside, epi-catechin) when different ratios of water and methanol werecompared. In acidified methanol, the content of most polyphe-nols was similar to 80 % methanol, but the content of mono-meric polyphenols such as (+)-catechin, (−)-epicatechin, andquercetin increased significantly. This is probably due to hy-drolysis reactions which occur in acidic environment. Further-more, total polyphenols obtained by 80 % methanol and acid-ified methanol show the highest values. According to theseresults, 80 % methanol could be a good choice to extractpolyphenols from apple peel because it gives high amount ofpolyphenols but does not cause hydrolysis reactions as acidi-fied one. Since peel contains anthocyanins as well, which aremore stable in acidified methanol (Giusti and Wrolstad 2001),the solvent of choice could be acidified methanol as well. Itcould be mentioned that the peak area of unidentified flavonolderivatives also increased as the methanol percentage in-creased and is the highest when methanol is acidified(Fig. 2). This could mean that for the extraction of flavonols,acidified methanol could also be a good choice due to betterdiversity of flavonols extracted. In the case of the extractionwith acidified methanol, it should be known that a hydrolysisreaction will cause the breakdown of some polymeric mole-cules which will cause higher amount of aglycons like cate-chins or quercetin.
In the flesh (Table 4), 80 % methanol gave higher contentof some individual polyphenols (procyanidin B1 and B2,chlorogenic acid, and (+)-catechin) and total polyphenols incomparison to other methanol/water solvents. Acidified meth-anol, on the other hand, extracted significantly higher contentof compounds like (+)-catechin and (−)-epicatechin. Highercontent of these compounds could be the result of the hydro-lysis of oligomeric and polymeric proanthocyanidins in anacidic environment. Namely, proanthocyanidins are more sus-ceptible to hydrolysis due to labile nature of interflavonoidbonds toward acids (Hellström and Mattila 2008). The resultof hydrolysis in an acidic environment is the higher content ofmonomeric flavan-3-ols. Because apple flesh contains highamount of flavan-3-ols (monomeric flavan-3-ols, oligomericand polymeric procyanidins), the solvent of choice could bethe mixture of methanol and water (80 % methanol) whichdoes not influence the hydrolysis of the major polyphenoliccompounds. Finally, according to the HPLC results,
polyphenols from the flesh could be efficiently extracted byusing 80 % methanol and polyphenols from the peel by using80 % or acidified methanol. This is in accordance with theliterature data (Arts and Hollman 1998). Van der Sluis et al.(2001) examined the extraction of polyphenols from appleswith water, 50 % methanol, 100 % methanol, and methanolwith 15% acetic acid.Water was not suitable for the extractionof compounds, and there was no difference between 50 %,100 % methanol, and acidified methanol for the majority ofcompounds (flavonols, anthocyanins, catechins, andphloridzin) (van der Sluis et al. 2001). But, epicatechin andchlorogenic acid were extracted better with 100 % methanolor acidified methanol. This is in agreement with our studyconsidering the fact that they did not examine other ratios ofwater/methanol, between 50 to 100 %.
Statistical Model
For the HPLC data, a four-factor regression model was set upwith suitable contrasts to test which sets of solvent types arebest overall (Table 5). The three most important factors (ex-planatory variables) are the solvent type, the type of phenoliccompound, and a factor specifying the part of apple (peel vsflesh). A fourth factor that plays a minor role specifies whetherit was apple Lještarka or Idared. These factors were carefullyencoded so that individually they provide orthogonal variablesfor the regression and they remain orthogonal whenmultipliedtogether to account for statistical interactions.
With two observations for each case, there are a total of 370potential polyphenol measurements analyzed in these data.There are three cases of missing pairs of procyanidin-B2 atspecific methanol levels (without acidification), in Lještarka.For these cases, estimates of the missing values from iteratingthe regression fit (initialized at zero estimates) were imputed,with the understanding that properly analyzed, there is a slightcorresponding adjustment (by three) to the degrees of freedomin the estimation of the standard errors, to retain statisticalvalidity. The estimated missing values for these absentprocyanidin-B2 cases are 24.6 for 100 % methanol, in thepeel, and 20.0 with 40 % methanol, and again 20.0 with60 % methanol, in the flesh. By using these imputed missingvalues for procyanidin-B2, rather than zeros, disruption to thequality of the additive fits in to the rest of the measured caseswas avoided.
The cases of compounds with larger concentrations exhibitlarger variability of measurements. For these data, the stan-dard deviation increases approximately linearly with thesquare root of the mean. Accordingly, to stabilize the variance,the square root of the polyphenol concentration was modeled.(In contrast, if the standard deviation were proportional to themean, the case of constant coefficient of variation, then wewould model the logarithm of the concentrations). Only if thestandard deviations were approximately constant
Food Anal. Methods (2015) 8:2612–2625 2621
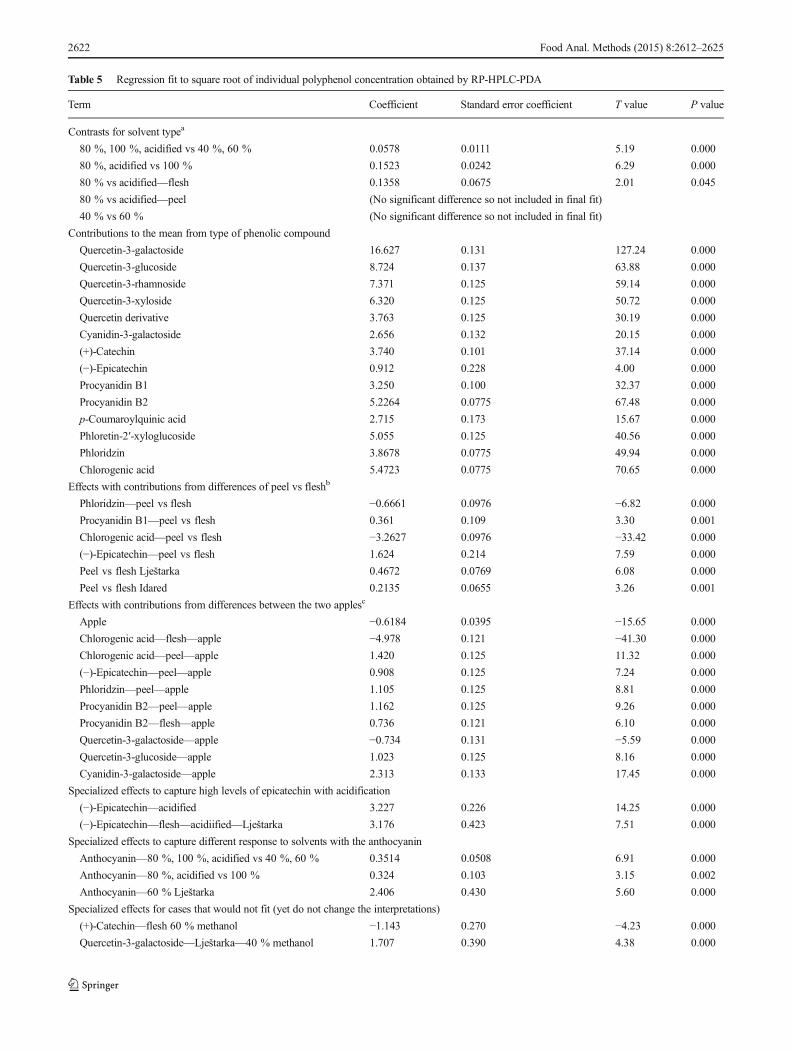
Table 5 Regression fit to square root of individual polyphenol concentration obtained by RP-HPLC-PDA
Term Coefficient Standard error coefficient T value P value
Contrasts for solvent typea
80 %, 100 %, acidified vs 40 %, 60 % 0.0578 0.0111 5.19 0.000
80 %, acidified vs 100 % 0.1523 0.0242 6.29 0.000
80 % vs acidified—flesh 0.1358 0.0675 2.01 0.045
80 % vs acidified—peel (No significant difference so not included in final fit)
40 % vs 60 % (No significant difference so not included in final fit)
Contributions to the mean from type of phenolic compound
Quercetin-3-galactoside 16.627 0.131 127.24 0.000
Quercetin-3-glucoside 8.724 0.137 63.88 0.000
Quercetin-3-rhamnoside 7.371 0.125 59.14 0.000
Quercetin-3-xyloside 6.320 0.125 50.72 0.000
Quercetin derivative 3.763 0.125 30.19 0.000
Cyanidin-3-galactoside 2.656 0.132 20.15 0.000
(+)-Catechin 3.740 0.101 37.14 0.000
(−)-Epicatechin 0.912 0.228 4.00 0.000
Procyanidin B1 3.250 0.100 32.37 0.000
Procyanidin B2 5.2264 0.0775 67.48 0.000
p-Coumaroylquinic acid 2.715 0.173 15.67 0.000
Phloretin-2′-xyloglucoside 5.055 0.125 40.56 0.000
Phloridzin 3.8678 0.0775 49.94 0.000
Chlorogenic acid 5.4723 0.0775 70.65 0.000
Effects with contributions from differences of peel vs fleshb
Phloridzin—peel vs flesh −0.6661 0.0976 −6.82 0.000
Procyanidin B1—peel vs flesh 0.361 0.109 3.30 0.001
Chlorogenic acid—peel vs flesh −3.2627 0.0976 −33.42 0.000
(−)-Epicatechin—peel vs flesh 1.624 0.214 7.59 0.000
Peel vs flesh Lještarka 0.4672 0.0769 6.08 0.000
Peel vs flesh Idared 0.2135 0.0655 3.26 0.001
Effects with contributions from differences between the two applesc
Apple −0.6184 0.0395 −15.65 0.000
Chlorogenic acid—flesh—apple −4.978 0.121 −41.30 0.000
Chlorogenic acid—peel—apple 1.420 0.125 11.32 0.000
(−)-Epicatechin—peel—apple 0.908 0.125 7.24 0.000
Phloridzin—peel—apple 1.105 0.125 8.81 0.000
Procyanidin B2—peel—apple 1.162 0.125 9.26 0.000
Procyanidin B2—flesh—apple 0.736 0.121 6.10 0.000
Quercetin-3-galactoside—apple −0.734 0.131 −5.59 0.000
Quercetin-3-glucoside—apple 1.023 0.125 8.16 0.000
Cyanidin-3-galactoside—apple 2.313 0.133 17.45 0.000
Specialized effects to capture high levels of epicatechin with acidification
(−)-Epicatechin—acidified 3.227 0.226 14.25 0.000
(−)-Epicatechin—flesh—acidiified—Lještarka 3.176 0.423 7.51 0.000
Specialized effects to capture different response to solvents with the anthocyanin
Anthocyanin—80 %, 100 %, acidified vs 40 %, 60 % 0.3514 0.0508 6.91 0.000
Anthocyanin—80 %, acidified vs 100 % 0.324 0.103 3.15 0.002
Anthocyanin—60 % Lještarka 2.406 0.430 5.60 0.000
Specialized effects for cases that would not fit (yet do not change the interpretations)
(+)-Catechin—flesh 60 % methanol −1.143 0.270 −4.23 0.000
Quercetin-3-galactoside—Lještarka—40 % methanol 1.707 0.390 4.38 0.000
2622 Food Anal. Methods (2015) 8:2612–2625
(homoschedastic) would it be statistically appropriate to notdo a transformation.
The data could also be analyzed by separate regressions forthe peel and for the flesh for Lještarka and for Idared. Fortu-nately, there are enough statistical similarities between thesethat a suitable combinedmodel captures the means with only afew regressors needed to explain what differences there arebetween peel and flesh and between Lještarka and Idared.
The regression proceeded by first including all main effectsand sensible pairwise interactions, examining the strongly sig-nificant residuals to suggest additional interactions for inclu-sion, and then, removing all contributions to the model that arenot statistically significant. Except where explicitly indicated,only the strongly statistically significant terms (p<0.01) wereincluded, and by the indicated procedure, we arrange all theresiduals to be less than 3 standard errors away from 0. Table 5provides the resulting regression fit to the square root of theconcentration individual polyphenols.
This is a comparatively parsimonious model with 44 pa-rameters (coefficients) fit, with mostly main effects and inter-pretable low-order statistical interactions, compared to using162 fit means. All of the coefficients in this model are stronglystatistically significant. The one exception is the coefficientfor the contrast testing 80 % methanol vs acidified methanol,for the flesh. These two solvent solutions perform similarly.
Statistically, the 80 % is significantly better (p<0.05) but notstrongly so. This model confirms what was suggested fromTables 3 and 4 that 80 %methanol gave the highest amount ofpolyphenols in the flesh with HPLC method through experi-ments. Moreover, 80 % methanol would still be suggested forthe extraction from the flesh due to hydrolysis reaction inacidified methanol. As for peel, the statistical model showsno significant difference between the two best solvent solu-tions: 80 % methanol and acidified methanol. This is also astatistical confirmation of the experimental results for the peel.
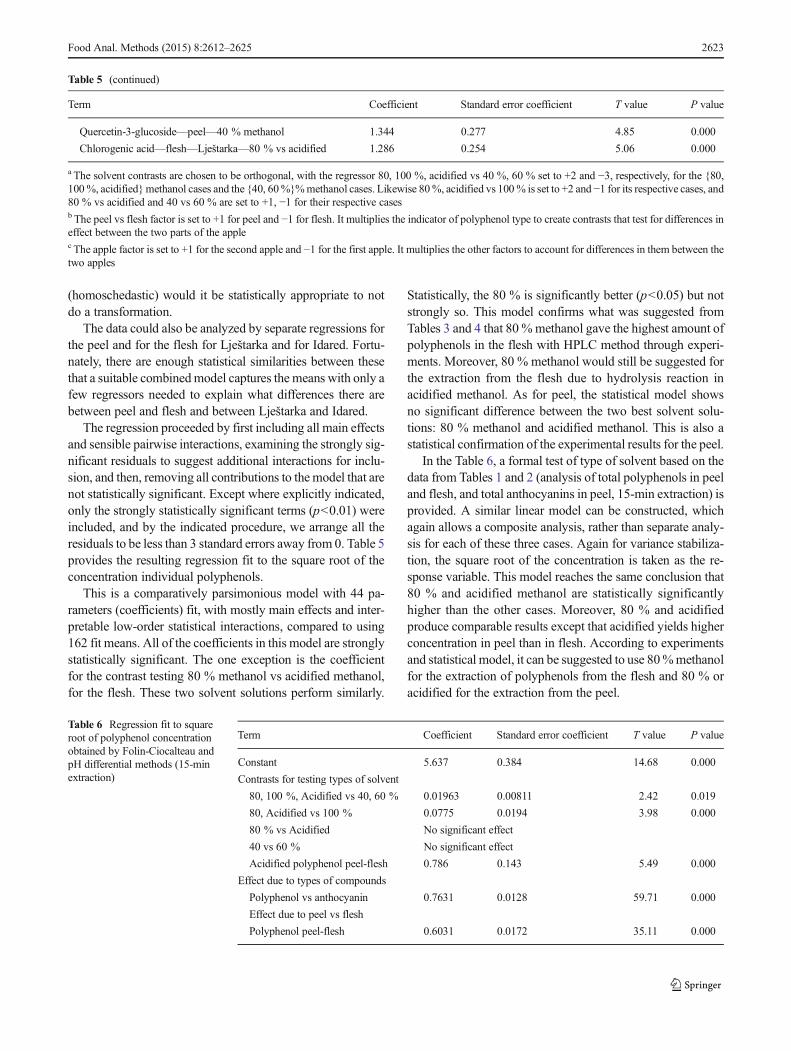
In the Table 6, a formal test of type of solvent based on thedata from Tables 1 and 2 (analysis of total polyphenols in peeland flesh, and total anthocyanins in peel, 15-min extraction) isprovided. A similar linear model can be constructed, whichagain allows a composite analysis, rather than separate analy-sis for each of these three cases. Again for variance stabiliza-tion, the square root of the concentration is taken as the re-sponse variable. This model reaches the same conclusion that80 % and acidified methanol are statistically significantlyhigher than the other cases. Moreover, 80 % and acidifiedproduce comparable results except that acidified yields higherconcentration in peel than in flesh. According to experimentsand statistical model, it can be suggested to use 80%methanolfor the extraction of polyphenols from the flesh and 80 % oracidified for the extraction from the peel.
Table 6 Regression fit to squareroot of polyphenol concentrationobtained by Folin-Ciocalteau andpH differential methods (15-minextraction)
Term Coefficient Standard error coefficient T value P value
Constant 5.637 0.384 14.68 0.000
Contrasts for testing types of solvent
80, 100 %, Acidified vs 40, 60 % 0.01963 0.00811 2.42 0.019
80, Acidified vs 100 % 0.0775 0.0194 3.98 0.000
80 % vs Acidified No significant effect
40 vs 60 % No significant effect
Acidified polyphenol peel-flesh 0.786 0.143 5.49 0.000
Effect due to types of compounds
Polyphenol vs anthocyanin 0.7631 0.0128 59.71 0.000
Effect due to peel vs flesh
Polyphenol peel-flesh 0.6031 0.0172 35.11 0.000
Table 5 (continued)
Term Coefficient Standard error coefficient T value P value
Quercetin-3-glucoside—peel—40 % methanol 1.344 0.277 4.85 0.000
Chlorogenic acid—flesh—Lještarka—80 % vs acidified 1.286 0.254 5.06 0.000
a The solvent contrasts are chosen to be orthogonal, with the regressor 80, 100 %, acidified vs 40 %, 60 % set to +2 and −3, respectively, for the {80,100%, acidified}methanol cases and the {40, 60%}%methanol cases. Likewise 80%, acidified vs 100% is set to +2 and −1 for its respective cases, and80 % vs acidified and 40 vs 60 % are set to +1, −1 for their respective casesb The peel vs flesh factor is set to +1 for peel and −1 for flesh. It multiplies the indicator of polyphenol type to create contrasts that test for differences ineffect between the two parts of the applec The apple factor is set to +1 for the second apple and −1 for the first apple. It multiplies the other factors to account for differences in them between thetwo apples
Food Anal. Methods (2015) 8:2612–2625 2623
Conclusions
In conclusion, various mixtures of methanol and water wereused in order to extract polyphenolic compounds from peeland flesh of apples by the help of ultrasonic bath. Additionally,acidified methanol was also used as an extraction solvent(0.1 % HCl in methanol). Extraction process was conductedin various time periods. The results showed that an efficientliquid–solid extraction could be performed with 80 %methano l to ex t r ac t f l avono l s , an thocyan ins ,dihydrochalcones, and flavan-3-ols from the peel. Acid-ified methanol could also be useful for the peel due tobetter stability of anthocyanins in acidified environmentand higher diversity of flavonols. In case of using acid-ified methanol, it should be noticed that the appearanceof monomers could be seen, due to hydrolysis of big-ger, dimeric, oligomeric, and polymeric molecules. Forthe extraction of polyphenols from the flesh, 80 %methanol is the solvent of choice for monomeric andoligomeric f lavan-3-ols , dihydrochalcones, andhydroxycinnamic acids.
Acknowledgments We thank Mr. M. Veić for his donation of applesamples for this research. The research was funded by the J.J.Strossmayer University of Osijek project: Characterization of polyphe-nols in old apple cultivars.
Compliance with Ethical Standards
Conflict of Interest Authors Jakobek Lidija, Boc Martina, Barron R.Andrew declare that they have no conflict of interest.
Research Involving Human Participants and/or Animals This arti-cle does not contain any studies with human participants or animals per-formed by any of the authors.
Informed Consent Informed consent was obtained from all individualparticipants included in the study.
References
Alonso-Salces RM, Ndjoko K, Querizon EF, Ioset JR, Hostettmann K,Berrueta LA, Gallo B, Vicente F (2004) On-line characterisation ofapple polyphenols by liquid chromatography coupled with massspectrometry and ultraviolet absorbance detection. J Chromatogr A1046:89–100
Alonso-Salces RM, Barranco A, Corta E, Berrueta LA, Gallo B, VicenteF (2005) A validated solid–liquid extraction method for the HPLCdetermination of polyphenols in apple tissues comparison withpressurised liquid extraction. Talanta 654–662
Arts ICW, Hollman PCH (1998) Optimization of a quantitative methodfor the determination of catechins in fruits and legumes. J AgricFood Chem 46:5156–5162
Balázs A, Tóth M, Blazics B, Héthelyi E, Szarka S, Ficsor E, Ficzek G,Lemberkovics É, Blázovics A (2012) Investigation of dietary im-portant components in selected red fleshed apples by GC–MS andLC–MS. Fitoterapia 83:1356–1363
Ceymann M, Arrigoni E, Schärer H, Nising AB, Hurrell RF (2012)Identification of apples rich in health-promoting flavan-3-ols andphenolic acids my measuring the polyphenol profile. J FoodCompos Anal 26:128–135
Escarpa A, González MC (1998) High performance liquid chromatogra-phy with diode-array detection for the determination of phenoliccompounds in peel and pulp from different apple varieties. JChromatogr A 823:331–337
Giusti MM, Wrolstad RE (2001) Anthocyanins. Characterization andmeasurement with UV-visible spectroscopy. In: Wrolstad RE (ed)Current protocols in food analytical chemistry. Wiley, New York, ppF1.2.1–F1.2.13
Hellström JK, Mattila PH (2008) HPLC determination of extractable andunextractable proanthocyanidins in plant material. J Agric FoodChem 56:7617–7624
Iacopini P, Camangi F, Stefani A, Sebastiani L (2010) Antiradical poten-tial of ancient Italian apple varieties ofMalus x domestica Borkh in aperoxynitrite-induced oxidative process. J Food Compos Anal 23:518–524
Jakobek L, García-Villalba R, Tomás-Barberán FA (2013) Polyphenoliccharacterisation of old apple varieties from Southeastern Europeanregion. J Food Compos Anal 31:199–211
Khanizadeh S, Tsao R, Rekika D, Yang R, Charles MT, Rupasinghe HPV(2008) Polyphenol composition and total antioxidant capacity ofselected apple genotypes for processing. J Food Compos Anal 21:396–401
Lamperi L, Chiuminatto U, Cincinelli A, Galvan P, Giordani E,Lepri L, Del Bubba M (2008) Polyphenol levels and freeradical scavenging activities of four apple cultivars from in-tegrated and organic farming in different Italian areas. JAgric Food Chem 56:6536–6546
Łata B, Tomala K (2007) Apple peel as a contributor towhole fruit qualityof potentially healthful bioactive compounds. Cultivar and year im-plication. J Agric Food Chem 55:10795–10802
Napolitano A, Cascone A, Graziani G, Ferracane R, Scalfi L, Di Vaio C,Ritieni A, Fogliano V (2004) Influence of variety and storage on thepolyphenol composition of apple flesh. J Agric Food Chem 52:6526–6531
Pastene E, Troncoso M, Figueroa G, Alarcón J, Speisky H (2009)Association between polymerization degree of apple peel polyphe-nols and inhibition of Helicobacter pylori Urease. J Agric FoodChem 57:416–424
Suárez B, Álvarez AL, Garcia YD, del Barrio G, Lobo AP, Parra F (2010)Phenolic profiles, antioxidant activity and in vitro antiviral proper-ties of apple pomace. Food Chem 120:339–342
Tsao R, Yang R, Young JC, Zhu H (2003) Polyphenolic profiles in eightapple cultivars using high-performance liquid chromatography(HPLC). J Agric Food Chem 51:6347–6353
Van der Sluis AA, Dekker M, de Jager A, Jongen WMF (2001) Activityand concentration of polyphenolic antioxidants in Apple: effect ofcultivar, harvest year, and storage conditions. J Agric Food Chem49:3606–3613
Vanzani P, Rossetto M, Rigo A, Vrhovsek U, Mattivi F, D’Amato E,Scarpa M (2005) Major phytochemicals in apple cultivars: contri-bution to peroxyl radical trapping efficiency. J Agric Food Chem 53:3377–3382
Veberic R, Trobec M, Herbinger K, Hofer M, Grill D, Stampar F (2005)Phenolic compounds in some apple (Malus domestica Borkh) culti-vars of organic and integrated production. J Sci Food Agric 85:1687–1694
Veeriah S, Hofmann T, Glei M, Dietrich H, Will F, Schreier P, Knaup B,Pool-Zobel BL (2007) Apple polyphenols and products formed inthe gut differently inhibit survival of human cell lines derived fromcolon adenoma (LT97) and carcinoma (HT29). J Agric Food Chem55:2892–2900
2624 Food Anal. Methods (2015) 8:2612–2625

Vrhovsek U, Rigo A, Tonon D, Mattivi F (2004) Quantitation ofpolyphenols in different apple varieties. J Agric Food Chem52:6532–6538
Waterhouse A, Folin-Ciocalteau micro-method for total phenol in wine.http://waterhouse.ucdavis.edu/faqs/folin-ciocalteau-micro-method-for-total-phenol-in-wine. Accessed 1 Sept 2014
Wojdylo A, Oszmiański J, Laskowski P (2008) Polyphenolic compoundsand antioxidant activity of new and old apple varieties. J Agric FoodChem 56:6520–6530
Food Anal. Methods (2015) 8:2612–2625 2625