optimization of affinity and ion-exchange chromatographic...
TRANSCRIPT
Optimization of Affinity and Ion -Exc h a n g e Chromatographic Processes for the Purification of Proteins
Q. M. Mao and M. T. W. Hearn* Centre for Bioprocess Technology, Department of Biochemistry and Molecular Biology, Monash University, Clayton, Victoria, 3 168, Australia
Received September 29, 1995/Accepted April 18, 1996
This study documents several alternative approaches for the optimization of the ion-exchange and affinity chro- matographic purification of proteins. In these ap- proaches, the chromatographic process has been treated as a four-stage (adsorption, washing, elution, and regen- eration) operation. Central to these investigations has been the elaboration of practical iterative procedures based on the use of theoretical models describing each of these stages. Predictions derived from these models have then been evaluated in terms of experimental data obtained using batch adsorption measurements in finite bath configurations and frontal breakthrough measure- ments with packed beds of different dimensions, con- taining nonporous and porous adsorbents of different selectivities and capacities for proteins. Commencing with the kinetic and distribution parameters derived from batch equilibrium measurements, the effect of the initial concentration of the target protein, the solid-liquid vol- ume ratio, the superficial velocity and the column dimen- sions on the pressure drop, production rate, concentra- tion profile, column utilization, and yield have been de- termined with packed beds. The potential of these iterative approaches to simplify the determination of key mass transfer and interaction parameters required for scale-up and economic optimization of chromatographic purifications of proteins has been examined using ion exchange, immobilized metal ion affinity, and triazine dye pseudo-affinity adsorbents of different selectivity and adsorption capacities. 0 1996 John Wiley & Sons, Inc. Key words: protein purification ion exchange chroma- tography metal ion affinity
INTRODUCTION The importance of chromatographic methods for the large- scale purification of high-value proteins has been increas- ingly recognized over the past decade (Clonis, 1990; H e m , 1989; Jungbauer, 1993). Competitive commercial pressures involved in product development mean that improved ap- proaches to process scale-up and optimization are needed (Cowan et al., 1989; Dantigny et al., 1991; Janson and Hed- man, 1987; Levison et al., 1992; Mao et al., 1992, 1993). It is generally accepted that optimization work based on simu- lation with mathematical models should be cheaper, more comprehensive, and more versatile than can be achieved
* To whom correspondence should be addressed. Telephone: Int + 61- 3-9905-3720; fax: 61-3-9905-5882; e-mail: milton.hearn@ med.monasb.edu.au
solely from repetitive laboratory experiments. With trial- and-error activities as currently used with most large-scale processes, long periods of time are required with consider- able outlays in terms of staff costs and consumables.
While various mathematical models have been developed for individual components of the chromatographic process (e.g., for the individual adsorption, washing, elution, and regeneration steps), when addressing the optimization and scaling-up of the total chromatographic process, no one gen- erally accepted simulation method has yet emerged (Cramer and Subramanian, 1990; Dantigny et al., 1991; Felinger and Guiochon, 1992; Grushka, 1989; Leser and Asenjo, 1992; Mao et al., 1992, 1993; Suwondo et al., 1991; Whitley et al., 1991; Yu et al., 1991). Most published studies in the scien- tific literature pertinent to the physical validation of the different theoretical models used to describe chromato- graphic processes with proteins have been limited to studies with breakthrough curves related predominantly to the ad- sorption step, although recently some effort has been de- voted to the application of mathematical modeling of actual complete biochromatographic processes. For example, Dan- tigny et al. (1991) have studied the influence of the adsorp- tion kinetics constants, the maximum capacity of the col- umn, and the effect of axial dispersion on the extent of product loss as well as the use of column capacity and productivity for a column loaded to an effluent concentra- tion of 5% of the influent value followed by washing. Simi- larly, Mao et al. (1992, 1993) have studied the effect of flow rate and the terminating effluent concentration on the pro- duction rate, the yield, and the column capacity utilization for the adsorption of proteins with biomimetic dye affinity systems.
The literature on the theory of packed-bed adsorption and its application to affinity and ion-exchange chromatography has significantly evolved over the past decade [see, for ex- ample, Cowan et al. (1989), Liapis (1989), and Johnston and Hearn (1991)l. These earlier treatments have generally been based on the substantial body of knowledge derived from chemical engineering analysis of (simple) chromatographic systems, primarily involving low molecular weight solutes. It is now recognized that the adsorption and desorption be- havior of proteins can be markedly different to low molecu- lar weight organic compounds. Much more complex chro-
Biotechnology and Bioengineering, Vol. 52, Pp. 204-222 (1996) 0 1996 John Wiley & Sons, Inc. CCC 0006-3592/96/020204-19

matographic equilibria arise with proteins and other high molecular weight biopolymers, and this behavior leads to greater difficulties in obtaining analytical solutions to the rigorous mathematical models. Substantial simplifications and assumptions are often necessary in order to obtain use- ful solutions. For example, it is commonly assumed with low molecular weight compounds that linear adsorption iso- therm approximations may be used. However, in common with more complex compound mixtures, affinity chromato- graphic studies of systems with proteins often display char- acteristics of nonlinear adsorption isotherms. Moreover, with these systems the availability of suitable experimental data proteins encompassing a complete chromatographic process for model verification has typically been limited.
Overall, the theoretical models for the affinity and ion- exchange chromatographic separation of proteins thus far developed fall into two groups. In the first group (group I) models, a single mechanism is assumed as the rate-limiting step for all conditions under study, involving either pore diffusion (Arnold et al., 1985) or surface interaction mecha- nisms (Chase, 1984). Such assumptions greatly simplify the analysis and allow analytical solutions of the concentration profile-time relationship to be obtained. Group I models have proved simple to use for the preliminary evaluation of column performance but fail to address the impact of im- portant parameters such as the particle size and specific mass transfer coefficients or surface interaction rate con- stants, which may assume considerable importance if flow rates or loading conditions are changed. Group I1 models, on the other hand, attempt to interpret the physical basis of the mass transfer phenomenon as the protein mixture passes over the chromatographic particles in a stirred tank, a packed bed, or an expanded bed by more comprehensive theoretical analysis. These group I1 models are more rigor- ous with all of the potential rate-limiting steps in biospecific or chemospecific adsorption processes considered, includ- ing the external liquid film mass transfer, internal pore dif- fusion, and surface interaction (Arve and Liapis, 1987, 1988; Hearn and Anspach, 1990; Horstmann and Chase, 1989; Liapis, 1989; Liapis et al., 1989; Yu et al., 1991). The resulting complexity of these theoretical treatments means that analytical solutions are not possible, and various nu- merical methods are needed to solve the equations. Cur- rently, such numerical iterations result in excessive compu- tation time and special software packages (Cowan et al., 1989; Horstmann and Chase, 1989) which are routinely not available or readily employed in a “user-friendly” manner by process operators.
The present investigations address a practical procedure based on the application of mathematical models for the selection of operating parameters with ion-exchange or af- finity chromatographic beds as part of integrated protein purification processes. This procedure has been developed for use with porous and nonporous particles in finite baths and packed columns. Computer simulations, generated from the analysis of the concentration-time profiles, derived from batch and packed-bed adsorption and washing stage
experiments with different adsorbents and mixtures of pro- teins form part of the selection procedure for the appropriate choice of fluid velocity, sample loading volume and con- centration, the time to terminate a particular stage, and the column length and diameter. The primary objective of these investigations was thus to develop more user-friendly ap- proaches and associated software which can be used to maintain maximum production rates for these different stages during scale-up, while ensuring that the basic require- ments of product yield and purity at predetermined levels were achieved. Increasing the mobile phase flow rate and increasing column loading were used as the main avenues to achieve high production rates. These investigations demon- strate that the exact values of these parameters (flow rate, volume, and time) will be dependent upon the economics of the specific procedures.
EXPERIMENTAL METHODS
The acquisition of the experimental data described in this article were based on equipment set-up and operating pro- cedures described elsewhere (Anspach et al., 1989, 1990; Johnston et al., 1991; Wirth, 1990; Wirth et al., 1993). Three affinity adsorbents were used: Cibacron blue F3GA modified 1.5-pm-diameter nonporous silica particles (Ans- pach et al., 1990; Wirth, 1990), iminodiacetic acid- copper(I1) (IDA-Cu2+) modified 1 .5-pm-diameter nonpo- rous silica particles (Wirth, 1990; Wirth et al., 1993), and Cibacron blue F3GA immobilized Fractosil 1000 silica gel (E. Merck, Darmstadt, Germany), average particle size 80.9 pm (Dasari et al., 1993; Mao et al., 1993) with concanav- din-A and hen egg white lysozyme as adsorbates. Prepara- tion of the surface modified 1.5-pm-diameter nonporous silica particles was based on procedures developed previ- ously in this Centre. Two ion-exchange adsorbents were also used, namely diethylaminoethyl (DEAE) Sepharose fast flow (Pharmacia Biotech AB, Uppsala, Sweden) and DEAE Trisacryl M (Biosepra Inc., Marlborough) with human se- rum albumin (HSA), as a 21% solution from CSL Ltd. (Melbourne, Australia).
The computer programs BEDNPF, BCHAMF, BCHAMP, BEDSTS, and BEDSTP using the mathematical models described in this article were written in FORTRAN. These programs and sample data files are available from the authors on request. The computation was carried out using an IBM PC compatible machine linked to a VAX 8700 mainframe computer.
MODEL DEVELOPMENT
Basic Considerations
Due to the complexity of the protein-adsorbent systems which is experienced in large-scale ion-exchange and affin- ity chromatography, it is not possible to identify an ideal optimum operating condition from a single analytical chro-
MA0 AND HEARN: AFFINITY AND ION-EXCHANGE CHROMATOGRAPHIC PROCESSES 205
matographic experiment. This investigation thus aimed at defining an optimum region of a parameter set within which the predetermined production criteria can be achieved. Since a large number of simulation experiments could in principle be required, the development of simple, yet rigor- ous mathematical models was essential. Analytical solu- tions or semianalytical solutions were thus preferred over the numerical methods. The models were intended to take into account the effects of all major rate-limiting factors as well as to accommodate the influence of different types of adsorption isotherms. The mass transfer coefficients will largely be affected by the physical properties of the protein- adsorbent system. These properties include the particle size, pore size, and pore fraction of the adsorbent, the particle rigidity, the size and shape of the adsorbate molecules, the bed porosity, fluid flow rate, and fluid viscosity. Fluid vis- cosity, in turn, is a function of the temperature and the fluid composition. The factors influencing the surface interaction behavior of the protein-adsorbent system have their basis more in the chemical nature of the protein, adsorbent, and mobile phase composition. In particular, the ligand density and distribution, the distribution of charged, hydrogen bonding or hydrophobic sites on the surface of the protein, the protein conformation, and the nature of the interplay between the protein and components in the solvent will all contribute to the surface interaction behavior. The influence of these chemical equilibria effects on the chromatographic behavior, to a large extent, are still not as well understood as the effects due to the physical properties of the system. It was thus important that separate parameters were used to describe the surface interaction and the mass transfer be- havior of proteins. Although some parameters (such as mass transfer coefficients) may be less rigorous due to the sim- plification required for fast calculation, they nevertheless provide a starting point for the more detailed (and usually more time-consuming) studies with the group I1 models.
Models for a Finite Bath
The various chromatographic processes employed in a packed-bed configuration for protein separation involve four stages (adsorption, washing, elution, and regeneration) as a sequence of events. In cases where the feed concentra- tion is very low, large quantities of liquid have to be pro- cessed. The time taken to make full use of the adsorptive capacity of the chromatographic bed may become very long in this circumstance, as flow rates are constrained by the pressure drop. The operating time can be reduced by car- rying out the adsorption stage in a stirred tank (i.e., as a finite bath) (Yang et al., 1989). With fermentation broths or biological extracts containing cell debris and other solid contaminants, a stirred tank may be preferable for the ad- sorption stage to avoid clogging of the packed bed. For the initial studies of protein adsorption processes at a laboratory scale, a finite bath is often a simple and cheaper tool to use.
A useful literature relating to experimental studies on protein adsorption hnetics and equilibrium behavior in fi-
nite baths for both affinity and ion-exchange adsorbents is available (see, for example, Anspach et al., 1989; Horst- mann and Chase, 1989; Horstmann et al., 1986; Johnston and Hearn, 1990,199 1 ; McCoy and Liapis, 199 1 ; Skidmore et al., 1990; Yang et al., 1989). Various mathematical mod- els have been developed, incorporating data on the adsorp- tion behavior of proteins in a finite bath (Arnold et al., 1985; Arve and Liapis, 1987; Chase, 1984; Horstmann and Chase, 1989; Horstmann et al., 1986; McCoy and Liapis, 1991; Mao et al., 1993; Skidmore et al., 1990). In the following section, a combined batch adsorption model (BAM,,,,) was developed to describe the dynamic adsorption behavior of proteins in a finite bath, initially for nonporous particles. The effects of both surface interaction and film mass trans- fer have been addressed. Due to the absence of pore diffu- sion, analytical solutions for the model and its two simpli- fied cases were derived. The model was then extended to cover the case of porous particles by using a linear driving force approximation (Ma0 et al., 1991, 1993) to describe the pore diffusion process.
Adsorption with Nonporous Particles: The BAMcomb Model
In a finite bath, a volume of fluid containing the proteins (adsorbates) of interest is brought into contact with a quan- tity of adsorbent at time zero in a well-mixed vessel. Inter- action is then allowed to occur for a period of time as equilibrium is approached. The basic assumptions for the rate-limiting steps involved in the simplest case of the BAM,,,, model for the adsorption process in a finite bath are (a) the transport of adsorbate from the bulk fluid to the surface of the particle can be described by a film resistance mechanism and (b) the interactions between the adsorbate and the adsorption sites at the particle surface can be de- scribed by a Langmuir-type model. Extended versions of this model can be derived to accommodate non- Langmuirean isothermal systems and, in the case of com- plex multicomponent mixtures, nonlinear adsorption behav- ior. Implicit to the above treatment, the finite bath is as- sumed to be well mixed, and therefore the concentration of the adsorbate in the liquid phase is uniform throughout the finite bath.
With the above assumptions, the mass balance for the adsorbate in the liquid phase and the rate equations for mass transfer and surface interaction can be established. The de- tailed derivation of the equations for the BAM,,, are pre- sented in Appendix 1. Analytical solutions of the BAM,,, were obtained and the concentration-time profiles for a given system readily calculated. In this model both the film mass transfer and surface interaction rates are considered finite. Two simplifying cases can be considered. First if the surface interaction rate constant k , -+ m, the external mass transfer becomes the rate-controlling step and a simplified solution of the model can be obtained. Because this case implies that equilibrium exists between the adsorbate and the adsorbate-ligand complex at each point on the particle
206 BIOTECHNOLOGY AND BIOENGINEERING, VOL. 52, NO. 2, OCTOBER 20, 1996
surface, this mass-transfer-controlling case of the B AM,,,, was designated BAM,,,. Second, if the liquid film mass transfer coefficient Kf + a, then the surface interaction (second-order kinetics) can be considered as the rate- controlling step and designated the kinetic controlling case of the BAM,,,,, abbreviated as BAM,,. This analytical solution produces a similar result to that derived from the equations of Horstmann et al. (1986) and can be used di- rectly to calculate the time-concentration profile. In the cases where the value of the liquid mass transfer coefficient Kf is finite, a bisectional method was adopted to calculate the profiles. For actual processes described subsequently, these solutions were used to estimate the time required to reach a predetermined final concentration in the finite bath.
Adsorption with Porous Particles: The BAMcomb
The BAM,,,, was then modified for the adsorption behav- ior with porous particles. A linear driving force approxima- tion was used to describe the mass transfer of the adsorbate in the liquid from the entrance of the pores at the external surface to the particle internal surface. With this approxi- mation, the pore fluid can be treated as a mass transfer medium rather than a separate phase, thus enabling it to be combined with the bulk fluid in the overall mass balance. In order to extend the BAMcomb to porous adsorbents, the mass balance, rate-limiting steps, and mass transfer coefficients were independently considered.
In an actual process, the pores of the adsorbent particles are normally filled with buffer liquid before the adsorption process starts. The overall mass balance was established based on this assumption. As the volume of pore fluid is normally very small in comparison with the volume of bulk fluid in a bath system, it may be neglected or lumped with the bulk fluid. Hence, two simplifying options can be con- sidered, with the differential form of the mass balance equa- tions the same as with the nonporous particles, with differ- ent phase volume ratios. The rate-limiting steps in an ad- sorption process are the mass transfers and the surface interaction. For protein adsorption processes, the effect of both steps should be taken into account (Johnston and Hearn, 1991). For porous particles, as the internal surface area is normally much greater than the external surface area, the effect of the external surface area may be neglected (in the case where the external surface area is less than, e.g., 1.0% of the total surface area) or lumped with the internal surface area in the modeling process. Hence, the finite bath model (BAM,,,,) with porous particles proposed here as- sumes that surface interaction will predominantly occur when the adsorbate reaches the internal surface of the par- ticles.
The BAMP,,,, considers that the transport of adsorbate from the bulk fluid to the internal surface of the particle occurs in two stages. In the first stage the protein diffuses through a thin film to reach the external surface of the particle where the entrances to the pores are located; then in the second stage the protein diffuses through the pore fluid,
which is stagnant, to reach the particle internal surface, where the surface interaction between the adsorbates and the ligand predominantly occurs. As both the liquid film on the external surface of the particle and the pore fluid are the media for mass transfer, both processes may be described by a linear driving force approximation. Therefore, the mass transfer rates of the different protein adsorbates from the bulk fluid to the internal particle surface can be expressed in terms of the relevant physical parameters.
Assuming that the volume of the liquid film is negligible, and there is no accumulation of the adsorbates in the pore fluid, the rate of change in the concentration of each adsor- bate in the solid phase then must equal the rate of mass transfer. As shown in Appendix 1, the overall resistance to the mass transfer is the sum of the resistance in the liquid film and the resistance in the pore fluid. In an analogous manner, the interaction between the proteins and the immo- bilized ligands at the internal particle surface can be de- scribed by the second-order reversible equation. This equa- tion is the same as for nonporous particles, except that the adsorbate concentration(s) in the liquid phase at the external surface of the particles, C*, is replaced by C,, the concen- tration of adsorbate in the liquid phase at the internal surface of the particles.
Models for a Packed Column
As part of these investigations, two models were used to predict protein elution profiles for columns packed with nonporous and porous adsorbents. The nonporous particle adsorption model (NPPAM) was developed specifically for use with nonporous particles in packed beds and has an analytical solution. The sectional adsorption model (SAM) developed for porous adsorbents in packed beds uses the equations of the BAM,,,, model as its key algorithm.
Nonporous Particle Adsorption Model
The "PAM seeks to develop predictive capability for the biospecific and ion-exchange adsorption behavior of pro- teins with nonporous particles in packed columns, permit- ting optimum performance characteristics to be determined, particularly with regard to the effect of particle size, load- ing, and flow rates. Briefly, the following assumptions were used to initially establish the simplest case of the NPPAM: (a) the effect of axial diffusion is negligible and the fluid velocity is uniform over the cross section of the column; (b) transport of adsorbate from the bulk fluid to the surface of the particle can be described by a film resistance mecha- nism; and (c) the interaction between the protein adsor- bate(s) and the immobilized ligand at the particle surface is described by a Langmuir-type model. Extension of this NPPAM case to the more complex (and more physically realistic cases involving multicomponent isotherms) can then be based on the analogous approach as used with the BAM,,,,. Formal solution of the NPPAM is based on an adapted form of the mathematical analytical approaches de-
M A 0 AND HEARN: AFFINITY AND ION-EXCHANGE CHROMATOGRAPHIC PROCESSES 207
veloped by Thomas (1944), Hiester and Vermeulen (1952), and Sherwood et al. (1975). The detailed derivation of NPPAM and its solution is given in Appendix 2.
Sectional Model
The SAM of the chromatographic column was developed as part of the current optimization studies. In this model, the column is divided into a series of sections with each section treated as a well-mixed tank. This model is similar to the discrete cell or discrete stage model (Do, 1985; Hubble, 1989; Mao et al., 1995) and can be used for both porous and nonporous particles. In this model, the fluid flow is concep- tually treated as a noncontinuous parameter. According to this model, in each section of the column the fluid contain- ing the solute protein of interest is brought into contact with the adsorbent and interaction is allowed to occur for a pe- riod of time, At. At the end of each time increment, the contents of the liquid (mobile) phase in each section is transferred to the next section. The time increment At is calculated as At = W(U n), where L is the column length, U the superficial velocity (linear flow rate) of the fluid, and n the number of the sections.
For adsorption of the protein with fresh or regenerated adsorbent particles, the initial adsorbate concentration in the solid (stationary) phase is zero for all the sections at the beginning of the process, and the column can be assumed to be saturated with buffer solution. During the adsorption stage, the initial adsorbate concentration in the liquid phase is equal to C,, the inlet concentration. For washing and elution stages, C, = 0. The basic assumptions for rate- limiting steps in the adsorption process are the same as those used in the nonporous particle adsorption model (BAMComb) for a finite bath. This treatment also permits other types of isothermal behavior, e.g., Freundlich or mul- ticomponent Freundlich-Langmuir isotherms, to be accom- modated (Wei and Hearn, to appear). In the simple case of a single-component nonlinear Langmuir isotherm, the as- sumptions are that (a) the transport of adsorbate from the bulk fluid to the surface of the particle can be described by a film resistance mechanism and (b) the interaction occurs between the adsorbate and independent binding sites at the particle surface. As each section is assumed to be well mixed, the adsorbate concentration in the liquid phase is assumed to be uniform throughout that section.
For the case with porous particles, a linear driving force approximation was again used to describe the mass transfer of the adsorbate in the liquid phase from the entrance of the pores at the external surface to the particle internal surface. With this approximation, the pore fluid can be treated as a mass transfer medium rather than a separate phase, thus enabling it to be combined with the bulk fluid in the overall mass balance. At the end of each time increment, the pore fluid was assumed to remain stagnant, and only the bulk fluid was transferred to the next section. Based on these assumptions and initial conditions, the concentrations of the adsorbate in both the liquid and solid phase can be calcu-
lated. The liquid phase concentration in the last section, C,, is the outlet concentration. The concentration-time plot, i.e., the breakthrough curve, can then be constructed. As the concentrations in each section were stored for each com- plete time cycle during the calculation, the axial concentra- tion profiles can also be produced for any particular time. Detailed derivation of the sectional SAM is presented in Appendix 3.
One of the key variables in the sectional SAM is the number of sections, n. It was found that when n > 16 in the test case, the effect of “numerical dispersion” was negli- gible and the breakthrough curves produced by the sectional model and the analytical solution of a packed bed (NPPAM) were synonymous and overlapped. The advantage of the SAM is thus its versatility. The adsorption stage may be terminated at any time without causing any difficulty in the calculation of the time-concentration curves in the washing stage.
DETERMINATION OF MODEL PARAMETERS
Adsorption Isotherm Parameters
In order to predict the behavior of a given system, certain specific information must be obtained experimentally and, in particular, data on the adsorption characteristics of the protein(s) and the particle. Although other types of iso- therms have been used in describing adsorption phenomena in biological systems, the Langmuir isotherm is still the most commonly used expression in the study of both bio- specific affinity chromatographic processes (Anspach et al., 1989; Arve and Liapis, 1987; Chase, 1984) and ion- exchange (Cowan et al., 1989; Gosling et al., 1989) chro- matographic processes. In the initial stages of the develop- ment of the various adsorption models used in the present studies, it has been assumed that Langmuir isotherms can be followed. According to the Langmuir isotherm, the relation- ship between the equilibrium concentration in the solid phase, q*, and the equilibrium concentration in the liquid phase, C”, can be expressed by
C” * - - ‘ - Kd+C*qm
where qm is the maximum adsorption capacity and Kd is the equilibrium constant. This equation can also be written in the following double-reciprocal plot form:
From Eq. (2) the characteristic parameters of maximum capacity q, and equilibrium constant Kd can be determined by least squares fit of the experimental adsorption data gen- erated using the batch method from the plot of I/q* against l/C, (Anspach et al., 1989; Gosling et al., 1989; Wei and Hearn, 1996). Equation (1) can also be written in the fol- lowing forms and the corresponding data take the form of
208 BIOTECHNOLOGY AND BIOENGINEERING, VOL. 52, NO. 2, OCTOBER 20, 1996
the semireciprocal plot [Eq. (3)] and the Scatchard plot [Eq. (411:
1 4 m - --q*+- 4* C* Kd Kd _ -
(3)
(4)
The double-reciprocal plot favors the experimental data obtained with the protein(s) at low concentration while the semireciprocal plot gives more weight to the data obtained at higher adsorbate concentrations. Nonlinear Scatchard plots are indicative of the deviation from Langmuir behav- ior. The adsorption isotherm can also be generated using column methods (Anspach et al., 1990), where, in this case, the variable q* in Eq. (1) becomes the adsorption capacity of the adsorbent, which is the amount of the adsorbate re- tained by the adsorbent when the column reaches saturation. The equilibrium concentration in the liquid phase, C* in Eqs. (1)-(4), can then be replaced by C,, which is the pro- tein adsorbate concentration in the inlet solution. Equation (1) then takes the form of Eq. (A2.5) in Appendix 2, and the values of q* at given C, evaluated by numerical integration of the area behind the breakthrough curve (Anspach et al., 1990; Johnston et al., 1991). The maximum adsorption ca- pacity qm and the equilibrium constant Kd employed in the described modeling work here have been derived from ex- perimental data using the above methods. However, it must be recognized with such isotherms that the values of these parameters may not prevail over the whole range of con- centrations encountered in a real biochromatographic sys- tem (Anspach et al., 1989).
Mass Transfer Coefficients
The liquid film mass transfer coefficient Kf can be calcu- lated from literature correlations for both bath models (Arve and Liapis, 1987; Horstmann and Chase, 1989; Ohashi et al., 1981) and column models (Arve and Liapis, 1988; Horstmann and Chase, 1989; Liapis et al., 1989; Ohashi et al., 1981). For the case with porous particles, the apparent pore liquid mass transfer coefficient Kp was expressed as an effective pore diffusivity over an average effective diffusion path length,
h* D, Kp = -
U Ro where D, is the effective pore diffusivity and X* is an area factor. The apparent pore liquid mass transfer coefficient Kp is based on the external surface area a, while d, is based on the total area perpendicular to the direction of diffusion a*, which is less than the total internal surface area per unit volume of the particle but larger than a (X* is the ratio of a* to a). The term uR, is the average effective diffusion path length, which is expressed as a linear function of the particle radius R,. The effective diffusivity D,, according to the random pore model (Smith, 1981), can be estimated from
2 D, = D,E,
where D, is the free molecular diffusivity, calculated from a literature correlation (Young et al., 1980).
APPLICATION OF THE MODELS
With chromatographic systems involving protein purifica- tion, the physical properties of the system and operating conditions are often predetermined. For proteins of known molecular weight, the liquid phase mass transfer coeffi- cients can be evaluated as discussed above. However, the forward surface interaction rate constant ( k , ) has to be de- termined from experimental data via a parameter-fitting program written for this purpose. Once numerical values for these parameters for a specific system have been deter- mined, the model can be used to predict behavior over a range of operating conditions.
Batch Adsorption Model (BAM,,,bI
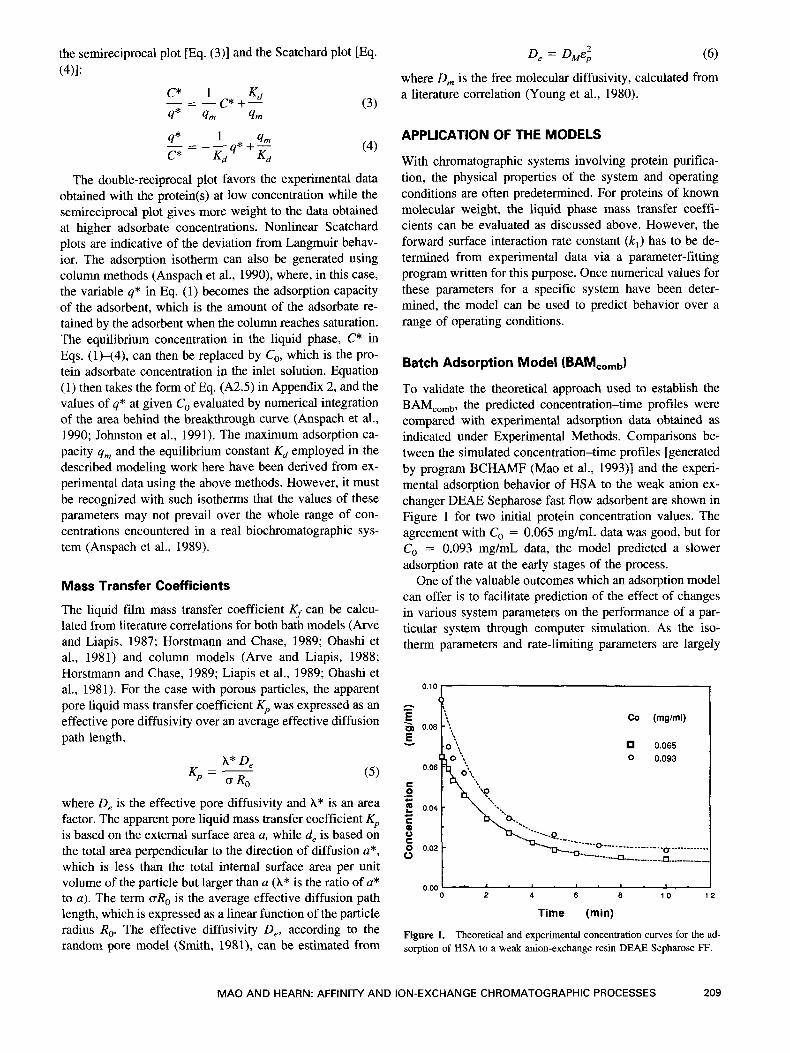
To validate the theoretical approach used to establish the BAM,,,, the predicted concentration-time profiles were compared with experimental adsorption data obtained as indicated under Experimental Methods. Comparisons be- tween the simulated concentration-time profiles [generated by program BCHAMF (Ma0 et al., 1993)] and the experi- mental adsorption behavior of HSA to the weak anion ex- changer DEAE Sepharose fast flow adsorbent are shown in Figure 1 for two initial protein concentration values. The agreement with C, = 0.065 mg/mL data was good, but for C, = 0.093 mg/mL data, the model predicted a slower adsorption rate at the early stages of the process.
One of the valuable outcomes which an adsorption model can offer is to facilitate prediction of the effect of changes in various system parameters on the performance of a par- ticular system through computer simulation. As the iso- therm parameters and rate-limiting parameters are largely
0.10 I I 1 I
Co (mglml)
0.065 0 0.093
E
0 2 4 6 6 1 0 1 2
Time (min)
Figure 1. Theoretical and experimental concentration curves for the ad- sorption of HSA to a weak anion-exchange resin DEAE Sepharose FF.
M A 0 AND HEARN: AFFINITY AND ION-EXCHANGE CHROMATOGRAPHIC PROCESSES 209
0.10 I I
Co (mg/ml)
0.065 0 0.093
I
0.00 0 2 4 6 8 10 12
Time (min)
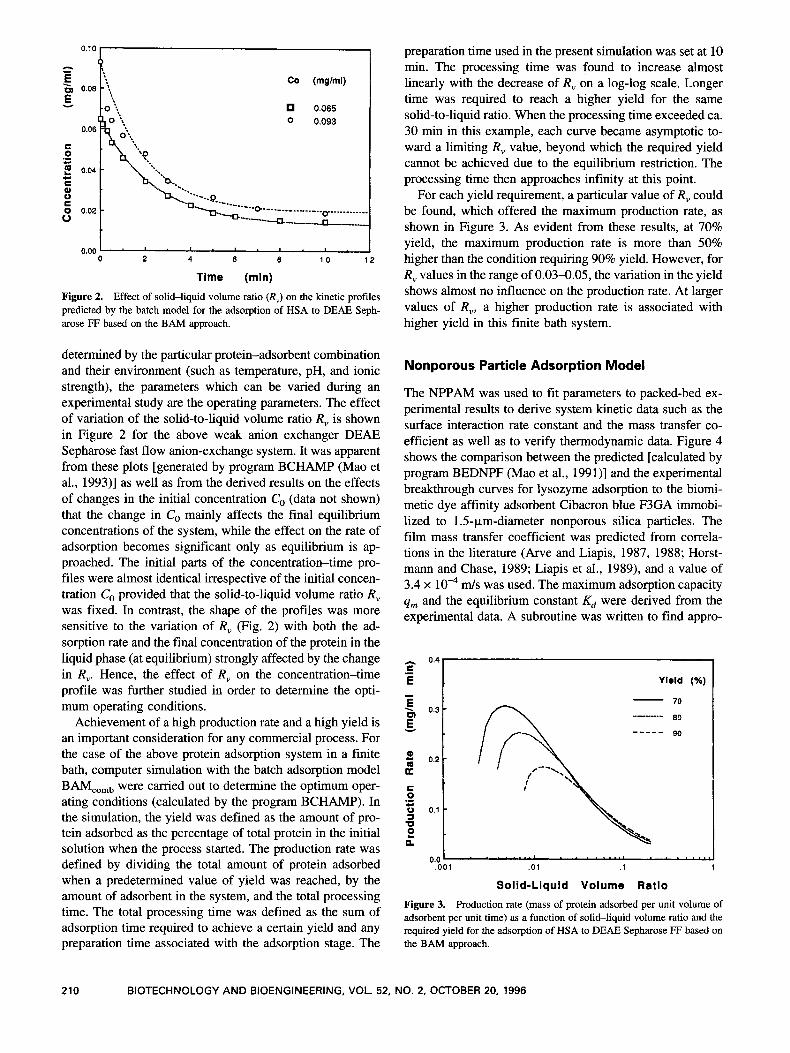
Figure 2. Effect of solid-liquid volume ratio (R,) on the kinetic profiles predicted by the batch model for the adsorption of HSA to DEAE Seph- arose FF based on the BAM approach.
determined by the particular protein-adsorbent combination and their environment (such as temperature, pH, and ionic strength), the parameters which can be varied during an experimental study are the operating parameters. The effect of variation of the solid-to-liquid volume ratio R, is shown in Figure 2 for the above weak anion exchanger DEAE Sepharose fast flow anion-exchange system. It was apparent from these plots [generated by program BCHAMP (Ma0 et al., 1993)l as well as from the derived results on the effects of changes in the initial concentration C, (data not shown) that the change in Co mainly affects the final equilibrium concentrations of the system, while the effect on the rate of adsorption becomes significant only as equilibrium is ap- proached. The initial parts of the concentration-time pro- files were almost identical irrespective of the initial concen- tration Co provided that the solid-to-liquid volume ratio R, was fixed. In contrast, the shape of the profiles was more sensitive to the variation of R, (Fig. 2 ) with both the ad- sorption rate and the final concentration of the protein in the liquid phase (at equilibrium) strongly affected by the change in R,. Hence, the effect of R, on the concentration-time profile was further studied in order to determine the opti- mum operating conditions.
Achievement of a high production rate and a high yield is an important consideration for any commercial process. For the case of the above protein adsorption system in a finite bath, computer simulation with the batch adsorption model BAMcomb were carried out to determine the optimum oper- ating conditions (calculated by the program BCHAMP). In the simulation, the yield was defined as the amount of pro- tein adsorbed as the percentage of total protein in the initial solution when the process started. The production rate was defined by dividing the total amount of protein adsorbed when a predetermined value of yield was reached, by the amount of adsorbent in the system, and the total processing time. The total processing time was defined as the sum of adsorption time required to achieve a certain yield and any preparation time associated with the adsorption stage. The
preparation time used in the present simulation was set at 10 min. The processing time was found to increase almost linearly with the decrease of R, on a log-log scale. Longer time was required to reach a higher yield for the same solid-to-liquid ratio. When the processing time exceeded ca. 30 min in this example, each curve became asymptotic to- ward a limiting R, value, beyond which the required yield cannot be achieved due to the equilibrium restriction. The processing time then approaches infinity at this point.
For each yield requirement, a particular value of R, could be found, which offered the maximum production rate, as shown in Figure 3. As evident from these results, at 70% yield, the maximum production rate is more than 50% higher than the condition requiring 90% yield. However, for R, values in the range of 0.03-0.05, the variation in the yield shows almost no influence on the production rate. At larger values of R,, a higher production rate is associated with higher yield in this finite bath system.
Nonporous Particle Adsorption Model
The NPPAM was used to fit parameters to packed-bed ex- perimental results to derive system kinetic data such as the surface interaction rate constant and the mass transfer co- efficient as well as to verify thermodynamic data. Figure 4 shows the comparison between the predicted [calculated by program BEDNPF (Ma0 et al., 1991)] and the experimental breakthrough curves for lysozyme adsorption to the biomi- metic dye affinity adsorbent Cibacron blue F3GA immobi- lized to 1 .5-p,m-diameter nonporous silica particles. The film mass transfer coefficient was predicted from correla- tions in the literature (Arve and Liapis, 1987, 1988; Horst- mann and Chase, 1989; Liapis et al., 1989), and a value of 3.4 x m/s was used. The maximum adsorption capacity qm and the equilibrium constant Kd were derived from the experimental data. A subroutine was written to find appro-
- 0.4 c E Yield (%) .- - E \ 0.3
Y F 0
U C 0
0 0.1 =I U
0.2
.- - 2
0.0 .001 .01 . I 1
Solid-Liquid Volume Ratio
Figure 3. Production rate (mass of protein adsorbed per unit volume of adsorbent per unit time) as a function of solid-liquid volume ratio and the required yield for the adsorption of HSA to DEAE Sepharose FF based on the BAM approach.
210 BIOTECHNOLOGY AND BIOENGINEERING, VOL. 52, NO. 2, OCTOBER 20, 1996

1 .O
0.8
0.6
0 O.O75m((hnl
0 0.013mghnl 0.4
0.2
0.0 0 2 4 6 8 1 0 1 2
Tlme (mln)
Figure 4. Predicted and experimental breakthrough curves for the ad- sorption of lysozyme on Cibacron blue F3GA immobilized on 1.5-km- diameter nonporous silica particles, analyzed according to the NPPAM approach. Mobile phase: 0.1 M phosphate buffer with 1 M NaCI. Flow rate 0.5 mL/min; column: 19 x 4 mm i.d.; Kd = 0.073 mg/mL, C, = 0.013 and 0.075 mg/mL.
priate value of the forward surface interaction rate constant k , which would give a satisfactory fit to the experimental curve. The objective function chosen to be minimized was the sum of squares of the percentage deviation between predicted and experimental values of CK,, over the range of C/C, values of 0.01-0.95 of the experimental break- through curve. This practice gave much greater weight to the initial part of the curve in the minimization process. Where good fit to the whole breakthrough curve was not possible, the initial part of the curve had a closer fit, as would occur in an actual process where the adsorption stage would be terminated at less than 50% of the breakthrough value (Horstmann and Chase, 1989). In order to obtain the best fit, the value of qm was iteratively adjusted.
Sectional Model
Comparison of the calculated and the experimental break- through curves was similarly used for the validation of the SAM of protein adsorption-desorption behavior with chro- matographic adsorbents and to extract system parameters for further simulation with porous particle systems (Horst- mann and Chase, 1989; Liapis et al., 1989; Mao et al., 1991; Yamamoto and Sano, 1992). Figure 5 shows the result for the concanavalin-A-IDA-Cu*+ adsorption system. Three concentrations of concanavalin-A were used, i.e., C, of 0.092, 0.053, and 0.01 1 mg/mL,. Other parameters were qm = 2.9 mg/mL solid, Kd = 0.0366 mg/mL,, and U = 0.66 m m / s (Wirth, 1990). A reasonable fit was obtained between predicted and experimental breakthrough curves for all three protein concentrations. The breakthrough curves cal- culated for this nonporous particle system by the sectional model were indistinguishable with the curves generated with the NPPAM software.
Figure 6 shows a typical curve fit of our S A M prediction to the experimental breakthrough curve for the albumin
r 0 m - L
L I
f 3 0 a a e c 0 a c:
- u
t a
1 .O
0.8
0.6 - Model Predctlon
Experimental Data 0.4
0 0.092rng/rnl
0.053 rng/rnl
A 0.011 rnglrnl 0.2
1 0 2 0 30 4 0 5 0 0.0
Tlme (min)
Figure 5. Predicted (lines) and experimental (points) breakthrough curves for the adsorption of concanavalin-A on an IDAZu(I1) modified 1.5-pm-diameter nonporous silica adsorbent for three concentrations of concanavalin-A: Co = 0.092, 0.053, 0.011 mg/mL. The data were ana- lyzed using the SAM approach. The column used was 19 x 4 mm i.d. Other parameters: qm = 2.9 mg/mL solid, Kd = 0.0366 mg/mL, and U = 0.066 cm/s.
(HSA) adsorption to the porous ion-exchange resin DEAE Trisacryl M. The parameters used were C, = 1.5 mg/mL, qm = 44 mg/mL bed, Kd = 0.0179 mg/mL, and U = 0.42 mmh (Johnston et al., 1991). Although the model predic- tions fit experimental data reasonably well in these two figures, agreement between the predicted and experimental breakthrough curves for some other situations studied was not as complete. As discussed previously (Ma0 et al., 1991, 1993), complicated mass transfer and surface interaction processes, e.g., aggregation, multilayer formation, and sur- face reorientation at high protein concentrations in the mi- croenvironment of the adsorbent, may cause divergences between the predicted and experimental breakthrough curves. For a large number of protein-ligand systems, the adsorption of protein molecules to the adsorbent is a revers-
1.0 ' C 2 0.9 L
g 0.8 c 8 0.7 ' C 8 0.6
0.5 '
0 0.4 '
0 u) 0.3 '
- I
0.2
8 0.1 '
0 5 10 15 20 25 30 35 40 45 50
Time (min) Figure 6. Predicted (line) and experimental (points) breakthrough curves for the adsorption of HSA on DEAE Trisacryl M ion-exchange adsorbent, analyzed according to the SAM approach. Parameters: column, 13 x 5 mm i.d.; C, = 1.5 mg/mL, q,,, = 44 mg/mL bed, Kd = 0.0179 mg/mL, and U = 0.042 cm/s.
M A 0 AND HEARN: AFFINITY AND ION-EXCHANGE CHROMATOGRAPHIC PROCESSES 21 1

ible process. During the washing stage, some protein which has already been adsorbed onto the solid phase will reenter the liquid phase and may be carried out of the column. At the end of the washing stage the amount of protein retained in the column may not be the same as at the end of the adsorption stage, with the binding efficiency ( = yield) nor- mally <loo% (Levison et al., 1992). For this reason, the washing and adsorption stages were considered as one unit operation in the present investigations.
The effects of washing on the breakthrough curves and the amount of protein retained in the column for lysozyme and Cibacron blue F3GA immobilized Fractosil 1000 are shown in Figure 7. In Figure 7a the time-concentration curves are shown for loading the column to an effluent concentration of 2%, lo%, and 99% of the influent concen- tration followed by washing. The numbers on the 10% curve indicate the different stages of the operation as follows: the column at the end of loading (no. 1) and the column washed with one column volume of buffer (no. 2), with 10 column volumes (no. 3), and with 30 column volumes (no. 4). The dimensionless concentration profiles in the solid phase for the 10% curve at these stages of the process are shown in Figure 7b, with the corresponding curves marked with the same numbering as in Figure 7a. Although the protein so- lution was no longer applied to the column, as evident from Figure 7a, the effluent concentration continued to rise even after the column was washed with 10 column volumes of
1.0-
- 9% - 0.6- 1 0%
40 8 0 8 0 100 120 140 180
Time (min)
p o . 0 4 , I . I . I , I . I 0.0 0.2 0.4 0.6 0.8 1 .o
Dimensionless Column Length
Figure 7. (a) Timexoncentration curves for loading to effluent concen- tration of 2%, lo%, and 99% of influent, respectively, followed by wash- ing. (b) Concentration profiles in the solid phase corresponding to the numbered times on the 10% effluent curve in (a) for the lysozyme- Cibacron blue F3GA Fractosil 1000 system analyzed using the SAM ap- proach.
buffer solution (no. 3). Examination of the concentration profile at this stage shows that the highest concentration section is still in the column, although it has moved closer to the outlet of the column. Only when the concentration peak has moved out of the column will the effluent concen- tration start to decline. By then, the amount of protein re- maining in the column has reduced, represented by the area under each concentration profile. In all three cases of col- umn loading to effluent concentration of 2%, lo%, and 99% of the influent concentration, the concentration in the efflu- ent continued to rise after the loading had been terminated and the washing with buffer solution started. Reducing the terminating effluent concentration from 10% to 2% of the influent concentration only decreased the maximum effluent concentration from ca. 80% to ca. 70%.
The production rate of the process can be defined as the mass of protein retained after washing per unit volume of the adsorbent per unit total processing time. The total time for a chromatographic process includes not only the actual time used for adsorption and washing, but also the time associated with preparation and reconditioning the column. In the present simulation, these latter times were fixed at 10 min. The yield was defined as the mass of protein retained by the column after washing as a percentage of total mass of protein applied. The column capacity utilization was calcu- lated by dividing the mass of protein retained by the column after washing by the attainable column capacity and was also expressed as a percentage. The attainable column ca- pacity is a fraction of the maximum capacity as a function of the protein concentration in the inlet solution.
The potential of the methodology was demonstrated by consideration of a specific biomimetic affinity system simi- lar to that used to extract system parameters. Hence, for lysozyme and Cibacron blue F3GA immobilized Fractosil 1000 (average particle size 80.9 Fm), the values of equilib- rium constant and maximum adsorption capacity used were 0.107 mg/mL and 15.4 mg/mL particle, respectively. Since the correlations for estimating the values of liquid film mass transfer coefficient have been incorporated into the BEDSTP program, the value of the surface interaction rate constant (0.0207 mL/mg s) was extracted from experimen- tal data and a value of 20 was chosen to be the number of sections used in the programs BEDSTP and BEDSTS for simulation. Figure 8 shows the variation in production rate for the preparative lysozyme-Cibacron blue F3GA Fractosil 1000 described above at different fluid velocities for the different terminating effluent concentrations. As evident from these results, there exists a fluid velocity at which a maximum production rate for this biomimetic affinity sys- tem can be achieved. The value of this fluid velocity in- creases with an increase in the allowable effluent concen- tration. The maximum production rate also increases with an increase in the terminating effluent concentration. At fluid velocities lower than the optimum velocities, the effect of the terminating effluent concentration becomes less im- portant. Figure 8 also shows that by using a flow rate at the maximum capacity of the pump (or to the pressure limit of
212 BIOTECHNOLOGY AND BIOENGINEERING, VOL. 52, NO. 2, OCTOBER 20, 1996

E I E
E 0.10
. (u
m
5 0.05 0 3
0
c.
.- U
& 0.00
\ ,---- . '. /
/ ---
0 500 1000 1500
Linear Flow Rate (cm/h) Figure 8. Production rate versus superficial liquid velocity for different effluent concentrations (0.5%, 1.0%, 2.0%, 5.0%, and 10% of inlet con- centration) for the lysozyme-Cibacron blue F3GA Fractosil lo00 system analyzed using the SAM approach.
the system), as is often practiced, the most desirable pro- duction rate could not be achieved. This conclusion has also been supported by other experimental data on large-scale chromatographic purification of proteins with ion-exchange adsorbents (Bjorkland and H e m , 1996, to appear; J.-C. Janson, personal communication, 1996; Finette et al., 1996, to appear).
In other studies involving actual processes for the large- scale recovery of human serum albumin, thrombin, or aI- proteinase inhibitor from crude feedstocks (Bjorkland and Hearn, 1996 , Mao et al., unpublished results, 1996), the operating conditions of the washing stage such as the amount of washing solution used and the washing flow rate were constrained by the nature of the contaminants (e.g., in terms of their molecular weights and concentrations) and the purity requirement of the target protein. For example, in associated investigations on the purification of thrombin present in the Cohn II+III cryosupernatant fraction from blood plasma using immobilized heparin silica-based affin- ity adsorbents with a column of larger dimension (e.g., 10- 30 cm), application of the approaches detailed in this article has resulted in enhanced purification factors and higher pro- ductivities (Bjorkland and Hearn, 1996, to appear). Simi- larly, optimization of the preparative ion-exchange chro- matographic purification of serine proteases and their in- hibitors (serpins) has been achieved utilizing the iterative approach detailed in the present study. As evident from these studies, the operating conditions are fixed for any particular system and will be essentially independent of those of the adsorption stage when the contaminants are not involved in direct competition with the binding sites for the target protein. In such cases, the operating conditions of the washing stage can be addressed separately as an indepen- dent variable. In thepresent simulation, 10 column volumes of buffer solution were used at a fluid velocity of 0.5 mm/s for the washing stage. The adsorption time, the percentage of utilization of the attainable column capacity, and the protein yield at different fluid velocities for each of the
terminating effluent concentrations were then calculated us- ing the computer program BEDSTP.
Application of similar contour plots derived directly from the use of the BAMComb, NPPAM, and SAM are illustrated from the following example (shown in Fig. 9). In this case, the optimization was based on a primary requirement of 94% yield. If a 60% column capacity utilization was the preferred option, then the operation had to be carried out in the region enclosed by the 94% yield curve and to the left of the 60% capacity curve. It can be seen that the highest production rate in the region occurs at the intersection of the two curves. Similar operational boundaries can be deter- mined for the cases where 70% and 50% are the preferred column capacities. The exact values of fluid velocity and effluent concentration at these points can also be calculated by the BEDSTP program.
The simulations presented above are all for a finite ter- minating effluent concentration. Hence, the yield value will always be less than 100% as part of the target protein has been lost in the effluent. For certain cases, a yield value approaching 100% is to be preferred. As evident from the model analysis, the operating conditions which need to be optimized then should be the loading volume and the flow rate. Through computer simulation, a proper loading vol- ume can be found to ensure that the effluent concentration of the target protein stays just below the detectable limit (e.g., 0.1% of influent) at the end of washing. There will be no breakthrough curve. However, the solid phase concen- trations can be used to evaluate this case (calculated by program BEDSTS).
Through utilization of the SAM, the influence of the op- erating range and the constraints imposed by the two main operating parameters can be shown more clearly in the de- rived contour plots. From Figure 10, it can be seen that high processing rates occur only at the top right-hand corner of these contour plots, where both the flow rate and the column
i l l I / \ I I
n 8 10 v
8 n c .- v
0 i 6 A c 3 0 Y
o 4
2 200 400 600 800 1000
Linear Flow Rate (cm / h) Figure 9. Operating regions at 94% yield for four (50%, 60%, 70%, and 80%) column capacity utilization levels for the lysozyme-Cibacron blue F3GA Fractosil 1000 system analyzed using the SAM approach.
M A 0 AND HEARN: AFFINITY AND ION-EXCHANGE CHROMATOGRAPHIC PROCESSES 213

120
g 100 v
w
Q 0 -I
80 5
60 E 3
8 40 -
Linear Flow Rate (cmlh) Figure 10. Operating regions based on the product yield and processing rate for a HSA-DEAE Trisacryl M ion-exchange chromatographic column. The open circles are the maximum production rates (0.87 and 1.46 mgl mL * min) for the 100% and 99% product yield curves derived from the SAM approach.
loading are high. The high yield, however, is restricted to the low flow rate and relatively low loading region. Due to
CONCLUSION
These investigations document several different modeling approaches for the evaluation and optimization of the puri- fication of proteins by ion-exchange and affinity chroma- tography. The simulations show good agreement with ex- perimental data derived with several different protein- ligand systems as well as with support materials of different physical dimensions and composition. Further utilization of the iterative approach detailed in this article based on the sequential use of finite bath and packed-bed systems to determine the value of key mass transfer and interaction parameters with several therapeutic and commodity proteins in process scale applications will be described elsewhere (Smith, 1981; Ohashi et al., 1981). The conclusions reached from the studies described in this article indicate that the methods described above should find general application for preparative ion-exchange, biomimetic affinity, immobilized metal ion chelate, and biospecific chromatographic separa- tion of proteins at the process level.
Aspects of these investigationawere supported by the Australian Research Council and Industrial Research and Development Cor- poration of the Department of Industry, Science and Technology. The award of an Alexander Von Humboldt (AvH) Forschung- spreis to M. T. W. H. is gratefully acknowledged.
NOMENCLATURE the asymptotic nature in the calculation of the yield values by the sectional model, a value of 99.999% yield was cho- sen to be an approximation of 100% yield. It can be seen that in order to improve the yield from 99% to loo%, the flow rate has to be reduced to less than half and the column loading may have to be reduced as well. This interdepen- dence became more evident when these two sets of curves were plotted together, as in Figure 10, where the maximum production rate at these yields is indicated by open circles. For each yield curve there is only one set of operating conditions which will provide a maximal production rate. When the yield was allowed to drop from 100% to 99%, this 1% reduction in yield resulted in a 60-70% increase of the processing rate. Depending on the actual yield requirement of the process, the expected production rates and the oper- ating range of the flow rate and column loading can thus be easily estimated from these plots.
The computer programs based on the BAM,,,,, NPPAM, and SAM can also be used for design purposes. As evident from Figures 9 and 10, the choice of optimum fluid velocity is also subject to the practical pressure drop limi- tation (Hearn, 1989; Clonis, 1990). The relationships be- tween packed-bed pressure drop, superficial fluid velocity, and particle size can be calculated based on the Blake- Kozeny equation (Bird et al., 1960), assuming rigid par- ticles. It can be shown (Ma0 et al., 1993) that for a fluid flow rate above 0.1 m d s , 10-pm particles based on silica or other mechanically rigid support materials would be the practical lower particle diameter limit for process scale ap- plications. If the predicted optimum fluid velocity exceeded the limit imposed by the system pressure drop, a shorter column with a larger diameter must be used.
a A B C C*
ci C,,O Ci*
CO
external surface area per unit volume of adsorbent particles parameter defined by Eqs. (A1.8), (A1.31). and (A3.10) parameter defined by Eqs. (A1.lO) and (A3.12) adsorbate concentration in the liquid phase equilibrium concentration of the adsorbate in the liquid phase, or the intermediate adsorbate concentration in the liquid phase at external surface of the particles adsorbate concentration in the liquid phase in section i initial adsorbate concentration in the liquid phase in section i intermediate adsorbate concentration in the liquid phase at (1) external surface of the particles in section i for the case with nonporous particles; (2) internal surface of the particles in section i for the case with porous particles intermediate adsorbate concentration in the liquid phase at internal surface of the particles adsorbate concentration in the liquid phase in the last section, which remesents the outlet adsorbate concentration initial adsorbate concentration in the liquid phase in the BAM; inlet concentration of adsorbate in the liquid phase in column models adsorbate concentration in the pore fluid adsorbate concentration in the pore fluid in section i initial adsorbate concentration in the pore fluid equivalent adsorbate concentration when total amount of the ad- sorbate in the system was assumed in the liquid phase equivalent adsorbate concentration when total amount of the adsorbate in the system was assumed in the liquid phase in section i effective pore diffusivity free molecular diffusivity forward surface interaction rate constant adsorption equilibrium constant overall effective liquid phase mass transfer coefficient liquid-side film mass transfer coefficient apparent pore fluid mass transfer coefficient column length
214 BIOTECHNOLOGY AND BIOENGINEERING, VOL. 52, NO. 2, OCTOBER 20, 1996
M n N 4 4, 4 t . O q m 40 4*
r* Ro R,
At
U
X XI
X2
Y
EP x
t
X
E
U
7
i
parameter defined by Eqs. (A1.7) and (A3.9) number of the sections in the sectional model [Fq. (A3. I)] mass flux adsorbate concentration on the solid phase adsorbate concentration on the solid phase in section i initial adsorbate concentration on the solid phase in section i maximum solid adsorption capacity initial adsorbate concentration on the solid phase equilibrium concentration of the adsorbate in the solid phase, or the attainable adsorption capacity of the adsorbent equilibrium parameter [Eq. (A2.6)] particle radius volume ratio of solid phase to liquid phase time time increment which is the residence time of bulk fluid in any one section superficial velocity (linear flow rate) of the fluid axial distance = c/c, positive root of quadratic Eqs. (A1.9) and (A3.11) other root of Fqs. (A1.9) and (A3.11) = q/q* volume fraction of liquid phase particle void fraction area factor, = a*/a ratio of the average effective diffusion path length to the particle radius dimensionless time parameter dimensionless distance parameter
APPENDICES
Appendix 1 : Batch Adsorption Model
Adsorption with Nonporous Particles
The overall mass balance for the adsorption of a protein to nonporous particles in a finite bath can be expressed as
EC + (1 - E)q = EC, (Al.l)
where C is the protein concentration in the bulk of the liquid phase, q is the protein concentration on the solid phase, and E is the volume fraction of liquid phase in the finite bath. The variable C, is the equivalent protein concentration when the total amount of the protein in the system is as- sumed only in the liquid phase and can be calculated from
cT = CO+RvqO (A1.2)
where C, is the initial protein concentration in the liquid phase, qo is the initial protein concentration in the solid phase, and R, = (1 - E ) / E is the volume ratio of the solid phase to the liquid phase. For adsorption with fresh or re- generated adsorbent particles, qo = 0 and C , = C,. For washing and elution stages, Co = 0 and C, = R, 4,.
The differential form of Eq. (Al.l) then can be expressed as
dC dq -+R,- = 0 dt dt (A1.3)
The transport of the protein from the bulk fluid to the
surface of the particle is described by a film resistance mechanism
(A1.4)
where a = 3/R, is the interfacial area per unit volume of the adsorbent particles, R, is the radius of the particle assuming the average shape can be represented as a sphere, Kf is the liquid film mass transfer coefficient, and C* is the interme- diate concentration of the protein in the liquid phase at the surface of the particles. The interaction between the protein and the adsorption sites at the particle surface can be de- scribed by the second-order reversible equation
(Al.5)
where k , is the forward interaction rate constant, qm is the maximum adsorption capacity of the adsorbent particles, and Kd is the adsorption equilibrium constant. At equilib- rium, Eq. (A1.5) takes the form of the Langmuir isotherm equation. Eliminating C*, q, and its derivative from Eqs. (A1.2), (A1.3), (A1.4), and (AlS), the rate of change of C with time can be written as
dq - = k,[(qm - q)C* - KAI dt
-(L+L) M k , dc dt = ( C - x , ) ( C - x , ) (A1.6)
where
A M =
Rvqm - cT + (A1.7)
and
A = aKfR, (A1.8)
The terms x , and x2 are the roots of quadratic equation
P-BC-KdCT = 0 (A1.9)
where
B = CT - R,qm - Kd (A1.lO)
and
X, = % [ B + v-71 (Al . l l )
x2 = % [ B - V Z , ] At equilibrium, the left-hand side of Eq. (A1.6) becomes
zero and Eq. (A1.6) becomes Eq. (A1.9). Hence the positive root of Eq. (A1.9), x , , is the concentration of the protein in the liquid phase when the finite bath system has reached equilibrium. Equation (A1.6) can be directly integrated to yield
+x21n - = A(x, -x2)t (:::,I (A 1.12)
M A 0 AND HEARN: AFFINITY AND ION-EXCHANGE CHROMATOGRAPHIC PROCESSES 215
Equation (A1.12) is the solution of the batch adsorption model from which the concentration-time profile for a given system can be calculated. In Eq. (A1.12) as well as in Eq. (A1.6) both the film mass transfer and surface interac- tion rates are considered finite. Two simplified cases can be considered. In the first case of the batch adsorption model (abbreviated as BAM,,,), k, 3 a~ and therefore the external mass transfer becomes the rate-controlling step, with Eq. (A1.6) becoming
and the integrated result is
(c, - R,q,) In( C-X, ") - x,ln( -) c - X I
c-x, c , - X I C,-X,
(A1.14)
In the second case (abbreviated as BAM,,), Kf 3 a~ and the surface interaction is then the rate-controlling step. As a result, A + 03 and 1/M 4 0. Hence, when the liquid film mass transfer coefficient Kf becomes dominant, Eq. (Al.6) becomes
and the integrated form is
c-x, c o - x , = (xl - x J t (-41.16)
In this kinetic controlling case, the concentration of the adsorbate in the liquid phase as a function of time then can be expressed as
which produces a similar result to that derived from the approach of Horstmann and Chase (1989). In the cases where the value of the liquid mass transfer coefficient Kf is finite, a bisectional method can be adopted to calculate the time-concentration profile directly from Eq. (Al. 17), while for an actual process, Eqs. (Al.l2), (Al.l4), or (A1.16) can be used to estimate the time required to reach a predeter- mined final concentration in the finite bath.
Adsorption with Porous Particles
For the adsorption of proteins with porous particles, a linear driving force approximation was used to describe the mass transfer of the protein in the pore fluid, thus permitting the mass balance, rate-limiting steps, and mass transfer coeffi- cients to be quantitatively and independently described.
(a) Mass balance. Assuming that the pores of the absor- bent particles are filled with buffer liquid before the adsorp- tion process starts, the overall mass balance is given by
E C + (1 - &)EpCp + (1 - &)( 1 - &p)q = [ E + (1 - &)&,]CT
(A1 .18)
where C, is the protein concentration in the pore fluid and E~ is the particle void fraction. Other symbols are the same as defined in Eq. (Al.1). The unit of q is taken as the mass per unit volume of solid. In this case, the value of C, is given by
&CO + (1 - &)&,Cpo + (1 - E ) ( 1 - E p ) q O E + (1 - E)E,
C T = (A1.19)
For adsorption of the protein(s) to fresh or regenerated adsorbent particles, qo = 0, C,, = 0 and C, can be written as
ECO c - - E+(1 - E ) E p
For washing stage, C, = 0 and C, becomes
(A1.20)
In a finite bath the volume of pore fluid is normally very small in comparison with the volume of bulk fluid and therefore may be neglected or lumped with the bulk fluid to simplify the mathematical description. Neglecting the pore fluid (i.e., let cP = 0), Eq. (A1.18) becomes the same as for the nonporous particles [Eq. (Al.l)]. The differential form of this equation then becomes the same as Eq. (A1.3), with the same volume ratio, R, = (1 - E ) / E . On the other hand, when the pore fluid is lumped with the bulk fluid, Cp = C, and Eq. (A1.18) becomes
[& + (1 - &)EPIC + (1 - &)( 1 - &,)q = [& + (1 - &)&,]CT (A1.22)
However, the differential form of Eq. (A1.22) is
dC dq - + R v - = 0 dt dt (Al.23)
which is the same as Eq. (A1.3), except the volume ratio of the solid phase to the liquid phase, R,, becomes
1 - [ E + ( 1 - &)&,I & + (1 - &)&, (Al.24) R, =
(b) Rate-limiting steps. The effects of both mass transfers and surface interaction as the rate-limiting steps can be treated separately by the BAM. Because the internal surface areas of porous particles are normally much greater than the external surface areas, the effect of the external surface area can be lumped with the internal surface area in the model proposed here. The transport of adsorbate from the bulk fluid to the internal surface of the particles consists of the external film diffusion and the pore diffusion, with both processes described by a linear driving force approximation. Therefore, the mass transfer rate of the adsorbate from the bulk fluid to the internal particle surface can be expressed as
216 BIOTECHNOLOGY AND BIOENGINEERING, VOL. 52, NO. 2, OCTOBER 20, 1996

N = KAC- C*) = Kp(C* - C,) = Ke(C- C,) (A1.25)
where N is the mass flux of the protein adsorbate into the particle, Kf is the liquid film mass transfer coefficient, Kp is the apparent pore fluid mass transfer coefficient, and K, is the overall effective liquid phase mass transfer coefficient. The term C* is the intermediate concentration of the protein in the liquid phase at the external surface of the particles, and C, is the intermediate concentration of the protein in the liquid phase at the internal surface of the particles. The model assumes that the volume of the liquid film is negli- gible, and there is no accumulation of the adsorbate in the pore fluid. Since the rate of change in the concentration of the protein in the solid phase then must equal the rate of mass transfer,
dq - = aKAC - C*) = aK,(C* - C,) (A1.26) dt
where the term a = 3/R, is the external surface area per unit volume of the adsorbent particles and R, is the radius of the particle. From Eq. (A1.25) and (A1.26) the following form of the rate of change of protein concentration can be written:
and
(A1.27)
(A1.28)
Equation (Al.28) clearly shows that the overall resistance to the mass transfer is the sum of the resistance in the liquid film and the resistance in the pore fluid. The value of the liquid film mass transfer coefficient Kf can be calculated from literature correlations (Arve and Liapis, 1988; Horst- mann and Chase, 1989, Ohashi et al., 1981). The method for the estimation of the apparent pore liquid mass transfer coefficient Kp has been discussed above. The surface inter- action between the protein and the immobilized ligand at the internal particle surface can be treated in the same way as for nonporous particles, i.e.,
(A1.29)
where K , is the forward interaction rate constant, qm is the maximum adsorption capacity of the immobilized ligand, and Kd is the adsorption equilibrium constant. This equation is identical with Eq. (A1.5) except that C* is replaced by C,, the concentration of the protein in the liquid phase at the internal surface of the particles.
(c) Solution of the model with porous adsorbents. Elimi- nating C,, q, and its derivative from Eq. (A1.18), (A1.23), (A1.27), and (A1.29), the form of the concentration equa- tion can be written as
- (L+L) M k, '=(C-x,)(C-q) dt (A1.30)
w l c h is identical with Eq. (A1.6). As the only difference between this option and the nonporous particle case is that Kf has been replaced by K,, the solutions given by Eq. (A1.9) and (A1.12) can be directly applied with
A = aK,Rv (Al.31)
Appendix 2. Nonporous Particle Adsorption Model
Basic Equations of NPPAM
Assuming that axial diffusion can be neglected, the conti- nuity equation linking concentration, axial distance, and time for the "PAM takes essentially the same form as those presented in the literature (Coulson and Richardson, 1979; Helfferich, 1962; Hines and Maddox, 1985; Sher- wood et al., 1975):
uac ac i - c a q +-+--- (A2.1)
where U is the superficial liquid velocity, E is the interstitial void fraction of the packed bed, x is the axial distance, t is time, C is the protein concentration in the bulk of the liquid phase, and q is the protein concentration in the solid phase. The rate of mass transfer in the liquid film at the particle surface is described by
-- & ax at E at - O
aq - = aKAC - C*) at (A2.2)
where a = 3/R,) is the external surface area per unit volume of the particle. The term R, is the radius of the particle, Kf is the liquid film mass transfer coefficient, and C* is the intermediate concentration of the protein in the liquid phase at the surface of the particles.
The surface interaction rate is described by the second- order reversible equation
(A2.3)
where k , is the forward interaction rate constant, qm is the maximum adsorption capacity of the sorbent particles, and Kd is the adsorption equilibrium constant. Eliminating C* from Eqs. (A2.2) and (A2.3) yields
Equations (A2.1) and (A2.4) are the basic equations of NPPAM in which the film mass transfer and surface inter- action rates are both considered finite. Simplified cases may be derived from these two equations.
Solution of NPPAM
The model has been solved by adapting the approach of Hiester and Vermeulen (1952) in which an extended form of the Thomas solution has been used. The Thomas solution on
M A 0 AND HEARN: AFFINITY AND ION-EXCHANGE CHROMATOGRAPHIC PROCESSES 217
fixed bed performance was originally developed for appli- cation to ion exchange columns (Helfferich, 1962; Smith, 1981). It has been shown (Hiester and Vermeulen, 1952) that the Thomas solution can be applied to the adsorption processes in general where the equilibrium relationship can be expressed by the Langmuir isotherm. By assuming that Langmuir isothermal behavior prevail in an adsorption pro- cess, the attainable adsorption capacity of the adsorbent, q*, which is the amount of the protein retained by the adsorbent when the column reaches saturation, can be expressed by
q*=- CO Kd + C, qm (A2.5)
where Co is the protein concentration in the inlet solution. By introducing the dimensionless terms X = CEO, Y = q/q*, and assuming Langmuir adsorption prevails, e.g.,
Kd r* = - Kd + ‘0
(A2.6)
Eq. (A2.4) can be rewritten as
dY -= KR[X(1- Y) - r*Y(l- X)] at (A2.7)
where
(A2.8) 3klKfCo K - - klRoq*[l + Y* (r* - l)] - 3KAr* - 1)
By defining the dimensionless time parameter 7 and di- mensionless distance parameter 5 such that
x(1 - e)q*
UCO 5 =
the continuity Eq. (A2.1) simplifies to
‘T = KR ( t - ;) ax ay a2 at -+-=o
(A2.9)
(A2.10)
(A2.11)
and Eq. (A2.7) becomes
d Y -=[X(l-Y)-r*Y(l-X)] (A2.12)
By appropriate substitution SXlSg can then be written as
at
ax a2
(A2.13) _- - -[X(1- Y) + r*Y(l - X)]
Assuming the bed is initially free of adsorbate, the bound- ary conditions are
X = 1
Y = 0
at 5 = 0 for all ‘T
at ‘T = 0 for all 5 The model then can be solved to give a solution for the
breakthrough curve which can normally be expressed in the
following form (Hiester and Vermeulen, 1952; Shenvood et al., 1975; Tan, 1977):
C J(r* z, t) Co - J(r* z , t) + [l - J(z, r* t)] exp[(r* - l)(t - 213
(A2.14)
The average dimensionless solid phase concentration Y* has been given a numerical value of 0.5, as was suggested by Hiester and Vermeulen (1952).
Two Simplified Cases
The NPPAM encompasses two simplified cases of the ad- sorption model. Neglecting the effect of the film mass trans- fer, it becomes the case of second-order kinetics controlling (the Thomas solution) (Horstmann et al., 1986; Johnston and Hearn, 1990; McCoy and Liapis, 1991). The second case is external film resistance controlling, in which equi- librium was assumed to exist between the protein and the protein-ligand complex at each point on the particle surface. An alternative solution of this case has been presented by Hiester and Vermeulen (1952). In Eq. (A2.4), if Kf + m,
then the surface interaction (second-order kinetics) is con- sidered as the rate-controlling step. As a result, Eq. (A2.4) becomes
(A2.15) dq - = k,[(q, - q)C - K d d at
and
(A2.16)
On the other hand, if k , + 00, then the external mass transfer becomes the rate-controlling step. Hence Eq. (A2.4) becomes
and
(A2.17)
(A2.18) 3Kf c o K - K - - RE - R,q*[l + Y*(r* - I)]
It can be noted that the only difference in the three cases discussed is in the expressions of the terms KRa, K R E , and KR, and
1 R d * [ l + Y * ( r * - l ) ] r*-1 1 1 ---- - +- (A2.19)
Equation (A2.19) is similar in form to that describing the total resistance of an electrical circuit with single resistances acting in series. This equation therefore suggests that the rate-limiting steps are occurring as a sequence of events in series. By using Eq. (A2.16) or (A2.18) to calculate the value of KR which was required in Eqs. (A2.9) and (A2. lo), the solution of these two simplified cases can be readily
-- - KR 3KF0 KICO KRE KRa
218 BIOTECHNOLOGY AND BIOENGINEERING, VOL. 52, NO. 2, OCTOBER 20, 1996
obtained from Eq. (A2.14). The solution given by Eq. (A2.14) contains the J function, which is a complex func- tion. Numerical values of the J function have been tabulated (Hines and Maddox, 1985; Shenvood et al., 1975) and methods for calculating its value are also available (Hiester and Vermeulen, 1952; Kreyszig, 1988; Shenvood et al., 1975; Tan, 1977). The detailed procedure for evaluating the values of the J function is given at the end of this Appendix.
Solutions for porous particles. The NPPAM can be modi- fied to include the application for the porous particles as well. If the intermediate concentration C* in Eqs. (A2.2) and (A2.3) was replaced by an average intermediate con- centration at all the ligand-bearing surfaces, including both the external and internal surfaces of the particle, and the liquid film mass transfer coefficient Kf in Q. (A2.2) was replaced by an overall liquid phase mass transfer coeffi- cient, the model can be used for both porous and nonporous particles. On the other hand, the simplified option of NPPAM, where the surface interaction is the rate- controlling step, can be directly applied to the adsorption process with porous particles, as particle properties are not a major concern since the rate constant k , is actually a lumped parameter representing all the rate-limiting factors (Chase, 1984).
The J Function
The solution of the models requires the knowledge of the J function, which takes the form (Hiester and Vermeulen, 1952; Shenvood et al., 1975; Tan, 1977)
where I , is a modified Bessel function of the first kind. The numerical value of the J function is between zero and one, and where J(0, p) = 1.0 and J(a, 0) = e-a. When both a and p are large (>lo), the following approximation can be used (Hiester and Vermeulen, 1952):
(A2.21)
According to Hiester and Vermeulen (1952) Eq. (A2.21) is accurate to within 1% when ap 2 36. The error function in the equation can be calculated from (Kreyszig, 1988)
It was found when N 2 30 that the difference between calculated value and the tabulated value of the error func- tion in the literature (Kreyszig, 1988; Tan, 1977) is less than O.OOO1. For smaller value of a and p, a formula developed by Tan (1977) gives a better approximation:
where
and
ak
e" Ak(OL) = k A k - , ( a ) -- for k 3 1
Calculation has shown that for (a + p) s 75 and a s 35, the difference between the result of Eq. (A2.23) and the tabulated value of the J function (Hines and Maddox, 1985; Shenvood et al., 1975) is less than 0.00002. For (a + p) > 75 or a > 35, Eq. (A2.21) is accurate to within 0.0001 compared with tabulated data.
Appendix 3: Sectional Model
In the SAM the chromatographic column is assumed to be divided into a series of sections with each section treated as a well-mixed tank. In each section the fluid containing the solute protein (adsorbate) of interest is brought into contact with the adsorbent and interaction is allowed to occur for a period of time, At. At the end of each time increment, the content of the liquid phase in each section is transferred to the next section. The time increment At is calculated as
L A t = -
Un (A3.1)
where L is the column length, U the superficial velocity of the fluid, and n the number of the sections. The interaction between the protein and the adsorption site at the particle surface is assumed in the treatment described below to be governed by a Langmuir-type isothermal model; however, other isothermal models can be readily employed. As each section is assumed to be well mixed, the concentration of the adsorbate in the liquid phase is uniform throughout the section.
Adsorption with Nonporous Particles
The overall mass balance for the adsorption with nonporous particles in a section i is
&Ci + (1 - &)qi = ECr,i (A3.2)
where Ci is the protein concentration in the bulk of the liquid phase, qi is the protein concentration on the solid phase, and E is the volume fraction of liquid phase in the column, which is assumed a constant throughout the col- umn. The variable Cri is the equivalent total protein con- centration when the total amount of the protein in that sec- tion is assumed only in the liquid phase, and CT,i can be calculated from
(A3.3)
MA0 AND HEARN: AFFINITY AND ION-EXCHANGE CHROMATOGRAPHIC PROCESSES 219
X2 = '/2 [B - v G d c , i ] (A3.14) where C,, is the protein concentration in the liquid phase at the beginning of the time increment, q,,, is the protein con- centration in the solid phase at the beginning of the time Equation (A3.8) Can be directly integrated to Yield increment, and R, is the volume ratio of the solid phase to the liquid phase, i.e., the phase ratio:
1 - & R , = -
& (A3.4)
The differential form of Eq. (A3.2) then can be expressed as
dC, dqi -+R,-=O dt dt ( A 3 3
The transport of the protein from the bulk fluid to the surface of the particle is described by a film resistance mechanism
(A3.6)
where a = 3/R, is the interfacial area per unit volume of the adsorbent particles, R, is the radius of the particle, Kf is the liquid film mass transfer coefficient, and CT is the interme- diate concentration of the protein in the liquid phase at the surface of the particles.
The surface interaction rate is described by the second- order reversible equation
(A3.7)
where k , is the forward interaction rate constant, qm is the maximum adsorption capacity of the adsorbent particles, and Kd is the adsorption equilibrium constant. At equilib- rium, Eq. A3.7 becomes the Langmuir isotherm equation. Eliminating CT,qi and its derivative from Eqs. (A3.3), (A3.5), (A3.6), and (A3.7), the rate of change of Ci with time can be written as
where
A M =
Rvqm - cT,i + ci (A3.9)
and A = aKfR, (A3.10)
The terms x1 and x2 are the roots of the quadratic equation
c; - BCi - KdcZi = 0 (A3.11)
where (A3.12)
and
x1 = '/2 [B + u B 2 + 4K&T.i] (A3.13)
=A(x, - x2)Dt
Equation (A3.15) can be used to calculate the liquid phase concentration at the end of each time increment At for section i. In this equation as well as in Eq. (A3.8) both the film mass transfer and surface interaction rates are consid- ered finite.
Adsorption with Porous Adsorbent Particles
In ananalogous manner to the BAM discussed above, a linear driving force approximation can be used with the sectional model. In addition, the second assumption is that the pore fluid can be assumed to be stagnant; therefore, only the bulk fluid was transferred to the next section at the end of each time increment.
The overall mass balance in section i is
(A3.16) &Ci + (1 - &)&pCp,i + (1 - &)(1 - Ep)qi = [&+(1 - E)Ep1CT,i
where CP,, is the protein concentration in the pore fluid and cP is the particle void fraction. Other symbols are the same as defined in Eq. (A3.2). The unit of qi is taken as the mass per unit volume of solid. Arising from the linear driving force approximation, the pore fluid has been treated as a mass transfer medium rather than a separate phase, thus enabling it to be combined with the bulk fluid in the overall mass balance. Therefore, the pore fluid was lumped with the bulk fluid, i.e., CP,; = Ci. Equation (A3.16) then becomes
[& + (1 - &)EPICi + (1 - &)( 1 - Ep)qi = [& + (1 - &)&p]CT,i (A3.17)
In this case, the value of CZi can be calculated by Eq. (A3.3), with the volume ratio of the solid phase to the liquid phase, R,, becoming
1 - [ & + ( 1 (A3.18) R, =
& + (1 - &)Ep
and the value of C,, calculated as
& (1 - E b p c. = C,&1+ Ci (A3.19) r*o & + (1 - &)Ep & + ( 1 - & ) E p
Equation (A3.19) indicated that at the end of each time increment, the pore fluid remained in the section, and only the bulk fluid in section i - 1 was transferred to section I. The differential form of Eq. (A3.17) then is identical to Eq. (A3.5). The solution for the case with porous particles then can be obtained with the same approach in Eqs. (A3.5)- (A3.14). The differences are that an effective overall liquid
220 BIOTECHNOLOGY AND BIOENGINEERING, VOL. 52, NO. 2, OCTOBER 20, 1996

phase mass transfer coefficient, K,, replaces Kf in Eqs. (A3.6) and (A3.10); and in Eqs. (A3.6) and (A3.7), CF is redefined as the intermediate concentration of the protein in the liquid phase at the internal surface of the particles. The concentrations of the protein in the liquid phase for each section can be calculated with Eq. (A3.15). The liquid phase concentration in the last section, C,, is the outlet concen- tration. The concentration-time plot, i.e., the breakthrough curve, then can be constructed. The solid phase concentra- tions in each section can be calculated by Q. (A3.2) for the nonporous particle case and by Eq. (A3.17) for the porous particle case. The axial concentration profiles in the column then can be produced for any particular time.
Two Simplified Cases
Similar to the BAM and NNPAM, the SAM also contains two simplified cases. When the surface interaction rate con- stant k , is assumed to be infinite, this mass transfer case of the SAM (abbreviated as SAM,,) can be represented by a simplified form of Eq. (A3.15), e.g.,
=A(x , - x2)Dt
In the case where the mass transfer rate is very high (abbreviated as the kinetic controlling case SAM,,), the surface interaction is considered as the rate-controlling step. As a result, Eq. (A3.8) becomes
1 dCi k, dt - (Ci - x ~ ) ( C , - x2) (A3.21)
and the integrated form is
=(x, - xJDt (A3.22)
In this case, the concentration of the protein in the liquid phase as a function of time then can be expressed as
which can be used directly to calculate the concentration in the liquid phase at time At. In the cases where the value of the liquid mass transfer coefficients are finite, i.e., Eq. (A3.15) or (A3.20) is required, a bisectional method can be adopted to calculate the concentrations.
References
Anspach, F. B., Johnston, A,, Wirth, H. J., Unger, K. K., Hearn, M. T. W. 1989. Thermodynamic and kinetic investigations on rigid and soft affinity gels with varying particle and pore sizes. J. Chromatogr. 476: 205-225.
Anspach, F. B., Johnston, A,, Wirth, H. J., Unger, K. K., Hearn, M. T. W.
1990. Thermodynamic and kinetic investigations on rigid and soft affinity gels with varying particle and pore sizes: Comparison of ther- modynamic parameters and the adsorption behaviour of proteins evaluated from bath and frontal analysis experiments. J. Chromatogr.
Arnold, F. H., Blanch, H. W., Wilke, C. R. 1985. Analysis of affinity sepa- rations: Predicting the performance of affinity adsorbers. Chem. Eng. J. 30: B9-B23.
Awe, B. H., Liapis, A. I. 1987. Modeling and analysis of biospecific ad- sorption in a finite bath. AIChE J. 33: 179-193.
Arve, B. H., Liapis, A. I. 1988. Biospecific adsorption in fixed and periomc countercurrent beds. Biotechnol. Bioeng. 32: 616627.
Bird, R. B., Stewart, W. E., Lightfoot, E. N. 1960. Transport phenomena. Wiley, New York.
Bjorkland, M., H e m , M. T. W. 1996. Synthesis of silica-based heparin affinity adsorbents. J. Chromatogr.
Bjorklund, M., Hearn, M. T. W. Characterization of silica-based heparin affinity adsorbents through column chromatography of plasma frac- tions containing thrombin. J. Chromatogr., to appear.
Chase, H. A. 1984. Prediction of the performance of preparative affinity chromatography. J. Chromatogr. 297: 179-202.
Clonis, Y. D. 1990. Process affinity chromatography, pp 401-445. In: J. A. Asenjo (ed.), Separation processes in biotechnology. Marcel Dekker, New York.
Coulson, J. M., Richardson, J. F. 1979. Chemical engineering, vol. 3, 2nd edition. Pergamon, Oxford.
Cowan, G. H., Gosling, I. S., Sweetenham, W. P. 1989. Modeling methods to aid the design and optimisation of batch stirred-tank and packed-bed column adsorption and chromatography units. J. Chromatogr. 484: 187-210.
Cramer, S. M., Subramanian, G. 1990. Recent advances in the theory and practice of displacement chromatography. Sep. Purif. Meth. 19: 31-91.
Dantigny, P., Wang, Y., Hubble, J., Howell, J. A. 1991. Optimisation of frontal chromatography by partial loading. J. Chromatogr. 545: 27-42.
Dasari, I, Prince, I. G., Hearn, M. T. W. 1993. Physical characterisation of fluidized-bed behaviour of chromatographic packing materials. J. Chromatogr. 631: 115-124.
Do, D. D. 1985. Discrete cell model of fixed-bed adsorbers with rectan- gular adsorption isotherms. AIChE J. 31: 1329-1337.
Felinger, A,, Guiochon, G. 1992. Optimization of the experimental condi- tions and the column design parameters in the overloaded elution chromatography. J. Chromatogr. 591: 3 1 4 5 .
Gosling, L. S., Cook, D., Fry, M. D. M. 1989. The role of adsorption isotherms in the design of chromatographic separations for down- stream processing. Chem. Eng. Res. Des. 67: 232-242.
Grushka, E. 1989. Preparative-scale chromatography. Marcel Dekker, New York.
Hearn, M. T. W. 1989. High performance chromatographic methods in biotechnology. Aust. J. Biotech. 3: 183-190.
Heam, M. T. W., Anspach, F. B. 1990. Chemical, physical, and biochemi- cal concepts in isolation and purification of proteins, pp 17-64. In: J. A. Asenjo (ed.), Separation processes in biotechnology. Marcel Dek- ker, New York.
499: 103-124.
Helfferich, F. 1962. Ion exchange. McGraw-Hill, New York. Hiester, N. K., Vermeulen, T. 1952. Saturation performance of ion-
exchange and adsorption columns. Chem. Eng. Prog. 48: 505-516. Hines, A. L., Maddox, R. N. 1985. Mass transfer: Fundamentals and ap-
plications. prentice-Hall, Englewood Cliffs, NJ. Horstmann, B. J., Chase, H. A. 1989. Modelling the affinity adsorption of
immunoglobulin G to Protein A immobilised to agarose matrices. Chem. Eng. Des. 67: 243-254.
Horstmann, B. J., Kenney, C. N., Chase, H. A. 1986. Adsorption of pro- teins on Sepharose affinity adsorbents of varying particle size. J. Chro- matogr. 361: 179-190.
Hubble, J. 1989. A simple model for predicting the performance of affinity chromatography columns. Biotechnol. Tech. 3: 113-1 18.
Janson, J-C., Hedman, P. 1987. On the optimization of process chroma- tography of proteins. Biotechnol. Prog. 3: 9-13.
M A 0 AND HEARN: AFFINITY AND ION-EXCHANGE CHROMATOGRAPHIC PROCESSES 221

Johnston, A., H e m , M. T. W. 1990. Mass transfer resistances in ion- exchange and dye-affinity chromatography of proteins. J. Chromatogr. 512: 101-114.
Johnston, A,, H e m , M. T. W. 1991. Protein interactions with porous cou- lombic adsorbents: Comparison of experimental findings with predic- tions of several adsorption models. J. Chromatogr. 557: 335-358.
Johnston, A., Mao, Q. M., Hearn, M. T. W. 1991. Analysis of operating parameters affecting the breakthrough curves in fixed-bed chromatog- raphy of proteins using several mathematical models. J. Chromatogr. 548: 127-145.
Jungbauer, A. 1993. Preparative chromatography of biomolecules. J. Chro- matogr. 639: 3-16.
Kreyszig, E. 1988. Advanced engineering mathematics, 6th ed. Wiley, New York.
Leser, E. W., Asenjo, J. A. 1992. Rational design of purification processes for recombinant proteins. J. Chromatogr. 584: 43-57.
Levison, P. R., Badger, S. E., Toome, D. W., Koscielny, M. L., Lane, L., Butts, E. T. 1992. Economic considerations important in the scale-up of an ovalbumin separation from hen egg-white on the anion-exchange cellulose DE92. J. Chromatogr. 590: 49-58.
Liapis, A. I. 1989. Theoretical aspects of affinity chromatography. J. Bio- technol. 11: 143-160.
Liapis, A. I., Anspach, F. B., Findley, M. E., Davies, J., H e m , M. T. W., Unger, K. K. 1989. Biospecific adsorption of lysozyme onto mono- clonal antibody ligand immobilized on nonporous silica particles. Bio- technol. Bioeng. 34 467-477.
Mao, Q. M., Finette, G. M. S., Prince, I. G., Heam, M. T. W. 1993. Studies of protein adsorption in fluidized beds using chromatographic support materials, APCChUCHEMECA '93 2: 403-406.
Mao, Q. M., Johnston, A,, Prince, I. G., Hearn, M. T. W. 1991. Predicting the performance of nonporous particles in affinity chromatography of proteins. J. Chromatogr. 548: 147-163.
Mao, Q. M., Prince, I. G., Heam, M. T. W. 1992. Choosing optimum op- erating conditions for protein purification with chromatographic col- umns. Roc. 10th Aust. Biotech. Conf., 308-311.
Mao, Q. M., Prince, I. G., H e m , M. T. W. 1993. Optimisation of operating parameters for protein purification with chromatographic columns. J. Chromatogr. 646: 81-89.
Mao, Q. M., Prince, I. G., H e m , M. T. W. 1995. Impact of operating parameters in large scale chromatography of proteins. J. Chromatogr.
Mao, Q. M., Stockmann, R., Prince, I. G., Hearn, M. T. W. 1993. Model- ling of protein adsorption with non-porous and porous particles in a finite bath. J. Chromatogr. 646: 67-80.
691: 273-283.
McCoy, M. A., Liapis, A. I. 1991. Evaluation of kinetic models for bio- specific adsorption and its implications for bath and column perfor- mance. J. Chromatogr. 548: 25-60.
Ohashi, H., Sugawara, T., Kikuchi, K., Konno, H. 1981. Correlation of liquid-side mass transfer coefficient for single particles and fixed beds. J. Chem. Eng. Jpn. 14: 433-438.
Sherwood, T. K., Pigford, R. L., Wilke, C. R. 1975. Mass transfer. Mc- Graw-Hill, New York.
Skidmore, G. L., Horstmann, B. J., Chase, H. A. 1990. Modelling single- component protein adsorption to the cation exchanger S Sepharose FF. J. Chromatogr. 498: 113-128.
Smith, J. M. 1981. Chemical engineering kinetics, 3rd edition. McGraw- Hill, New York.
Suwondo, E., Pibouleau, L., Domenech, S., Riba, J. P. 1991. Simulation via orthogonal collocation on finite element of a chromatographic column with nonlinear isotherm. Chem. Eng. Commun. 102: 161-188.
Tan, H. 1977. Calculation of the J function by a pocket calculator. Chem. Eng. 10: 158.
Thomas, H. G. 1944. Heterogeneous ion exchange in a flowing system. J. Am. Chem. SOC. 6 6 1664-1666.
Wei, J., H e m , M. T. W. Protein interaction with immobilised metal ion affinity ligands under high ionic strength conditions. Anal. Biochem., to appear.
Whitley, R. D., Van Cott, K. E., Berninger, J. A,, Wang, N. H. L. 1991. Effects of protein aggregation in isocratic nonlinear chromatography. AIChE J. 37: 555-568.
Wirth, H. J. 1990. Investigations on the influence of ligand densities on the chromatographic properties of silica based affinity supports. Ph.D. Dissertation, Joh.-Gutenberg University, Mainz, Germany.
Wirth, H. J., Unger, K. K., H e m , M. T. W. 1993. Influence of the ligand density on the properties of metal-chelate affinity supports. Anal. Bio- chem. 208: 1G25.
Yamamoto, S., Sano, Y. 1992. Short-cut method for predicting the pro- ductivity of affinity chromatography. J. Chromatogr. 597: 173-179.
Yang, B. L., Goto, M., Goto, S. M. 1989. Enzyme purification by affinity chromatography combined with batchwise adsorption and columnwise elution. J. Chem. Eng. Jpn. 2 2 532-537.
Young, M. E., Carroad, P. A,, Bell, R. L. 1980. Estimation of diffusion coefficients of proteins. Biotechnol. Bioeng. 22: 947-955.
Yu, Q.. Ngugen, T. S., Do, D. D. 1991. Interference phenomena and non- ideal effects of displacement chromatography. Prep. Chromatogr. 1: 235-267.
222 BIOTECHNOLOGY AND BIOENGINEERING, VOL. 52, NO. 2, OCTOBER 20, 1996