optimization of a solar photovoltaic thermal (pv/t) water collector based on exergy concept
TRANSCRIPT

lable at ScienceDirect
Renewable Energy 68 (2014) 356e365
Contents lists avai
Renewable Energy
journal homepage: www.elsevier .com/locate/renene
Optimization of a solar photovoltaic thermal (PV/T) water collectorbased on exergy concept
F. Sobhnamayan a, F. Sarhaddi a,*, M.A. Alavi b, S. Farahat a, J. Yazdanpanahi a
aDepartment of Mechanical Engineering, University of Sistan and Baluchestan, Zahedan, IranbDepartment of Mechanical Engineering, Mashhad Branch, Islamic Azad University, Mashhad, Iran
a r t i c l e i n f o
Article history:Received 11 April 2013Accepted 30 January 2014Available online
Keywords:Solar photovoltaic thermal (PV/T) watercollectorExergy analysisOptimization
* Corresponding author. Tel.: þ98 541 2426206; faxE-mail address: [email protected] (F. Sarhad
http://dx.doi.org/10.1016/j.renene.2014.01.0480960-1481/� 2014 Elsevier Ltd. All rights reserved.
a b s t r a c t
In this paper, the optimization of a solar photovoltaic thermal (PV/T) water collector which is based onexergy concept is carried out. Considering energy balance for different components of PV/T collector, wecan obtain analytical expressions for thermal parameters (i.e. solar cells temperature, outlet watertemperature, useful absorbed heat rate, average water temperature, thermal efficiency, etc.). Thermalanalysis of PV/T collector depends on electrical analysis of it; therefore, five-parameter currentevoltage (IeV) model is used to obtain electrical parameters (i.e. open-circuit voltage, short-circuit current, voltageand current at the point which has maximum electrical power, electrical efficiency, etc.). In order toobtain exergy efficiency of PV/T collector we need exergy analysis as well as energy analysis. Consideringexergy balance for different components of PV/T collector, we obtain the expressions which show theexergy of the different parts of PV/T collector. Some corrections have been done on the above expressionsin order to obtain a modified equation for the exergy efficiency of PV/T water collector. A computersimulation program has been developed in order to obtain the amount of thermal and electrical pa-rameters. The simulation results are in good agreement with the experimental data of previous litera-ture. Genetic algorithm (GA) has been used to optimize the exergy efficiency of PV/T water collector.Optimum inlet water velocity and pipe diameter are 0.09 m s�1, 4.8 mm, respectively. Maximum exergyefficiency is 11.36%. Finally, some parametric studies have been done in order to find the effect of climaticparameters on exergy efficiency.
� 2014 Elsevier Ltd. All rights reserved.
1. Introduction
Nowadays using renewable energies is considered morebecause of fossil fuels high price and the environmental problemswhich are caused by them. One of an abundant renewable energysources is solar energy. Most conventional systems which are usedin order to convert solar energy in to other kinds of energies are asfollows
1. Photovoltaic (PV) systems: systems which receive solar energyin order to give us electricity.
2. Solar collector systems: systems which receive solar energy inorder to give heat to the agent fluid
In a PV system, when the solar cells temperature increases,electrical voltage decreases. The electrical efficiency of PV system
: þ98 541 2447092.di).
decreases as a result of decrease in electrical voltage. In a solarcollector system, an external electrical source is needed to circulatethe agent fluid through the system. Therefore, if we combine a PVmodule and a solar collector system, the electrical source can beprovided for solar collector system. On the other hand, the addi-tional heat which is absorbed from PV module causes solar cellstemperature to decrease and as a result electrical efficiency in-creases. Combining these two systems, we can also use optimuminstallation space. Using a PV/T collector, we can convert solar en-ergy in to electricity and heat. As we know, the quality of these twokinds of energies is not the same. Using exergy analysis, we cancompare these two kinds of energies, which are different in theirquality. Using exergy optimization, we can determine optimumoperating mode of PV/T water collector. It has been shown that PV/T collector energy payback time (EPBT) can be decreased if PV/Tcollector works in its optimum operating mode [1].
Experimental and theoretical research which is carried out inthe field of exergy analysis of PV and PV/T systems, can beexpressed briefly as follows
F. Sobhnamayan et al. / Renewable Energy 68 (2014) 356e365 357
� Thermodynamic (exergy) limitations of photovoltaic phenom-enon and its conversion efficiency have been investigated inRefs. [2e7].
� Exergy analysis of PV systems based on net output exergy orexergy losses have been investigated in Refs. [8e11].
� Exergy analysis of PV/T air collectors has been widely investi-gated in Refs. [12e17].
� Exergy analysis of PV/T water collectors has been carried out inRefs. [18e26].
The deficient points of the previous studies are considered asfollows
� The exergy loss due to pressure drop in flow pipes is neglected� The exergy efficiency of PV/Twater collector which is used in theprevious literature [18e26], has a significant error at low solarradiation intensity. In this condition, the exergy efficiency tendsto the nominal electrical efficiency (hex z hel,ref) at the referenceconditions (Tcell,ref ¼ 25 �C, G ¼ 1000 W m�2).
� There has not been a comprehensive optimization of PV/T watercollector which is based on exergy concept regarding to designand operating parameters before the one carried out in thispaper.
In this paper, the following items are carried out respectively inorder to optimize a solar PV/T water collector which is based onexergy concept.
� Energy analysis is done in order to obtain thermal and electricalparameters
� Exergy analysis is done in order to introduce exergy efficiency� Exergetic optimization is carried out in order to determine op-timum operating mode of PV/T water collector
� Finally, some parametric studies are done in order to find theeffect of climatic parameters on exergy efficiency.
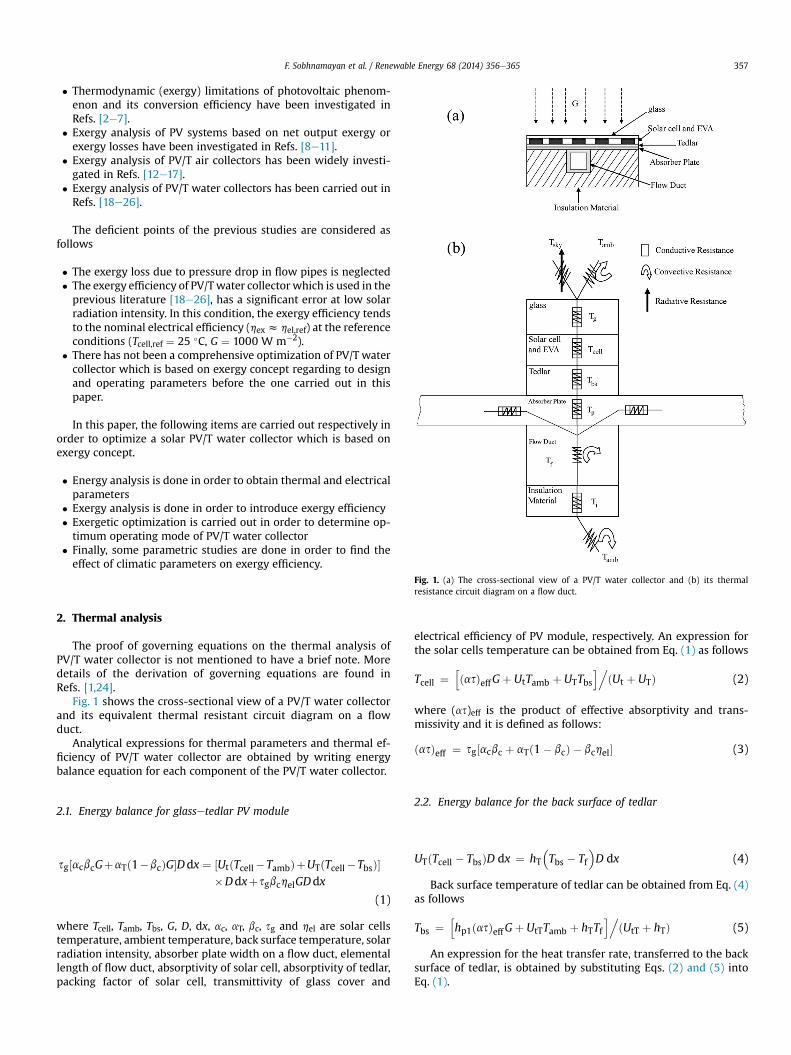
Fig. 1. (a) The cross-sectional view of a PV/T water collector and (b) its thermalresistance circuit diagram on a flow duct.
2. Thermal analysis
The proof of governing equations on the thermal analysis ofPV/T water collector is not mentioned to have a brief note. Moredetails of the derivation of governing equations are found inRefs. [1,24].
Fig. 1 shows the cross-sectional view of a PV/T water collectorand its equivalent thermal resistant circuit diagram on a flowduct.
Analytical expressions for thermal parameters and thermal ef-ficiency of PV/T water collector are obtained by writing energybalance equation for each component of the PV/T water collector.
2.1. Energy balance for glassetedlar PV module
sg½acbcGþaTð1�bcÞG�Ddx ¼ ½UtðTcell�TambÞþUTðTcell�TbsÞ��Ddxþ sgbchelGDdx
(1)
where Tcell, Tamb, Tbs, G, D, dx, ac, aT, bc, sg and hel are solar cellstemperature, ambient temperature, back surface temperature, solarradiation intensity, absorber plate width on a flow duct, elementallength of flow duct, absorptivity of solar cell, absorptivity of tedlar,packing factor of solar cell, transmittivity of glass cover and
electrical efficiency of PV module, respectively. An expression forthe solar cells temperature can be obtained from Eq. (1) as follows
Tcell ¼hðasÞeffGþ UtTamb þ UTTbs
i.ðUt þ UTÞ (2)
where (as)eff is the product of effective absorptivity and trans-missivity and it is defined as follows:
ðasÞeff ¼ sg½acbc þ aTð1� bcÞ � bchel� (3)
2.2. Energy balance for the back surface of tedlar
UTðTcell � TbsÞD dx ¼ hT�Tbs � Tf
�D dx (4)
Back surface temperature of tedlar can be obtained from Eq. (4)as follows
Tbs ¼hhp1ðasÞeffGþ UtTTamb þ hTTf
i.ðUtT þ hTÞ (5)
An expression for the heat transfer rate, transferred to the backsurface of tedlar, is obtained by substituting Eqs. (2) and (5) intoEq. (1).

F. Sobhnamayan et al. / Renewable Energy 68 (2014) 356e365358
UTðTcell�TbsÞ ¼ hT�Tbs�Tf
�¼ hp1hp2ðasÞeffG�Utw
�Tf �Tamb
�(6)
2.3. Energy balance for absorber plate
Energy balance for an elemental length of absorber plate and theflow duct under it, gives the following equation
ð1=NÞ�d _Qu=dx
�¼ WF 0
hhp1hp2ðasÞeffG� UL
�Tf � Tamb
�i(7)
where UL,W, N and F 0 are overall heat transfer coefficient from PV/Tcollector to surrounding, distance between two adjacent flow duct,number of flow ducts and collector efficiency factor, respectively.
2.4. Energy balance for the element of agent fluid in flow duct(Fig. 2)
_mNCpTf
����xþdx
� _mNCpTf
����x� 1Nd _Qu dx ¼ 0 (8)
8<:
dTfdx þ
�WF 0UL_mCp=N
��Tf � Tamb
�¼ WF 0hp1hp2ðasÞeffG
_mCp=N
x ¼ 0/Tf ¼ Tf ;in(9)
An expression for agent fluid temperature is obtained by solvingEq. (9) as follows
Tf ðxÞ ¼ Tamb þ
hp1hp2ðasÞeffGUL
!�1� exp
��bF 0ULx_mCp
��
þ Tf ;in exp��bF 0ULx
_mCp
�(10)
The outlet temperature of agent fluid (Tf,out) is obtained from theabove equation by considering boundary condition as Tf ¼ Tf,out, atx ¼ L
Tf ;out ¼ Tamb þ
hp1hp2ðasÞeffGUL
!�1� exp
��bF 0ULL_mCp
��
þ Tf ;in exp��bF 0ULL
_mCp
�(11)
where L is flow duct length and b¼ NW is PV/T collector width. Theaverage temperature of agent fluid along the length of a flow duct isobtained as follows
Fig. 2. The element of agent fluid in flow duct.
T f ¼ 1L
ZLx¼0
Tf ðxÞdx
¼"Tamb þ
hp1hp2ðasÞeffGUL
#241��1� exp
��bF 0ULL
_mCp
���bF 0ULL_mCp
�35
þ Tf ;in
�1� exp
��bF 0ULL
_mCp
���bF 0ULL_mCp
� (12)
2.5. Thermal efficiency of PV/T water collector
The rate of useful thermal energy of PV/T water collector isobtained as follows
_Qu ¼ _mCp�Tf ;out � Tf ;in
�¼ FRbL
hhp1hp2ðasÞeffG� UL
�Tf ;in � Tamb
�i(13)
FR ¼ _mCpULbL
�1� exp
��bF 0ULL_mCp
��(14)
where FR, _m and Cp are heat removal factor, mass flow rate and heatcapacity of agent fluid, respectively.
Thermal efficiency of PV/T water collector is defined as follows
hth ¼_Qu
bLG¼ FR
24hp1hp2ðasÞeff � UL
�Tf ;in � Tamb
�G
35 (15)
Because of the presence of the electrical efficiency of PV module(hel) in Eq. (3), thermal parameters of PV/T water collector and itselectrical parameters are dependent to each other.
3. Electrical analysis
In order to calculate electrical parameters and electrical effi-ciency of PV/T water collector five-parameter currentevoltage (IeV) model (Fig. 3) is used as follows [10,11]
I ¼ IL � Io
�exp
�V þ IRs
a
�� 1
�� ðV þ IRsÞ
Rsh(16)
where I and V represent current and voltage at load, a, IL, Io, Rs andRsh are ideality factor, light current, diode reverse saturation cur-rent, series resistance and shunt resistance, respectively. In order tocalculate five reference parameters (aref, IL,ref, Io,ref, Rs,ref and Rsh,ref),five pieces of information are needed at reference conditions. Thesefive pieces of information are defined as follows [10,11]:
At short-circuit current: I ¼ Isc,ref, V ¼ 0At open-circuit voltage: I ¼ 0, V ¼ Voc,ref
Fig. 3. Equivalent electrical circuit in fiveeparameter photovoltaic model.

F. Sobhnamayan et al. / Renewable Energy 68 (2014) 356e365 359
At the maximum power point: I ¼ Imp,ref, V ¼ Vmp,refAt the maximum power point: ½dðIVÞ=dV �mp ¼ ½VdI=dV +I�mp ¼ 0At short circuit: ½dI=dV �sc ¼ - 1=Rsh;ref
The subscript ‘ref’ indicates the value of parameters at thereference conditions. Reference conditions or standard ratingconditions (SRC) are defined as follows [10,11]
Solar cells temperature at reference conditions: Tcell,ref ¼ 25 �CSolar radiation intensity at reference conditions:
Gref ¼ 1000 W m�2.Substituting the five mentioned pieces of information into Eq.
(16), following equations are obtained
F1 ¼�Isc;ref þ IL;ref � Io;ref
"exp
Isc;refRs;ref
aref
!�1
#� Isc;refRs;ref
Rsh;ref¼ 0
(17)
F2 ¼ IL;ref � Io;ref
"exp
Voc;ref
aref
!� 1
#� Voc;ref
Rsh;ref¼ 0 (18)
F3 ¼ �Imp;ref þ IL;ref � Io;ref
"exp
Vmp;ref þ Imp;refRs;ref
aref
!� 1
#
� Vmp;ref þ Imp;refRs;refRsh;ref
¼ 0
(19)
F4 ¼ Vmp;ref
26664
�Io;ref exp�
Vmp;refþImp;ref Rs;refaref
�aref
� 1Rsh;ref
1þIo;refRs;ref exp
�Vmp;refþImp;ref Rs;ref
aref
�aref
þ Rs;refRsh;ref
37775þ Imp;ref ¼ 0
(20)
F5 ¼
26664
�Io;ref exp�
Isc;ref Rs;refaref
�aref
� 1Rsh;ref
1þIo;refRs;ref exp
�Isc;ref Rs;ref
aref
�aref
þ Rs;refRsh;ref
37775þ 1
Rsh;ref¼ 0 (21)
where Voc, Vmp, Isc and Imp are open-circuit voltage, maximumpower point voltage, short-circuit current and maximum powerpoint current, respectively. Functions F1, F2, F3, F4 and F5 form a setof five nonlinear equations in five unknown variables x1 ¼ aref,x2 ¼ IL,ref, x3 ¼ Io,ref, x4 ¼ Rs,ref and x5 ¼ Rsh,ref. Since the Eqs. (17)e(21) are implicit and nonlinear, NewtoneRaphson method is usedto solve them. Solving the equations set with NewtoneRaphsonmethod gives the value of five parameters (aref, IL,ref, Io,ref, Rs,ref andRsh,ref), at the reference conditions (Tcell,ref ¼ 25 �C,Gref¼ 1000 W m�2). In order to calculate the model parameters atnew climatic and operating conditions (G,Tcell), a set of translationequations is used such as follows [10,11]
aaref
¼ TcellTcell;ref
(22)
IoIo;ref
¼
TcellTcell;ref
!3
exp
3Nc
aref
�1� Tcell;ref
Tcell
�!(23)
IL ¼
GGref
!hIL;ref þ a
�Tcell � Tcell;ref
�i(24)
DT ¼ Tcell � Tcell;ref (25)
DI ¼ a
G
Gref
!DT þ
G
Gref� 1
!Isc;ref (26)
DV ¼ bDT � RsDI (27)
Isc ¼ Isc;ref þ DI (28)
Voc ¼ Voc;ref þ DV (29)
GGref
¼
264 �Io;ref exp
VmpþImpRs
a
a � 1
Rsh
1þIoRs exp
VmpþImpRs
a
a þ Rs
Rsh
375
26664
�Io;ref exp
�Vmp;refþImp;ref Rs;ref
aref
�aref
� 1Rsh;ref
1þIo;ref Rs;ref exp
�Vmp;refþImp;ref Rs;ref
aref
�aref
þ Rs;refRsh;ref
37775
(30)
RshzRsh;ref (31)
where 3, Nc, a and b are semiconductor band gap energy, solar cellsnumber in series, current temperature coefficient and voltagetemperature coefficient, respectively. PV module manufacturersusually give temperature coefficients. Vmp and Imp is a point on IeVcharacteristic curve. The area of rectangle under the IeV charac-teristic curve with the length of Vmp and width of Imp should bemaximum.
The consumed electrical power by pump to circulate workingfluid in PV/T water collector is calculated from [27]
Ppump ¼ 1:2465� 104APV=Th3:5f m1:83D0:5h
k2:33C1:17p r2hpump
(32)
Dh ¼ 4� Cross� sectional area of ductWetted perimeter
¼ 4dD2ðdþ DÞ (33)
The electrical efficiency of PV/T water collector is defined as theratio of actual electrical output power to input solar energy incidentrate on PV/T collector surface as follows:
hel ¼ VmpImp � Ppump
GAPV=T(34)
In the previous equations, Dh, APV/T, d, hf, m, k, r and hpump arehydraulic diameter of flow duct, PV/T surface area, duct depth,viscosity, conductivity, density of agent fluid and pump efficiency,respectively.
4. Exergy analysis
Exergy is defined as the maximum amount of work that can beproduced by a system or a flow of mass or energy as it comes toequilibrium with a reference environment [28,29]. The generalform of exergy balance equation for a control volume is written as[9]

F. Sobhnamayan et al. / Renewable Energy 68 (2014) 356e365360
Xð _mexÞin �
Xð _mexÞout þ
X_ExQ � _ExW ¼ _I (35)
whereP ð _mexÞin,
P ð _mexÞout,P _ExQ , _ExW and _I are inlet exergy
rate related to inlet water flow, outlet exergy rate related to outletwater flow, inlet or outlet heat exergy rate, inlet or outlet workexergy rate and irreversibility rate in control volume, respectively.
4.1. Inlet and outlet exergy rate related to water flow
These exergy rates are given by [28,29]
Xð _mexÞin ¼ _mCp
�Tf ;in � Tamb � Tamb ln
�Tf ;inTamb
��þ
_mDPf ;inr
(36)
Xð _mexÞout ¼ _mCp
�Tf ;out � Tamb � Tamb ln
�Tf ;outTamb
��þ
_mDPf ;outr
(37)
hex ¼_Qu
�1� Tamb
Tf ;out
�þnhel;ref
h1� bref
�Tcell � Tamb;ref
�iGAPV=T
o� Ppump
GAPV=T
�1� 4
3
�TambTsun
�þ 1
3
�TambTsun
�4� (43)
where DPf,in and DPf,out are the pressure difference between waterflow and surroundings at entrance and exit of PV/T collector.
4.2. Heat exergy rate
Heat exergy rate includes solar radiation intensity exergy rateð _ExQ ;sunÞ. According to the Petela theorem, it is given by [30,31]
_ExQ ;sun ¼ GAPV=T
"1� 4
3
�TambTsun
�þ 13
�TambTsun
�4#
(38)
where Tsun is sun temperature in Kelvin scale.
4.3. Work exergy rate
Work exergy rate includes the difference between outlet elec-trical power of PV module and consumed electrical power bypump:
_ExW ¼ VmpImp � Ppump (39)
4.4. Irreversibility rate
Irreversibility rate is the summation of exergy losses rate fromcontrol volume and exergy destructions rate in control volume
_I ¼X
_Exloss þX
_Exdes (40)
The amount of exergy goes out of control volume and cannot beused, is called exergy loss. On the other hand, the amount of exergyproduced by for example flow friction or mixture of two kinds ofliquids, etc. and does not go out of control volume is named exergydestruction [9].
4.5. Exergy efficiency of PV/T water collector
Exergy efficiency of PV/T water collector is defined as the ratio ofnet output (desired) exergy rate to net input exergy rate [9]
hex ¼P ð _mexÞout �
P ð _mexÞin þ _ExW_ExQ ;sun
¼ 1�_I
_ExQ ;sun(41)
Substituting Eqs. (36)e(39) into Eq. (41), exergy efficiency of PV/T water collector is obtained as follows:
hex ¼_mCp
�Tf ;out�Tf ;in�Tamb ln
�Tf ;outTf ;in
��� _mDPf
r þVmpImp�Ppump
GAPV=T
�1�4
3
�TambTsun
�þ1
3
�TambTsun
�4�(42)
where DPf is pressure drop in flow pipes.In the previous studies [18e26], exergy efficiency of PV/T water
collector has been calculated from following equation
This equation has some deficiencies; first, it does not include theexergy loss due to pressure drop in flow pipes. Second, it has asignificant error at low solar radiation intensity. At low solar radi-ation intensity, PV/T exergy efficiency defined by Eq. (43) tends tothe electrical efficiency of the reference conditions (hex z hel,ref).The equivalence of solar cells temperature and ambient tempera-ture and negligible amount of _Qu are the reasons of this fact.
5. Formulation of optimization problem
Optimization of PV/T water collector is necessary to increase itsefficiency and reduce its EPBT. A computer simulation program hasbeen developed based on thermal and electrical models which arepresented in the previous sections. The formulation of optimizationproblem, considering the quantities Tamb, Tamb,ref, Tcell,ref,Tf,inzTamb, Tsun, G, Gref, hel,ref, APV/T, L,W, etc. as constant parametersis given by8>>>>>>>>>>>>><>>>>>>>>>>>>>:
Maximize hex ¼ Eq: ð42Þ;subject toEqs: ð1Þ � ð34Þand0:01 � Vin � 2 m s�1;0:001 � Dh � 0:01 m;Tcell; Tf ;out; Tbs; T f ; _m;Cp; Io; IL;Rs;Rsh; a; Isc;Voc; Imp;Vmp;_Qu;Qloss;Ut;UL;UT;UtT;DPf ; r; ðasÞeff ; hp1; hp2; hf ; hth; hel � 0;other nonlinear constraints:
where Vin and Dh are independent parameters and Tcell, Tf,out, Tbs, T f ,_m, Cp, Io, IL, Rs, Rsh, a, Isc, Voc, Imp, Vmp, _Qu, _Q loss, Ut, UL, UT, UtT, DPf, r,(as)eff, hp1, hp2, hf, hth and hel are dependent parameters in theoptimization procedure. The objective function and its constraintequations are nonlinear. Therefore, a real coded genetic algorithm

Table 1Design parameters of the PV/T water collector.
F. Sobhnamayan et al. / Renewable Energy 68 (2014) 356e365 361
program has been developed to optimize the objective function[32].
Parameter Value
PV Module Solarex MSX60, Poly-crystalline silicon 60 WL � b 1.108 m � 0.502 mW 0.037 mIsc,ref 3.8 AVoc,ref 21.1 VImp,ref 3.5 AVmp,ref 17.1 Va 2.06 mA �C�1
b �0.077 V �C�1
bc 0.9bref 0.0045 �C�1
Vw 1 m s�1
6. Experimental validation
The simulation results of our computer program have beenvalidated by the experimental results of Huang et al. [18] for asample PV/T water collector. The features of sample PV/T watercollector come as follows.
The PV/T water collector made in their study consists of a poly-crystalline PV module (Solarex MSX60) and a heat-collecting plate.The heat-collecting plate adheres directly to the back of the PVmodule. Thermal grease is used between the plate and the PVmodule for better contact. Below the heat-collecting plate, a ther-mal insulation layer is attached using a fixing frame. Fig. 4 showsschematic diagram of the experimental setup of Huang et al. [18].
The experimental data of Huang et al. [18] include solar radia-tion intensity, ambient temperature, solar cells temperature, inletand outlet water temperature and average value of electrical effi-ciency. The simulated values of solar cells temperature, outlet watertemperature, thermal efficiency, electrical efficiency and exergyefficiency have been validated by their corresponding experimentalvalues in Ref. [18].
It should be mentioned that zero-phase digital filtering is usedto obtain smooth curves from Fig. 4 in Huang et al.’s work. Thencurve fitting methods are used to convert the smooth curves in tonumerical values.
The design parameters of PV/T water collector are described inTable 1. More details about experiments and measurement in-struments can be found in Ref. [18].
In order to compare the simulated results with the experimentalresult, a root mean square percentage deviation (RMS) has beenused by following equation
RMS ¼ffiffiffiffiffiffiffiffiffiffiffiffiffiffiffiffiffiffiffiffiffiffiffiffiffiffiffiffiffiffiffiffiffiffiffiffiffiffiffiffiffiffiffiffiffiffiffiffiffiffiffiffiffiffiffiffiffiffiffiffiffiffiffiffiffiffiffiffiffiffiffiffiffiP �
100� Xsim;i � Xexp;i
Xexp;i�2
n
s(44)
where n is the number of the experiments carried out.Variations of solar radiation intensity and the simulated and
experimental values of solar cells temperature, outlet water tem-perature, inlet water temperature and ambient temperature duringthe test day are shown in Fig. 5.
Since, PV/T water collector of Huang et al.’s setup has worked ina closed loop therefore the inlet water temperature is higher thanthe ambient temperature. According to this figure, it is observedthat there are good agreements between the experimental andsimulated values of solar cells temperature and outlet water tem-perature. Furthermore, the root mean square percentage deviationsof these parameters are 6.13%, and 4.52%, respectively.
Fig. 4. Schematic diagram of Huang et al.’s setup [18].
Experimental and simulated values of thermal and electricalefficiency during the test day are shown in Fig. 6.
A comparison between the experimental and simulated valuesof thermal efficiency is carried out in this figure. Since in Ref. [18],only the average value of electrical efficiency (hel,exp,avg ¼ 9%)during the course of experiments has been reported, the RMS of theaverage values of experimental and simulated electrical efficiencyhas been calculated. The root mean square percentage deviations ofthese parameters are 9.68% and 5.55%, respectively. It is observedthat there is a fair agreement between the experimental andsimulated values of these efficiencies.
Simulated and experimental values of the exergy efficiency ofpresent work and the one given by previous studies during the testday are shown in Fig. 7.
The values of root mean square percent deviation are 6.36% and6.85%, respectively. It is observed that there is a good agreementbetween the simulated and experimental values of these effi-ciencies. The relative values of the exergy efficiency given byprevious studies are more than the exergy efficiency values ofpresent work. The exergy efficiency given by previous studies doesnot include the exergy loss due to pressure drop in flow pipes.Therefore, its values are more than the ones given by presentstudy.
Fig. 5. Variations of solar radiation intensity and the simulated and experimentalvalues of various temperatures of PV/T water collector during the test day.

Fig. 6. Experimental and simulated values of thermal and electrical efficiency duringthe test day.
Fig. 8. Behavior of exergy efficiency as a function of inlet water velocity (Vin) and pipesdiameter (Dh).
F. Sobhnamayan et al. / Renewable Energy 68 (2014) 356e365362
7. Results and discussion
7.1. Optimization results
Optimization process is carried out for the selected values of theenvironmental and design conditions according to Table 1. Thevariations of objective function (hex) with respect to the variation ofinlet water velocity (Vin) and pipes diameter (Dh) are drawn inFig. 8.
Fig. 8 is presented a range of operational and design conditionswhere the exergy efficiency takes a global maximum value. It isobserved that there is one global maximum point. The coordinateof this point shows the values of optimized parameters. Thecalculated values of global maximum point are Vin,opt ¼ 0.09 m s�1,Dh,opt ¼ 4.8 mm, hex,max ¼ 11.36%.
Fig. 7. Simulated and experimental values of the exergy efficiency of present work andthe one given by previous studies during the test day.
7.2. Parametric studies
In order to plot the next figures some parameters are assumedwhich are mentioned above each figure. The rest of parametersneeded to plot the following figures are used from Table 1.
The variations of the exergy efficiency of present work and theexergy efficiency of previous studies with respect to inlet watervelocity are plotted in Fig. 9.
It is observed that by increasing inlet water velocity from 0.01 to2 m s�1, initially the exergy efficiency of present study increasesfromw9% tow11.36% and after attaining the inlet water velocity ofabout Vin ¼ 0.09 m s�1, it decreases to 0%. This indicates the opti-mum value of inlet water velocity for given climatic and designparameters (Table 1). The increase of inlet water velocity increasespressure drop in flow pipes, therefore the consumed electricalpower by pump increases and it causes a significant drop in theexergy efficiency of PV/T water collector. On the other hand, theexergy efficiency of previous studies has the same behavior with
Fig. 9. Variations of the exergy efficiency of present work and the exergy efficiency ofprevious studies with respect to inlet water velocity.

Fig. 10. Variations of the exergy efficiency of present work and the one given byprevious studies with respect to pipes diameter.
Fig. 12. Variations of the exergy efficiency of present work and the one given byprevious studies with respect to wind speed.
F. Sobhnamayan et al. / Renewable Energy 68 (2014) 356e365 363
respect to the variation of inlet water velocity. Since it does notinclude the exergy loss of pressure drop, its relative values are morethan the exergy efficiency values of present work.
Fig. 10 shows the variations of the exergy efficiency of presentwork and the one given by previous studies with respect to pipesdiameter.
According to this figure, the exergy efficiency of present studyincreases from w8.5% to its optimum value and then it tends to aconstant value (w11.3%). The coordinate of optimum point isDh ¼ 4.8 mm. It is impossible to determine an optimum value formass flow rate regarding to the optimum value of inlet water ve-locity and pipes diameter because there are some values of inletwater velocity and pipes diameter which are not optimum but giveus the same mass flow rate as the one obtained for optimum inletwater velocity and pipes diameter.
Fig. 11 shows the effect of solar radiation intensity on the exergyefficiency of present work and the one given by previous studies.
Fig. 11. Effect of solar radiation intensity on the exergy efficiency of present work andthe one given by previous studies.
It is observed that by increasing solar radiation intensity from0 to 1000 W m�2, the exergy efficiency of the present work in-creases from w0% to w11.5%, exponentially but the exergy effi-ciency of previous studies increases from w11.4 to w13%, quasi-linearly. According to the figure, it is observed that the exergy ef-ficiency given by previous studies has a significant error at low solarradiation intensity. At low solar radiation intensity, the exergy ef-ficiency given by previous studies gives the value of PV/T exergyefficiency almost near the value of electrical efficiency of thereference conditions (hexz hel,ref). The equivalence of the solar cellsand ambient temperature and the negligible amount of _Qu are thereasons of this fact.
Fig. 12 shows the variations of the exergy efficiency of presentwork and the one given by previous studies with respect to windspeed.
According to this figure, it is observed that the two exergy ef-ficiencies have a slight change with respect to wind speedvariations.
8. Conclusion
Based on present study, the following conclusions have beendrawn:
� the numerical simulation results are in good agreement with theexperimental measurements of Huang et al. [18];
� since the exergy efficiency given by previous studies does notinclude the exergy loss due to pressure drop in flow pipes, itsrelative values are more than the ones given in the presentstudy;
� the exergy efficiency of the previous studies has a significanterror at low solar radiation intensity. This deficiency has beencorrected in the modified exergy efficiency of present study;
� we know that energy efficiency changes without havingextremum points with respect to operating and design param-eters variation. Therefore, energy optimization gives optimumpoints in start or end of optimization parameters ranges. How-ever, the exergy efficiency has extremum points and shows apoint of global maximum;
� exergy efficiency behavior of the present work is the same as theone given by previous studies with respect to the changes ofinlet water velocity, pipes diameter and wind speed.

F. Sobhnamayan et al. / Renewable Energy 68 (2014) 356e365364
Nomenclaturea ideality factor (eV)b width of PV/T water collector (m)A area (m2)Cp specific heat capacity of water (J kg�1 K�1)D width of flow duct, hydraulic diameter of flow duct (m)ex specific exergy flow (J kg�1)_Ex exergy rate (W)F functionFR heat removal factorF 0 collector efficiency factorG solar radiation intensity (W m�2)h heat transfer coefficient (W m�2 K�1)hp1 penalty factor due to the presence of solar cell material,
glass and EVAhp2 penalty factor due to the presence of interface between
tedlar and working fluidI circuit current (A)_I irreversibility rate (W)IeV currentevoltageL dimensions of solar module, the length of PV/T water
collector (m)_m mass flow rate of water (kg s�1)n number of the experiment carried outN number of flow ductNc number of cells in PV moduleP power (W), pressure (Pa)_Q heat transfer rate (W)R resistance (U)RMS root mean square percentage deviation (%)T temperature (K)T average temperature (K)UL an overall heat loss coefficient from the PV/T collector to
the environment (W m�2 K�1)Ut an overall heat transfer coefficient from solar cell to
ambient through glass cover (W m�2 K�1)UT a conductive heat transfer coefficient from solar cell to
absorber plate through tedlar (W m�2 K�1)UtT an overall heat transfer coefficient from glass to tedlar
through solar cell (W m�2 K�1)Utw an overall heat transfer coefficient from glass to agent
fluid through solar cell (W m�2 K�1)V circuit voltage (V), wind speed (m s�1)W distance between two adjacent flow duct (m)X experimental or simulated parameter
Greek symbolsa absorptivity, current temperature coefficient (mA�C�1)(as)eff product of effective absorptivity and transmittivityb packing factor, voltage temperature coefficient (V �C�1)
the temperature coefficient of electrical efficiency (�C�1)d duct depth (m)D difference in current, pressure, temperature, voltage3 semiconductor band gap energy (eV)h efficiency (%)r density (kg m�3)m viscosity (kg m�1 s�1)s transmittivity
Subscriptsamb ambientavg averagebs back surface of tedlarcell cell, moduledes destroyed
el electricalex exergyexp experimentalf fluid flowg glassh hydraulici i-th parameterin inletinlet inletloss lossL light currentmax maximummp maximum power pointo reverse saturationoc open circuitopt optimumout outletpump pumpQ heat transferPV/T PV/Tref references seriessc short-circuitsh shuntsim simulatedsun sunt topT tedlarth thermalu usefulw wind, work
References
[1] Tiwari A, Sodha MS. Performance evaluation of solar PV/T system: an exper-imental validation. Sol Energy 2006;80:751e9.
[2] Ross RT, Hsiao TL. Limits on the yield of photochemical solar energy conver-sion. J Appl Phys 1977;48(11):4783e5.
[3] Landsberg PT, Markvart T. The carnot factor in solar cell theory. Solid-StateElectron 1998;42(4):657e9.
[4] Markvart T, Landsberg PT. Thermodynamics and reciprocity of solar energyconversion. Physica E 2002;14:71e7.
[5] Würfel P. Thermodynamic limitations to solar energy conversion. Physica E2002;14:18e26.
[6] Smestad GP. Conversion of heat and light simultaneously using a vacuumphotodiode and the thermionic and photoelectric effects. Sol Energy Mater SolCells 2004;82:227e40.
[7] Bisquert J, Cahen D, Hodes G, Ruhle S, Zaban A. Physical chemical principles ofphotovoltaic conversion with nanoparticulate, mesoporous dye-sensitizedsolar cells. J Phys Chem B 2004;108(24):8106e18.
[8] Sahin AD, Dincer I, Rosen MA. Thermodynamic analysis of solar photovoltaiccell systems. Sol Energy Mater Sol Cells 2007;91:153e9.
[9] Joshi AS, Dincer I, Reddy BV. Thermodynamic assessment of photovoltaicsystems. Sol Energy 2009;83(8):1139e49.
[10] Sarhaddi F, Farahat S, Ajam H, Behzadmehr A. Exergetic performance evalu-ation of a solar photovoltaic (PV) array. Aust J Basic Appl Sci 2010;4(3):502e19.
[11] Sarhaddi F, Farahat S, Ajam H, Behzadmehr A. Exergy efficiency of a solarphotovoltaic array based on exergy destructions. Proc Inst Mech Eng Part JPower Energy 2010;224(6):813e25.
[12] Polivoda FA. Analysis of the exergy efficiency and the energy efficiency ofphotothermal-and-voltaic systems. Therm Eng 1998;45(7):609e12.
[13] Saitoh H, Hamada Y, Kubota H, Nakamura M, Ochifuji K, Yokoyama S, et al.Field experiments and analyses on a hybrid solar collector. Appl Therm Eng2003;23:2089e105.
[14] Joshi AS, Tiwari A. Energy and exergy efficiencies of a hybrid photovoltaicethermal (PV/T) air collector. Renew Energy 2007;32(13):2223e41.
[15] Dubey S, Solanki SC, Tiwari A. Energy and exergy analysis of PV/T air collectorsconnected in series. Energy Build 2009;41(8):863e70.
[16] Sarhaddi F, Farahat S, Ajam H, Behzadmehr A. Exergetic performanceassessment of a solar photovoltaic thermal (PV/T) air collector. Energy Build2010;42:2184e99.
[17] Agrawal S, Tiwari GN. Energy and exergy analysis of hybrid micro-channelphotovoltaic thermal module. Sol Energy 2011;85(2):356e70.

F. Sobhnamayan et al. / Renewable Energy 68 (2014) 356e365 365
[18] Huang BJ, Lin TH, Hung WC, Sun FS. Performance evaluation of solar photo-voltaic/thermal systems. Sol Energy 2001;70(5):443e8.
[19] Zondag HA, De Vries DW, Van Helden WGJ, Van Zolengen RJC, VanSteenhoven AA. The thermal and electrical yield of a PVethermal collector. SolEnergy 2002;72(2):113e28.
[20] Zondag HA, De Vries DW, Van Helden WGJ, Van Zolingen RJC, VanSteenhoven AA. The yield of different combined PVethermal collector de-signs. Sol Energy 2003;74:253e69.
[21] Dubey S, Tiwari GN. Thermal modeling of a combined system of photovoltaicthermal (PV/T) solar water heater. Sol Energy 2008;82:602e12.
[22] Dubey S, Tiwari GN. Analysis of PV/T flat plate water collectors connected inseries. Sol Energy 2009;83:1485e98.
[23] Bosanac M, Sorensen B, Ivan K, Sorensen H, Bruno N, Jamal B. Photovoltaic/thermal solar collectors and their potential in Denmark. Final report. EFP Project2003, 1713/00-0014,www.solenergi.dk/rapporter/pvtpotentialindenmark.pdf;2003.
[24] Tiwari A, Dubey S, Sandhu GS, Sodha MS, Anwar SI. Exergy analysis of inte-grated photovoltaic thermal solar water heater under constant flow rate andconstant collection temperature modes. Appl Energy 2009;86(12):2592e7.
[25] Chow TT, Pei G, Fong KF, Lin Z, Chan ALS, Ji J. Energy and exergy analysis ofphotovoltaicethermal collector with and without glass cover. Appl Energy2009;86:310e6.
[26] Mishra RK, Tiwari GN. Energy and exergy analysis of hybrid photovoltaicthermal water collector for constant collection temperature mode. Sol Energy2013;90:58e67.
[27] Kakaç S, Liu H. Heat exchangers: selection, rating and thermal design. 2nd ed.Boca Raton, Florida 33431, USA: CRC Press LLC, 2000 N.W. Corporate Blvd.;2003.
[28] Kotas TJ. The exergy method of thermal plant analysis. Malabar, FL: KriegerPublish Company; 1995. UK.
[29] Wong KFV. Thermodynamics for engineers. USA: University of Miami/CRCPress LLC, Taylor & Francis; 2000.
[30] Petela R. Exergy of undiluted thermal radiation. Sol Energy 2003;74:469e88.[31] Petela R. An approach to the exergy analysis of photosynthesis. Sol Energy
2008;82:311e28.[32] Osyczka A. Evolutionary algorithms for single and multicriteria design opti-
mization. 1st ed. Verlag Heidelberg; 2001.