optimal placement of multitypes dg as independent private sector under pool/hybrid power market...
TRANSCRIPT

Electrical Power and Energy Systems 51 (2013) 43–53
Contents lists available at SciVerse ScienceDirect
Electrical Power and Energy Systems
journal homepage: www.elsevier .com/locate / i jepes
Optimal placement of multitypes DG as independent private sectorunder pool/hybrid power market using GA-based Tabu Search method
0142-0615/$ - see front matter � 2013 Elsevier Ltd. All rights reserved.http://dx.doi.org/10.1016/j.ijepes.2013.03.003
⇑ Corresponding author. Tel.: +98 09188607414.E-mail addresses: [email protected] (M. Mohammadi), [email protected]
(M. Nafar).
M. Mohammadi a,⇑, Mehdi Nafar b
a Department of Electrical Engineering, Borujerd Branch, Islamic Azad University, Borujerd, Iranb Department of Electrical Engineering, Marvdasht Branch, Islamic Azad University, Marvdasht, Iran
a r t i c l e i n f o a b s t r a c t
Article history:Received 7 June 2012Received in revised form 22 February 2013Accepted 2 March 2013
Keywords:Distributed generationElectricity marketPool marketHybrid marketGenetic algorithmTabu Search method
The new idea of this paper is investigation the effect of bilateral contract between Disco and upstreamnetwork and between Disco-Customers in supplying demand power of customers based on hybrid powermarket rules. In this paper, an optimal location of multi types of distributed generation as independentprivate sector in a distribution system under pool and hybrid based electricity market in order to cover aconstant demand power using bilateral contract for selling fixed value power with certain price valueduring every condition of market by upstream network to is presented and discussed. The hybrid marketconsidered in this paper consists of four independent sectors and participants, as (1) DG owners, (2) dis-tribution company known as Disco, (3) Independent Supervisor Operator (ISO) in order to superintend onmarket situation and finally (4) Customers. Based on hybrid electricity operation, in this study it is sup-posed that in every condition Disco using bilateral contract with 63/20 substation, purchase constantpower with certain price and sell it to customers with another contract. Of course due to this bilateralcontract, the operation cost of Disco increases and on the other hand the reliability of system increasesand the revenue obtained from decreasing energy not supplied load is the important subject that is con-sidered and analyzed in this research.
In this research, GA-based Tabu Search method (GATS) is investigated and analyzed in order to optimallocation of DG units with certain capacity but with multi types for optimizing net present worth subjectto economical, technical, and market constraints. The costs include capital cost, replacement cost, oper-ation and maintenance cost, fuel cost, production cost, and reliability improvement cost.
� 2013 Elsevier Ltd. All rights reserved.
1. Introduction
Distributed generations have many advantages that encouragesystem planners to utilize them in system planning. DGs can im-prove system quality through voltage profile improvement, lossreduction, mitigation of transmission and distribution capacity, reli-ability, and power quality improvement. In order to receive to men-tioned advantages, the issue of optimal sitting and sizing of DG mustbe addressed [1,2]. Ghosh [3] Presents a simple search approach fordetermining optimal size and location of DG using N–R methodthrough optimizing of a multi-objective function based minimizingpower loss and cost. Other power flow techniques are presented tooptimal sizing of DG [4,5]. Wang and Nehrir have presented an ana-lytical technique for optimal location of DG with the aim of reducingpower loss [6]. Chiradeja has discussed the advantages of reductionpower loss in distribution system f with concentrated load [7]. Manystudies have been implemented with the aim of power loss reduc-
tion that addressed the issue of DG optimization based onintelligent method such as genetic algorithm, particle swarm opti-mization, simulated annealing, and tabu search of course otherstudies have been presented based on analytical method in optimi-zation of DGs for power loss reduction [7–20]. Distribution systemplanning technique based on cost minimization considering DGfor peak cutting is presented by Ouyang et al. [21]. It purposes tominimize the sum of investments costs of distribution systemincluding feeders and DG investments, energy loss cost, and theadditional cost of DG sources. Authors have developed a model fordistribution system planning, with considering DG sources. How-ever, the influence of load variation and reliability improvementof system by DG are not considered by El-Khattam et al. [22]. In[23], distribution system planning considering DG option based ona multistage model is presented. However, power quality and reli-ability improvement and also load variation are not considered. Insome other studies, advantages and benefits of considering distrib-uted generation in distribution system planning has been discussed[24–26]. A new methodology based on Fuzzy and Artificial ImmuneSystem (AIS) in order to optimize the placement of Distributed Gen-erators for a typical distribution system with the aim of reducing the

Nomenclature
NPW net present worth of systemxi coefficients factors in objective functionPi, Qi real and reactive power injected in each busVi voltage at bus i|Vi| voltage magnitude at bus idi voltage angle at bus ih � q decision variablesPgi active power generated by DGPmax
gi ; Pmingi upper and lower limitations of active power generated
by DGi annual interstate ratei0 nominal increate arteF inflation ratesCRF capital recovery factorSSF sinking fund factorRrep replacement cost durationRcomp lifetime of the component.Rrem remaining life of the componentCarep annualized replacement costCrep replacement cost of system componentfrep replacement factorNb number of feeders of distribution systemkb failure rate of feeders of distribution system (f/km year)Lb feeder length (km)Cint,J the price of energy loss for load level JNres number of isolated buses during fault location
Nrep number of isolated buses during fault repairPres restored demand power during faultPrep not restored demand power during faulttres time of fault detection and switching timetrep repair time of faultCEquip,J cost of energy not supplied due to failuresCENS cost of energy not suppliedCENS, DG cost of energy not supplied considering DG unitrij, ri,u decision variablesCij the cost of upgrading of feeder i � j per kmCi,u the fixed cost of upgrading of ith transformer in uth sub-
stationCe the variable cost of upgrading of ith transformer in uth
substation for per kwPi,u nominal power of ith transformer in uth sub.Cr&m replacement-maintenance cost of DG units per kWpf power factor of power systemSDGi rated power of DG unitsai, bi and ci parameters of fuel-cost curve of micro turbinePel output power of micro turbine (kW)Pth,rec thermal recovered power of micro turbine (kW)mf mass flow rate of the fuel of micro turbine (kg/s)LHVf lower heating rate of fuel in micro turbine (kJ/kg f)Cnl the price of natural gas of micro turbinePJ the electric power output of micro turbine at interval JglJ the cell efficiency of micro turbine at interval J
44 M. Mohammadi, M. Nafar / Electrical Power and Energy Systems 51 (2013) 43–53
real power losses and improving the voltage profile is presented byPadma Lalitha et al. [27]. In [28], the optimal DG placement inderegulated electricity market is presented. Optimal DG placementin distribution systems using cost/worth analysis is discussed andanalyzed by Ahmadigorji et al. [29]. Evaluation of reliability, losses,and power quality considering time variations of load in presenceof distributed generation sources is presented by Hamedi andGandomkar [30]. In [31], GA-based optimal sizing and placementof distributed generation for loss minimization is presented.
In the most of investigations about DG optimization, the opti-mal DG sitting and sizing have been studied with the aim of reli-ability and power quality improvement, loss reduction, andvoltage profile improvement based on the assumption that DG de-vice is a part of distribution system, and all of advantages, disad-vantages, costs and revenue due to installing of DGs belong todistribution system, and based on the trade-off between theseadvantages and disadvantages, the optimal points are determined.In other research, DGs are optimized only based on revenues andcosts and the maximizing benefit of DG installation is consideredas objective function. It is notable that in the most researches, onlyoptimal placement and sizing are discussed and few researcheshave considered the optimization of types of DG. So, in reviewedresearches, up to now, DGs have not been considered as indepen-dent sector in distribution system under power market. As newidea, this paper has investigated the optimal placement ofmultitype of DGs under hybrid electricity market with aim ofmaximizing the total net present worth of DGs owners and Distri-bution Company (Disco). In this study, based on hybrid marketrules and based on tied bilateral contract between customers,Disco and upstream network, it is supposed that a constant powerwith certain price is provided in every condition using Disco andthe rest of power demand under competitive market environmentbetween Disco and DG-owners is supported. Also, the effect ofmarket policy is investigated and a comparison is done betweenoptimization results under pool and hybrid market. This paper
used combination of genetic algorithm and tabu search thatpresented by Chuan-Kang Ting, Cheng-Feng Ko, and Chih-HuiHuang for optimization procedure of multitypes DG units underpool market.
2. Optimization problem
2.1. Objective function
Based on the proposed power market, considering main powersellers, that is Disco and DG, the objective function is considered asfollows:
2.1.1. Maximize
NPW ¼ x1 � NPWDG þx2 � NPWDisco
0 6 xi 6 1 andX2
i¼1
xi ¼ 1ð1Þ
For multi types of distributed generations the NPW of DG unitsis considered as:
NPWDG ¼ k1 � NPWDE þ k2 � NPWMT
k1 þ k2 ¼ 1ð2Þ
where x1, x2, k1, and k2 represent weighting coefficients related tomultitypes of DG and Disco.
The NPW represents the Net Present Worth of the market. Itcovers two terms. NPWDisco represents the net present worth ofDisco and NPWDG indicates net present worth of DG owners. In fact,the maximizing the total NPW of DG and Disco is the main objec-tive of ISO under market that in this study it is optimized with GA-based TS (GATS) approach.

M. Mohammadi, M. Nafar / Electrical Power and Energy Systems 51 (2013) 43–53 45
2.2. Power flow analysis
Real and reactive power balances based on equations of powerflow for each of bus system are presented as below [30]:
Pi ¼XNb
j¼1
ViVj½Gij cosðdi � djÞ þ Bij sinðdi � djÞ� ð3Þ
Q i ¼XNb
j¼1
ViVj½Gij sinðdi � djÞ � Bij cosðdi � djÞ� ð4Þ
Also the injected real and reactive power considering DG atoptimal points of system can be determined as follows:
Q i ¼ Q gi þ h � QDGi � Q di ð5ÞPi ¼ Pgi þ h � PDGi � q � Pdi ð6Þ
where q demonstrate the variation of demand power by customersunder bilateral/hybrid power market. Also decision variable h repre-sents the considering or not-considering DG in each bus of system.This value will be one in the case of DG and otherwise it is zero.
The main inequality constraints that must be considered in theoptimization are listed as follow:
Pmingi 6 Pgi 6 Pmax
gi ð7Þdmax
i 6 di 6 dmaxi ð8Þ
jV jmixi 6 jV ji 6 jV j
maxi ð9Þ
Iline 6 Imaxline limitation of feeder current ð10Þ
Psub;63=20 P 0 power flow direction constraint ð11Þ
Eq. (7) shows the limitation of power generated with each DG. Eq.(8) represents the limitation of voltage angles based on system sta-bility. Eq. (9) describes the limitation of magnitude angle for voltageat each bus of system and Eq. (10) represents the limitation of feed-ers current due to power loss and thermal limitation and the lastequation indicate that in order to remain security and system sta-bility, the direction of power flow must be from upstream networkto downstream network and it must not opposite.
2.3. Basic economic formulation
Based techno-economic assessment of DG optimization disusedby many researchers [32], the main economical relations, em-ployed in this study, are illustrated in detail below:
2.3.1. Net present worthIt is defined as the difference between present worth of benefit
and cost as follow:
J ¼ NPW ¼ PWBk � PWCk
k ¼ Disco;DGð12Þ
2.3.2. Annualized costIt is determined by multiplying the initial cost by the capital
recovery factor (CRF) and illustrated as below [21]:
Cann;tot ¼ Cint � CRFði;RprojÞ ð13Þ
where CRF is calculated as follows [21]:
CRFði;RprojÞ ¼ið1þ iÞRproj
ð1þ iÞRproj � 1ð14Þ
where Rproj indicate the project lifetime and i represents the annualinterest rate and is related to nominal interest rate and inflationrate as bellow [28]:
i ¼ i0 � fi0 þ f
ð15Þ
Following equation gives the annualized cost versus of futureworth:
Cann;tot ¼ FW � SSFði;RprojÞ ð16Þ
where SFF represents sinking fund factor and determined as follows[32]:
SFFði;RprojÞ ¼i
ð1þ iÞRproj � 1ð17Þ
2.3.3. Replacement cost durationFollowing equation gives the salvage value of each component
of market at the end of the project lifetime [32].
Rrep ¼ Rcomp � INTRproj
Rcomp
� �ð18Þ
where Rcomp represents the component-lifetime.
2.3.4. Remaining life of the componentIt is calculated as follows:
Rrem ¼ Rcomp � ðRproj � RrepÞ ð19Þ
2.3.5. Annualized replacement costThis parameter is expressed by the following equation [32–34]:
Carep ¼ Crepffrep � SFFði;RcompÞ �Rrem
Rcomp
� �� SFFði;RprojÞg ð20Þ
where Crep indicates the replacement cost of components of systemat end of its lifetime and frep is replacement factor that is due to dif-ference between the component and the project lifetime. It is for-mulated as follows [31,32]:
frep ¼CRFði;RprojÞCRFði;RrepÞ ; Rrep > 0
0; Rrep < 0
(ð21Þ
2.4. Cost–benefit assessment of market
This section illustrates Disco and DG owners as follows:
2.4.1. Income of DISCOThe revenue obtained by Disco is the income received using
selling electrical power to customers and it is formulated as fol-lows [32–34]:
RDISCO ¼ Rsellingpower þ Rreliability ð22Þ
The first term is revenue of Disco due to selling power. It is theincome obtained from selling electricity to the customers underelectricity market and is expressed as follows [32–34]:
Rsellingpower ¼ K þXT
k¼1
XM
i¼1
Pek;i;sell � qe
k;i;sell ð23Þ
This revenue of Disco due to selling power under hybrid powermarket consists of two parts. The first part is the revenue from sell-ing constant power to customer due to bilateral contract betweenDisco and Customers and the second part is revenue of Disco forproviding the rest of demand power in competition with DG unitsunder market.
Reliability consideration has been investigated by manyresearchers in optimizing DGs [35]. However, in DG optimizationunder power market as independent private sector, reliability con-sideration has been few investigated. So for considering reliabilityimprovement in this research, the second term of [23] representsthe revenue of Disco due to improvement of reliability of systemin decreasing energy not supplied of distribution system throughpresence of DG as private sector in market.

46 M. Mohammadi, M. Nafar / Electrical Power and Energy Systems 51 (2013) 43–53
In this paper in order to calculate the revenue of increasing sys-tem reliability, the index of energy not supplied is considered andits variation due to DG installation is investigated and analyzed.This parameter demonstrates the value of total energy that willnot be supplied by the system in during fault study. It is clear thatwith installing DG by DG owners, the energy not supplied of sys-tem will be decreased and therefore the revenue already missedby Disco is recovered. So in order to calculate this revenue it shouldbe calculate the cost of energy not supplied before and after DGinstallation on optimal bus derived from optimization processand the differences between two this value, gives reliabilityimprovement system revenue as follows:
Rreliability ¼ CENS � CENS;DG ð24Þ
For energy not supplied cost, Ref. [15] presents a formulation asfollows:
CENS ¼XNb
b¼1
Cint; J � kb � Lb �XNres
res¼1
Prestres þXNrep
rep¼1
Preptrep
!þ CEquip;J
" #
ð25Þ
It is notable that this formulation will be used in two times,once for cost calculation without considering DGs and again withconsidering DGs in system at optimal point.
Based on economical analytical and presented relations in per-vious sections, the present worth value of this revenue is presentedas follows:
BVPðRreliabilityÞ ¼ Rreliability
XT
t¼1
1þ f1þ i
� �t
ð26Þ
It is to be noted that in this study, the price of energy not sup-plied is not considered as the same in different time and it is variedfor off peak and peak during time [16]. Fig. 1 shows the variation ofprice of energy not supply in this investigation.
2.4.2. Costs of DISCOAll of the costs that should be considered by Disco can be for-
mulated as follows [34]:
CDISCO ¼ CF þ CS�M&O þ CBuy ð27Þ
where the first term presented by [27] represents the total cost dueto repairing and upgrading feeders of distribution system and isdetermined as follows [36,37]:
CF ¼XTN
i¼1
XM
j¼1
Cijrij ð28Þ
Fig. 1. Estimation of energy not supply price in network.
The cost of the maintenance, operation, and repairing of substa-tions is given by second term and it is calculated as follows [38,39]:
CS�M&O ¼XTN
i¼1
XM
u¼1
Ci;uri;u þ 8760XT
t¼1
bXTN
i¼1
XTUi
u¼1
CePi;u
!ð29Þ
The last term gives total cost used for buying electricity fromsubstation 63/20 and or/and from DGs to meet the load [40]:
CBuy ¼XT
k¼1
Pe;SUBk;buyq
e;SUBk;buy þ
XT
k¼1
Pe;DGk;buyq
e;DGk;buy ð30Þ
The decision variables ri,u and ri,j are used to show the repairsituation. In case of repair, it is equal to one, otherwise it is zero.
2.4.3. Income of distributed generationThe total revenue obtained by DG under market is the income
received by selling power to Disco on peak during and is deter-mined as follows [33]:
RDG ¼XT
k¼1
XNDG
i¼1
Pe;DGk;i;sell � qe;DG
k;sell ð31Þ
2.4.4. Costs of distributed generationEq. (34) gives the all of costs of DG owners as follows:
CDG ¼ CCap þ Cr&m þ CPðDGÞ ð32Þ
The first term gives the installation costs of DG units in optimallocations considering types of them.
The next term gives the repair and maintenance costs of DGs asfollows [36]:
Cr&m ¼ 8760XT
i¼bXM
i¼1
ðCr&m � pf � SDGiÞ ð33Þ
The last term is related to production cost. It covers fuel cost.In this paper, two kinds of distributed generation are consid-
ered, and based on results of optimization, the optimum type canbe placed on optimal bus results using DG owners in distributionsystem.
Diesel generator and micro turbine are considered as owns ofDG owners for possible placement in optimal location.
The effective function of DE is supplying demand power load ofcustomers in peak during and decreasing peak of system. The mainportion of maintenance and operation cost of DE is related to itsfuel cost and it is considered as quadratic polynomial in terms ofoutput power by DE as follows [22].
CP ¼XT
k¼1
XNDG
i¼1
ða � P2k;i þ b � Pk;i þ cÞ ð34Þ
ai, bi and ci are the coefficients of the fuel-cost characterization ofdiesel generator, Pk;i; i ¼ 1;2; . . . ;N is the diesel generator i outputpower (kW) and N represents the number of DE that is dependedto optimization results.In this study, the values of ai; bi and ci areset as follows:
a ¼ 0:0074; b ¼ 0:2333 and c ¼ 0:4333:
Fig. 2 represents the consumption of fuel in terms of power ofthe considered diesel generator.
Another candidate DG is considered in this study is micro tur-bine. The models of micro turbines are similar to those of fuel cells[22].
The fuel cost of MT is formulated as follows:
CMT ¼ Cnl
XJ
PJ
glJð35Þ

Fig. 2. Fuel consumption of DNAC 50 Hz diesel engine.
M. Mohammadi, M. Nafar / Electrical Power and Energy Systems 51 (2013) 43–53 47
where Cnl indicates the price of natural gas in order to supply theMT, PJ represent net produced electrical power at interval J and glJ
is the cell efficiency at interval J and it is calculated based formula-tion presented as follows:
g ¼ Pel þ Pth;rec
mf LHVfð36Þ
where Pel indicates the total generated electrical power, Pth,rec isrecovered thermal power, rate of fuel-mass flow is represented bymf and LHVf indicate the rate of the fuel lower heating (kJ/kg f)
Fig. 3. GA–TS algorithm flowchart.
3. Power market model
In order to achieve competitive electricity environment, threebasic market models and transactions can be considered as follows[39]:
� Pool model.� Bilateral contract model.� Hybrid market model.
The pool markets demonstrate a centralized market environ-ment that clears the market for the buyers and sellers of electricalpower. The electrical power sellers/buyers offer bids to the pool forthe monetary of electrical power which they are trend to trade un-der market.
In restructuring power market place, under existing competi-tion between various electric power sellers and various transac-tions can occur among buyers and sellers directly; thesetransactions are as follows [40]:
� Bilateral.� Multilateral.� Ancillary services transactions.
The hybrid power market model has a combination of severalfeatures related to pool and bilateral models. In the model of hy-brid power market, many transactions can be expected betweenbuyers and sellers in order to provide more flexible and economicmarket operation. It can also lead to congestion and decrease sys-tem security and stability of the network. So the issue of optimalsitting of DG under hybrid power market should be addressed.
As a main indicator, nodal price is the index to identify the priceof unit MW that injects at each node and congestion in the distri-bution network.
4. The GA–TS optimization approach
Fig. 3 presents the Flowchart of GA–TS that presented by Chu-an-Kang Ting, Cheng-Feng Ko and Chih-Hui Huang. Based on[24], this approach is presented as following. The framework ofGATS principally follows that of GA, except the survivor selectionembedded with the TS strategies. In the survivor selection, GATSdisallows the offspring reproduced from tabu mating to survive,unless they can satisfy the aspiration criterion. To adapt these TSstrategies to GA, several modifications are required. The modifiedelements of GA in GATS are elaborated below.
4.1. Representation
The chromosome representation in GATS consists of the chro-mosome structure of GA and, especially, an additional memorystructure based on TS to guide the search. Formally, a chromosomeis represented as a three tuple (g,u,s) where g = (g1, . . . ,gl) indi-cates genes, u represents the clan number, and s = (s1, . . . ,sT) dem-onstrates the tabu list. The first part, g, originated from GA, isconcerned with the information about candidate solutions. There-fore, the representation is problem-dependent. This study usesbinary-coded and order-based representations for numerical andcombinatorial optimization problems, respectively. The secondpart is a memory structure comprised of clan number u and tabulist s. The clan number acts as a signature for chromosome identi-fication. Each chromosome in the initial population of GATS is as-signed a unique clan number.
4.2. Tabu restriction
The proposed GATS utilizes the tabu restriction of TS to preventinbreeding. Inbreeding represents the mating (breeding) of closerelatives and is known to be harmful to the health and fertility ofindividuals in nature. In evolutionary algorithms, several studieshave proven that inbreeding causes a rapid loss of population

48 M. Mohammadi, M. Nafar / Electrical Power and Energy Systems 51 (2013) 43–53
diversity and raises the risk of premature convergence. To preventthis, GATS uses the clan number to identify chromosomes and thetabu list to record mating history. Whenever GATS selects a pair ofparents for reproduction, it checks the validity of this mating. Ifeither parent finds its clan number exists in the clan number orthe tabu list of its partner, this mating is invalid and their offspringare labeled with ‘‘tabu’’. That is to say, the mating of related chro-mosomes will yield tabu offspring according to the comparison re-sult of clan and mating history. The following function determineswhether the mating of two chromosomes c1 = (g1,u1,s1) andc2 = (g2,u2,s2) yields tabu offspring:
Tabu ðC1;C2Þ ¼
true u1 ¼ u2 or
9k : u1 ¼ s2;k or u2 ¼ s1;k� �false otherwise
8>><>>: ð37Þ
where si,k denotes the kth element in tabu list si.A chromosome updates its tabu list when it undertakes cross-
over. The crossover of parents in GATS includes two parts. AsFig. 4 shows, first, the crossover is performed on genes to exchangeinformation about the solution variables. This part is analogouswith the crossover in GA. Second, both parents add the clan num-ber of their partner to the tabu list, which works as a queue-first in,first out. The clan numbers that are removed out of the tabu listregain the validity to mate with. Each offspring inherits the clannumber and tabu list from one of its parents.
4.3. Aspiration criterion
In addition to tabu restriction, TGATS takes the aspiration crite-rion into account in the survivor selection. The tabu restrictionhelps to maintain population diversity; however, it may weakenthe exploitation of promising solutions. GATS enables the aspira-tion criterion of TS to provide a chance to release from the taburestriction so as to moderately reinforce exploitation. Aspirationcriterion is defined to allow superior offspring to override the taburestriction. In GATS, a tabu offspring C0 is said to be aspired if its fit-ness is better than the best so-far fitness f�. For a minimizationproblem, the aspiration criterion is defined by:
Aspired ðC 0Þ ¼true f ðC 0Þ < f �
false otherwise
(ð38Þ
The aspired offspring will survive while the tabu offspring willbe discarded in the survivor selection. The interaction between
Fig. 4. Crossover and updating of tabu list in GATS.
tabu restriction and aspiration criterion is expected to balancethe diversity maintenance and selection pressure of GATS.
4.4. Survivor selection
The survivor selection is the key of GATS in hybridization of GAand TS. Traditionally, the survivor selection of GA considers onlythe chromosome fitness. In nature, the survivability of an individ-ual is, however, concerned with many factors in addition to fitness.For example, inbreeding depression states that inbreeding, that is,breeding of related individuals, will cause a decrease in fitness. Toavoid that, humans generally conduct eugenics to avoid mating ofparties related by blood (consanguinity) or marriage (affinity) orboth.
The GATS implements this idea through the components andstrategies of TS. The clan number and tabu list enable GATS toidentify chromosomes and their relatives. The tabu restriction, fur-thermore, forbids mating of related chromosomes.
Analogous with the eugenics used in human society, the tabuoffspring will be eliminated unless they are good enough to defeatthe best chromosome so far, that is, to satisfy the aspiration crite-rion. The survivor selection in GATS thus considers three kinds ofchromosomes as survivors for the next generation: [1] parents inthe current population, [2] offspring that are generated from validmating and [3] aspired offspring.
5. Simulation and discussion
5.1. Case study and test system
The proposed methodology is tested on a typical test system. Aschematic of the 33-bus test system is shown in Fig. 5.
5.2. Assumptions and constraints of electricity market
Since this study deal with the optimal location of distributedgeneration in distribution system under electricity market, it ismore important to consider the assumptions and constraints ofpower market in this problem. This assumptions and constraintsand related numerical values are used as input parameters for pro-grammed software using MATLAB for this optimization. This cov-ers the assumptions and constraints of all participants in powermarket including Distribution Generations (DGs) and DistributionCompany (Disco), upstream network or main utility grid and cus-tomers. The details of this assumptions and constraints and relatednumerical values are discussed as follows.
5.3. Distributed generations and power market constraints
In this research, two types of DG units including combustionmotor as type 1 and micro turbine as type 2 are considered forinstalling in candidate buses on 4, 9, 12, 20, 23, 26, and 29. DGowners must consider power market laws. All of the costs dis-cussed before for DG units are listed in Table 1.
With attention of high investment cost of DG units, if powerprice under electricity market cross from a certain value and ex-change with higher price, then DGs must be ready for selling powerto Disco. In this research, two types of power and prices are consid-ered for distributed generation under electricity market. This in-cludes off-peak and peak periods. The upper and lower limitsconsidered for selling power to Disco by DG units and their periodsare given Fig. 6.
It is notable that in order to investigate the impact of the kind ofentree of DGs to market environment, two assumptions are consid-ered as follows:

Fig. 5. Test distribution system.
Table 1Parameters of DGS considered in this study.
Parameters DE MT
Maximum rated power (kW) 1000 500Investment cost ($/kW h) 690 915Fuel price ($/kW h) 0.0220 0.0236Repair and operation costs ($/kW h) 0.009 0.011Life time (year) 15 10
Fig. 6. Electricity price of distributed generations.
Fig. 7. Electricity price of upstream network.
M. Mohammadi, M. Nafar / Electrical Power and Energy Systems 51 (2013) 43–53 49
DG-Type 1 (Diesel Generator, (DE)) is supposed that it can enterto network from the first year of planning and used underoperation.DG-Type 2 (Micro Turbine, (MT)) is supposed that heir ownershave opportunity about 1 year for investing and entrance tomarket, in the other words, this type of DGs can be operatedfrom second year.
5.4. Upstream network and power market constraints
The upstream network, that is, substation 63 kV/20 kV as themain sector in supplying a part of demand power of network (ofcourse in absence of DGs it must supply the total demand power),similar to other participants in market like DGs, has its specialrules that must be considered in optimization problem.
It is supposed that Disco in order to purchase power from up-stream network with optimal price will be competed in electricitymarket with other participants.
It is supposed that Disco at beginning of the multiyears longterm programming, anticipate the buying power price based onpower prices in previous years and other effective factors. How-ever, in order to simplify the optimization problem, it is supposedthat instead of 24 types prices, only 4 types of prices are consideredfor buying power from upstream network.
It shall be noted that active power price is variant in differenthours. This paper uses multi-level model for electricity price thatis functional of active power receiving from transmission grid.
Fig. 7 shows the proposed electric price.
5.5. Distribution company (Disco) and power market constraints
Under hybrid electricity market and based on bilateral contractbetween Disco and upstream network, main grid or 63/20 substa-tion is responsible for selling constant power equal to 800 [KW] toDisco with constant value of price equal 0.0650 [$/KW h] for everycondition during on peak and off peak. Of course, this price is lessthan value of price for exchange power between Disco and up-stream network, that is, 0.658 [$KW h] under pool market.
The rest of demand power is supplied with Disco under poolelectricity market and under the same conditions, and only basedon suggested prices, cost-constraints and technical limitations,Disco can purchase power simultaneously from upstream networkand distributed generation units. The details of this exchange be-tween Disco and other participants in market have been illustratedin above sections.
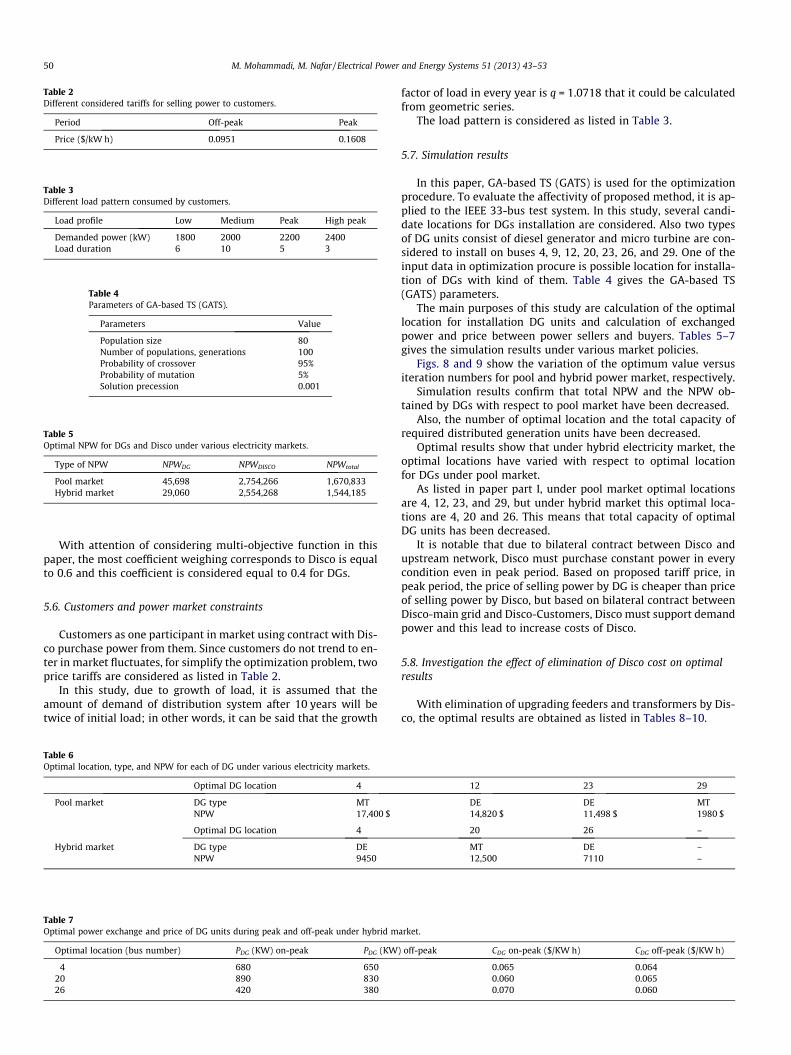
Table 2Different considered tariffs for selling power to customers.
Period Off-peak Peak
Price ($/kW h) 0.0951 0.1608
Table 3Different load pattern consumed by customers.
Load profile Low Medium Peak High peak
Demanded power (kW) 1800 2000 2200 2400Load duration 6 10 5 3
Table 4Parameters of GA-based TS (GATS).
Parameters Value
Population size 80Number of populations, generations 100Probability of crossover 95%Probability of mutation 5%Solution precession 0.001
Table 5Optimal NPW for DGs and Disco under various electricity markets.
Type of NPW NPWDG NPWDISCO NPWtotal
Pool market 45,698 2,754,266 1,670,833Hybrid market 29,060 2,554,268 1,544,185
50 M. Mohammadi, M. Nafar / Electrical Power and Energy Systems 51 (2013) 43–53
With attention of considering multi-objective function in thispaper, the most coefficient weighing corresponds to Disco is equalto 0.6 and this coefficient is considered equal to 0.4 for DGs.
5.6. Customers and power market constraints
Customers as one participant in market using contract with Dis-co purchase power from them. Since customers do not trend to en-ter in market fluctuates, for simplify the optimization problem, twoprice tariffs are considered as listed in Table 2.
In this study, due to growth of load, it is assumed that theamount of demand of distribution system after 10 years will betwice of initial load; in other words, it can be said that the growth
Table 6Optimal location, type, and NPW for each of DG under various electricity markets.
Optimal DG location 4
Pool market DG type MTNPW 17,400 $
Optimal DG location 4
Hybrid market DG type DENPW 9450
Table 7Optimal power exchange and price of DG units during peak and off-peak under hybrid m
Optimal location (bus number) PDG (KW) on-peak PDG (KW
4 680 65020 890 83026 420 380
factor of load in every year is q = 1.0718 that it could be calculatedfrom geometric series.
The load pattern is considered as listed in Table 3.
5.7. Simulation results
In this paper, GA-based TS (GATS) is used for the optimizationprocedure. To evaluate the affectivity of proposed method, it is ap-plied to the IEEE 33-bus test system. In this study, several candi-date locations for DGs installation are considered. Also two typesof DG units consist of diesel generator and micro turbine are con-sidered to install on buses 4, 9, 12, 20, 23, 26, and 29. One of theinput data in optimization procure is possible location for installa-tion of DGs with kind of them. Table 4 gives the GA-based TS(GATS) parameters.
The main purposes of this study are calculation of the optimallocation for installation DG units and calculation of exchangedpower and price between power sellers and buyers. Tables 5–7gives the simulation results under various market policies.
Figs. 8 and 9 show the variation of the optimum value versusiteration numbers for pool and hybrid power market, respectively.
Simulation results confirm that total NPW and the NPW ob-tained by DGs with respect to pool market have been decreased.
Also, the number of optimal location and the total capacity ofrequired distributed generation units have been decreased.
Optimal results show that under hybrid electricity market, theoptimal locations have varied with respect to optimal locationfor DGs under pool market.
As listed in paper part I, under pool market optimal locationsare 4, 12, 23, and 29, but under hybrid market this optimal loca-tions are 4, 20 and 26. This means that total capacity of optimalDG units has been decreased.
It is notable that due to bilateral contract between Disco andupstream network, Disco must purchase constant power in everycondition even in peak period. Based on proposed tariff price, inpeak period, the price of selling power by DG is cheaper than priceof selling power by Disco, but based on bilateral contract betweenDisco-main grid and Disco-Customers, Disco must support demandpower and this lead to increase costs of Disco.
5.8. Investigation the effect of elimination of Disco cost on optimalresults
With elimination of upgrading feeders and transformers by Dis-co, the optimal results are obtained as listed in Tables 8–10.
12 23 29
DE DE MT14,820 $ 11,498 $ 1980 $
20 26 –
MT DE –12,500 7110 –
arket.
) off-peak CDG on-peak ($/KW h) CDG off-peak ($/KW h)
0.065 0.0640.060 0.0650.070 0.060

Table 11Optimal NPW with more expensive fuel price under hybrid market.
Type of NPW NPWDG NPWDISCO NPWtotal
NPW value ($) 15,216 1,722,489 2,860,655
Table 12Optimal location, type, and NPW for each of DG with more expensive fuel price.
Under hybrid market
Optimal DG location 4 20 26 Total
DG Type DE MT DE –NPW 9420 12,500 7110 29,060
Table 13Optimal power exchange and price of DG units during peak and off-peak with moreexpensive fuel price under hybrid market.
Optimal location(bus number)
CDG on-peak($/KW h)
PDG (KW)off-peak
PDG (KW)on-peak
CDG off-peak($/KW h)
4 650 750 0.065 0.06220 850 900 0.060 0.06026 380 450 0.070 0.055
Fig. 9. optimum value versus iteration number under hybrid electricity market.
Fig. 8. optimum value versus iteration number under pool electricity market.
Table 10Optimal power exchange and price of DG units during peak and off-peak withoutconsidering upgrading costs by Disco under hybrid market.
Optimal location(bus number)
CDG on-peak($/KW h)
PDG (KW)off-peak
PDG (KW)on-peak
CDG off-peak($/KW h)
9 0.065 980 980 0.06026 0.065 805 805 0.060
Table 9Optimal location, type, and NPW for each of DG without considering upgrading costsby Disco under hybrid market.
Optimal DG location 9 26 – Total
DG type MT MT – –NPW 9420 12,500 – 29,060
Table 8Optimal NPW without considering upgrading costs by Disco under hybrid market.
Type of NPW NPWDG NPWDISCO NPWtotal
NPW value ($) 192,962 2,122,748 3,409,270
M. Mohammadi, M. Nafar / Electrical Power and Energy Systems 51 (2013) 43–53 51
As shown, due to elimination of cost of Disco, the benefit hasbeen increased from 2,554,268 to 3,409,270.
Optimization result show with eliminating of Disco cost, thenumber of optimal locations and types of DG have been decreasedand due to centralization of DG locations, the DG investment cost isdecreased and as a result, the benefit of DG is increased.
This result shows that installation of new feeders andtransformers and upgrading of old substation and feeders haseffective role on optimal location of DGs. It is obvious that withwithdrawing of upgrading cost, the optimal locations vary such away that number of optimal location is reduced and centralizedlocations are obtained that leads to reduce of investment cost ofDG owners.
5.9. Investigation the effect of elimination of fuel cost of DGs
In another study in order to investigate the validation ofresults, the fuel price of DGs in considered more expensiverather than pervious assumption, 20% more expensive, and withthis assumption, the optimal results are obtained as given inTables 11–13.
It is obvious that due to increase in fuel price, Disco must paymore cost to DG for purchase power, so this leads to increase inDisco costs and the NPW of Disco is reduced.
Fig. 10. Variation of power of DG and Disco with lower contract price.

Fig. 11. Variation of power of DG and Disco with more contract price.
Fig. 12. Variation of selling price for rest of power out of contract by DG and Discowith lower contract price.
Fig. 13. Variation of selling price for rest of power out of contract by DG and Discowith more contract price.
52 M. Mohammadi, M. Nafar / Electrical Power and Energy Systems 51 (2013) 43–53
5.10. Investigation the effect of variation price in bilateral contractbetween Disco and upstream network
In order to investigate the effect of price of bilateral contract be-tween Disco and upstream network for supplying power demand,optimization has been carried out and optimal power and marketprice results for contact price less than considered value in this pa-per in before section, i.e., 0.065 and for value more than 0.065 areshown in Figs. 10–13.
6. Conclusion
In this paper, optimization of DG in distribution system in orderto identify optimal location and type using maximizing net presentworth of system is presented under hybrid electricity. The newidea of this paper is that in this research, DG is considered as inde-pendent private sector in comparison with government sector asDisco for providing power demand. In this study, based on pool/bilateral/hybrid market rules and a based on tied bilateral contract
between customers, Disco and upstream network, it is supposedthat a constant power with certain price is provided in every con-dition using Disco and the rest of power demand under competi-tive market environment between Disco and DG-owners aresupported. In addition to this research, the effect of fuel price, elim-ination of feeder cost of distribution system, and price value inbilateral contract between Disco and upstream network under hy-brid market on optimal results are discussed and analyzed.
References
[1] Barker PP, de Mello RW. Determining the impact of distributed generation onpower systems. Part 1. Radial distribution systems. In: IEEE PES summermeeting, vol. 3; 2000. p. 1645–56.
[2] Hadjsaid N, Canard JF, Dumas F. Dispersed generation impact on distributionnetworks. IEEE Comput Appl Power 1999;12(April):22–8.
[3] Ghosh Sudipta, Ghoshal SP, Ghosh Saradindu. Optimal sizing and placement ofdistributed generation in a network system. Electr Power Energy Syst2010;32:849–56.
[4] Rau NS, Wan YH. Optimum location of resources in distributed planning. IEEETrans Power Syst 1994;9:2014–20.
[5] Kim JO, Nam SW, Park SK, Singh C. Dispersed generation planning usingimproved Hereford ranch algorithm. Electr Power Syst Res 1998;47(11).
[6] Wang C, Nehrir MHashem. Analytical approaches for optimal placement ofdistributed generation sources in power systems. IEEE Trans Power Syst2004;19(4):2068–76.
[7] Chiradeja P. Benefit of distributed generation: a line loss reduction analysis. In:IEEE/PES transmission and distribution conference & exhibition: Asia andPacific, China Dalian; 2005. p. 1–5.
[8] Wang C, Nehrir MH. Analytical approaches for optimal placement ofdistributed generation sources in power systems. IEEE Trans Power Syst2004;19(4):2068–76.
[9] Gozel T, Hocaoglu MH. An analytical method for the sizing and siting ofdistributed generators in radial systems. Int J Electr Power Syst Res 2009;79:912–8.
[10] Le DT, Kashem MA, Negnevitsky M, Ledwich G. Optimal distributed generationparameters for reducing losses with economic consideration. In: IEEE generalmeeting, vols. 24–28; 2007. p. 1–8.
[11] Gandomkar M, Vakilian M, Ehsan M. A combination of genetic algorithm andsimulated annealing for optimal DG allocation in distribution networks. In:2005 Canadian conference on electrical and, computer engineering, 1–4 May2005, p. 645–8.
[12] Celli G, Pillo F. Optimal distributed generation allocation in MV distributionnetworks. In: Proceedings of the IEEE international conference on powerengineering society, May 2001. p. 81–6.
[13] Carpinelli G, Celli G, Mocci S. Optimization of embedded generation sizing andsitting by using a double trade-off method. IEE Proc Generat Transm Distrib2005;152(4):503–13.
[14] Nara K, Hayashi Y, Ikeda K, Ashizawa T. Application of tabu search to optimalplacement of distributed generators. In: IEEE power engineering societywinter meeting; 2001. p. 918–23.
[15] Cano Edwin B. Utilizing fuzzy optimization for distributed generationallocation. In: IEEE region 10 conference, TENCON 2007, 30 October 2007.
[16] Rau NS, Wan Y-H. Optimum location of resources in distributed planning. IEEETrans Power Syst 1994;4:2014–20.
[17] Ghosh S, Ghoshal SP, Ghosh Sa. Optimal sizing and placement of distributedgeneration in a network system. Int J Electr Power Energy Syst 2010;32:849–56.
[18] Sebastian Rios M, Marcelo Rubio S. Sequential optimization for sitting andsizing distributed generation (DG) in medium voltage (MV) distributionnetworks. In: IEEE power tech conferences; 2007.
[19] Porkar S, Poure P, Abbaspour-Tehrani-fard A, Saadate S. A novel optimaldistribution system planning framework implementing distributed generationin a deregulated electricity market. Int J Electr Power Syst Res 2010;60:828–37.
[20] Moradi MH, Abedini M. A combination of genetic algorithm and particleswarm optimization for optimal DG location and sizing in distributionsystems. Int J Electr Power Energy Syst 2012;34(1):66–74 [January].
[21] Ouyang W, Cheng H, Zhang X, Yao L. Distribution network planning methodconsidering distributed generation for peak cutting. Energy Convers Manage2010;51(12):2394–401.
[22] El-Khattam W, Hegazy YG, Salama MMA. An integrated distributed generationoptimization model for distribution system planning. IEEE Trans Power Syst2005;20(2):1158–65.
[23] Haffner S, Pereira LFA, Pereira LA, Barreto LS. Multistage model for distributionexpansion planning with distributed generation – Part II: Numerical results.IEEE Trans Power Deliv 2008;23(2):915–23.
[24] Ting Chuan-Kang, Ko Cheng-Feng, Huang Chih-Hui. Selecting survivors ingenetic algorithm using tabu search Strategies. Memetic Comp 2009;1:191–203.
[25] Espie P, Ault GW, Burt GM, McDonald JR. Multiple criteria decision makingtechniques applied to electricity distribution system planning. IEE Proc GenerTransm Distribut 2003;150(5):527–35.

M. Mohammadi, M. Nafar / Electrical Power and Energy Systems 51 (2013) 43–53 53
[26] The distribution working group of the IEEE power system planning andimplementation committee, planning for effective distribution. IEEE PowerEnergy Mag 2003;1(5):54–62.
[27] Padma Lalitha M, Veera Reddy VC, Sivarami Reddy N, Sivagangadhar Reddy K.Clonal selection algorithm for DG sources allocation for minimum loss indistribution system. Int J Comput Sci Emerg Technol 2010;1(3).
[28] Gautam Durga, Mithulananthan Nadarajah. Optimal DG placement inderegulated electricity market. Electr Power Syst Res 2007;77:1627–36.
[29] Ahmadigorji M , Abbaspour A, Rajabi-Ghahnavieh A, Fotuhi-Firuzabad M.Optimal DG placement in distribution systems using cost/worth analysis.World Acad Sci Eng Technol 2009;49.
[30] Hamedi Hadi, Gandomkar Majid. Evaluation of reliability, losses and powerquality considering time variations of load in presence of distributedgeneration. Int J Acad Res May 2011;3(3). I Part.
[31] Singh Deependra, Singh Devender, Verma KS. GA based optimal sizing &placement of distributed generation for loss minimization. Int J Intell SystTechnol 2007;2.
[32] Moghimi H, Ahmadi A, Aghaei J, Rabiee A. Stochastic techno-economicoperation of power systems in the presence of distributed energy resources.Int J Electr Power Energy Syst February 2013;45(1):477–88.
[33] Kamalapur GD, Udaykumar RY. Rural electrification in India and feasibility ofphotovoltaic solar home systems. Int J Electr Power Energy Syst 2011;33:594–9.
[34] Hatziargyriou N, Asano H, Iravani R, Marnay C. MGs. An overview of ongoingresearch, development, and demonstration projects. IEEE Power Energy Mag2007;5(4):78–94.
[35] Arya Rajesh, Choube SC, Arya LD. Reliability evaluation and enhancement ofdistribution systems in the presence of distributed generation based onstandby mode. Int J Electr Power Energy Syst 2012;43(1):607–16.
[36] Bagherian Alireza, Tafreshi SM Moghaddas. A developed energy managementsystem for a microgrid in the completive electricity market. In: IEEE Bucharestpower teach conference, Bicharest, Romania, June 28th–July 2nd; 2009. p. 1–6.
[37] Chandramohan S, Atturulu Naresh, Kumudini Devi RP, Venkatesh B. Operatingcost minimization of a radial distribution system in a deregulated electricitymarket through reconfiguration using NSGA method. Int J Electr Power EnergySyst 2010;32:126–32.
[38] Mantway AH, Al-Muhaini Mohammad M. Multi-objective BPSO algorithm fordistribution system expansion planning including distributed generation. In:Transmission and distribution conference and exposition, 2008. IEEE/PES,Chicago, IL, 21–24 April; 2008. p. 1–8.
[39] Mohamed FaisalA, Koivo HeikkiN. System modelling and online optimalmanagement of Micro-Grid using Mesh Adaptive Direct Search. Int J ElectrPower Energy Syst 2010;32:398–407.
[40] Niknama Taher, Kavousifarda Abdollah, Tabatabaei Sajad, Aghaei Jamshid.Optimal operation management of fuel cell/wind/photovoltaic power sourcesconnected to distribution networks. J Power Sources 2011;196:8881–96.