optimal detection of faulty traffic sensorsused in route...
TRANSCRIPT
Optimal Detection of Faulty Tra�ic SensorsUsed in Route Planning
Amin GhafouriVanderbilt University
Nashville, Tennessee [email protected]
Aron LaszkaVanderbilt University
Nashville, Tennessee [email protected]
Abhishek DubeyVanderbilt University
Nashville, Tennessee [email protected]
Xenofon KoutsoukosVanderbilt University
Nashville, Tennessee [email protected]
ABSTRACTIn a smart city, real-time tra�c sensors may be deployed for variousapplications, such as route planning. Unfortunately, sensors areprone to failures, which result in erroneous tra�c data. Erroneousdata can adversely a�ect applications such as route planning, andcan cause increased travel time and environmental impact. To min-imize the impact of sensor failures, we must detect them promptlyand with high accuracy. However, typical detection algorithms maylead to a large number of false positives (i.e., false alarms) and falsenegatives (i.e., missed detections), which can result in suboptimalroute planning. In this paper, we devise an e�ective detector foridentifying faulty tra�c sensors using a prediction model based onGaussian Processes. Further, we present an approach for computingthe optimal parameters of the detector which minimize losses dueto false-positive and false-negative errors. We also characterizecritical sensors, whose failure can have high impact on the routeplanning application. Finally, we implement our method and evalu-ate it numerically using a real-world dataset and the route planningplatform OpenTripPlanner.
CCS CONCEPTS• Computer systems organization → Embedded and cyber-physical systems; Dependable and fault-tolerant systems and net-works; • Theory of computation → Gaussian processes;
KEYWORDSfault detection, cyber-physical systems, smart city, route planning
ACM Reference format:Amin Ghafouri, Aron Laszka, Abhishek Dubey, and Xenofon Koutsoukos.2017. Optimal Detection of Faulty Tra�c Sensors Used in Route Planning.In Proceedings of The 2nd Workshop on Science of Smart City Operations andPlatforms Engineering, Pittsburgh, PA USA, April 2017 (SCOPE 2017), 6 pages.
Permission to make digital or hard copies of all or part of this work for personal orclassroom use is granted without fee provided that copies are not made or distributedfor pro�t or commercial advantage and that copies bear this notice and the full citationon the �rst page. Copyrights for components of this work owned by others than theauthor(s) must be honored. Abstracting with credit is permitted. To copy otherwise, orrepublish, to post on servers or to redistribute to lists, requires prior speci�c permissionand/or a fee. Request permissions from [email protected] 2017, Pittsburgh, PA USA© 2017 Copyright held by the owner/author(s). Publication rights licensed to ACM.978-1-4503-4989-5/17/04. . . $15.00DOI: http://dx.doi.org/10.1145/3063386.3063767
1 INTRODUCTIONIn smart cities, real-time tra�c sensors may be deployed for variousapplications. However, sensors are prone to failures, which resultin erroneous tra�c data. Erroneous data can adversely a�ect theperformance of applications. To minimize the impact of sensorfailures, we must detect them promptly and with high accuracy.However, typical detection algorithms may lead to a large numberof false positives and false negatives, which can result in suboptimalperformance.
Anomaly detection of faulty tra�c sensors has been studied inthe literature. Typical approaches include using data-driven meth-ods that incorporate historical and real-time data to detect anom-alies [10], [18], [14], [16]. However, existing approaches may resultin high performance-losses in tra�c applications, mainly due tofalse-positive (FP) and false-negative (FN) errors. In order to min-imize the losses, it is desirable to reduce the FP and FN rates asmuch as possible. But, there exists a trade-o� between them, whichcan be changed through a detection threshold. To address this, itis necessary to take into account the tra�c application when de-signing anomaly detectors, and quantify the losses in the tra�capplication caused by the FP and FN errors. By selecting the rightdetection threshold, the performance losses caused by FPs and FNscan be minimized.
In this paper, we study the problem of �nding optimal thresholdsfor anomaly detection of faulty tra�c sensors, considering routeplanning as the application of interest. The objective is to selectthe optimal thresholds of anomaly detectors in order to optimizethe performance of the route planning application in the presenceof faulty sensors. We devise an e�ective detector for identifyingfaulty tra�c sensors using a prediction model based on Gauss-ian Processes. Further, we present an approach for computing theoptimal parameters of the detector which minimize losses due tofalse-positive and false-negative errors. We also characterize criticalsensors, whose failure can have high impact on the tra�c applica-tion. Finally, we implement our method and evaluate it numericallyusing a real-world dataset and the route planning platform Open-TripPlanner [11]. Our evaluation results show that the proposedstrategy successfully minimizes the performance loss and identi�esthe critical sensors.
The remainder of this paper is organized as follows. In Section 2,we present the background for route planning and Gaussian Process

SCOPE 2017, April 2017, Pi�sburgh, PA USA A. Ghafouri et al.
regression. In Section 3, we introduce the system model. In Section 4,we de�ne a notion of optimal detection, present a method to obtainnear-optimal thresholds, and de�ne critical sensors. In Section 5,we implement our method and evaluate it numerically. In Section 6,we discuss related work. Concluding remarks are presented inSection 7.
2 PRELIMINARIES2.1 Route PlanningLet G = (V ,E) be a directed graph with a setV of vertices and a setE of arcs. Each arc (u,v) ∈ E has an associated nonnegative costc(u,v). The cost (i.e., length) of a path is the sum of the costs of itsarcs. In the point-to-point shortest path problem, one is given asinput the graph G, a query q = (o,d), where o ∈ V is an origin andd ∈ V is a destination, and the objective is to �nd a minimum-cost(i.e., shortest) path from o to d in G. In the many-to-many shortestpath problem, a set of queries Q is given, and the goal is to �nd theminimum-cost path for each query q = (o,d) ∈ Q .
There exist many route planning algorithms that compute op-timal solutions in an e�cient manner [1]. Among these methods,the bidirectional Dijkstra’s algorithm with binary heaps computespoint-to-point shortest path in O(|E | + |V | log |V |). Further, theFloyd-Warshall algorithm solves all pairs shortest paths in O(|V |3).A large number of methods have been designed to improve run-ning time of shortest-path algorithms. For example, contractionhierarchies and arc �ags have been successfully used [3].
2.2 Gaussian Process RegressionGPs provide a Bayesian paradigm to learn an implicit functional re-lationship y = f (x) from a training dataset {(x i ,yi ); i = 1, 2, ...,n},where x i ∈ Rd represents the vector of observed input variables(i.e., predictors), and yi is the observed target value. A comprehen-sive discussion of GPs in machine learning can be found in [13].
GPs directly elicit a prior distribution on the function f (x), andassume it to be a GP a priori,
f (x) ∼ GP(µ(x),k(x ,x ′)
). (1)
For a new point x∗, the goal is to predict y∗ = f (x∗). Given that theregression function is a GP, the distribution of the values of f atany �nite number of points is a multivariate Gaussian distribution.Therefore, (
yy∗
)∼ N
(µ(x),
(K K ′∗K∗ K∗∗
)), (2)
where K is the covariance matrix for the labeled points, K∗ is thecovariance vector between the new point and the labeled points,and K∗∗ is the measurement noise. Then,
Pr(y∗ |y) ∼ N(K∗K−1y,K∗∗ − K∗K−1K ′∗
). (3)
The prediction of a GP model depends on the choice of covariancefunction, which identi�es the expected correlation between theobserved data. Typically, a parametric family of functions is used,and the hyperparameters are inferred from the data. Examples ofthe commonly used covariance functions include polynomial kernel,automatic relevance determination (ARD), and radial basis function(RBF). Methods for learning the hyperparameters are based on
maximization of the marginal likelihood, which can be performedusing gradient-based optimization algorithms.
3 SYSTEM MODELIn this section, we present the system model. We �rst de�ne amodel of transportation network. Then, we construct a detector foridentifying faulty tra�c sensors using a prediction model based onGaussian Processes.
3.1 Transportation NetworkConsider a transportation network modeled as a graph G = (V ,E),where edges represent road segments and vertices represent con-nections between road segments (e.g., tra�c junctions). We assumethat a subset S ⊆ E of the road segments are monitored by sensorsthat measure tra�c state (e.g., speed, occupancy, �ow) at discretetimesteps k ∈ N. The measurements of these sensors are transmit-ted to a navigation service, which given a set of queries Q(k) attimestep k , computes the corresponding shortest paths. For seg-ments without a tra�c sensor, we assume the navigation serviceuses either previously computed values or predicted values usingmeasurements of adjacent sensors.
Tra�c sensors may be faulty due to miscalibration or hardwarefailure. If a sensor s ∈ S is faulty, there is a discrepancy between theactual and measured values. In other words, if as (k) is the actualvalue and ms (k) is the measured value of faulty sensor s , thenms (k) = as (k) + εs (k), where εs (k) is the fault value at time k . Inthis model, we do not consider faults that result in no data beingsent, since such cases can easily be �ltered out by an operator.
3.2 Gaussian Process-Based DetectorGiven the sensor measurements, we need to decide whether somesensors are faulty. We assume that the number of sensors thatsimultaneously become faulty is low, which is true in practice. As aresult, for any sensor, the majority of nearby sensors that have notbeen marked faulty provide reliable tra�c data, and so we can usethese nearby sensors to predict the value measured by the sensorin question. To detect faults, we then compare the predictions tothe measurements, and if there is a signi�cant di�erence betweenthe predicted values and the received measurements, an alarmindicating presence of a fault in that particular sensor is triggered.
3.2.1 Tra�ic Prediction. As our tra�c predictor, we use GPs,which is a kernel-based machine learning method. Kernel-basedmethods have gained special attention for tra�c prediction becauseof their generalization capability and superior nonlinear approxima-tion. Among di�erent kernel-based methods, previous work showsthat GPs outperform other methods such as ARIMA and neuralnetworks [17]. We use GPs because in addition to the above advan-tages, it allows for explicit probabilistic interpretation of forecastingoutputs.
As the kernel function, we decide for the commonly used ARDsquared exponential,
K(m(k),m(k)′) = σ 2f exp(−12
d∑i=1
(mi (k) −m′i (k))2
σ 2i
), (4)

Optimal Detection of Faulty Tra�ic Sensors SCOPE 2017, April 2017, Pi�sburgh, PA USA
where m(k) and m(k)′ are vectors of measurements, and σf and{σi }di=1 are hyperparameters.
We let the target variable be the predicted tra�c value ps (e.g.,tra�c �ow or occupancy) of sensor s ∈ S at timestep k . Further, welet the predictor variables be the measured tra�c values of othersensors at the same timestep. In practice, two sensors are highlycorrelated if they are in close proximity. Therefore, it is possibleto select predictor variables as the measured values of d closestsensors from the target sensor, where the choice ofd depends on thenetwork structure. This way, the predicted tra�c value is de�nedas ps (k) = f (mV (s)(k)), where V (s) is the set of d closest sensorsfrom s .
3.2.2 Detection Algorithm. We can e�ciently detect failuresfor each sensor s ∈ S , by comparing the measured tra�c valuems (k) with the predicted tra�c value ps (k). We use Cumulativesum control chart (CUSUM) as the detection algorithm, which is asequential analysis technique typically used for monitoring changedetection [12].
Consider sensor s ∈ S , with a sequence of measurementsms (1), ...,ms (k) and corresponding tra�c predictions with meansps (1), ...,ps (k) and standard deviations σs (1), ...,σs (k). The stan-dardized residual signal is de�ned as
zs (k) =ms (k) − ps (k)
σs (k). (5)
Moreover, upper and lower cumulative sums are de�ned as,
Us (k) = max(0,Us (k − 1) + zs (k) − bs ), (6)
Ls (k) = min(0,Ls (k − 1) + zs (k) + bs ), (7)where Us (k) = Ls (k) = 0 for k = 1, and bs is a small constant.
Denoting the detection threshold at timestep k by ηs (k), a mea-surement sequence violates the CUSUM criterion at the samplezs (k) if it obeys Us (k) > ηs (k) or Ls (k) < −ηs (k). Formally, lettingH0 and H1 be the null and fault hypothesis, the decision rule isdescribed by
ds (Us (k),Ls (k)) ={
H1 if Us (k) > ηs (k) or Ls (k) < −ηs (k)H0 otherwise .
(8)
3.2.3 False-Negative and False-Positive Trade-o�. In anomaly de-tectors, there might be a false negative, which means failing to raisean alarm when a fault did happen. Further, there might be a falsepositive, which means raising an alarm when the sensor exhibitsnormal behavior. It is desirable to reduce the FP and FN probabili-ties as much as possible. But, there exists a trade-o� between them,which can be controlled by changing the threshold. In particular, bydecreasing (increasing) the threshold, one can decrease (increase)the FN probability and increase (decrease) the FP probability.
We represent the FN probability for each sensor s by the func-tion FNs : R+ → [0, 1], where FNs (ηs (k)) is the probability of FNwhen the threshold is ηs (k), given that the sensor is faulty. Simi-larly, we denote the attainable FP probability for each sensor s byFPs : R+ → [0, 1], where FPs (ηs (k)) is the FP probability when thethreshold is ηs (k), given that the sensor is in normal operation. It ispossible to plot the FP probability as a function of the FN probabilityfor various threshold values [5] (e.g., see Figure 3).
4 OPTIMAL DETECTIONIn this section, we formulate the problem of �nding optimal thresh-olds for anomaly detection of tra�c sensors, considering routeplanning as their primary application. The objective is to selectthe optimal thresholds for anomaly detectors in order to minimizethe losses caused by false positives and false negatives. Then, wepresent an algorithm to �nd near-optimal detection thresholds. Fi-nally, we characterize critical sensors, whose failure can have highimpact on the tra�c application.
4.1 Optimization ProblemFirst, consider the set of queries Q , and a route planning algorithmthat takes as inputs the set of queries and the measured and pre-dicted tra�c values, and outputs the optimal routes. For a singlequery q ∈ Q and sensor s ∈ S , we denote by Pq (ms ) the optimalroute computed using the measured tra�c values for all sensors,and we denote by Pq (ps ) the optimal route using the predictedvalue ps for sensor s and the measured values m−s for all othersensors. Finally, for a given route r and sensor s , let T (r ,ms ) andT (r ,ps ) be the total travel time based on the measured ms andpredicted ps values for sensor s , respectively, and the measuredvaluesm−s for all other sensors.
Then, T(Pq (ps ),ms
)is the measured travel time of the shortest
route computed using the predicted value ps for sensor s . Similarly,T
(Pq (ms ),ms
)is the measured travel time of the shortest route
computed using the measured value ms . We de�ne the loss causedby a false positive as follows:
CFPs,q (ps ,ms ) = T
(Pq (ps ),ms
)−T
(Pq (ms ),ms
), (9)
that is, the di�erence in measured travel time between using eitherthe predicted or the measured value for sensor s .
The rationale behind the above expression is the following. Incase of a FP, according to the detector, the measured value ms isincorrect, but it is actually correct. Consequently, we choose a routethat is computed using our prediction ps instead of the optimalroute, which would be computed using the measurement ms . Toquantify the loss, we need to compare the travel times of the tworoutes, and we must use the measured tra�c value ms for thiscomparison since that is the correct value in this case.
Similarly, for a FN,T(Pq (ms ),ps
)is the predicted travel time of
the shortest route using measured valuems , and T(Pq (ps ),ps
)is
the predicted travel time of the shortest path using predicted valueps . The loss caused by a FN is
CFNs,q (ps ,ms ) = T
(Pq (ms ),ps
)−T
(Pq (ps ),ps
), (10)
that is, the di�erence in predicted travel time between using eitherthe measured or the predicted value for sensor s . Note that in (9)and (10), the values of P and T can be computed using existingroute planning algorithms [1].
Next, let FPs (ηs (k)) and FNs (ηs (k)) be the probabilities of false-positive and false-negative errors when detection threshold ηs (k) isselected. Further, letpf be the probability of fault, and letpn = 1−pfbe the probability of normal operation. For a given query q, thetotal loss caused by FPs and FNs is,
Ls,q (ηs (k)) =FPs (ηs (k)) ·CFPs,q (ps ,ms ) · pn+
FNs (ηs (k)) ·CFNs,q (ps ,ms ) · pf .
(11)
SCOPE 2017, April 2017, Pi�sburgh, PA USA A. Ghafouri et al.
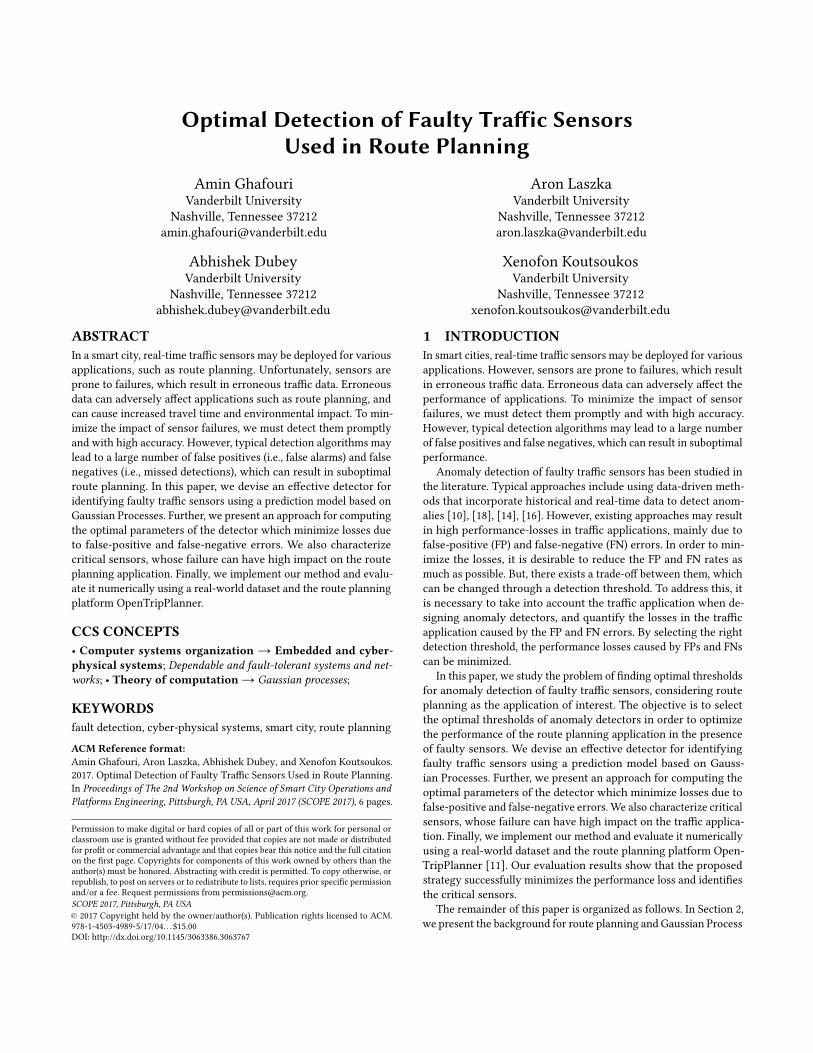
Predictor
Measurements
Algorithm forFinding
Thresholds
Queries
Detector
m(k )
p(k )m(k )
Q (k )
η(k )
Figure 1: Information �ow in our approach.
Considering the set of all queries Q , the total loss is
Ls (ηs (k),Q) =∑q∈Q
Ls,q (ηs (k)), (12)
which allows us to de�ne the notion of optimal detection thresholdfor a sensor.
De�nition 4.1 (Optimal Detection). The detection threshold η∗s (k)is optimal for sensor s if it minimizes the loss function (12). Formally,η∗s (k) is optimal for sensor s if
η∗s (k) ∈ argminηs (k )
Ls (ηs (k),Q). (13)
Figure 1 shows the �ow of information in our approach. At eachtimestep k , given measurementsm(k), the predictor computes thepredicted measurements p(k). Then, given a set of queries Q(k),and the predictions and measurements, the thresholds η(k) arecomputed for the detectors using the algorithm presented next.
4.2 Algorithm for Obtaining ThresholdsWe present Algorithm 1 to �nd near-optimal detection thresholds.The algorithm implements a random-restart hill climbing technique.If the FP to FN trade-o� curve is convex, which makes (12) convex,we are able to compute optimal thresholds using convex optimiza-tion methods. However, this is not generally the case, as trade-o�curves tend to be non-convex (see Figure 3 for an instance of atrade-o� curve).
The algorithm considers each sensor separately, and �nds its cor-responding detection threshold. At each iteration, the algorithm se-lects a new starting point and �nds a local minimum using gradient-based optimization. In order to avoid unnecessary computation, weskip computing detection thresholds for sensors with very similarmeasured and predicted tra�c values. Formally, for sensor s ∈ E,we select detection threshold ηs = ∞, if |zs (k)| < b. This is becausethe detector’s statistics Us (k) and Ls (k) are decreasing and it isunlikely that an alert would be raised if one was not raised before.
4.3 Critical SensorsValue of the optimal loss gives insight on the criticality of tra�csensors. Fault on a sensor that has high loss value degrades thesystem’s performance more than fault on a sensor with low lossvalue. We formally de�ne the set of δ -critical sensors below.
De�nition 4.2 (Critical Sensors). Set of δ -critical sensors in a timeperiod [1,T ] is de�ned as the set of sensors which have the averageoptimal loss values of greater than or equal to δ . That is to say, asensor s is critical if 1
T∑Tk=1 Ls (η
∗s (k),Q(k)) ≥ δ .
Algorithm 1 Algorithm for Obtaining Thresholds
1: Input Q , FP(η), FN (η), α , γ2: Initialize: η ← η0, L∗ ←∞3: for all s ∈ S do4: if |z(k)| ≤ b then5: η∗s ←∞6: else7: while i < N do8: ηs,new ←↩ FP−1s (Uniform([0, 1]))9: ηs,old ← 0
10: while |Ls (ηs,new ,Q) − Ls (ηs,old ,Q)|>α do11: ηs,old ← ηs,new12: ηs,new ← ηs,old − γ∇ηs Ls (ηs,old ,Q)13: if Ls (Q,ηs,new ) < L∗s then14: η∗s ← ηs,new15: L∗s ← Ls (ηs,new ,Q)16: i ← i + 117: return η∗
Identifying critical sensors is bene�cial, since it allows us tolocate the most vulnerable elements of a network, which shouldbe strengthened �rst to increase the robustness of a network. Forexample, if we have a limited budget which permits us to replaceonly a subset of the sensors with more robust ones, then we shouldstart with the critical sensors.
5 EVALUATIONIn this section, we implement our method and evaluate it numeri-cally using a route planning platform.
5.1 System Model5.1.1 Tra�ic Data. We use a tra�c dataset obtained from the
Caltrans Performance Measurement System (PeMS) database [2].The database provides real-time and historical tra�c data from over39,000 individual sensors, which span the freeway system acrossmetropolitan areas of the State of California. Figure 2 shows thelocation of sensors in our case study, in which a total of 40 sensorsare considered. We use the 5-minute aggregated data collected onthe weekdays of September 3, 2016 to September 17, 2016. Thedataset contains 115,200 data points. The �rst 7 days are used astraining data, and the remaining 7 days are used as test data.
To simulate faults, we use models for a speci�c set of fault typesand ranges of fault magnitudes, which is similar to the approach pre-sented in [16]. The fault models are: 1) Constant Relative Overcount(caused by e.g., unsuitable sensitivity levels); range: 3% to 7% of theactual values (i.e., εs (k) = usas (k) where 0.03 ≤ us ≤ 0.07), 2) Con-ditional Undercount (caused by e.g., sensor saturation); range: 7%to 13% (i.e., εs (k) = usas (k) where −0.13 ≤ us ≤ −0.07).
Next, for each sensor, we construct a predictor using the mea-surements of its d closest sensors as the predictor variables. Weselectd = 10 since it results in the minimum overall prediction error.We choose bs = 0.05 for all the detectors, to make them sensitive tosmall shifts in the mean. We evaluate each detector’s performanceby plotting the FP probability against the FN probability at variousthreshold values. Figure 3 shows the trade-o� curve of the detector

Optimal Detection of Faulty Tra�ic Sensors SCOPE 2017, April 2017, Pi�sburgh, PA USA
Figure 2: Amap of tra�c sensors installed in Downtown LosAngeles.
0 0.2 0.4 0.6 0.8 1FN Probability [FN(η)]
0
0.1
0.2
0.3
0.4
0.5
0.6
0.7
0.8
0.9
1
FP
Probab
ility[F
P(η)]
Conditional Undercount
Constant Relative Overcount
Figure 3: Trade-o� between the false-positive and false-negative probabilities.
implemented for a sensor, whose identi�er in the PeMS dataset isVDS 774685.
5.1.2 Route Planner. We use OpenTripPlanner (OTP), whichis an open source platform for multi-modal route planning [11].OTP relies on open data standards including OpenStreetMap forstreet networks. The default routing algorithm in OTP is the A∗
algorithm with a cost-heuristic to prune the search. For improvedperformance on large networks, it also uses contraction hierarchies.
5.2 ResultsWe simulate a route planning scenario in OTP, where the edge costs(i.e., travel times) are updated using our tra�c data. For a source anddestination as shown in Figure 4a, we consider 1000 queries madeon September 15, from 9:00 am to 10:00 am. Figure 4a shows theshortest route when a particular sensor (i.e., VDS 774685) is healthy,and Figure 4b shows the shortest route when the same sensorhas a conditional undercount fault. Note that if the fault remains
(a)
(b)
Figure 4: Reroute occurs due to a conditional undercountfault. (a) Normal. (b) Fault. (Green �ag is the source and red�ag is the destination.)
undetected (i.e., false negative), a suboptimal route (Figure 4b) willbe selected instead of the optimal route (Figure 4a). In anotherscenario, assume an alarm is triggered under normal operation(i.e., false positive). This means that the predicted value is used forroute planning instead of the accurate measurement value, whichdepending on the prediction accuracy, may result in a suboptimalroute planning solution.
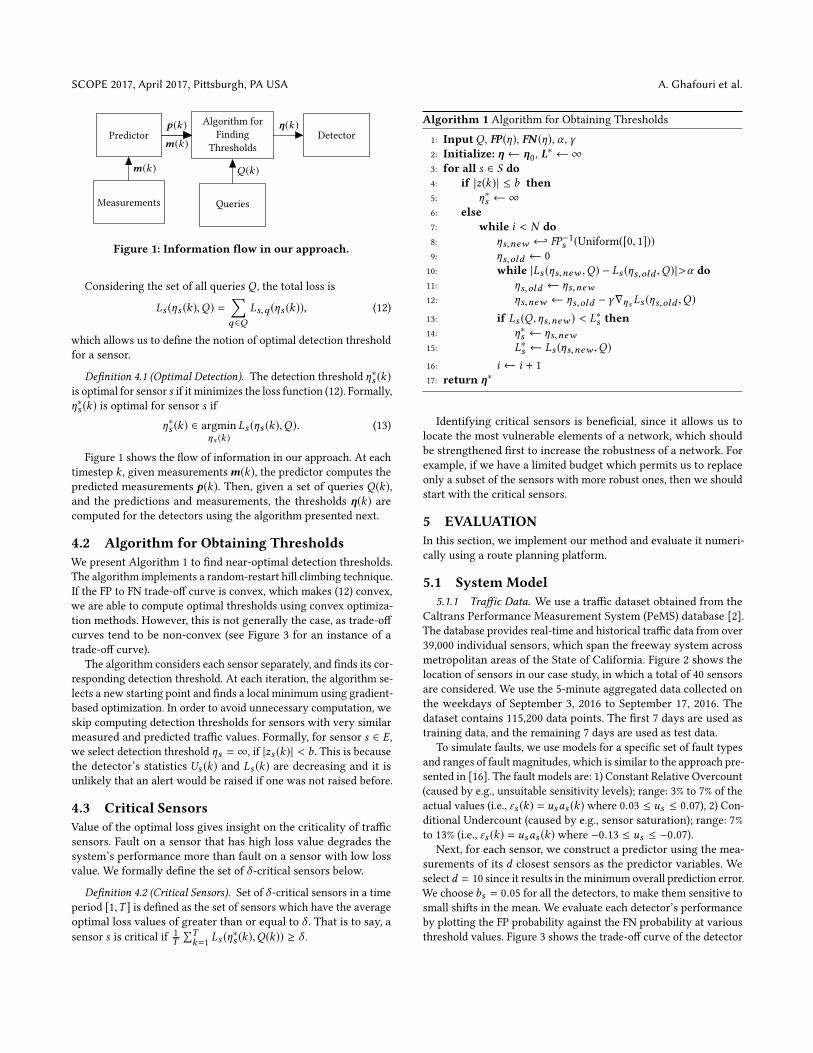
We use Algorithm 1 to �nd near-optimal thresholds that mini-mize losses due to FPs and FNs. We assume that for each sensor,the probability of fault is pf = 0.05. For the previously consideredsensor, at k = 1 (i.e., from 9:00 am to 9:05 am), the loss value (12)as a function of the threshold is shown in Figure 5. In this case,Algorithm 1 �nds the optimal thresholds. For the Conditional Un-dercount, the optimal threshold and the minimum loss are η = 0.17and L = 16.2, whereas for the Constant Relative Overcount, theoptimal threshold and the minimum loss are η = 0.39 and L = 30.0.
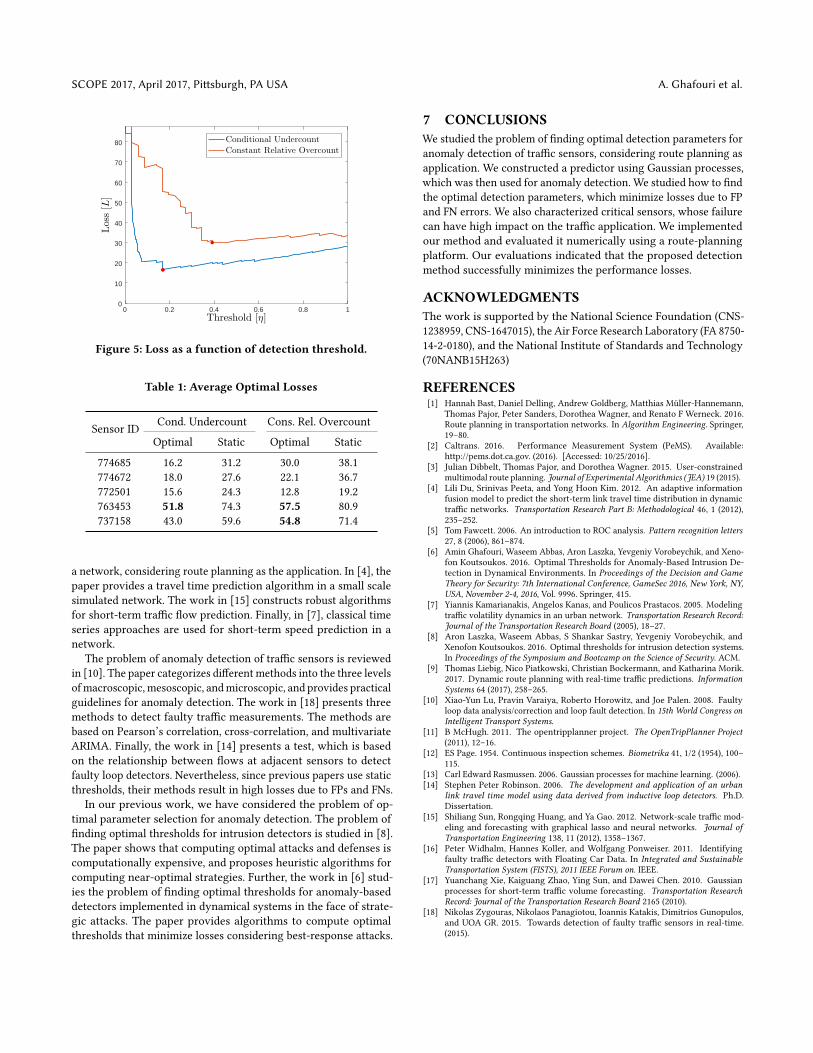
Further, Table 1 shows the average optimal loss for some sen-sors, i.e., 1
T∑Tk=1 Ls (η
∗s (k),Q(k)). As a baseline, we also compute
the minimum loss when the thresholds have static values at allthe timesteps. That is, for all k , we assign ηs (k) = η∗s , whereη∗s ∈ argminηs
∑k Ls (ηs ,Q). We observe that our method achieves
signi�cantly smaller losses compared the static case. The loss val-ues can also be used to identify the set of δ -critical sensors. Forexample, 50.0-critical sensors are made bold in the table.
6 RELATEDWORKThere are many papers that study tra�c prediction. The work in [9]uses multivariate kernel regression models to predict tra�c �ow in
SCOPE 2017, April 2017, Pi�sburgh, PA USA A. Ghafouri et al.
0 0.2 0.4 0.6 0.8 1Threshold [η]
0
10
20
30
40
50
60
70
80
Loss[L]
Conditional Undercount
Constant Relative Overcount
Figure 5: Loss as a function of detection threshold.
Table 1: Average Optimal Losses
Sensor ID Cond. Undercount Cons. Rel. Overcount
Optimal Static Optimal Static
774685 16.2 31.2 30.0 38.1774672 18.0 27.6 22.1 36.7772501 15.6 24.3 12.8 19.2763453 51.8 74.3 57.5 80.9737158 43.0 59.6 54.8 71.4
a network, considering route planning as the application. In [4], thepaper provides a travel time prediction algorithm in a small scalesimulated network. The work in [15] constructs robust algorithmsfor short-term tra�c �ow prediction. Finally, in [7], classical timeseries approaches are used for short-term speed prediction in anetwork.
The problem of anomaly detection of tra�c sensors is reviewedin [10]. The paper categorizes di�erent methods into the three levelsof macroscopic, mesoscopic, and microscopic, and provides practicalguidelines for anomaly detection. The work in [18] presents threemethods to detect faulty tra�c measurements. The methods arebased on Pearson’s correlation, cross-correlation, and multivariateARIMA. Finally, the work in [14] presents a test, which is basedon the relationship between �ows at adjacent sensors to detectfaulty loop detectors. Nevertheless, since previous papers use staticthresholds, their methods result in high losses due to FPs and FNs.
In our previous work, we have considered the problem of op-timal parameter selection for anomaly detection. The problem of�nding optimal thresholds for intrusion detectors is studied in [8].The paper shows that computing optimal attacks and defenses iscomputationally expensive, and proposes heuristic algorithms forcomputing near-optimal strategies. Further, the work in [6] stud-ies the problem of �nding optimal thresholds for anomaly-baseddetectors implemented in dynamical systems in the face of strate-gic attacks. The paper provides algorithms to compute optimalthresholds that minimize losses considering best-response attacks.
7 CONCLUSIONSWe studied the problem of �nding optimal detection parameters foranomaly detection of tra�c sensors, considering route planning asapplication. We constructed a predictor using Gaussian processes,which was then used for anomaly detection. We studied how to �ndthe optimal detection parameters, which minimize losses due to FPand FN errors. We also characterized critical sensors, whose failurecan have high impact on the tra�c application. We implementedour method and evaluated it numerically using a route-planningplatform. Our evaluations indicated that the proposed detectionmethod successfully minimizes the performance losses.
ACKNOWLEDGMENTSThe work is supported by the National Science Foundation (CNS-1238959, CNS-1647015), the Air Force Research Laboratory (FA 8750-14-2-0180), and the National Institute of Standards and Technology(70NANB15H263)
REFERENCES[1] Hannah Bast, Daniel Delling, Andrew Goldberg, Matthias Müller-Hannemann,
Thomas Pajor, Peter Sanders, Dorothea Wagner, and Renato F Werneck. 2016.Route planning in transportation networks. In Algorithm Engineering. Springer,19–80.
[2] Caltrans. 2016. Performance Measurement System (PeMS). Available:http://pems.dot.ca.gov. (2016). [Accessed: 10/25/2016].
[3] Julian Dibbelt, Thomas Pajor, and Dorothea Wagner. 2015. User-constrainedmultimodal route planning. Journal of Experimental Algorithmics (JEA) 19 (2015).
[4] Lili Du, Srinivas Peeta, and Yong Hoon Kim. 2012. An adaptive informationfusion model to predict the short-term link travel time distribution in dynamictra�c networks. Transportation Research Part B: Methodological 46, 1 (2012),235–252.
[5] Tom Fawcett. 2006. An introduction to ROC analysis. Pattern recognition letters27, 8 (2006), 861–874.
[6] Amin Ghafouri, Waseem Abbas, Aron Laszka, Yevgeniy Vorobeychik, and Xeno-fon Koutsoukos. 2016. Optimal Thresholds for Anomaly-Based Intrusion De-tection in Dynamical Environments. In Proceedings of the Decision and GameTheory for Security: 7th International Conference, GameSec 2016, New York, NY,USA, November 2-4, 2016, Vol. 9996. Springer, 415.
[7] Yiannis Kamarianakis, Angelos Kanas, and Poulicos Prastacos. 2005. Modelingtra�c volatility dynamics in an urban network. Transportation Research Record:Journal of the Transportation Research Board (2005), 18–27.
[8] Aron Laszka, Waseem Abbas, S Shankar Sastry, Yevgeniy Vorobeychik, andXenofon Koutsoukos. 2016. Optimal thresholds for intrusion detection systems.In Proceedings of the Symposium and Bootcamp on the Science of Security. ACM.
[9] Thomas Liebig, Nico Piatkowski, Christian Bockermann, and Katharina Morik.2017. Dynamic route planning with real-time tra�c predictions. InformationSystems 64 (2017), 258–265.
[10] Xiao-Yun Lu, Pravin Varaiya, Roberto Horowitz, and Joe Palen. 2008. Faultyloop data analysis/correction and loop fault detection. In 15th World Congress onIntelligent Transport Systems.
[11] B McHugh. 2011. The opentripplanner project. The OpenTripPlanner Project(2011), 12–16.
[12] ES Page. 1954. Continuous inspection schemes. Biometrika 41, 1/2 (1954), 100–115.
[13] Carl Edward Rasmussen. 2006. Gaussian processes for machine learning. (2006).[14] Stephen Peter Robinson. 2006. The development and application of an urban
link travel time model using data derived from inductive loop detectors. Ph.D.Dissertation.
[15] Shiliang Sun, Rongqing Huang, and Ya Gao. 2012. Network-scale tra�c mod-eling and forecasting with graphical lasso and neural networks. Journal ofTransportation Engineering 138, 11 (2012), 1358–1367.
[16] Peter Widhalm, Hannes Koller, and Wolfgang Ponweiser. 2011. Identifyingfaulty tra�c detectors with Floating Car Data. In Integrated and SustainableTransportation System (FISTS), 2011 IEEE Forum on. IEEE.
[17] Yuanchang Xie, Kaiguang Zhao, Ying Sun, and Dawei Chen. 2010. Gaussianprocesses for short-term tra�c volume forecasting. Transportation ResearchRecord: Journal of the Transportation Research Board 2165 (2010).
[18] Nikolas Zygouras, Nikolaos Panagiotou, Ioannis Katakis, Dimitrios Gunopulos,and UOA GR. 2015. Towards detection of faulty tra�c sensors in real-time.(2015).