opportunities and challenges for microinsurance in kenya workshop... · structure of presentation...
TRANSCRIPT
Opportunities and challenges for microinsurance in Kenya
Stakeholder Workshop
Nairobi, 20 May 2010
Structure of presentation
1. Introduction
2. Country context
3. Regulatory analysis
4. Financial sector context (Banks, SACCOs and MFIs)
5. Insurance industry overview
6. Demand-side insights
7. Conclusions and opportunities
About Cenfri
Cenfri
Non-profit research centre based in Cape Town and established with support of Finmark Trust
Support financial sector development and financial inclusion
Manages FMT research on microinsurance and retail payment systems across Africa
Global experience with microinsurance (MI)
Involved in developing new MI regulatory framework in SA (since 2003)
More information at: www.cenfri.org
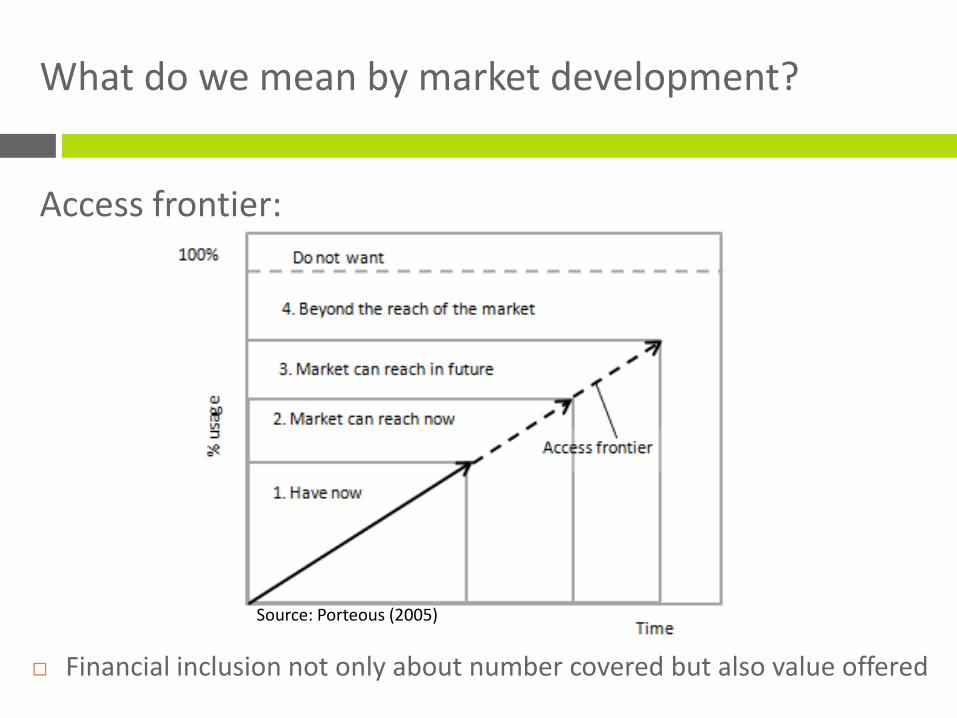
What do we mean by market development?
Access frontier:
Financial inclusion not only about number covered but also value offered
Source: Porteous (2005)

Microinsurance is a global issue
Mexico
Colombia
Peru
Brazil
South Africa
Kenya
India
Philippines
Ghana
Uganda
Zambia
Cambodia
Mongolia
Egypt
Venezuela
Bolivia
China
Namibia
Ethiopia
…but the story is different for each country
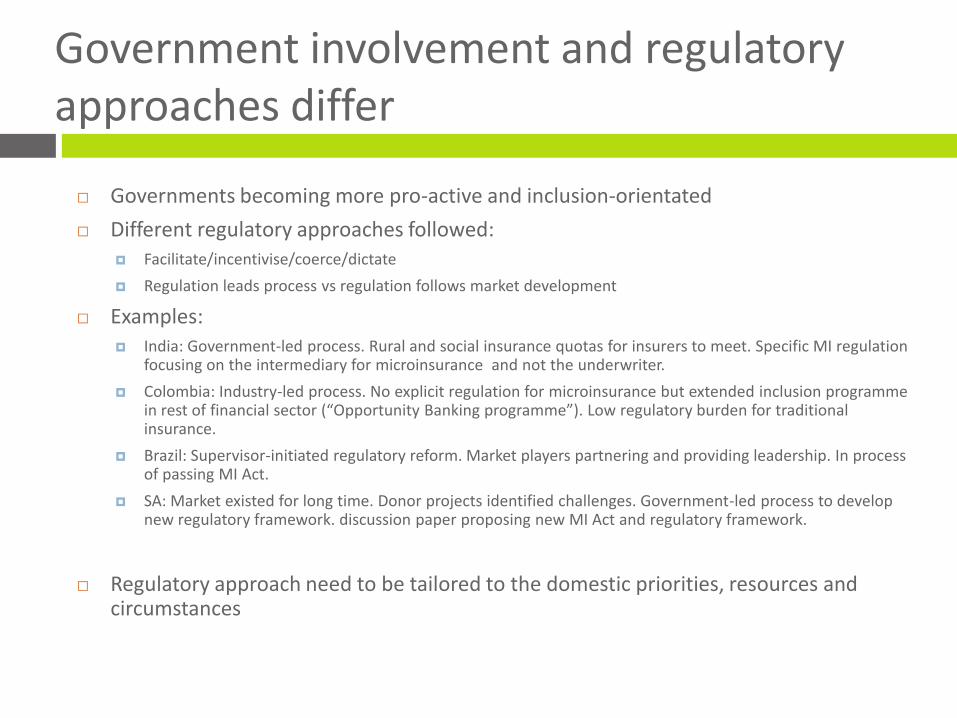
Governments becoming more pro-active and inclusion-orientated
Different regulatory approaches followed: Facilitate/incentivise/coerce/dictate
Regulation leads process vs regulation follows market development
Examples: India: Government-led process. Rural and social insurance quotas for insurers to meet. Specific MI regulation
focusing on the intermediary for microinsurance and not the underwriter.
Colombia: Industry-led process. No explicit regulation for microinsurance but extended inclusion programme in rest of financial sector (“Opportunity Banking programme”). Low regulatory burden for traditional insurance.
Brazil: Supervisor-initiated regulatory reform. Market players partnering and providing leadership. In process of passing MI Act.
SA: Market existed for long time. Donor projects identified challenges. Government-led process to develop new regulatory framework. discussion paper proposing new MI Act and regulatory framework.
Regulatory approach need to be tailored to the domestic priorities, resources and circumstances
Government involvement and regulatory approaches differ
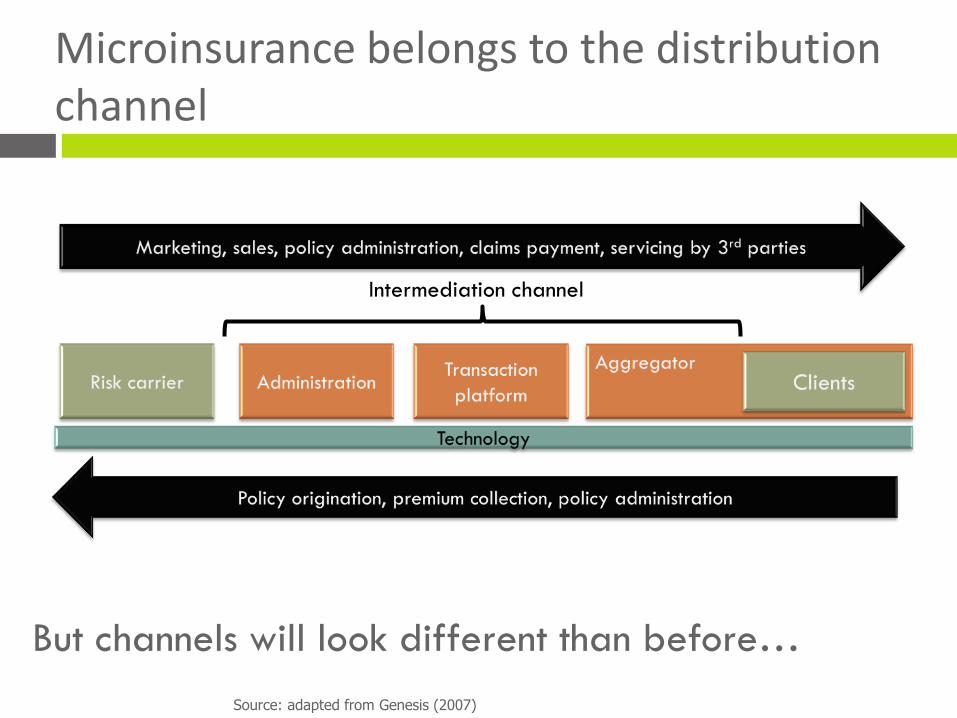
Microinsurance belongs to the distribution channel
Source: adapted from Genesis (2007)
Intermediation channel
But channels will look different than before…
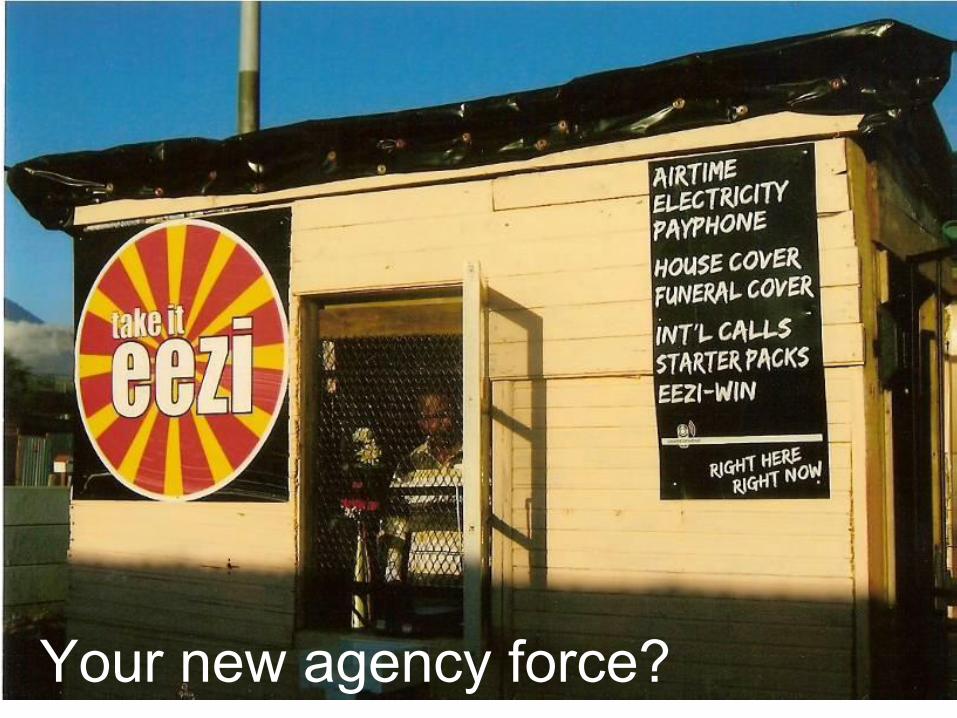
Typical featuresYour new agency force?
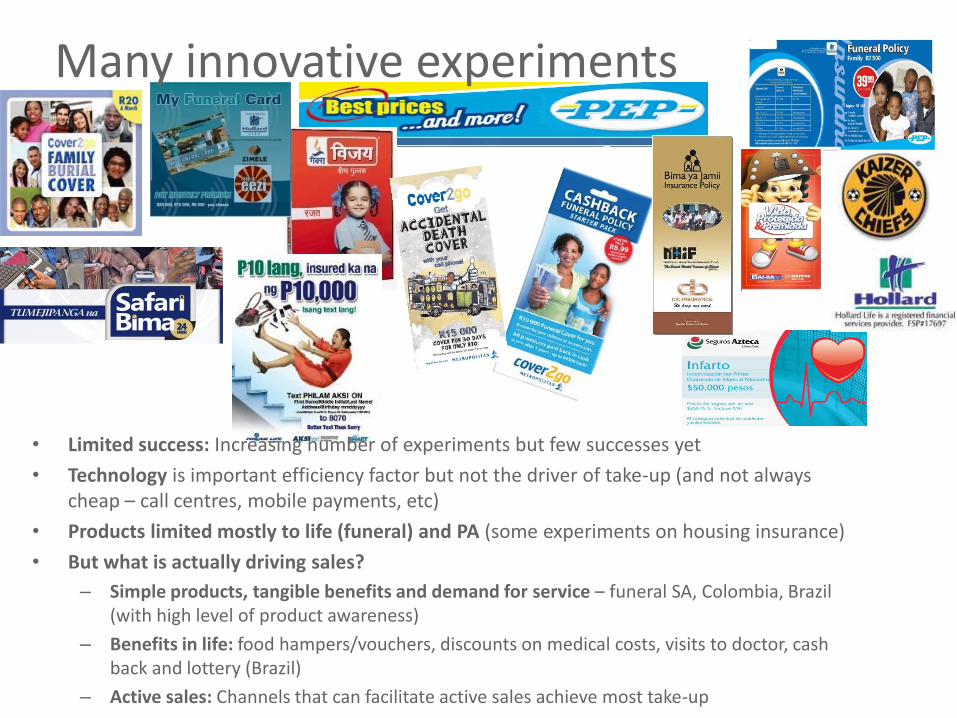
Many innovative experiments
• Limited success: Increasing number of experiments but few successes yet
• Technology is important efficiency factor but not the driver of take-up (and not always cheap – call centres, mobile payments, etc)
• Products limited mostly to life (funeral) and PA (some experiments on housing insurance)
• But what is actually driving sales?
– Simple products, tangible benefits and demand for service – funeral SA, Colombia, Brazil (with high level of product awareness)
– Benefits in life: food hampers/vouchers, discounts on medical costs, visits to doctor, cash back and lottery (Brazil)
– Active sales: Channels that can facilitate active sales achieve most take-up

Funeral insurance is dominant voluntary product
Often informal
Consumer credit insurance is large but many challenges
ST group/nature:
MI can be defined as low risk
Use of open group schemes
Contractual relationships
Key MI product trends
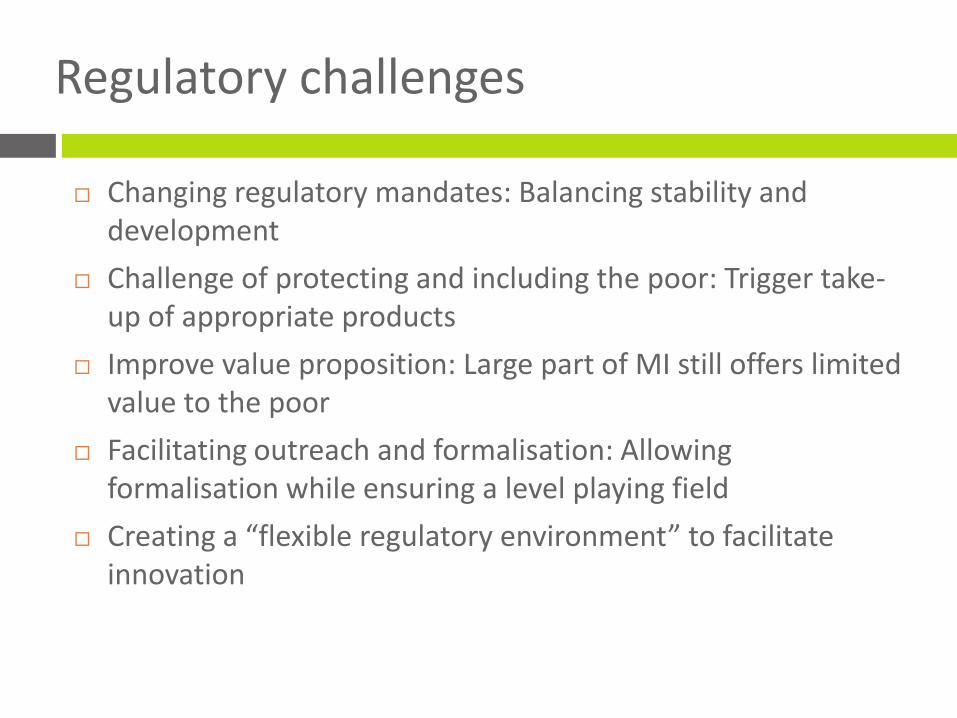
Changing regulatory mandates: Balancing stability and development
Challenge of protecting and including the poor: Trigger take-up of appropriate products
Improve value proposition: Large part of MI still offers limited value to the poor
Facilitating outreach and formalisation: Allowing formalisation while ensuring a level playing field
Creating a “flexible regulatory environment” to facilitate innovation
Regulatory challenges
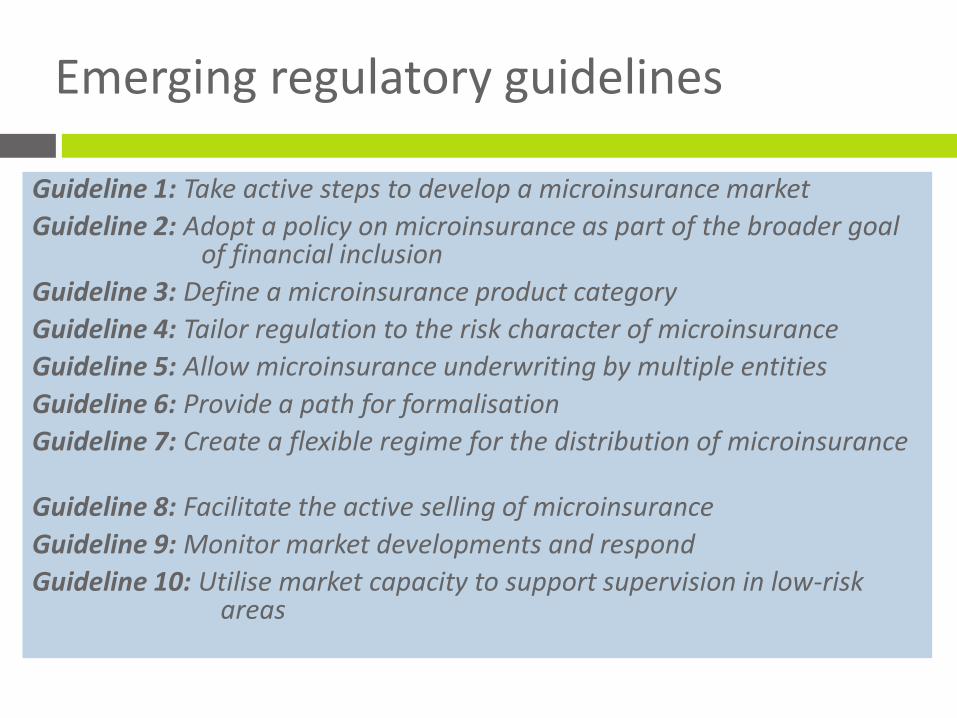
Guideline 1: Take active steps to develop a microinsurance market
Guideline 2: Adopt a policy on microinsurance as part of the broader goal of financial inclusion
Guideline 3: Define a microinsurance product category
Guideline 4: Tailor regulation to the risk character of microinsurance
Guideline 5: Allow microinsurance underwriting by multiple entities
Guideline 6: Provide a path for formalisation
Guideline 7: Create a flexible regime for the distribution of microinsurance
Guideline 8: Facilitate the active selling of microinsurance
Guideline 9: Monitor market developments and respond
Guideline 10: Utilise market capacity to support supervision in low-risk areas
Emerging regulatory guidelines
2. Country context
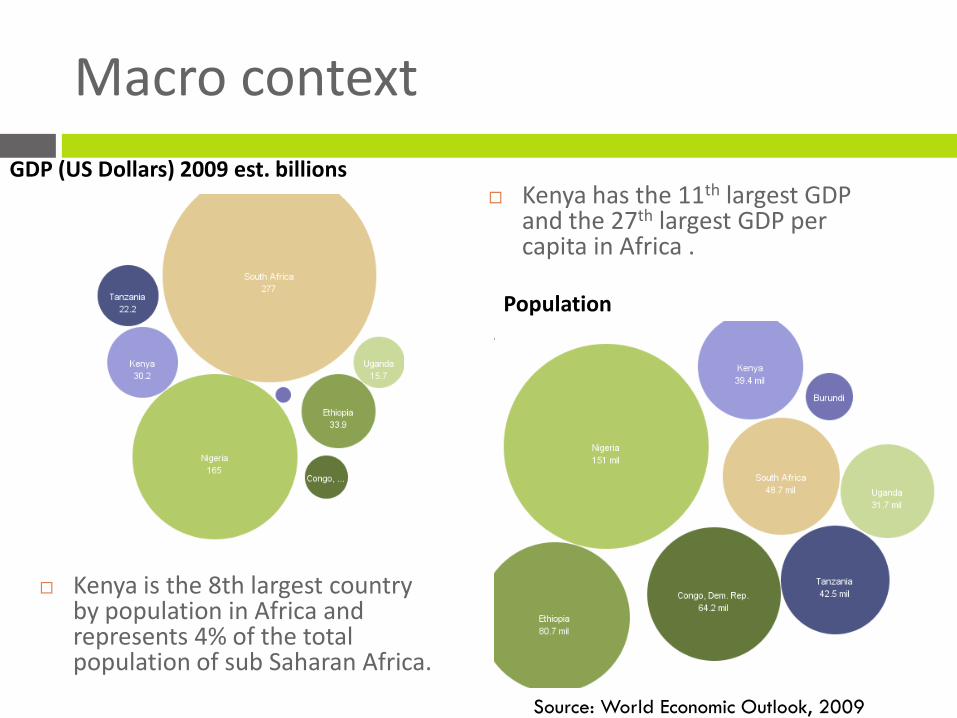
Macro context
Kenya has the 11th largest GDP and the 27th largest GDP per capita in Africa .
Kenya is the 8th largest country by population in Africa and represents 4% of the total population of sub Saharan Africa.
GDP (US Dollars) 2009 est. billions
Population
Source: World Economic Outlook, 2009
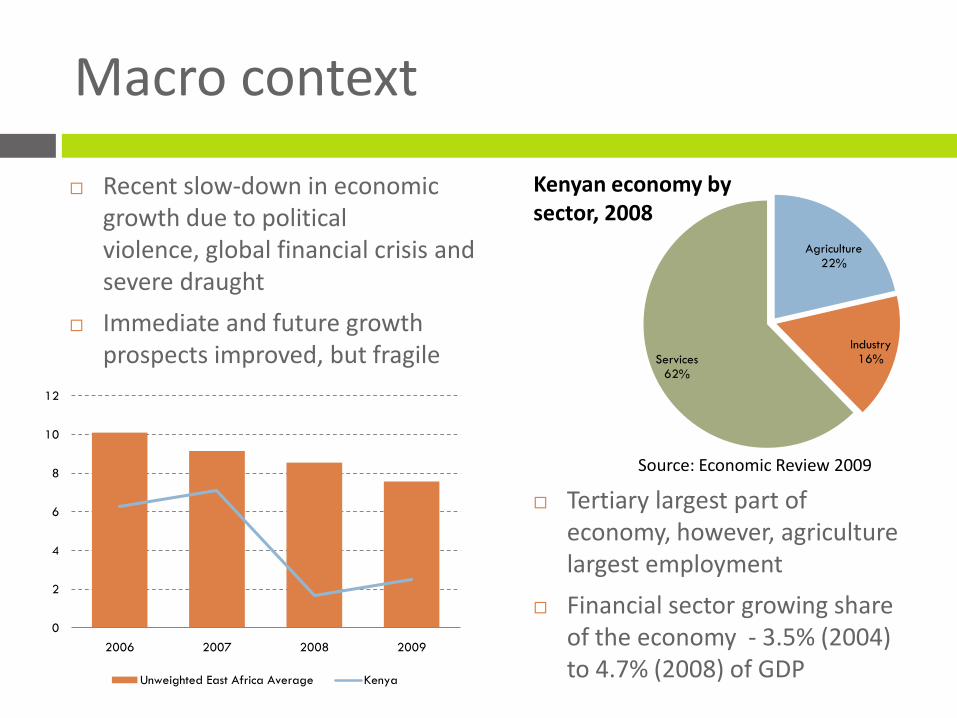
Macro context
Recent slow-down in economic growth due to political violence, global financial crisis and severe draught
Immediate and future growth prospects improved, but fragile
Agriculture22%
Industry16%Services
62%
Kenyan economy by sector, 2008
Source: Economic Review 2009
0
2
4
6
8
10
12
2006 2007 2008 2009
Unweighted East Africa Average Kenya
Tertiary largest part of economy, however, agriculture largest employment
Financial sector growing share of the economy - 3.5% (2004) to 4.7% (2008) of GDP
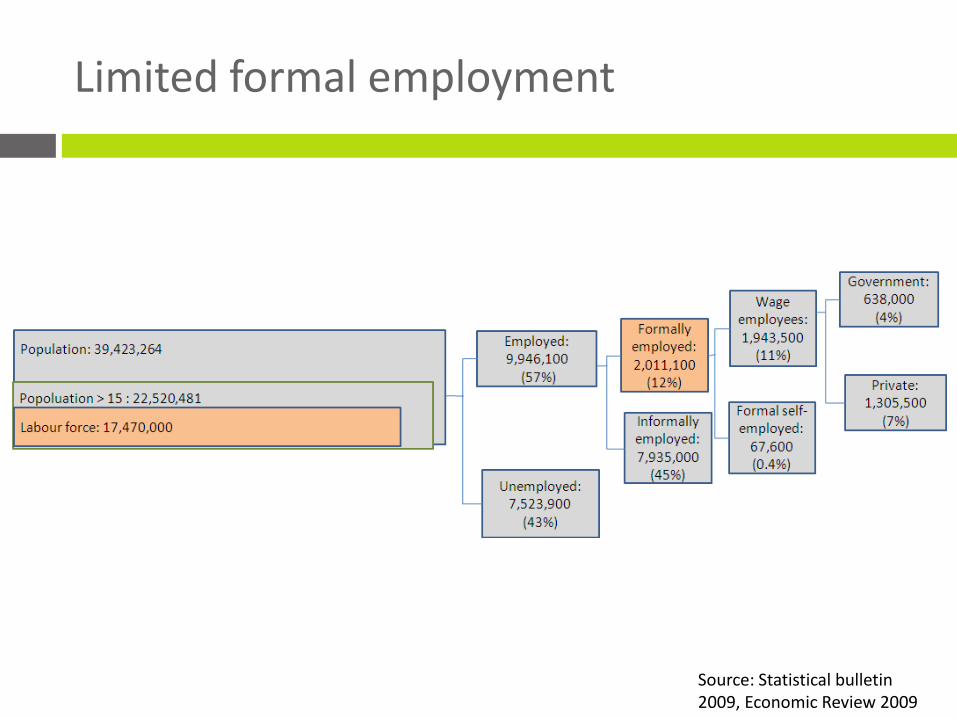
Limited formal employment
Source: Statistical bulletin 2009, Economic Review 2009

Income distribution overview
0
5
10
15
20
25
% o
f in
div
iduals
$1.25/day:19.72% $2 /day:
39.25%
$5 /day:
82%
$1.25/day:19.72% $2 /day:
39.25%
$5 /day:
82%
Income
Too
po
or?
Insu
red
Potential:
Microinsurance market
Note: Dollar values are calculated using PPP exchange
rates
Source: FinAccess, 2009, PovCalNet 2005
Majority of population, typical microinsurance target market
USD 2 – USD 5 (PPP): 17 million individuals, 9.6 million adults

Agricultural context
Agriculture key contributor to the economy, but exposed to negative shocks
Agriculture contributes 26.0% to GDP, and 45% of government revenue in 2009
Sector accounts for 60% of export earnings: (Ministry of Finance, 2010)
Horticulture (31%) and tea (31%) greatest GDP contributors in 2008 (Kenya Statistical Abstract, 2009)
Sector has suffered severe negative shocks (political violence, drought, increased input prices, recession)
Agriculture a major source of income for hhs.
Over 36% of adults derive main income from food crops (sweet potatoes, maize, cassava, beans) (FinAccess2009)
Almost 20% derive main income from livestock output , with 15% deriving main income from livestock sales (FinAccess 2009)
Source of income within agricultural sector in
the last 12 months
Source: FinAccess, 2009
6.86
18.62
6.943.5
0.56
7.75
44.23

Agricultural context
Smallholder farmers dominate sector Limited data on land and cattle distribution (no
agricultural survey or census available)
But evidence that smallholder farmers play an important role within the sector
Smallholder farmers face the most exposure to risks due: limited access to resources, majority of farm on acre or less of land
Agriculture cooperatives provide potential distribution network: Large number of co-operatives with some
organized according to specific industries.
However, not clear how well networked
Source: (Mbithi, 2009), (Meridian, 2010), (East African
Dairy Development, 2008), (Mitiambo, 2010)
Source: Kenya Statistical Abstract, 2009
Crop Small holder population as a percentage of total group
Smallholder contribution to total production
Tea 62%
Horticulture 80% 5-13%
Maize 75%Dairy 99% 70-80%
Societies No of co-operative societies
No of members
Coffee 549 672,000
Dairy 264 306,000
Multi purpose 1,923 130,000
Other agricultural 1243 121,000
Total 3,979 1,229,000
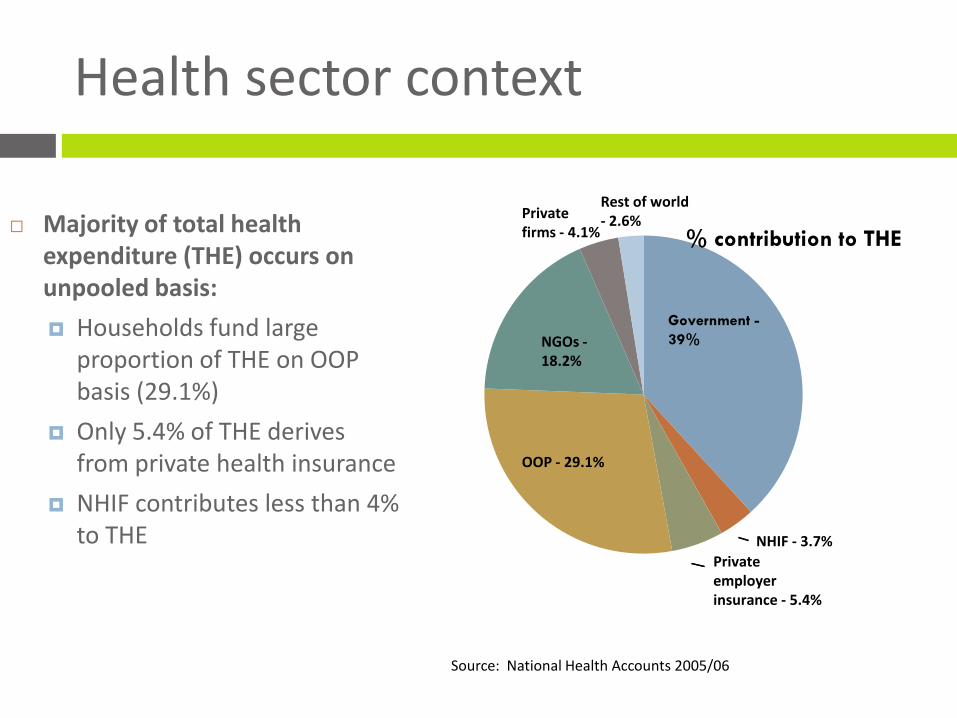
Health sector context
Majority of total health expenditure (THE) occurs on unpooled basis:
Households fund large proportion of THE on OOP basis (29.1%)
Only 5.4% of THE derives from private health insurance
NHIF contributes less than 4% to THE
Source: National Health Accounts 2005/06
% contribution to THE
Government -
39%
OOP - 29.1%
Privateemployer insurance - 5.4%
NHIF - 3.7%
NGOs -18.2%
Rest of world- 2.6%Private
firms - 4.1%

Health sector context
NHIF covers more than 2.5m lives for hospitalisation costs:
Experimentation with out-patient services cover
Country faces choice more comprehensive insurance mechanism (expanded SHI/NHI) or more comprehensive direct tax funded health system (NHS)
Health financing strategy principles in place, but final decision needs to be made
4 categories of health “insurance” providers:
14 general insurance companies providing health insurance
Private hospitals offering insurance plans
Medical insurance providers (MIPs) carrying health risks illegally
Third-party managed funds being moved into insurance industry
Insurance industry faces number of challenges in delivering health insurance:
Intermediation commission viewed as increasing health insurance costs unnecessarily
High administration costs resulting in low profits
Absence of efficient MIS
Financing mainly happening on fee-for service basis with capitation approached on experimental basis – industry has not yet dealt effectively with risk sharing (and regulation of this)
3. Regulatory analysis
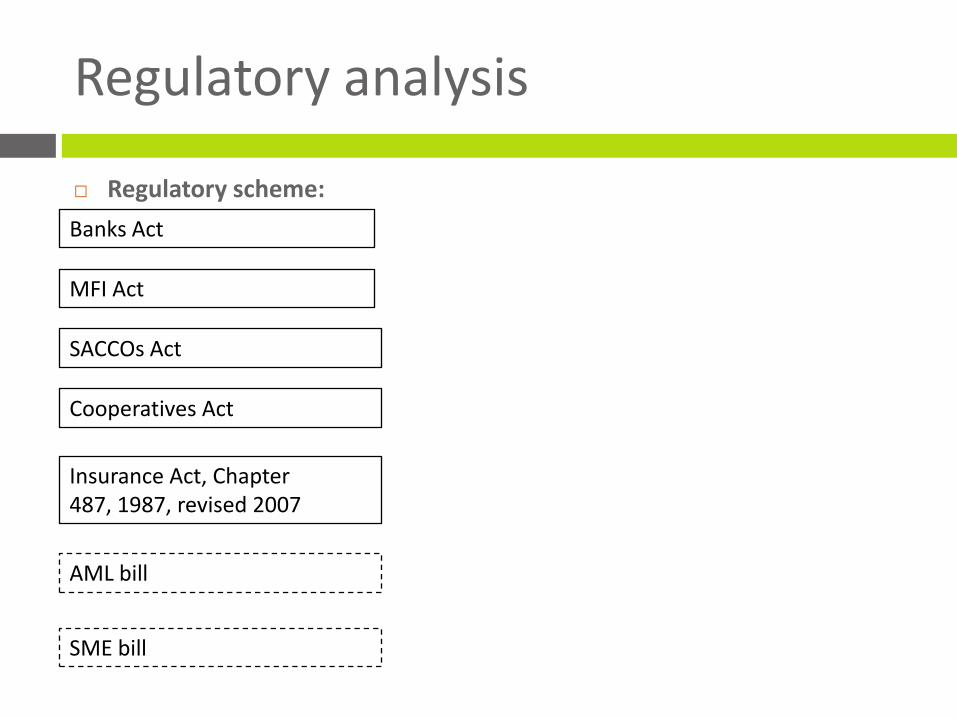
Regulatory analysis
Regulatory scheme:
MFI Act
Banks Act
SACCOs Act
Insurance Act, Chapter 487, 1987, revised 2007
Cooperatives Act
AML bill
SME bill
Regulatory analysis
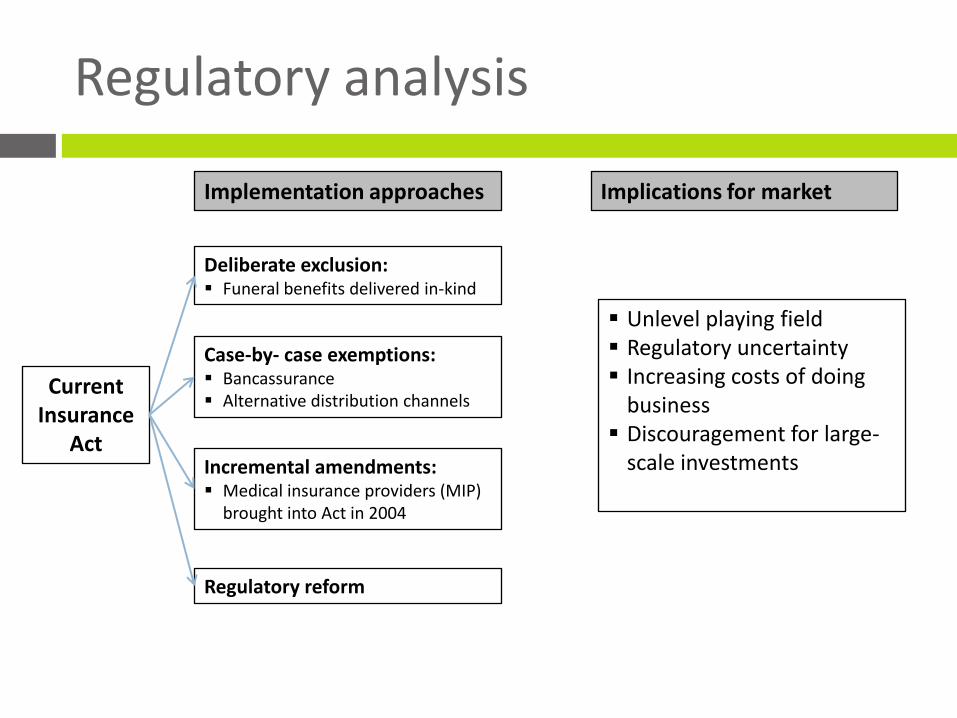
Current Insurance
Act
Implementation approaches Implications for market
Unlevel playing field Regulatory uncertainty Increasing costs of doing
business Discouragement for large-
scale investments
Deliberate exclusion: Funeral benefits delivered in-kind
Case-by- case exemptions: Bancassurance Alternative distribution channels
Incremental amendments: Medical insurance providers (MIP)
brought into Act in 2004
Regulatory reform
Regulatory analysis
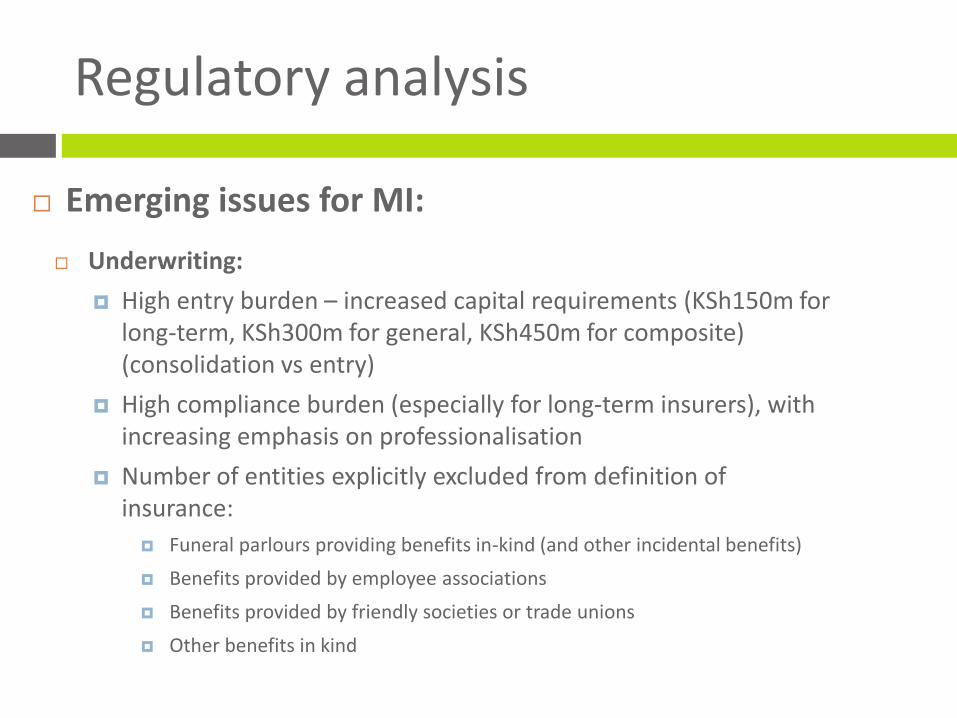
Emerging issues for MI:
Underwriting:
High entry burden – increased capital requirements (KSh150m for long-term, KSh300m for general, KSh450m for composite) (consolidation vs entry)
High compliance burden (especially for long-term insurers), with increasing emphasis on professionalisation
Number of entities explicitly excluded from definition of insurance:
Funeral parlours providing benefits in-kind (and other incidental benefits)
Benefits provided by employee associations
Benefits provided by friendly societies or trade unions
Other benefits in kind
Regulatory analysis
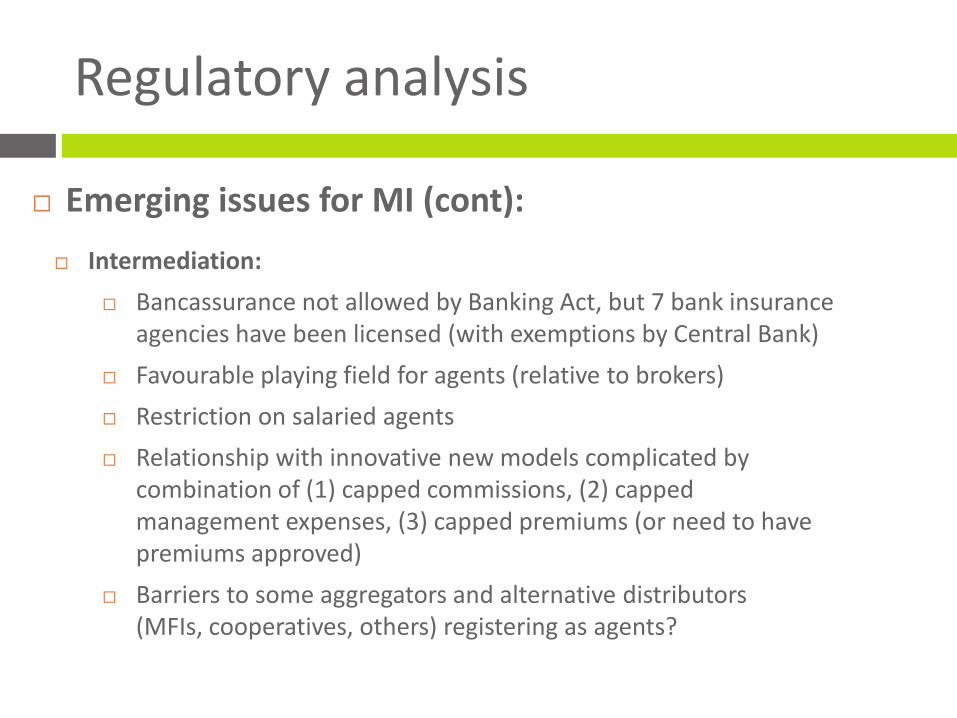
Emerging issues for MI (cont):
Intermediation:
Bancassurance not allowed by Banking Act, but 7 bank insurance agencies have been licensed (with exemptions by Central Bank)
Favourable playing field for agents (relative to brokers)
Restriction on salaried agents
Relationship with innovative new models complicated by combination of (1) capped commissions, (2) capped management expenses, (3) capped premiums (or need to have premiums approved)
Barriers to some aggregators and alternative distributors (MFIs, cooperatives, others) registering as agents?

Regulatory analysis
Emerging issues for MI (cont):
Consumer protection:
Limited market conduct regulation focusing only on entry requirements for brokers and agents
Regulation biases in favour of agents, with lighter touch on entry requirements for agents
Policyholder protection fund to provide pay-outs of up to KSh100,000 if insurance company goes bankrupt
Internal complaints desk at IRA
Regulatory requirement for clear wording, but negligible fine if this is not adhered to (S. 180)
Misleading advertisements fined, but fine is negligible (S.164)
Regulatory analysis
Emerging issues for MI (cont):
Traces of MI (tiered) approach in Act:
Industrial life policies defined in Act:
Shorter term (premiums must be paid at least every two months), premiums paid in cash and collected by agents
Grace period for non-payment of industrial life
Special low cost/ faster dispute resolution process for claims on life policies with value <KSH 100,000 – disputes settled by Commissioner without reference to any court
Highest management expense caps for industrial life
4. Financial sector context
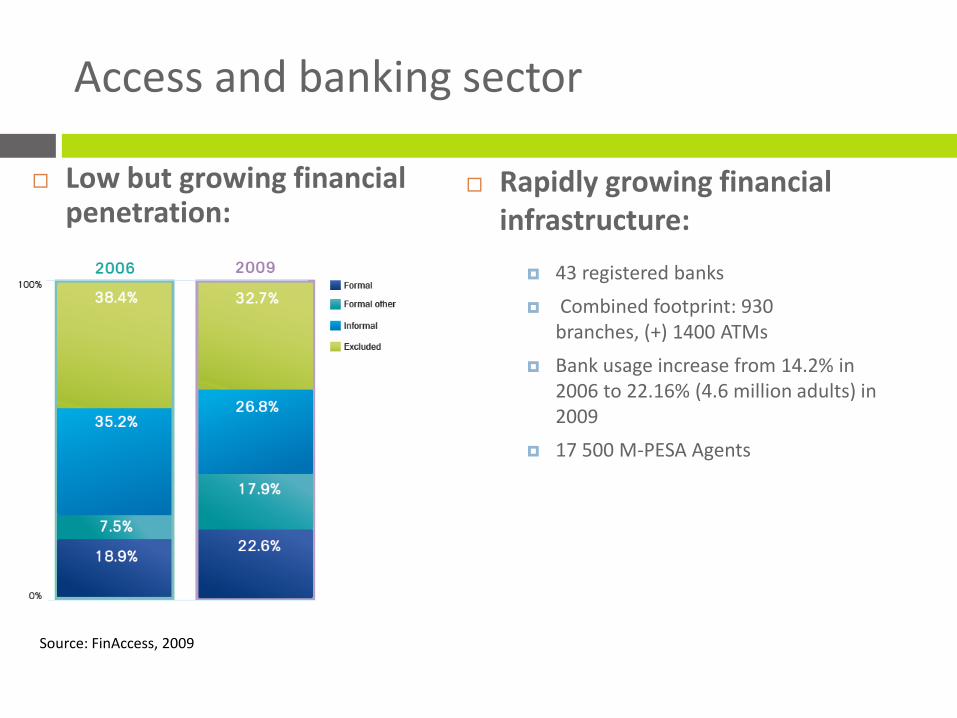
Access and banking sector
Rapidly growing financial infrastructure:
Low but growing financial penetration:
43 registered banks
Combined footprint: 930 branches, (+) 1400 ATMs
Bank usage increase from 14.2% in 2006 to 22.16% (4.6 million adults) in 2009
17 500 M-PESA Agents
Source: FinAccess, 2009
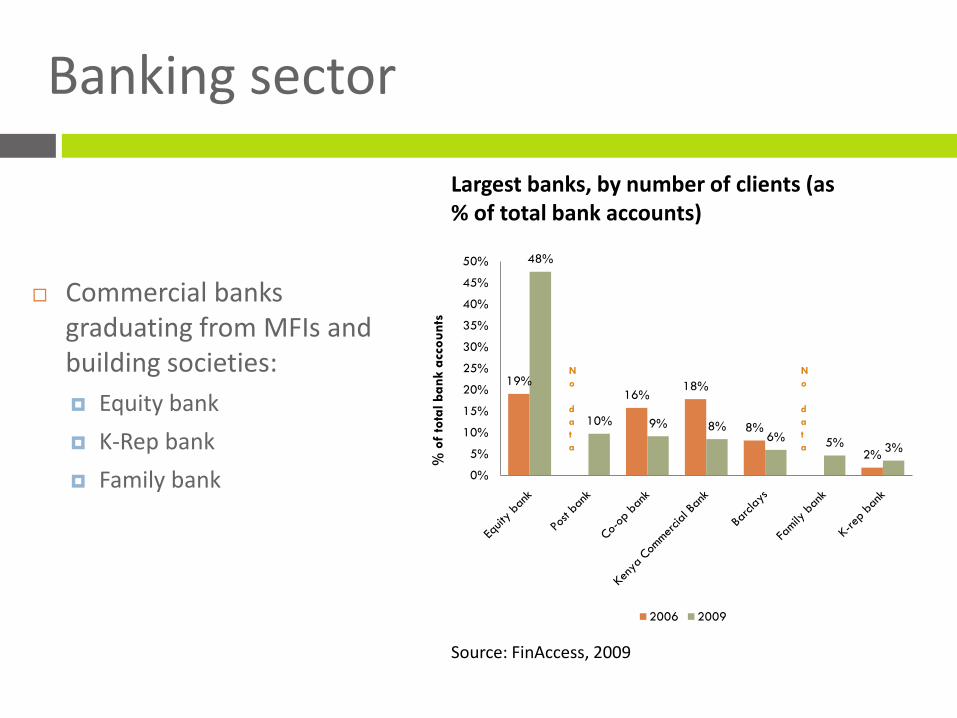
Banking sector
Commercial banks graduating from MFIs and building societies:
Equity bank
K-Rep bank
Family bank
Source: FinAccess, 2009
Largest banks, by number of clients (as % of total bank accounts)
19%16%
18%
8%
2%
48%
10% 9% 8%6% 5% 3%
0%
5%
10%
15%
20%
25%
30%
35%
40%
45%
50%
2006 2009
N
o
d
a
t
a
N
o
d
a
t
a%
of
tota
l ba
nk a
ccou
nts
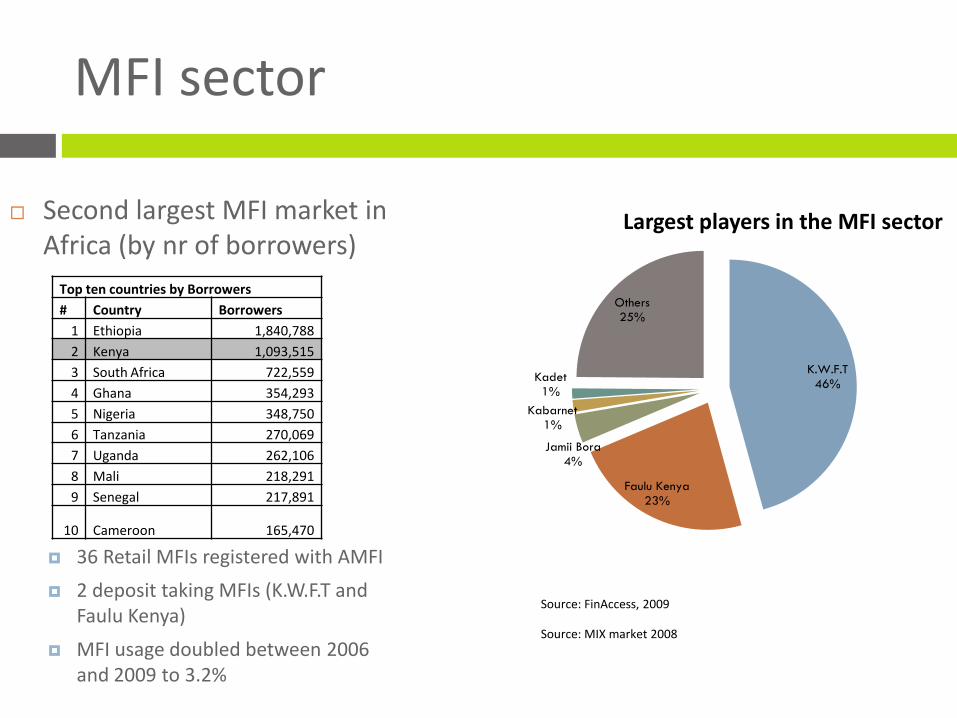
MFI sector
Top ten countries by Borrowers
# Country Borrowers
1 Ethiopia 1,840,788
2 Kenya 1,093,515
3 South Africa 722,559
4 Ghana 354,293
5 Nigeria 348,750
6 Tanzania 270,069
7 Uganda 262,106
8 Mali 218,291
9 Senegal 217,891
10 Cameroon 165,470
Second largest MFI market in Africa (by nr of borrowers)
36 Retail MFIs registered with AMFI
2 deposit taking MFIs (K.W.F.T and Faulu Kenya)
MFI usage doubled between 2006 and 2009 to 3.2%
K.W.F.T46%
Faulu Kenya
23%
Jamii Bora4%
Kabarnet1%
Kadet1%
Others25%
Source: FinAccess, 2009
Source: MIX market 2008
Largest players in the MFI sector

Co-operative sector
Kenyan Co-operative movement largest in Africa and 7th largest in World (CAK, 2010)
Co-operative sector operates in 4 tiers:
1) Apex body (CAK)
2) National Co-operative Organizations (CIC, Co-operative Bank etc.,),
3)Secondary co-operative societies
4) Primary co-operative societies, 12,000, of which SACCOs make up an estimated 48%.
Of which: 300 SACCOs offer Front Office Services Activities (FASO) –services include cheque and salary deposits, bill payments, cheque cards and ATM services.
Co-ops contributing to increasing financial sector footprint
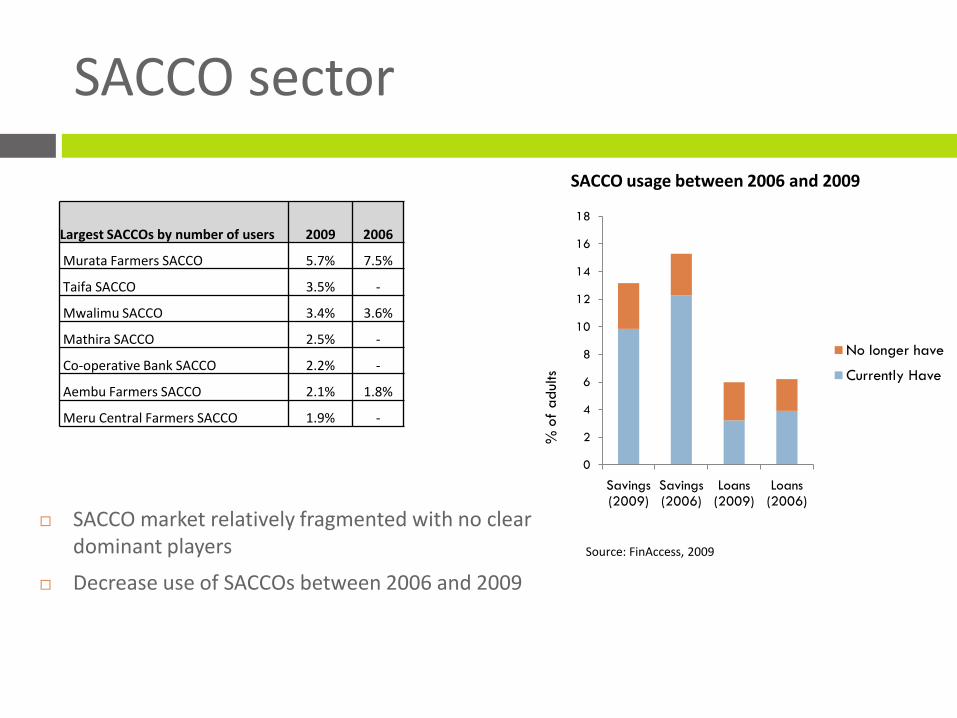
SACCO sector
SACCO market relatively fragmented with no clear dominant players
Decrease use of SACCOs between 2006 and 2009
% o
f adul
ts
Largest SACCOs by number of users 2009 2006
Murata Farmers SACCO 5.7% 7.5%
Taifa SACCO 3.5% -
Mwalimu SACCO 3.4% 3.6%
Mathira SACCO 2.5% -
Co-operative Bank SACCO 2.2% -
Aembu Farmers SACCO 2.1% 1.8%
Meru Central Farmers SACCO 1.9% -
0
2
4
6
8
10
12
14
16
18
Savings (2009)
Savings (2006)
Loans (2009)
Loans (2006)
No longer have
Currently Have
Source: FinAccess, 2009
SACCO usage between 2006 and 2009

Client profile
Source: FinAccess, 2009
Limited MFI additionality
Banking channel largest aggregator
MFIs provide unique access to 1.1% and SACCOs 4.4% of adults
Banks penetrate younger market
Banks usage skewed to younger, 18 – 29 year old market
MFI usage concentrated in the 35 –44 year old brackets
SACCO usage skewed towards middle and older age brackets
0% 10% 20% 30% 40%
16-17
18-24
25-29
30-34
35-39
40-44
45-49
50-54
55-59
60-64
65+
% share of SACCO users % share of Bank users % share of MFI users

Client profile
MFI not catering to the lowest income bracket (< Ksh 1,000)
Banks have made significant in-roads into the low-income market
SACCO usage skewed towards lower income users
0
2
4
6
8
10
12
14
16
18
20
% o
f in
div
iduals
'000 KSHS% of adult population
14.69%
23.4%
47.89%
48.6%
45.9%
30.7%
26.9%
2.35% - MFI
6.04% - Bank
3.70% -
SACCO
34.27%15.49%
Source: FinAccess, 2009
Ksh 6.5K Ksh 22.5K Ksh 100K
5. Insurance sector overview

Market size
Insurance penetration (% of GDP)
Limited insurance penetration, but in line with peers
Total insurance: Ksh55 billion (2.63% of GDP)
General: Ksh 35 billion (1.7% of GDP)
Long term: Ksh 20 billion (0.9% of GDP)
Number Registered
2006 2007 2008
Insurance companies
Long term 7 7 7
General 20 19 19
Composite 17 17 17
Reinsurance 2 2 2
Insurance intermediaries
Insurance brokers 201 190 149Medical insurance providers 21 24 21
Insurance Agents 2665 3085 3355
Source: IRA 2006, 2007 & 2008
Growth in line with GDP growth
Slight increase in penetration driven by life (pension related categories)
Increase in agents, decrease in brokers:
Corresponds to changes in regulation

Market players
Largest general insurers by gross premiums, 2008
18%
15%13%
12%
9%
6% 5% 5%3%
2%
Largest life insurers by gross premiums, 2008
Source: IRA, 2008
% s
har
e o
f gr
oss
pre
miu
ms
No dominant market player in overall general/life
Concentration at life product line
Largest insurers showing interest in MI
8.3%7.8% 7.6%
6.7%
5.7%
4.7%4.2%
3.8% 3.6% 3.5%
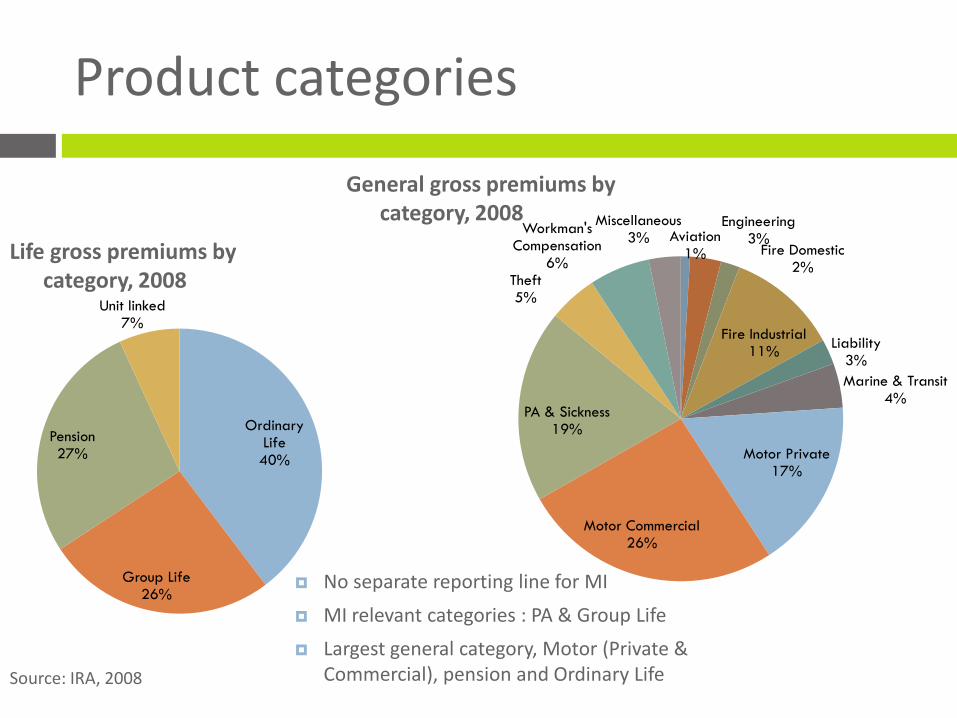
Product categories
Aviation1%
Engineering3%
Fire Domestic2%
Fire Industrial11%
Liability3%
Marine & Transit4%
Motor Private17%
Motor Commercial26%
PA & Sickness19%
Theft5%
Workman's Compensation
6%
Miscellaneous3%
Ordinary Life40%
Group Life26%
Pension27%
Unit linked7%
Source: IRA, 2008
Life gross premiums by category, 2008
General gross premiums by category, 2008
No separate reporting line for MI
MI relevant categories : PA & Group Life
Largest general category, Motor (Private & Commercial), pension and Ordinary Life
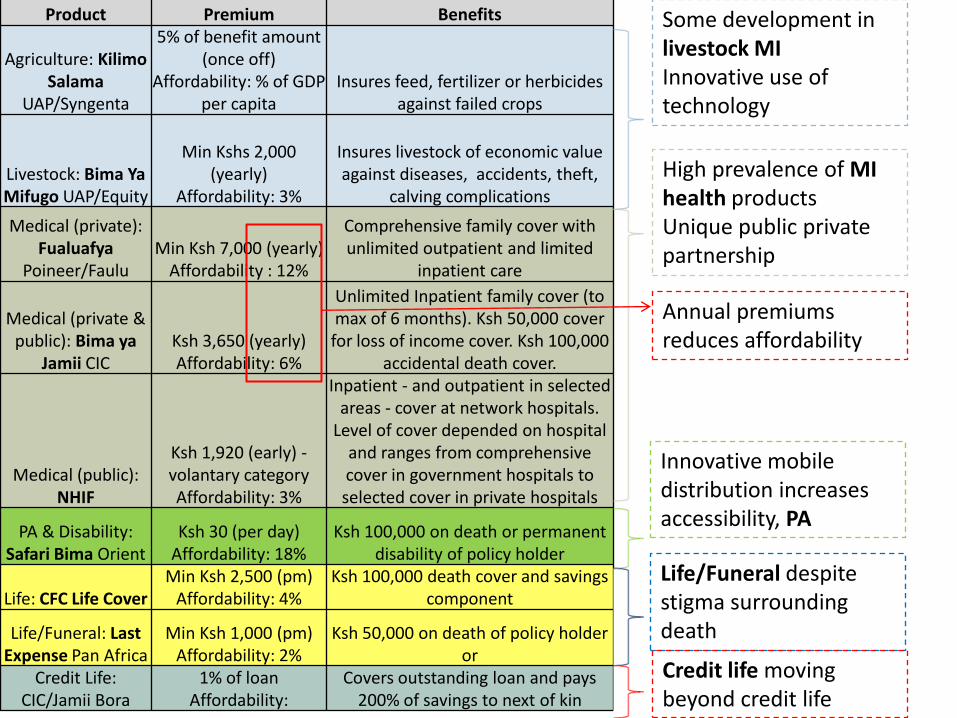
Product Premium Benefits
Agriculture: Kilimo Salama
UAP/Syngenta
5% of benefit amount (once off)
Affordability: % of GDP per capita
Insures feed, fertilizer or herbicides against failed crops
Livestock: Bima Ya Mifugo UAP/Equity
Min Kshs 2,000 (yearly)
Affordability: 3%
Insures livestock of economic value against diseases, accidents, theft,
calving complications
Medical (private): Fualuafya
Poineer/FauluMin Ksh 7,000 (yearly)
Affordability : 12%
Comprehensive family cover with unlimited outpatient and limited
inpatient care
Medical (private & public): Bima ya
Jamii CICKsh 3,650 (yearly)Affordability: 6%
Unlimited Inpatient family cover (to max of 6 months). Ksh 50,000 cover for loss of income cover. Ksh 100,000
accidental death cover.
Medical (public): NHIF
Ksh 1,920 (early) -volantary categoryAffordability: 3%
Inpatient - and outpatient in selected areas - cover at network hospitals.
Level of cover depended on hospital and ranges from comprehensive cover in government hospitals to selected cover in private hospitals
PA & Disability: Safari Bima Orient
Ksh 30 (per day)Affordability: 18%
Ksh 100,000 on death or permanent disability of policy holder
Life: CFC Life CoverMin Ksh 2,500 (pm)
Affordability: 4%Ksh 100,000 death cover and savings
component
Life/Funeral: Last Expense Pan Africa
Min Ksh 1,000 (pm) Affordability: 2%
Ksh 50,000 on death of policy holder or
Credit Life: CIC/Jamii Bora
1% of loanAffordability:
Covers outstanding loan and pays 200% of savings to next of kin
Some development in livestock MIInnovative use of technology
High prevalence of MI health productsUnique public private partnership
Annual premiums reduces affordability
Innovative mobile distribution increases accessibility, PA
Life/Funeral despite stigma surrounding death
Credit life moving beyond credit life
6. Demand-side insights
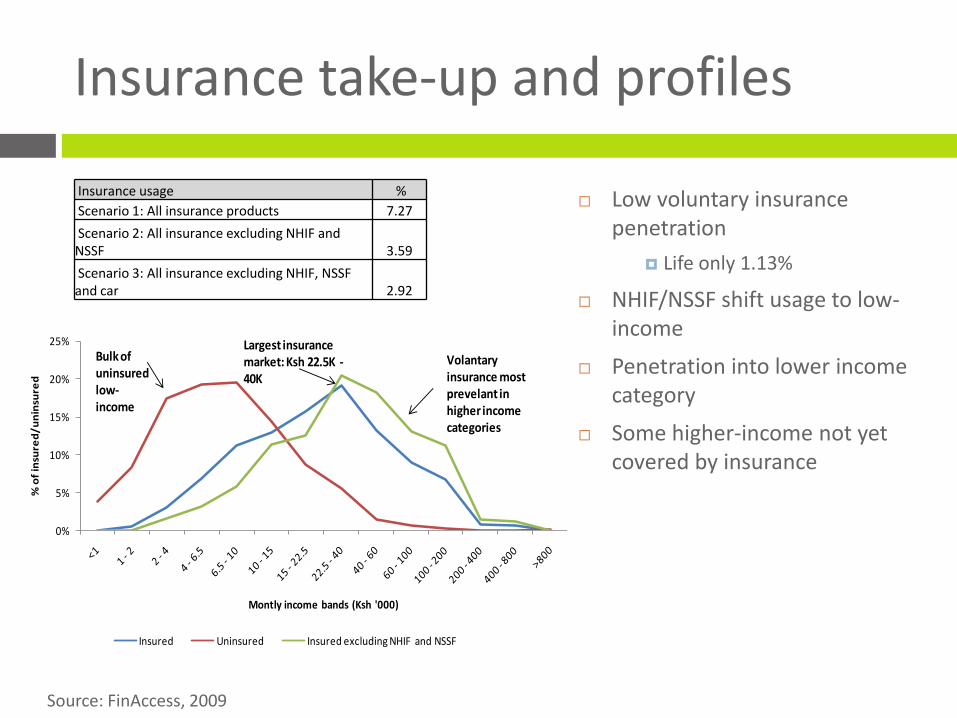
Insurance take-up and profiles
0%
5%
10%
15%
20%
25%
% o
f in
sure
d/
un
insu
red
Montly income bands (Ksh '000)
Insured Uninsured Insured excluding NHIF and NSSF
Bulk of uninsuredlow-income
Largest insurance market: Ksh 22.5K -40K
Volantary insurance most prevelant in higher income categories
Source: FinAccess, 2009
Insurance usage %
Scenario 1: All insurance products 7.27
Scenario 2: All insurance excluding NHIF and NSSF 3.59
Scenario 3: All insurance excluding NHIF, NSSF and car 2.92
Low voluntary insurance penetration
Life only 1.13%
NHIF/NSSF shift usage to low-income
Penetration into lower income category
Some higher-income not yet covered by insurance
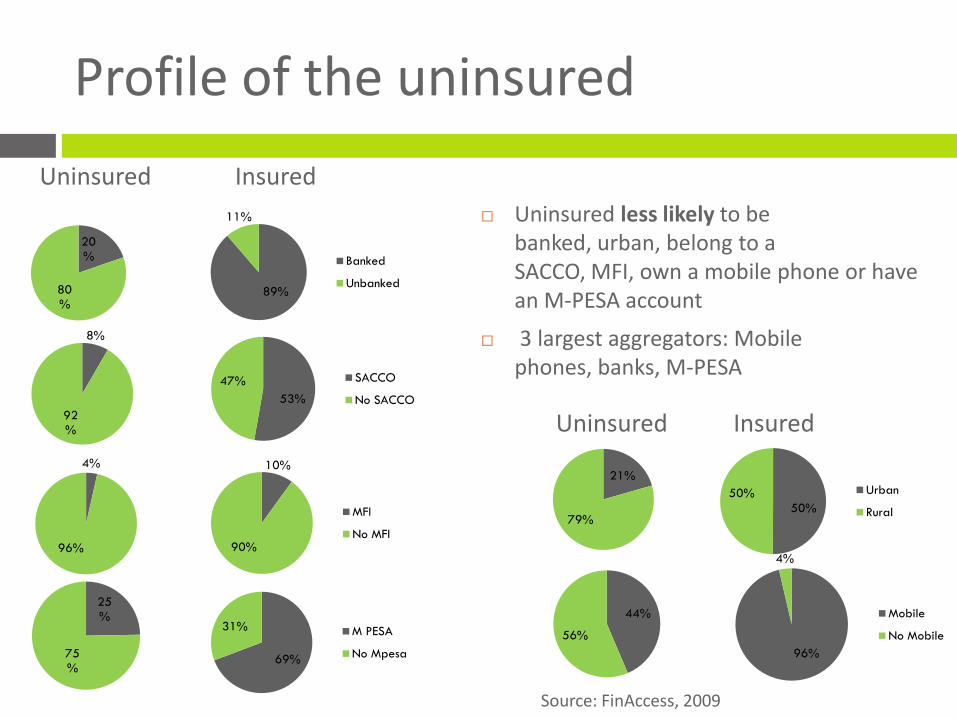
Profile of the uninsured
Uninsured Insured
Source: FinAccess, 2009
20%
80%
89%
11%
Banked
Unbanked
8%
92%
53%
47% SACCO
No SACCO
4%
96%
10%
90%
MFI
No MFI
25%
75%
69%
31% M PESA
No Mpesa
Uninsured less likely to be banked, urban, belong to a SACCO, MFI, own a mobile phone or have an M-PESA account
3 largest aggregators: Mobile phones, banks, M-PESA
44%
56%
96%
4%
Mobile
No Mobile
Uninsured Insured
21%
79%50%
50% Urban
Rural

Risks faced and coping strategies
Coping strategies: how do people deal financially with an unexpected event? Source: FinAccess, 2009
Savings13%
Loan10%
Family member support25%
Find a better job/additional
job17%
Sell assets9%
Depend on
charity from church
mosque, Red Cross10%
Can't do anything
12%
Claim insurance1%
Other3%
Coping strategies mostly ex post
Ex ante
Savings
Welfare groups
Ex post
Loans
Support from family members
Sell assets
Depend on charity
Biggest risk %
Loss of income of main wage-earner 21.2
Drought/famine 18.71
Increase of cost of basic things you need 15.46
Loss of family land 12.43Large medical costs due to family member's ill
health 9.19
Theft, fire or loss of house, property or business 5.84
Bad or deteriorating political situation in country 3.43
Loss of livestock 3.37
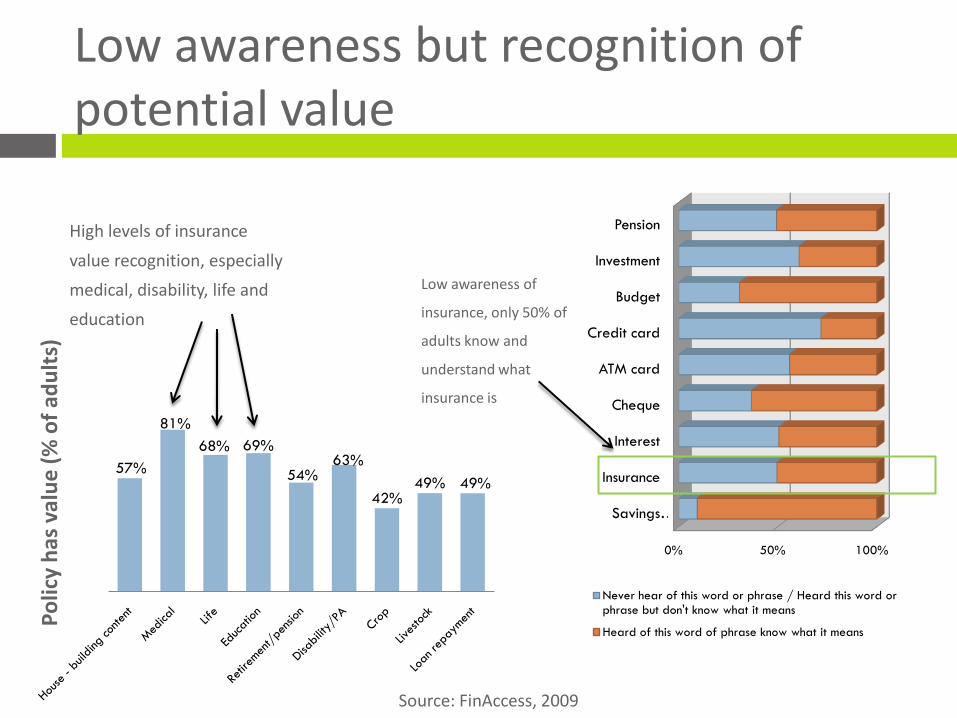
Low awareness but recognition of potential value
High levels of insurance
value recognition, especially
medical, disability, life and
education
0% 50% 100%
Savings …
Insurance
Interest
Cheque
ATM card
Credit card
Budget
Investment
Pension
Never hear of this word or phrase / Heard this word or phrase but don't know what it means
Heard of this word of phrase know what it means
57%
81%
68% 69%
54%63%
42%49% 49%
Low awareness of
insurance, only 50% of
adults know and
understand what
insurance is
Source: FinAccess, 2009
Po
licy
has
val
ue
(%
of
adu
lts)

Insurance usage by product
Largest insurance classes, compulsory insurance: NHIF, NSSF
Largest insurance classes mainly monthly payroll deducted (NHIF, NSSF)
Insurance usage reflects the value individuals place on insurance and the most trusted channel for insurance advice (employers)
1.3%
0.2%
4.8%
0.7%1.1%
0.6%
1.4%
3.2%
Source: FinAccess, 2009
Insu
ran
ce u
sage
(%
of
adu
lts)

Risk perceptions
Focus group research helped to inform demand-side insights from 4 perspectives:
MFI clients: credit insurance
Civil servants: NHIF and insurance usage (steady income)
Artisans and traders: informal sector, small business risks
Farmers & small agri-business: agricultural livelihood risks
29 groups in total (about 8 people per group), Nairobi and peri-urban area
Death of breadwinner, followed by sickness and accidents perceived as biggest risks
Loss of property third
Inability to pay school fees also a much cited risk/issue
Risk management strategies
Various risk management and coping strategies used:
Before the risk:
Risk pooling groups such as welfare societies/associations
Insurance
Savings
After the risk:
Harambees
Loans from ACSAs, SACCOs, MFIs
Selling of livestock and produce
Liquidation of all savings
Funerals very expensive, more so than generally believed:
Funeral costs include coffin, body transportation, mortuary costs, clothes for deceased/immediate family members, for mourners.
Generally ranges from KSh150,000-KSh200,000
Welfare groups unable to fully cover costs of funeral:
Only provide payout ranging from KSh10,000-KSh50,000
Welfare groups of farmers, artisans and traders may provide less
Harambees as post-even risk coping strategy losing its power:
Being misused, over-used – lower willingness to contribute

Perceptions of insurers and insurance
Perceptions of insurance and insurance companies very poor:
Uncertainty about ability to claim successfully, delays in honouringof claims:
Insurance is not transparent, you are only deducted but do not get paid.
It takes too long to pay claims…it takes a lot of time and money to follow up claims..you are told to wait…wait.
Insurance people are not honest, they are complicated and the common man cannot understand them.
Insurance viewed as being for the rich, educated:
I used to think it is for the educated with degrees, “si ya watu wa jua kali” (not for the informal sector people).
Most insurance products were sold through brokers and agents, but perceptions of these intermediaries are very poor:
Brokers are thieves and conmen. You give them money then the office has moved. I have already been conned. I had paid for medical, school fees and they disappeared. They (agents) come
like angels but act like devils.
Perception of value
NHIF thought to provide good value proposition:
My wife was getting a baby at Huruma Nursing home, incurred a bill of Ksh5,000 and they paid all of it. You just present your card at the nursing home and they pay.
I had an uncle who was sick and we were told if he had the NHIF card he would have been paid for it. I went and got myself a card after that and for our parents.
Credit life insurance mostly understood, thought to offer value:
Property of deceased not taken away to pay for debts, family left in peace
Demonstration effect from pay-outs to family of friends
Loan officers mostly thought to explain product well
7. Conclusions and opportunities

Key themes
Banks and M-Pesa have led the entry into the low-income market: Largest single aggregator opportunity
But uncertainty on bancassurance not yet definitively clarified
Large informal insurance market Large % of individuals participate in groups that have “welfare” function
(funeral, health)
Funeral parlours providing insurance products?
Informal risk carrying by MIPs and some service providers
Many MFIs managing client death risks on informal basis (1% of loan charge)
Households face large funeral expenses that cannot be fully covered by informal means Power of post-payment mechanism (harambee) being eroded
Funeral costs up to 4 times higher than pay-out of welfare groups
In recognition of this, funeral insurance products now emerging that cover members of welfare groups
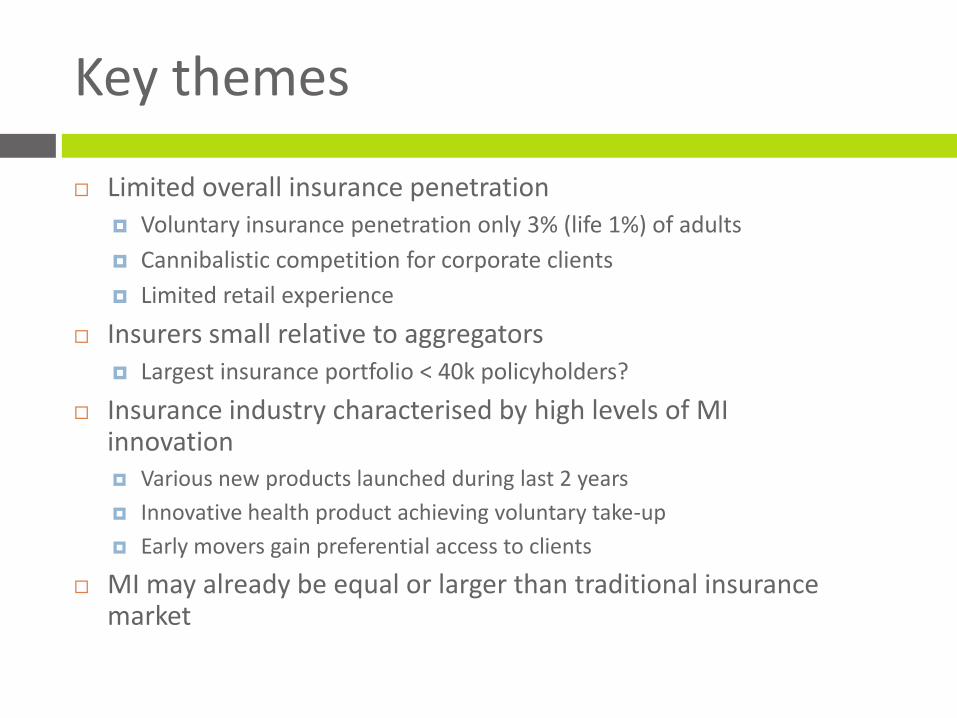
Key themes
Limited overall insurance penetration Voluntary insurance penetration only 3% (life 1%) of adults
Cannibalistic competition for corporate clients
Limited retail experience
Insurers small relative to aggregators Largest insurance portfolio < 40k policyholders?
Insurance industry characterised by high levels of MI innovation Various new products launched during last 2 years
Innovative health product achieving voluntary take-up
Early movers gain preferential access to clients
MI may already be equal or larger than traditional insurance market
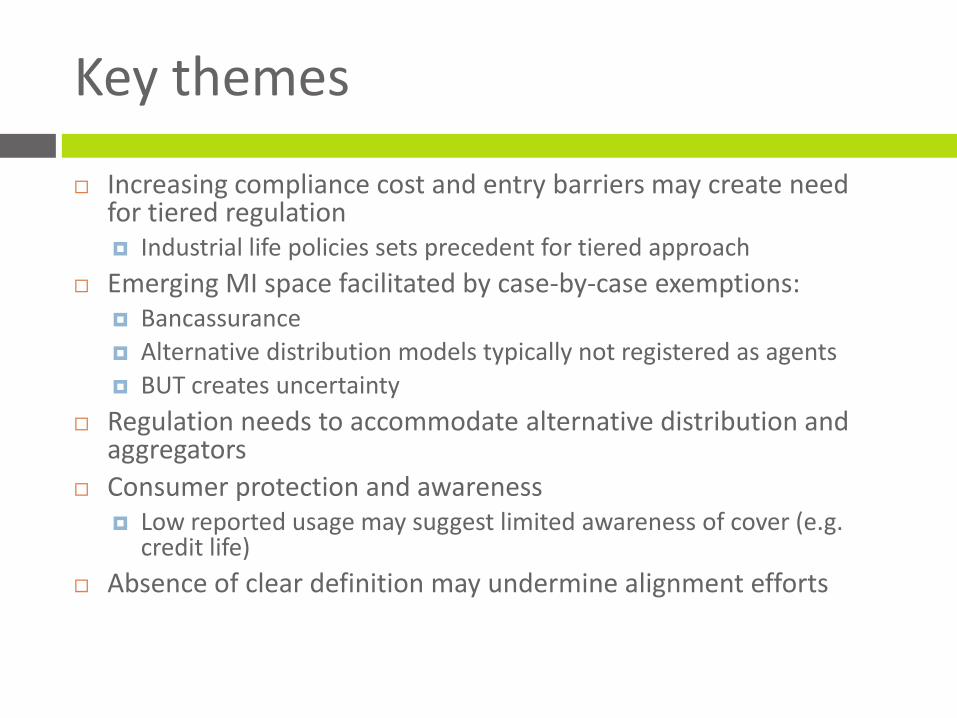
Key themes
Increasing compliance cost and entry barriers may create need for tiered regulation Industrial life policies sets precedent for tiered approach
Emerging MI space facilitated by case-by-case exemptions: Bancassurance
Alternative distribution models typically not registered as agents
BUT creates uncertainty
Regulation needs to accommodate alternative distribution and aggregators
Consumer protection and awareness Low reported usage may suggest limited awareness of cover (e.g.
credit life)
Absence of clear definition may undermine alignment efforts
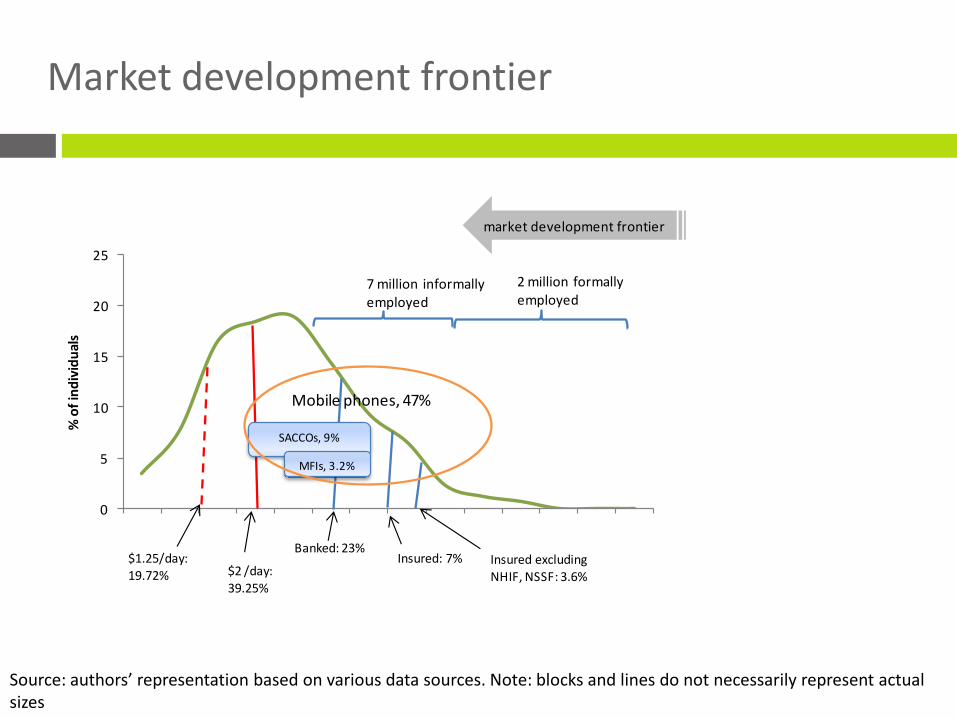
Market development frontier
Source: authors’ representation based on various data sources. Note: blocks and lines do not necessarily represent actual sizes
0
5
10
15
20
25
% o
f in
div
idu
als
market development frontier
$1.25/day:19.72% $2 /day:
39.25%
2 million formally employed
7 million informally employed
Banked: 23%Insured: 7% Insured excluding
NHIF, NSSF: 3.6%
SACCOs, 9%
MFIs, 3.2%
Mobile phones, 47%

Pockets of opportunity
Number of Banked: 4.5m3.9m (85%) of banked uninsured
Formal employment market: 2mInsurance estimate 30%
Welfare market: 4.2 million
4 million (96%)of welfare group members are uninsured
Funeral parlour market?
MFI client base: 770, 000Intermediary: 700,000 (90%) of MFI clients are uninsuredCredit risk: Underwriting on consumer credit insurance?
M-PESA users: 5.4 million (FinAccess) (M-PESA >8m?)
4.9 million (90%) are uninsuredM-PESA agents: >17k
Number of Jua kalis members: 680kOther associations?
SACCO members: 2m1.7 m (81%) are uninsuredOther coops: >1m MI estimates: Current
market
150 – 200K
(Policyholders, Voluntary)
500k Credit life (policyholders)
MFI market
Funeral
Agriculture?
Formally employed
M-PESATraders
associations
Banked
SACCO
Health?
Agricultural risks
Intermediary
Scope for further expansion amongst informally employed?
Low-hanging fruit could extend current voluntary market by 10x

Thank you!
Doubell Chamberlain
Anja Smith
Herman Smit

Discussion