opportunities and barriers for clean coal & other clean ... · opportunities and barriers for...
TRANSCRIPT
Opportunities and Barriers for Clean Coal & Other Clean Technologies
Annex I Expert Group Seminar“Working Together to Respond to Climate Change”
Jarad DanielsUnited States Department of Energy
May 2008

U.S. Department of Energy 2
NPC: The Hard Truths About Energy
Fossil fuels are indispensable to meet demand growth
Conventional oil and natural gas supply won't meet increasing demand
Large scale alternative energy sources will be required to meet demand
Curbing carbon emissions will alter the energy mix, increase energy-related costs, and require demand reductions
National Petroleum Council report “The Hard Truths About Energy” 2007.

U.S. Department of Energy 3
Growing World Energy Demand
U.S. Department of Energy 4
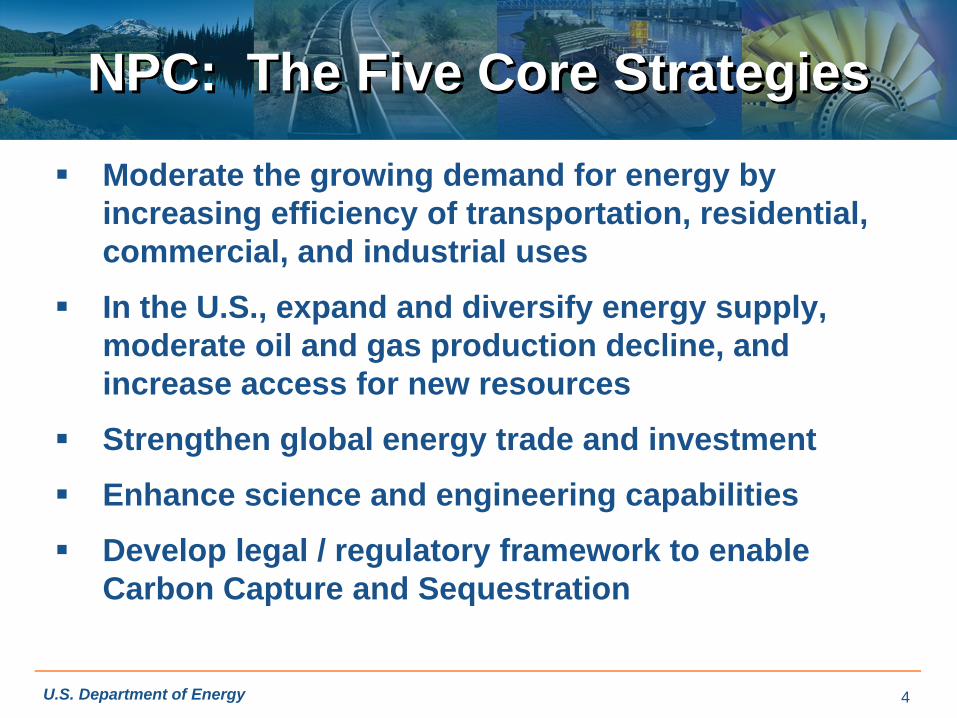
NPC: The Five Core Strategies
Moderate the growing demand for energy by increasing efficiency of transportation, residential, commercial, and industrial uses
In the U.S., expand and diversify energy supply, moderate oil and gas production decline, and increase access for new resources
Strengthen global energy trade and investment
Enhance science and engineering capabilities
Develop legal / regulatory framework to enable Carbon Capture and Sequestration

Coal is expected to play a key role in growth of Emerging Economies
Source: IEA, World Energy Outlook 2007, Reference scenario.
0
500
1 000
1 500
2 000
2 500
3 000
3 500
4 000
2005 2030 2005 2030
Mtoe
TEOther OECDEU27JapanUSOther DCIndiaChina
Power generation Other
Coa
l inp
ut
Global CO2 emissions from coal: 11 GtCO2 in 2005, 19 GtCO2 in 2030

Electricity Generation Capacity by Fuel Type in 2005 (%) China, India, and USA
Operational Capacity by Fuel Type (2005)
0.0% 20.0% 40.0% 60.0% 80.0% 100.0%
CHINA
USA
INDIA
Coal Gas Oil Hydro Nuclear Others / Renewables
Country Total Capacity (MW) Coal Capacity (MW)
India 116,860 67,296
USA 991,794 327,551
China 379,895 272,243
Data Source: Platts UDI, 2005

Age of Existing Coal-Fired Units in 2005 (Number of Units) in India, China, and USA
552
406
133108
6372
111 10580
3820
116
223258
569
0
100
200
300
400
500
600
0-10 Years Old(1996-2005)
11-20 Years Old(1986-1995)
21-30 Years Old(1976-1985)
31-40 Years Old(1966-1975)
41Years andOlder (1965)
Num
ber o
f Uni
ts
ChinaIndiaUS
Data Source: Platts UDI, 2005

Age of Existing Coal-Fired Capacity in 2005 (MW) in India, China, and USA
132,862
82,554
17,015
5,956
105,780
112,795
77,287
2,3296,776
19,92217,126
1,852
25,245
4,937
26,631
0
20,000
40,000
60,000
80,000
100,000
120,000
140,000
160,000
0-10 Years Old(1996-2005)
11-20 Years Old(1986-1995)
21-30 Years Old(1976-1985)
31-40 Years Old(1966-1975)
41Years andOlder (1965)
Cap
acity
(MW
)
ChinaIndiaUS
Data Source: Platts UDI, 2005
U.S. Department of Energy 9
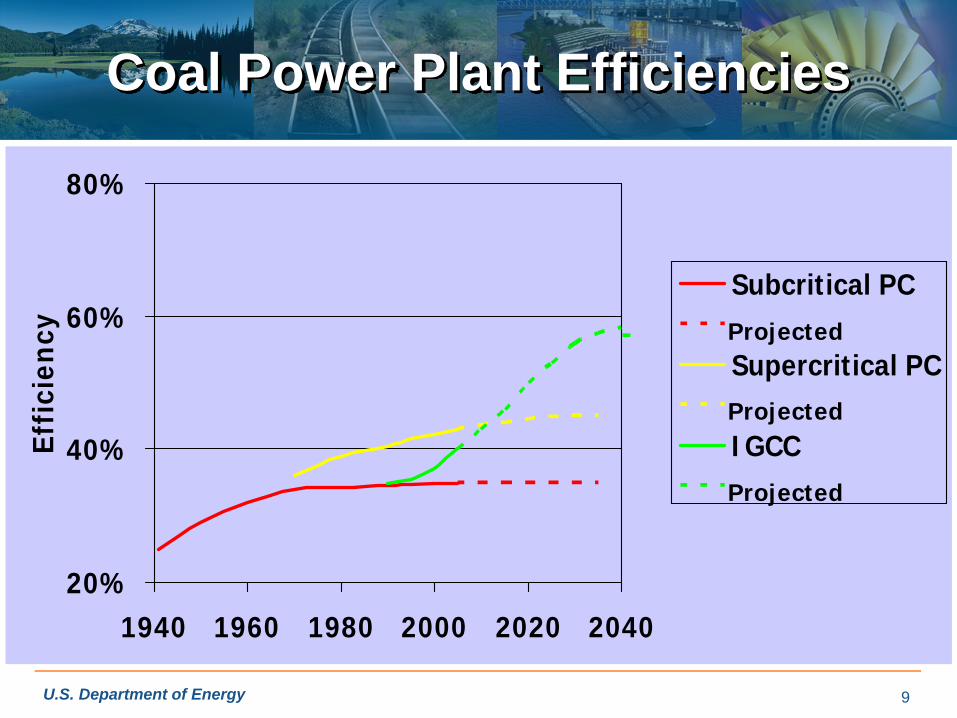
Coal Power Plant Efficiencies
20%
40%
60%
80%
1940 1960 1980 2000 2020 2040
Effi
cien
cy
Subcritical PC
Supercritical PC
IGCC
Projected
Projected
Projected

Average Coal-Fired Power Plant EfficienciesChina, India, and USA
CountryAverage Efficiency
(HHV) (%)
OECD 36
USA 33-34
China ~30-32
India ~25-34
China’s reported power efficiency is approaching OECD levels following rapid build up of new units over the last 5+ years
India is improving too but not as fast as China owing to slower build up and the number of poor performing SEB stations, which represent about 2/3 of India’s electricity generation
The efficiency of Indian coal plants is greatly hampered by high ash content coal, and warm weather.
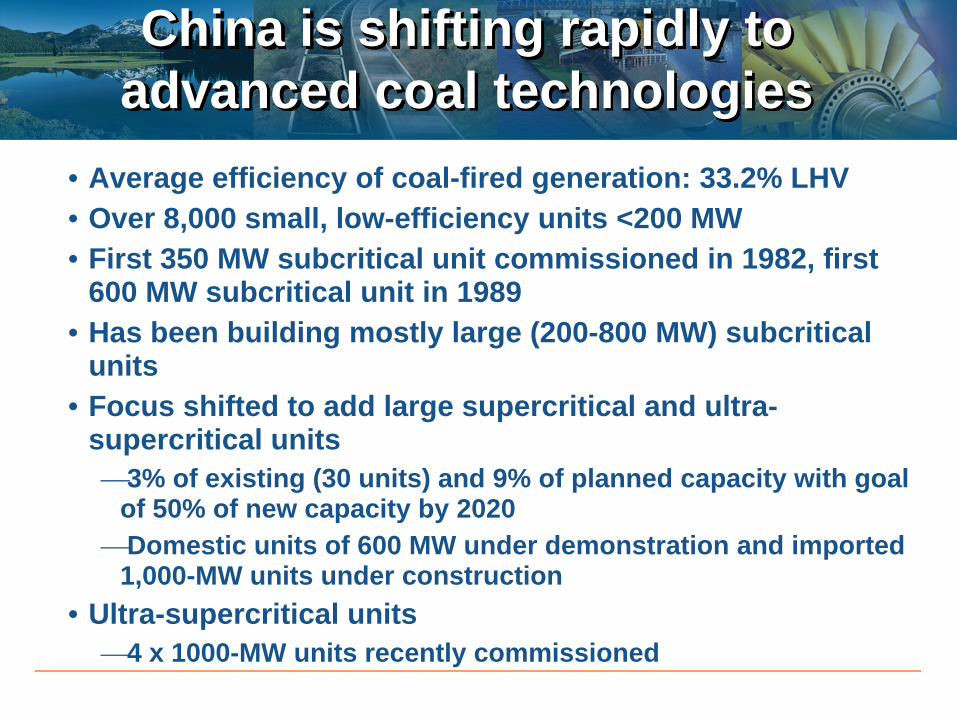
China is shifting rapidly to advanced coal technologies
• Average efficiency of coal-fired generation: 33.2% LHV• Over 8,000 small, low-efficiency units <200 MW• First 350 MW subcritical unit commissioned in 1982, first
600 MW subcritical unit in 1989• Has been building mostly large (200-800 MW) subcritical
units• Focus shifted to add large supercritical and ultra-
supercritical units⎯3% of existing (30 units) and 9% of planned capacity with goal
of 50% of new capacity by 2020⎯Domestic units of 600 MW under demonstration and imported
1,000-MW units under construction• Ultra-supercritical units
⎯4 x 1000-MW units recently commissioned

India is adopting advanced technologies more slowly
• Average efficiency of coal-fired generation: 27.6% LHV• Poor quality coal (>40% ash) limits performance• Currently, 100% subcritical pulverized coal
⎯135 x 200-250 MW units since 1978 and 27 x 500 MW since 1984 commissioned by BHEL
• 1st supercritical plant (3 x 660 MW) under construction at Sipat using South Korean technology
• “Ultra-mega” projects planned using 800-MW supercritical units

Coal Technology Status in China and IndiaTechnology China India
IGCCYantai IGCC project under consideration for past decade. Several power and polygeneration projects being developed by major utilities.
$2.5-M DOE/USAID/NTPC feasibility study for 100-MW unit completed. Pursuing a demo project of about 100 MW by NTPC . BHEL developed domestic technology, tested at 6-MW scale.
Gasifiers37 on coal, 13 on petroleum and 1 on gas(25 Shell, 22 GE, 3 Sasol Lurgi, 1 GTI U-Gas)(35 Operating, 16 Planned)
6 operating on petroleum and petcoke(5 Shell, 1 GE)
CFBC Many domestically built 50-200-MW unitsTechnology acquired through licensing. Four domestically built 125-MW units, including 2 firing lignite. 250-MW unit under installation at Neyveli Lignite.
CTL/ Polygeneration
First phase of Shenhua’s direct liquefaction plant in Inner Mongolia to start operation in 2008, producing 1.08 million tons of liquid products (diesel, LPG, and naphtha). Total production of two phases is 5 million tons. Also, developing two indirect liquefaction plants with Sasol Polygeneration under study by others, including Hunnan International Technopolis Shenyang (HITS) using coal and waste/garbage and Datang Power (4 plants) using coal
Under study; on January 2007, Investment Commission said go forward, but not a near-term project
Supercritical Several dozen units commissioned
Original license from Combustion Engineering (USA, now Alstom); scaled up by BHEL. No units constructed yet, but first plant announced by BHEL and TNEB for 2 x 800 plant at Tuticorin, Tamil Nadu. First imported unit 1980-MW (3 x 660 MW) Sipat to be commissioned in 2008 by Doosan Babcock (Korea), which will burn 43% ash coal. Three other projects already awarded to IPPs through tariff-based competitive bidding. Many more supercritical units in pipeline.
Ultra Supercritical First plant commissioned early 2008 (Huaneng’s 4 x 1000-MW Yuhuan Plant)
Initial tie-up with Babcock Borsig. Recently, licensed Alstomboiler technology and Siemens steam turbine technology up to 660 MW. BHEL plans to develop up to 800 MW. No units constructed yet.

2010:
• 45-50% Efficiency (HHV)• 99% SO2 removal• NOx < 0.01 lb/MM Btu• 90% Hg removal
2012:
• 90% CO2 capture• <10% increase in cost of electricity (COE) with carbon
sequestration2015
• Multi-product capability (e.g., power + H2)• 60% efficiency (measured without carbon capture)
US DOE’s Office of Fossil EnergyAdvanced (Coal) Power Systems Goals
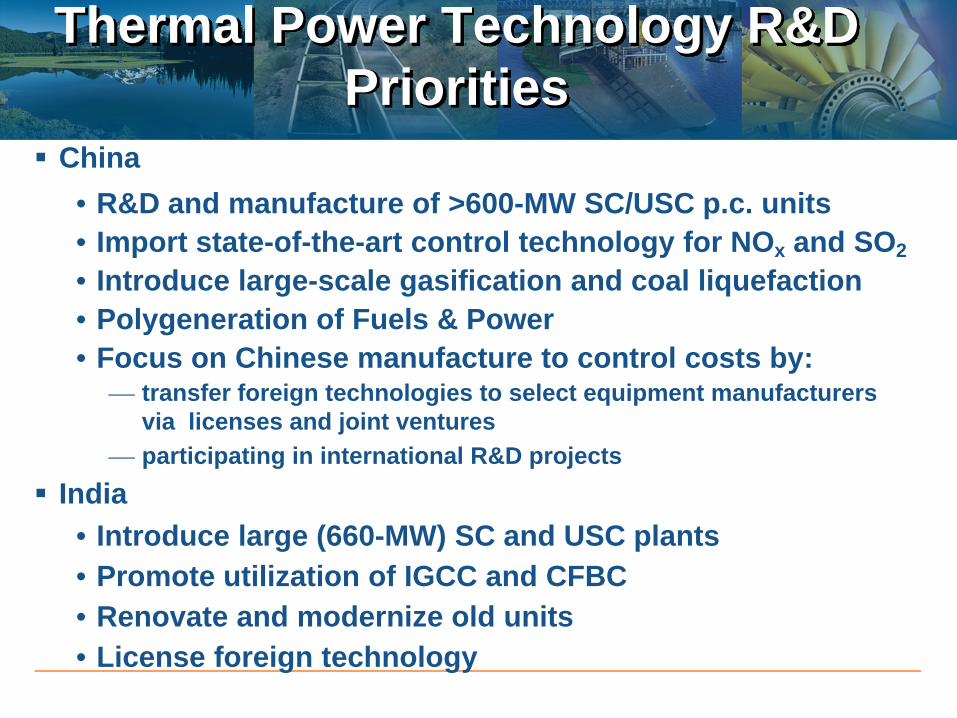
Thermal Power Technology R&D Priorities
China• R&D and manufacture of >600-MW SC/USC p.c. units• Import state-of-the-art control technology for NOx and SO2• Introduce large-scale gasification and coal liquefaction• Polygeneration of Fuels & Power• Focus on Chinese manufacture to control costs by:
⎯ transfer foreign technologies to select equipment manufacturers via licenses and joint ventures
⎯ participating in international R&D projectsIndia
• Introduce large (660-MW) SC and USC plants• Promote utilization of IGCC and CFBC• Renovate and modernize old units • License foreign technology

U.S. Department of Energy 16
Carbon Capture and Storage (CCS)
Three elements of CCS:• Capture – accounts for over 90% of the CCS cost due
to high capital cost and energy penalties• Transport- requires infrastructure, pipeline, right of
ways, limited by economics of transport distance.• Storage- safety, long-term storage, liability, land and
mineral access rights for geologic storage.Research focuses on cost and energy penalty reductions and providing a scientific and operational basis for safe and effective injection and long-term storage

17
Examples of CO2 Capture Technologies
Combustion Plants(new construction)
Commercial/Near Commercial
Advanced Selexol w/ Hydrogen Co-production
$45-60/ton Carbon
Gasification-Based Plants
(new construction)
Hydrogen Membranes$40-50/ton Carbon
Ionic Liquids$ 30-60 /ton Carbon
Current State of the Capture Technology
Advanced
Commercial/Near Commercial
Advanced
Advanced Rectisol$150-170/ton Carbon
Advanced Amine$140-160/ton Carbon
Amine Wet-Scrubber$110-130/ton Carbon
Advanced Amine$90-120/ton Carbon
Oxyfuel Combustion$70-80/ton Carbon
Can be Retrofit to Existing Plants
Plant Type
CO2 Capture Technologies
FutureGen w/ Carbon Capture and Storage
$0-10/ton Carbon (net) Potential
Adv. Oxyfuel Comb.$55-70/ton Carbon
Chilled Ammonia$100-140/ton Carbon
Aqua Ammoniaw/ Byproduct Sales
$70-80/ton Carbon
Note: These costs have not been rigorously updated but represent estimates based on cost escalations since original costs were constructed in 2006

39.5
32.1
36.8
24.9
39.1
27.2
0.0
5.0
10.0
15.0
20.0
25.0
30.0
35.0
40.0
45.0
Avg IGCC Avg IGCC w/CO2 Capture
PC-Sub PC-Sub w/CO2 Capture
PC-Super PC-Super w/CO2 Capture
Capturing CO2 with Today’s TechnologySignificantly Reduces Plant Efficiency
Source: DOE/NETL Report: “Cost and Performance Baseline for Fossil Energy Plants”, May 2007
-19%-32% -30%
Gasification Pulverized Coal Combustion

7.79
10.63
6.40
11.88
6.33
11.48
0.00
2.00
4.00
6.00
8.00
10.00
12.00
14.00
Avg IGCC Avg IGCC w/CO2 Capture
PC-Sub PC-Sub w/CO2 Capture
PC-Super PC-Super w/CO2 Capture
Capturing CO2 with Today’s Technology is Expensive
Cost of Electricity Comparison
January 2007 Dollars, Coal cost $1.80/106 Btu
+36% +86% +81%
Gasification Pulverized Coal Combustion
Source: DOE/NETL Report: “Cost and Performance Baseline for Fossil Energy Plants”, May 2007

U.S. Department of Energy 20
Impediments to IGCC & CCS
Higher cost of IGCC over conventional PCIGCC is less mature than PC• Absence of warranties on IGCC hardware• Lack of industry confidence• Difficulties in obtaining financing
High cost of CCS• Reluctance of regulated utility commission to adjust
rate base for costlier plantsLong-term CO2 storage liability to utilities

U.S. Department of Energy 21
Cost Reduction Goals of IGCC R&D
Current IGCC costs are approximately 20% higher than conventional coal plants.
Our US DOE program goal is to develop technology that would reduce IGCC costs, increase reliability and efficiency, and have the features for accommodating CCS, and when combined with CCS will result in a nominal increase in the cost of electricity (~10% premium).
Cost reductions will result from improved gasifier designs (more reliable and maintainable), cheaper air separation technologies (e.g. membranes), improved gas clean-up technologies, and utilization of advanced low-emission hydrogen turbines, and reduction in CCS costs and energy penalties.
U.S. Department of Energy 22
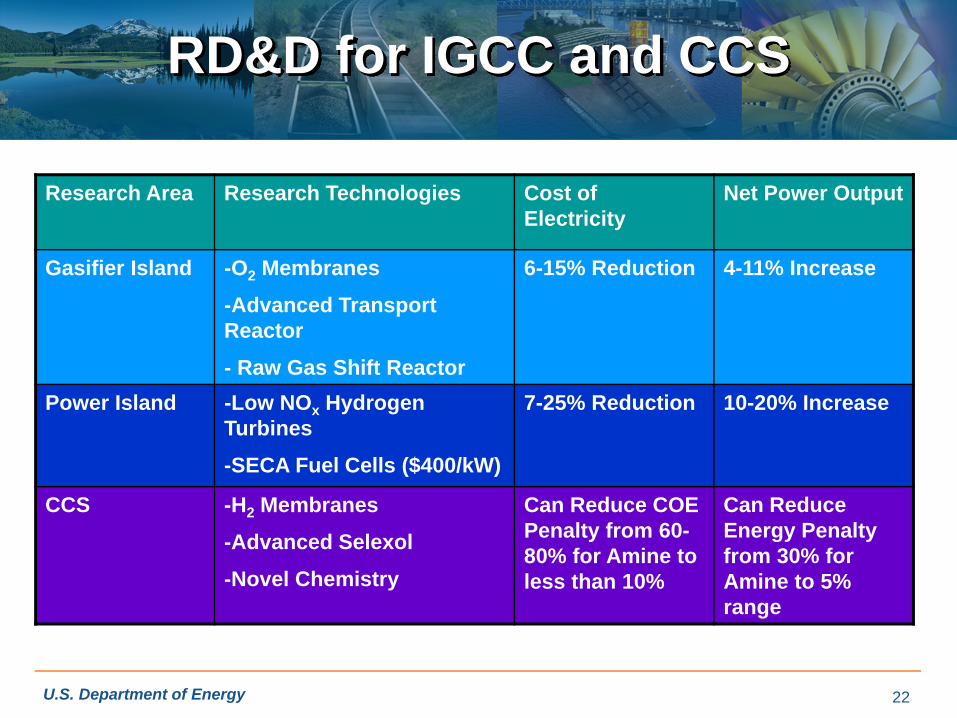
RD&D for IGCC and CCS
Research Area Research Technologies Cost of Electricity
Net Power Output
Gasifier Island -O2 Membranes
-Advanced Transport Reactor
- Raw Gas Shift Reactor
6-15% Reduction 4-11% Increase
Power Island -Low NOx Hydrogen Turbines
-SECA Fuel Cells ($400/kW)
7-25% Reduction 10-20% Increase
CCS -H2 Membranes
-Advanced Selexol
-Novel Chemistry
Can Reduce COE Penalty from 60-80% for Amine to less than 10%
Can Reduce Energy Penalty from 30% for Amine to 5% range

Benchmark: $30/tCO2
Form of Energy Equivalent to $30/tCO2 (≈ $100/tC)
Natural gas $1.60/1000 scf
Crude oil $13/barrel
Coal $70/U.S. ton
Gasoline 25¢/gallon (ethanol subsidy: 50¢/gallon)
Electricity from coal 2.4¢/kWh (wind and nuclear subsidies: 1.8 ¢/kWh)
Electricity from natural gas 1.1¢/kWh
Carbon emission charges in the neighborhood of $30/tCO2 can enable scale-up of most of technologies, if supplemented with sectoral policy to facilitate transition.
$30/tCO2 is the current European Trading System price for 2008 emissions.At this price, current global emissions (30 GtCO2/yr) cost $900 billion/yr, 2% of GWP.
Slide Source: Professor Socolow, Princeton University

Asia Pacific Partnership
Partners: Australia, Canada, China, Japan, India, Republic of Korea, United States
Objectives: “Meet goals for energy security, national air pollution reduction, and climate change in ways that promote sustainable economic growth and poverty reduction.”
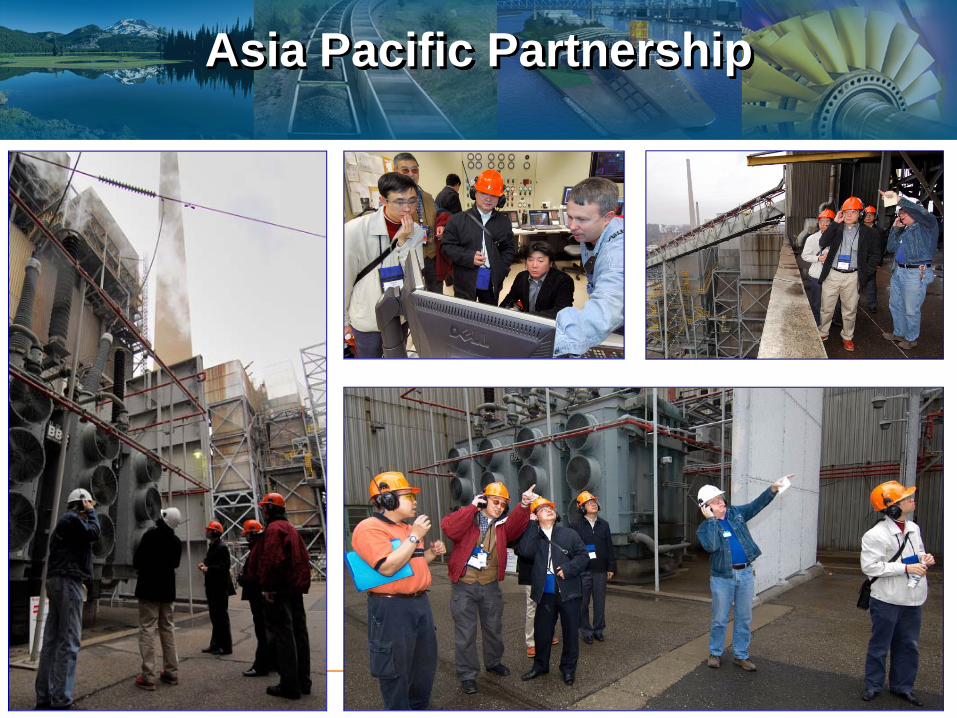
Asia Pacific Partnership

U.S. Department of Energy 26
Carbon Sequestration Leadership Forum
The CSLF is an international climate change initiative that is focused on development of improved cost-effective technologies for the separation and capture of carbon dioxide for its transport and long-term safe storage. The purpose of the CSLF is to make these technologies broadly available internationally; and to identify and address wider issues relating to carbon capture and storage. This could include promoting the appropriate technical, political, and regulatory environments for the development of such technology. The CSLF is currently comprised of 22 members, including 21 countries and the European Commission.

U.S. Department of Energy 27
Final Observations
Fossil Fuels will continue to be a large part of the world’s energy mix
Technology is available today for carbon capture from new and retrofitted coal-fired IGCC and PC power plants, however:
• It is very expensive
• Parasitic load is very high
• Reliability needs to be proven
Sequestration needs to be adequately demonstrated, especially in deep saline reservoirs with large-volume CO2 injection
DOE RD&D program is targeting the key issues of lowering system costs, increasing efficiencies, and proving sequestration.
International cooperation, through many diverse mechanisms, will be necessary to ensure success.

For Additional Information
U.S. Department of EnergyOffice of Fossil Energy
www.fe.doe.gov
Jarad [email protected]