open source tools development tools for arm®...
TRANSCRIPT
External Use
TM
Open Source Tools Development
Tools for ARM Architectures
FTF-SDS-F0012
A P R . 2 0 1 4
Catalin Udma | Software Engineer, Digital Networking
Gene Fortanely | Software Engineer, Digital Networking
TM
External Use 1
Session Introduction
• The development tools ecosystem for ARM is probably the most comprehensive in the embedded world
• This session will demonstrate how to pick from the existing tools and then how to use them to create an integrated development solution
− The power and versatility of open source GNU tools like GCC and GDB
− The GUI usability improvements provided by the development tools based on Eclipse
• When the basics are completed, it's time to move to optimization and fine tuning – tools like perf and Valgrind along with the Eclipse Linux Tools project

TM
External Use 2
Session Objectives
• After completing this session you will be able to:
− Create an integrated development solution based on open-source tools
− Build native and target GDB configured to debug ARM targets
− Debug Linux applications using GDB and Eclipse
− Optimize target applications using dynamic analysis tools
TM
External Use 3
Agenda
• Open-source resources for ARM
• GDB – Gnu Debugger
• Eclipse CDT – C/C++ Integrated Development
Environment
• Dynamic analysis tools
• Eclipse Linux Tools
• Freescale extensions to open-source tools

TM
External Use 4
Agenda
• Open-source resources for ARM
• GDB – Gnu Debugger
• Eclipse CDT – C/C++ Integrated Development
Environment
• Dynamic analysis tools
• Eclipse Linux Tools
• Freescale extensions to open-source tools
TM
External Use 5
Open-Source Resources for ARM
• Development environment for ARM embedded systems:
− U-boot boot-loader
− Linux Kernel
− Root file system
− Bare-metal application
• Software Development Tools
− Toolchain - GCC suite
Cross-build each environment component for ARM target
Obtain the executable and run it on ARM target
− Debugger - source code debugger
Fix the program crashes and validate the program execution
− Dynamic analysis tools - trace and performance
Fine-tunning: performance optimization, memory allocation, trace

TM
External Use 6
Open-Source Resources for ARM (continued)
• Open-source resources
− GNU http://www.gnu.org/
− GCC: the GNU Compiler Collection http://gcc.gnu.org/
− GDB: the GNU Project Debugger http://www.gnu.org/software/gdb/
− Linux Kernel https://www.kernel.org/
− U-boot http://www.denx.de/wiki/U-Boot
• Open-source for ARM
− Linaro: Open-source software for ARM SoCs: http://www.linaro.org/
− Available binaries (toolchain, GDB), sources with Linaro specific patches,
on-line tutorials and examples
TM
External Use 7
Open-Source Resources for ARM (continued)
• Embedded build environment
− Yocto Project (https://www.yoctoproject.org/ )
Open-source embedded Linux build system
“It's not an embedded Linux distribution – it creates a custom one for you”
− Freescale – Yocto contributor
Freescale SDK – Yocto based (Power Architecture and ARM technologies)
• User-friendly framework for creating Linux distribution
• Configure the target
• Build the toolchain: GCC, GCC-cross egblic, binutils
• Build the u-boot, kernel
• Build Linux User space applications

TM
External Use 8
Agenda
• Open-source resources for ARM
• GDB – Gnu Debugger
• Eclipse CDT – C/C++ Integrated Development
Environment
• Dynamic analysis tools
• Eclipse Linux Tools
• Freescale extensions to open-source tools
TM
External Use 9
GDB – Gnu Debugger
• Objective: Create an integrated development solution
− Software Development Tools
Debugger: GDB
• GDB is one of the most popular and used debuggers. GDB is free
software provided by Free Software Foundation
− What is going on `inside' another program while it executes – or what
another program was doing at the moment it crashed
Current execution point context
Program’s source code
Registers
Stack frames
Program memory
Variables
Change program execution
TM
External Use 10
GDB – ARM Support
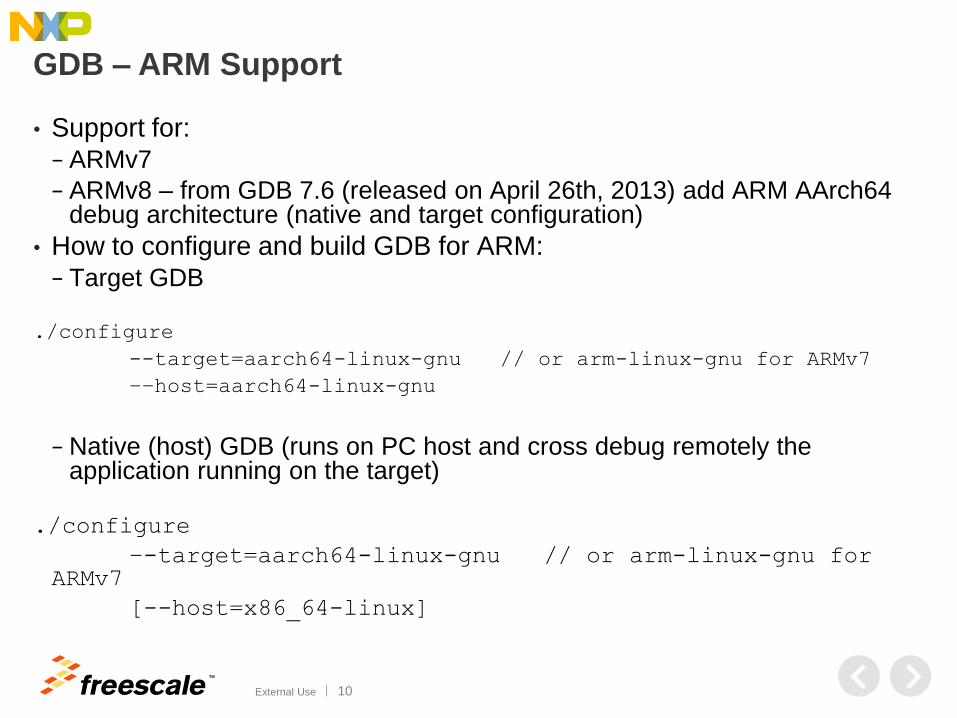
• Support for:
− ARMv7
− ARMv8 – from GDB 7.6 (released on April 26th, 2013) add ARM AArch64 debug architecture (native and target configuration)
• How to configure and build GDB for ARM:
− Target GDB
./configure
--target=aarch64-linux-gnu // or arm-linux-gnu for ARMv7
––host=aarch64-linux-gnu
− Native (host) GDB (runs on PC host and cross debug remotely the application running on the target)
./configure
–-target=aarch64-linux-gnu // or arm-linux-gnu for ARMv7
[--host=x86_64-linux]

TM
External Use 11
GDB – ARM Support (continued)
• Using Yocto: How to configure and build GDB for ARM
− Configure Yocto target
$ source ./fsl-setup-poky –m <ARM target>
or
$ source poky/oe-init-build-env
edit conf/local.conf to define the ARM target details
Target GDB
$ bitbake gdb
Native (host) GDB
$ bitbake gdb-cross
TM
External Use 12
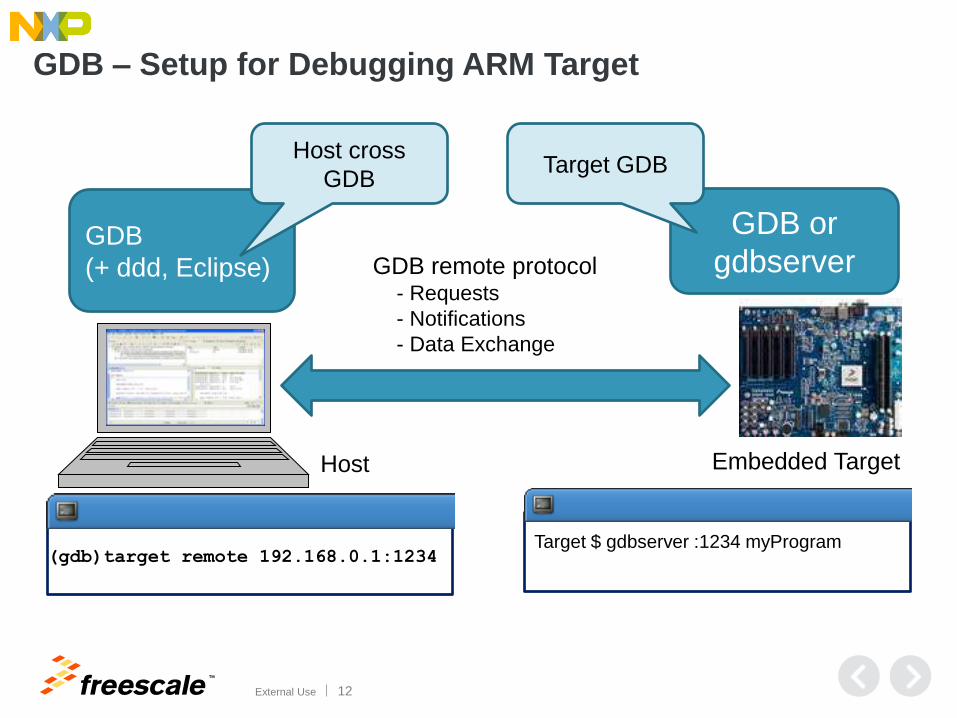
GDB – Setup for Debugging ARM Target
Embedded Target
GDB or
gdbserver
Host
GDB
(+ ddd, Eclipse) GDB remote protocol - Requests
- Notifications
- Data Exchange
Host cross
GDB Target GDB
(gdb)target remote 192.168.0.1:1234 Target $ gdbserver :1234 myProgram
TM
External Use 13
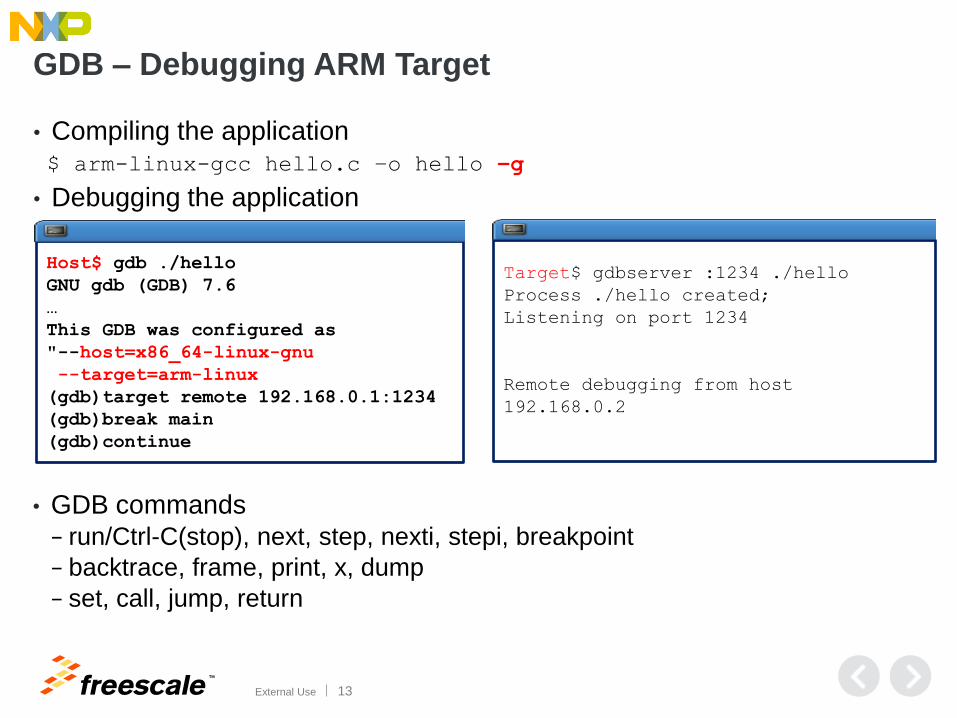
GDB – Debugging ARM Target
• Compiling the application $ arm-linux-gcc hello.c –o hello –g
• Debugging the application
• GDB commands
− run/Ctrl-C(stop), next, step, nexti, stepi, breakpoint
− backtrace, frame, print, x, dump
− set, call, jump, return
Target$ gdbserver :1234 ./hello
Process ./hello created;
Listening on port 1234
Remote debugging from host
192.168.0.2
Host$ gdb ./hello
GNU gdb (GDB) 7.6
…
This GDB was configured as
"--host=x86_64-linux-gnu
--target=arm-linux
(gdb)target remote 192.168.0.1:1234
(gdb)break main
(gdb)continue

TM
External Use 14
Agenda
• Open-source resources for ARM
• GDB – Gnu Debugger
• Eclipse CDT – C/C++ Integrated Development
Environment
• Dynamic analysis tools
• Eclipse Linux Tools
• Freescale extensions to open-source tools
TM
External Use 15
CDT – C/C++ Integrated Development Environment
• C/C++ Development Tooling (CDT)
− Integrated Development Environment based on Eclipse
− http://www.eclipse.org/cdt
• Features
− Supports GNU build tools as managed build project or standard make
build
− Source navigation, code refactoring, code generation
− Visual debugging tools, including memory, registers, and disassembly
viewers, multicore visualization
• Uses native Linux command-line tools. These tools have to be
installed independently

TM
External Use 16
Eclipse CDT – Remote Application Debug
• CDT prerequisites
− GDB cross-tools for
remote target
− SSH connection for
downloading application
• Debug configuration
− Update GDB debugger to
point to cross-tools gdb
− Use “C/C++ Remote
Application” and ssh
connection to download
executable on remote
Linux machine
ARM Eclipse CDT
GDB
Launch GDB GDB/MI
GDB CLI
(gdb) break main.c:10
(gdb) continue
Continuing.
gdbserver
Linux
GDB Cross-
Tools
Host

TM
External Use 17
Eclipse CDT – Debugging ARM Target

TM
External Use 18
Agenda
• Open-source resources for ARM
• GDB – Gnu Debugger
• Eclipse CDT – C/C++ Integrated Development
Environment
• Dynamic analysis tools
• Eclipse Linux Tools
• Freescale extensions to open-source tools

TM
External Use 19
Dynamic Analysis Tools - PERF
• PERF
− “perf” is a performance analysis tool that is based on the perf_events
interface made available in Linux Kernels Version 2.6 and higher
− Perf exposes its functionality via a simple but powerful command line
interface.
• “perf” command:
usage: perf [--version] [--help] COMMAND [ARGS]
Examples:
perf stat: obtain event counts
perf record: record events for later reporting
perf report: break down events by process, function, etc.
perf annotate: annotate assembly or source code with event counts
perf top: see live event count
TM
External Use 20
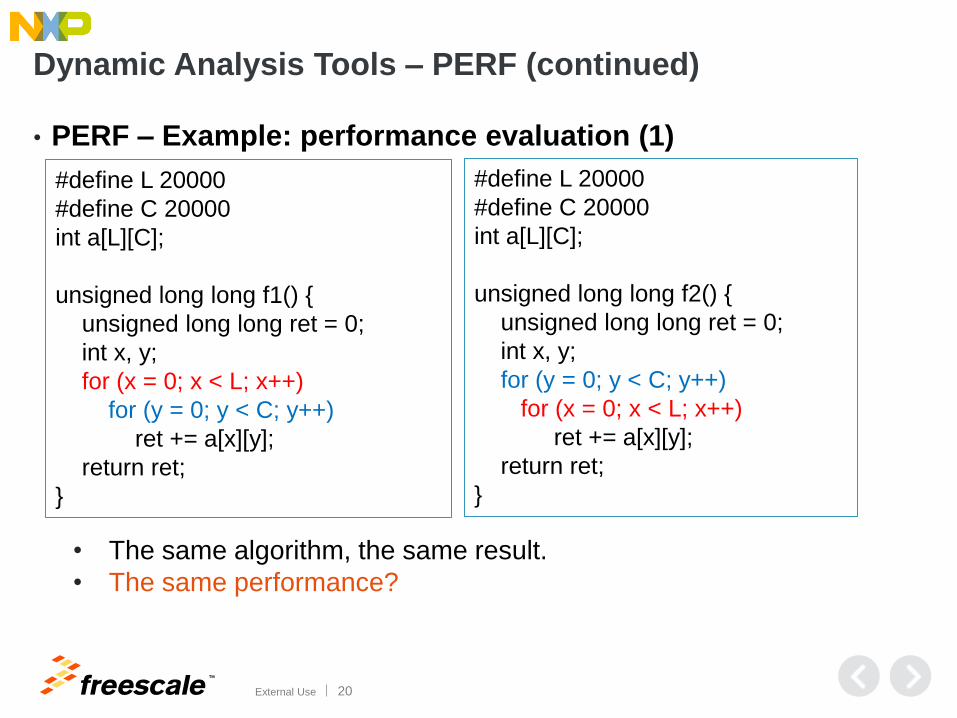
Dynamic Analysis Tools – PERF (continued)
• PERF – Example: performance evaluation (1)
#define L 20000
#define C 20000
int a[L][C];
unsigned long long f1() {
unsigned long long ret = 0;
int x, y;
for (x = 0; x < L; x++)
for (y = 0; y < C; y++)
ret += a[x][y];
return ret;
}
#define L 20000
#define C 20000
int a[L][C];
unsigned long long f2() {
unsigned long long ret = 0;
int x, y;
for (y = 0; y < C; y++)
for (x = 0; x < L; x++)
ret += a[x][y];
return ret;
}
• The same algorithm, the same result.
• The same performance?

TM
External Use 21
Dynamic Analysis Tools – PERF (continued)
• PERF – Example: performance evaluation (2)
$ perf stat -e cache-misses ./f1
Performance counter stats for './f1':
4007 cache-misses
1.855771646 seconds time elapsed
$ perf stat -e cache-misses ./f2
Performance counter stats for './f2':
11401273 cache-misses
5.551568045 seconds time elapsed
TM
External Use 22
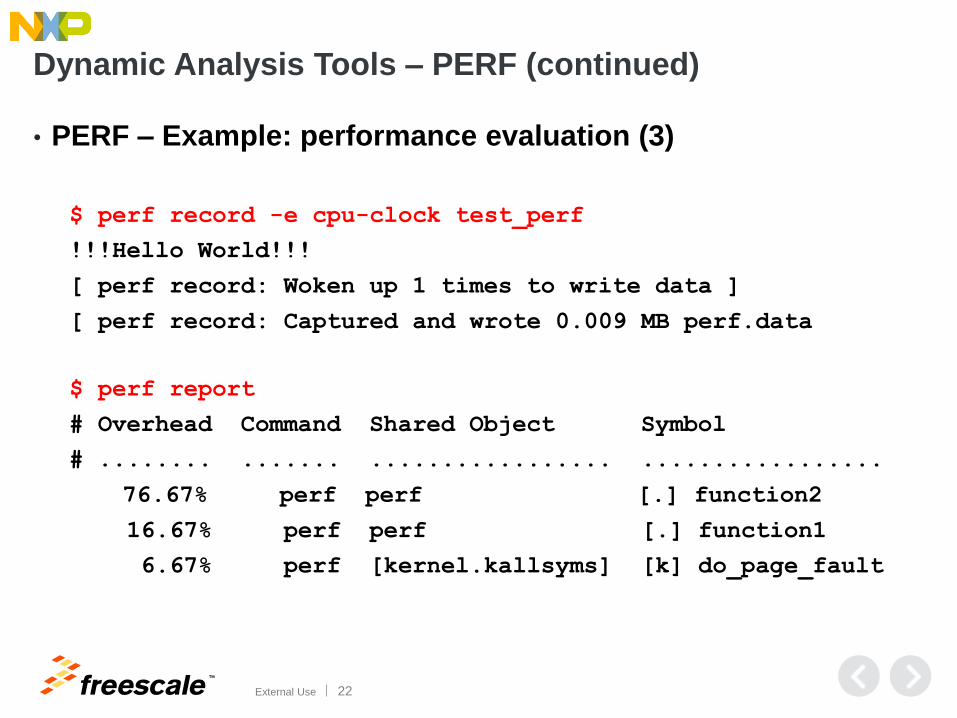
Dynamic Analysis Tools – PERF (continued)
• PERF – Example: performance evaluation (3)
$ perf record -e cpu-clock test_perf
!!!Hello World!!!
[ perf record: Woken up 1 times to write data ]
[ perf record: Captured and wrote 0.009 MB perf.data
$ perf report
# Overhead Command Shared Object Symbol
# ........ ....... ................. .................
76.67% perf perf [.] function2
16.67% perf perf [.] function1
6.67% perf [kernel.kallsyms] [k] do_page_fault

TM
External Use 23
Dynamic Analysis Tools – Valgrind
• Valgrind
− http://valgrind.org/
− Valgrind is an instrumentation framework for building dynamic analysis
tools
− Support for ARMv7
− A collection of tools for dynamic analysis:
Memcheck detects memory management problems
Cachegrind – a cache profiler
Massif – a heap profiler
Helgrind – thread debugger which finds data races in multithreaded programs
TM
External Use 24
Dynamic Analysis Tools – Valgrind (continued)
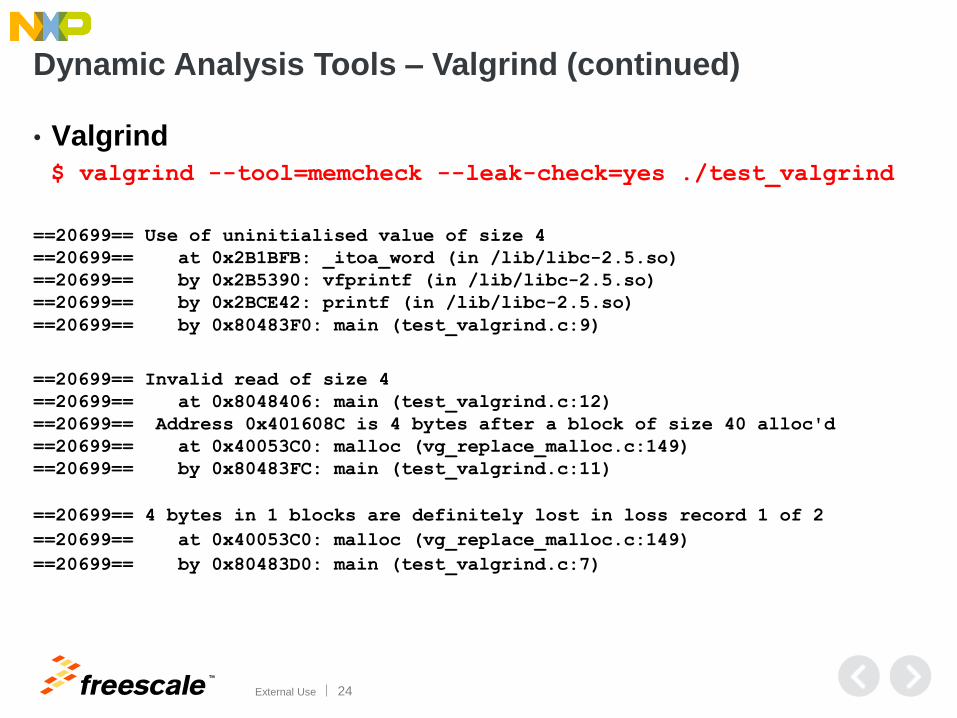
• Valgrind
$ valgrind --tool=memcheck --leak-check=yes ./test_valgrind
==20699== Use of uninitialised value of size 4
==20699== at 0x2B1BFB: _itoa_word (in /lib/libc-2.5.so)
==20699== by 0x2B5390: vfprintf (in /lib/libc-2.5.so)
==20699== by 0x2BCE42: printf (in /lib/libc-2.5.so)
==20699== by 0x80483F0: main (test_valgrind.c:9)
==20699== Invalid read of size 4
==20699== at 0x8048406: main (test_valgrind.c:12)
==20699== Address 0x401608C is 4 bytes after a block of size 40 alloc'd
==20699== at 0x40053C0: malloc (vg_replace_malloc.c:149)
==20699== by 0x80483FC: main (test_valgrind.c:11)
==20699== 4 bytes in 1 blocks are definitely lost in loss record 1 of 2
==20699== at 0x40053C0: malloc (vg_replace_malloc.c:149)
==20699== by 0x80483D0: main (test_valgrind.c:7)
TM
External Use 25
Agenda
• Open-source resources for ARM
• GDB – Gnu Debugger
• Eclipse CDT – C/C++ Integrated Development
Environment
• Dynamic analysis tools
• Eclipse Linux Tools
• Freescale extensions to open-source tools

TM
External Use 26
Eclipse Linux Tools
• Eclipse Linux Tools Project
− Linux Tools integrates Linux native tools
Profiling: perf, oprofile, GProf
Dynamic analysis tools: valgrind
Tracing : LTTng, SystemTap
Other: RPM, ChangeLog, Man Page, Gcov
• Installing Linux Tools Project
− Install into an existing Eclipse (p2 update)
http://download.eclipse.org/linuxtools/update
• The Linux Tools Project:
− Provides only the Eclipse like interfaces
− Eclipse Linux tools only use the native Linux command-line tools. These tools have to be also installed independently

TM
External Use 27
Eclipse Linux Tools - perf
• Perf
− Provides performance counters (cycles, instructions, cache-misses) per
task, per cpu, per workload and source-code event annotation
• Eclipse – one-click launch
− Right-click on the project->Profile As -> Profile with Perf
• Customized profiling – Profile configuration
− Perf options
− Perf event selection SW/HW: cycles, cache-misses, HW counters
• View the results
− Perf profile view

TM
External Use 28
Eclipse Linux Tools - valgrind
• Valgrind
− A collection of tools for dynamic
analysis
Memcheck detects memory
management problems
Cachegrind – a cache profiler
Massif – a heap profiler
Helgrind – thread debugger which finds
data races in multithreaded programs
− One-click launch and profile
configuration
− View the results

TM
External Use 29
Agenda
• Open-source resources for ARM
• GDB – Gnu Debugger
• Eclipse CDT – C/C++ Integrated Development
Environment
• Dynamic analysis tools
• Eclipse Linux Tools
• Freescale extensions to open-source tools

TM
External Use 30
Freescale Extensions - gdbproxy
gdb/gdbserver usage:
• Traditional use of GDB: gdbserver
for Linux Application debug
• Only Debug Linux User space
application debug
• Require Linux OS running on target
• Problems:
− How to debug bare-metal program
(no OS)
− How to debug Linux Kernel
− How to do low-levelboard bring-up
ARM
GDB GDB/MI
GDB CLI
(gdb) break main.c:10
(gdb) continue
Continuing.
gdbserver
Linux
TCP/IP
connection
TM
External Use 31
Freescale Extensions – gdbproxy (continued)
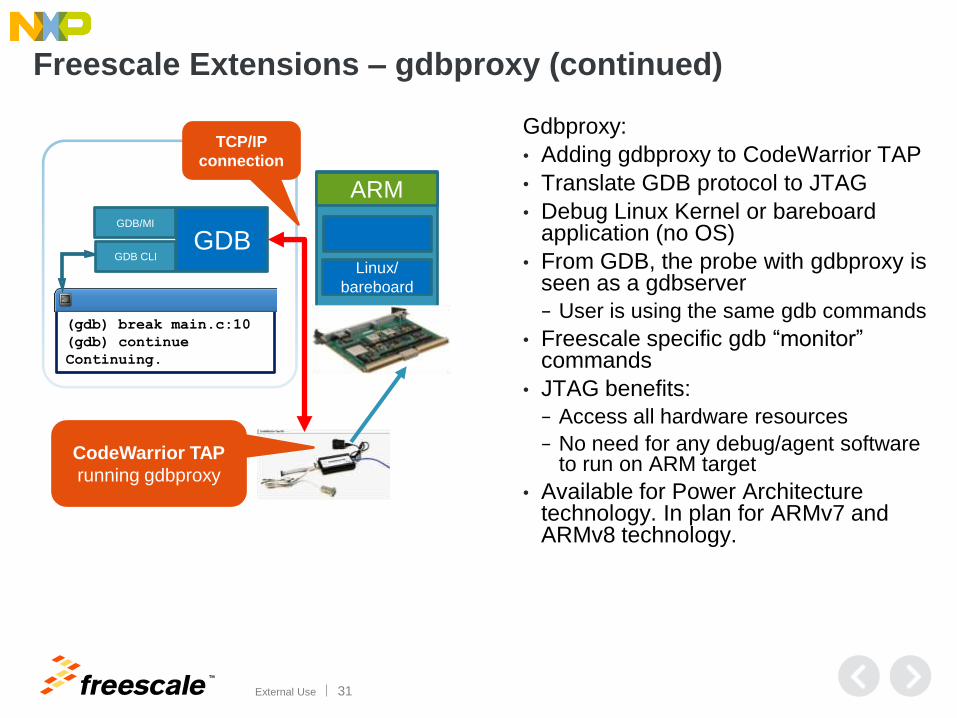
Gdbproxy:
• Adding gdbproxy to CodeWarrior TAP
• Translate GDB protocol to JTAG
• Debug Linux Kernel or bareboard application (no OS)
• From GDB, the probe with gdbproxy is seen as a gdbserver
− User is using the same gdb commands
• Freescale specific gdb “monitor” commands
• JTAG benefits:
− Access all hardware resources
− No need for any debug/agent software to run on ARM target
• Available for Power Architecture technology. In plan for ARMv7 and ARMv8 technology.
ARM
Linux/
bareboard
(gdb) break main.c:10
(gdb) continue
Continuing.
CodeWarrior TAP
running gdbproxy
GDB GDB/MI
GDB CLI
TCP/IP
connection

TM
External Use 32
Freescale Extensions – Eclipse Plug-in
• Extend CDT GDB solution with introspection into Freescale SoC
− Display register values for all SoC IP blocks
− Bit-level documentation of register values
− Cache viewer
• Enhance GDB JTAG debugging experience
− Auto-detection of Freescale SoC and generate GDB init scripts for
bare-metal debug
− Multicore bare-metal debug
TM
External Use 33
Freescale Extensions – Linux Kernel Awareness
• GDB has no specific awareness about debugging Linux Kernel
− Debug Linux Kernel as a simple bareboard application
• Freescale extensions for Linux Kernel Awareness
− Linux Kernel threads information
− Kernel modules list
− User friendly Linux Kernel module debugging
− Additional Linux Kernel system information
− Deep MMU understanding including page table entries

TM
External Use 34
Session Summary
• Get open-source tools to create an integrated development
solution
− The base is GDB
− The usability can be further improved by adding GUI – using Eclipse
− Optimization and fine tuning: using Dynamic analysis tools
− Adding a GUI user friendly visualization tool - Eclipse Linux Tools Project
− Adding Freescale extension to open source – extend capability set and
improve user experience

TM
External Use 35
Introducing The
QorIQ LS2 Family
Breakthrough,
software-defined
approach to advance
the world’s new
virtualized networks
New, high-performance architecture built with ease-of-use in mind Groundbreaking, flexible architecture that abstracts hardware complexity and
enables customers to focus their resources on innovation at the application level
Optimized for software-defined networking applications Balanced integration of CPU performance with network I/O and C-programmable
datapath acceleration that is right-sized (power/performance/cost) to deliver
advanced SoC technology for the SDN era
Extending the industry’s broadest portfolio of 64-bit multicore SoCs Built on the ARM® Cortex®-A57 architecture with integrated L2 switch enabling
interconnect and peripherals to provide a complete system-on-chip solution
TM
External Use 36
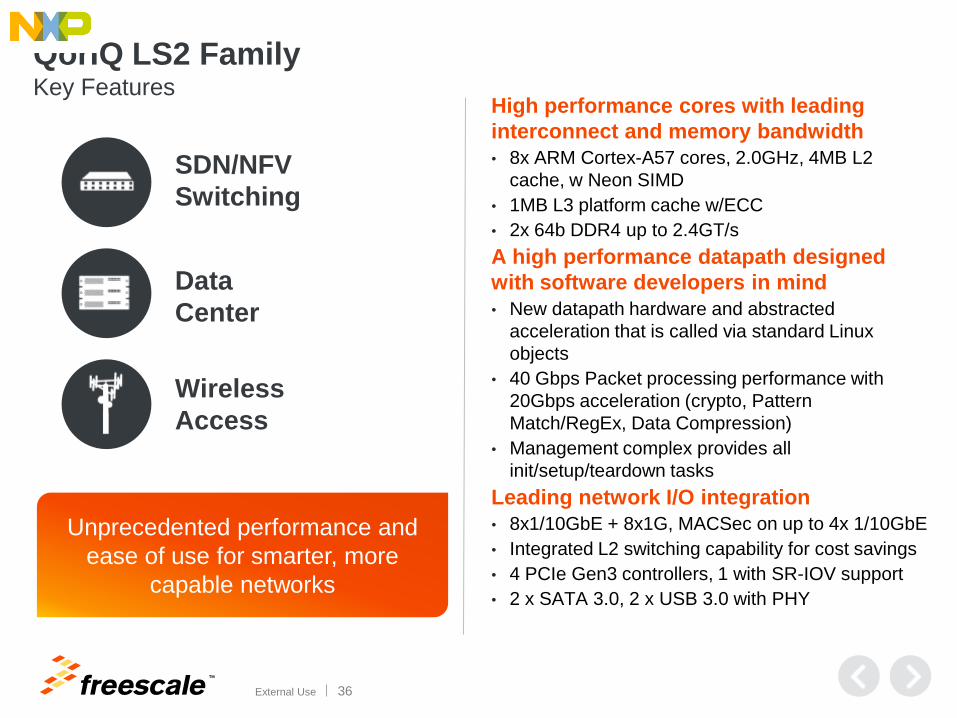
QorIQ LS2 Family Key Features
Unprecedented performance and
ease of use for smarter, more
capable networks
High performance cores with leading
interconnect and memory bandwidth
• 8x ARM Cortex-A57 cores, 2.0GHz, 4MB L2
cache, w Neon SIMD
• 1MB L3 platform cache w/ECC
• 2x 64b DDR4 up to 2.4GT/s
A high performance datapath designed
with software developers in mind
• New datapath hardware and abstracted
acceleration that is called via standard Linux
objects
• 40 Gbps Packet processing performance with
20Gbps acceleration (crypto, Pattern
Match/RegEx, Data Compression)
• Management complex provides all
init/setup/teardown tasks
Leading network I/O integration
• 8x1/10GbE + 8x1G, MACSec on up to 4x 1/10GbE
• Integrated L2 switching capability for cost savings
• 4 PCIe Gen3 controllers, 1 with SR-IOV support
• 2 x SATA 3.0, 2 x USB 3.0 with PHY
SDN/NFV
Switching
Data
Center
Wireless
Access

TM
External Use 37
See the LS2 Family First in the Tech Lab!
4 new demos built on QorIQ LS2 processors:
Performance Analysis Made Easy
Leave the Packet Processing To Us
Combining Ease of Use with Performance
Tools for Every Step of Your Design

TM
© 2014 Freescale Semiconductor, Inc. | External Use
www.Freescale.com