open source online geospatial interfaces to multiscale ... · open source online geospatial...
TRANSCRIPT
Open Source Online Geospatial Interfaces to Multiscale Indicators
Cesare Furlanello
With Giorgio Guzzetta, G. Allegri, A. Galea, and MPA Solutions
FBK, Trento, Italy
http://mpba.fbk.eu
Innovative Approaches to Turning Statistics into KnowledgeStockholm, 26 May 2008,
1
OUTLINE
1. FBK Interfaces for Visualizing Indicators• The MITRIS Integrated Monitoring System• The INTERSOS Humanitarian Response WebGIS
2. Reviewing the Technology Stack• Open Source Components• Integrating Spatial data and Statistical Indicators
3. Interacting with data, models, experts• Life Cycle: for Data and Models• Towards Collaborative Knowledge Discovery Processes
2
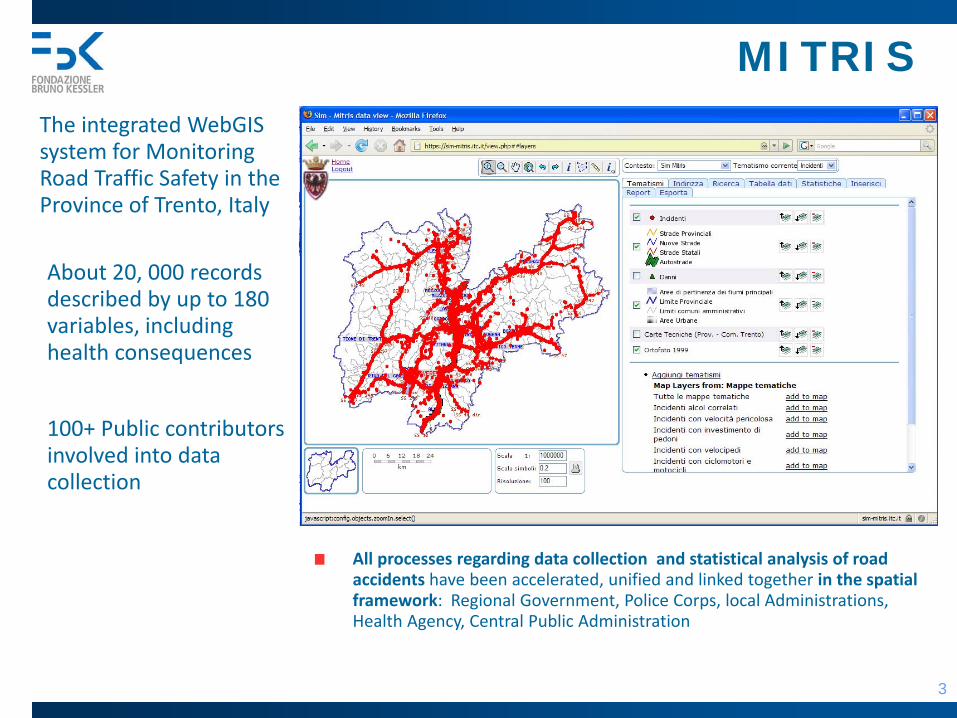
MITRIS
3
The integrated WebGIS system for Monitoring Road Traffic Safety in the Province of Trento, Italy
All processes regarding data collection and statistical analysis of road accidents have been accelerated, unified and linked together in the spatial framework: Regional Government, Police Corps, local Administrations, Health Agency, Central Public Administration
About 20, 000 records described by up to 180 variables, including health consequences
100+ Public contributors involved into data collection

RESULTS
4
1. The shared central data infrastructure supports one data collection and analysis process for Trentino (0.5 ML Inhab, 223 municipalities)
2. Tools for evaluating priorities, responsiveness, effectiveness of interventions: risk indicators
Standards and formats (XML, support of quality control, privacy issues)Provide ante-post analyses, maps, best practices, predictive methods, support to intervention for mitigationEstimate social/health costs corresponding to each critical location and then to risk patterns
A full open source solution, developed through 4 different national projects. Now being extended to Friuli-Venezia Giulia (region of 1.2 ML inh., 219 Municipalities)
5
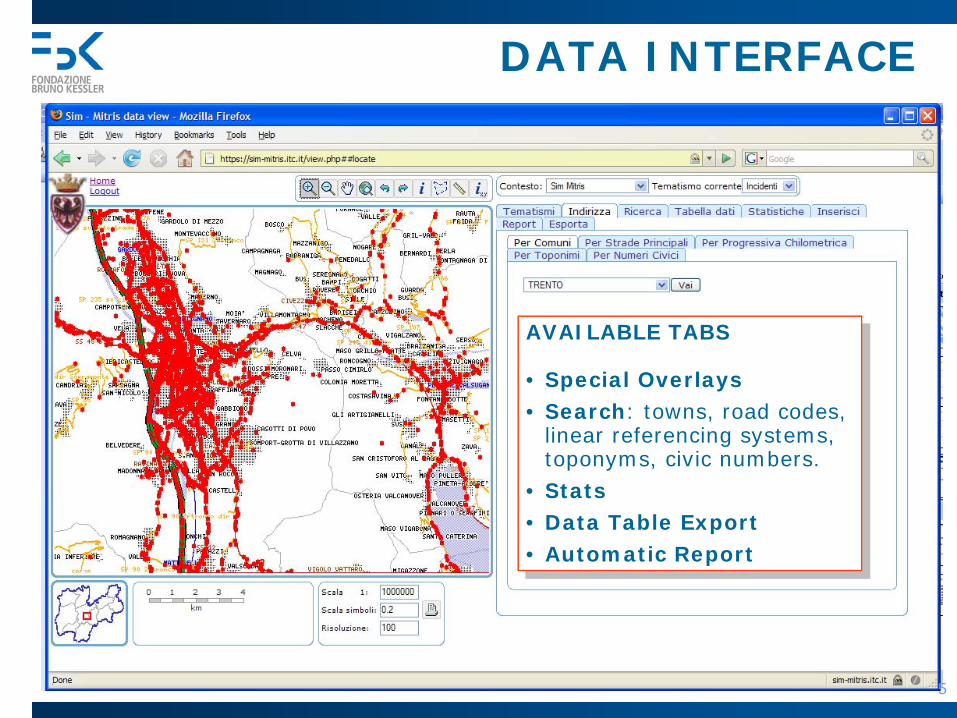
AVAILABLE TABS
• Special Overlays• Search: towns, road codes,
linear referencing systems, toponyms, civic numbers.
• Stats• Data Table Export• Automatic Report
DATA INTERFACE
5
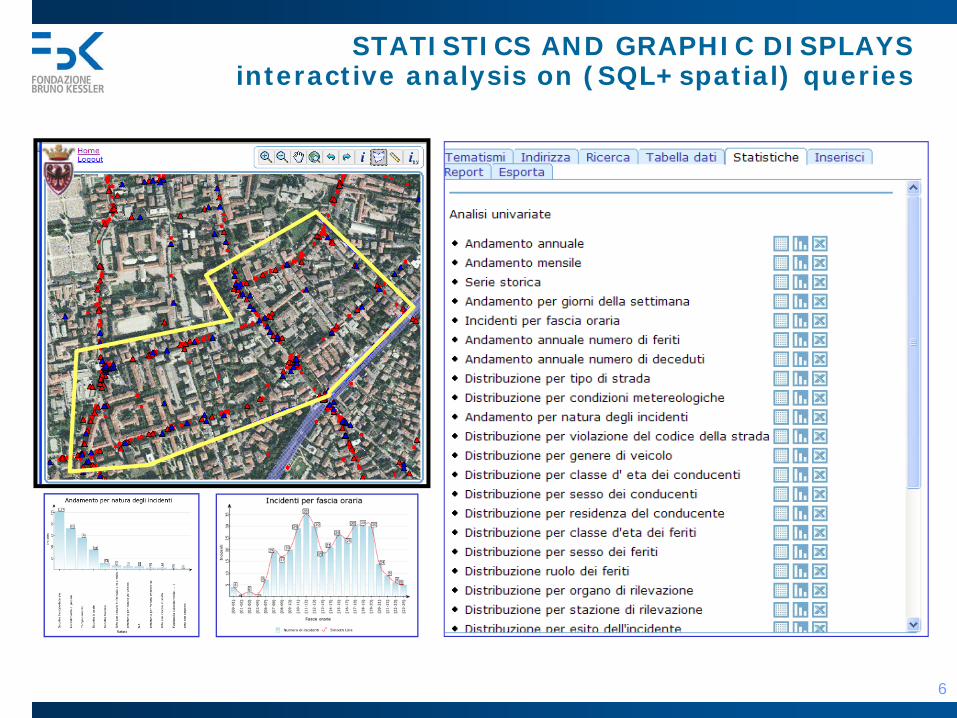
STATISTICS AND GRAPHIC DISPLAYSinteractive analysis on (SQL+spatial) queries
6
MITRIS-UNPSA2008 7
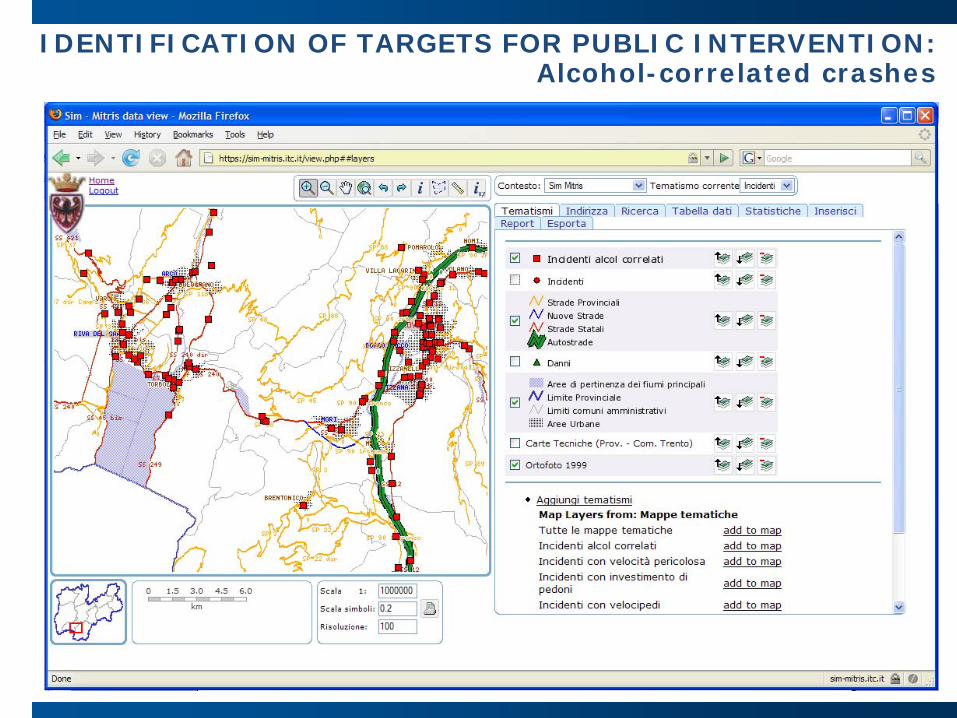
IDENTIFICATION OF TARGETS FOR PUBLIC INTERVENTION: Alcohol-correlated crashes

Results:Accident density mapmotor vehicle crash injuries, 2002/2003
Different risk density found as a function of driver residence (local vs non local).
Northern Garda lake area, (Resolution: 100m)
Crash density(acc/hm/year)
5
2.5
10
MITRIS – SISS 2005 – Riva del Garda
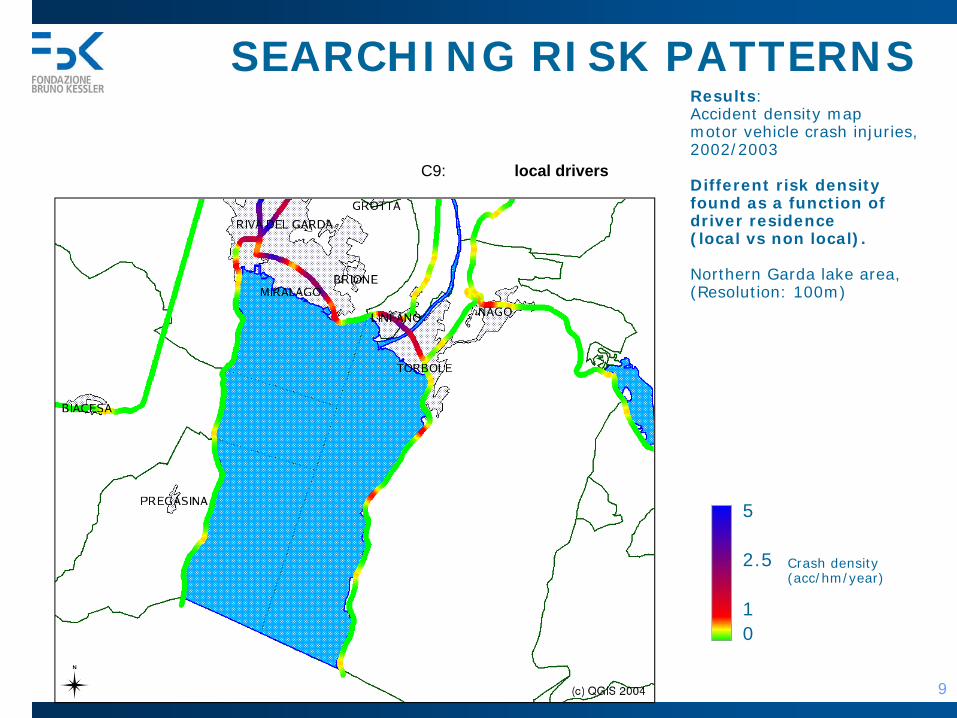
SEARCHING RISK PATTERNS
8
Non local drivers
C9: NON local drivers
Results:Accident density mapmotor vehicle crash injuries, 2002/2003
Different risk density found as a function of driver residence (local vs non local).
Northern Garda lake area, (Resolution: 100m)
Crash density(acc/hm/year)
5
2.5
10
MITRIS – SISS 2005 – Riva del Garda
SEARCHING RISK PATTERNS
9
Non local drivers
C9: local drivers
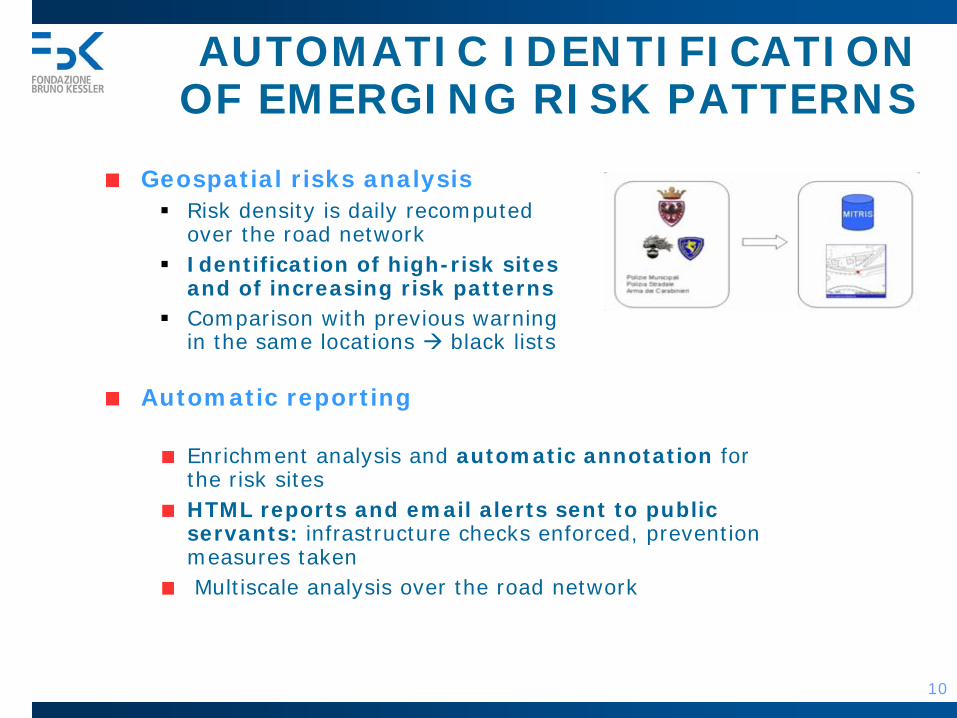
Geospatial risks analysisRisk density is daily recomputed over the road network Identification of high-risk sitesand of increasing risk patternsComparison with previous warning in the same locations black lists
Automatic reporting
Enrichment analysis and automatic annotation for the risk sitesHTML reports and email alerts sent to public servants: infrastructure checks enforced, prevention measures takenMultiscale analysis over the road network
AUTOMATIC IDENTIFICATIONOF EMERGING RISK PATTERNS
10
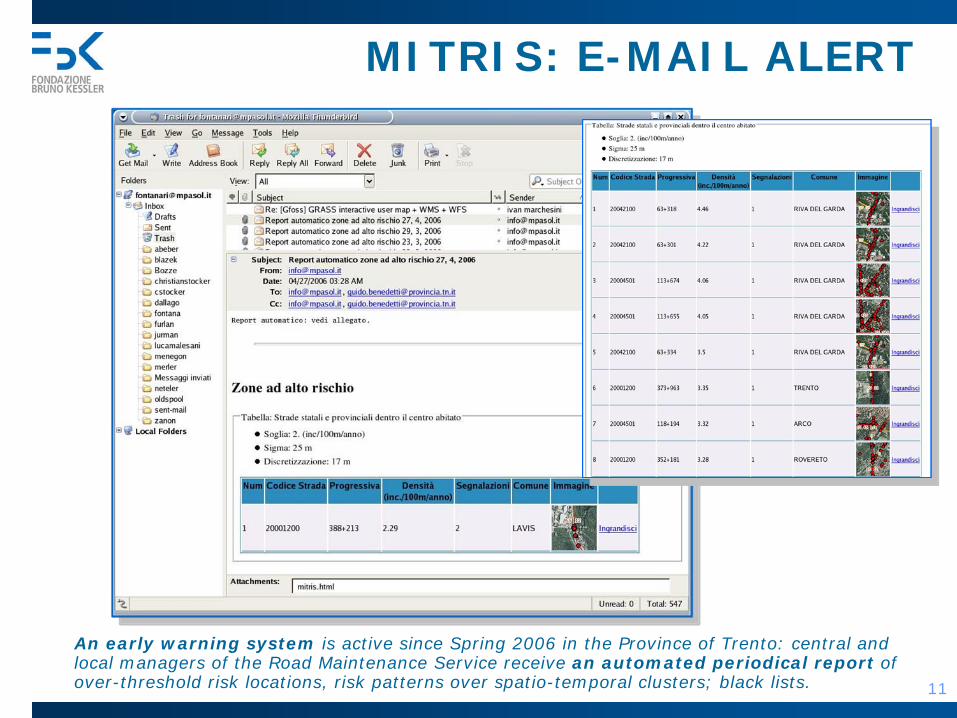
An early warning system is active since Spring 2006 in the Province of Trento: central and local managers of the Road Maintenance Service receive an automated periodical report of over-threshold risk locations, risk patterns over spatio-temporal clusters; black lists.
MITRIS: E-MAIL ALERT
11
THE INTERSOS HR-WEBGIS
12
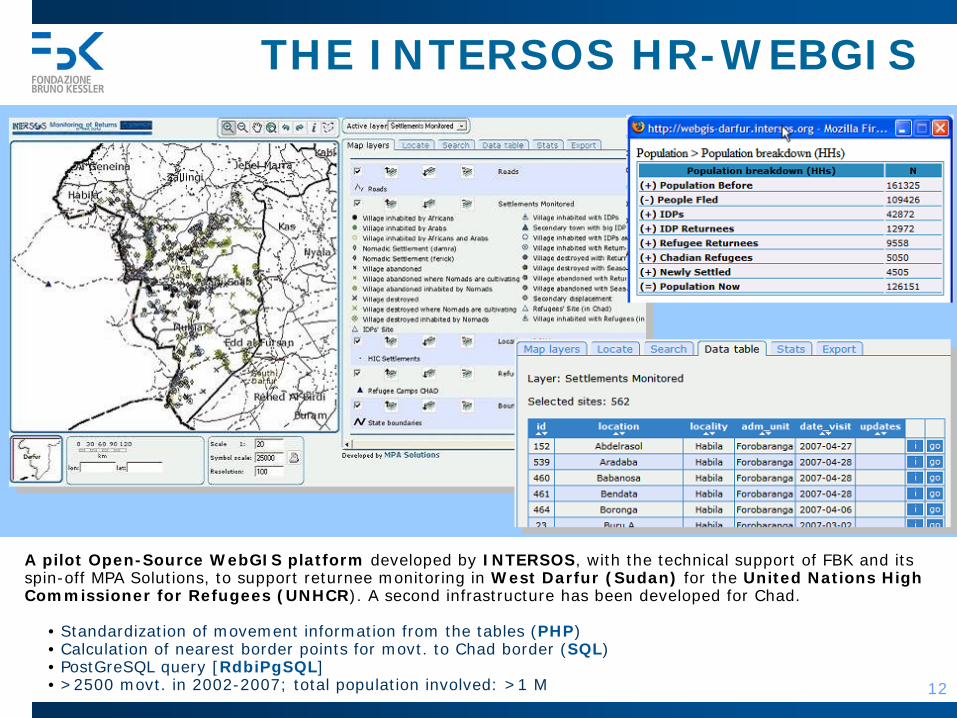
A pilot Open-Source WebGIS platform developed by INTERSOS, with the technical support of FBK and its spin-off MPA Solutions, to support returnee monitoring in West Darfur (Sudan) for the United Nations High Commissioner for Refugees (UNHCR). A second infrastructure has been developed for Chad.
• Standardization of movement information from the tables (PHP)• Calculation of nearest border points for movt. to Chad border (SQL)• PostGreSQL query [RdbiPgSQL]• >2500 movt. in 2002-2007; total population involved: >1 M
GAP FUNCTION IN THE WEBGIS
+
PL/R: integration of R functions within
PostgreSQL/PostGIS
RdbiPgSQL
spatstat
sp grass6
Gap analysis • maps• graphs• indicators• shapefiles
Data
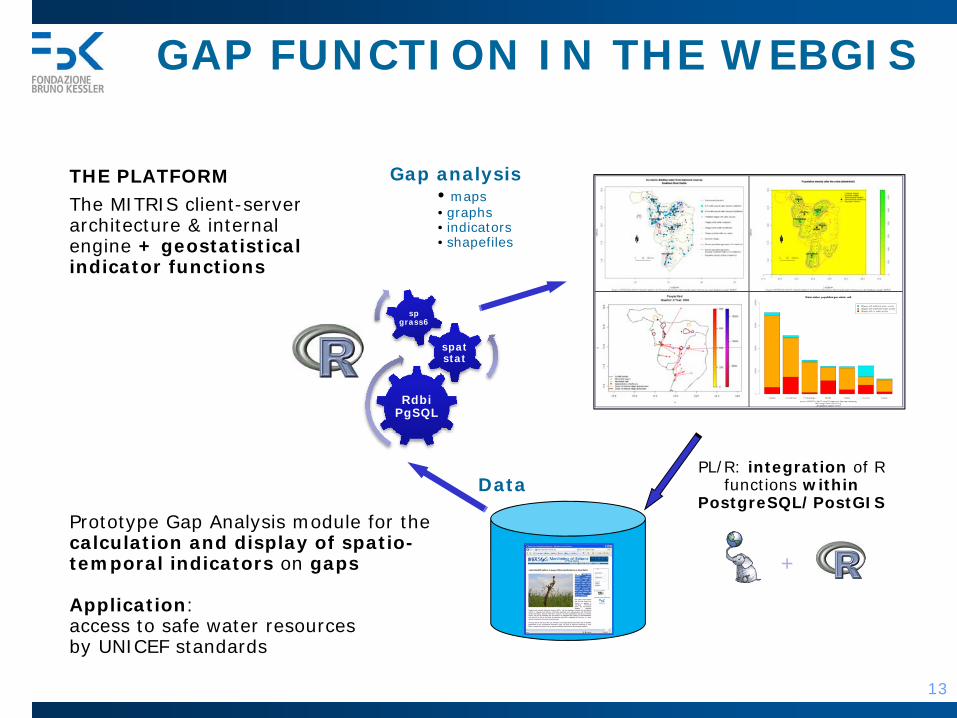
THE PLATFORM
The MITRIS client-server architecture & internal engine + geostatistical indicator functions
Prototype Gap Analysis module for the calculation and display of spatio-temporal indicators on gaps
Application: access to safe water resources by UNICEF standards
13
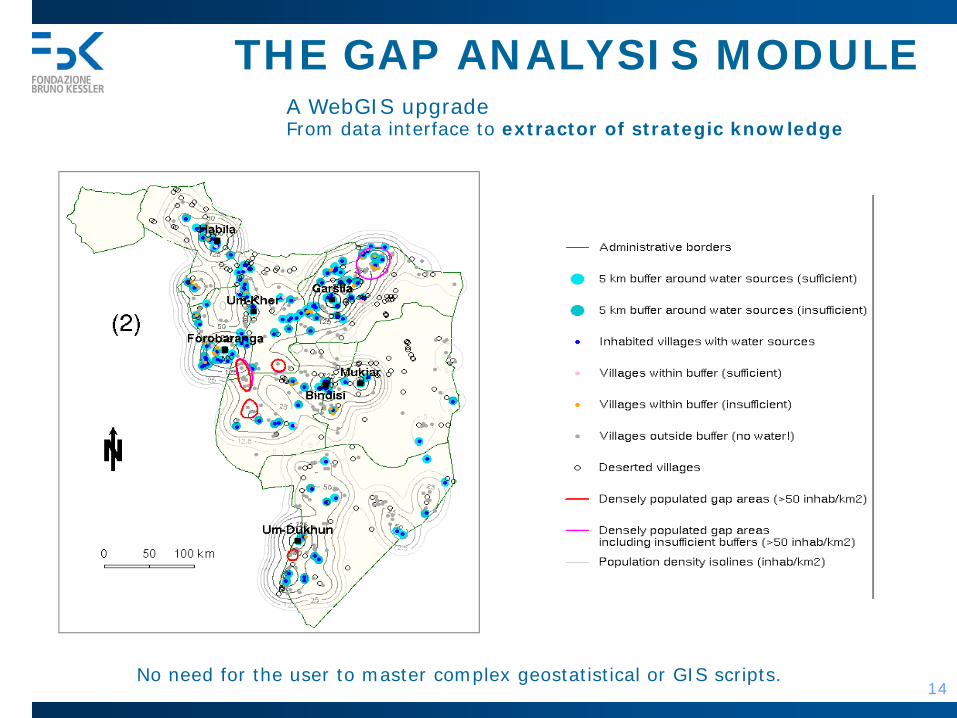
A WebGIS upgradeFrom data interface to extractor of strategic knowledge
No need for the user to master complex geostatistical or GIS scripts.
THE GAP ANALYSIS MODULE
14

• movt. with same destination and date + similar length and direction
• intensity of collapsed movt. (hhs involved): sum of simple movt.
• origin of collapsed movt.: average of origins weighted by intensity
• before-crisis population density isolines on abandoned or destroyed villages
• larrows from origin to destination of collapsed movements
• color related to movt. intensity
• double color scale: ordinary movt. vs. very intense extraordinary movt.
THE MOV-TRACKING MODULE
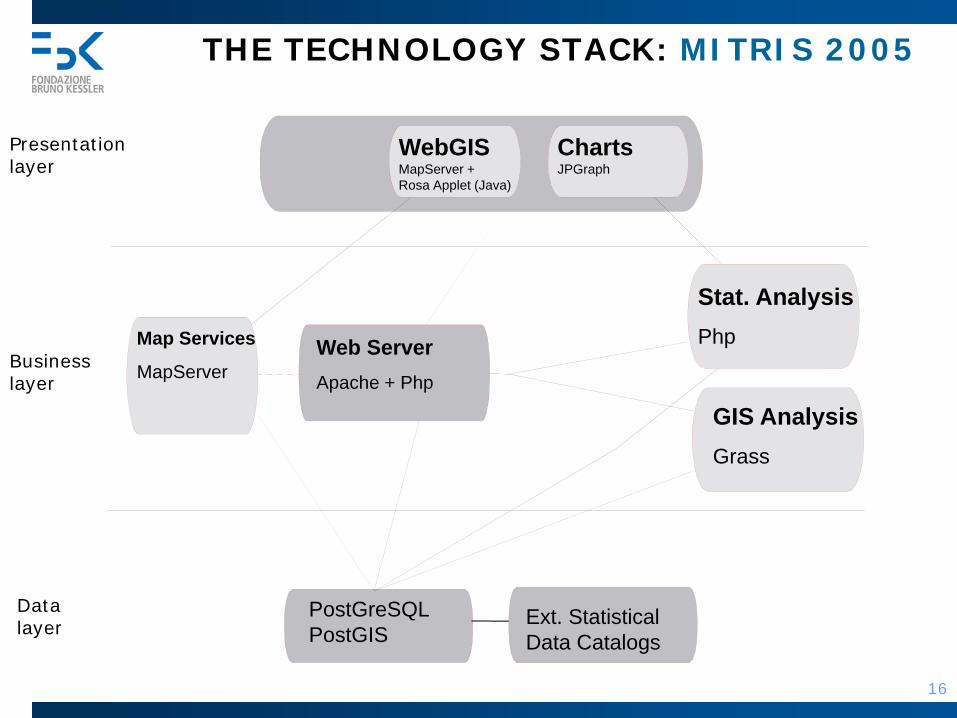
THE TECHNOLOGY STACK: MITRIS 2005
16
Presentation layer
Business layer
Data layer
WebGISMapServer + Rosa Applet (Java)
ChartsJPGraph
Map Services
MapServerWeb ServerApache + Php
Stat. AnalysisPhp
GIS AnalysisGrass
PostGreSQL PostGIS
Ext. StatisticalData Catalogs

THE TECHNOLOGY STACK: MITRIS 2007
17
Presentation layer
Business layer
Data layer
WebGISMapBuilderOpenLayers
ChartsPear + phpPlot
Map Services
MapServerWeb ServerApache + Php
Stat. AnalysisR + PL/R
GIS AnalysisGrass + Grass Server
PostGreSQL PostGIS
Ext. StatisticalData Catalogs
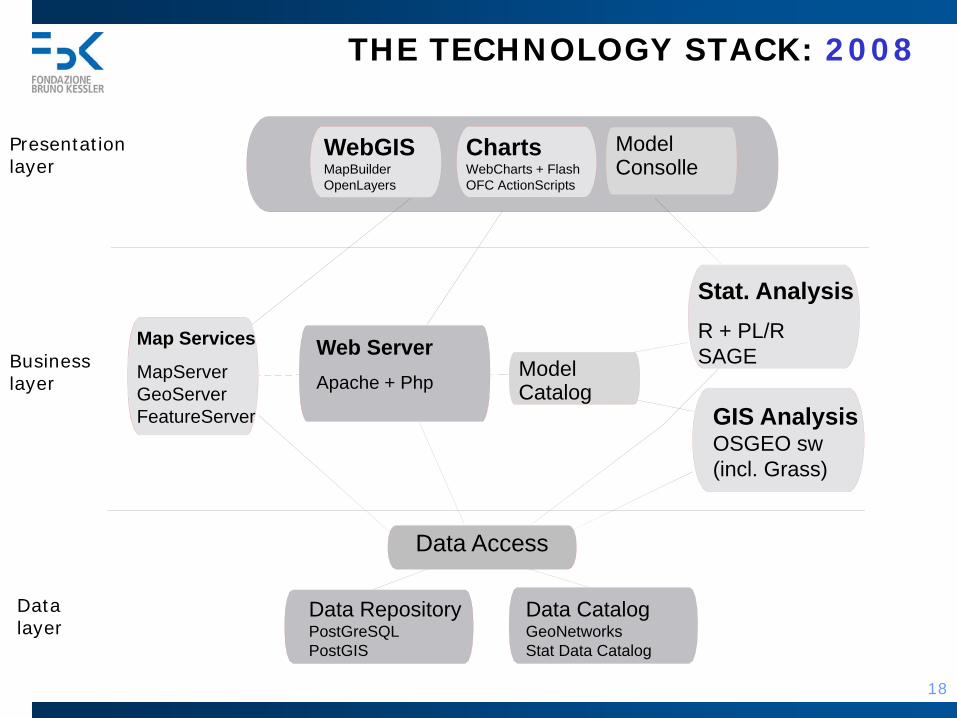
THE TECHNOLOGY STACK: 2008
18
Data Access
ModelCatalog
ModelConsolle
Presentation layer
Business layer
Data layer
WebGISMapBuilderOpenLayers
ChartsWebCharts + Flash OFC ActionScripts
Map Services
MapServerGeoServerFeatureServer
Web ServerApache + Php
Stat. AnalysisR + PL/RSAGE
Data Repository PostGreSQL PostGIS
Data CatalogGeoNetworksStat Data Catalog
GIS AnalysisOSGEO sw (incl. Grass)
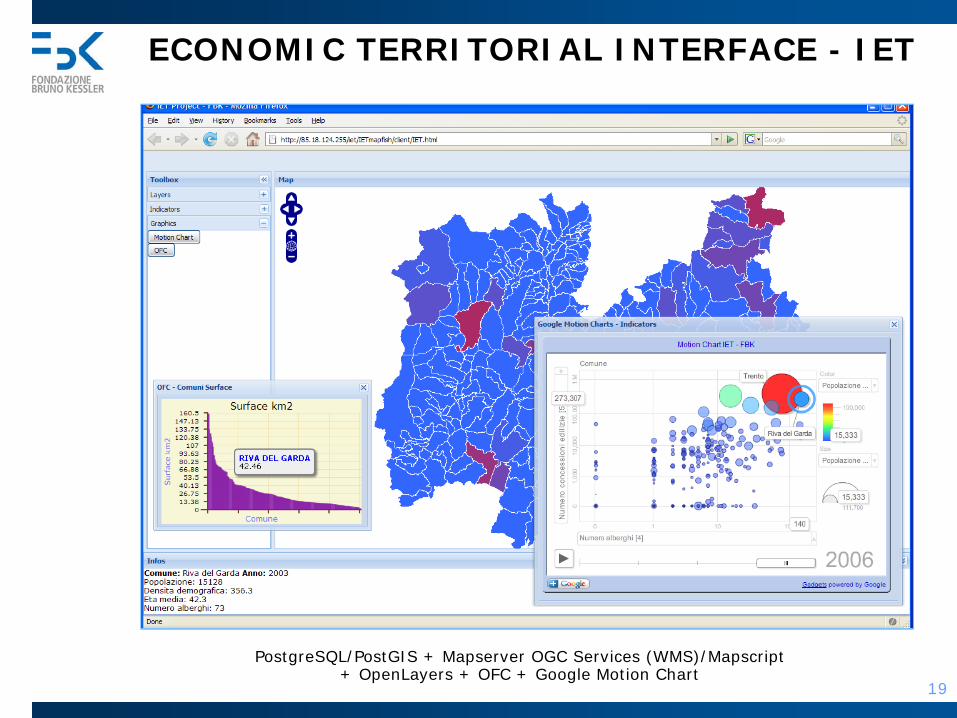
ECONOMIC TERRITORIAL INTERFACE - IET
PostgreSQL/PostGIS + Mapserver OGC Services (WMS)/Mapscript + OpenLayers + OFC + Google Motion Chart
19
Interacting with … ?
[From our experience with “vertical” WebGIS + ML solutions]
To promote a culture of evidence-based decision making, we not only need to provide access to statistics (the data, the tools), but also the skills on how to build knowledge from them.
The ‘laymen’ who want to transform statistics into knowledgecertainly need:
- easy access to data- intuitive visualization of data on charts and maps- technical instruments to interact with them
... but also (and more importantly):- A support to adequately implement all the steps of the
knowledge process
Because the tools of the Future Internet are accelerators, but cannot substitute a solid, possibly creative, collaborative process of knowledge building.
20

… with Models?
The process of knowledge creation requires building a model, typically by iteration. In a rough summary, the steps are:
• An initial curiosity, driven by a statistical question and then:
• Locating and retrieving the correct data• Preprocessing • Building a first model• Criticizing and falsifying• Refining the model• Validating
• Patterns in the data may be discovered starting from a first simpler model, leading to more complex knowledge.
21
Life Cycle
We need to maintain knowledge, support reuse, ensure replicability of the collective progress in using statistical data and technologies.
A. Understand Data Life Cycle in Data and Models
• Metadata support in SDMX and DDI, including support of capturing of metadata regarding researcher activity
• Workflows are being devised in other communities: scientific grid computing, bioinformatics, ecoinformatics(Kepler project). Not an easy concept.
B. Create a new concept of knowledge bases on the complete process of using data and technologies
• How to reuse and modify an existing model? Which modern solutions to share scientific scripting with the masses?
22
… with a community of experts?
A knowledge base of case studies is a good starting point but it is not enough.
Users need tools to interact with the experts providing support.
Examples:• Ticketing on a community of experts to obtain guidelines on the process to
solution of a problem• Appropriate consensus mechanisms to derive answers to ‘Frequently Asked
Questions’ related to progress indicator • Store, share and create a synthesis from questions and solutions by the
new generations of analysts. How to store and share enthusiasm for discovery?
Such an online interactive assistance system should be inspired to the first session of analysis that consultant specialists have with the ‘client’ in the early phases of a new study.
Web2.0: creating process of sociality, data sharing, opinionWeb2.5: creating structured processes of knowledge
23