opec o organization of the petroleum exporting countries ... · may 2010 feature article: promising...
TRANSCRIPT
May 2010
Feature Article:Promising but uneven recovery in the global economy
Oil market highlights
Feature article
Crude oil price movements
Commodity markets
Highlights of the world economy
World oil demand
World oil supply
Product markets and refinery operations
The tanker market
Oil trade
Stock movements
Balance of supply and demand
1
3
5
9
15
21
30
38
43
46
55
59
OPECOrganization of the Petroleum Exporting Countries
Monthly Oil Market Report
Tel +43 1 21112 Fax +43 1 2164320 E-mail: [email protected] Web site: www.opec.org
Data Summary OPECOrganization of the Petroleum Exporting Countries
Monthly Oil Market Report
Tel +43 1 21112 Fax +43 1 2164320 E-mail: [email protected] Web site: www.opec.org
Data Summary
Helferstorferstrasse 17, A-1010 Vienna, Austria

_________________________________________________________________________________________________________________________________________Monthly Oil Market Report
May 2010 1
Oil Market Highlights Optimism about the global economic recovery and higher oil demand expectations supported the oil market in April. The OPEC Reference Basket moved above $81/b in the second trading day of the month for the first time since January and then followed an upward trend to end the month to reach $84.13/b, the highest level since early October 2008. In monthly terms, the Basket averaged $82.33/b, for a gain of $5.12 or 6.6%. The oil market turned bearish in May amid concerns about the sovereign debt crisis in Greece with contagion risk and high oil inventories in the US. As a result, prices fell more than $10 over three days before recovering slightly to stand at $78.08/b on 10 May.
World economic growth is kept unchanged at 3.5% for 2010. While the US, Japan and China showed encouraging signs of a recovery, the Euro-zone has just managed to avoid a spillover of the sovereign debt crisis of Greece to other economies. OECD growth remains unchanged at 1.9%, as the US forecast was increased to 2.8% from 2.6% and the Euro-zone’s forecast was revised down to 0.6% from 0.7%. China is expected to grow by 9.5% in 2010 and India by 7.1%. The global economy is improving, but the challenges of sovereign debt in the developed countries, the ability of China to avoid overheating and persistently high unemployment levels need careful monitoring.
World oil demand estimate for 2009 remains broadly unchanged, showing a contraction of 1.5 mb/d. In 2010, global demand growth is expected at 0.9 mb/d, in line with the previous month’s forecast. Although the economic recovery shows signs of improving momentum, important risks remain that could impact demand growth expectations for this year. China has been among the main drivers behind oil demand growth so far this year, which should continue for the rest of the year despite the recent price increase in its gasoline and diesel retail sales by 4.5% and 5% respectively.
Non-OPEC oil supply is estimated to have increased by 0.7 mb/d in 2009, following an upward revision of 100 tb/d. The forecast for non-OPEC supply growth in 2010 was also revised 30 tb/d higher to stand at 0.5 mb/d. The adjustment was mainly due to the release of preliminary up-to-date data for actual production. OPEC NGLs and non-conventional oils are expected to average 4.9 mb/d in 2010, an increase of 0.5 mb/d over the previous year. In April, total OPEC crude production averaged 29.25 mb/d, an increase of 0.01 mb/d over the previous month.
Increased product demand in tandem with improving economic growth has overshadowed other bearish developments in the product markets, including the volcano eruption in Iceland and its negative impacts on the aviation industry and jet/fuel demand. This situation has also reinforced product market sentiment and lifted refining margins across the board, with the exception of Europe. Despite the recent improvement in refinery operations and margins, it appears that due to persisting inter-product imbalances and ample stocks of light products, the risk of a downward correction in refinery operations is very high. As a result, product markets are not likely to provide sufficient support for crude market fundamentals in the near future.
OPEC spot fixtures in April declined by 16.7% compared to the previous month. Sailings from OPEC were marginally higher and arrivals in the US gained 3.3%. In April, the tanker market experienced mixed movement with VLCC and Suezmax rates increasing, while Aframax decreased. Higher imports by major consumers supported the increase in rates, while tonnage availability affected the Aframax sector. Clean spot freight rates declined by 7.7% over the same period, mainly due to maintenance activities.
US commercial stocks rose by a considerable 24.2 mb in April driven by the build in products which increased by 19.5 mb, while crude stocks rose by 4.7 mb. Inventories now stand at around 90 mb above the five-year average. Japan’s commercial oil stocks increased by 4.0 mb in March, reversing the huge decline observed last month, but still remained below the historical norm. Demand for OPEC crude in 2009 is estimated at 29.0 mb/d, around 20 tb/d higher than in the previous report. This still represents a decline of 2.4 mb/d compared to the previous year. In 2010, demand for OPEC crude is expected to average 28.8 mb/d, about 40 tb/d more than in the previous assessment and a decline of around 0.1 mb/d from a year ago.

Monthly Oil Market Report_____________________________________________________________________
May 2010 2

_______________________________________________________________________________________________________________________________________________Monthly Oil Market Report
May 2010 3
Promising but uneven recovery in the global economy The recovery in the world economy appears to be continuing at a steady pace. Improvements have been
supported by private household consumption in the OECD, which have picked up again. US consumption – a major driver of global growth before the crisis – gained significant momentum, contributing almost 80% to US growth in the first quarter. This has raised hopes that the recovery is becoming more self-sustaining, with private household consumption returning as the main source of GDP growth.
The pace of the recovery differs significantly across the globe. The US economy has grown by 3.2% in the first quarter of 2010 and China posted double-digit growth of 11.9% GDP (see Graph 1). In contrast, growth in the Euro-zone has been flat in the last quarter of 2009 and there appears to be little prospect of an immediate improvement. And while improving, Japan is only growing in the low single digits as well. Several major challenges lie ahead that could slow any increase in momentum. These include sovereign debt levels in the developed countries, persistently high unemployment across the globe, the risk of inflated asset prices in China and uncertainties regarding reform of the financial sector. For a better assessment of the way ahead, it is worth considering these risks in more detail.
Graph 1: GDP growth in major regions, % Graph 2: WTI crude prices vs. Equity market
The combination of falling tax revenues and the massive fiscal stimulus has pushed sovereign debt to high levels, particularly in the developed countries. According to IMF estimates, gross debt to GDP ratios in the major OECD economies currently stand at 80% and could reach as high as 100% by 2014. The crisis in Greece demonstrates the extent of the challenge in the Euro-zone. While capital markets have reacted positively to the recently announced rescue package of up to €750 bn by the EU and the IMF, it remains to be seen whether these measures will be able to calm financial markets over the longer run.
High unemployment rates continue to be an important risk, particularly in the OECD. The OECD now expects the unemployment rate to stay at the current elevated levels for its countries. For the current year, the average unemployment rate in the OECD is forecast at 8.6%, before decreasing to 8.5% in 2011.
China continues to tighten its monetary policy. The reserve requirements for major banks were increased for the third time this year, up 50 basis points to stand at 17%. This has raised concerns that growth in China might decelerate more than expected, potentially leading to a sharp correction in asset prices. And finally, the ongoing debate on reforming the financial sector also provides a potential risk. Uncertainty about its outcome might put further pressure on financial markets, dampening sentiment and lending.
Concerns about these risks, along with the developing situation in Greece, have had some impact on financial markets. In the currency markets, the US$/euro exchange rate declined by 6% in the first week of May to $1.27/€, the lowest level in more than a year, before recovering to $1.30/€ following announcement of the rescue package. Equity markets, which have seen a remarkable recovery since bottoming out in March 2009, have also turned cautious. After gaining almost 10% this year, the S&P 500 now stands 8% below the recent peak (see Graph 2). The Shanghai Composite Index has also come under pressure and now stands around 20% below its peak last August.
The more cautious sentiment about the continued pace of the recovery has also been reflected in oil price volatility. US benchmark crude rose to more than $86/b, before falling more than $10 in three days. This strong volatility came despite the fact that crude fundamentals remain relatively unchanged and thus highlight the continued impact of financial market sentiment on crude oil prices.
Overall, the recent signs of improvement in the global economy have been encouraging. However, in light of current uncertainties, the forecast for global growth in 2010 has been left unchanged at 3.5%. In the meantime, OPEC will continue to closely monitor the market, awaiting further signs that the positive momentum is broadening across all major regions.
-20-15-10-505
101520
1Q08
2Q08
3Q08
4Q08
1Q09
2Q09
3Q09
4Q09
US Japan Eurozone China
1050107010901110113011501170119012101230
70727476788082848688
04 J
an
19 J
an
03 F
eb
18 F
eb
05 M
ar
20 M
ar
04 A
pr
19 A
pr
04 M
ay
Nymex WTI S&P 500 index
US$/b Index

Monthly Oil Market Report__________________________________________________________________________________________________________________________________________
4 May 2010
_________________________________________________________________________________________________________________________________________Monthly Oil Market Report
May 2010 5
Crude Oil Price Movements
OPEC Reference Basket OPEC Reference Basket rose $5.12 to average $82.33 in April
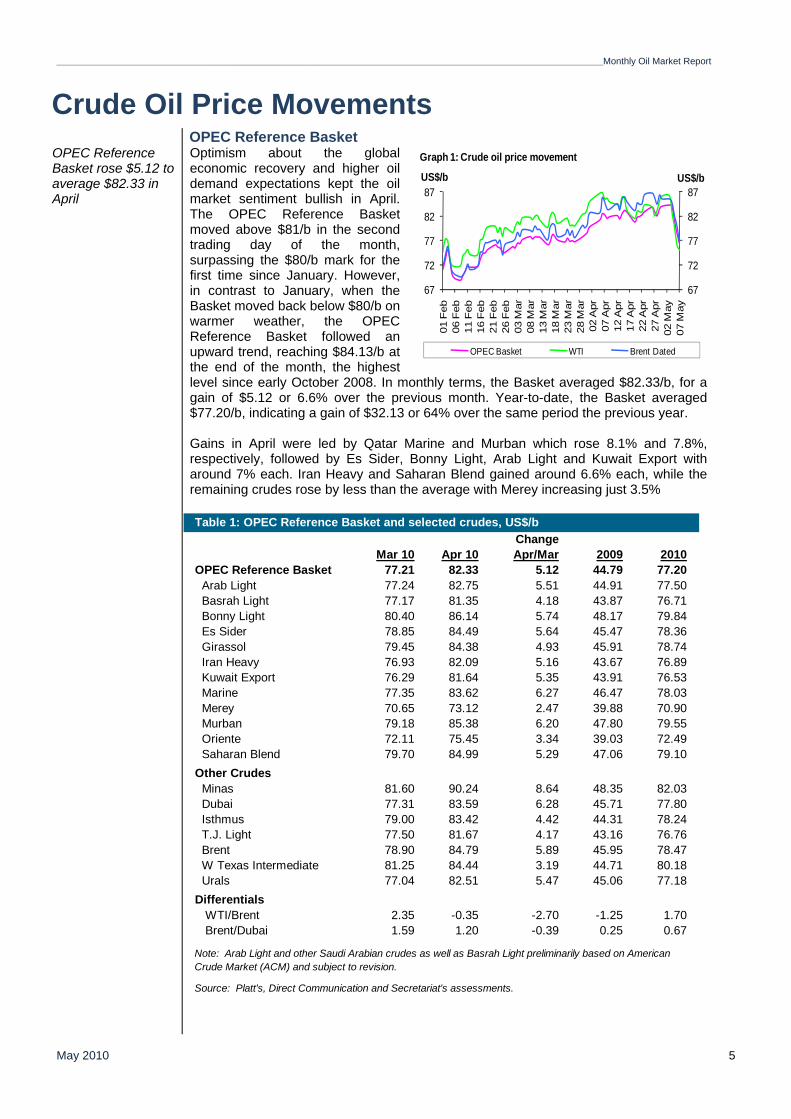
Optimism about the global economic recovery and higher oil demand expectations kept the oil market sentiment bullish in April. The OPEC Reference Basket moved above $81/b in the second trading day of the month, surpassing the $80/b mark for the first time since January. However, in contrast to January, when the Basket moved back below $80/b on warmer weather, the OPEC Reference Basket followed an upward trend, reaching $84.13/b at the end of the month, the highest level since early October 2008. In monthly terms, the Basket averaged $82.33/b, for a gain of $5.12 or 6.6% over the previous month. Year-to-date, the Basket averaged $77.20/b, indicating a gain of $32.13 or 64% over the same period the previous year. Gains in April were led by Qatar Marine and Murban which rose 8.1% and 7.8%, respectively, followed by Es Sider, Bonny Light, Arab Light and Kuwait Export with around 7% each. Iran Heavy and Saharan Blend gained around 6.6% each, while the remaining crudes rose by less than the average with Merey increasing just 3.5%
Table 1: OPEC Reference Basket and selected crudes, US$/bChange
Mar 10 Apr 10 Apr/Mar 2009 201077.21 82.33 5.12 44.79 77.20
Arab Light 77.24 82.75 5.51 44.91 77.50 Basrah Light 77.17 81.35 4.18 43.87 76.71 Bonny Light 80.40 86.14 5.74 48.17 79.84 Es Sider 78.85 84.49 5.64 45.47 78.36 Girassol 79.45 84.38 4.93 45.91 78.74 Iran Heavy 76.93 82.09 5.16 43.67 76.89 Kuwait Export 76.29 81.64 5.35 43.91 76.53 Marine 77.35 83.62 6.27 46.47 78.03 Merey 70.65 73.12 2.47 39.88 70.90 Murban 79.18 85.38 6.20 47.80 79.55 Oriente 72.11 75.45 3.34 39.03 72.49 Saharan Blend 79.70 84.99 5.29 47.06 79.10
Minas 81.60 90.24 8.64 48.35 82.0377.31 83.59 6.28 45.71 77.8079.00 83.42 4.42 44.31 78.2477.50 81.67 4.17 43.16 76.7678.90 84.79 5.89 45.95 78.4781.25 84.44 3.19 44.71 80.1877.04 82.51 5.47 45.06 77.18
Differentials WTI/Brent 2.35 -0.35 -2.70 -1.25 1.70
1.59 1.20 -0.39 0.25 0.67
Source: Platt's, Direct Communication and Secretariat's assessments.
Urals
Note: Arab Light and other Saudi Arabian crudes as well as Basrah Light preliminarily based on American Crude Market (ACM) and subject to revision.
OPEC Reference Basket
Brent/Dubai
T.J. Light Brent
Other Crudes
Dubai Isthmus
W Texas Intermediate
67
72
77
82
87
67
72
77
82
87
01 F
eb06
Feb
11 F
eb16
Feb
21 F
eb26
Feb
03 M
ar08
Mar
13 M
ar18
Mar
23 M
ar28
Mar
02 A
pr07
Apr
12 A
pr17
Apr
22 A
pr27
Apr
02 M
ay07
May
US$/bUS$/b
OPEC Basket WTI Brent Dated
Graph 1: Crude oil price movement
Monthly Oil Market Report_________________________________________________________________________________________________________________________________________
May 2010 6
The strong gain in Middle Eastern crudes compared to other crudes was attributed to the expectations of tightness in the market with stronger demand from Asia, partly after the return of some refiners from their seasonal maintenance, compared to the rest of the world and expected maintenance in the North Sea and Russia’s Sakhalin 1 Soko oil field. The surge in gasoil cracks also contributed to the strength in Middle East market crudes. However, weak fuel oil demand affected heavy sweet crudes. Although increasing, Brent-related crude prices were under pressure relative to Dated Brent due to the supply overhang, poor refining margins and limited arbitrage opportunities to US markets amid relatively weak demand and high inventories. The inverted WTI-Brent relationship, with Brent trading higher than WTI, limited arbitrage opportunities for Brent-related crudes, particularly Saharan Blend. In early May, the OPEC Reference Basket continued the upward trend to hit $84.36/b on 3 May. The oil market turned bearish amid concerns about the economic crisis and ample oil inventories in the US. As a result, prices fell more than $10 over three days before recovering to stand at $78.08/b on 10 May.
The oil futures market US benchmark crude rose on increased economic optimism, averaging $84.58/b in April
The oil market remained bullish in April with the Nymex WTI front-month increasing for the third consecutive month to average $84.58/b. This was the highest monthly average since September 2008 and the first time the WTI front-month contract settled constantly above $80/b during a whole month. The market continued to be supported by increasing optimism that the economic recovery would boost oil demand. This was despite current fundamentals remaining weak as oil inventories in OECD countries continued to hover at high levels. This could be seen in the US where commercial inventories rose further to stand at extremely high levels, particularly at the Nymex delivery point in Cushing, Oklahoma. Futures prices also continued to move in tandem with equity markets, which rebounded significantly in April. The bullish sentiment in the market was attributed to expectations of improving global economic recovery with the IMF revising up its forecast for 2010 from 3.9% to 4.2% and Chinese and Indian growth remaining strong. The bullishness was further underpinned by upward revisions to global oil demand by different institutions. The Brent futures crude contract also increased for the third consecutive month but at a higher pace than WTI to average $85.75/b, up $5.82 or 7.3% compared to $3.29 or 4.0% for WTI. The ICE Brent front-month contract ended the month at $87.44/b but continued higher to settle slightly below $89/b on 3 May. Concerns that Greece’s crisis might spread to other countries sent the WTI front month on Nymex to drop to around $75/b on 7 May before it recovered slightly to $76.80/b on 10 May, supported by the EU and IMF rescue packages to stabilise the Euro. Over the last week of April, WTI traded at a discount of $3.34/b to Brent. The shift from a premium to a discount was attributed to downward pressure from the surge in inventories at Cushing, Oklahoma, the delivery point for Nymex WTI, which again moved above 34 mb in mid-April, to hit a fresh record of more than 36 mb in the week ending 30 April. This was a repeat of last December and the first quarter of 2009, when WTI fell to a discount to Dated Brent. However, the weakness in WTI compared to Brent is less severe than in the first quarter 2009 when the discount moved above $10/b. The premium of Brent over WTI can also be attributed to a combination of lower supply in the North Sea due to field maintenance, strong Asian appetite for crude and weaker US demand due to refining maintenance and a high level of product inventories. Prices were also supported by trader activity with investments in crude oil continuing to rise. High amounts of liquidity and the expectations of a tighter market continued to encourage the use of crude oil as an asset class. The trading volume on the Nymex increased significantly in April to around 824,000 contracts per day compared to 575,000 contracts in March, a rise of 43%. It is worth mentioning that between 12 and 15 April, trade volume averaged 1.19 million contracts. Similarly, ICE Brent trade volume averaged 575,000 contracts in these 4 days compared to some 300,000
_________________________________________________________________________________________________________________________________________Monthly Oil Market Report
May 2010 7
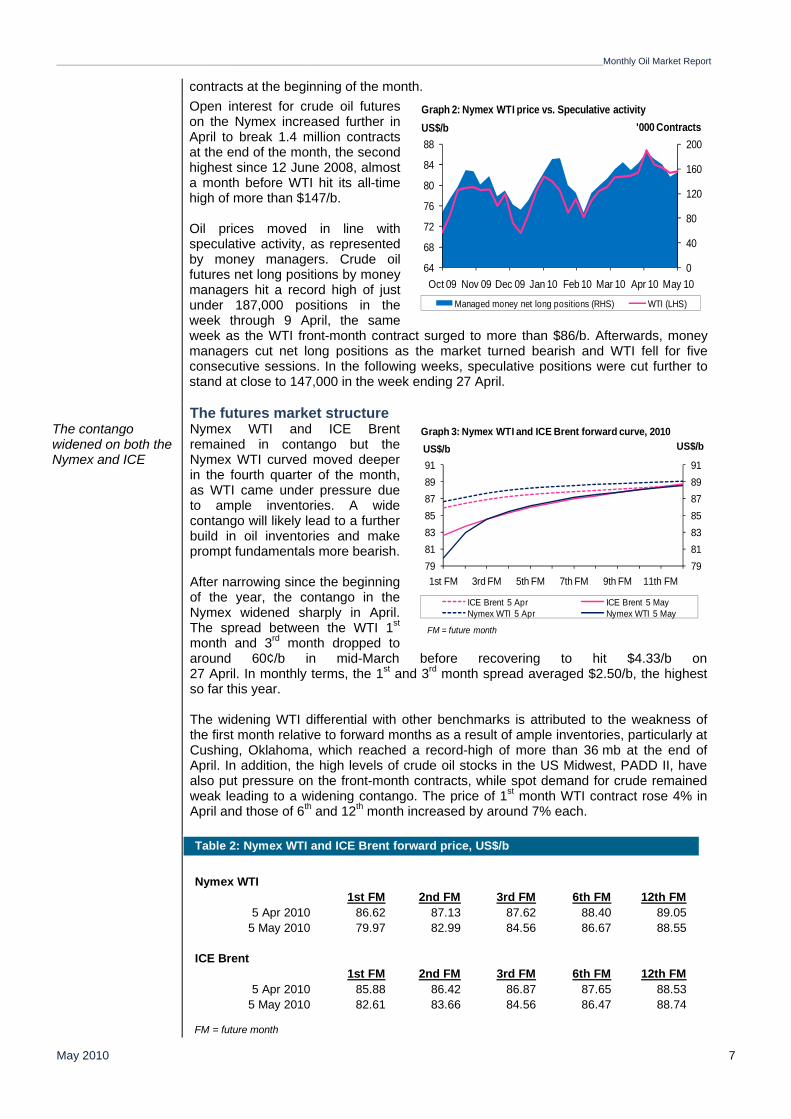
contracts at the beginning of the month. Open interest for crude oil futures
on the Nymex increased further in April to break 1.4 million contracts at the end of the month, the second highest since 12 June 2008, almost a month before WTI hit its all-time high of more than $147/b. Oil prices moved in line with speculative activity, as represented by money managers. Crude oil futures net long positions by money managers hit a record high of just under 187,000 positions in the week through 9 April, the same week as the WTI front-month contract surged to more than $86/b. Afterwards, money managers cut net long positions as the market turned bearish and WTI fell for five consecutive sessions. In the following weeks, speculative positions were cut further to stand at close to 147,000 in the week ending 27 April.
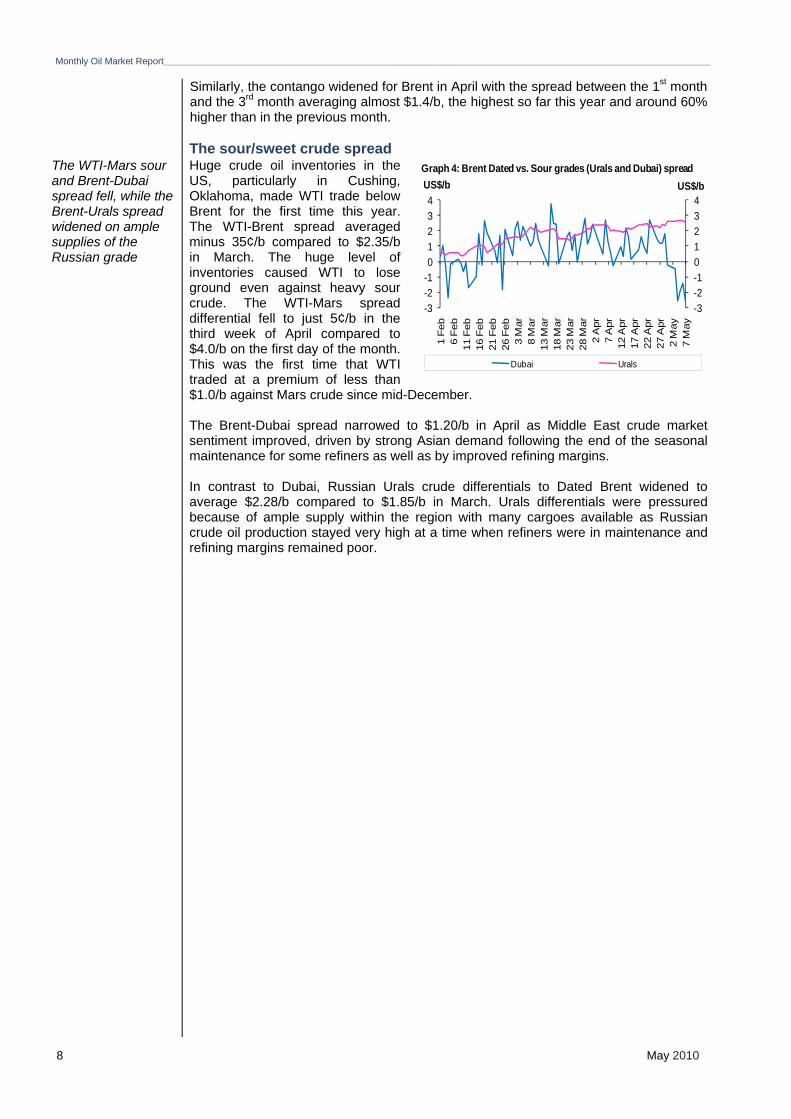
The futures market structure The contango widened on both the Nymex and ICE
Nymex WTI and ICE Brent remained in contango but the Nymex WTI curved moved deeper in the fourth quarter of the month, as WTI came under pressure due to ample inventories. A wide contango will likely lead to a further build in oil inventories and make prompt fundamentals more bearish. After narrowing since the beginning of the year, the contango in the Nymex widened sharply in April. The spread between the WTI 1st month and 3rd month dropped to around 60¢/b in mid-March before recovering to hit $4.33/b on 27 April. In monthly terms, the 1st and 3rd month spread averaged $2.50/b, the highest so far this year. The widening WTI differential with other benchmarks is attributed to the weakness of the first month relative to forward months as a result of ample inventories, particularly at Cushing, Oklahoma, which reached a record-high of more than 36 mb at the end of April. In addition, the high levels of crude oil stocks in the US Midwest, PADD II, have also put pressure on the front-month contracts, while spot demand for crude remained weak leading to a widening contango. The price of 1st month WTI contract rose 4% in April and those of 6th and 12th month increased by around 7% each.
Table 2: Nymex WTI and ICE Brent forward price, US$/b
Nymex WTI 1st FM 2nd FM 3rd FM 6th FM 12th FM
5 Apr 2010 86.62 87.13 87.62 88.40 89.055 May 2010 79.97 82.99 84.56 86.67 88.55
ICE Brent1st FM 2nd FM 3rd FM 6th FM 12th FM
5 Apr 2010 85.88 86.42 86.87 87.65 88.535 May 2010 82.61 83.66 84.56 86.47 88.74
FM = future month
0
40
80
120
160
200
64
68
72
76
80
84
88
Oct 09 Nov 09 Dec 09 Jan 10 Feb 10 Mar 10 Apr 10 May 10
Managed money net long positions (RHS) WTI (LHS)
'000 ContractsUS$/bGraph 2: Nymex WTI price vs. Speculative activity
79818385878991
79818385878991
1st FM 3rd FM 5th FM 7th FM 9th FM 11th FM
US$/bUS$/b
ICE Brent 5 Apr ICE Brent 5 MayNymex WTI 5 Apr Nymex WTI 5 May
Graph 3: Nymex WTI and ICE Brent forward curve, 2010
FM = future month
Monthly Oil Market Report_________________________________________________________________________________________________________________________________________
May 2010 8
Similarly, the contango widened for Brent in April with the spread between the 1st month and the 3rd month averaging almost $1.4/b, the highest so far this year and around 60% higher than in the previous month.
The sour/sweet crude spread The WTI-Mars sour and Brent-Dubai spread fell, while the Brent-Urals spread widened on ample supplies of the Russian grade
Huge crude oil inventories in the US, particularly in Cushing, Oklahoma, made WTI trade below Brent for the first time this year. The WTI-Brent spread averaged minus 35¢/b compared to $2.35/b in March. The huge level of inventories caused WTI to lose ground even against heavy sour crude. The WTI-Mars spread differential fell to just 5¢/b in the third week of April compared to $4.0/b on the first day of the month. This was the first time that WTI traded at a premium of less than $1.0/b against Mars crude since mid-December. The Brent-Dubai spread narrowed to $1.20/b in April as Middle East crude market sentiment improved, driven by strong Asian demand following the end of the seasonal maintenance for some refiners as well as by improved refining margins. In contrast to Dubai, Russian Urals crude differentials to Dated Brent widened to average $2.28/b compared to $1.85/b in March. Urals differentials were pressured because of ample supply within the region with many cargoes available as Russian crude oil production stayed very high at a time when refiners were in maintenance and refining margins remained poor.
-3-2-101234
-3-2-101234
1 F
eb6
Feb
11 F
eb16
Feb
21 F
eb26
Feb
3 M
ar8
Mar
13 M
ar18
Mar
23 M
ar28
Mar
2 A
pr7
Apr
12 A
pr17
Apr
22 A
pr27
Apr
2 M
ay7
May
US$/bUS$/b
Dubai Urals
Graph 4: Brent Dated vs. Sour grades (Urals and Dubai) spread
_________________________________________________________________________________________________________________________________________Monthly Oil Market Report
May 2010 9
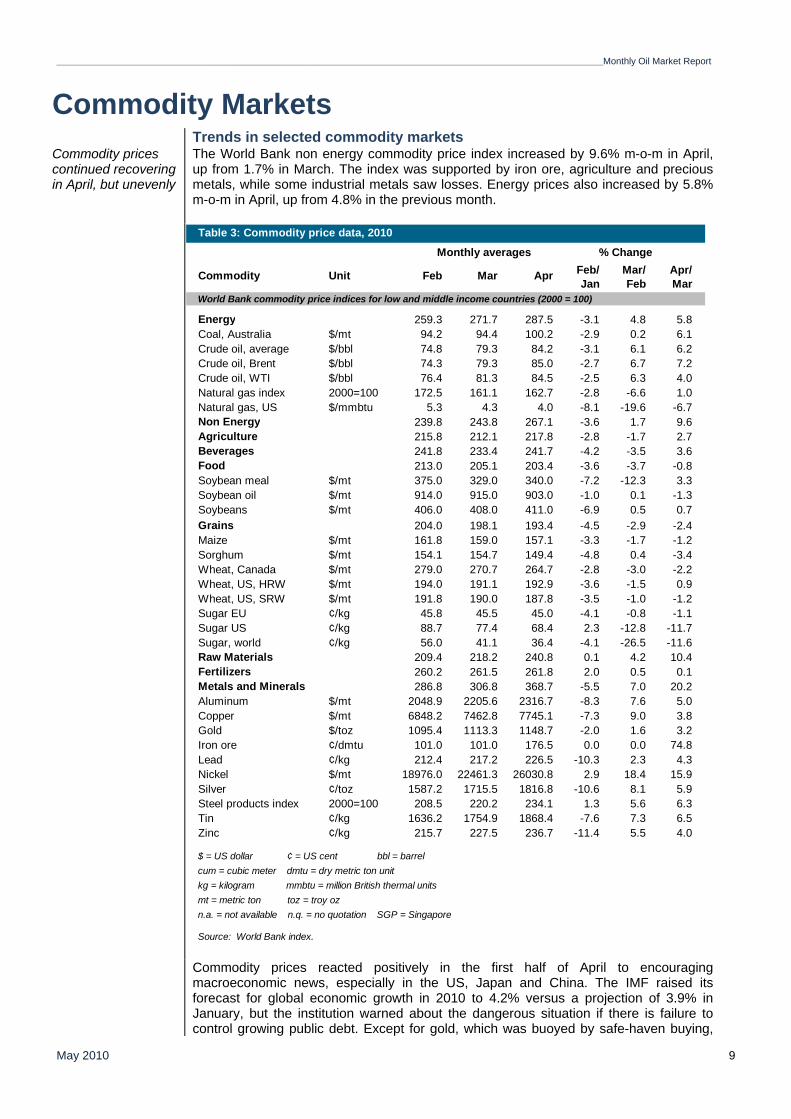
Commodity Markets Trends in selected commodity markets Commodity prices continued recovering in April, but unevenly
The World Bank non energy commodity price index increased by 9.6% m-o-m in April, up from 1.7% in March. The index was supported by iron ore, agriculture and precious metals, while some industrial metals saw losses. Energy prices also increased by 5.8% m-o-m in April, up from 4.8% in the previous month.
Commodity prices reacted positively in the first half of April to encouraging macroeconomic news, especially in the US, Japan and China. The IMF raised its forecast for global economic growth in 2010 to 4.2% versus a projection of 3.9% in January, but the institution warned about the dangerous situation if there is failure to control growing public debt. Except for gold, which was buoyed by safe-haven buying,
Monthly averagesFeb/ Mar/ Apr/Jan Feb Mar
Energy 259.3 271.7 287.5 -3.1 4.8 5.8Coal, Australia $/mt 94.2 94.4 100.2 -2.9 0.2 6.1Crude oil, average $/bbl 74.8 79.3 84.2 -3.1 6.1 6.2Crude oil, Brent $/bbl 74.3 79.3 85.0 -2.7 6.7 7.2Crude oil, WTI $/bbl 76.4 81.3 84.5 -2.5 6.3 4.0Natural gas index 2000=100 172.5 161.1 162.7 -2.8 -6.6 1.0Natural gas, US $/mmbtu 5.3 4.3 4.0 -8.1 -19.6 -6.7Non Energy 239.8 243.8 267.1 -3.6 1.7 9.6Agriculture 215.8 212.1 217.8 -2.8 -1.7 2.7Beverages 241.8 233.4 241.7 -4.2 -3.5 3.6Food 213.0 205.1 203.4 -3.6 -3.7 -0.8Soybean meal $/mt 375.0 329.0 340.0 -7.2 -12.3 3.3Soybean oil $/mt 914.0 915.0 903.0 -1.0 0.1 -1.3Soybeans $/mt 406.0 408.0 411.0 -6.9 0.5 0.7Grains 204.0 198.1 193.4 -4.5 -2.9 -2.4Maize $/mt 161.8 159.0 157.1 -3.3 -1.7 -1.2Sorghum $/mt 154.1 154.7 149.4 -4.8 0.4 -3.4Wheat, Canada $/mt 279.0 270.7 264.7 -2.8 -3.0 -2.2Wheat, US, HRW $/mt 194.0 191.1 192.9 -3.6 -1.5 0.9Wheat, US, SRW $/mt 191.8 190.0 187.8 -3.5 -1.0 -1.2Sugar EU ¢/kg 45.8 45.5 45.0 -4.1 -0.8 -1.1Sugar US ¢/kg 88.7 77.4 68.4 2.3 -12.8 -11.7Sugar, world ¢/kg 56.0 41.1 36.4 -4.1 -26.5 -11.6Raw Materials 209.4 218.2 240.8 0.1 4.2 10.4Fertilizers 260.2 261.5 261.8 2.0 0.5 0.1Metals and Minerals 286.8 306.8 368.7 -5.5 7.0 20.2Aluminum $/mt 2048.9 2205.6 2316.7 -8.3 7.6 5.0Copper $/mt 6848.2 7462.8 7745.1 -7.3 9.0 3.8Gold $/toz 1095.4 1113.3 1148.7 -2.0 1.6 3.2Iron ore ¢/dmtu 101.0 101.0 176.5 0.0 0.0 74.8Lead ¢/kg 212.4 217.2 226.5 -10.3 2.3 4.3Nickel $/mt 18976.0 22461.3 26030.8 2.9 18.4 15.9Silver ¢/toz 1587.2 1715.5 1816.8 -10.6 8.1 5.9Steel products index 2000=100 208.5 220.2 234.1 1.3 5.6 6.3Tin ¢/kg 1636.2 1754.9 1868.4 -7.6 7.3 6.5Zinc ¢/kg 215.7 227.5 236.7 -11.4 5.5 4.0
$ = US dollar ¢ = US cent bbl = barrel cum = cubic meter dmtu = dry metric ton unit kg = kilogram mmbtu = million British thermal units mt = metric ton toz = troy oz n.a. = not available n.q. = no quotation SGP = Singapore
Source: World Bank index.
% Change
World Bank commodity price indices for low and middle income countries (2000 = 100)
Table 3: Commodity price data, 2010
Feb Mar AprUnitCommodity
Monthly Oil Market Report_________________________________________________________________________________________________________________________________________
May 2010 10
commodity prices experienced a sharp drop in the last week of April due to the risk reduction in the financial markets, following the outbreak of Greece’s debt crisis and the possible spill-over effect to Portugal, Spain and even Italy. Rating agencies’ downgrades to Greece, Portugal and Spain’s sovereign debt were reflected in heavy selling pressure, especially for industrial metals. China’s third tightening of the monetary base in a year triggered an immediate negative reaction in the commodity markets. In addition, the flux in the foreign exchange markets and a stronger dollar added to the bearish market sentiment.
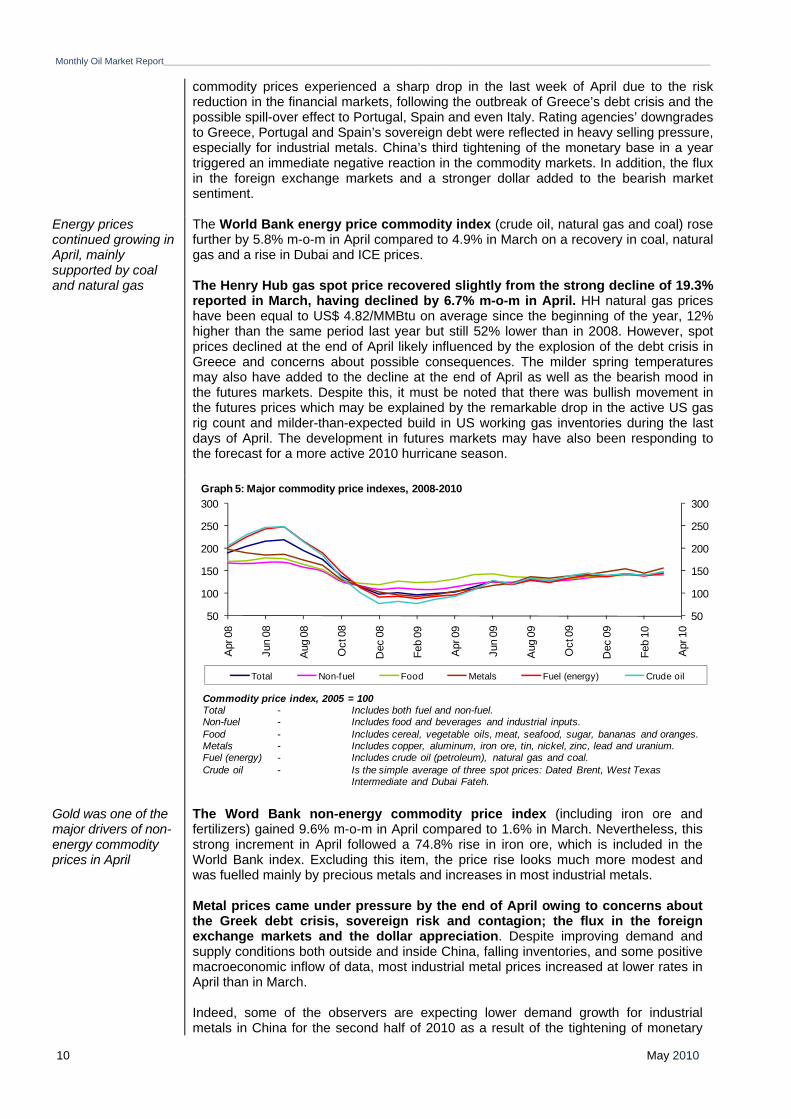
Energy prices continued growing in April, mainly supported by coal and natural gas
The World Bank energy price commodity index (crude oil, natural gas and coal) rose further by 5.8% m-o-m in April compared to 4.9% in March on a recovery in coal, natural gas and a rise in Dubai and ICE prices. The Henry Hub gas spot price recovered slightly from the strong decline of 19.3% reported in March, having declined by 6.7% m-o-m in April. HH natural gas prices have been equal to US$ 4.82/MMBtu on average since the beginning of the year, 12% higher than the same period last year but still 52% lower than in 2008. However, spot prices declined at the end of April likely influenced by the explosion of the debt crisis in Greece and concerns about possible consequences. The milder spring temperatures may also have added to the decline at the end of April as well as the bearish mood in the futures markets. Despite this, it must be noted that there was bullish movement in the futures prices which may be explained by the remarkable drop in the active US gas rig count and milder-than-expected build in US working gas inventories during the last days of April. The development in futures markets may have also been responding to the forecast for a more active 2010 hurricane season.
Gold was one of the major drivers of non-energy commodity prices in April
The Word Bank non-energy commodity price index (including iron ore and fertilizers) gained 9.6% m-o-m in April compared to 1.6% in March. Nevertheless, this strong increment in April followed a 74.8% rise in iron ore, which is included in the World Bank index. Excluding this item, the price rise looks much more modest and was fuelled mainly by precious metals and increases in most industrial metals. Metal prices came under pressure by the end of April owing to concerns about the Greek debt crisis, sovereign risk and contagion; the flux in the foreign exchange markets and the dollar appreciation. Despite improving demand and supply conditions both outside and inside China, falling inventories, and some positive macroeconomic inflow of data, most industrial metal prices increased at lower rates in April than in March. Indeed, some of the observers are expecting lower demand growth for industrial metals in China for the second half of 2010 as a result of the tightening of monetary
50
100
150
200
250
300
50
100
150
200
250
300
Apr
08
Jun
08
Aug
08
Oct
08
Dec
08
Feb
09
Apr
09
Jun
09
Aug
09
Oct
09
Dec
09
Feb
10
Apr
10
Total Non-fuel Food Metals Fuel (energy) Crude oil
Graph 5: Major commodity price indexes, 2008-2010
Commodity price index, 2005 = 100Total - Includes both fuel and non-fuel.Non-fuel - Includes food and beverages and industrial inputs.Food - Includes cereal, vegetable oils, meat, seafood, sugar, bananas and oranges.Metals - Includes copper, aluminum, iron ore, tin, nickel, zinc, lead and uranium.Fuel (energy) - Includes crude oil (petroleum), natural gas and coal.Crude oil - Is the simple average of three spot prices: Dated Brent, West Texas
Intermediate and Dubai Fateh.
_________________________________________________________________________________________________________________________________________Monthly Oil Market Report
May 2010 11
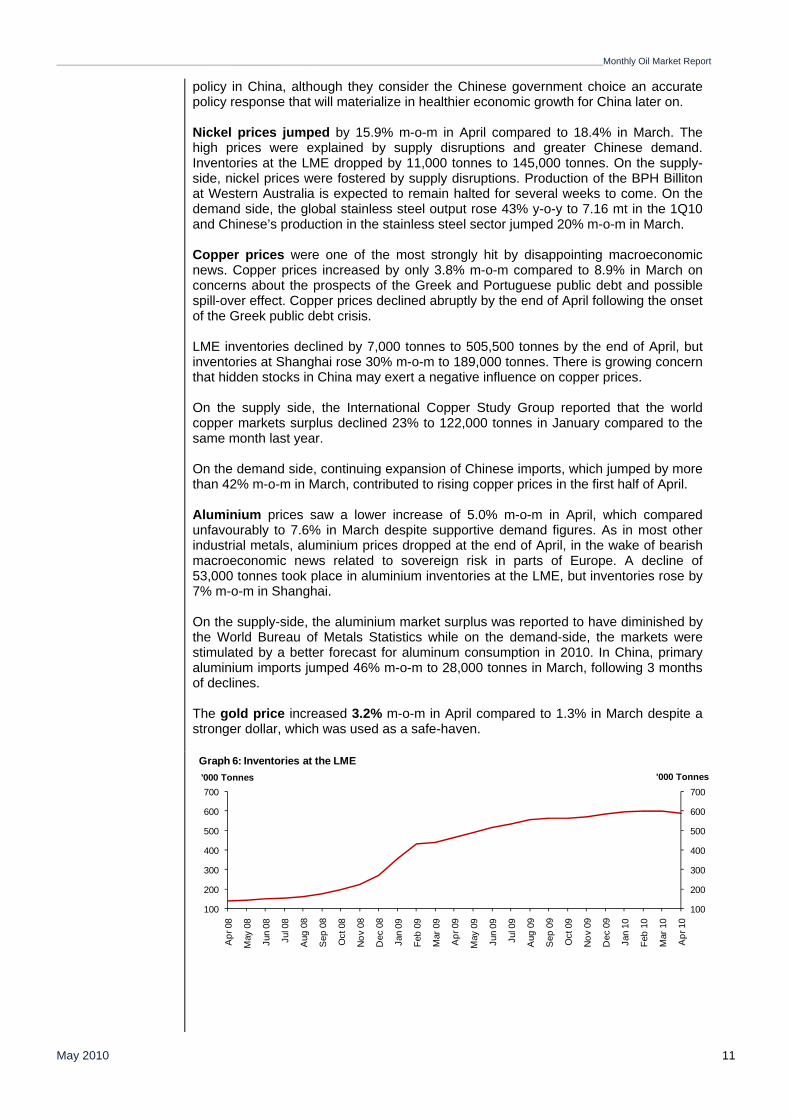
policy in China, although they consider the Chinese government choice an accurate policy response that will materialize in healthier economic growth for China later on. Nickel prices jumped by 15.9% m-o-m in April compared to 18.4% in March. The high prices were explained by supply disruptions and greater Chinese demand. Inventories at the LME dropped by 11,000 tonnes to 145,000 tonnes. On the supply-side, nickel prices were fostered by supply disruptions. Production of the BPH Billiton at Western Australia is expected to remain halted for several weeks to come. On the demand side, the global stainless steel output rose 43% y-o-y to 7.16 mt in the 1Q10 and Chinese’s production in the stainless steel sector jumped 20% m-o-m in March. Copper prices were one of the most strongly hit by disappointing macroeconomic news. Copper prices increased by only 3.8% m-o-m compared to 8.9% in March on concerns about the prospects of the Greek and Portuguese public debt and possible spill-over effect. Copper prices declined abruptly by the end of April following the onset of the Greek public debt crisis. LME inventories declined by 7,000 tonnes to 505,500 tonnes by the end of April, but inventories at Shanghai rose 30% m-o-m to 189,000 tonnes. There is growing concern that hidden stocks in China may exert a negative influence on copper prices. On the supply side, the International Copper Study Group reported that the world copper markets surplus declined 23% to 122,000 tonnes in January compared to the same month last year. On the demand side, continuing expansion of Chinese imports, which jumped by more than 42% m-o-m in March, contributed to rising copper prices in the first half of April. Aluminium prices saw a lower increase of 5.0% m-o-m in April, which compared unfavourably to 7.6% in March despite supportive demand figures. As in most other industrial metals, aluminium prices dropped at the end of April, in the wake of bearish macroeconomic news related to sovereign risk in parts of Europe. A decline of 53,000 tonnes took place in aluminium inventories at the LME, but inventories rose by 7% m-o-m in Shanghai. On the supply-side, the aluminium market surplus was reported to have diminished by the World Bureau of Metals Statistics while on the demand-side, the markets were stimulated by a better forecast for aluminum consumption in 2010. In China, primary aluminium imports jumped 46% m-o-m to 28,000 tonnes in March, following 3 months of declines. The gold price increased 3.2% m-o-m in April compared to 1.3% in March despite a stronger dollar, which was used as a safe-haven.
100
200
300
400
500
600
700
100
200
300
400
500
600
700
Apr
08
May
08
Jun
08
Jul 0
8
Aug
08
Sep
08
Oct
08
Nov
08
Dec
08
Jan
09
Feb
09
Mar
09
Apr
09
May
09
Jun
09
Jul 0
9
Aug
09
Sep
09
Oct
09
Nov
09
Dec
09
Jan
10
Feb
10
Mar
10
Apr
10
'000 Tonnes'000 Tonnes
Graph 6: Inventories at the LME
Monthly Oil Market Report_________________________________________________________________________________________________________________________________________
May 2010 12
Investment flow into commoditiesMajor commodities saw a 3.5% rise in OIV
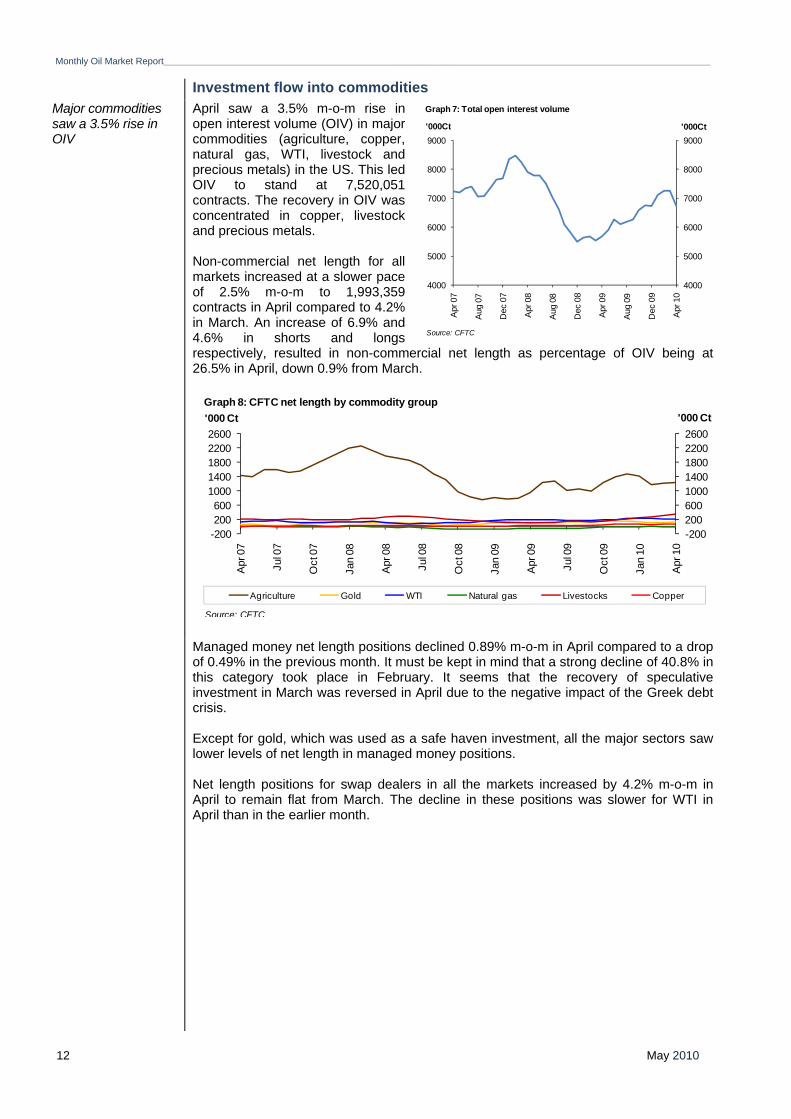
April saw a 3.5% m-o-m rise in open interest volume (OIV) in major commodities (agriculture, copper, natural gas, WTI, livestock and precious metals) in the US. This led OIV to stand at 7,520,051 contracts. The recovery in OIV was concentrated in copper, livestock and precious metals. Non-commercial net length for all markets increased at a slower pace of 2.5% m-o-m to 1,993,359 contracts in April compared to 4.2% in March. An increase of 6.9% and 4.6% in shorts and longs respectively, resulted in non-commercial net length as percentage of OIV being at 26.5% in April, down 0.9% from March.
Managed money net length positions declined 0.89% m-o-m in April compared to a drop
of 0.49% in the previous month. It must be kept in mind that a strong decline of 40.8% in this category took place in February. It seems that the recovery of speculative investment in March was reversed in April due to the negative impact of the Greek debt crisis. Except for gold, which was used as a safe haven investment, all the major sectors saw lower levels of net length in managed money positions. Net length positions for swap dealers in all the markets increased by 4.2% m-o-m in April to remain flat from March. The decline in these positions was slower for WTI in April than in the earlier month.
-20020060010001400180022002600
-200200600
10001400180022002600
Apr
07
Jul 0
7
Oct
07
Jan
08
Apr
08
Jul 0
8
Oct
08
Jan
09
Apr
09
Jul 0
9
Oct
09
Jan
10
Apr
10
'000 Ct'000 Ct
Agriculture Gold WTI Natural gas Livestocks Copper
Graph 8: CFTC net length by commodity group
Source: CFTC
4000
5000
6000
7000
8000
9000
4000
5000
6000
7000
8000
9000
Apr
07
Aug
07
Dec
07
Apr
08
Aug
08
Dec
08
Apr
09
Aug
09
Dec
09
Apr
10
Graph 7: Total open interest volume
'000Ct '000Ct
Source: CFTC
_________________________________________________________________________________________________________________________________________Monthly Oil Market Report
May 2010 13
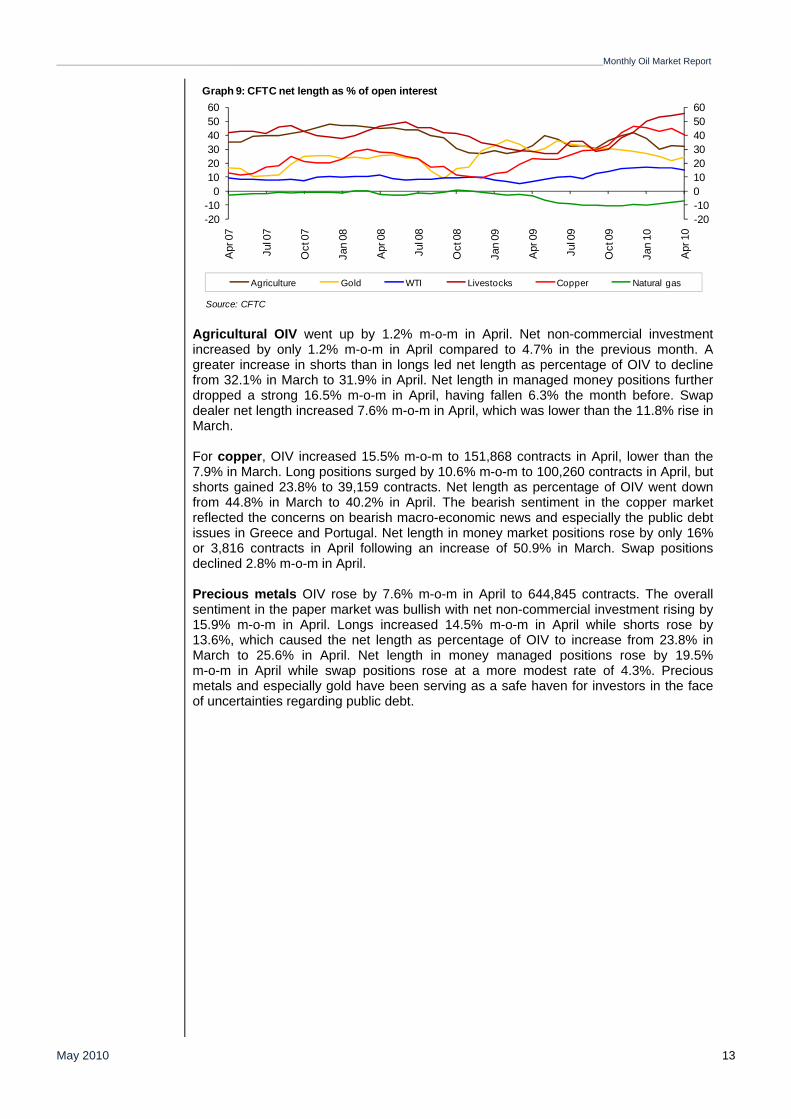
Agricultural OIV went up by 1.2% m-o-m in April. Net non-commercial investment
increased by only 1.2% m-o-m in April compared to 4.7% in the previous month. A greater increase in shorts than in longs led net length as percentage of OIV to decline from 32.1% in March to 31.9% in April. Net length in managed money positions further dropped a strong 16.5% m-o-m in April, having fallen 6.3% the month before. Swap dealer net length increased 7.6% m-o-m in April, which was lower than the 11.8% rise in March. For copper, OIV increased 15.5% m-o-m to 151,868 contracts in April, lower than the 7.9% in March. Long positions surged by 10.6% m-o-m to 100,260 contracts in April, but shorts gained 23.8% to 39,159 contracts. Net length as percentage of OIV went down from 44.8% in March to 40.2% in April. The bearish sentiment in the copper market reflected the concerns on bearish macro-economic news and especially the public debt issues in Greece and Portugal. Net length in money market positions rose by only 16% or 3,816 contracts in April following an increase of 50.9% in March. Swap positions declined 2.8% m-o-m in April. Precious metals OIV rose by 7.6% m-o-m in April to 644,845 contracts. The overall sentiment in the paper market was bullish with net non-commercial investment rising by 15.9% m-o-m in April. Longs increased 14.5% m-o-m in April while shorts rose by 13.6%, which caused the net length as percentage of OIV to increase from 23.8% in March to 25.6% in April. Net length in money managed positions rose by 19.5% m-o-m in April while swap positions rose at a more modest rate of 4.3%. Precious metals and especially gold have been serving as a safe haven for investors in the face of uncertainties regarding public debt.
-20-100102030405060
-20-10
0102030405060
Apr
07
Jul 0
7
Oct
07
Jan
08
Apr
08
Jul 0
8
Oct
08
Jan
09
Apr
09
Jul 0
9
Oct
09
Jan
10
Apr
10
Agriculture Gold WTI Livestocks Copper Natural gas
Graph 9: CFTC net length as % of open interest
Source: CFTC
Monthly Oil Market Report_________________________________________________________________________________________________________________________________________
May 2010 14
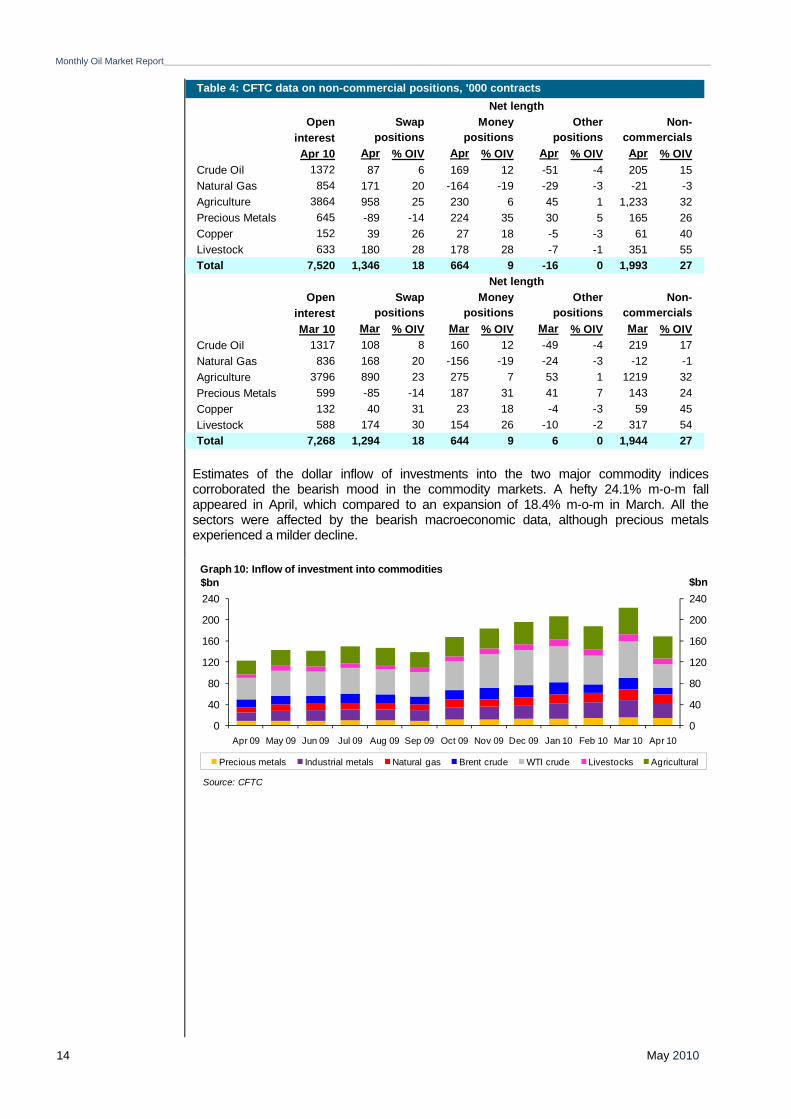
Estimates of the dollar inflow of investments into the two major commodity indices corroborated the bearish mood in the commodity markets. A hefty 24.1% m-o-m fall appeared in April, which compared to an expansion of 18.4% m-o-m in March. All the sectors were affected by the bearish macroeconomic data, although precious metals experienced a milder decline.
OpeninterestApr 10 Apr % OIV Apr % OIV Apr % OIV Apr % OIV
Crude Oil 1372 87 6 169 12 -51 -4 205 15Natural Gas 854 171 20 -164 -19 -29 -3 -21 -3Agriculture 3864 958 25 230 6 45 1 1,233 32Precious Metals 645 -89 -14 224 35 30 5 165 26Copper 152 39 26 27 18 -5 -3 61 40Livestock 633 180 28 178 28 -7 -1 351 55Total 7,520 1,346 18 664 9 -16 0 1,993 27
OpeninterestMar 10 Mar % OIV Mar % OIV Mar % OIV Mar % OIV
Crude Oil 1317 108 8 160 12 -49 -4 219 17Natural Gas 836 168 20 -156 -19 -24 -3 -12 -1Agriculture 3796 890 23 275 7 53 1 1219 32Precious Metals 599 -85 -14 187 31 41 7 143 24Copper 132 40 31 23 18 -4 -3 59 45Livestock 588 174 30 154 26 -10 -2 317 54Total 7,268 1,294 18 644 9 6 0 1,944 27
Table 4: CFTC data on non-commercial positions, '000 contractsNet length
Swappositions
positions positions positions commercials
Net lengthSwap Money Other Non-
Moneypositions
Otherpositions
Non-commercials
0
40
80
120
160
200
240
0
40
80
120
160
200
240
Apr 09 May 09 Jun 09 Jul 09 Aug 09 Sep 09 Oct 09 Nov 09 Dec 09 Jan 10 Feb 10 Mar 10 Apr 10
$bn$bn
Precious metals Industrial metals Natural gas Brent crude WTI crude Livestocks Agricultural
Graph 10: Inflow of investment into commodities
Source: CFTC
_________________________________________________________________________________________________________________________________________Monthly Oil Market Report
May 2010 15
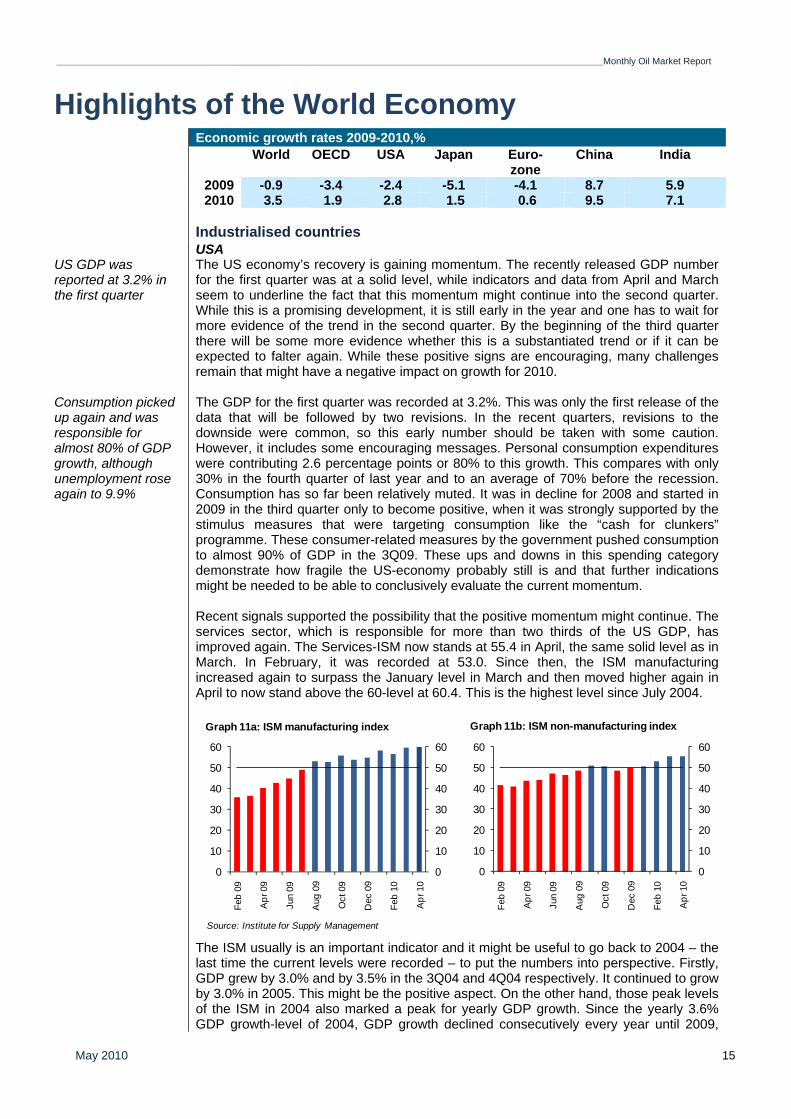
Highlights of the World Economy Economic growth rates 2009-2010,% World OECD USA Japan Euro-
zone China India
2009 -0.9 -3.4 -2.4 -5.1 -4.1 8.7 5.9 2010 3.5 1.9 2.8 1.5 0.6 9.5 7.1
Industrialised countries USA US GDP was reported at 3.2% in the first quarter Consumption picked up again and was responsible for almost 80% of GDP growth, although unemployment rose again to 9.9%
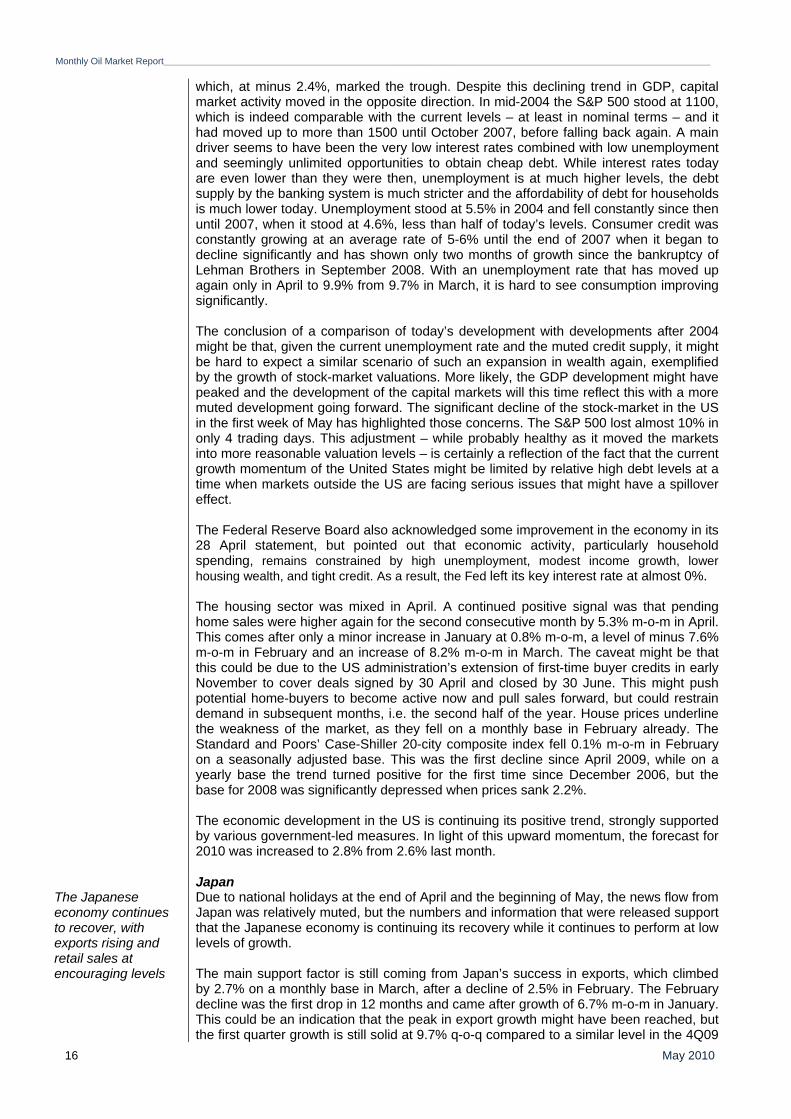
The US economy’s recovery is gaining momentum. The recently released GDP number for the first quarter was at a solid level, while indicators and data from April and March seem to underline the fact that this momentum might continue into the second quarter. While this is a promising development, it is still early in the year and one has to wait for more evidence of the trend in the second quarter. By the beginning of the third quarter there will be some more evidence whether this is a substantiated trend or if it can be expected to falter again. While these positive signs are encouraging, many challenges remain that might have a negative impact on growth for 2010. The GDP for the first quarter was recorded at 3.2%. This was only the first release of the data that will be followed by two revisions. In the recent quarters, revisions to the downside were common, so this early number should be taken with some caution. However, it includes some encouraging messages. Personal consumption expenditures were contributing 2.6 percentage points or 80% to this growth. This compares with only 30% in the fourth quarter of last year and to an average of 70% before the recession. Consumption has so far been relatively muted. It was in decline for 2008 and started in 2009 in the third quarter only to become positive, when it was strongly supported by the stimulus measures that were targeting consumption like the “cash for clunkers” programme. These consumer-related measures by the government pushed consumption to almost 90% of GDP in the 3Q09. These ups and downs in this spending category demonstrate how fragile the US-economy probably still is and that further indications might be needed to be able to conclusively evaluate the current momentum. Recent signals supported the possibility that the positive momentum might continue. The services sector, which is responsible for more than two thirds of the US GDP, has improved again. The Services-ISM now stands at 55.4 in April, the same solid level as in March. In February, it was recorded at 53.0. Since then, the ISM manufacturing increased again to surpass the January level in March and then moved higher again in April to now stand above the 60-level at 60.4. This is the highest level since July 2004.
The ISM usually is an important indicator and it might be useful to go back to 2004 – the last time the current levels were recorded – to put the numbers into perspective. Firstly, GDP grew by 3.0% and by 3.5% in the 3Q04 and 4Q04 respectively. It continued to grow by 3.0% in 2005. This might be the positive aspect. On the other hand, those peak levels of the ISM in 2004 also marked a peak for yearly GDP growth. Since the yearly 3.6% GDP growth-level of 2004, GDP growth declined consecutively every year until 2009,
0
10
20
30
40
50
60
0
10
20
30
40
50
60
Feb
09
Apr
09
Jun
09
Aug
09
Oct
09
Dec
09
Feb
10
Apr
10
0
10
20
30
40
50
60
0
10
20
30
40
50
60
Feb
09
Apr
09
Jun
09
Aug
09
Oct
09
Dec
09
Feb
10
Apr
10
Source: Institute for Supply Management
Graph 11a: ISM manufacturing index Graph 11b: ISM non-manufacturing index
Monthly Oil Market Report_________________________________________________________________________________________________________________________________________
May 2010 16
which, at minus 2.4%, marked the trough. Despite this declining trend in GDP, capital market activity moved in the opposite direction. In mid-2004 the S&P 500 stood at 1100, which is indeed comparable with the current levels – at least in nominal terms – and it had moved up to more than 1500 until October 2007, before falling back again. A main driver seems to have been the very low interest rates combined with low unemployment and seemingly unlimited opportunities to obtain cheap debt. While interest rates today are even lower than they were then, unemployment is at much higher levels, the debt supply by the banking system is much stricter and the affordability of debt for households is much lower today. Unemployment stood at 5.5% in 2004 and fell constantly since then until 2007, when it stood at 4.6%, less than half of today’s levels. Consumer credit was constantly growing at an average rate of 5-6% until the end of 2007 when it began to decline significantly and has shown only two months of growth since the bankruptcy of Lehman Brothers in September 2008. With an unemployment rate that has moved up again only in April to 9.9% from 9.7% in March, it is hard to see consumption improving significantly. The conclusion of a comparison of today’s development with developments after 2004 might be that, given the current unemployment rate and the muted credit supply, it might be hard to expect a similar scenario of such an expansion in wealth again, exemplified by the growth of stock-market valuations. More likely, the GDP development might have peaked and the development of the capital markets will this time reflect this with a more muted development going forward. The significant decline of the stock-market in the US in the first week of May has highlighted those concerns. The S&P 500 lost almost 10% in only 4 trading days. This adjustment – while probably healthy as it moved the markets into more reasonable valuation levels – is certainly a reflection of the fact that the current growth momentum of the United States might be limited by relative high debt levels at a time when markets outside the US are facing serious issues that might have a spillover effect. The Federal Reserve Board also acknowledged some improvement in the economy in its 28 April statement, but pointed out that economic activity, particularly household spending, remains constrained by high unemployment, modest income growth, lower housing wealth, and tight credit. As a result, the Fed left its key interest rate at almost 0%. The housing sector was mixed in April. A continued positive signal was that pending home sales were higher again for the second consecutive month by 5.3% m-o-m in April. This comes after only a minor increase in January at 0.8% m-o-m, a level of minus 7.6% m-o-m in February and an increase of 8.2% m-o-m in March. The caveat might be that this could be due to the US administration’s extension of first-time buyer credits in early November to cover deals signed by 30 April and closed by 30 June. This might push potential home-buyers to become active now and pull sales forward, but could restrain demand in subsequent months, i.e. the second half of the year. House prices underline the weakness of the market, as they fell on a monthly base in February already. The Standard and Poors’ Case-Shiller 20-city composite index fell 0.1% m-o-m in February on a seasonally adjusted base. This was the first decline since April 2009, while on a yearly base the trend turned positive for the first time since December 2006, but the base for 2008 was significantly depressed when prices sank 2.2%. The economic development in the US is continuing its positive trend, strongly supported by various government-led measures. In light of this upward momentum, the forecast for 2010 was increased to 2.8% from 2.6% last month.
Japan The Japanese economy continues to recover, with exports rising and retail sales at encouraging levels
Due to national holidays at the end of April and the beginning of May, the news flow from Japan was relatively muted, but the numbers and information that were released support that the Japanese economy is continuing its recovery while it continues to perform at low levels of growth. The main support factor is still coming from Japan’s success in exports, which climbed by 2.7% on a monthly base in March, after a decline of 2.5% in February. The February decline was the first drop in 12 months and came after growth of 6.7% m-o-m in January. This could be an indication that the peak in export growth might have been reached, but the first quarter growth is still solid at 9.7% q-o-q compared to a similar level in the 4Q09
_________________________________________________________________________________________________________________________________________Monthly Oil Market Report
May 2010 17
of 9.8%. Shipments to Asia were again the main driving force. They increased by 2.3% on a monthly base, compared to only a 0.3% increase in the EU and minus 0.3% to the US. On a quarterly basis, Asian exports were the leading driver of growth at a rate of 11.5% q-o-q in 1Q10. This is the same level as in 4Q09. Contrary to the exports to Asia, the growth momentum in exports to the EU and the US declined significantly from 4Q09 to 1Q10. With this strong growth in exports, it appears unlikely that the Japanese economy will experience a double-dip in 2010. While the domestic demand in Japan is expected to face some slowdown after the second half of the year, when the main effects of the stimulus measures might come to an end, it is holding up very well and appears to still have a strong dynamic. In March, retail sales picked up again strongly at 4.7% y-o-y. This is the third consecutive month of improvement. On a monthly base, retail sales maintained a strong growth momentum of 0.8% in March after rising 0.9% in February and 2.0% in January, leading to a 2.7% q-o-q advance in 1Q10. An encouraging sign is that sales from industries that have not directly benefited from the stimulus have also seen rising sales numbers. Sales in fabrics, apparel and accessories increased by 5.4% q-o-q in 1Q10 after a 0.6% q-o-q decline in the previous quarter, while food and beverage sales also turned around to a 2.2% q-o-q rise after a 1.8% q-o-q decline in 4Q09. This strong support in March comes despite the unemployment rate having increased by 0.1% to 5.0% in March. On the other side, the closely watched jobs-to-applicant ratio increased from 0.47 to 0.49, which marks the fifth consecutive improvement. Deflation remains a challenge for the Japanese economy. Both the headline and the so-called “core-core” consumer price index (CPI), which excludes food and energy, fell by 1.1% y-o-y. The Bank of Japan (BoJ) forecast an end of deflation in 2011 and is predicting that prices will rise by 0.1% in the next fiscal year, which starts April 2011. Furthermore, the BoJ became more bullish on the growth of the economy. It sharply increased its median forecast for this fiscal year from 1.3% to 1.8%. The BoJ kept its overnight rate on hold at 0.1%. While the economic situation in Japan has continued to recover, some uncertainties with regard to exports and domestic demand remain. The growth forecast therefore was kept unchanged at 1.5% in 2010.
Euro-zone The Euro-zone continues to be challenged by the sovereign debt crisis; unemployment stands at 10.0% and is hindering domestic demand
The challenges of the Euro-zone are currently the main market driver and they are indeed of historical relevance. The Euro-zone has so far already been in a difficult situation and the economic recovery was characterized by two different speeds. However, recent developments have underlined the fragility of this recovery and, even more so, those developments have demonstrated that the European Monetary Union (EMU) has so far been a two-tier system. While that has been widely acknowledged, no mechanism has been put in place to cope with such an unforeseen event of an almost bankruptcy of one of the Euro-zone economies and it seems that there is certainly no other possibility than to bail-out this failing economy, which than again puts significant pressure on the more solid countries. Germany and France as the biggest shareholders in the Euro have no other choice than to support those ailing economies. Greece – as it turned out over the last months and particularly over the last weeks – is in much worse shape than anticipated. An emergency support was put in place in the range of €110bn over three years, with €30bn coming from the IMF and €80 bn from the EU. In combination with this support, Greece has agreed on a very tough cost-cutting program, the Economic Policy Programme (EPP) that includes very crucial cuts to the social system, to private income and therefore has the potential to significantly decelerate the economy going forward. Base estimates for this programme are that Greece is declining by 4.0% in 2010 and 2.6% in 2011 and although Greece only contributes around 3-4% of the Euro-zone GDP, this crisis has the potential of impacting growth in the Euro-zone significantly. The International Monetary Fund, for example, currently shows a GDP growth estimate for Greece of minus 2.0% in 2010, which is also reflected in the general consensus estimate. Taking into account the recent austerity measures, Greece itself now projects a decline of 4.0%. This would result in a further decline of 0.1 points in the Euro-zone’s growth. The consensus for Eurozone growth, which at the beginning of the year stood at 1.3%, has been revised to 1.2% and further

Monthly Oil Market Report_________________________________________________________________________________________________________________________________________
May 2010 18
revisions can be expected. It will be of great importance to monitor the handling of the situation by the Euro-zone institutions over the coming days and weeks. Most likely they will manage to put a mechanism in place to support ailing countries, not only for this instance, but also in the future, otherwise the pressure on bonds within the Euro-zone and of primarily the weaker southern European countries, will continue to be considerable. Consequently the Euro’s decline might continue. Furthermore, if the crisis cannot be contained, the spill-over effects to other economies could be massive. To name just a few examples, the currency rates will be impacted significantly, when the euro/US$ rate is under pressure and other exchange rates follow, given the fact that the euro is already a very important reserve currency across the globe. Funds will be redirected from the Euro-zone to other safe havens such as US dollar as well as the yen and the Swiss-franc. In addition, funds will probably be invested more into fixed-income instruments, which might be favoured in the short-term over equities. While the sovereign-debt crisis in the Euro-zone is overshadowing the other developments in the real economy, there have recently been some slight positive elements. Euro-zone PMIs reached new record levels. The Euro-zone Markit composite PMI stood at 57.3 for April, compared to 55.5 in March. The Euro-zone manufacturing PMI stood at 57.6 in April. On the negative side and based on the recent news flow, it is a high likelihood that at least in the mid-term these remain to present peak levels. Unemployment has stayed at 10.0% in March, the same level from February. Again, Spain is taking the lead of the bigger Euro-zone countries at 19.1% compared to the level of February of 19.0%. In contrast, Germany even recorded a decline in its unemployment-rate which moved from the February level of 7.4% to 7.3% in March. Youth unemployment also stayed at the lofty level of 19.9% and here also Spain had the worst development of the main Euro-zone economies, when it again recorded a hefty increase of 0.6% to 41.2% in March. Germany saw the best performance, recording below-average levels of 10%, an improvement of 0.1% compared to February. The economic outlook in the Euro-zone remains relatively uncertain. Despite some encouraging signals, it depends mostly on the outcome of the current sovereign debt crisis. This will keep growth in the Euro-zone at relatively low levels. Consequently, the Euro-zone GDP growth forecast was reduced by 0.1% to 0.6%.
Former Soviet Union Russia 1Q growth is now estimated at 0.6% q-o-q. Capital investments grew by 0.7% y-o-y in March
Russia’s real GDP was up by 4.9% y-o-y and by 0.2% m-o-m on a seasonally adjusted basis in March, according to a preliminary assessment by the Ministry of Economic Development. Growth in the first quarter is now estimated at 0.6% q-o-q. This compares with 2.0% in 3Q09 and 1.7% in 4Q09. While the quarterly growth trend is therefore declining, the Ministry currently expects the Russian economy to grow by 3.1% in 2010. Industrial production in March rose by 5.7% y-o-y, higher than expected. The mining sector was up by 6.6% y-o-y, while manufacturing rose by 5.1% y-o-y, after only growing by 1.9 % y-o-y in February. Capital investments grew by 0.7% y-o-y in March, the first positive reading since October 2008 and a significant improvement compared to February, when it declined by 7.4%. In line with this positive development, retail sales increase by 2.9% y-o-y in March and by a strong 7.9% on a monthly base. The unemployment rate remained flat in March at 8.6% compared to Februarys’ levels, according to the Federal Statistics Service. This compares to the recent peak level of 9.2% in December of last year. Economic growth in the Ukraine for 1Q10 came to around 5.0% y-o-y, according to the National Bank of Ukraine (NBU). Consumer and business confidence both continued to grow, backed by the improvement in the economic expectations. The NBU business expectation index surged from 104.4 in 4Q09 to 115.6 in 1Q10 as the share of producers expecting their business conditions to improve over the next 12 months continued to grow. The stabilization of the political situation and the financial markets created a base for the current improvement. Both producers and consumers expect inflation to remain on a declining trend this year, according to the NBU’s survey. Despite the positive sentiment, the decline of the construction sector accelerated slightly to minus 21.4%
_________________________________________________________________________________________________________________________________________Monthly Oil Market Report
May 2010 19
y-o-y in 1Q10. Retail sales continued falling as well, shrinking by 3.1% y-o-y. Household spending has been subdued as real incomes continued to decline.
Developing Countries China continues to avoid overheating by tightening its monetary base; reserve requirements were increased for the third time this year.
China is still trying to find the right balance between monetary tightening to avoid overheating and keeping the growth momentum. The reserve requirements for major banks were raised for the third time this year by 50 basis points to a level of 17%. This comes after quarterly GDP growth for the 1Q10 of 11.9%. China’s trade balance moved back into surplus in April after recording a deficit in March. Although the surplus is only at a modest $1.7 bn, it might ease some of the pressure on Beijing to appreciate its currency. China’s April exports were $119.9 bn and imports were $118.2 bn, according to the Chinese Customs Bureau. This comes after an unexpected trade-deficit in March of $7.6 bn, which was the first deficit in almost 6 years. The April surplus shrank 87% compared to last year’s levels. Exports were up in March by 30.5% y-o-y. An appreciation of the yuan will therefore certainly be an issue at the upcoming meetings of the US-China strategic and economic dialogue scheduled for late May and the G20 summit at the end of June. Import volumes of commodities declined, but were offset by price increases. Input prices rose the most in 22 months, according to the Statistics Bureau. China used 3.2% more energy per unit of GDP in the first quarter, adding to pressure to cut consumption for the rest of 2010, according to the Prime Minister. Headline PMI in China increased by 0.6 to a level of 55.7. This rise was mainly driven by the jump in input prices, which increased by 7.5 points to 72.6, while other key sub-indices remained flat. Output and new domestic orders gained just 0.7 and 1.2, but new export orders stayed flat and finished goods inventories even lost 2.1. They dropped to 46.2 in April from 48.3 in March, now moving further down below 50 and also behind new orders and output. Raw material inventories rose to 51.5 in April from 50.6 in March, suggesting demand for commodities stays at solid levels. Indian export growth in dollar terms accelerated to 54.1% y-o-y in March. This might be a reflection of a low base effect and improved global demand. This compares with an increase of 34.8% y-o-y in February 2010. In rupee terms, export growth picked up to 36.9% y-o-y, compared with 26.7% y-o-y in February. The strong domestic demand was also reflected in strong import growth, at a level of 67.1% y-o-y in March, equally inflated by the base effect from last year. This compares with 66.4% y-o-y in February. In rupee terms import growth decelerated to 48.4% y-o-y from 56.4% y-o-y in January. While oil import growth in dollar terms remained high at 85.1% y-o-y in March compared with 97.4% in February, non-oil import growth picked up further to 61.0% y-o-y in March. The Reserve Bank of India (RBI) has increased all its key policy rates by 25 basis points. With this move, the bank’s lending rate or ‘repo rate’ now stands at 5.25%, while its liquidity absorption rate or ‘reverse-repo rate’ stands at 3.75% and the cash reserve ratio (CRR) is at 6%. The rate hikes were largely in line with expectations. Since January, the RBI has taken several steps to exit from the exceptionally easy monetary conditions put in place during the 2008/2009 global financial crisis. Between January and April, the CRR has been raised by 100 basis points while the repo and reverse repo rates have been raised by 50 basis points each. The central bank has clearly indicated that more interest rate increases and liquidity withdrawal measures are ahead as the economy’s recovery firms up. The RBI expects the economy to grow by 8.0% in the fiscal year.
OPEC Member Countries Qatar’s GDP advanced 8.6% in 2009, underlying the significant growth trend
Real GDP growth in Qatar advanced by 8.6% in 2009, according to the data released by the Qatar Statistics Authority (QSA). The 2009 growth figure is lower than the 11.0% indicated by officials at the beginning of the year. The QSA released real GDP data for the 2005 - 2009 period showing real GDP grew by 26.8% in 2007 and 25.4% in 2008, compared to the previously announced 5.3% and 16%. The data shows that the gas sector continues to contribute a significant share, growing by 14.7% in 2009 and 36.4% in 2008. Trade and hospitality increased its growth pace by 21.7% in 2009 compared to 13.8% in 2008 and financial services turned positive, growing by 19.6% in 2009 compared to a decline of 1.5% in 2008. Government services also grew by 43.2% in
Monthly Oil Market Report_________________________________________________________________________________________________________________________________________
May 2010 20
2009, compared to 36.5% in 2008. The United Arab Emirates (UAE) cut their growth forecast for this year. The Ministry of Economics announced that the economy would expand by up to 2.5% in 2010. This compares with a previous forecast of 3.2%. In general, it was highlighted that the projections depend highly on the development of the oil price. Inflation is expected to remain low at a level of up to 2% this year. Inflation rose by 0.1% m-o-m in March 2010 on higher food and housing costs for the first time since December 2009, data released by the UAE Bureau of Statistics showed. Dubai’s economy reportedly contracted by 2.5% in 2009. The drop in GDP followed a 5.7% increase in 2008, according to Bloomberg.
Oil prices, the US dollar and inflation The main development in the currency market took place in the first week of May, when the US dollar appreciated significantly versus the euro but depreciated against the Yen
The US-dollar continued to strengthen in April against the euro, the yen and the Swiss-franc, but declined against the pound sterling. On an average monthly base, the dollar rose 1.2% against the euro, appreciated 3.2% versus the yen and gained 0.2% compared to the Swiss-franc. Against the pound sterling, it declined by 1.8%. The most dramatic move of the US-dollar was recorded at the beginning of May, when it rose significantly against the euro to $1.2727/€ compared to the April closing level of $1.3315/€ and therefore managed a rise of 4.4% within just four trading days. The increase in the US dollar against the euro was supported by the solid US GDP number for 1Q10 and other positive indicators that support a continued improvement of the US economy in the second quarter, but even more so by the weakness of the euro. The Euro-zone, which is facing its biggest crisis since having established the euro in 2001, is fighting the debt challenges of the weaker Euro-zone economies and the success of these actions will influence not only the euro, but will have also have an influence on the other main global currencies. A failure might not only have a significant negative impact on the Euro-zone economies, but also would imply an appreciation of the other reserve currencies and impact their cross-rates. This could be seen at the beginning of May, when the dollar appreciated significantly against the euro, but at the same time depreciated against the yen. In April, the OPEC Reference Basket increased by $5.12/b or 6.6% to $82.33/b from $77.21/b in March. In real terms (base June 2001=100), accounting for inflation and currency fluctuations, the Basket price rose by $3.64/b or 7.3% to $53.62/b from $49.98/b. The dollar rose by 0.7%, as measured against the import-weighted modified Geneva I+US dollar basket, while inflation remained flat.*
* The ‘modified Geneva I+US$ basket’ includes the euro, the Japanese yen, the US dollar, the pound sterling and the Swiss franc, weighted
according to the merchandise imports of OPEC Member Countries from the countries in the basket.
_________________________________________________________________________________________________________________________________________Monthly Oil Market Report
May 2010 21
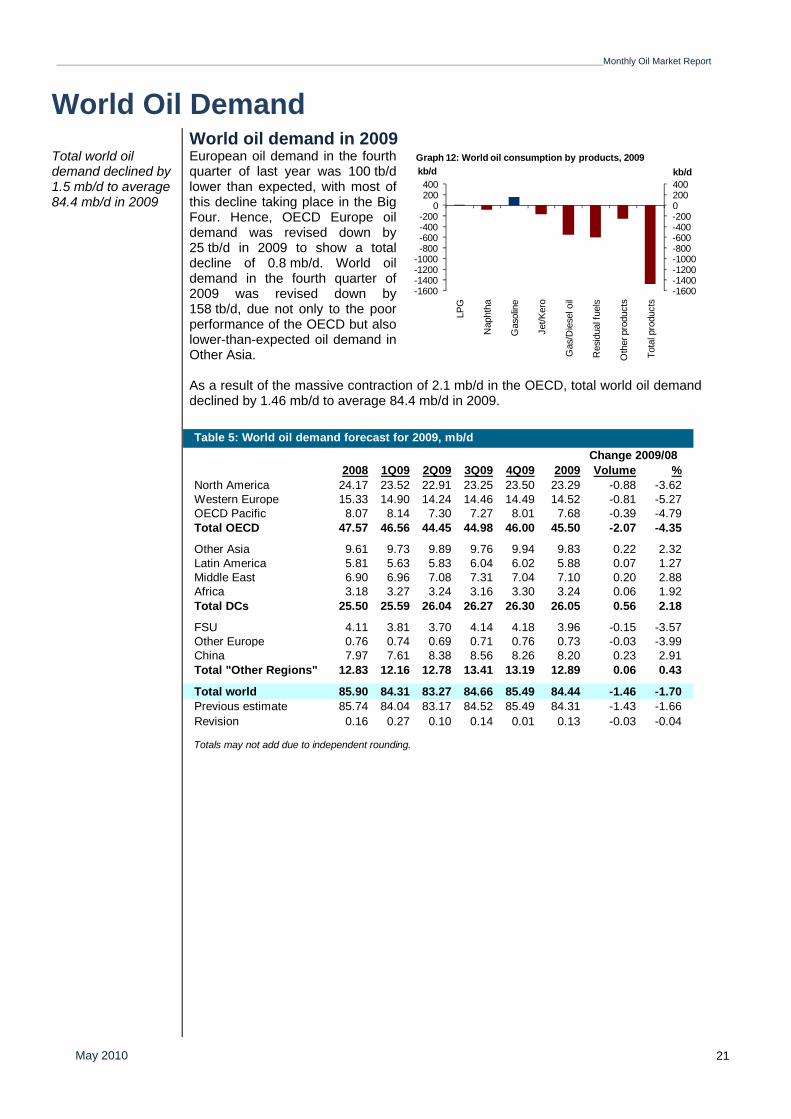
World Oil Demand World oil demand in 2009 Total world oil demand declined by 1.5 mb/d to average 84.4 mb/d in 2009
European oil demand in the fourth quarter of last year was 100 tb/d lower than expected, with most of this decline taking place in the Big Four. Hence, OECD Europe oil demand was revised down by 25 tb/d in 2009 to show a total decline of 0.8 mb/d. World oil demand in the fourth quarter of 2009 was revised down by 158 tb/d, due not only to the poor performance of the OECD but also lower-than-expected oil demand in Other Asia. As a result of the massive contraction of 2.1 mb/d in the OECD, total world oil demand declined by 1.46 mb/d to average 84.4 mb/d in 2009.
2008 1Q09 2Q09 3Q09 4Q09 2009 Volume %North America 24.17 23.52 22.91 23.25 23.50 23.29 -0.88 -3.62Western Europe 15.33 14.90 14.24 14.46 14.49 14.52 -0.81 -5.27OECD Pacific 8.07 8.14 7.30 7.27 8.01 7.68 -0.39 -4.79Total OECD 47.57 46.56 44.45 44.98 46.00 45.50 -2.07 -4.35
Other Asia 9.61 9.73 9.89 9.76 9.94 9.83 0.22 2.32Latin America 5.81 5.63 5.83 6.04 6.02 5.88 0.07 1.27Middle East 6.90 6.96 7.08 7.31 7.04 7.10 0.20 2.88Africa 3.18 3.27 3.24 3.16 3.30 3.24 0.06 1.92Total DCs 25.50 25.59 26.04 26.27 26.30 26.05 0.56 2.18
FSU 4.11 3.81 3.70 4.14 4.18 3.96 -0.15 -3.57Other Europe 0.76 0.74 0.69 0.71 0.76 0.73 -0.03 -3.99China 7.97 7.61 8.38 8.56 8.26 8.20 0.23 2.91Total "Other Regions" 12.83 12.16 12.78 13.41 13.19 12.89 0.06 0.43
Total world 85.90 84.31 83.27 84.66 85.49 84.44 -1.46 -1.70Previous estimate 85.74 84.04 83.17 84.52 85.49 84.31 -1.43 -1.66Revision 0.16 0.27 0.10 0.14 0.01 0.13 -0.03 -0.04
Totals may not add due to independent rounding.
Change 2009/08Table 5: World oil demand forecast for 2009, mb/d
-1600-1400-1200-1000-800-600-400-2000200400
-1600-1400-1200-1000-800-600-400-200
0200400
LPG
Nap
htha
Gas
olin
e
Jet/K
ero
Gas
/Die
sel o
il
Res
idua
l fue
ls
Oth
er p
rodu
cts
Tota
l pro
duct
s
kb/dkb/dGraph 12: World oil consumption by products, 2009
Monthly Oil Market Report_________________________________________________________________________________________________________________________________________
May 2010 22
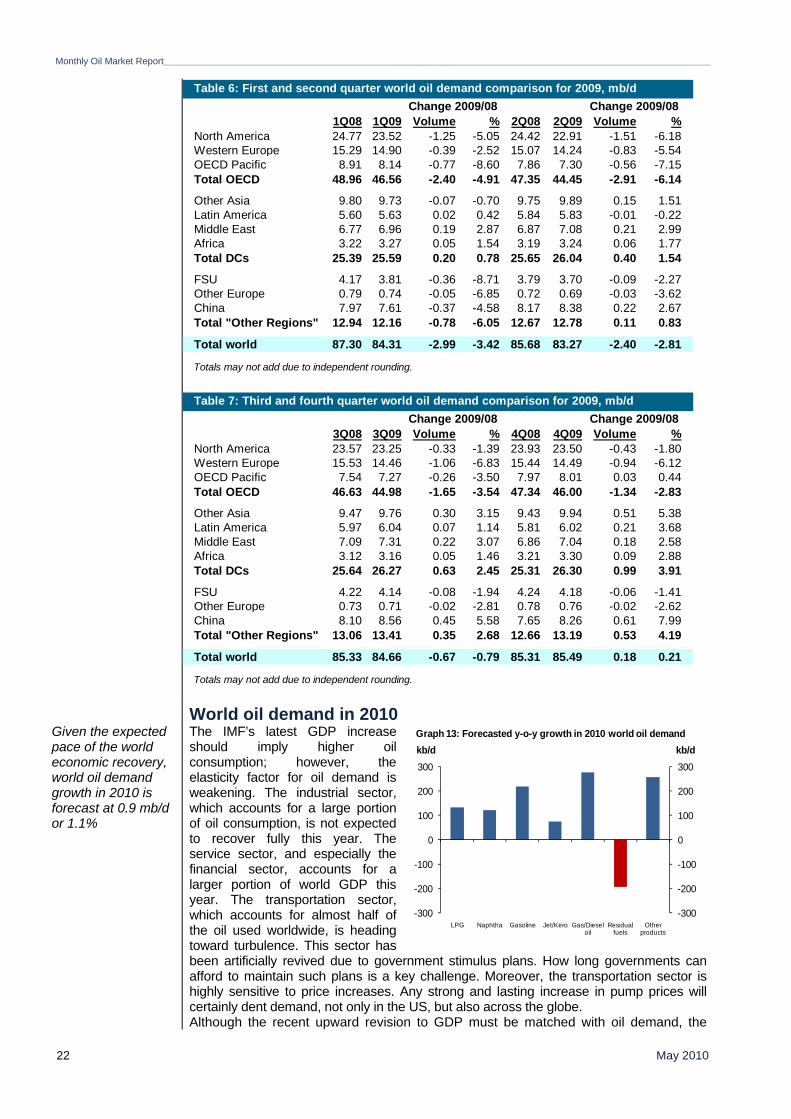
World oil demand in 2010 Given the expected pace of the world economic recovery, world oil demand growth in 2010 is forecast at 0.9 mb/d or 1.1%
The IMF’s latest GDP increase should imply higher oil consumption; however, the elasticity factor for oil demand is weakening. The industrial sector, which accounts for a large portion of oil consumption, is not expected to recover fully this year. The service sector, and especially the financial sector, accounts for a larger portion of world GDP this year. The transportation sector, which accounts for almost half of the oil used worldwide, is heading toward turbulence. This sector has been artificially revived due to government stimulus plans. How long governments can afford to maintain such plans is a key challenge. Moreover, the transportation sector is highly sensitive to price increases. Any strong and lasting increase in pump prices will certainly dent demand, not only in the US, but also across the globe. Although the recent upward revision to GDP must be matched with oil demand, the
1Q08 1Q09 Volume % 2Q08 2Q09 Volume %North America 24.77 23.52 -1.25 -5.05 24.42 22.91 -1.51 -6.18Western Europe 15.29 14.90 -0.39 -2.52 15.07 14.24 -0.83 -5.54OECD Pacific 8.91 8.14 -0.77 -8.60 7.86 7.30 -0.56 -7.15Total OECD 48.96 46.56 -2.40 -4.91 47.35 44.45 -2.91 -6.14
Other Asia 9.80 9.73 -0.07 -0.70 9.75 9.89 0.15 1.51Latin America 5.60 5.63 0.02 0.42 5.84 5.83 -0.01 -0.22Middle East 6.77 6.96 0.19 2.87 6.87 7.08 0.21 2.99Africa 3.22 3.27 0.05 1.54 3.19 3.24 0.06 1.77Total DCs 25.39 25.59 0.20 0.78 25.65 26.04 0.40 1.54
FSU 4.17 3.81 -0.36 -8.71 3.79 3.70 -0.09 -2.27Other Europe 0.79 0.74 -0.05 -6.85 0.72 0.69 -0.03 -3.62China 7.97 7.61 -0.37 -4.58 8.17 8.38 0.22 2.67Total "Other Regions" 12.94 12.16 -0.78 -6.05 12.67 12.78 0.11 0.83
Total world 87.30 84.31 -2.99 -3.42 85.68 83.27 -2.40 -2.81
Totals may not add due to independent rounding.
Change 2009/08 Change 2009/08Table 6: First and second quarter world oil demand comparison for 2009, mb/d
3Q08 3Q09 Volume % 4Q08 4Q09 Volume %North America 23.57 23.25 -0.33 -1.39 23.93 23.50 -0.43 -1.80Western Europe 15.53 14.46 -1.06 -6.83 15.44 14.49 -0.94 -6.12OECD Pacific 7.54 7.27 -0.26 -3.50 7.97 8.01 0.03 0.44Total OECD 46.63 44.98 -1.65 -3.54 47.34 46.00 -1.34 -2.83
Other Asia 9.47 9.76 0.30 3.15 9.43 9.94 0.51 5.38Latin America 5.97 6.04 0.07 1.14 5.81 6.02 0.21 3.68Middle East 7.09 7.31 0.22 3.07 6.86 7.04 0.18 2.58Africa 3.12 3.16 0.05 1.46 3.21 3.30 0.09 2.88Total DCs 25.64 26.27 0.63 2.45 25.31 26.30 0.99 3.91
FSU 4.22 4.14 -0.08 -1.94 4.24 4.18 -0.06 -1.41Other Europe 0.73 0.71 -0.02 -2.81 0.78 0.76 -0.02 -2.62China 8.10 8.56 0.45 5.58 7.65 8.26 0.61 7.99Total "Other Regions" 13.06 13.41 0.35 2.68 12.66 13.19 0.53 4.19
Total world 85.33 84.66 -0.67 -0.79 85.31 85.49 0.18 0.21
Totals may not add due to independent rounding.
Change 2009/08Change 2009/08Table 7: Third and fourth quarter world oil demand comparison for 2009, mb/d
-300
-200
-100
0
100
200
300
-300
-200
-100
0
100
200
300
LPG Naphtha Gasoline Jet/Kero Gas/Diesel oil
Residual fuels
Other products
kb/dkb/dGraph 13: Forecasted y-o-y growth in 2010 world oil demand
_________________________________________________________________________________________________________________________________________Monthly Oil Market Report
May 2010 23
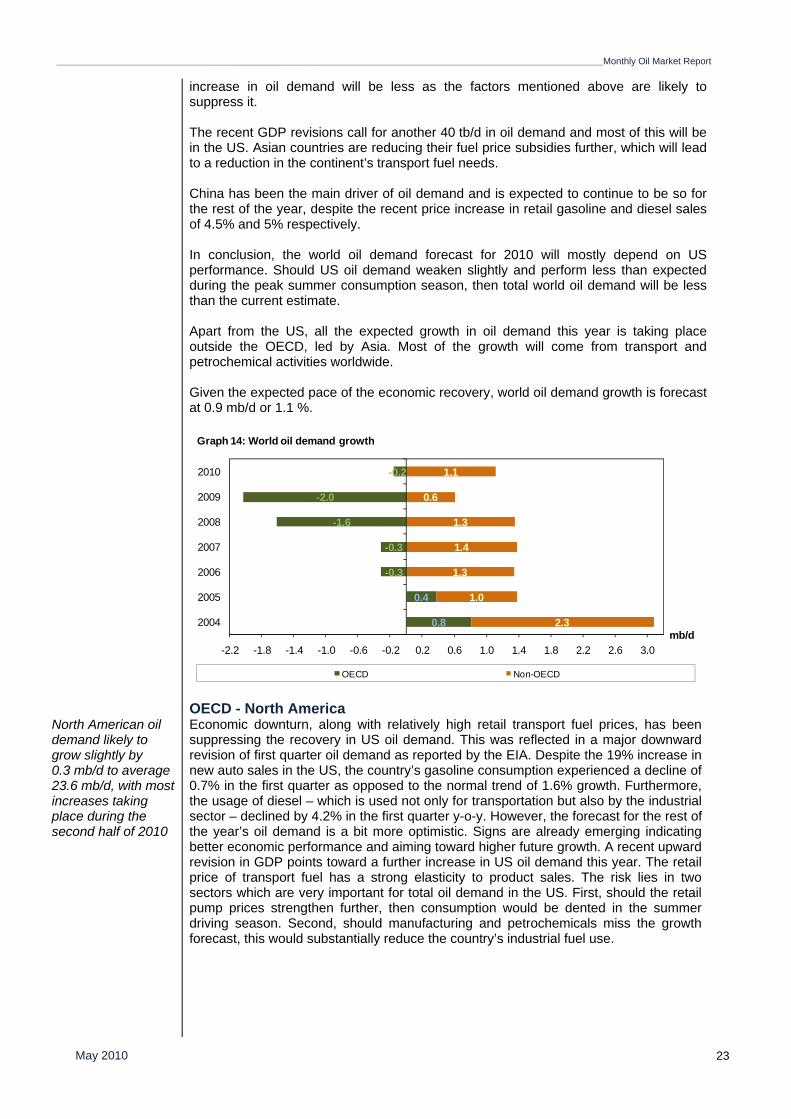
increase in oil demand will be less as the factors mentioned above are likely to suppress it. The recent GDP revisions call for another 40 tb/d in oil demand and most of this will be in the US. Asian countries are reducing their fuel price subsidies further, which will lead to a reduction in the continent’s transport fuel needs. China has been the main driver of oil demand and is expected to continue to be so for the rest of the year, despite the recent price increase in retail gasoline and diesel sales of 4.5% and 5% respectively. In conclusion, the world oil demand forecast for 2010 will mostly depend on US performance. Should US oil demand weaken slightly and perform less than expected during the peak summer consumption season, then total world oil demand will be less than the current estimate. Apart from the US, all the expected growth in oil demand this year is taking place outside the OECD, led by Asia. Most of the growth will come from transport and petrochemical activities worldwide. Given the expected pace of the economic recovery, world oil demand growth is forecast at 0.9 mb/d or 1.1 %.
OECD - North AmericaNorth American oil demand likely to grow slightly by 0.3 mb/d to average 23.6 mb/d, with most increases taking place during the second half of 2010
Economic downturn, along with relatively high retail transport fuel prices, has been suppressing the recovery in US oil demand. This was reflected in a major downward revision of first quarter oil demand as reported by the EIA. Despite the 19% increase in new auto sales in the US, the country’s gasoline consumption experienced a decline of 0.7% in the first quarter as opposed to the normal trend of 1.6% growth. Furthermore, the usage of diesel – which is used not only for transportation but also by the industrial sector – declined by 4.2% in the first quarter y-o-y. However, the forecast for the rest of the year’s oil demand is a bit more optimistic. Signs are already emerging indicating better economic performance and aiming toward higher future growth. A recent upward revision in GDP points toward a further increase in US oil demand this year. The retail price of transport fuel has a strong elasticity to product sales. The risk lies in two sectors which are very important for total oil demand in the US. First, should the retail pump prices strengthen further, then consumption would be dented in the summer driving season. Second, should manufacturing and petrochemicals miss the growth forecast, this would substantially reduce the country’s industrial fuel use.
0.8
0.4
-0.3
-0.3
-1.6
-2.0
-0.2
2.3
1.0
1.3
1.4
1.3
0.6
1.1
-2.2 -1.8 -1.4 -1.0 -0.6 -0.2 0.2 0.6 1.0 1.4 1.8 2.2 2.6 3.0
2004
2005
2006
2007
2008
2009
2010
mb/d
OECD Non-OECD
Graph 14: World oil demand growth
Monthly Oil Market Report_________________________________________________________________________________________________________________________________________
May 2010 24
Mexican oil demand has kept its February healthy trend. March data indicated 3.2% growth in the country’s domestic sales of petroleum products. Most of the growth was attributed to transport fuel, especially gasoline. Given not only the sales of new cars but also miles driven in Mexico, gasoline and diesel demand grew by 7% and 9% y-o-y in March. Higher demand for air travel boosted demand for jet fuel by an extra 2%. Due to the steep decline in January, first quarter oil demand grew by only 0.8%. It is forecast that Mexican oil demand will grow by 1.3% in 2010.
As in Mexico, Canadian petroleum product consumption in the first quarter is assessed at 60 tb/d growth and is forecast to perform well all year long. However, there is a downward risk as the economy depends greatly on the US. Recent March data indicates a strong increase in transport fuel usage due primarily to the low base last year. The country’s March oil demand grew by 5.4% or 87 tb/d y-o-y to average 1.7 mb/d. North American oil demand is expected to grow slightly by 0.3 mb/d y-o-y to average 23.6 mb/d, with most increases taking place during the second half of 2010.
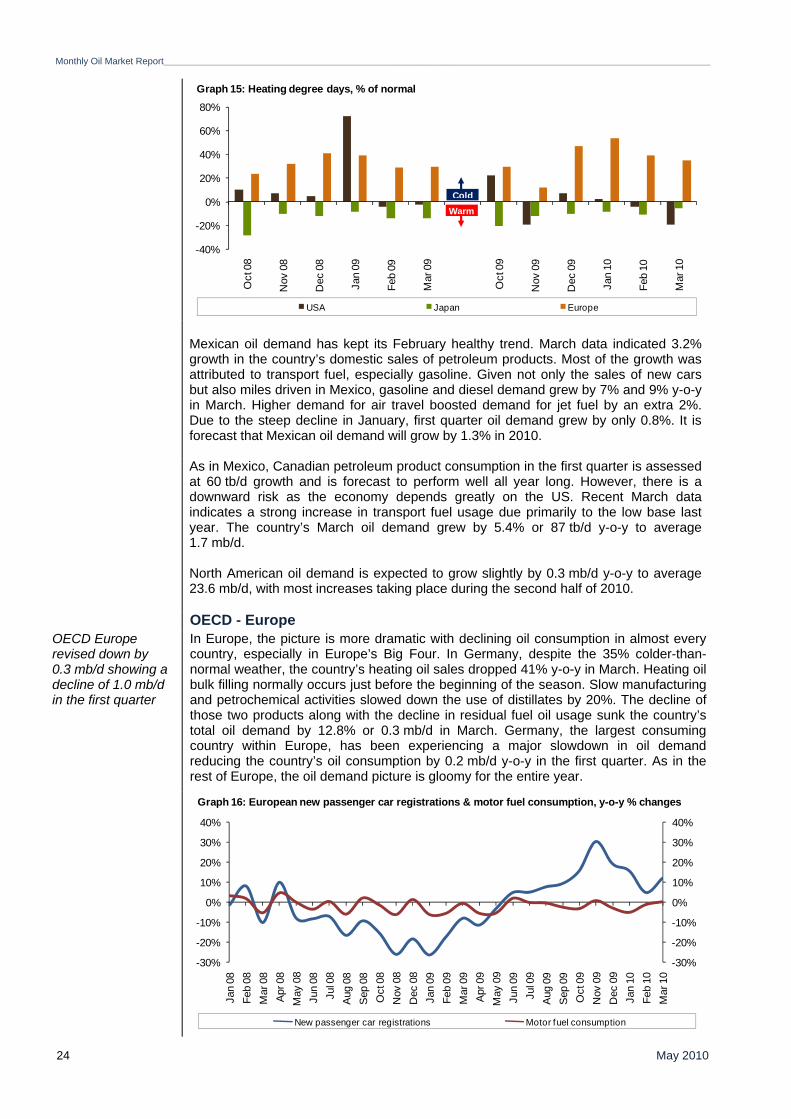
OECD - Europe OECD Europe revised down by 0.3 mb/d showing a decline of 1.0 mb/d in the first quarter
In Europe, the picture is more dramatic with declining oil consumption in almost every country, especially in Europe’s Big Four. In Germany, despite the 35% colder-than-normal weather, the country’s heating oil sales dropped 41% y-o-y in March. Heating oil bulk filling normally occurs just before the beginning of the season. Slow manufacturing and petrochemical activities slowed down the use of distillates by 20%. The decline of those two products along with the decline in residual fuel oil usage sunk the country’s total oil demand by 12.8% or 0.3 mb/d in March. Germany, the largest consuming country within Europe, has been experiencing a major slowdown in oil demand reducing the country’s oil consumption by 0.2 mb/d y-o-y in the first quarter. As in the rest of Europe, the oil demand picture is gloomy for the entire year.
-40%
-20%
0%
20%
40%
60%
80%
Oct
08
Nov
08
Dec
08
Jan
09
Feb
09
Mar
09
Oct
09
Nov
09
Dec
09
Jan
10
Feb
10
Mar
10
Graph 15: Heating degree days, % of normal
USA Japan Europe
WarmCold
-30%
-20%
-10%
0%
10%
20%
30%
40%
-30%
-20%
-10%
0%
10%
20%
30%
40%
Jan
08Fe
b 08
Mar
08
Apr 0
8M
ay 0
8Ju
n 08
Jul 0
8A
ug 0
8S
ep 0
8O
ct 0
8N
ov 0
8D
ec 0
8Ja
n 09
Feb
09M
ar 0
9Ap
r 09
May
09
Jun
09Ju
l 09
Aug
09
Sep
09
Oct
09
Nov
09
Dec
09
Jan
10Fe
b 10
Mar
10
New passenger car registrations Motor fuel consumption
Graph 16: European new passenger car registrations & motor fuel consumption, y-o-y % changes
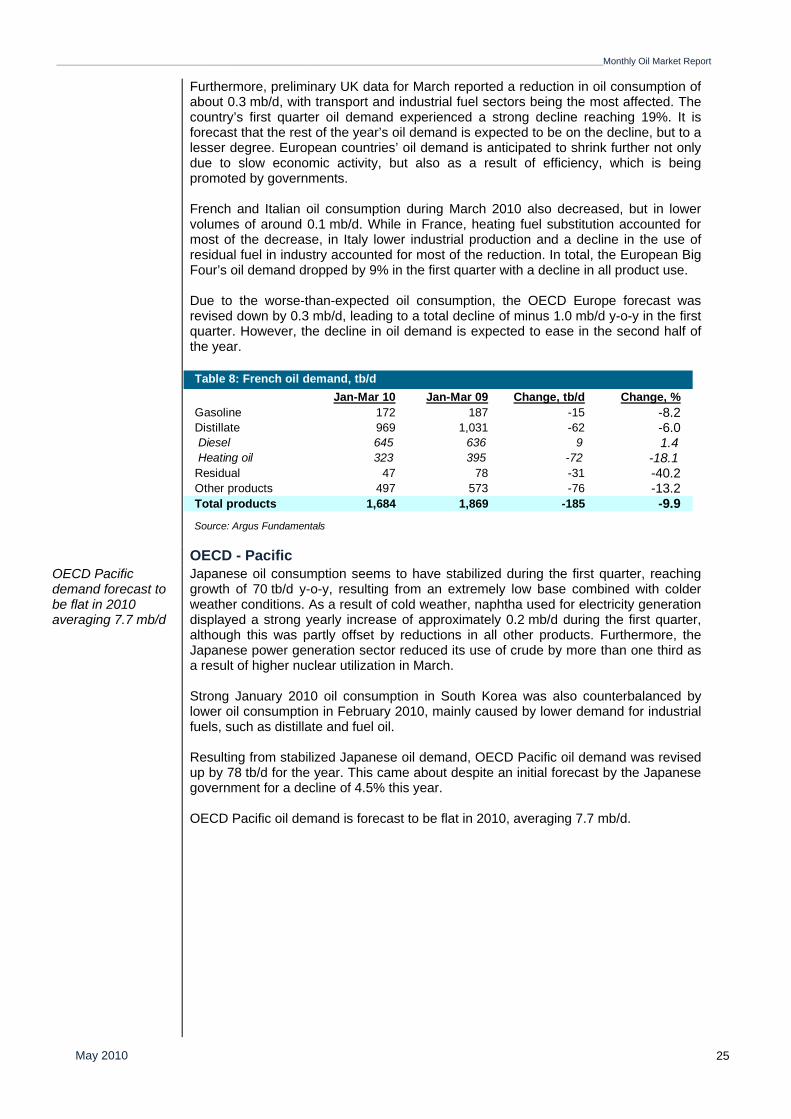
_________________________________________________________________________________________________________________________________________Monthly Oil Market Report
May 2010 25
Furthermore, preliminary UK data for March reported a reduction in oil consumption of about 0.3 mb/d, with transport and industrial fuel sectors being the most affected. The country’s first quarter oil demand experienced a strong decline reaching 19%. It is forecast that the rest of the year’s oil demand is expected to be on the decline, but to a lesser degree. European countries’ oil demand is anticipated to shrink further not only due to slow economic activity, but also as a result of efficiency, which is being promoted by governments. French and Italian oil consumption during March 2010 also decreased, but in lower volumes of around 0.1 mb/d. While in France, heating fuel substitution accounted for most of the decrease, in Italy lower industrial production and a decline in the use of residual fuel in industry accounted for most of the reduction. In total, the European Big Four’s oil demand dropped by 9% in the first quarter with a decline in all product use. Due to the worse-than-expected oil consumption, the OECD Europe forecast was revised down by 0.3 mb/d, leading to a total decline of minus 1.0 mb/d y-o-y in the first quarter. However, the decline in oil demand is expected to ease in the second half of the year.
OECD - Pacific OECD Pacific demand forecast to be flat in 2010 averaging 7.7 mb/d
Japanese oil consumption seems to have stabilized during the first quarter, reaching growth of 70 tb/d y-o-y, resulting from an extremely low base combined with colder weather conditions. As a result of cold weather, naphtha used for electricity generation displayed a strong yearly increase of approximately 0.2 mb/d during the first quarter, although this was partly offset by reductions in all other products. Furthermore, the Japanese power generation sector reduced its use of crude by more than one third as a result of higher nuclear utilization in March. Strong January 2010 oil consumption in South Korea was also counterbalanced by lower oil consumption in February 2010, mainly caused by lower demand for industrial fuels, such as distillate and fuel oil. Resulting from stabilized Japanese oil demand, OECD Pacific oil demand was revised up by 78 tb/d for the year. This came about despite an initial forecast by the Japanese government for a decline of 4.5% this year. OECD Pacific oil demand is forecast to be flat in 2010, averaging 7.7 mb/d.
Jan-Mar 10 Jan-Mar 09 Change, tb/d Change, %Gasoline 172 187 -15 -8.2Distillate 969 1,031 -62 -6.0 Diesel 645 636 9 1.4 Heating oil 323 395 -72 -18.1Residual 47 78 -31 -40.2Other products 497 573 -76 -13.2Total products 1,684 1,869 -185 -9.9Source: Argus Fundamentals
Table 8: French oil demand, tb/d
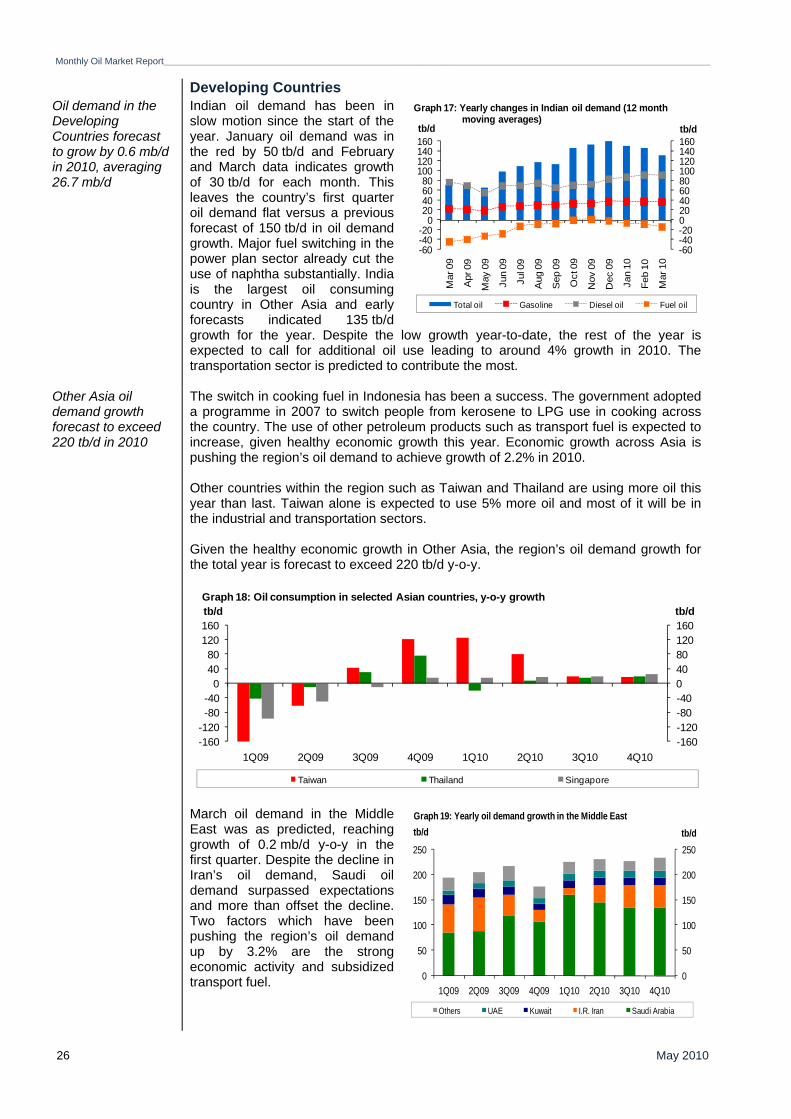
Monthly Oil Market Report_________________________________________________________________________________________________________________________________________
May 2010 26
Developing Countries Oil demand in the Developing Countries forecast to grow by 0.6 mb/d in 2010, averaging 26.7 mb/d
Indian oil demand has been in slow motion since the start of the year. January oil demand was in the red by 50 tb/d and February and March data indicates growth of 30 tb/d for each month. This leaves the country’s first quarter oil demand flat versus a previous forecast of 150 tb/d in oil demand growth. Major fuel switching in the power plan sector already cut the use of naphtha substantially. India is the largest oil consuming country in Other Asia and early forecasts indicated 135 tb/d growth for the year. Despite the low growth year-to-date, the rest of the year is expected to call for additional oil use leading to around 4% growth in 2010. The transportation sector is predicted to contribute the most.
Other Asia oil demand growth forecast to exceed 220 tb/d in 2010
The switch in cooking fuel in Indonesia has been a success. The government adopted a programme in 2007 to switch people from kerosene to LPG use in cooking across the country. The use of other petroleum products such as transport fuel is expected to increase, given healthy economic growth this year. Economic growth across Asia is pushing the region’s oil demand to achieve growth of 2.2% in 2010. Other countries within the region such as Taiwan and Thailand are using more oil this year than last. Taiwan alone is expected to use 5% more oil and most of it will be in the industrial and transportation sectors. Given the healthy economic growth in Other Asia, the region’s oil demand growth for the total year is forecast to exceed 220 tb/d y-o-y.
March oil demand in the Middle
East was as predicted, reaching growth of 0.2 mb/d y-o-y in the first quarter. Despite the decline in Iran’s oil demand, Saudi oil demand surpassed expectations and more than offset the decline. Two factors which have been pushing the region’s oil demand up by 3.2% are the strong economic activity and subsidized transport fuel.
-160-120-80-4004080120160
-160-120-80-40
04080
120160
1Q09 2Q09 3Q09 4Q09 1Q10 2Q10 3Q10 4Q10
tb/dtb/dGraph 18: Oil consumption in selected Asian countries, y-o-y growth
Taiwan Thailand Singapore
-60-40-20020406080100120140160
-60-40-20
020406080
100120140160
Mar
09
Apr
09
May
09
Jun
09
Jul 0
9
Aug
09
Sep
09
Oct
09
Nov
09
Dec
09
Jan
10
Feb
10
Mar
10
tb/dtb/d
Total oil Gasoline Diesel oil Fuel oil
Graph 17: Yearly changes in Indian oil demand (12 monthmoving averages)
0
50
100
150
200
250
0
50
100
150
200
250
1Q09 2Q09 3Q09 4Q09 1Q10 2Q10 3Q10 4Q10
tb/dtb/d
Others UAE Kuwait I.R. Iran Saudi Arabia
Graph 19: Yearly oil demand growth in the Middle East
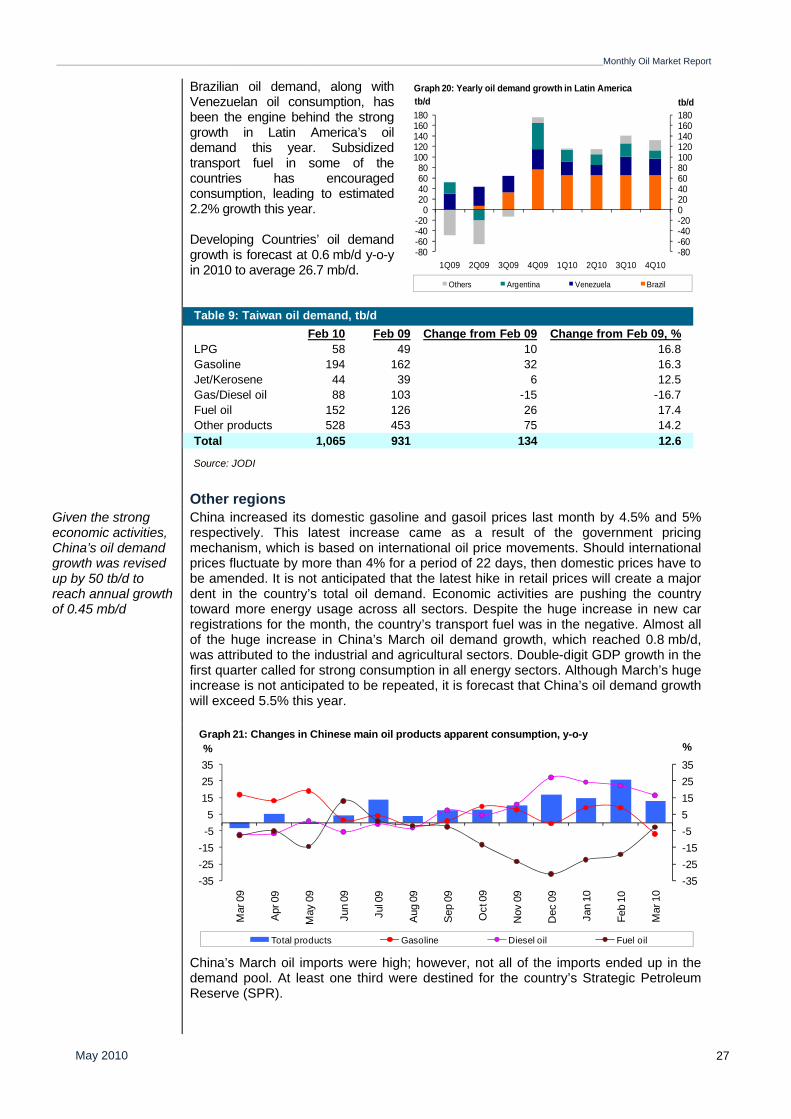
_________________________________________________________________________________________________________________________________________Monthly Oil Market Report
May 2010 27
Brazilian oil demand, along with Venezuelan oil consumption, has been the engine behind the strong growth in Latin America’s oil demand this year. Subsidized transport fuel in some of the countries has encouraged consumption, leading to estimated 2.2% growth this year. Developing Countries’ oil demand growth is forecast at 0.6 mb/d y-o-y in 2010 to average 26.7 mb/d.
Other regions Given the strong economic activities, China’s oil demand growth was revised up by 50 tb/d to reach annual growth of 0.45 mb/d
China increased its domestic gasoline and gasoil prices last month by 4.5% and 5% respectively. This latest increase came as a result of the government pricing mechanism, which is based on international oil price movements. Should international prices fluctuate by more than 4% for a period of 22 days, then domestic prices have to be amended. It is not anticipated that the latest hike in retail prices will create a major dent in the country’s total oil demand. Economic activities are pushing the country toward more energy usage across all sectors. Despite the huge increase in new car registrations for the month, the country’s transport fuel was in the negative. Almost all of the huge increase in China’s March oil demand growth, which reached 0.8 mb/d, was attributed to the industrial and agricultural sectors. Double-digit GDP growth in the first quarter called for strong consumption in all energy sectors. Although March’s huge increase is not anticipated to be repeated, it is forecast that China’s oil demand growth will exceed 5.5% this year.
China’s March oil imports were high; however, not all of the imports ended up in the demand pool. At least one third were destined for the country’s Strategic Petroleum Reserve (SPR).
Feb 10 Feb 09 Change from Feb 09 Change from Feb 09, %LPG 58 49 10 16.8Gasoline 194 162 32 16.3Jet/Kerosene 44 39 6 12.5Gas/Diesel oil 88 103 -15 -16.7Fuel oil 152 126 26 17.4Other products 528 453 75 14.2Total 1,065 931 134 12.6
Source: JODI
Table 9: Taiwan oil demand, tb/d
-35-25-15-55152535
-35-25-15-55
152535
Mar
09
Apr
09
May
09
Jun
09
Jul 0
9
Aug
09
Sep
09
Oct
09
Nov
09
Dec
09
Jan
10
Feb
10
Mar
10
%%
Total products Gasoline Diesel oil Fuel oil
Graph 21: Changes in Chinese main oil products apparent consumption, y-o-y
-80-60-40-20020406080100120140160180
-80-60-40-20
020406080
100120140160180
1Q09 2Q09 3Q09 4Q09 1Q10 2Q10 3Q10 4Q10
tb/dtb/d
Others Argentina Venezuela Brazil
Graph 20: Yearly oil demand growth in Latin America
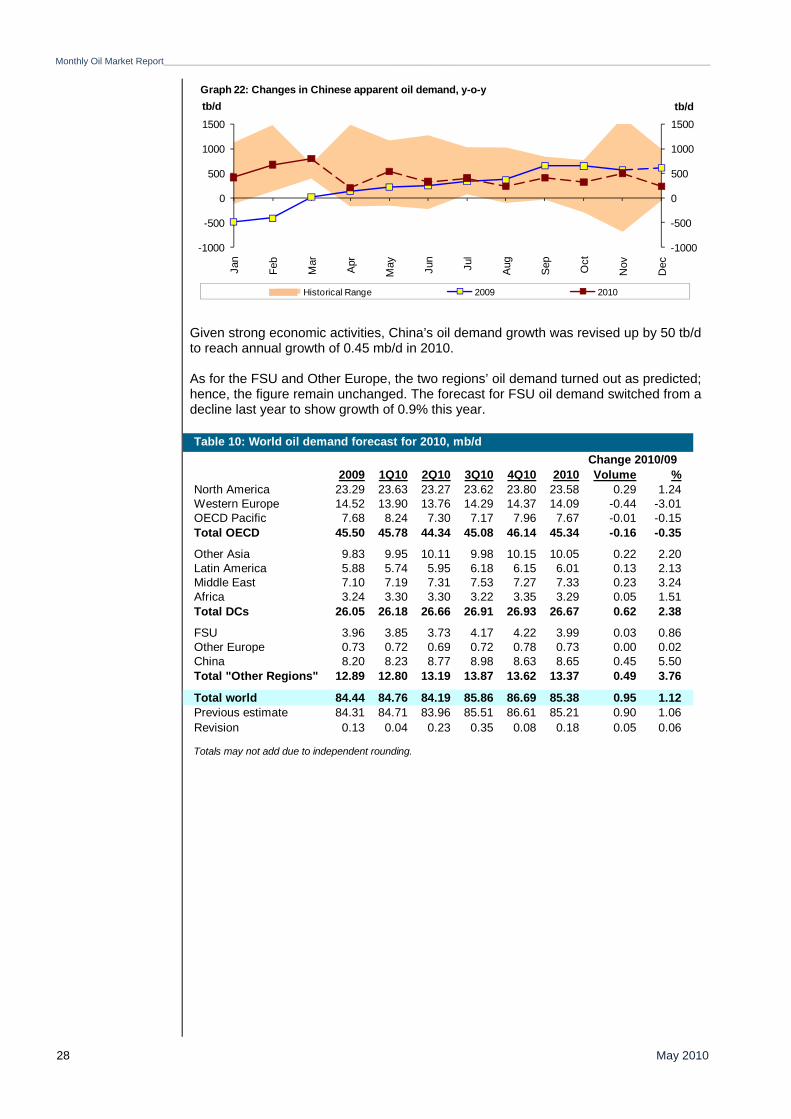
Monthly Oil Market Report_________________________________________________________________________________________________________________________________________
May 2010 28
Given strong economic activities, China’s oil demand growth was revised up by 50 tb/d
to reach annual growth of 0.45 mb/d in 2010. As for the FSU and Other Europe, the two regions’ oil demand turned out as predicted; hence, the figure remain unchanged. The forecast for FSU oil demand switched from a decline last year to show growth of 0.9% this year.
-1000
-500
0
500
1000
1500
-1000
-500
0
500
1000
1500
Jan
Feb
Mar
Apr
May Jun
Jul
Aug
Sep Oct
Nov
Dec
tb/dtb/d
Historical Range 2009 2010
Graph 22: Changes in Chinese apparent oil demand, y-o-y
2009 1Q10 2Q10 3Q10 4Q10 2010 Volume %North America 23.29 23.63 23.27 23.62 23.80 23.58 0.29 1.24Western Europe 14.52 13.90 13.76 14.29 14.37 14.09 -0.44 -3.01OECD Pacific 7.68 8.24 7.30 7.17 7.96 7.67 -0.01 -0.15Total OECD 45.50 45.78 44.34 45.08 46.14 45.34 -0.16 -0.35
Other Asia 9.83 9.95 10.11 9.98 10.15 10.05 0.22 2.20Latin America 5.88 5.74 5.95 6.18 6.15 6.01 0.13 2.13Middle East 7.10 7.19 7.31 7.53 7.27 7.33 0.23 3.24Africa 3.24 3.30 3.30 3.22 3.35 3.29 0.05 1.51Total DCs 26.05 26.18 26.66 26.91 26.93 26.67 0.62 2.38
FSU 3.96 3.85 3.73 4.17 4.22 3.99 0.03 0.86Other Europe 0.73 0.72 0.69 0.72 0.78 0.73 0.00 0.02China 8.20 8.23 8.77 8.98 8.63 8.65 0.45 5.50Total "Other Regions" 12.89 12.80 13.19 13.87 13.62 13.37 0.49 3.76
Total world 84.44 84.76 84.19 85.86 86.69 85.38 0.95 1.12Previous estimate 84.31 84.71 83.96 85.51 86.61 85.21 0.90 1.06Revision 0.13 0.04 0.23 0.35 0.08 0.18 0.05 0.06
Table 10: World oil demand forecast for 2010, mb/dChange 2010/09
Totals may not add due to independent rounding.
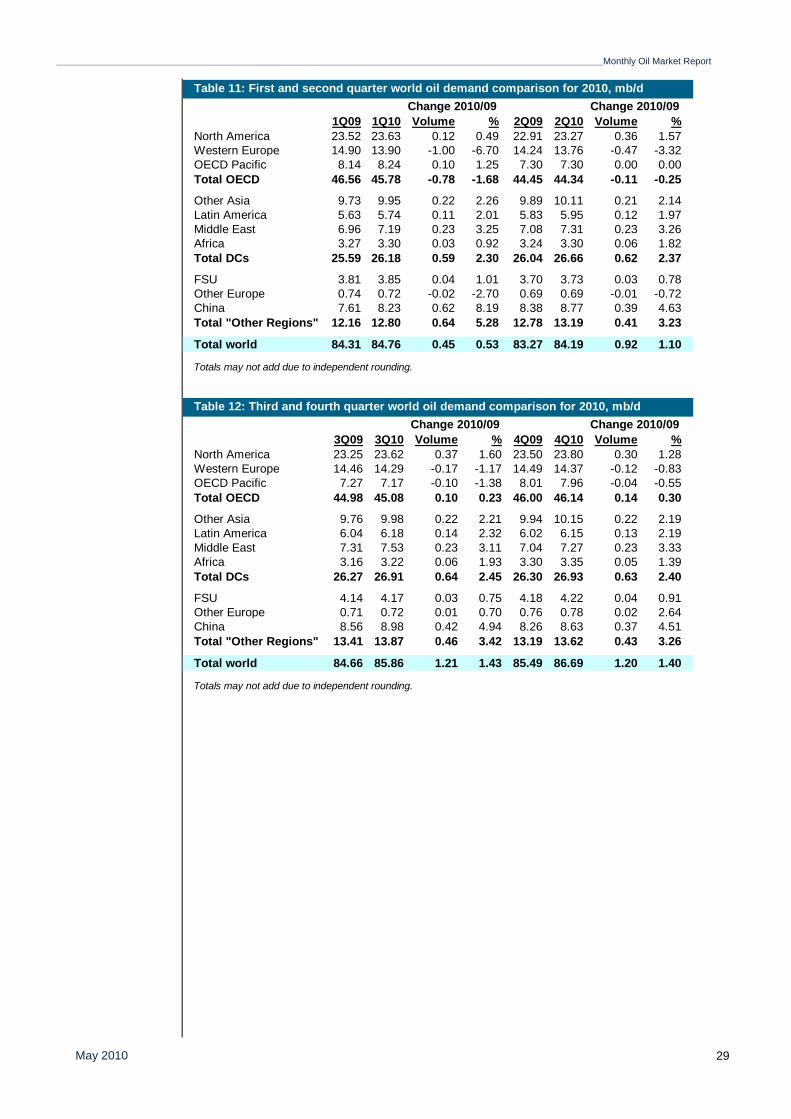
_________________________________________________________________________________________________________________________________________Monthly Oil Market Report
May 2010 29
1Q09 1Q10 Volume % 2Q09 2Q10 Volume %North America 23.52 23.63 0.12 0.49 22.91 23.27 0.36 1.57Western Europe 14.90 13.90 -1.00 -6.70 14.24 13.76 -0.47 -3.32OECD Pacific 8.14 8.24 0.10 1.25 7.30 7.30 0.00 0.00Total OECD 46.56 45.78 -0.78 -1.68 44.45 44.34 -0.11 -0.25
Other Asia 9.73 9.95 0.22 2.26 9.89 10.11 0.21 2.14Latin America 5.63 5.74 0.11 2.01 5.83 5.95 0.12 1.97Middle East 6.96 7.19 0.23 3.25 7.08 7.31 0.23 3.26Africa 3.27 3.30 0.03 0.92 3.24 3.30 0.06 1.82Total DCs 25.59 26.18 0.59 2.30 26.04 26.66 0.62 2.37
FSU 3.81 3.85 0.04 1.01 3.70 3.73 0.03 0.78Other Europe 0.74 0.72 -0.02 -2.70 0.69 0.69 -0.01 -0.72China 7.61 8.23 0.62 8.19 8.38 8.77 0.39 4.63Total "Other Regions" 12.16 12.80 0.64 5.28 12.78 13.19 0.41 3.23
Total world 84.31 84.76 0.45 0.53 83.27 84.19 0.92 1.10
Totals may not add due to independent rounding.
Table 11: First and second quarter world oil demand comparison for 2010, mb/dChange 2010/09 Change 2010/09
3Q09 3Q10 Volume % 4Q09 4Q10 Volume %North America 23.25 23.62 0.37 1.60 23.50 23.80 0.30 1.28Western Europe 14.46 14.29 -0.17 -1.17 14.49 14.37 -0.12 -0.83OECD Pacific 7.27 7.17 -0.10 -1.38 8.01 7.96 -0.04 -0.55Total OECD 44.98 45.08 0.10 0.23 46.00 46.14 0.14 0.30
Other Asia 9.76 9.98 0.22 2.21 9.94 10.15 0.22 2.19Latin America 6.04 6.18 0.14 2.32 6.02 6.15 0.13 2.19Middle East 7.31 7.53 0.23 3.11 7.04 7.27 0.23 3.33Africa 3.16 3.22 0.06 1.93 3.30 3.35 0.05 1.39Total DCs 26.27 26.91 0.64 2.45 26.30 26.93 0.63 2.40
FSU 4.14 4.17 0.03 0.75 4.18 4.22 0.04 0.91Other Europe 0.71 0.72 0.01 0.70 0.76 0.78 0.02 2.64China 8.56 8.98 0.42 4.94 8.26 8.63 0.37 4.51Total "Other Regions" 13.41 13.87 0.46 3.42 13.19 13.62 0.43 3.26
Total world 84.66 85.86 1.21 1.43 85.49 86.69 1.20 1.40
Totals may not add due to independent rounding.
Table 12: Third and fourth quarter world oil demand comparison for 2010, mb/dChange 2010/09 Change 2010/09
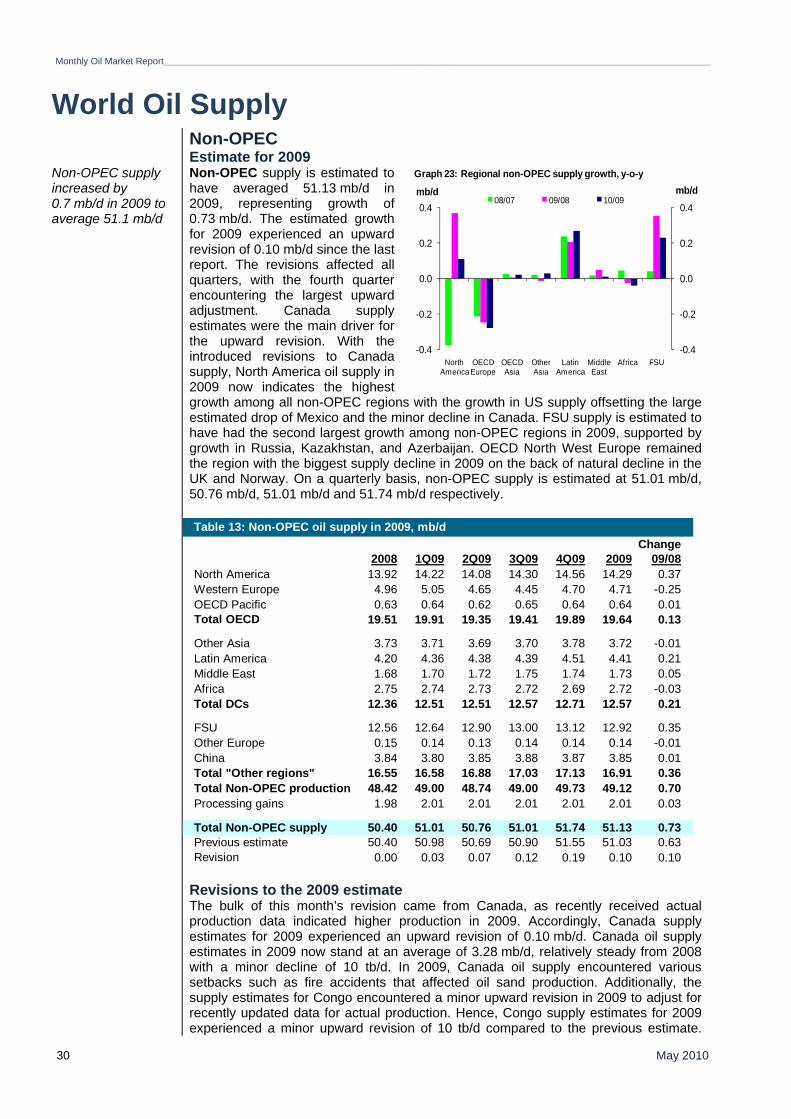
Monthly Oil Market Report_________________________________________________________________________________________________________________________________________
May 2010 30
World Oil Supply Non-OPEC Estimate for 2009 Non-OPEC supply increased by 0.7 mb/d in 2009 to average 51.1 mb/d
Non-OPEC supply is estimated to have averaged 51.13 mb/d in 2009, representing growth of 0.73 mb/d. The estimated growth for 2009 experienced an upward revision of 0.10 mb/d since the last report. The revisions affected all quarters, with the fourth quarter encountering the largest upward adjustment. Canada supply estimates were the main driver for the upward revision. With the introduced revisions to Canada supply, North America oil supply in 2009 now indicates the highest growth among all non-OPEC regions with the growth in US supply offsetting the large estimated drop of Mexico and the minor decline in Canada. FSU supply is estimated to have had the second largest growth among non-OPEC regions in 2009, supported by growth in Russia, Kazakhstan, and Azerbaijan. OECD North West Europe remained the region with the biggest supply decline in 2009 on the back of natural decline in the UK and Norway. On a quarterly basis, non-OPEC supply is estimated at 51.01 mb/d, 50.76 mb/d, 51.01 mb/d and 51.74 mb/d respectively.
Revisions to the 2009 estimate The bulk of this month’s revision came from Canada, as recently received actual
production data indicated higher production in 2009. Accordingly, Canada supply estimates for 2009 experienced an upward revision of 0.10 mb/d. Canada oil supply estimates in 2009 now stand at an average of 3.28 mb/d, relatively steady from 2008 with a minor decline of 10 tb/d. In 2009, Canada oil supply encountered various setbacks such as fire accidents that affected oil sand production. Additionally, the supply estimates for Congo encountered a minor upward revision in 2009 to adjust for recently updated data for actual production. Hence, Congo supply estimates for 2009 experienced a minor upward revision of 10 tb/d compared to the previous estimate.
Table 13: Non-OPEC oil supply in 2009, mb/dChange
2008 1Q09 2Q09 3Q09 4Q09 2009 09/08North America 13.92 14.22 14.08 14.30 14.56 14.29 0.37Western Europe 4.96 5.05 4.65 4.45 4.70 4.71 -0.25OECD Pacific 0.63 0.64 0.62 0.65 0.64 0.64 0.01Total OECD 19.51 19.91 19.35 19.41 19.89 19.64 0.13
Other Asia 3.73 3.71 3.69 3.70 3.78 3.72 -0.01Latin America 4.20 4.36 4.38 4.39 4.51 4.41 0.21Middle East 1.68 1.70 1.72 1.75 1.74 1.73 0.05Africa 2.75 2.74 2.73 2.72 2.69 2.72 -0.03Total DCs 12.36 12.51 12.51 12.57 12.71 12.57 0.21
FSU 12.56 12.64 12.90 13.00 13.12 12.92 0.35Other Europe 0.15 0.14 0.13 0.14 0.14 0.14 -0.01China 3.84 3.80 3.85 3.88 3.87 3.85 0.01Total "Other regions" 16.55 16.58 16.88 17.03 17.13 16.91 0.36Total Non-OPEC production 48.42 49.00 48.74 49.00 49.73 49.12 0.70Processing gains 1.98 2.01 2.01 2.01 2.01 2.01 0.03
Total Non-OPEC supply 50.40 51.01 50.76 51.01 51.74 51.13 0.73Previous estimate 50.40 50.98 50.69 50.90 51.55 51.03 0.63Revision 0.00 0.03 0.07 0.12 0.19 0.10 0.10
-0.4
-0.2
0.0
0.2
0.4
-0.4
-0.2
0.0
0.2
0.4
North America
OECD Europe
OECD Asia
Other Asia
Latin America
Middle East
Africa FSU
mb/dmb/d08/07 09/08 10/09
Graph 23: Regional non-OPEC supply growth, y-o-y
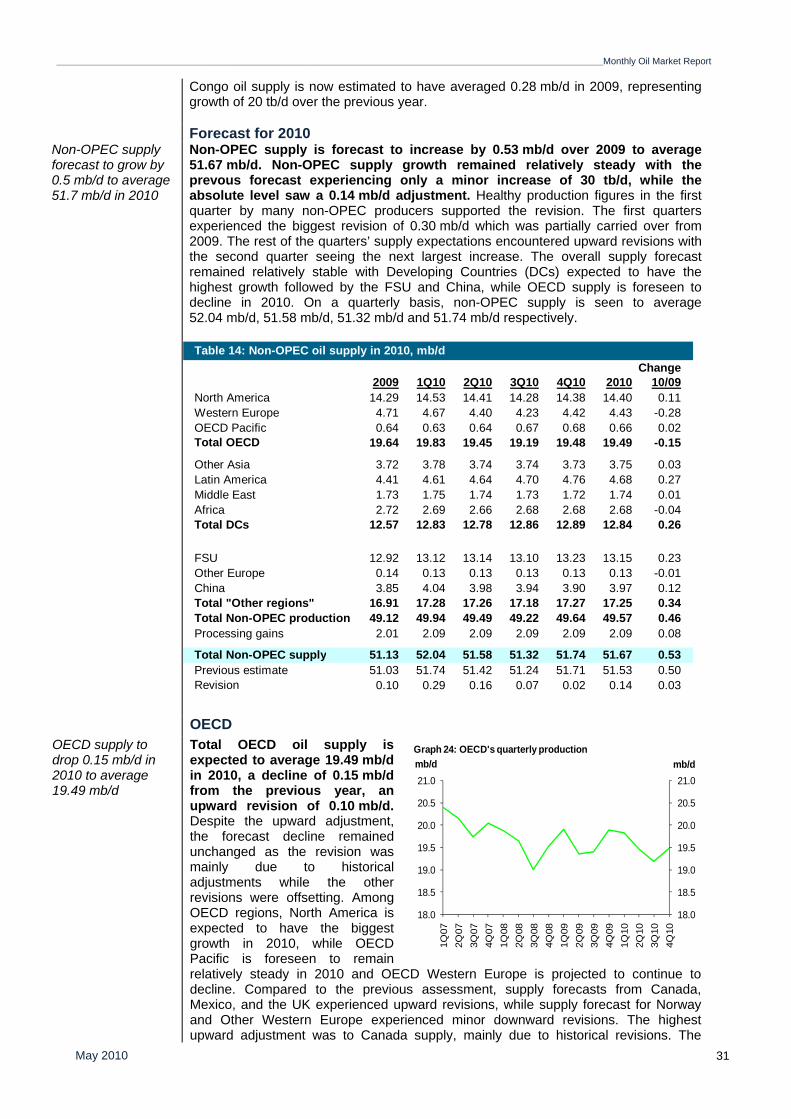
_________________________________________________________________________________________________________________________________________Monthly Oil Market Report
May 2010 31
Congo oil supply is now estimated to have averaged 0.28 mb/d in 2009, representing growth of 20 tb/d over the previous year.
Forecast for 2010 Non-OPEC supply forecast to grow by 0.5 mb/d to average 51.7 mb/d in 2010
Non-OPEC supply is forecast to increase by 0.53 mb/d over 2009 to average 51.67 mb/d. Non-OPEC supply growth remained relatively steady with the prevous forecast experiencing only a minor increase of 30 tb/d, while the absolute level saw a 0.14 mb/d adjustment. Healthy production figures in the first quarter by many non-OPEC producers supported the revision. The first quarters experienced the biggest revision of 0.30 mb/d which was partially carried over from 2009. The rest of the quarters’ supply expectations encountered upward revisions with the second quarter seeing the next largest increase. The overall supply forecast remained relatively stable with Developing Countries (DCs) expected to have the highest growth followed by the FSU and China, while OECD supply is foreseen to decline in 2010. On a quarterly basis, non-OPEC supply is seen to average 52.04 mb/d, 51.58 mb/d, 51.32 mb/d and 51.74 mb/d respectively.
OECD OECD supply to drop 0.15 mb/d in 2010 to average 19.49 mb/d
Total OECD oil supply is expected to average 19.49 mb/d in 2010, a decline of 0.15 mb/d from the previous year, an upward revision of 0.10 mb/d. Despite the upward adjustment, the forecast decline remained unchanged as the revision was mainly due to historical adjustments while the other revisions were offsetting. Among OECD regions, North America is expected to have the biggest growth in 2010, while OECD Pacific is foreseen to remain relatively steady in 2010 and OECD Western Europe is projected to continue to decline. Compared to the previous assessment, supply forecasts from Canada, Mexico, and the UK experienced upward revisions, while supply forecast for Norway and Other Western Europe experienced minor downward revisions. The highest upward adjustment was to Canada supply, mainly due to historical revisions. The
Table 14: Non-OPEC oil supply in 2010, mb/dChange
2009 1Q10 2Q10 3Q10 4Q10 2010 10/09North America 14.29 14.53 14.41 14.28 14.38 14.40 0.11Western Europe 4.71 4.67 4.40 4.23 4.42 4.43 -0.28OECD Pacific 0.64 0.63 0.64 0.67 0.68 0.66 0.02Total OECD 19.64 19.83 19.45 19.19 19.48 19.49 -0.15
Other Asia 3.72 3.78 3.74 3.74 3.73 3.75 0.03Latin America 4.41 4.61 4.64 4.70 4.76 4.68 0.27Middle East 1.73 1.75 1.74 1.73 1.72 1.74 0.01Africa 2.72 2.69 2.66 2.68 2.68 2.68 -0.04Total DCs 12.57 12.83 12.78 12.86 12.89 12.84 0.26
FSU 12.92 13.12 13.14 13.10 13.23 13.15 0.23Other Europe 0.14 0.13 0.13 0.13 0.13 0.13 -0.01China 3.85 4.04 3.98 3.94 3.90 3.97 0.12Total "Other regions" 16.91 17.28 17.26 17.18 17.27 17.25 0.34Total Non-OPEC production 49.12 49.94 49.49 49.22 49.64 49.57 0.46Processing gains 2.01 2.09 2.09 2.09 2.09 2.09 0.08
Total Non-OPEC supply 51.13 52.04 51.58 51.32 51.74 51.67 0.53Previous estimate 51.03 51.74 51.42 51.24 51.71 51.53 0.50Revision 0.10 0.29 0.16 0.07 0.02 0.14 0.03
18.0
18.5
19.0
19.5
20.0
20.5
21.0
18.0
18.5
19.0
19.5
20.0
20.5
21.0
1Q07
2Q07
3Q07
4Q07
1Q08
2Q08
3Q08
4Q08
1Q09
2Q09
3Q09
4Q09
1Q10
2Q10
3Q10
4Q10
mb/dmb/dGraph 24: OECD's quarterly production
Monthly Oil Market Report_________________________________________________________________________________________________________________________________________
May 2010 32
anticipated growth from North America is seen to offset part of the expected decline in OECD Western Europe. On a quarterly basis, OECD oil supply is expected to average 19.83 mb/d, 19.45 mb/d, 19.19 mb/d and 19.48 mb/d respectively. Total OECD supply stood at 19.83 mb/d in first quarter of 2010, according to the preliminary data, which indicate a decline of around 0.10 mb/d, compared to the same period in 2009.
North America North America oil production is anticipated to average 14.40 mb/d in 2010, representing growth of 0.11 mb/d and an upward revision of 0.12 mb/d. Mexico oil supply is expected to continue the declining trend in 2010, partially limiting the region’s anticipated growth that is supported by expectation of a healthy supply increase in the US and Canada. Despite the significant upward revision, regional growth forecast experienced only a minor increase of 20 tb/d compared to the previous month, mainly due to the historical revision to Canada oil supply. On a quarterly basis, North America oil supply in 2010 is expected to stand at 14.53 mb/d, 14.41 mb/d, 14.41 mb/d, and 14.38 mb/d respectively.
US US supply to average 8.23 mb/d in 2010, representing growth of 0.16 mb/d
Oil supply from the US is forecast to increase by 0.16 mb/d to average 8.23 mb/d in 2010, flat from the previous assessment. Despite the steady state, US quarterly oil supply encountered some revisions, with the first quarter supply experiencing an upward adjustment. In contrast, the rest of the year’s quarters were revised down slightly. The upward revision in the first quarter totaled 30 tb/d and was introduced to adjust for updated production data that was stronger than previously expected. On the other hand, the announced maintenance of the Thunder Horse field – the second largest field in terms of volume in the US – for more than two months with an anticipated large reduction in production, supported the downward revisions in the other quarters. The recent growth in the US oil supply is strongly supported by the deep water projects. Hence, the change in output of any of deep water projects will have a direct impact on the country’s production. The recent oil leak incident is not expected to have a major affect on t US short-term supply; however, the risk of the oil slick disturbing other Gulf of Mexico operations remains a possibility. Additionally, recent forecasts indicate that the 2010 Atlantic hurricane season will see above-average activity, with higher chances of a major hurricane making landfall than the long-term average. On a quarterly basis, US oil supply is seen to average 8.28 mb/d 8.19 mb/d, 8.19 mb/d, and 8.25 mb/d respectively. According to preliminary data, US oil supply is estimated to have averaged 8.34 mb/d in April, which is slightly higher than the average of the first quarter.
Canada and Mexico Canada supply to average 3.29 mb/d in 2010
Oil production from Canada is projected to increase by 50 tb/d to average 3.29 mb/d in 2010, indicating an upward revision of 0.10 mb/d from the last month. Despite the significant upward revision for total anticipated volume, growth experienced a minor upward revision of 10 tb/d. The historical revision on the back of revised production data for 2009 was the main reason behind the upward revision, in addition to the estimated healthy production figures in the first quarter. The ramp up of projects such as Syncrude, Horizon, and Long Lack supports production. Additionally, the expected startup of three satellite developments in the While Rose field in the second quarter is further supporting growth in Canadian supply. The Suncor repairs of the unit damage in the February fire has been completed and the unit is reported to be back in full capacity, which is another factor supporting oil production. Additionally, the Long Lake project reported a ramp-up of the steam output needed to liquefy the tarry bitumen in the sand, which has further added to the positive factors for Canada oil supply in 2010. On a quarterly basis, Canada’s production is anticipated to average 3.26 mb/d, 3.30 mb/d, 3.27 mb/d and 3.33 mb/d respectively.
The decline in Mexico production slowed in 1Q marking the lowest y-o-y quarterly decline since 3Q06
Mexican oil production is seen to average 2.88 mb/d in 2010, a decline of 0.10 mb/d over 2009, indicating an upward revision of 20 tb/d. Stable production in the first quarter of the year has necessitated the upward revision as it indicates a steady production level with improvement on the decline rate. The decline at Cantarell has slowed down while production at Ku-Maloob-Zaap (KMZ) has continued to edge higher, exceeding what was recently believed to be peak production. Actual production data in the first quarter is supporting the case of slowing the decline and stabilizing
_________________________________________________________________________________________________________________________________________Monthly Oil Market Report
May 2010 33
production. In March 2010, total oil production indicated a decline of less than 2% compared to March 2009, which is much lower than the 6% decline experienced in Mexico total production of 2009 compared to 2008. On a quarterly basis, Mexico’s oil supply is forecast to average 2.99 mb/d, 2.91 mb/d, 2.83 mb/d and 2.80 mb/d respectively. Preliminary data shows that Mexico production averaged 2.99 mb/d in March, which is steady compared to February production. The average of the first quarter remained at 2.99 mb/d, which is lower by 1.6% compared to the same quarter last year.
Western Europe Total OECD Western Europe oil production is foreseen to decline by 0.28 mb/d to
average 4.43 mb/d in 2010, a downward revision of 30 tb/d compared to the previous month. All quarters experienced some revisions with the first quarter experiencing the only positive adjustment while the rest of the year’s quarters encountered minor downward revisions. The upward revision came on the back of adjustment to recently updated production data in the first quarter, while various other issues necessitated the other minor downward revisions. On a quarterly basis, OECD Western Europe supply in 2010 is expected to average 4.67 mb/d, 4.40 mb/d, 4.22 mb/d, and 4.42 mb/d respectively. Preliminary first quarter estimates suggest a production level of 4.67 mb/d, slightly lower than the fourth quarter 2009.
Norway supply to be affected by a heavy turnaround season to show a drop of 0.14 mb/d in 2010
Norwegian oil supply is anticipated to decline by 0.14 mb/d to average 2.20 mb/d in 2010, indicating a downward revision of 20 tb/d compared to the previous month. The downward revision affected all quarters, with the first quarter influenced by the preliminary actual production data. The overall outlook for Norwegian supply remains on a declining trend, with most new fields being small satellite developments. Additionally, the biggest operator reported turnaround plans for 13 fields which have further affected the supply forecast during the second half of 2010. Preliminary actual production data for March indicates a decline compared to the previous month, mainly due to a shutdown at the Vale and Draugen fields. On the other hand, the Valund project has restarted operations in early May and is expected to add more volume in the second half of 2010. On a quarterly basis, Norway’s supply is forecast to average 2.31 mb/d, 2.17 mb/d, 2.08 mb/d and 2.23 mb/d respectively. First quarter supply is estimated to have averaged 2.31 mb/d, according to preliminary data, which indicates a y-o-y decline of 0.20 mb/d.
UK supply expected to average 1.39 mb/d in 2010
Oil supply from the UK is expected to decline by 90 tb/d to average 1.39 mb/d in 2010, an upward revision of 10 tb/d compared to last month. The upward revision mainly affected first quarter supply with preliminary production data suggesting healthier output than previously expected. However, UK supply is predicted to decline in the coming two quarters due to maintenance. Furthermore, a recent report indicates that the UK drilling activities have slowed in the first quarter to the lowest level in six years. Such a reduction in drilling activities is seen to influence production in the short term as well as in the medium- to long-term. On a quarterly basis, UK oil supply is foreseen to stand at 1.50 mb/d, 1.38 mb/d, 1.32 mb/d and 1.35 mb/d respectively. First quarter preliminary supply data indicates a y-o-y decline of 0.13 mb/d or 8%. Danish oil production is forecast to decline slightly by 20 tb/d to average 0.24 mb/d in 2010, flat from the previous month. Despite the steady state, Denmark’s supply profile encountered a minor downward revision in the first quarter that did not have an influence on the annual forecast. The minor downward revision was due to an adjustment to actual production figures. March oil supply showed a minor increase compared to February, mainly due to added volume from the Nini field in the Siri complex.
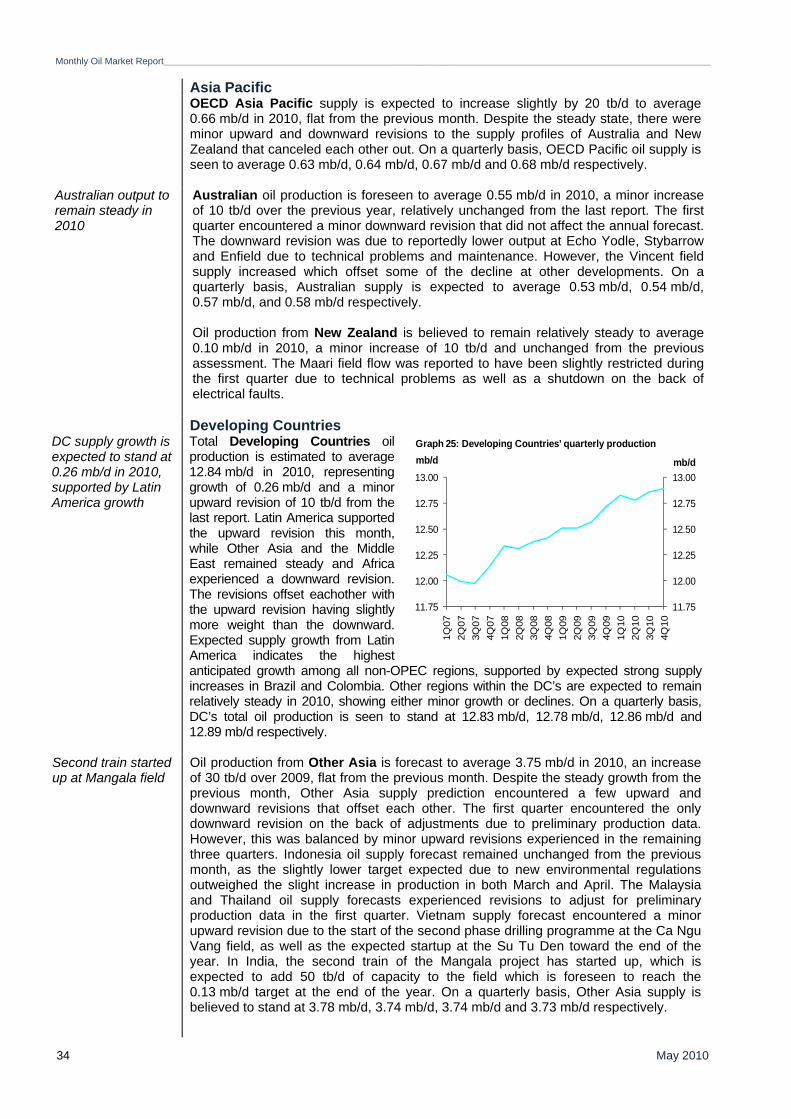
Monthly Oil Market Report_________________________________________________________________________________________________________________________________________
May 2010 34
Asia Pacific OECD Asia Pacific supply is expected to increase slightly by 20 tb/d to average
0.66 mb/d in 2010, flat from the previous month. Despite the steady state, there were minor upward and downward revisions to the supply profiles of Australia and New Zealand that canceled each other out. On a quarterly basis, OECD Pacific oil supply is seen to average 0.63 mb/d, 0.64 mb/d, 0.67 mb/d and 0.68 mb/d respectively.
Australian output to remain steady in 2010
Australian oil production is foreseen to average 0.55 mb/d in 2010, a minor increase of 10 tb/d over the previous year, relatively unchanged from the last report. The first quarter encountered a minor downward revision that did not affect the annual forecast. The downward revision was due to reportedly lower output at Echo Yodle, Stybarrow and Enfield due to technical problems and maintenance. However, the Vincent field supply increased which offset some of the decline at other developments. On a quarterly basis, Australian supply is expected to average 0.53 mb/d, 0.54 mb/d, 0.57 mb/d, and 0.58 mb/d respectively. Oil production from New Zealand is believed to remain relatively steady to average 0.10 mb/d in 2010, a minor increase of 10 tb/d and unchanged from the previous assessment. The Maari field flow was reported to have been slightly restricted during the first quarter due to technical problems as well as a shutdown on the back of electrical faults.
Developing Countries DC supply growth is expected to stand at 0.26 mb/d in 2010, supported by Latin America growth
Total Developing Countries oil production is estimated to average 12.84 mb/d in 2010, representing growth of 0.26 mb/d and a minor upward revision of 10 tb/d from the last report. Latin America supported the upward revision this month, while Other Asia and the Middle East remained steady and Africa experienced a downward revision. The revisions offset eachother with the upward revision having slightly more weight than the downward. Expected supply growth from Latin America indicates the highest anticipated growth among all non-OPEC regions, supported by expected strong supply increases in Brazil and Colombia. Other regions within the DC’s are expected to remain relatively steady in 2010, showing either minor growth or declines. On a quarterly basis, DC’s total oil production is seen to stand at 12.83 mb/d, 12.78 mb/d, 12.86 mb/d and 12.89 mb/d respectively.
Second train started up at Mangala field
Oil production from Other Asia is forecast to average 3.75 mb/d in 2010, an increase of 30 tb/d over 2009, flat from the previous month. Despite the steady growth from the previous month, Other Asia supply prediction encountered a few upward and downward revisions that offset each other. The first quarter encountered the only downward revision on the back of adjustments due to preliminary production data. However, this was balanced by minor upward revisions experienced in the remaining three quarters. Indonesia oil supply forecast remained unchanged from the previous month, as the slightly lower target expected due to new environmental regulations outweighed the slight increase in production in both March and April. The Malaysia and Thailand oil supply forecasts experienced revisions to adjust for preliminary production data in the first quarter. Vietnam supply forecast encountered a minor upward revision due to the start of the second phase drilling programme at the Ca Ngu Vang field, as well as the expected startup at the Su Tu Den toward the end of the year. In India, the second train of the Mangala project has started up, which is expected to add 50 tb/d of capacity to the field which is foreseen to reach the 0.13 mb/d target at the end of the year. On a quarterly basis, Other Asia supply is believed to stand at 3.78 mb/d, 3.74 mb/d, 3.74 mb/d and 3.73 mb/d respectively.
11.75
12.00
12.25
12.50
12.75
13.00
11.75
12.00
12.25
12.50
12.75
13.00
1Q07
2Q07
3Q07
4Q07
1Q08
2Q08
3Q08
4Q08
1Q09
2Q09
3Q09
4Q09
1Q10
2Q10
3Q10
4Q10
mb/dmb/dGraph 25: Developing Countries' quarterly production
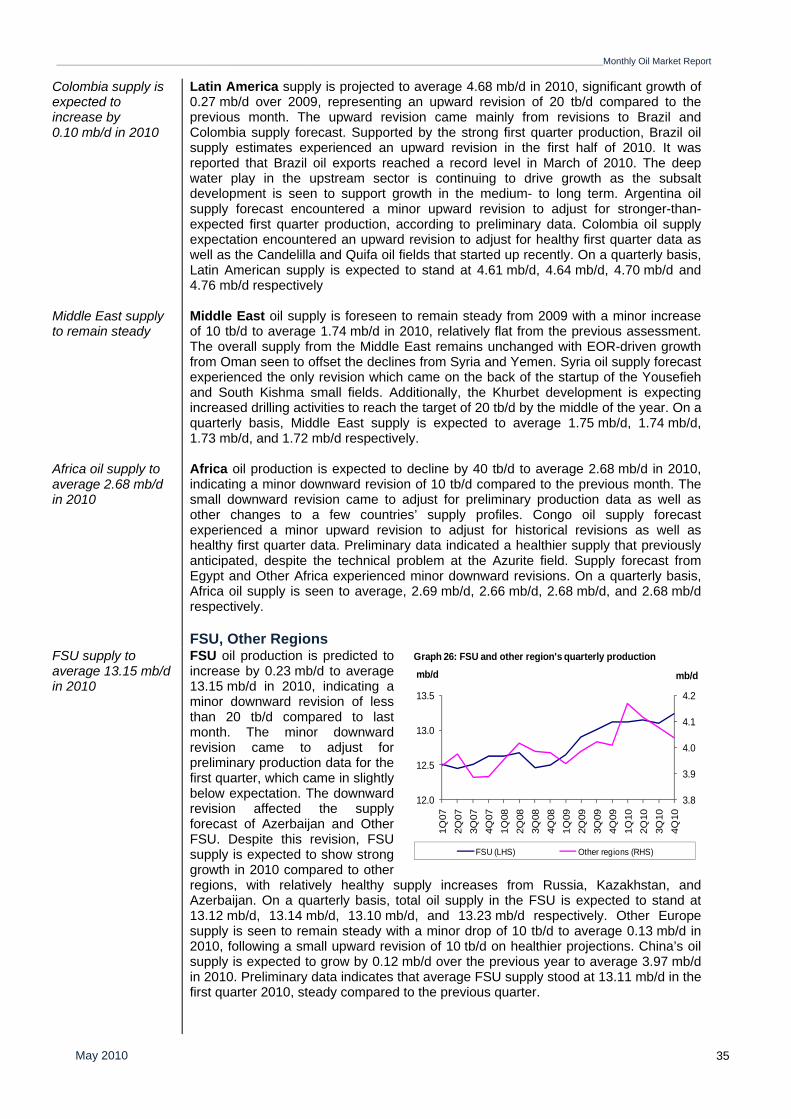
_________________________________________________________________________________________________________________________________________Monthly Oil Market Report
May 2010 35
Colombia supply is expected to increase by 0.10 mb/d in 2010
Latin America supply is projected to average 4.68 mb/d in 2010, significant growth of 0.27 mb/d over 2009, representing an upward revision of 20 tb/d compared to the previous month. The upward revision came mainly from revisions to Brazil and Colombia supply forecast. Supported by the strong first quarter production, Brazil oil supply estimates experienced an upward revision in the first half of 2010. It was reported that Brazil oil exports reached a record level in March of 2010. The deep water play in the upstream sector is continuing to drive growth as the subsalt development is seen to support growth in the medium- to long term. Argentina oil supply forecast encountered a minor upward revision to adjust for stronger-than-expected first quarter production, according to preliminary data. Colombia oil supply expectation encountered an upward revision to adjust for healthy first quarter data as well as the Candelilla and Quifa oil fields that started up recently. On a quarterly basis, Latin American supply is expected to stand at 4.61 mb/d, 4.64 mb/d, 4.70 mb/d and 4.76 mb/d respectively
Middle East supply to remain steady
Middle East oil supply is foreseen to remain steady from 2009 with a minor increase of 10 tb/d to average 1.74 mb/d in 2010, relatively flat from the previous assessment. The overall supply from the Middle East remains unchanged with EOR-driven growth from Oman seen to offset the declines from Syria and Yemen. Syria oil supply forecast experienced the only revision which came on the back of the startup of the Yousefieh and South Kishma small fields. Additionally, the Khurbet development is expecting increased drilling activities to reach the target of 20 tb/d by the middle of the year. On a quarterly basis, Middle East supply is expected to average 1.75 mb/d, 1.74 mb/d, 1.73 mb/d, and 1.72 mb/d respectively.
Africa oil supply to average 2.68 mb/d in 2010
Africa oil production is expected to decline by 40 tb/d to average 2.68 mb/d in 2010, indicating a minor downward revision of 10 tb/d compared to the previous month. The small downward revision came to adjust for preliminary production data as well as other changes to a few countries’ supply profiles. Congo oil supply forecast experienced a minor upward revision to adjust for historical revisions as well as healthy first quarter data. Preliminary data indicated a healthier supply that previously anticipated, despite the technical problem at the Azurite field. Supply forecast from Egypt and Other Africa experienced minor downward revisions. On a quarterly basis, Africa oil supply is seen to average, 2.69 mb/d, 2.66 mb/d, 2.68 mb/d, and 2.68 mb/d respectively.
FSU, Other Regions FSU supply to average 13.15 mb/d in 2010
FSU oil production is predicted to increase by 0.23 mb/d to average 13.15 mb/d in 2010, indicating a minor downward revision of less than 20 tb/d compared to last month. The minor downward revision came to adjust for preliminary production data for the first quarter, which came in slightly below expectation. The downward revision affected the supply forecast of Azerbaijan and Other FSU. Despite this revision, FSU supply is expected to show strong growth in 2010 compared to other regions, with relatively healthy supply increases from Russia, Kazakhstan, and Azerbaijan. On a quarterly basis, total oil supply in the FSU is expected to stand at 13.12 mb/d, 13.14 mb/d, 13.10 mb/d, and 13.23 mb/d respectively. Other Europe supply is seen to remain steady with a minor drop of 10 tb/d to average 0.13 mb/d in 2010, following a small upward revision of 10 tb/d on healthier projections. China’s oil supply is expected to grow by 0.12 mb/d over the previous year to average 3.97 mb/d in 2010. Preliminary data indicates that average FSU supply stood at 13.11 mb/d in the first quarter 2010, steady compared to the previous quarter.
3.8
3.9
4.0
4.1
4.2
12.0
12.5
13.0
13.5
1Q07
2Q07
3Q07
4Q07
1Q08
2Q08
3Q08
4Q08
1Q09
2Q09
3Q09
4Q09
1Q10
2Q10
3Q10
4Q10
mb/dmb/d
FSU (LHS) Other regions (RHS)
Graph 26: FSU and other region's quarterly production
Monthly Oil Market Report_________________________________________________________________________________________________________________________________________
May 2010 36
Russia Russia Yuri started up in the Caspian sea
Russian oil production is anticipated to increase by 90 tb/d to average 10.01 mb/d in 2010, unchanged from the previous month. The relatively healthy growth expected from Russia supply is mainly supported by new green field developments such as the Vankor field, which are seen to more than offset the decline at mature producing areas, despite the drop in investment following the financial crisis. The Yuri Korchagin field commenced production in the Caspian Sea, with supply expected to increase gradually toward the peak of 50 tb/d. The Vankor field is seen to continue the healthy growth in 2010. Also, the Tyamkinskoye field, part of the Uvat development, started production recently. Furthermore, the Odoptu field is expected to start up in the fourth quarter of this year at help stabilize the production at the Sakhalin project. According to preliminary data, Russia oil supply declined slightly in April from the previous month, yet remained above the 10.1 mb/d level. On a quarterly basis, Russian oil supply is seen to average at 10.09 mb/d, 10.03 mb/d, 9.99 mb/d and 9.95 mb/d respectively.
Caspian Kazakhstan supply to increase by 70 tb/d in 2010
Kazakh oil production is projected to average 1.61 mb/d in 2010, an increase of 70 tb/d over 2009, broadly unchanged from the previous report. Despite the steady state, there were small downward and upward adjustments that offset each other in the second and third quarters. The anticipated growth is supported by the Tengiz developments with the second generation project seen to strongly support production which is being maintained at near-capacity levels. Additionally, second quarter supply is expected to increase slightly which is evident in the export programmes of various pipelines in May, showing the highest levels so far in 2010. On a quarterly basis, Kazakhstan supply is expected to stand at 1.61 mb/d, 1.62 mb/d, 1.56 mb/d, and 1.65 mb/d respectively.
Azerbaijan supply to increase by 50 tb/d in 2010
Azeri oil production is forecast to average 1.07 mb/d in 2010, an increase of 50 tb/d over 2009 and a minor downward revision of less than 10 tb/d from the previous month. The revision was a result of an adjustment to preliminary actual production figures for the first quarter that came in slightly below expectation. However, the healthy growth level remains in the forecast, supported by the Azeri-Chirag-Guneshli (ACG) field. Similarly, Azerbaijan supply is expected to increase in the second quarter with the loading programme in May indicating the highest level so far in 2010. The field continues to add new volume supported by various projects. In the first quarter of 2010, ACG reported a production figure of 0.82 mb/d, which was 50 tb/d higher than field production in the same period last year. On a quarterly basis, Azerbaijan oil supply is estimated to average 0.98 mb/d, 1.05 mb/d, 1.10 mb/d, and 1.16 mb/d respectively.
China China supply to increase by 0.12 mb/d in 2010
Oil supply from China is expected to increase by 0.12 mb/d to average 3.97 mb/d in 2010, indicating an upward revision of 30 tb/d compared to the last report. The resumption of full production at the typhoon-damaged Huizhou field supported overall supply, requiring the upward revision. Additionally, strong supply data in the first quarter necessitated the adjustment. China first quarter supply stood at 4.04 mb/d, 0.24 mb/d higher compared to the same period last year, where some operators have restricted production in order to cut costs. On a quarterly basis, China’s oil supply is forecast to average 4.04 mb/d, 3.98 mb/d, 3.94 mb/d, and 3.90 mb/d respectively.
OPEC natural gas liquids and non-conventional oils OPEC NGLs and non-conventional oils are estimated to have averaged 4.35 mb/d in
2009, representing growth of 0.21 mb/d over the previous year. In 2010, OPEC NGLs and nonconventional oils are expected to increase by 0.52 mb/d over the previous year to average 4.87 mb/d.
Change Change Change2007 2008 08/07 1Q09 2Q09 3Q09 4Q09 2009 09/08 2010 10/09
Total OPEC 3.95 4.14 0.20 4.14 4.31 4.48 4.47 4.35 0.21 4.87 0.52
Table 15: OPEC NGLs + non-conventional oils, 2007-2010
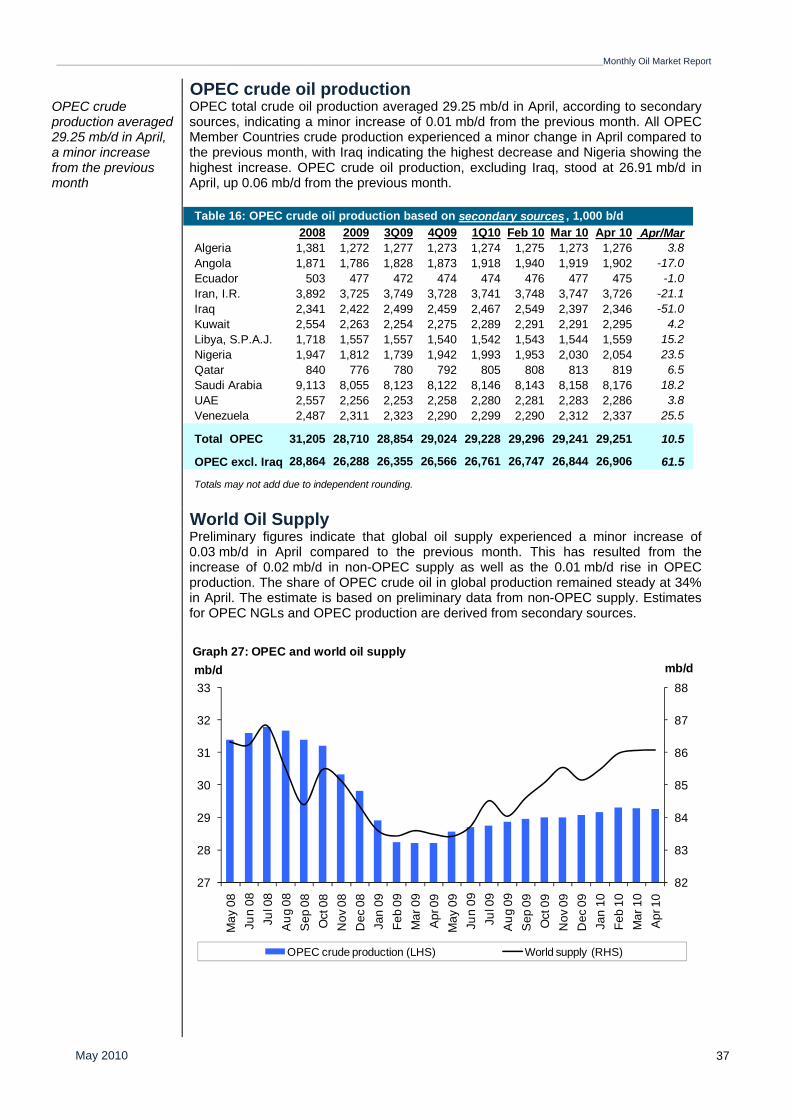
_________________________________________________________________________________________________________________________________________Monthly Oil Market Report
May 2010 37
OPEC crude oil production OPEC crude production averaged 29.25 mb/d in April, a minor increase from the previous month
OPEC total crude oil production averaged 29.25 mb/d in April, according to secondary sources, indicating a minor increase of 0.01 mb/d from the previous month. All OPEC Member Countries crude production experienced a minor change in April compared to the previous month, with Iraq indicating the highest decrease and Nigeria showing the highest increase. OPEC crude oil production, excluding Iraq, stood at 26.91 mb/d in April, up 0.06 mb/d from the previous month.
World Oil Supply
Preliminary figures indicate that global oil supply experienced a minor increase of 0.03 mb/d in April compared to the previous month. This has resulted from the increase of 0.02 mb/d in non-OPEC supply as well as the 0.01 mb/d rise in OPEC production. The share of OPEC crude oil in global production remained steady at 34% in April. The estimate is based on preliminary data from non-OPEC supply. Estimates for OPEC NGLs and OPEC production are derived from secondary sources.
Table 16: OPEC crude oil production based on secondary sources , 1,000 b/d2008 2009 3Q09 4Q09 1Q10 Feb 10 Mar 10 Apr 10 Apr/Mar
Algeria 1,381 1,272 1,277 1,273 1,274 1,275 1,273 1,276 3.8Angola 1,871 1,786 1,828 1,873 1,918 1,940 1,919 1,902 -17.0Ecuador 503 477 472 474 474 476 477 475 -1.0Iran, I.R. 3,892 3,725 3,749 3,728 3,741 3,748 3,747 3,726 -21.1Iraq 2,341 2,422 2,499 2,459 2,467 2,549 2,397 2,346 -51.0Kuwait 2,554 2,263 2,254 2,275 2,289 2,291 2,291 2,295 4.2Libya, S.P.A.J. 1,718 1,557 1,557 1,540 1,542 1,543 1,544 1,559 15.2Nigeria 1,947 1,812 1,739 1,942 1,993 1,953 2,030 2,054 23.5Qatar 840 776 780 792 805 808 813 819 6.5Saudi Arabia 9,113 8,055 8,123 8,122 8,146 8,143 8,158 8,176 18.2UAE 2,557 2,256 2,253 2,258 2,280 2,281 2,283 2,286 3.8Venezuela 2,487 2,311 2,323 2,290 2,299 2,290 2,312 2,337 25.5
Total OPEC 31,205 28,710 28,854 29,024 29,228 29,296 29,241 29,251 10.5
OPEC excl. Iraq 28,864 26,288 26,355 26,566 26,761 26,747 26,844 26,906 61.5
Totals may not add due to independent rounding.
82
83
84
85
86
87
88
27
28
29
30
31
32
33
May
08
Jun
08Ju
l 08
Aug
08
Sep
08
Oct
08
Nov
08
Dec
08
Jan
09Fe
b 09
Mar
09
Apr
09
May
09
Jun
09Ju
l 09
Aug
09
Sep
09
Oct
09
Nov
09
Dec
09
Jan
10Fe
b 10
Mar
10
Apr
10
mb/dmb/d
OPEC crude production (LHS) World supply (RHS)
Graph 27: OPEC and world oil supply
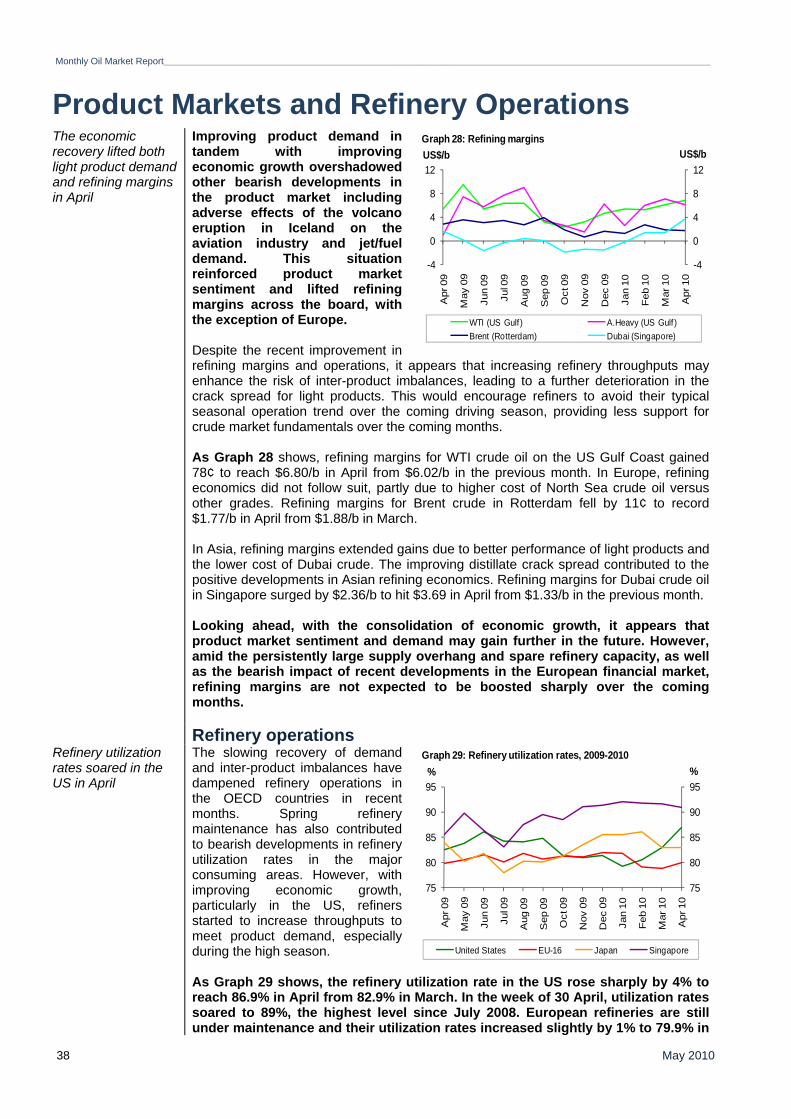
Monthly Oil Market Report_________________________________________________________________________________________________________________________________________
May 2010 38
Product Markets and Refinery Operations The economic recovery lifted both light product demand and refining margins in April
Improving product demand in tandem with improving economic growth overshadowed other bearish developments in the product market including adverse effects of the volcano eruption in Iceland on the aviation industry and jet/fuel demand. This situation reinforced product market sentiment and lifted refining margins across the board, with the exception of Europe. Despite the recent improvement in refining margins and operations, it appears that increasing refinery throughputs may enhance the risk of inter-product imbalances, leading to a further deterioration in the crack spread for light products. This would encourage refiners to avoid their typical seasonal operation trend over the coming driving season, providing less support for crude market fundamentals over the coming months. As Graph 28 shows, refining margins for WTI crude oil on the US Gulf Coast gained 78¢ to reach $6.80/b in April from $6.02/b in the previous month. In Europe, refining economics did not follow suit, partly due to higher cost of North Sea crude oil versus other grades. Refining margins for Brent crude in Rotterdam fell by 11¢ to record $1.77/b in April from $1.88/b in March. In Asia, refining margins extended gains due to better performance of light products and the lower cost of Dubai crude. The improving distillate crack spread contributed to the positive developments in Asian refining economics. Refining margins for Dubai crude oil in Singapore surged by $2.36/b to hit $3.69 in April from $1.33/b in the previous month. Looking ahead, with the consolidation of economic growth, it appears that product market sentiment and demand may gain further in the future. However, amid the persistently large supply overhang and spare refinery capacity, as well as the bearish impact of recent developments in the European financial market, refining margins are not expected to be boosted sharply over the coming months.
Refinery operationsRefinery utilization rates soared in the US in April
The slowing recovery of demand and inter-product imbalances have dampened refinery operations in the OECD countries in recent months. Spring refinery maintenance has also contributed to bearish developments in refinery utilization rates in the major consuming areas. However, with improving economic growth, particularly in the US, refiners started to increase throughputs to meet product demand, especially during the high season. As Graph 29 shows, the refinery utilization rate in the US rose sharply by 4% to reach 86.9% in April from 82.9% in March. In the week of 30 April, utilization rates soared to 89%, the highest level since July 2008. European refineries are still under maintenance and their utilization rates increased slightly by 1% to 79.9% in
-4
0
4
8
12
-4
0
4
8
12
Apr
09
May
09
Jun
09
Jul 0
9
Aug
09
Sep
09
Oct
09
Nov
09
Dec
09
Jan
10
Feb
10
Mar
10
Apr
10
US$/bUS$/b
WTI (US Gulf ) A.Heavy (US Gulf )Brent (Rotterdam) Dubai (Singapore)
Graph 28: Refining margins
75
80
85
90
95
75
80
85
90
95
Apr
09
May
09
Jun
09
Jul 0
9
Aug
09
Sep
09
Oct
09
Nov
09
Dec
09
Jan
10
Feb
10
Mar
10
Apr
10
%%
United States EU-16 Japan Singapore
Graph 29: Refinery utilization rates, 2009-2010
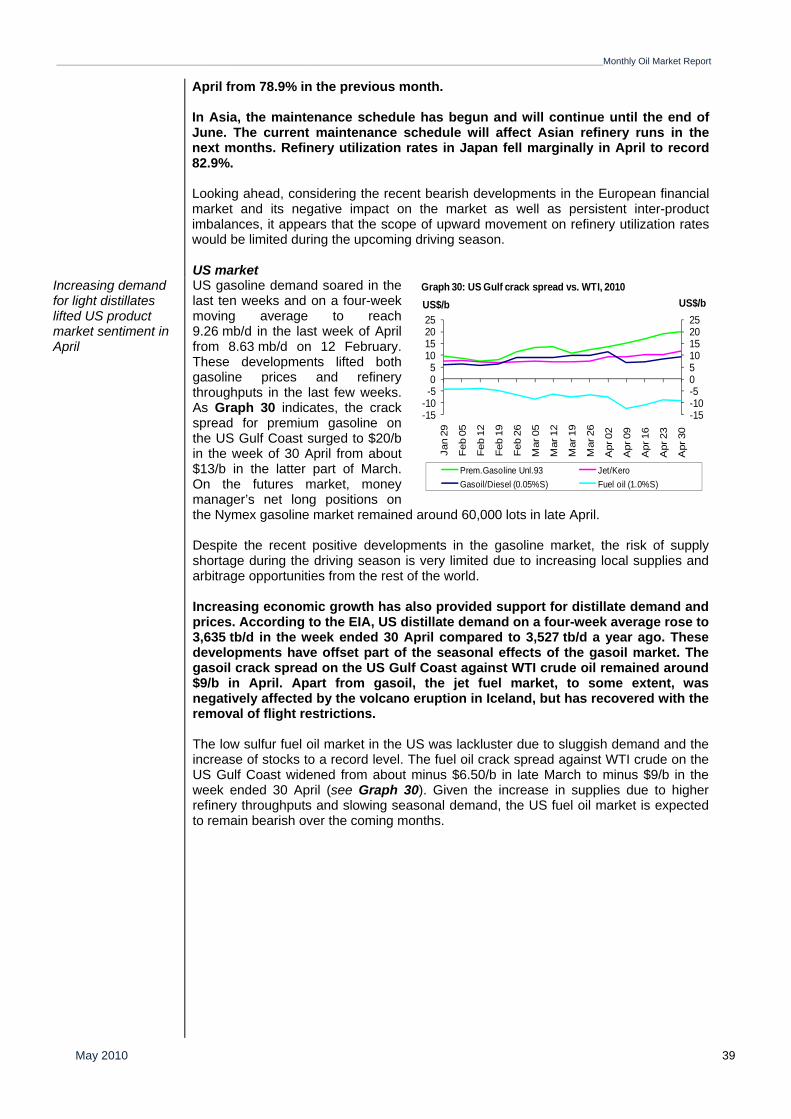
_________________________________________________________________________________________________________________________________________Monthly Oil Market Report
May 2010 39
April from 78.9% in the previous month. In Asia, the maintenance schedule has begun and will continue until the end of June. The current maintenance schedule will affect Asian refinery runs in the next months. Refinery utilization rates in Japan fell marginally in April to record 82.9%. Looking ahead, considering the recent bearish developments in the European financial market and its negative impact on the market as well as persistent inter-product imbalances, it appears that the scope of upward movement on refinery utilization rates would be limited during the upcoming driving season.
US market Increasing demand for light distillates lifted US product market sentiment in April
US gasoline demand soared in the last ten weeks and on a four-week moving average to reach 9.26 mb/d in the last week of April from 8.63 mb/d on 12 February. These developments lifted both gasoline prices and refinery throughputs in the last few weeks. As Graph 30 indicates, the crack spread for premium gasoline on the US Gulf Coast surged to $20/b in the week of 30 April from about $13/b in the latter part of March. On the futures market, money manager’s net long positions on the Nymex gasoline market remained around 60,000 lots in late April. Despite the recent positive developments in the gasoline market, the risk of supply shortage during the driving season is very limited due to increasing local supplies and arbitrage opportunities from the rest of the world. Increasing economic growth has also provided support for distillate demand and prices. According to the EIA, US distillate demand on a four-week average rose to 3,635 tb/d in the week ended 30 April compared to 3,527 tb/d a year ago. These developments have offset part of the seasonal effects of the gasoil market. The gasoil crack spread on the US Gulf Coast against WTI crude oil remained around $9/b in April. Apart from gasoil, the jet fuel market, to some extent, was negatively affected by the volcano eruption in Iceland, but has recovered with the removal of flight restrictions. The low sulfur fuel oil market in the US was lackluster due to sluggish demand and the increase of stocks to a record level. The fuel oil crack spread against WTI crude on the US Gulf Coast widened from about minus $6.50/b in late March to minus $9/b in the week ended 30 April (see Graph 30). Given the increase in supplies due to higher refinery throughputs and slowing seasonal demand, the US fuel oil market is expected to remain bearish over the coming months.
-15-10-50510152025
-15-10-505
10152025
Jan
29
Feb
05
Feb
12
Feb
19
Feb
26
Mar
05
Mar
12
Mar
19
Mar
26
Apr
02
Apr
09
Apr
16
Apr
23
Apr
30
US$/bUS$/b
Prem.Gasoline Unl.93 Jet/KeroGasoil/Diesel (0.05%S) Fuel oil (1.0%S)
Graph 30: US Gulf crack spread vs. WTI, 2010
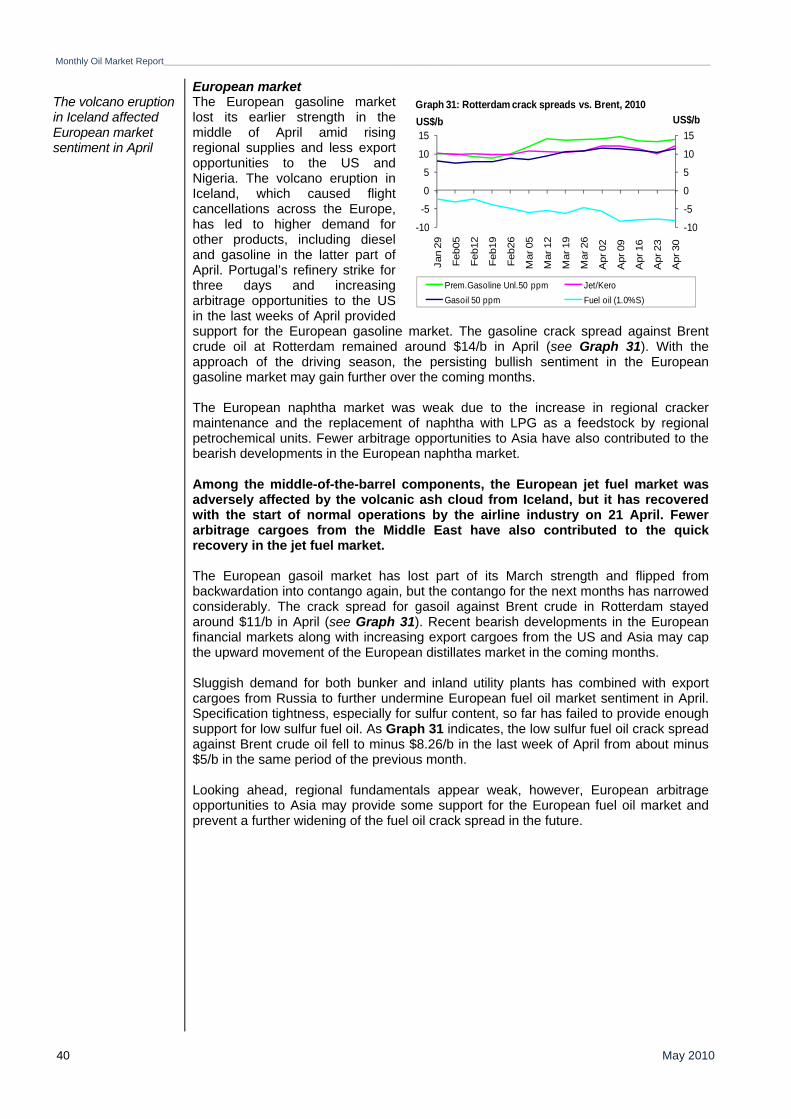
Monthly Oil Market Report_________________________________________________________________________________________________________________________________________
May 2010 40
European market The volcano eruption in Iceland affected European market sentiment in April
The European gasoline market lost its earlier strength in the middle of April amid rising regional supplies and less export opportunities to the US and Nigeria. The volcano eruption in Iceland, which caused flight cancellations across the Europe, has led to higher demand for other products, including diesel and gasoline in the latter part of April. Portugal’s refinery strike for three days and increasing arbitrage opportunities to the US in the last weeks of April provided support for the European gasoline market. The gasoline crack spread against Brent crude oil at Rotterdam remained around $14/b in April (see Graph 31). With the approach of the driving season, the persisting bullish sentiment in the European gasoline market may gain further over the coming months. The European naphtha market was weak due to the increase in regional cracker maintenance and the replacement of naphtha with LPG as a feedstock by regional petrochemical units. Fewer arbitrage opportunities to Asia have also contributed to the bearish developments in the European naphtha market. Among the middle-of-the-barrel components, the European jet fuel market was adversely affected by the volcanic ash cloud from Iceland, but it has recovered with the start of normal operations by the airline industry on 21 April. Fewer arbitrage cargoes from the Middle East have also contributed to the quick recovery in the jet fuel market. The European gasoil market has lost part of its March strength and flipped from backwardation into contango again, but the contango for the next months has narrowed considerably. The crack spread for gasoil against Brent crude in Rotterdam stayed around $11/b in April (see Graph 31). Recent bearish developments in the European financial markets along with increasing export cargoes from the US and Asia may cap the upward movement of the European distillates market in the coming months. Sluggish demand for both bunker and inland utility plants has combined with export cargoes from Russia to further undermine European fuel oil market sentiment in April. Specification tightness, especially for sulfur content, so far has failed to provide enough support for low sulfur fuel oil. As Graph 31 indicates, the low sulfur fuel oil crack spread against Brent crude oil fell to minus $8.26/b in the last week of April from about minus $5/b in the same period of the previous month. Looking ahead, regional fundamentals appear weak, however, European arbitrage opportunities to Asia may provide some support for the European fuel oil market and prevent a further widening of the fuel oil crack spread in the future.
-10
-5
0
5
10
15
-10
-5
0
5
10
15
Jan
29
Feb0
5
Feb1
2
Feb1
9
Feb2
6
Mar
05
Mar
12
Mar
19
Mar
26
Apr
02
Apr
09
Apr
16
Apr
23
Apr
30
US$/bUS$/b
Prem.Gasoline Unl.50 ppm Jet/KeroGasoil 50 ppm Fuel oil (1.0%S)
Graph 31: Rotterdam crack spreads vs. Brent, 2010
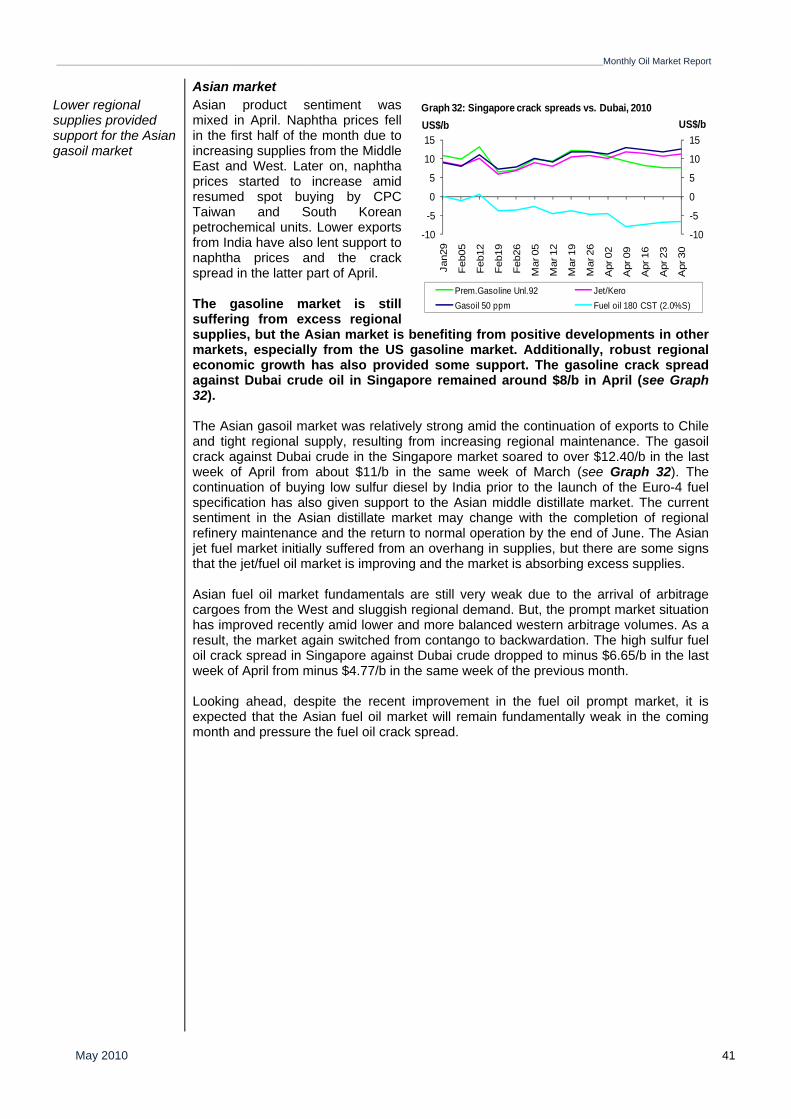
_________________________________________________________________________________________________________________________________________Monthly Oil Market Report
May 2010 41
Asian market Lower regional supplies provided support for the Asian gasoil market
Asian product sentiment was mixed in April. Naphtha prices fell in the first half of the month due to increasing supplies from the Middle East and West. Later on, naphtha prices started to increase amid resumed spot buying by CPC Taiwan and South Korean petrochemical units. Lower exports from India have also lent support to naphtha prices and the crack spread in the latter part of April. The gasoline market is still suffering from excess regional supplies, but the Asian market is benefiting from positive developments in other markets, especially from the US gasoline market. Additionally, robust regional economic growth has also provided some support. The gasoline crack spread against Dubai crude oil in Singapore remained around $8/b in April (see Graph 32). The Asian gasoil market was relatively strong amid the continuation of exports to Chile and tight regional supply, resulting from increasing regional maintenance. The gasoil crack against Dubai crude in the Singapore market soared to over $12.40/b in the last week of April from about $11/b in the same week of March (see Graph 32). The continuation of buying low sulfur diesel by India prior to the launch of the Euro-4 fuel specification has also given support to the Asian middle distillate market. The current sentiment in the Asian distillate market may change with the completion of regional refinery maintenance and the return to normal operation by the end of June. The Asian jet fuel market initially suffered from an overhang in supplies, but there are some signs that the jet/fuel oil market is improving and the market is absorbing excess supplies. Asian fuel oil market fundamentals are still very weak due to the arrival of arbitrage cargoes from the West and sluggish regional demand. But, the prompt market situation has improved recently amid lower and more balanced western arbitrage volumes. As a result, the market again switched from contango to backwardation. The high sulfur fuel oil crack spread in Singapore against Dubai crude dropped to minus $6.65/b in the last week of April from minus $4.77/b in the same week of the previous month. Looking ahead, despite the recent improvement in the fuel oil prompt market, it is expected that the Asian fuel oil market will remain fundamentally weak in the coming month and pressure the fuel oil crack spread.
-10
-5
0
5
10
15
-10
-5
0
5
10
15
Jan2
9
Feb0
5
Feb1
2
Feb1
9
Feb2
6
Mar
05
Mar
12
Mar
19
Mar
26
Apr
02
Apr
09
Apr
16
Apr
23
Apr
30
US$/bUS$/b
Prem.Gasoline Unl.92 Jet/KeroGasoil 50 ppm Fuel oil 180 CST (2.0%S)
Graph 32: Singapore crack spreads vs. Dubai, 2010
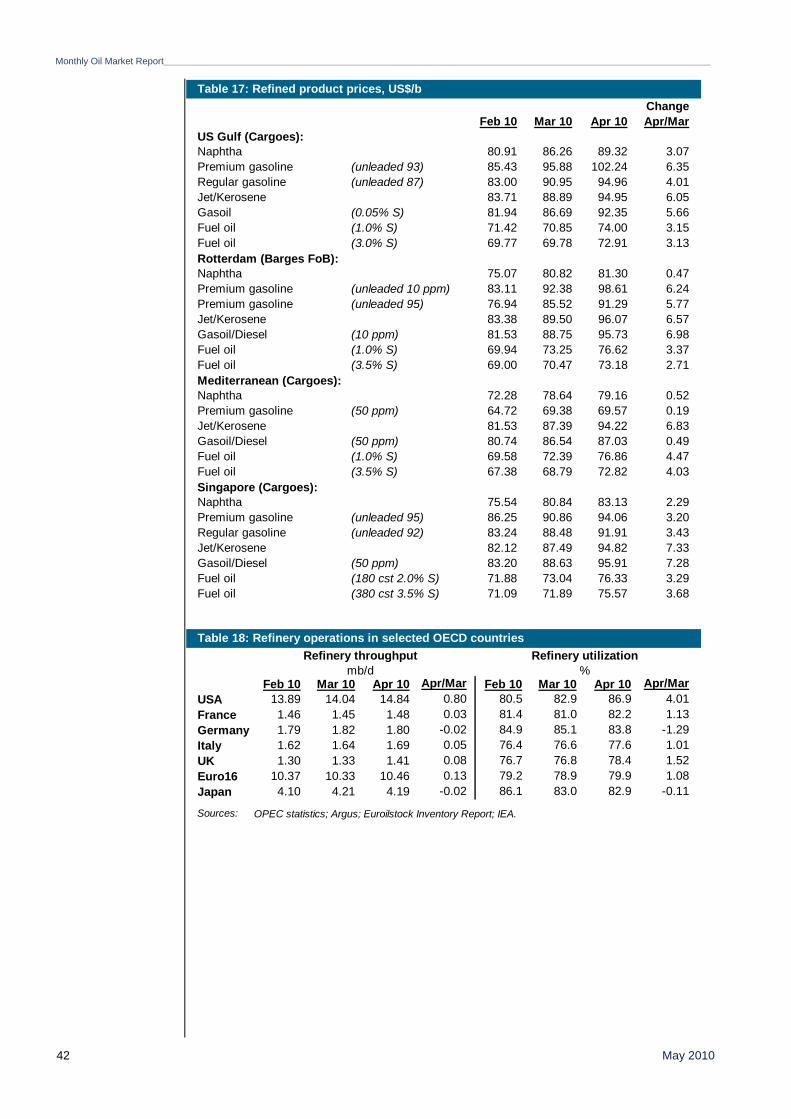
Monthly Oil Market Report_________________________________________________________________________________________________________________________________________
May 2010 42
Table 17: Refined product prices, US$/bChange
Feb 10 Mar 10 Apr 10 Apr/MarUS Gulf (Cargoes):Naphtha 80.91 86.26 89.32 3.07Premium gasoline (unleaded 93) 85.43 95.88 102.24 6.35Regular gasoline (unleaded 87) 83.00 90.95 94.96 4.01Jet/Kerosene 83.71 88.89 94.95 6.05Gasoil (0.05% S) 81.94 86.69 92.35 5.66Fuel oil (1.0% S) 71.42 70.85 74.00 3.15Fuel oil (3.0% S) 69.77 69.78 72.91 3.13Rotterdam (Barges FoB):Naphtha 75.07 80.82 81.30 0.47Premium gasoline (unleaded 10 ppm) 83.11 92.38 98.61 6.24Premium gasoline (unleaded 95) 76.94 85.52 91.29 5.77Jet/Kerosene 83.38 89.50 96.07 6.57Gasoil/Diesel (10 ppm) 81.53 88.75 95.73 6.98Fuel oil (1.0% S) 69.94 73.25 76.62 3.37Fuel oil (3.5% S) 69.00 70.47 73.18 2.71Mediterranean (Cargoes):Naphtha 72.28 78.64 79.16 0.52Premium gasoline (50 ppm) 64.72 69.38 69.57 0.19Jet/Kerosene 81.53 87.39 94.22 6.83Gasoil/Diesel (50 ppm) 80.74 86.54 87.03 0.49Fuel oil (1.0% S) 69.58 72.39 76.86 4.47Fuel oil (3.5% S) 67.38 68.79 72.82 4.03Singapore (Cargoes):Naphtha 75.54 80.84 83.13 2.29Premium gasoline (unleaded 95) 86.25 90.86 94.06 3.20Regular gasoline (unleaded 92) 83.24 88.48 91.91 3.43Jet/Kerosene 82.12 87.49 94.82 7.33Gasoil/Diesel (50 ppm) 83.20 88.63 95.91 7.28Fuel oil (180 cst 2.0% S) 71.88 73.04 76.33 3.29Fuel oil (380 cst 3.5% S) 71.09 71.89 75.57 3.68
Table 18: Refinery operations in selected OECD countries
Feb 10 Mar 10 Apr 10 Apr/Mar Feb 10 Mar 10 Apr 10 Apr/MarUSA 13.89 14.04 14.84 0.80 80.5 82.9 86.9 4.01France 1.46 1.45 1.48 0.03 81.4 81.0 82.2 1.13Germany 1.79 1.82 1.80 -0.02 84.9 85.1 83.8 -1.29Italy 1.62 1.64 1.69 0.05 76.4 76.6 77.6 1.01UK 1.30 1.33 1.41 0.08 76.7 76.8 78.4 1.52Euro16 10.37 10.33 10.46 0.13 79.2 78.9 79.9 1.08Japan 4.10 4.21 4.19 -0.02 86.1 83.0 82.9 -0.11
Sources:
Refinery throughputmb/d
OPEC statistics; Argus; Euroilstock Inventory Report; IEA.
Refinery utilization%
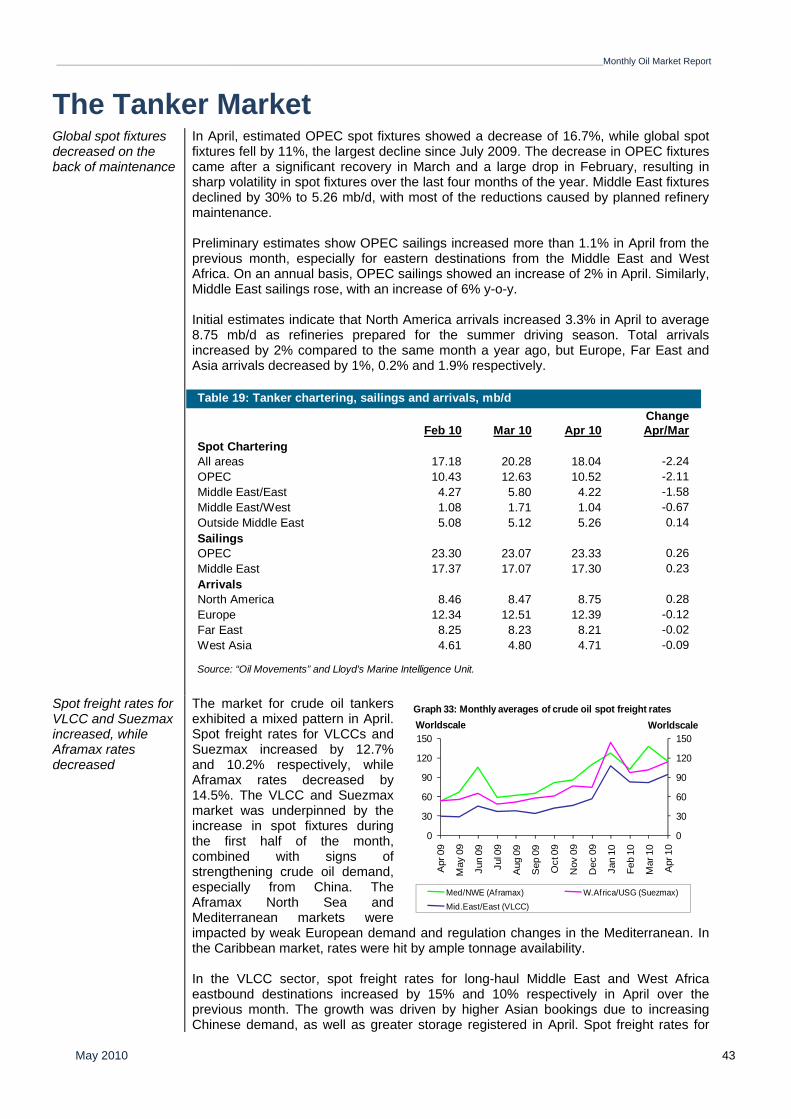
_________________________________________________________________________________________________________________________________________Monthly Oil Market Report
May 2010 43
The Tanker Market
Global spot fixtures decreased on the back of maintenance
In April, estimated OPEC spot fixtures showed a decrease of 16.7%, while global spot fixtures fell by 11%, the largest decline since July 2009. The decrease in OPEC fixtures came after a significant recovery in March and a large drop in February, resulting in sharp volatility in spot fixtures over the last four months of the year. Middle East fixtures declined by 30% to 5.26 mb/d, with most of the reductions caused by planned refinery maintenance. Preliminary estimates show OPEC sailings increased more than 1.1% in April from the previous month, especially for eastern destinations from the Middle East and West Africa. On an annual basis, OPEC sailings showed an increase of 2% in April. Similarly, Middle East sailings rose, with an increase of 6% y-o-y. Initial estimates indicate that North America arrivals increased 3.3% in April to average 8.75 mb/d as refineries prepared for the summer driving season. Total arrivals increased by 2% compared to the same month a year ago, but Europe, Far East and Asia arrivals decreased by 1%, 0.2% and 1.9% respectively.
Spot freight rates for VLCC and Suezmax increased, while Aframax rates decreased
The market for crude oil tankers exhibited a mixed pattern in April. Spot freight rates for VLCCs and Suezmax increased by 12.7% and 10.2% respectively, while Aframax rates decreased by 14.5%. The VLCC and Suezmax market was underpinned by the increase in spot fixtures during the first half of the month, combined with signs of strengthening crude oil demand, especially from China. The Aframax North Sea and Mediterranean markets were impacted by weak European demand and regulation changes in the Mediterranean. In the Caribbean market, rates were hit by ample tonnage availability. In the VLCC sector, spot freight rates for long-haul Middle East and West Africa eastbound destinations increased by 15% and 10% respectively in April over the previous month. The growth was driven by higher Asian bookings due to increasing Chinese demand, as well as greater storage registered in April. Spot freight rates for
ChangeFeb 10 Mar 10 Apr 10 Apr/Mar
Spot CharteringAll areas 17.18 20.28 18.04 -2.24OPEC 10.43 12.63 10.52 -2.11Middle East/East 4.27 5.80 4.22 -1.58Middle East/West 1.08 1.71 1.04 -0.67Outside Middle East 5.08 5.12 5.26 0.14SailingsOPEC 23.30 23.07 23.33 0.26Middle East 17.37 17.07 17.30 0.23ArrivalsNorth America 8.46 8.47 8.75 0.28Europe 12.34 12.51 12.39 -0.12Far East 8.25 8.23 8.21 -0.02West Asia 4.61 4.80 4.71 -0.09
Table 19: Tanker chartering, sailings and arrivals, mb/d
Source: “Oil Movements” and Lloyd's Marine Intelligence Unit.
0
30
60
90
120
150
0
30
60
90
120
150
Apr
09
May
09
Jun
09
Jul 0
9
Aug
09
Sep
09
Oct
09
Nov
09
Dec
09
Jan
10
Feb
10
Mar
10
Apr
10
WorldscaleWorldscale
Med/NWE (Aframax) W.Africa/USG (Suezmax)Mid.East/East (VLCC)
Graph 33: Monthly averages of crude oil spot freight rates
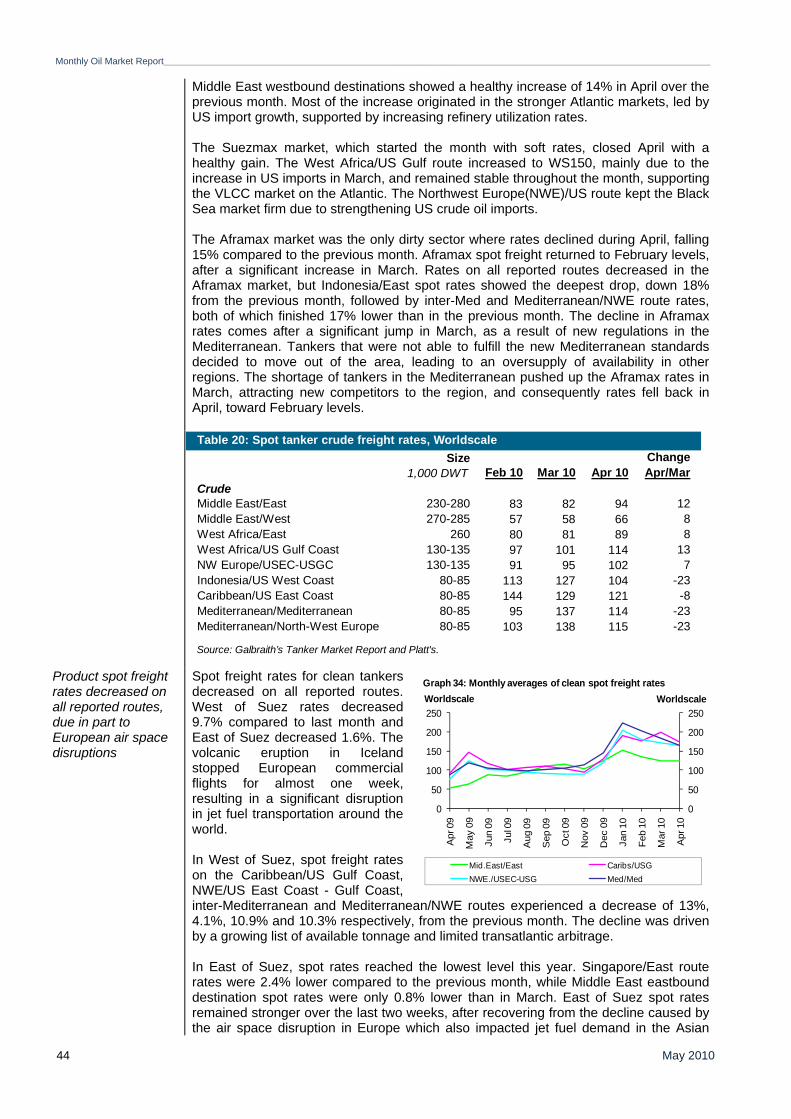
Monthly Oil Market Report_________________________________________________________________________________________________________________________________________
May 2010 44
Middle East westbound destinations showed a healthy increase of 14% in April over the previous month. Most of the increase originated in the stronger Atlantic markets, led by US import growth, supported by increasing refinery utilization rates. The Suezmax market, which started the month with soft rates, closed April with a healthy gain. The West Africa/US Gulf route increased to WS150, mainly due to the increase in US imports in March, and remained stable throughout the month, supporting the VLCC market on the Atlantic. The Northwest Europe(NWE)/US route kept the Black Sea market firm due to strengthening US crude oil imports. The Aframax market was the only dirty sector where rates declined during April, falling 15% compared to the previous month. Aframax spot freight returned to February levels, after a significant increase in March. Rates on all reported routes decreased in the Aframax market, but Indonesia/East spot rates showed the deepest drop, down 18% from the previous month, followed by inter-Med and Mediterranean/NWE route rates, both of which finished 17% lower than in the previous month. The decline in Aframax rates comes after a significant jump in March, as a result of new regulations in the Mediterranean. Tankers that were not able to fulfill the new Mediterranean standards decided to move out of the area, leading to an oversupply of availability in other regions. The shortage of tankers in the Mediterranean pushed up the Aframax rates in March, attracting new competitors to the region, and consequently rates fell back in April, toward February levels.
Product spot freight rates decreased on all reported routes, due in part to European air space disruptions
Spot freight rates for clean tankers decreased on all reported routes. West of Suez rates decreased 9.7% compared to last month and East of Suez decreased 1.6%. The volcanic eruption in Iceland stopped European commercial flights for almost one week, resulting in a significant disruption in jet fuel transportation around the world. In West of Suez, spot freight rates on the Caribbean/US Gulf Coast, NWE/US East Coast - Gulf Coast, inter-Mediterranean and Mediterranean/NWE routes experienced a decrease of 13%, 4.1%, 10.9% and 10.3% respectively, from the previous month. The decline was driven by a growing list of available tonnage and limited transatlantic arbitrage. In East of Suez, spot rates reached the lowest level this year. Singapore/East route rates were 2.4% lower compared to the previous month, while Middle East eastbound destination spot rates were only 0.8% lower than in March. East of Suez spot rates remained stronger over the last two weeks, after recovering from the decline caused by the air space disruption in Europe which also impacted jet fuel demand in the Asian
Size Change1,000 DWT Feb 10 Mar 10 Apr 10 Apr/Mar
CrudeMiddle East/East 230-280 83 82 94 12Middle East/West 270-285 57 58 66 8West Africa/East 260 80 81 89 8West Africa/US Gulf Coast 130-135 97 101 114 13NW Europe/USEC-USGC 130-135 91 95 102 7Indonesia/US West Coast 80-85 113 127 104 -23Caribbean/US East Coast 80-85 144 129 121 -8Mediterranean/Mediterranean 80-85 95 137 114 -23Mediterranean/North-West Europe 80-85 103 138 115 -23
Table 20: Spot tanker crude freight rates, Worldscale
Source: Galbraith’s Tanker Market Report and Platt's.
0
50
100
150
200
250
0
50
100
150
200
250
Apr
09
May
09
Jun
09
Jul 0
9
Aug
09
Sep
09
Oct
09
Nov
09
Dec
09
Jan
10
Feb
10
Mar
10
Apr
10
WorldscaleWorldscale
Mid.East/East Caribs/USG NWE./USEC-USG Med/Med
Graph 34: Monthly averages of clean spot freight rates
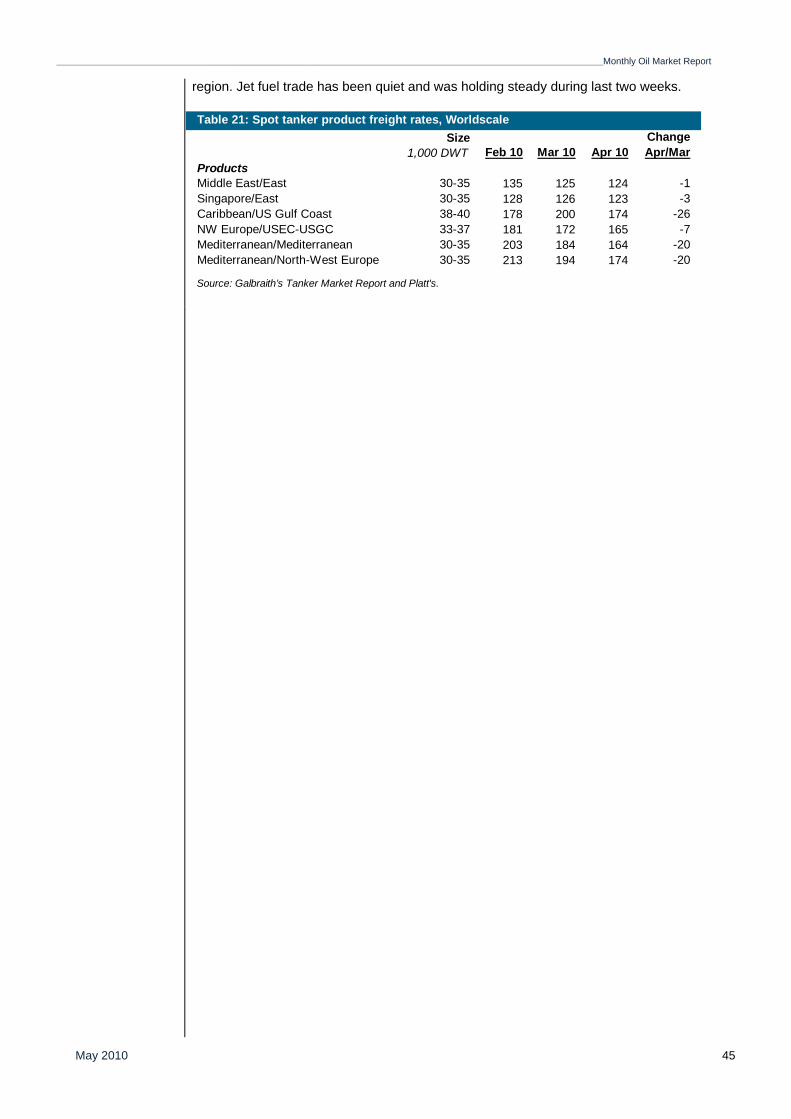
_________________________________________________________________________________________________________________________________________Monthly Oil Market Report
May 2010 45
region. Jet fuel trade has been quiet and was holding steady during last two weeks.
Size Change1,000 DWT Feb 10 Mar 10 Apr 10 Apr/Mar
ProductsMiddle East/East 30-35 135 125 124 -1Singapore/East 30-35 128 126 123 -3Caribbean/US Gulf Coast 38-40 178 200 174 -26NW Europe/USEC-USGC 33-37 181 172 165 -7Mediterranean/Mediterranean 30-35 203 184 164 -20Mediterranean/North-West Europe 30-35 213 194 174 -20
Source: Galbraith’s Tanker Market Report and Platt's.
Table 21: Spot tanker product freight rates, Worldscale
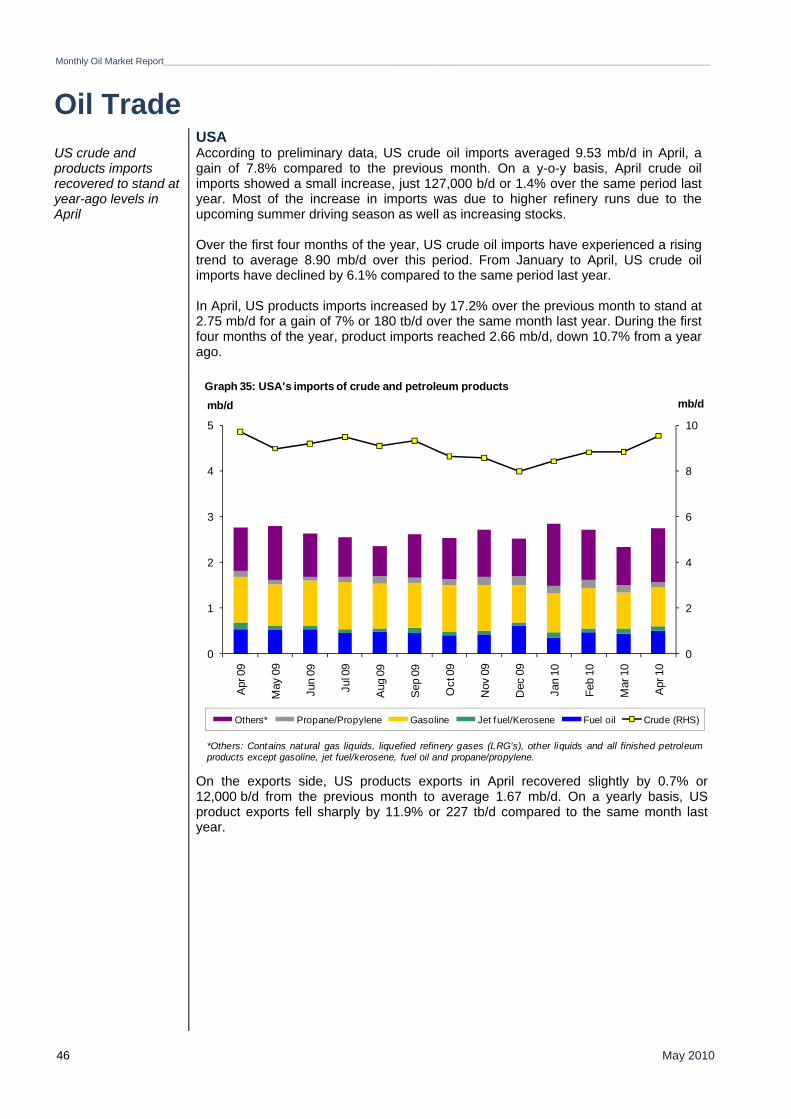
Monthly Oil Market Report_________________________________________________________________________________________________________________________________________
May 2010 46
Oil Trade USA US crude and products imports recovered to stand at year-ago levels in April
According to preliminary data, US crude oil imports averaged 9.53 mb/d in April, a gain of 7.8% compared to the previous month. On a y-o-y basis, April crude oil imports showed a small increase, just 127,000 b/d or 1.4% over the same period last year. Most of the increase in imports was due to higher refinery runs due to the upcoming summer driving season as well as increasing stocks. Over the first four months of the year, US crude oil imports have experienced a rising trend to average 8.90 mb/d over this period. From January to April, US crude oil imports have declined by 6.1% compared to the same period last year. In April, US products imports increased by 17.2% over the previous month to stand at 2.75 mb/d for a gain of 7% or 180 tb/d over the same month last year. During the first four months of the year, product imports reached 2.66 mb/d, down 10.7% from a year ago.
On the exports side, US products exports in April recovered slightly by 0.7% or 12,000 b/d from the previous month to average 1.67 mb/d. On a yearly basis, US product exports fell sharply by 11.9% or 227 tb/d compared to the same month last year.
0
2
4
6
8
10
0
1
2
3
4
5
Apr 0
9
May
09
Jun
09
Jul 0
9
Aug
09
Sep
09
Oct
09
Nov
09
Dec
09
Jan
10
Feb
10
Mar
10
Apr 1
0
mb/dmb/d
Others* Propane/Propylene Gasoline Jet fuel/Kerosene Fuel oil Crude (RHS)
Graph 35: USA's imports of crude and petroleum products
*Others: Contains natural gas liquids, liquefied refinery gases (LRG's), other liquids and all finished petroleumproducts except gasoline, jet fuel/kerosene, fuel oil and propane/propylene.
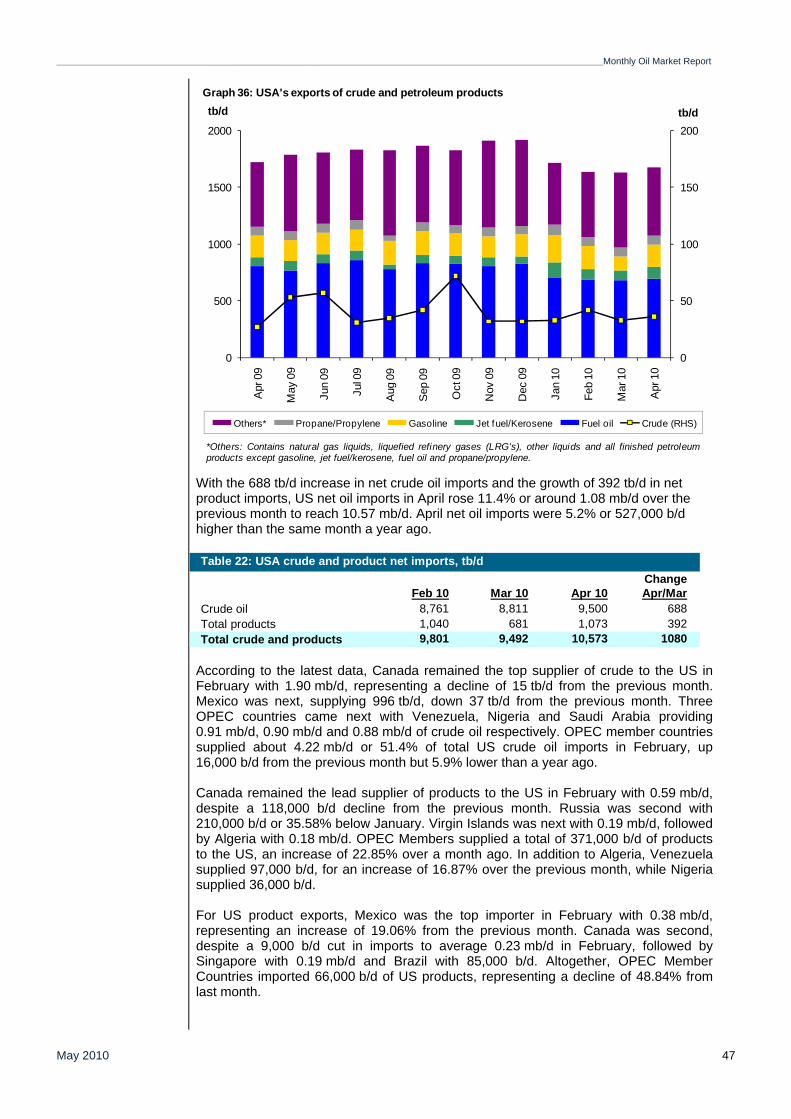
_________________________________________________________________________________________________________________________________________Monthly Oil Market Report
May 2010 47
With the 688 tb/d increase in net crude oil imports and the growth of 392 tb/d in net
product imports, US net oil imports in April rose 11.4% or around 1.08 mb/d over the previous month to reach 10.57 mb/d. April net oil imports were 5.2% or 527,000 b/d higher than the same month a year ago.
According to the latest data, Canada remained the top supplier of crude to the US in February with 1.90 mb/d, representing a decline of 15 tb/d from the previous month. Mexico was next, supplying 996 tb/d, down 37 tb/d from the previous month. Three OPEC countries came next with Venezuela, Nigeria and Saudi Arabia providing 0.91 mb/d, 0.90 mb/d and 0.88 mb/d of crude oil respectively. OPEC member countries supplied about 4.22 mb/d or 51.4% of total US crude oil imports in February, up 16,000 b/d from the previous month but 5.9% lower than a year ago. Canada remained the lead supplier of products to the US in February with 0.59 mb/d, despite a 118,000 b/d decline from the previous month. Russia was second with 210,000 b/d or 35.58% below January. Virgin Islands was next with 0.19 mb/d, followed by Algeria with 0.18 mb/d. OPEC Members supplied a total of 371,000 b/d of products to the US, an increase of 22.85% over a month ago. In addition to Algeria, Venezuela supplied 97,000 b/d, for an increase of 16.87% over the previous month, while Nigeria supplied 36,000 b/d. For US product exports, Mexico was the top importer in February with 0.38 mb/d, representing an increase of 19.06% from the previous month. Canada was second, despite a 9,000 b/d cut in imports to average 0.23 mb/d in February, followed by Singapore with 0.19 mb/d and Brazil with 85,000 b/d. Altogether, OPEC Member Countries imported 66,000 b/d of US products, representing a decline of 48.84% from last month.
0
50
100
150
200
0
500
1000
1500
2000
Apr
09
May
09
Jun
09
Jul 0
9
Aug
09
Sep
09
Oct
09
Nov
09
Dec
09
Jan
10
Feb
10
Mar
10
Apr
10
tb/dtb/d
Others* Propane/Propylene Gasoline Jet fuel/Kerosene Fuel oil Crude (RHS)
*Others: Contains natural gas liquids, liquefied refinery gases (LRG's), other liquids and all finished petroleumproducts except gasoline, jet fuel/kerosene, fuel oil and propane/propylene.
Graph 36: USA's exports of crude and petroleum products
ChangeFeb 10 Mar 10 Apr 10 Apr/Mar
Crude oil 8,761 8,811 9,500 688Total products 1,040 681 1,073 392Total crude and products 9,801 9,492 10,573 1080
Table 22: USA crude and product net imports, tb/d
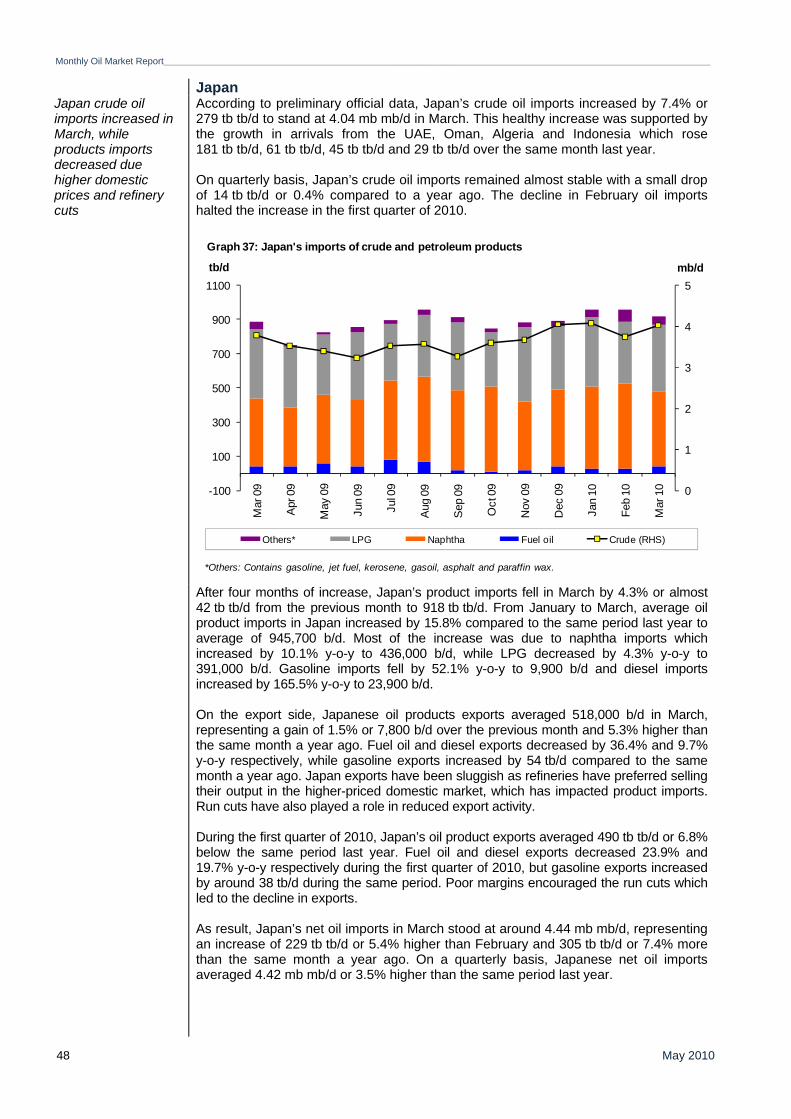
Monthly Oil Market Report_________________________________________________________________________________________________________________________________________
May 2010 48
Japan Japan crude oil imports increased in March, while products imports decreased due higher domestic prices and refinery cuts
According to preliminary official data, Japan’s crude oil imports increased by 7.4% or 279 tb tb/d to stand at 4.04 mb mb/d in March. This healthy increase was supported by the growth in arrivals from the UAE, Oman, Algeria and Indonesia which rose 181 tb tb/d, 61 tb tb/d, 45 tb tb/d and 29 tb tb/d over the same month last year. On quarterly basis, Japan’s crude oil imports remained almost stable with a small drop of 14 tb tb/d or 0.4% compared to a year ago. The decline in February oil imports halted the increase in the first quarter of 2010.
After four months of increase, Japan’s product imports fell in March by 4.3% or almost 42 tb tb/d from the previous month to 918 tb tb/d. From January to March, average oil product imports in Japan increased by 15.8% compared to the same period last year to average of 945,700 b/d. Most of the increase was due to naphtha imports which increased by 10.1% y-o-y to 436,000 b/d, while LPG decreased by 4.3% y-o-y to 391,000 b/d. Gasoline imports fell by 52.1% y-o-y to 9,900 b/d and diesel imports increased by 165.5% y-o-y to 23,900 b/d. On the export side, Japanese oil products exports averaged 518,000 b/d in March, representing a gain of 1.5% or 7,800 b/d over the previous month and 5.3% higher than the same month a year ago. Fuel oil and diesel exports decreased by 36.4% and 9.7% y-o-y respectively, while gasoline exports increased by 54 tb/d compared to the same month a year ago. Japan exports have been sluggish as refineries have preferred selling their output in the higher-priced domestic market, which has impacted product imports. Run cuts have also played a role in reduced export activity. During the first quarter of 2010, Japan’s oil product exports averaged 490 tb tb/d or 6.8% below the same period last year. Fuel oil and diesel exports decreased 23.9% and 19.7% y-o-y respectively during the first quarter of 2010, but gasoline exports increased by around 38 tb/d during the same period. Poor margins encouraged the run cuts which led to the decline in exports. As result, Japan’s net oil imports in March stood at around 4.44 mb mb/d, representing an increase of 229 tb tb/d or 5.4% higher than February and 305 tb tb/d or 7.4% more than the same month a year ago. On a quarterly basis, Japanese net oil imports averaged 4.42 mb mb/d or 3.5% higher than the same period last year.
0
1
2
3
4
5
-100
100
300
500
700
900
1100
Mar
09
Apr
09
May
09
Jun
09
Jul 0
9
Aug
09
Sep
09
Oct
09
Nov
09
Dec
09
Jan
10
Feb
10
Mar
10
mb/dtb/d
Others* LPG Naphtha Fuel oil Crude (RHS)
Graph 37: Japan's imports of crude and petroleum products
*Others: Contains gasoline, jet fuel, kerosene, gasoil, asphalt and paraffin wax.
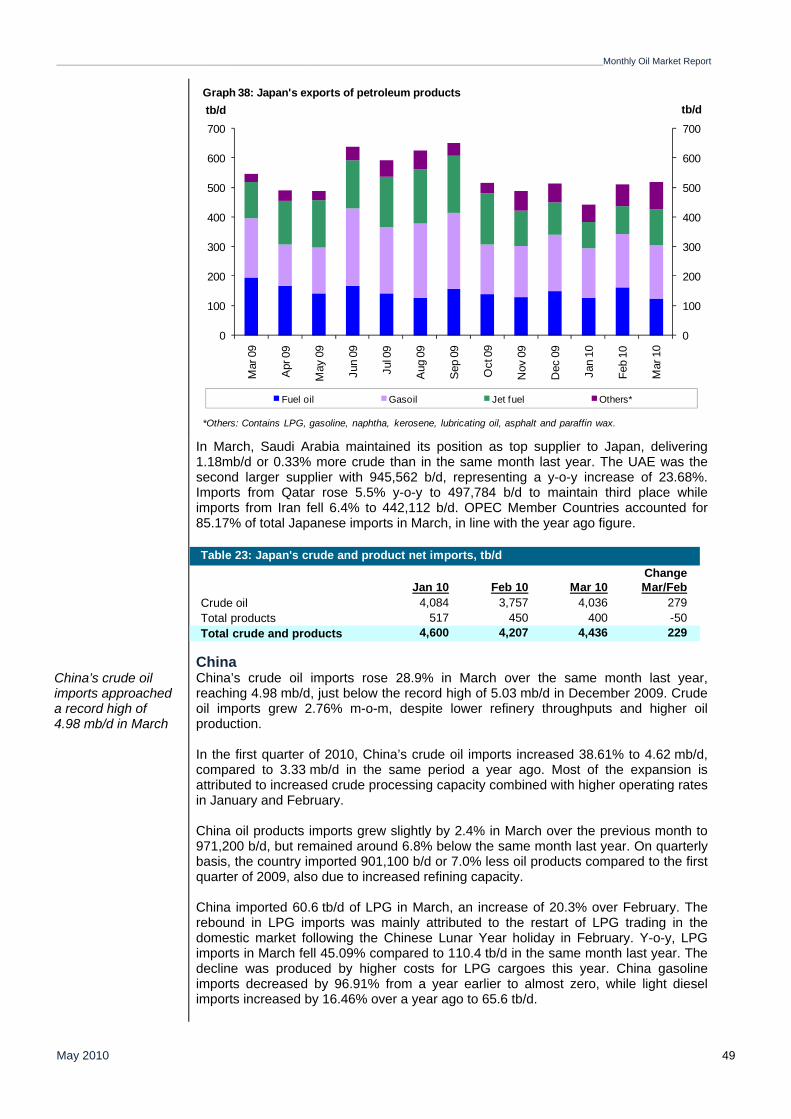
_________________________________________________________________________________________________________________________________________Monthly Oil Market Report
May 2010 49
In March, Saudi Arabia maintained its position as top supplier to Japan, delivering
1.18mb/d or 0.33% more crude than in the same month last year. The UAE was the second larger supplier with 945,562 b/d, representing a y-o-y increase of 23.68%. Imports from Qatar rose 5.5% y-o-y to 497,784 b/d to maintain third place while imports from Iran fell 6.4% to 442,112 b/d. OPEC Member Countries accounted for 85.17% of total Japanese imports in March, in line with the year ago figure.
ChinaChina’s crude oil imports approached a record high of 4.98 mb/d in March
China’s crude oil imports rose 28.9% in March over the same month last year, reaching 4.98 mb/d, just below the record high of 5.03 mb/d in December 2009. Crude oil imports grew 2.76% m-o-m, despite lower refinery throughputs and higher oil production. In the first quarter of 2010, China’s crude oil imports increased 38.61% to 4.62 mb/d, compared to 3.33 mb/d in the same period a year ago. Most of the expansion is attributed to increased crude processing capacity combined with higher operating rates in January and February. China oil products imports grew slightly by 2.4% in March over the previous month to 971,200 b/d, but remained around 6.8% below the same month last year. On quarterly basis, the country imported 901,100 b/d or 7.0% less oil products compared to the first quarter of 2009, also due to increased refining capacity. China imported 60.6 tb/d of LPG in March, an increase of 20.3% over February. The rebound in LPG imports was mainly attributed to the restart of LPG trading in the domestic market following the Chinese Lunar Year holiday in February. Y-o-y, LPG imports in March fell 45.09% compared to 110.4 tb/d in the same month last year. The decline was produced by higher costs for LPG cargoes this year. China gasoline imports decreased by 96.91% from a year earlier to almost zero, while light diesel imports increased by 16.46% over a year ago to 65.6 tb/d.
0
100
200
300
400
500
600
700
0
100
200
300
400
500
600
700
Mar
09
Apr
09
May
09
Jun
09
Jul 0
9
Aug
09
Sep
09
Oct
09
Nov
09
Dec
09
Jan
10
Feb
10
Mar
10
tb/dtb/d
Fuel oil Gasoil Jet fuel Others*
Graph 38: Japan's exports of petroleum products
*Others: Contains LPG, gasoline, naphtha, kerosene, lubricating oil, asphalt and paraffin wax.
ChangeJan 10 Feb 10 Mar 10 Mar/Feb
Crude oil 4,084 3,757 4,036 279Total products 517 450 400 -50Total crude and products 4,600 4,207 4,436 229
Table 23: Japan's crude and product net imports, tb/d
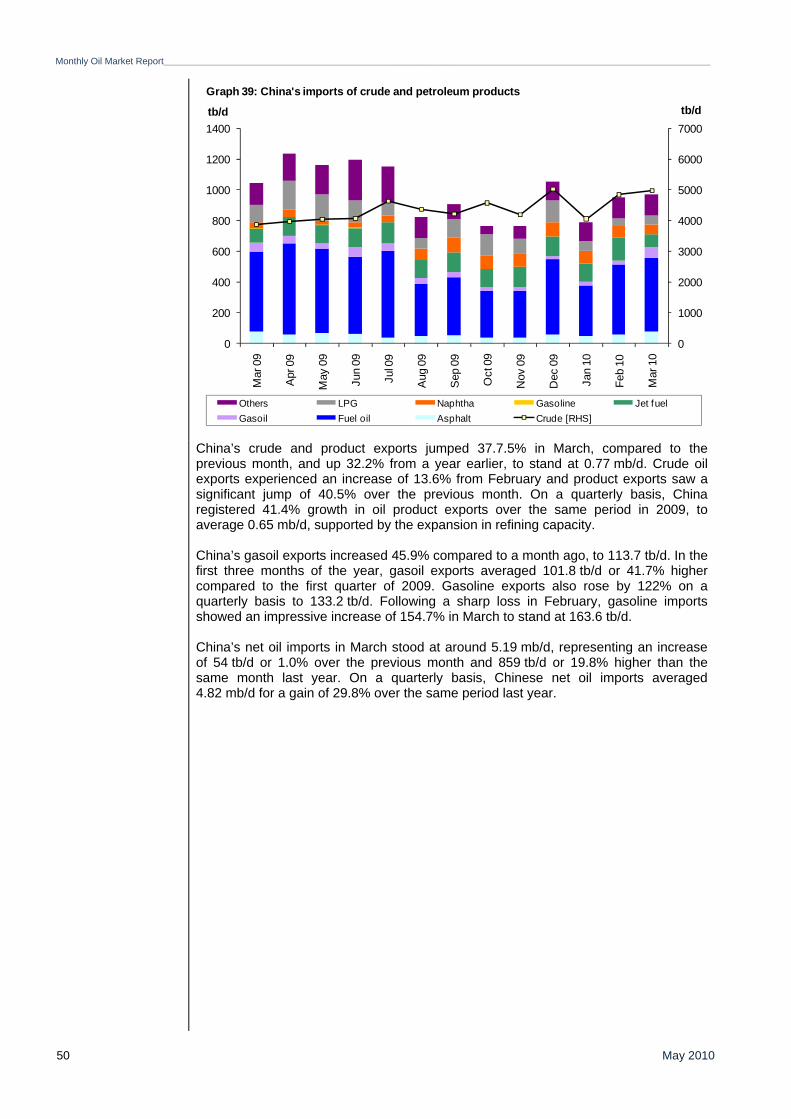
Monthly Oil Market Report_________________________________________________________________________________________________________________________________________
May 2010 50
China’s crude and product exports jumped 37.7.5% in March, compared to the previous month, and up 32.2% from a year earlier, to stand at 0.77 mb/d. Crude oil exports experienced an increase of 13.6% from February and product exports saw a significant jump of 40.5% over the previous month. On a quarterly basis, China registered 41.4% growth in oil product exports over the same period in 2009, to average 0.65 mb/d, supported by the expansion in refining capacity. China’s gasoil exports increased 45.9% compared to a month ago, to 113.7 tb/d. In the first three months of the year, gasoil exports averaged 101.8 tb/d or 41.7% higher compared to the first quarter of 2009. Gasoline exports also rose by 122% on a quarterly basis to 133.2 tb/d. Following a sharp loss in February, gasoline imports showed an impressive increase of 154.7% in March to stand at 163.6 tb/d. China’s net oil imports in March stood at around 5.19 mb/d, representing an increase of 54 tb/d or 1.0% over the previous month and 859 tb/d or 19.8% higher than the same month last year. On a quarterly basis, Chinese net oil imports averaged 4.82 mb/d for a gain of 29.8% over the same period last year.
0
1000
2000
3000
4000
5000
6000
7000
0
200
400
600
800
1000
1200
1400
Mar
09
Apr
09
May
09
Jun
09
Jul 0
9
Aug
09
Sep
09
Oct
09
Nov
09
Dec
09
Jan
10
Feb
10
Mar
10
tb/dtb/d
Others LPG Naphtha Gasoline Jet fuelGasoil Fuel oil Asphalt Crude [RHS]
Graph 39: China's imports of crude and petroleum products
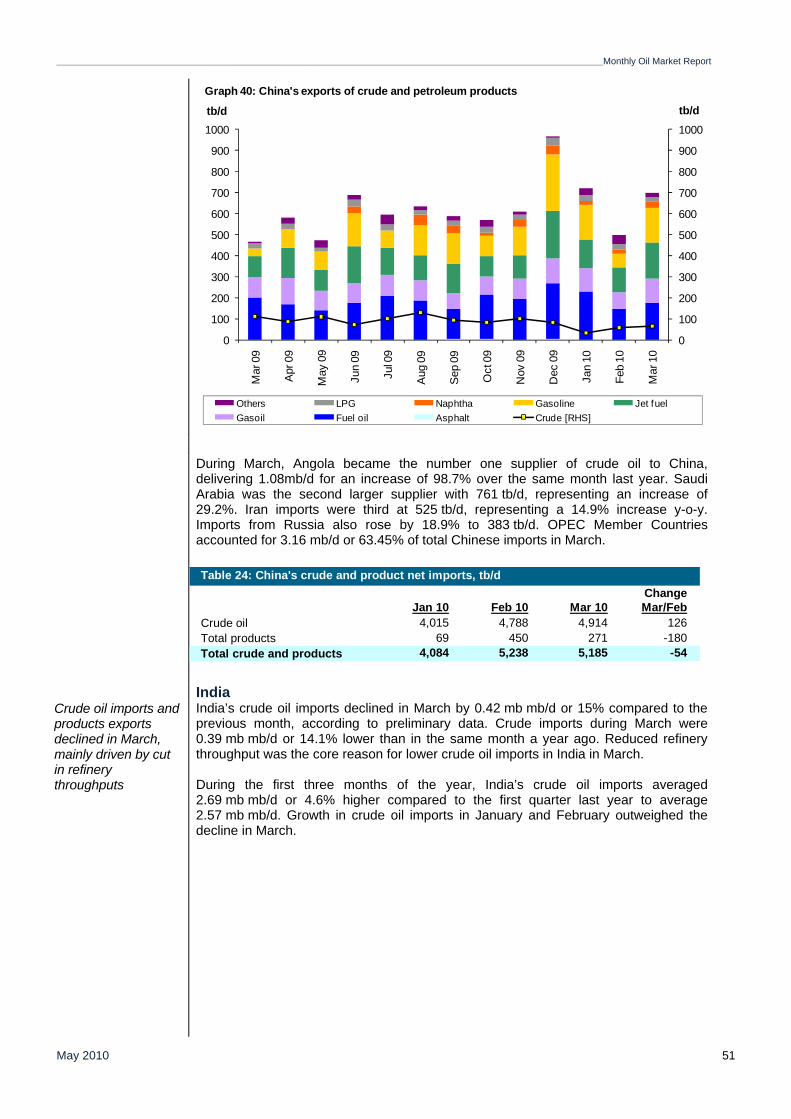
_________________________________________________________________________________________________________________________________________Monthly Oil Market Report
May 2010 51
During March, Angola became the number one supplier of crude oil to China,
delivering 1.08mb/d for an increase of 98.7% over the same month last year. Saudi Arabia was the second larger supplier with 761 tb/d, representing an increase of 29.2%. Iran imports were third at 525 tb/d, representing a 14.9% increase y-o-y. Imports from Russia also rose by 18.9% to 383 tb/d. OPEC Member Countries accounted for 3.16 mb/d or 63.45% of total Chinese imports in March.
India Crude oil imports and products exports declined in March, mainly driven by cut in refinery throughputs
India’s crude oil imports declined in March by 0.42 mb mb/d or 15% compared to the previous month, according to preliminary data. Crude imports during March were 0.39 mb mb/d or 14.1% lower than in the same month a year ago. Reduced refinery throughput was the core reason for lower crude oil imports in India in March. During the first three months of the year, India’s crude oil imports averaged 2.69 mb mb/d or 4.6% higher compared to the first quarter last year to average 2.57 mb mb/d. Growth in crude oil imports in January and February outweighed the decline in March.
0
100
200
300
400
500
600
700
800
900
1000
0
100
200
300
400
500
600
700
800
900
1000
Mar
09
Apr 0
9
May
09
Jun
09
Jul 0
9
Aug
09
Sep
09
Oct
09
Nov
09
Dec
09
Jan
10
Feb
10
Mar
10
tb/dtb/d
Others LPG Naphtha Gasoline Jet fuelGasoil Fuel oil Asphalt Crude [RHS]
Graph 40: China's exports of crude and petroleum products
ChangeJan 10 Feb 10 Mar 10 Mar/Feb
Crude oil 4,015 4,788 4,914 126Total products 69 450 271 -180Total crude and products 4,084 5,238 5,185 -54
Table 24: China's crude and product net imports, tb/d
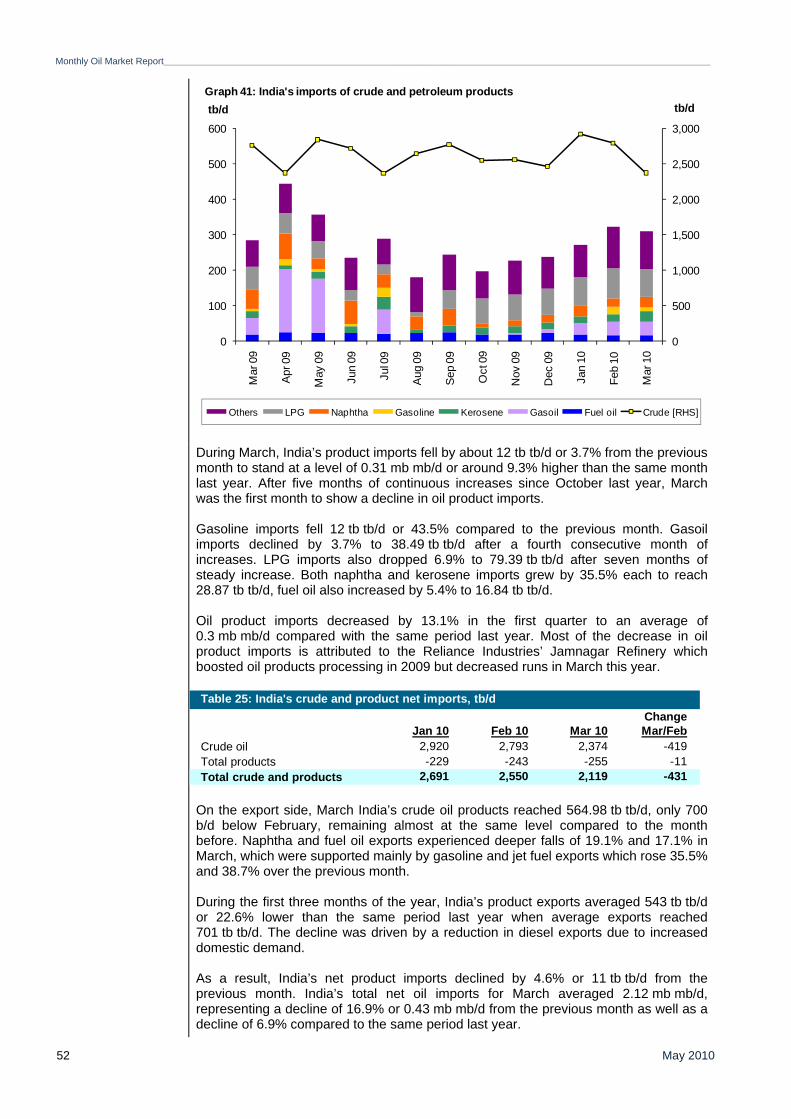
Monthly Oil Market Report_________________________________________________________________________________________________________________________________________
May 2010 52
During March, India’s product imports fell by about 12 tb tb/d or 3.7% from the previous month to stand at a level of 0.31 mb mb/d or around 9.3% higher than the same month last year. After five months of continuous increases since October last year, March was the first month to show a decline in oil product imports. Gasoline imports fell 12 tb tb/d or 43.5% compared to the previous month. Gasoil imports declined by 3.7% to 38.49 tb tb/d after a fourth consecutive month of increases. LPG imports also dropped 6.9% to 79.39 tb tb/d after seven months of steady increase. Both naphtha and kerosene imports grew by 35.5% each to reach 28.87 tb tb/d, fuel oil also increased by 5.4% to 16.84 tb tb/d. Oil product imports decreased by 13.1% in the first quarter to an average of 0.3 mb mb/d compared with the same period last year. Most of the decrease in oil product imports is attributed to the Reliance Industries’ Jamnagar Refinery which boosted oil products processing in 2009 but decreased runs in March this year.
On the export side, March India’s crude oil products reached 564.98 tb tb/d, only 700 b/d below February, remaining almost at the same level compared to the month before. Naphtha and fuel oil exports experienced deeper falls of 19.1% and 17.1% in March, which were supported mainly by gasoline and jet fuel exports which rose 35.5% and 38.7% over the previous month. During the first three months of the year, India’s product exports averaged 543 tb tb/d or 22.6% lower than the same period last year when average exports reached 701 tb tb/d. The decline was driven by a reduction in diesel exports due to increased domestic demand. As a result, India’s net product imports declined by 4.6% or 11 tb tb/d from the previous month. India’s total net oil imports for March averaged 2.12 mb mb/d, representing a decline of 16.9% or 0.43 mb mb/d from the previous month as well as a decline of 6.9% compared to the same period last year.
0
500
1,000
1,500
2,000
2,500
3,000
0
100
200
300
400
500
600
Mar
09
Apr
09
May
09
Jun
09
Jul 0
9
Aug
09
Sep
09
Oct
09
Nov
09
Dec
09
Jan
10
Feb
10
Mar
10
tb/dtb/d
Others LPG Naphtha Gasoline Kerosene Gasoil Fuel oil Crude [RHS]
Graph 41: India's imports of crude and petroleum products
ChangeJan 10 Feb 10 Mar 10 Mar/Feb
Crude oil 2,920 2,793 2,374 -419Total products -229 -243 -255 -11Total crude and products 2,691 2,550 2,119 -431
Table 25: India's crude and product net imports, tb/d
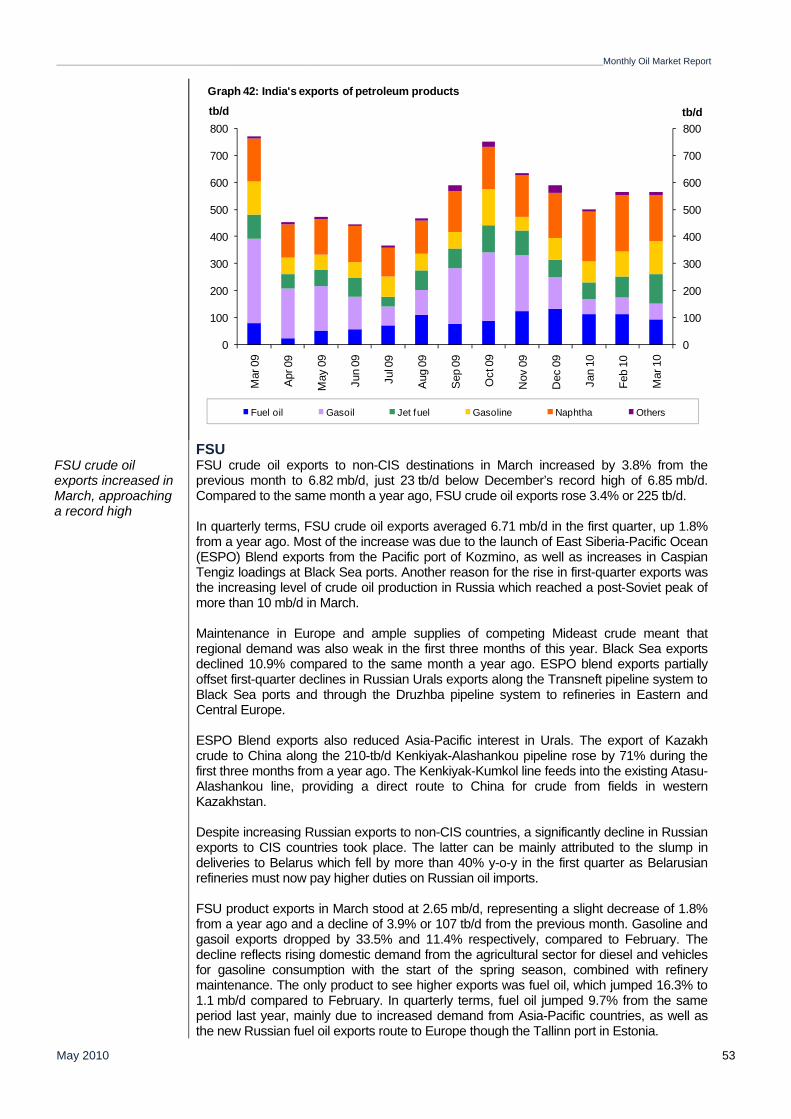
_________________________________________________________________________________________________________________________________________Monthly Oil Market Report
May 2010 53
FSU FSU crude oil exports increased in March, approaching a record high
FSU crude oil exports to non-CIS destinations in March increased by 3.8% from the previous month to 6.82 mb/d, just 23 tb/d below December’s record high of 6.85 mb/d. Compared to the same month a year ago, FSU crude oil exports rose 3.4% or 225 tb/d. In quarterly terms, FSU crude oil exports averaged 6.71 mb/d in the first quarter, up 1.8% from a year ago. Most of the increase was due to the launch of East Siberia-Pacific Ocean (ESPO) Blend exports from the Pacific port of Kozmino, as well as increases in Caspian Tengiz loadings at Black Sea ports. Another reason for the rise in first-quarter exports was the increasing level of crude oil production in Russia which reached a post-Soviet peak of more than 10 mb/d in March. Maintenance in Europe and ample supplies of competing Mideast crude meant that regional demand was also weak in the first three months of this year. Black Sea exports declined 10.9% compared to the same month a year ago. ESPO blend exports partially offset first-quarter declines in Russian Urals exports along the Transneft pipeline system to Black Sea ports and through the Druzhba pipeline system to refineries in Eastern and Central Europe. ESPO Blend exports also reduced Asia-Pacific interest in Urals. The export of Kazakh crude to China along the 210-tb/d Kenkiyak-Alashankou pipeline rose by 71% during the first three months from a year ago. The Kenkiyak-Kumkol line feeds into the existing Atasu-Alashankou line, providing a direct route to China for crude from fields in western Kazakhstan. Despite increasing Russian exports to non-CIS countries, a significantly decline in Russian exports to CIS countries took place. The latter can be mainly attributed to the slump in deliveries to Belarus which fell by more than 40% y-o-y in the first quarter as Belarusian refineries must now pay higher duties on Russian oil imports. FSU product exports in March stood at 2.65 mb/d, representing a slight decrease of 1.8% from a year ago and a decline of 3.9% or 107 tb/d from the previous month. Gasoline and gasoil exports dropped by 33.5% and 11.4% respectively, compared to February. The decline reflects rising domestic demand from the agricultural sector for diesel and vehicles for gasoline consumption with the start of the spring season, combined with refinery maintenance. The only product to see higher exports was fuel oil, which jumped 16.3% to 1.1 mb/d compared to February. In quarterly terms, fuel oil jumped 9.7% from the same period last year, mainly due to increased demand from Asia-Pacific countries, as well as the new Russian fuel oil exports route to Europe though the Tallinn port in Estonia.
0
100
200
300
400
500
600
700
800
0
100
200
300
400
500
600
700
800
Mar
09
Apr 0
9
May
09
Jun
09
Jul 0
9
Aug
09
Sep
09
Oct
09
Nov
09
Dec
09
Jan
10
Feb
10
Mar
10
tb/dtb/d
Fuel oil Gasoil Jet fuel Gasoline Naphtha Others
Graph 42: India's exports of petroleum products
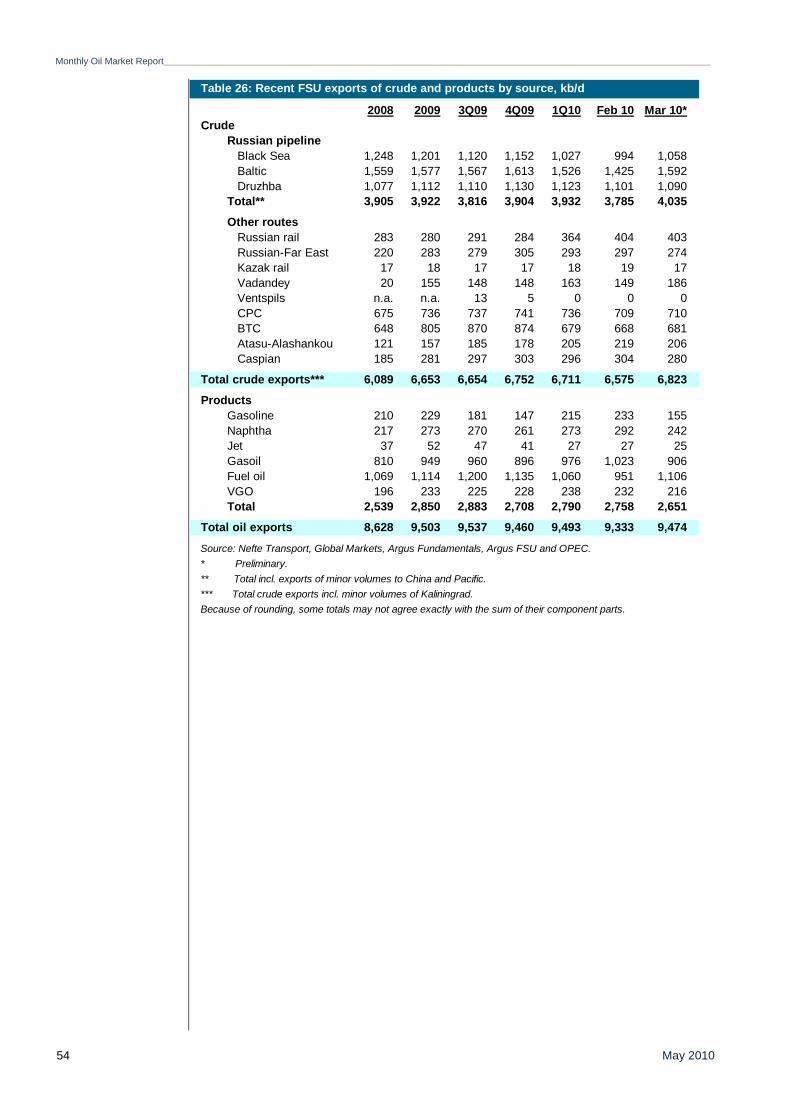
Monthly Oil Market Report_________________________________________________________________________________________________________________________________________
May 2010 54
2008 2009 3Q09 4Q09 1Q10 Feb 10 Mar 10*Crude
Russian pipeline Black Sea 1,248 1,201 1,120 1,152 1,027 994 1,058 Baltic 1,559 1,577 1,567 1,613 1,526 1,425 1,592 Druzhba 1,077 1,112 1,110 1,130 1,123 1,101 1,090Total** 3,905 3,922 3,816 3,904 3,932 3,785 4,035
Other routes Russian rail 283 280 291 284 364 404 403 Russian-Far East 220 283 279 305 293 297 274 Kazak rail 17 18 17 17 18 19 17 Vadandey 20 155 148 148 163 149 186 Ventspils n.a. n.a. 13 5 0 0 0 CPC 675 736 737 741 736 709 710 BTC 648 805 870 874 679 668 681 Atasu-Alashankou 121 157 185 178 205 219 206 Caspian 185 281 297 303 296 304 280
6,089 6,653 6,654 6,752 6,711 6,575 6,823
ProductsGasoline 210 229 181 147 215 233 155Naphtha 217 273 270 261 273 292 242Jet 37 52 47 41 27 27 25Gasoil 810 949 960 896 976 1,023 906Fuel oil 1,069 1,114 1,200 1,135 1,060 951 1,106VGO 196 233 225 228 238 232 216Total 2,539 2,850 2,883 2,708 2,790 2,758 2,651
8,628 9,503 9,537 9,460 9,493 9,333 9,474
Source: Nefte Transport, Global Markets, Argus Fundamentals, Argus FSU and OPEC.* Preliminary.** Total incl. exports of minor volumes to China and Pacific.*** Total crude exports incl. minor volumes of Kaliningrad.Because of rounding, some totals may not agree exactly with the sum of their component parts.
Table 26: Recent FSU exports of crude and products by source, kb/d
Total crude exports***
Total oil exports
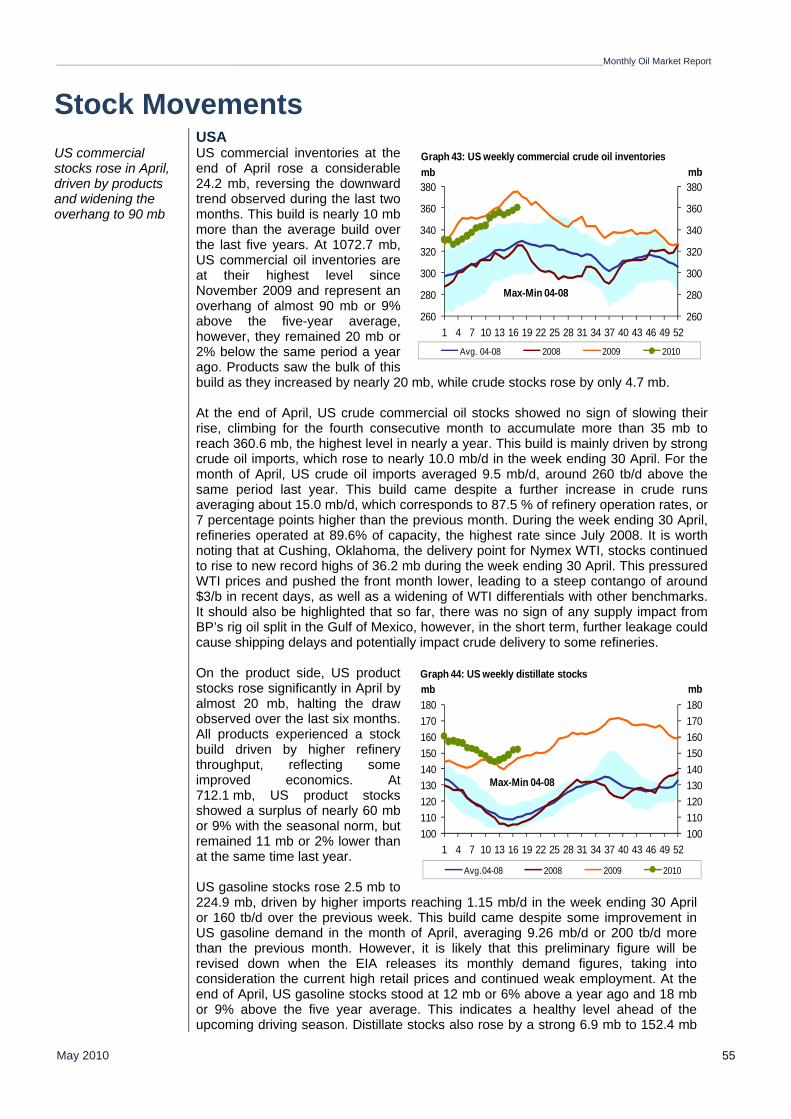
_________________________________________________________________________________________________________________________________________Monthly Oil Market Report
May 2010 55
Stock Movements
USA US commercial stocks rose in April, driven by products and widening the overhang to 90 mb
US commercial inventories at the end of April rose a considerable 24.2 mb, reversing the downward trend observed during the last two months. This build is nearly 10 mb more than the average build over the last five years. At 1072.7 mb, US commercial oil inventories are at their highest level since November 2009 and represent an overhang of almost 90 mb or 9% above the five-year average, however, they remained 20 mb or 2% below the same period a year ago. Products saw the bulk of this build as they increased by nearly 20 mb, while crude stocks rose by only 4.7 mb. At the end of April, US crude commercial oil stocks showed no sign of slowing their rise, climbing for the fourth consecutive month to accumulate more than 35 mb to reach 360.6 mb, the highest level in nearly a year. This build is mainly driven by strong crude oil imports, which rose to nearly 10.0 mb/d in the week ending 30 April. For the month of April, US crude oil imports averaged 9.5 mb/d, around 260 tb/d above the same period last year. This build came despite a further increase in crude runs averaging about 15.0 mb/d, which corresponds to 87.5 % of refinery operation rates, or 7 percentage points higher than the previous month. During the week ending 30 April, refineries operated at 89.6% of capacity, the highest rate since July 2008. It is worth noting that at Cushing, Oklahoma, the delivery point for Nymex WTI, stocks continued to rise to new record highs of 36.2 mb during the week ending 30 April. This pressured WTI prices and pushed the front month lower, leading to a steep contango of around $3/b in recent days, as well as a widening of WTI differentials with other benchmarks. It should also be highlighted that so far, there was no sign of any supply impact from BP’s rig oil split in the Gulf of Mexico, however, in the short term, further leakage could cause shipping delays and potentially impact crude delivery to some refineries.
On the product side, US product stocks rose significantly in April by almost 20 mb, halting the draw observed over the last six months. All products experienced a stock build driven by higher refinery throughput, reflecting some improved economics. At 712.1 mb, US product stocks showed a surplus of nearly 60 mb or 9% with the seasonal norm, but remained 11 mb or 2% lower than at the same time last year. US gasoline stocks rose 2.5 mb to 224.9 mb, driven by higher imports reaching 1.15 mb/d in the week ending 30 April or 160 tb/d over the previous week. This build came despite some improvement in US gasoline demand in the month of April, averaging 9.26 mb/d or 200 tb/d more than the previous month. However, it is likely that this preliminary figure will be revised down when the EIA releases its monthly demand figures, taking into consideration the current high retail prices and continued weak employment. At the end of April, US gasoline stocks stood at 12 mb or 6% above a year ago and 18 mb or 9% above the five year average. This indicates a healthy level ahead of the upcoming driving season. Distillate stocks also rose by a strong 6.9 mb to 152.4 mb
260
280
300
320
340
360
380
260
280
300
320
340
360
380
1 4 7 10 13 16 19 22 25 28 31 34 37 40 43 46 49 52
mbmb
Avg. 04-08 2008 2009 2010
Graph 43: US weekly commercial crude oil inventories
Max-Min 04-08
100110120130140150160170180
100110120130140150160170180
1 4 7 10 13 16 19 22 25 28 31 34 37 40 43 46 49 52
mbmb
Avg.04-08 2008 2009 2010
Graph 44: US weekly distillate stocks
Max-Min 04-08
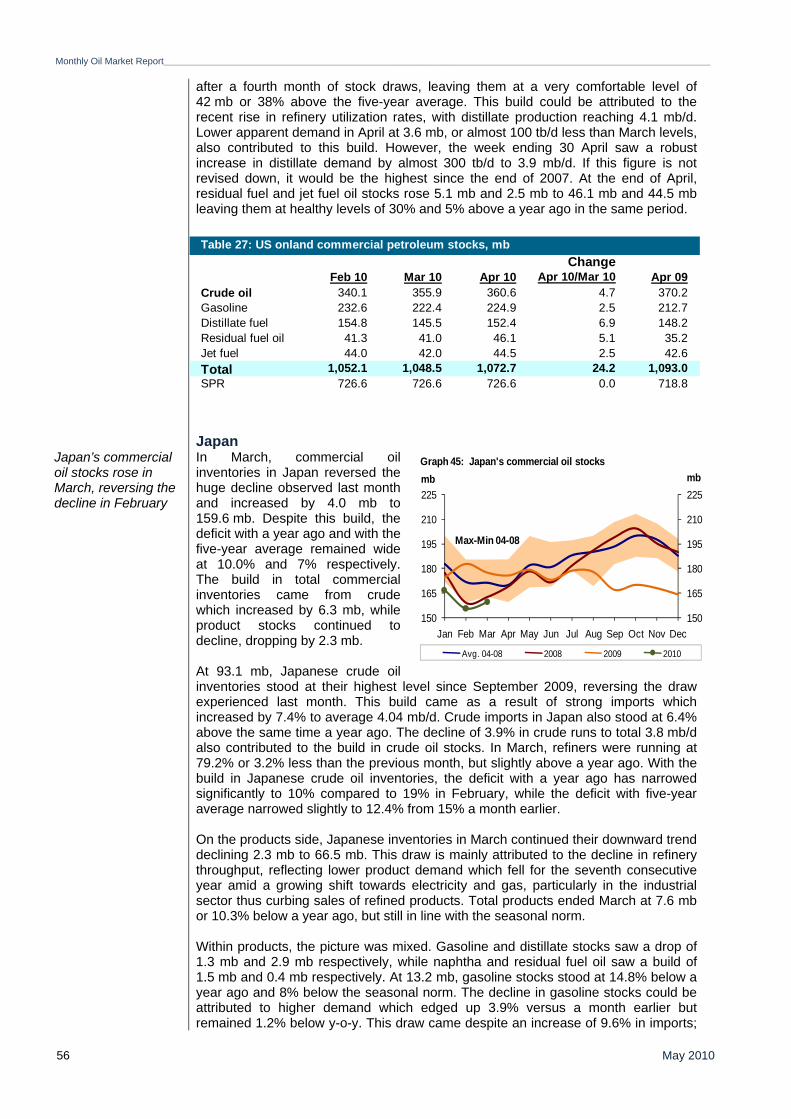
Monthly Oil Market Report_________________________________________________________________________________________________________________________________________
May 2010 56
after a fourth month of stock draws, leaving them at a very comfortable level of 42 mb or 38% above the five-year average. This build could be attributed to the recent rise in refinery utilization rates, with distillate production reaching 4.1 mb/d. Lower apparent demand in April at 3.6 mb, or almost 100 tb/d less than March levels, also contributed to this build. However, the week ending 30 April saw a robust increase in distillate demand by almost 300 tb/d to 3.9 mb/d. If this figure is not revised down, it would be the highest since the end of 2007. At the end of April, residual fuel and jet fuel oil stocks rose 5.1 mb and 2.5 mb to 46.1 mb and 44.5 mb leaving them at healthy levels of 30% and 5% above a year ago in the same period.
Japan Japan’s commercial oil stocks rose in March, reversing the decline in February
In March, commercial oil inventories in Japan reversed the huge decline observed last month and increased by 4.0 mb to 159.6 mb. Despite this build, the deficit with a year ago and with the five-year average remained wide at 10.0% and 7% respectively. The build in total commercial inventories came from crude which increased by 6.3 mb, while product stocks continued to decline, dropping by 2.3 mb. At 93.1 mb, Japanese crude oil inventories stood at their highest level since September 2009, reversing the draw experienced last month. This build came as a result of strong imports which increased by 7.4% to average 4.04 mb/d. Crude imports in Japan also stood at 6.4% above the same time a year ago. The decline of 3.9% in crude runs to total 3.8 mb/d also contributed to the build in crude oil stocks. In March, refiners were running at 79.2% or 3.2% less than the previous month, but slightly above a year ago. With the build in Japanese crude oil inventories, the deficit with a year ago has narrowed significantly to 10% compared to 19% in February, while the deficit with five-year average narrowed slightly to 12.4% from 15% a month earlier. On the products side, Japanese inventories in March continued their downward trend declining 2.3 mb to 66.5 mb. This draw is mainly attributed to the decline in refinery throughput, reflecting lower product demand which fell for the seventh consecutive year amid a growing shift towards electricity and gas, particularly in the industrial sector thus curbing sales of refined products. Total products ended March at 7.6 mb or 10.3% below a year ago, but still in line with the seasonal norm. Within products, the picture was mixed. Gasoline and distillate stocks saw a drop of 1.3 mb and 2.9 mb respectively, while naphtha and residual fuel oil saw a build of 1.5 mb and 0.4 mb respectively. At 13.2 mb, gasoline stocks stood at 14.8% below a year ago and 8% below the seasonal norm. The decline in gasoline stocks could be attributed to higher demand which edged up 3.9% versus a month earlier but remained 1.2% below y-o-y. This draw came despite an increase of 9.6% in imports;
ChangeFeb 10 Mar 10 Apr 10 Apr 10/Mar 10 Apr 09
Crude oil 340.1 355.9 360.6 4.7 370.2Gasoline 232.6 222.4 224.9 2.5 212.7Distillate fuel 154.8 145.5 152.4 6.9 148.2Residual fuel oil 41.3 41.0 46.1 5.1 35.2Jet fuel 44.0 42.0 44.5 2.5 42.6Total 1,052.1 1,048.5 1,072.7 24.2 1,093.0SPR 726.6 726.6 726.6 0.0 718.8
Table 27: US onland commercial petroleum stocks, mb
150
165
180
195
210
225
150
165
180
195
210
225
Jan Feb Mar Apr May Jun Jul Aug Sep Oct Nov Dec
mbmb
Avg. 04-08 2008 2009 2010
Graph 45: Japan's commercial oil stocks
Max-Min 04-08
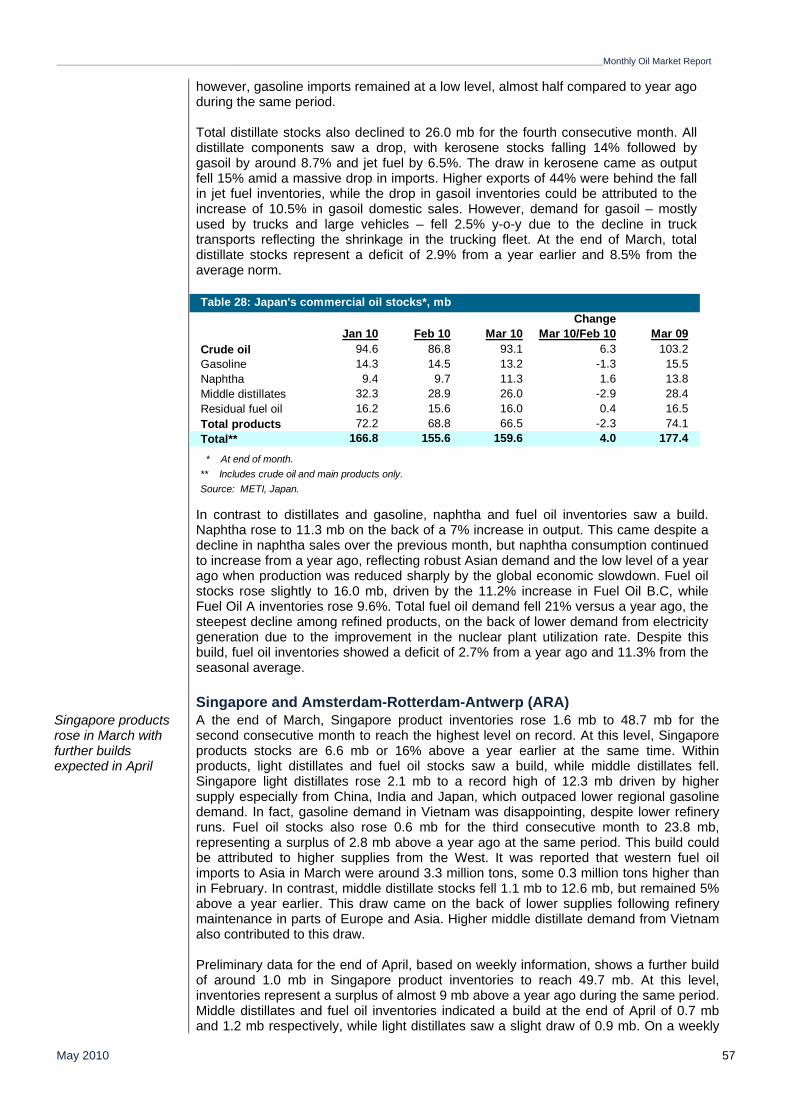
_________________________________________________________________________________________________________________________________________Monthly Oil Market Report
May 2010 57
however, gasoline imports remained at a low level, almost half compared to year ago during the same period. Total distillate stocks also declined to 26.0 mb for the fourth consecutive month. All distillate components saw a drop, with kerosene stocks falling 14% followed by gasoil by around 8.7% and jet fuel by 6.5%. The draw in kerosene came as output fell 15% amid a massive drop in imports. Higher exports of 44% were behind the fall in jet fuel inventories, while the drop in gasoil inventories could be attributed to the increase of 10.5% in gasoil domestic sales. However, demand for gasoil – mostly used by trucks and large vehicles – fell 2.5% y-o-y due to the decline in truck transports reflecting the shrinkage in the trucking fleet. At the end of March, total distillate stocks represent a deficit of 2.9% from a year earlier and 8.5% from the average norm.
In contrast to distillates and gasoline, naphtha and fuel oil inventories saw a build.
Naphtha rose to 11.3 mb on the back of a 7% increase in output. This came despite a decline in naphtha sales over the previous month, but naphtha consumption continued to increase from a year ago, reflecting robust Asian demand and the low level of a year ago when production was reduced sharply by the global economic slowdown. Fuel oil stocks rose slightly to 16.0 mb, driven by the 11.2% increase in Fuel Oil B.C, while Fuel Oil A inventories rose 9.6%. Total fuel oil demand fell 21% versus a year ago, the steepest decline among refined products, on the back of lower demand from electricity generation due to the improvement in the nuclear plant utilization rate. Despite this build, fuel oil inventories showed a deficit of 2.7% from a year ago and 11.3% from the seasonal average.
Singapore and Amsterdam-Rotterdam-Antwerp (ARA) Singapore products rose in March with further builds expected in April
A the end of March, Singapore product inventories rose 1.6 mb to 48.7 mb for the second consecutive month to reach the highest level on record. At this level, Singapore products stocks are 6.6 mb or 16% above a year earlier at the same time. Within products, light distillates and fuel oil stocks saw a build, while middle distillates fell. Singapore light distillates rose 2.1 mb to a record high of 12.3 mb driven by higher supply especially from China, India and Japan, which outpaced lower regional gasoline demand. In fact, gasoline demand in Vietnam was disappointing, despite lower refinery runs. Fuel oil stocks also rose 0.6 mb for the third consecutive month to 23.8 mb, representing a surplus of 2.8 mb above a year ago at the same period. This build could be attributed to higher supplies from the West. It was reported that western fuel oil imports to Asia in March were around 3.3 million tons, some 0.3 million tons higher than in February. In contrast, middle distillate stocks fell 1.1 mb to 12.6 mb, but remained 5% above a year earlier. This draw came on the back of lower supplies following refinery maintenance in parts of Europe and Asia. Higher middle distillate demand from Vietnam also contributed to this draw. Preliminary data for the end of April, based on weekly information, shows a further build of around 1.0 mb in Singapore product inventories to reach 49.7 mb. At this level, inventories represent a surplus of almost 9 mb above a year ago during the same period. Middle distillates and fuel oil inventories indicated a build at the end of April of 0.7 mb and 1.2 mb respectively, while light distillates saw a slight draw of 0.9 mb. On a weekly
ChangeJan 10 Feb 10 Mar 10 Mar 10/Feb 10 Mar 09
Crude oil 94.6 86.8 93.1 6.3 103.2Gasoline 14.3 14.5 13.2 -1.3 15.5Naphtha 9.4 9.7 11.3 1.6 13.8Middle distillates 32.3 28.9 26.0 -2.9 28.4Residual fuel oil 16.2 15.6 16.0 0.4 16.5Total products 72.2 68.8 66.5 -2.3 74.1Total** 166.8 155.6 159.6 4.0 177.4
Table 28: Japan's commercial oil stocks*, mb
Source: METI, Japan.
* At end of month.** Includes crude oil and main products only.
Monthly Oil Market Report_________________________________________________________________________________________________________________________________________
May 2010 58
basis, at 13.3 mb, middle distillate stocks fell to a four week low as strong demand from India and Indonesia outpaced healthy exports from China and South Korea. At 25.0 mb, fuel oil stocks are considered to be at high levels, driven by heavier inflows to Asia which kept supply higher. Light distillate stocks stood at 11.4 mb at the end of April, the highest level in two weeks, driven by ample supply from South Korea and China which outpaced gasoline demand for the two main importing countries – Indonesia and Vietnam – with demand for these two countries lower than a week ago. Product stocks in ARA at the end of March reversed the downward trend over the last two months and built 1.0 mb to 37.4 mb to remain at a surplus of 4.0 mb above a year ago in the same period. With the exception of gasoil and jet fuel, the three other products indicated a build. At 16.4 mb, gasoil stocks fell for the third consecutive month as the market structure discouraged trades to store this product. Additionally, gasoil exports to the UK and to Northwest Europe were higher than imports, leading to a stock draw for gasoil inventories. Jet fuel oil stocks slipped 0.6 mb to 5.8 mb, almost unchanged from a year ago at the same period. Fuel oil stocks rose 2.2 mb to 6.4 mb as local production and imports from India, Kuwait and UAE outpaced local demand. Fuel oil stocks remained at 2.4 mb above a year earlier. Naphtha stocks at the end of April also rose 0.3 mb to 0.65 mb on the back of limited import opportunities. Gasoline stocks rose significantly by 1.6 mb to 8.2 mb, widening the surplus with a year ago to 1.2 mb. This increase came as traders started building stocks ahead of the summer season. Preliminary data for the end of April, based on weekly information, indicates a further build in total product stocks of 1.0 mb to 38.4 mb, versus the previous month, to remain at healthy levels with a surplus of 5 mb above a year ago. Gasoline stocks continued to increase further by 0.6 mb to 8.7 mb due to heavy imports and also benefiting from the contango market structure. Gasoil inventories rose 0.6 mb to nearly 17 mb, after falling last month. Lower exports going to France and the UK contributed to this build. Jet fuel inventories at the end of April rose 0.3 mb to 6.2 mb, remaining almost at the same level as the previous year. This build came on the back of higher supply and lower demand for jet fuel resulting from the disruption in air traffic. Fuel oil and naphtha inventories fell 0.4 mb and 0.1 mb to 6.2 mb and 0.5 mb respectively.
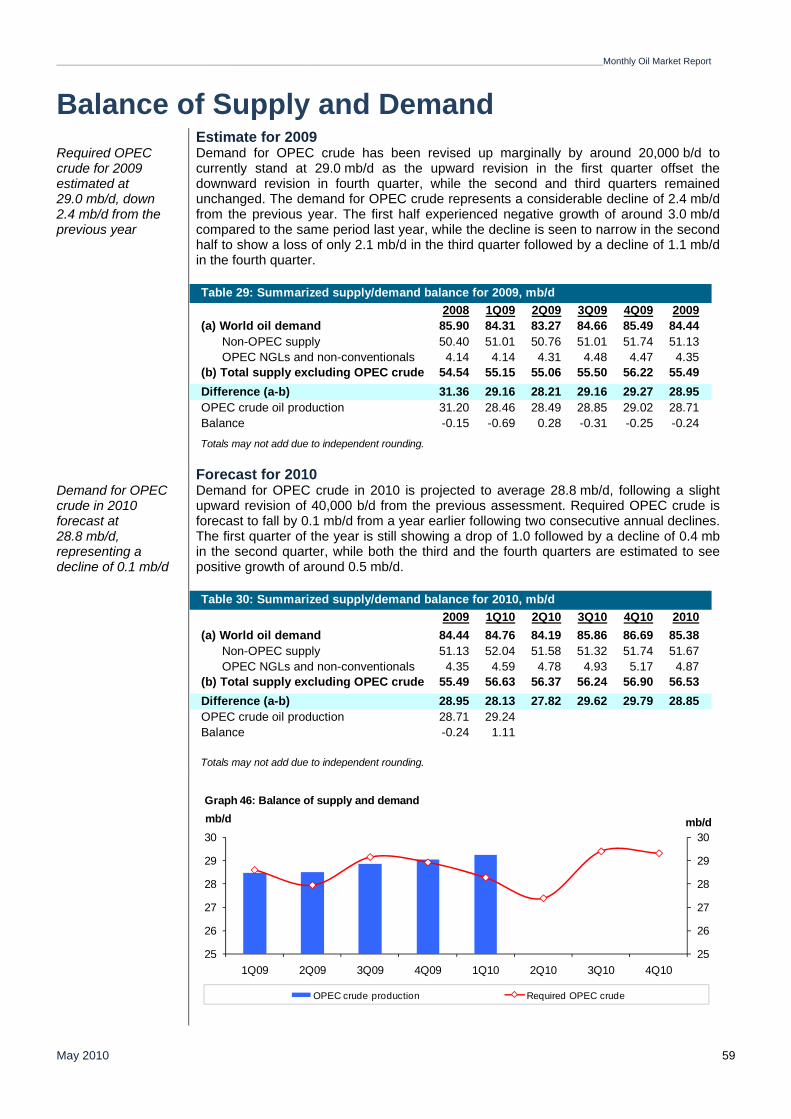
_________________________________________________________________________________________________________________________________________Monthly Oil Market Report
May 2010 59
Balance of Supply and Demand Estimate for 2009 Required OPEC crude for 2009 estimated at 29.0 mb/d, down 2.4 mb/d from the previous year
Demand for OPEC crude has been revised up marginally by around 20,000 b/d to currently stand at 29.0 mb/d as the upward revision in the first quarter offset the downward revision in fourth quarter, while the second and third quarters remained unchanged. The demand for OPEC crude represents a considerable decline of 2.4 mb/d from the previous year. The first half experienced negative growth of around 3.0 mb/d compared to the same period last year, while the decline is seen to narrow in the second half to show a loss of only 2.1 mb/d in the third quarter followed by a decline of 1.1 mb/d in the fourth quarter.
Forecast for 2010 Demand for OPEC crude in 2010 forecast at 28.8 mb/d, representing a decline of 0.1 mb/d
Demand for OPEC crude in 2010 is projected to average 28.8 mb/d, following a slight upward revision of 40,000 b/d from the previous assessment. Required OPEC crude is forecast to fall by 0.1 mb/d from a year earlier following two consecutive annual declines. The first quarter of the year is still showing a drop of 1.0 followed by a decline of 0.4 mb in the second quarter, while both the third and the fourth quarters are estimated to see positive growth of around 0.5 mb/d.
2008 1Q09 2Q09 3Q09 4Q09 2009(a) World oil demand 85.90 84.31 83.27 84.66 85.49 84.44 Non-OPEC supply 50.40 51.01 50.76 51.01 51.74 51.13 OPEC NGLs and non-conventionals 4.14 4.14 4.31 4.48 4.47 4.35(b) Total supply excluding OPEC crude 54.54 55.15 55.06 55.50 56.22 55.49Difference (a-b) 31.36 29.16 28.21 29.16 29.27 28.95OPEC crude oil production 31.20 28.46 28.49 28.85 29.02 28.71Balance -0.15 -0.69 0.28 -0.31 -0.25 -0.24
Totals may not add due to independent rounding.
Table 29: Summarized supply/demand balance for 2009, mb/d
2009 1Q10 2Q10 3Q10 4Q10 2010(a) World oil demand 84.44 84.76 84.19 85.86 86.69 85.38 Non-OPEC supply 51.13 52.04 51.58 51.32 51.74 51.67 OPEC NGLs and non-conventionals 4.35 4.59 4.78 4.93 5.17 4.87(b) Total supply excluding OPEC crude 55.49 56.63 56.37 56.24 56.90 56.53Difference (a-b) 28.95 28.13 27.82 29.62 29.79 28.85OPEC crude oil production 28.71 29.24Balance -0.24 1.11
Totals may not add due to independent rounding.
Table 30: Summarized supply/demand balance for 2010, mb/d
25
26
27
28
29
30
25
26
27
28
29
30
1Q09 2Q09 3Q09 4Q09 1Q10 2Q10 3Q10 4Q10
mb/dmb/d
OPEC crude production Required OPEC crude
Graph 46: Balance of supply and demand
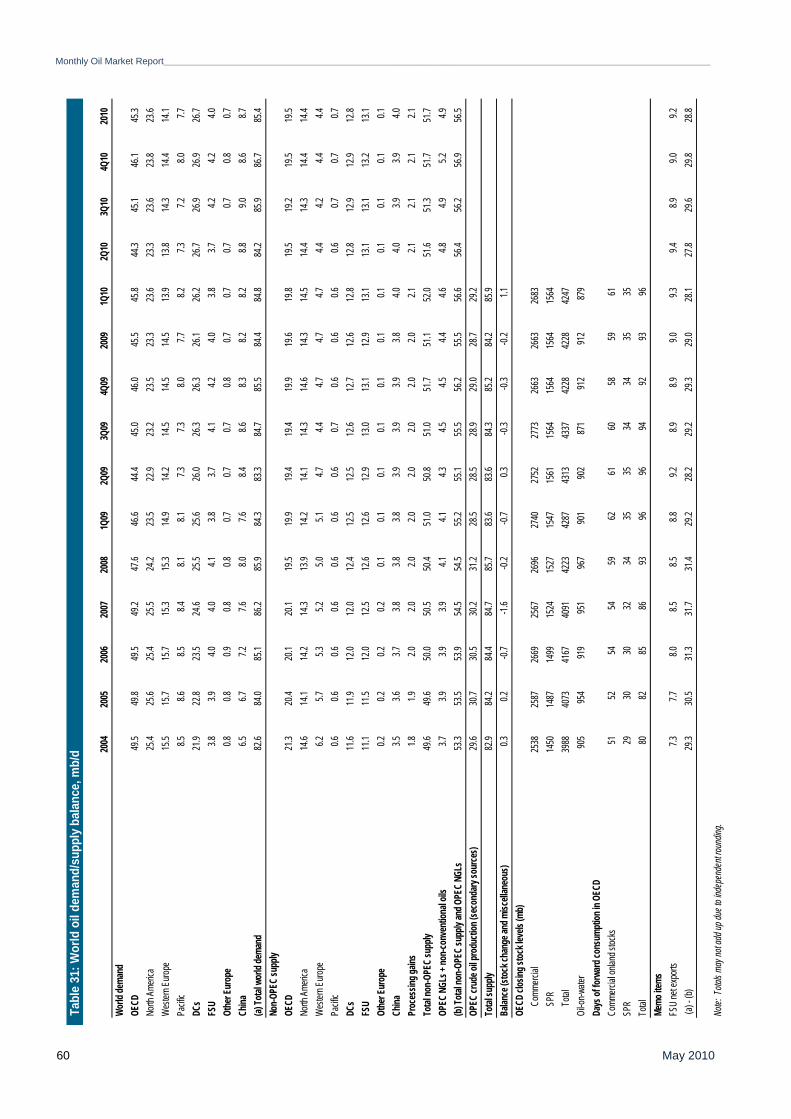
Monthly Oil Market Report_________________________________________________________________________________________________________________________________________
May 2010 60
20
0420
0520
0620
0720
081Q
092Q
093Q
094Q
0920
091Q
102Q
103Q
104Q
1020
10Wo
rld de
mand
OECD
49.5
49.8
49.5
49.2
47.6
46.6
44.4
45.0
46.0
45.5
45.8
44.3
45.1
46.1
45.3
North
Ameri
ca25
.425
.625
.425
.524
.223
.522
.923
.223
.523
.323
.623
.323
.623
.823
.6W
ester
n Euro
pe15
.515
.715
.715
.315
.314
.914
.214
.514
.514
.513
.913
.814
.314
.414
.1Pa
cific
8.58.6
8.58.4
8.18.1
7.37.3
8.07.7
8.27.3
7.28.0
7.7DC
s21
.922
.823
.524
.625
.525
.626
.026
.326
.326
.126
.226
.726
.926
.926
.7FS
U3.8
3.94.0
4.04.1
3.83.7
4.14.2
4.03.8
3.74.2
4.24.0
Othe
r Eur
ope
0.80.8
0.90.8
0.80.7
0.70.7
0.80.7
0.70.7
0.70.8
0.7Ch
ina6.5
6.77.2
7.68.0
7.68.4
8.68.3
8.28.2
8.89.0
8.68.7
(a) To
tal w
orld
dema
nd82
.684
.085
.186
.285
.984
.383
.384
.785
.584
.484
.884
.285
.986
.785
.4No
n-OPE
C su
pply
OECD
21.3
20.4
20.1
20.1
19.5
19.9
19.4
19.4
19.9
19.6
19.8
19.5
19.2
19.5
19.5
North
Ameri
ca14
.614
.114
.214
.313
.914
.214
.114
.314
.614
.314
.514
.414
.314
.414
.4W
ester
n Euro
pe6.2
5.75.3
5.25.0
5.14.7
4.44.7
4.74.7
4.44.2
4.44.4
Pacif
ic0.6
0.60.6
0.60.6
0.60.6
0.70.6
0.60.6
0.60.7
0.70.7
DCs
11.6
11.9
12.0
12.0
12.4
12.5
12.5
12.6
12.7
12.6
12.8
12.8
12.9
12.9
12.8
FSU
11.1
11.5
12.0
12.5
12.6
12.6
12.9
13.0
13.1
12.9
13.1
13.1
13.1
13.2
13.1
Othe
r Eur
ope
0.20.2
0.20.2
0.10.1
0.10.1
0.10.1
0.10.1
0.10.1
0.1Ch
ina3.5
3.63.7
3.83.8
3.83.9
3.93.9
3.84.0
4.03.9
3.94.0
Proc
essin
g gain
s1.8
1.92.0
2.02.0
2.02.0
2.02.0
2.02.1
2.12.1
2.12.1
Total
non-O
PEC
supp
ly49
.649
.650
.050
.550
.451
.050
.851
.051
.751
.152
.051
.651
.351
.751
.7OP
EC N
GLs +
non-c
onve
ntion
al oil
s3.7
3.93.9
3.94.1
4.14.3
4.54.5
4.44.6
4.84.9
5.24.9
(b) To
tal no
n-OPE
C su
pply
and O
PEC
NGLs
53.3
53.5
53.9
54.5
54.5
55.2
55.1
55.5
56.2
55.5
56.6
56.4
56.2
56.9
56.5
OPEC
crud
e oil p
rodu
ction
(sec
onda
ry so
urce
s)29
.630
.730
.530
.231
.228
.528
.528
.929
.028
.729
.2To
tal su
pply
82.9
84.2
84.4
84.7
85.7
83.6
83.6
84.3
85.2
84.2
85.9
Balan
ce (s
tock c
hang
e and
misc
ellan
eous
)0.3
0.2-0.
7-1.
6-0.
2-0.
70.3
-0.3
-0.3
-0.2
1.1OE
CD cl
osing
stoc
k lev
els (m
b)
Com
merci
al25
3825
8726
6925
6726
9627
4027
5227
7326
6326
6326
83
SPR
1450
1487
1499
1524
1527
1547
1561
1564
1564
1564
1564
To
tal39
8840
7341
6740
9142
2342
8743
1343
3742
2842
2842
47Oi
l-on-w
ater
905
954
919
951
967
901
902
871
912
912
879
Days
of fo
rward
cons
umpti
on in
OEC
DCo
mmerc
ial on
land s
tocks
5152
5454
5962
6160
5859
61SP
R29
3030
3234
3535
3434
3535
Total
8082
8586
9396
9694
9293
96Me
mo ite
msFS
U ne
t exp
orts
7.37.7
8.08.5
8.58.8
9.28.9
8.99.0
9.39.4
8.99.0
9.2 (a
) - (b
)
29.3
30.5
31.3
31.7
31.4
29.2
28.2
29.2
29.3
29.0
28.1
27.8
29.6
29.8
28.8
Note:
Tota
ls ma
y not
add u
p due
to in
depe
nden
t roun
ding.
Tabl
e 31
: Wor
ld o
il de
man
d/su
pply
bal
ance
, mb/
d
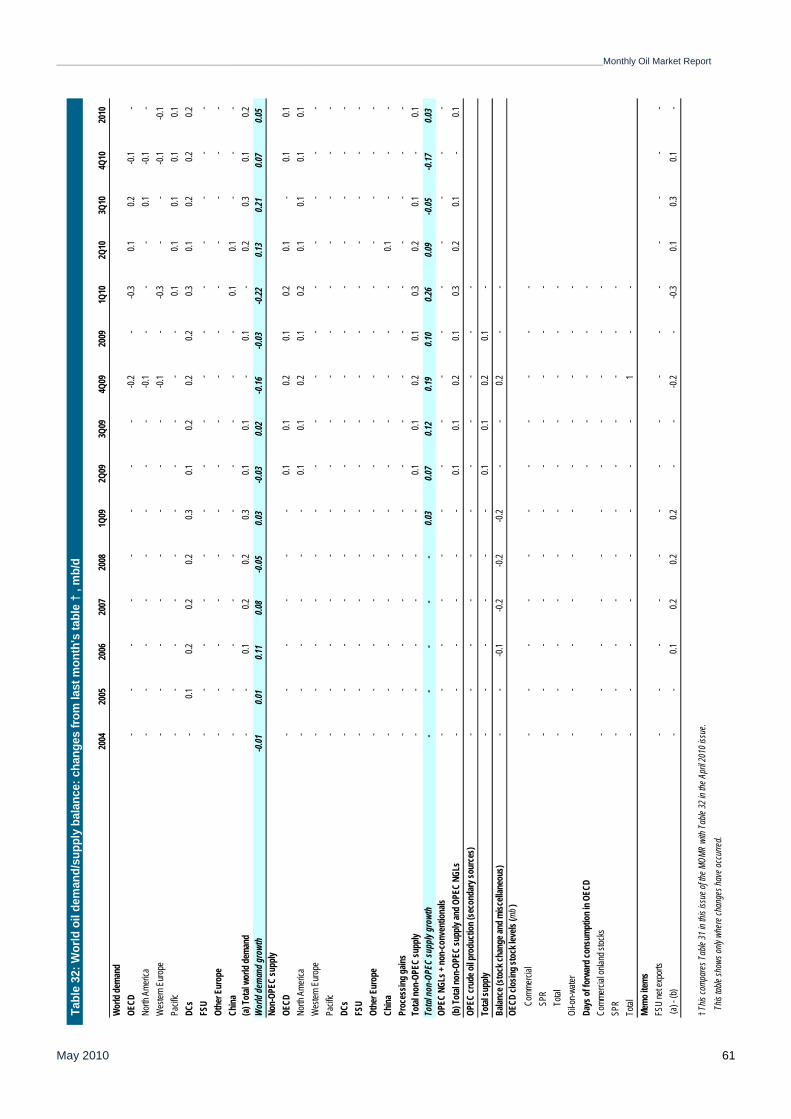
_________________________________________________________________________________________________________________________________________Monthly Oil Market Report
May 2010 61
Tabl
e 32
: Wor
ld o
il de
man
d/su
pply
bal
ance
: cha
nges
from
last
mon
th's
tabl
e †
, mb/
d
2004
2005
2006
2007
2008
1Q09
2Q09
3Q09
4Q09
2009
1Q10
2Q10
3Q10
4Q10
2010
Wor
ld de
mand
OECD
--
--
--
--
-0.2
--0
.30.1
0.2-0.
1-
North
Ame
rica
--
--
--
--
-0.1
--
-0.1
-0.1
-W
ester
n Eur
ope
--
--
--
--
-0.1
--0
.3-
--0.
1-0
.1Pa
cific
--
--
--
--
--
0.10.1
0.10.1
0.1DC
s-
0.10.2
0.20.2
0.30.1
0.20.2
0.20.3
0.10.2
0.20.2
FSU
--
--
--
--
--
--
--
-Ot
her E
urop
e-
--
--
--
--
--
--
--
China
--
--
--
--
--
0.10.1
--
-(a)
Total
wor
ld de
mand
--
0.10.2
0.20.3
0.10.1
-0.1
-0.2
0.30.1
0.2W
orld
dema
nd gr
owth
-0.01
0.01
0.11
0.08
-0.05
0.03
-0.03
0.02
-0.16
-0.03
-0.22
0.13
0.21
0.07
0.05
Non-
OPEC
supp
lyOE
CD-
--
--
-0.1
0.10.2
0.10.2
0.1-
0.10.1
North
Ame
rica
--
--
--
0.10.1
0.20.1
0.20.1
0.10.1
0.1W
ester
n Eur
ope
--
--
--
--
--
--
--
-Pa
cific
--
--
--
--
--
--
--
-DC
s-
--
--
--
--
--
--
--
FSU
--
--
--
--
--
--
--
-Ot
her E
urop
e-
--
--
--
--
--
--
--
China
--
--
--
--
--
-0.1
--
-Pr
oces
sing g
ains
--
--
--
--
--
--
--
-To
tal no
n-OP
EC su
pply
--
--
--
0.10.1
0.20.1
0.30.2
0.1-
0.1To
tal no
n-OP
EC su
pply
grow
th-
--
--
0.03
0.07
0.12
0.19
0.10
0.26
0.09
-0.05
-0.17
0.03
OPEC
NGL
s + no
n-co
nven
tiona
ls-
--
--
--
--
--
--
--
(b) T
otal
non-
OPEC
supp
ly an
d OPE
C NG
Ls-
--
--
-0.1
0.10.2
0.10.3
0.20.1
-0.1
OPEC
crud
e oil p
rodu
ction
(sec
onda
ry so
urce
s)-
--
--
--
--
--
Total
supp
ly-
--
--
-0.1
0.10.2
0.1-
Balan
ce (s
tock
chan
ge an
d misc
ellan
eous
)-
--0
.1-0.
2-0
.2-0
.2-
-0.2
--
OECD
clos
ing st
ock l
evels
(mb )
C
omme
rcial
--
--
--
--
--
-
SPR
--
--
--
--
--
-
Total
--
--
--
--
--
-Oi
l-on-w
ater
--
--
--
--
--
-Da
ys of
forw
ard c
onsu
mptio
n in O
ECD
--
--
-Co
mmer
cial o
nland
stoc
ks-
--
--
--
--
--
SPR
--
--
--
--
--
-To
tal-
--
--
--
-1
--
Memo
items
FSU
net e
xpor
ts-
--
--
--
--
--
--
--
(a) -
(b)
-
-0.1
0.20.2
0.2-
--0.
2-
-0.3
0.10.3
0.1-
† This
comp
ares
Tab
le 31
in th
is iss
ue of
the M
OMR
with
Table
32 in
the A
pril 2
010 i
ssue
. T
his ta
ble sh
ows o
nly w
here
chan
ges h
ave o
ccur
red.
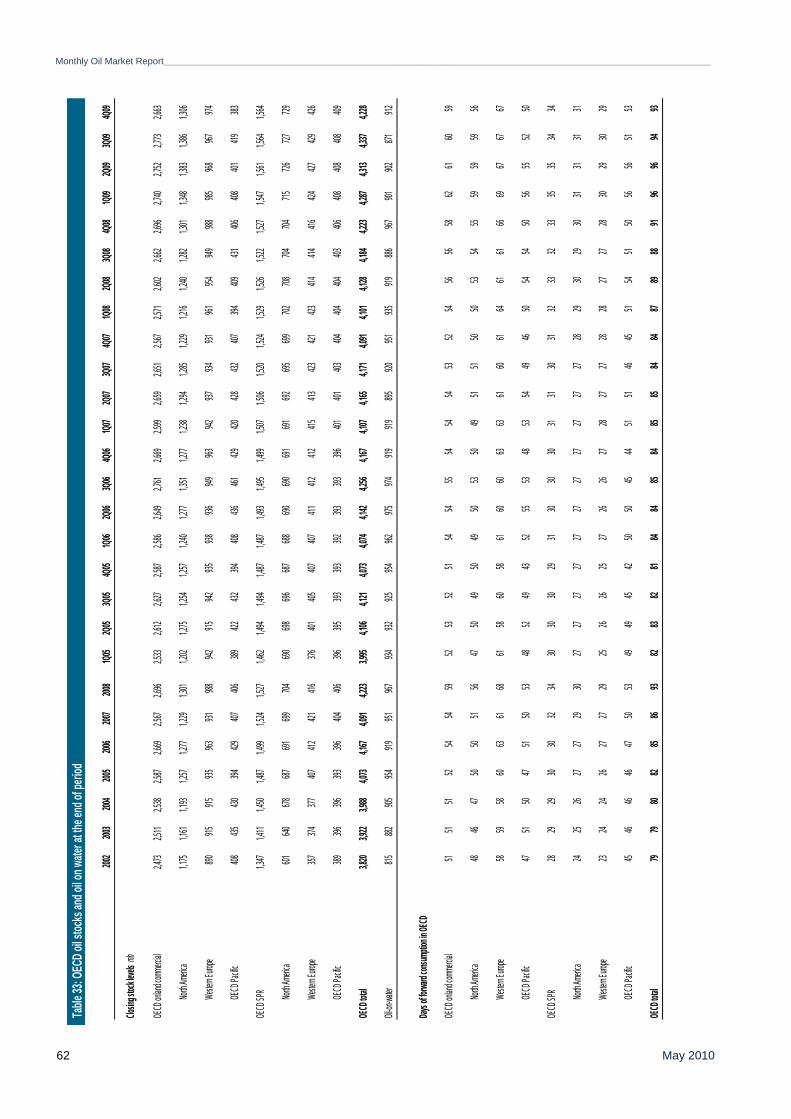
Monthly Oil Market Report_________________________________________________________________________________________________________________________________________
May 2010 62
2002
2003
2004
2005
2006
2007
2008
1Q05
2Q05
3Q05
4Q05
1Q06
2Q06
3Q06
4Q06
1Q07
2Q07
3Q07
4Q07
1Q08
2Q08
3Q08
4Q08
1Q09
2Q09
3Q09
4Q09
Closin
g stoc
k level
s mb
OECD
onlan
d com
mercia
l2,4
732,5
112,5
382,5
872,6
692,5
672,6
962,5
332,6
122,6
272,5
872,5
862,6
492,7
612,6
692,5
992,6
592,6
512,5
672,5
712,6
022,6
622,6
962,7
402,7
522,7
732,6
63
North A
merica
1,175
1,161
1,193
1,257
1,277
1,229
1,301
1,202
1,275
1,254
1,257
1,240
1,277
1,351
1,277
1,238
1,294
1,285
1,229
1,216
1,240
1,282
1,301
1,348
1,383
1,386
1,306
Weste
rn Euro
pe890
915915
935963
931988
942915
942935
938936
949963
942937
934931
961954
949988
985968
967974
OECD
Pacific
408435
430394
429407
406389
422432
394408
436461
429420
428432
407394
409431
406408
401419
383
OECD
SPR
1,347
1,411
1,450
1,487
1,499
1,524
1,527
1,462
1,494
1,494
1,487
1,487
1,493
1,495
1,499
1,507
1,506
1,520
1,524
1,529
1,526
1,522
1,527
1,547
1,561
1,564
1,564
North A
merica
601640
678687
691699
704690
698696
687688
690690
691691
692695
699702
708704
704715
726727
729
Weste
rn Euro
pe357
374377
407412
421416
376401
405407
407411
412412
415413
423421
423414
414416
424427
429426
OECD
Pacific
389396
396393
396404
406396
395393
393392
393393
396401
401403
404404
404403
406408
408408
409
OECD
total
3,820
3,922
3,988
4,073
4,167
4,091
4,223
3,995
4,106
4,121
4,073
4,074
4,142
4,256
4,167
4,107
4,165
4,171
4,091
4,101
4,128
4,184
4,223
4,287
4,313
4,337
4,228
Oil-on-
water
815882
905954
919951
967934
932925
954962
975974
919919
895920
951935
919886
967901
902871
912
Days o
f forwa
rd cons
umptio
n in OE
CD
OECD
onlan
d com
mercia
l51
5151
5254
5459
5253
5251
5454
5554
5454
5352
5456
5658
6261
6059
North A
merica
4846
4750
5051
5647
5049
5049
5053
5049
5151
5050
5354
5559
5959
56
Weste
rn Euro
pe58
5958
6063
6168
6158
6058
6160
6063
6361
6061
6461
6166
6967
6767
OECD
Pacific
4751
5047
5150
5348
5249
4352
5553
4853
5449
4650
5454
5056
5552
50
OECD
SPR
2829
2930
3032
3430
3030
2931
3030
3031
3130
3132
3332
3335
3534
34
North A
merica
2425
2627
2729
3027
2727
2727
2727
2727
2727
2829
3029
3031
3131
31
Weste
rn Euro
pe23
2424
2627
2729
2526
2625
2726
2627
2827
2728
2827
2728
3029
3029
OECD
Pacific
4546
4646
4750
5349
4945
4250
5045
4451
5146
4551
5451
5056
5651
53
OECD
total
7979
8082
8586
9382
8382
8184
8485
8485
8584
8487
8988
9196
9694
93
n.a. No
t availa
ble.
Table
33: O
ECD o
il stoc
ks an
d oil o
n wate
r at th
e end
of pe
riod
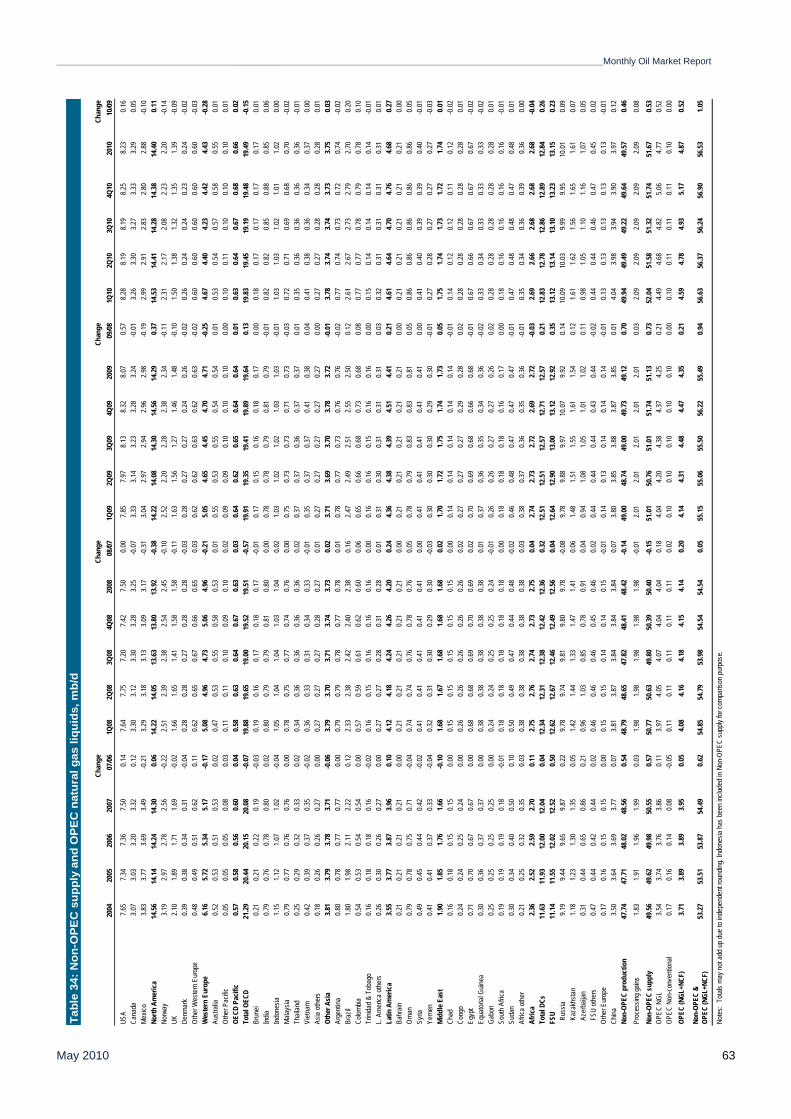
_________________________________________________________________________________________________________________________________________Monthly Oil Market Report
May 2010 63
Chan
geCh
ange
Chan
geCh
ange
2004
2005
2006
2007
07/0
61Q
082Q
083Q
084Q
0820
0808
/07
1Q09
2Q09
3Q09
4Q09
2009
09/0
81Q
102Q
103Q
104Q
1020
1010
/09
USA
7.65
7.34
7.36
7.50
0.14
7.64
7.75
7.20
7.42
7.50
0.00
7.85
7.97
8.13
8.32
8.07
0.57
8.28
8.19
8.19
8.25
8.23
0.16
Cana
da3.
073.
033.
203.
320.
123.
303.
123.
303.
283.
25-0
.07
3.33
3.14
3.23
3.28
3.24
-0.0
13.
263.
303.
273.
333.
290.
05M
exico
3.83
3.77
3.69
3.49
-0.2
13.
293.
183.
133.
093.
17-0
.31
3.04
2.97
2.94
2.96
2.98
-0.1
92.
992.
912.
832.
802.
88-0
.10
North
Am
eric
a14
.56
14.1
414
.24
14.3
00.
0614
.22
14.0
513
.63
13.8
013
.92
-0.3
814
.22
14.0
814
.30
14.5
614
.29
0.37
14.5
314
.41
14.2
814
.38
14.4
00.
11No
rway
3.19
2.97
2.78
2.56
-0.2
22.
512.
392.
382.
542.
45-0
.10
2.52
2.20
2.28
2.38
2.34
-0.1
12.
312.
172.
082.
232.
20-0
.14
UK2.
101.
891.
711.
69-0
.02
1.66
1.65
1.41
1.58
1.58
-0.1
11.
631.
561.
271.
461.
48-0
.10
1.50
1.38
1.32
1.35
1.39
-0.0
9De
nmar
k0.
390.
380.
340.
31-0
.04
0.28
0.28
0.27
0.28
0.28
-0.0
30.
280.
270.
270.
240.
26-0
.02
0.26
0.24
0.24
0.23
0.24
-0.0
2Ot
her W
este
rn E
urop
e0.
480.
490.
510.
620.
110.
620.
650.
670.
660.
650.
030.
620.
620.
630.
620.
63-0
.02
0.60
0.60
0.60
0.60
0.60
-0.0
3W
este
rn E
urop
e6.
165.
725.
345.
17-0
.17
5.08
4.96
4.73
5.06
4.96
-0.2
15.
054.
654.
454.
704.
71-0
.25
4.67
4.40
4.23
4.42
4.43
-0.2
8Au
stra
lia0.
520.
530.
510.
530.
020.
470.
530.
550.
580.
530.
010.
550.
530.
550.
540.
540.
010.
530.
540.
570.
580.
550.
01Ot
her P
acific
0.05
0.05
0.05
0.08
0.03
0.11
0.11
0.10
0.09
0.10
0.02
0.09
0.09
0.10
0.10
0.10
0.00
0.10
0.11
0.10
0.10
0.10
0.01
OECD
Pac
ific
0.57
0.58
0.56
0.60
0.04
0.58
0.63
0.64
0.67
0.63
0.03
0.64
0.62
0.65
0.64
0.64
0.01
0.63
0.64
0.67
0.68
0.66
0.02
Tota
l OEC
D21
.29
20.4
420
.15
20.0
8-0
.07
19.8
819
.65
19.0
019
.52
19.5
1-0
.57
19.9
119
.35
19.4
119
.89
19.6
40.
1319
.83
19.4
519
.19
19.4
819
.49
-0.1
5Br
unei
0.21
0.21
0.22
0.19
-0.0
30.
190.
160.
170.
180.
17-0
.01
0.17
0.15
0.16
0.18
0.17
0.00
0.18
0.17
0.17
0.17
0.17
0.01
India
0.79
0.76
0.78
0.80
0.02
0.80
0.79
0.79
0.81
0.80
0.00
0.78
0.78
0.79
0.81
0.79
-0.0
10.
820.
820.
850.
880.
850.
06In
done
sia1.
151.
121.
071.
02-0
.04
1.05
1.04
1.04
1.03
1.04
0.02
1.03
1.02
1.02
1.03
1.03
-0.0
11.
031.
031.
021.
011.
020.
00M
alays
ia0.
790.
770.
760.
760.
000.
780.
750.
770.
740.
760.
000.
750.
730.
730.
710.
73-0
.03
0.72
0.71
0.69
0.68
0.70
-0.0
2Th
ailan
d0.
250.
290.
320.
330.
020.
340.
360.
360.
360.
360.
020.
370.
370.
360.
370.
370.
010.
350.
360.
360.
360.
36-0
.01
Viet
nam
0.42
0.39
0.37
0.35
-0.0
20.
360.
330.
310.
340.
33-0
.01
0.35
0.37
0.37
0.41
0.38
0.04
0.41
0.38
0.36
0.34
0.37
0.00
Asia
othe
rs0.
180.
260.
260.
270.
000.
270.
270.
270.
280.
270.
010.
270.
270.
270.
270.
270.
000.
270.
270.
280.
280.
280.
01Ot
her A
sia
3.81
3.79
3.78
3.71
-0.0
63.
793.
703.
713.
743.
730.
023.
713.
693.
703.
783.
72-0
.01
3.78
3.74
3.74
3.73
3.75
0.03
Arge
ntina
0.80
0.78
0.77
0.77
0.00
0.79
0.79
0.78
0.77
0.78
0.01
0.78
0.77
0.73
0.76
0.76
-0.0
20.
770.
740.
730.
720.
74-0
.02
Braz
il1.
801.
982.
112.
220.
122.
332.
382.
422.
402.
380.
162.
472.
492.
512.
552.
500.
122.
612.
672.
732.
792.
700.
20Co
lombia
0.54
0.53
0.54
0.54
0.00
0.57
0.59
0.61
0.62
0.60
0.06
0.65
0.66
0.68
0.73
0.68
0.08
0.77
0.77
0.78
0.79
0.78
0.10
Trini
dad
& To
bago
0.16
0.18
0.18
0.16
-0.0
20.
160.
150.
160.
160.
160.
000.
160.
160.
150.
160.
160.
000.
150.
140.
140.
140.
14-0
.01
L. A
mer
ica o
ther
s0.
260.
300.
260.
270.
000.
270.
270.
280.
310.
280.
010.
310.
300.
310.
310.
310.
030.
320.
310.
310.
310.
310.
01La
tin A
mer
ica
3.55
3.77
3.87
3.96
0.10
4.12
4.18
4.24
4.26
4.20
0.24
4.36
4.38
4.39
4.51
4.41
0.21
4.61
4.64
4.70
4.76
4.68
0.27
Bahr
ain0.
210.
210.
210.
210.
000.
210.
210.
210.
210.
210.
000.
210.
210.
210.
210.
210.
000.
210.
210.
210.
210.
210.
00Om
an0.
790.
780.
750.
71-0
.04
0.74
0.74
0.76
0.78
0.76
0.05
0.78
0.79
0.83
0.83
0.81
0.05
0.86
0.86
0.86
0.86
0.86
0.05
Syria
0.49
0.45
0.44
0.42
-0.0
20.
410.
410.
410.
410.
410.
000.
410.
410.
410.
410.
410.
000.
410.
400.
390.
390.
40-0
.01
Yem
en0.
410.
410.
370.
33-0
.04
0.32
0.31
0.30
0.29
0.30
-0.0
30.
300.
300.
300.
290.
30-0
.01
0.27
0.28
0.27
0.27
0.27
-0.0
3M
iddl
e Ea
st1.
901.
851.
761.
66-0
.10
1.68
1.67
1.68
1.68
1.68
0.02
1.70
1.72
1.75
1.74
1.73
0.05
1.75
1.74
1.73
1.72
1.74
0.01
Chad
0.16
0.18
0.15
0.15
0.00
0.15
0.15
0.15
0.15
0.15
0.00
0.14
0.14
0.14
0.14
0.14
-0.0
10.
140.
120.
120.
110.
12-0
.02
Cong
o0.
240.
240.
250.
240.
000.
260.
260.
260.
260.
260.
020.
270.
270.
270.
290.
280.
020.
280.
280.
280.
280.
280.
01Eg
ypt
0.71
0.70
0.67
0.67
0.00
0.68
0.68
0.69
0.70
0.69
0.02
0.70
0.69
0.68
0.66
0.68
-0.0
10.
670.
660.
670.
670.
67-0
.02
Equa
toria
l Guin
ea0.
300.
360.
370.
370.
000.
380.
380.
380.
380.
380.
010.
370.
360.
350.
340.
36-0
.02
0.33
0.34
0.33
0.33
0.33
-0.0
2Ga
bon
0.25
0.25
0.25
0.25
0.00
0.24
0.24
0.25
0.25
0.24
-0.0
10.
260.
260.
270.
270.
260.
020.
280.
280.
280.
280.
280.
01So
uth
Afric
a0.
190.
190.
190.
18-0
.01
0.18
0.18
0.18
0.18
0.18
0.00
0.18
0.18
0.18
0.16
0.17
0.00
0.18
0.16
0.16
0.16
0.16
-0.0
1Su
dan
0.30
0.34
0.40
0.50
0.10
0.50
0.49
0.47
0.44
0.48
-0.0
20.
460.
480.
470.
470.
47-0
.01
0.47
0.48
0.48
0.47
0.48
0.01
Afric
a ot
her
0.21
0.25
0.32
0.35
0.03
0.38
0.38
0.38
0.38
0.38
0.03
0.38
0.37
0.36
0.35
0.36
-0.0
10.
350.
340.
360.
390.
360.
00Af
rica
2.36
2.52
2.59
2.70
0.11
2.75
2.76
2.74
2.73
2.75
0.04
2.74
2.73
2.72
2.69
2.72
-0.0
32.
692.
662.
682.
682.
68-0
.04
Tota
l DCs
11.6
311
.93
12.0
012
.04
0.04
12.3
412
.31
12.3
812
.42
12.3
60.
3212
.51
12.5
112
.57
12.7
112
.57
0.21
12.8
312
.78
12.8
612
.89
12.8
40.
26FS
U11
.14
11.5
512
.02
12.5
20.
5012
.62
12.6
712
.46
12.4
912
.56
0.04
12.6
412
.90
13.0
013
.12
12.9
20.
3513
.12
13.1
413
.10
13.2
313
.15
0.23
Rus
sia9.
199.
449.
659.
870.
229.
789.
749.
819.
809.
78-0
.08
9.78
9.88
9.97
10.0
79.
920.
1410
.09
10.0
39.
999.
9510
.01
0.09
Kaz
akhs
tan
1.18
1.23
1.30
1.35
0.05
1.42
1.44
1.33
1.47
1.41
0.06
1.48
1.51
1.55
1.61
1.54
0.12
1.61
1.62
1.56
1.65
1.61
0.07
Aze
rbaij
an0.
310.
440.
650.
860.
210.
961.
030.
850.
780.
910.
040.
941.
081.
051.
011.
020.
110.
981.
051.
101.
161.
070.
05 F
SU o
ther
s0.
470.
440.
420.
440.
020.
460.
460.
460.
450.
460.
020.
440.
440.
440.
430.
44-0
.02
0.44
0.44
0.46
0.47
0.45
0.02
Othe
r Eur
ope
0.17
0.16
0.15
0.15
0.00
0.15
0.15
0.14
0.14
0.15
-0.0
10.
140.
130.
140.
140.
14-0
.01
0.13
0.13
0.13
0.13
0.13
-0.0
1Ch
ina3.
503.
643.
693.
770.
073.
813.
873.
843.
843.
840.
073.
803.
853.
883.
873.
850.
014.
043.
983.
943.
903.
970.
12No
n-OP
EC p
rodu
ctio
n47
.74
47.7
148
.02
48.5
60.
5448
.79
48.6
547
.82
48.4
148
.42
-0.1
449
.00
48.7
449
.00
49.7
349
.12
0.70
49.9
449
.49
49.2
249
.64
49.5
70.
46Pr
oces
sing
gains
1.83
1.91
1.96
1.99
0.03
1.98
1.98
1.98
1.98
1.98
-0.0
12.
012.
012.
012.
012.
010.
032.
092.
092.
092.
092.
090.
08
Non-
OPEC
sup
ply
49.5
649
.62
49.9
850
.55
0.57
50.7
750
.63
49.8
050
.39
50.4
0-0
.15
51.0
150
.76
51.0
151
.74
51.1
30.
7352
.04
51.5
851
.32
51.7
451
.67
0.53
OPEC
NGL
3.54
3.74
3.76
3.86
0.11
3.97
4.05
4.07
4.04
4.04
0.18
4.04
4.20
4.38
4.37
4.25
0.21
4.49
4.68
4.82
5.06
4.77
0.52
OPEC
Non
-con
vent
ional
0.17
0.16
0.14
0.08
-0.0
50.
110.
110.
110.
110.
110.
020.
100.
100.
100.
100.
100.
000.
100.
110.
110.
110.
100.
00OP
EC (N
GL+N
CF)
3.71
3.89
3.89
3.95
0.05
4.08
4.16
4.18
4.15
4.14
0.20
4.14
4.31
4.48
4.47
4.35
0.21
4.59
4.78
4.93
5.17
4.87
0.52
Non-
OPEC
&
OPEC
(NGL
+NCF
)53
.27
53.5
153
.87
54.4
90.
6254
.85
54.7
953
.98
54.5
454
.54
0.05
55.1
555
.06
55.5
056
.22
55.4
90.
9456
.63
56.3
756
.24
56.9
056
.53
1.05
Note
s: T
otals
may
not
add
up
due
to in
depe
nden
t rou
nding
. Ind
ones
ia ha
s be
en in
clude
d in
Non-
OPEC
supp
ly fo
r com
paris
on p
urpo
se.
Tabl
e 34
: Non
-OP
EC
sup
ply
and
OP
EC
nat
ural
gas
liqu
ids,
mb/
d
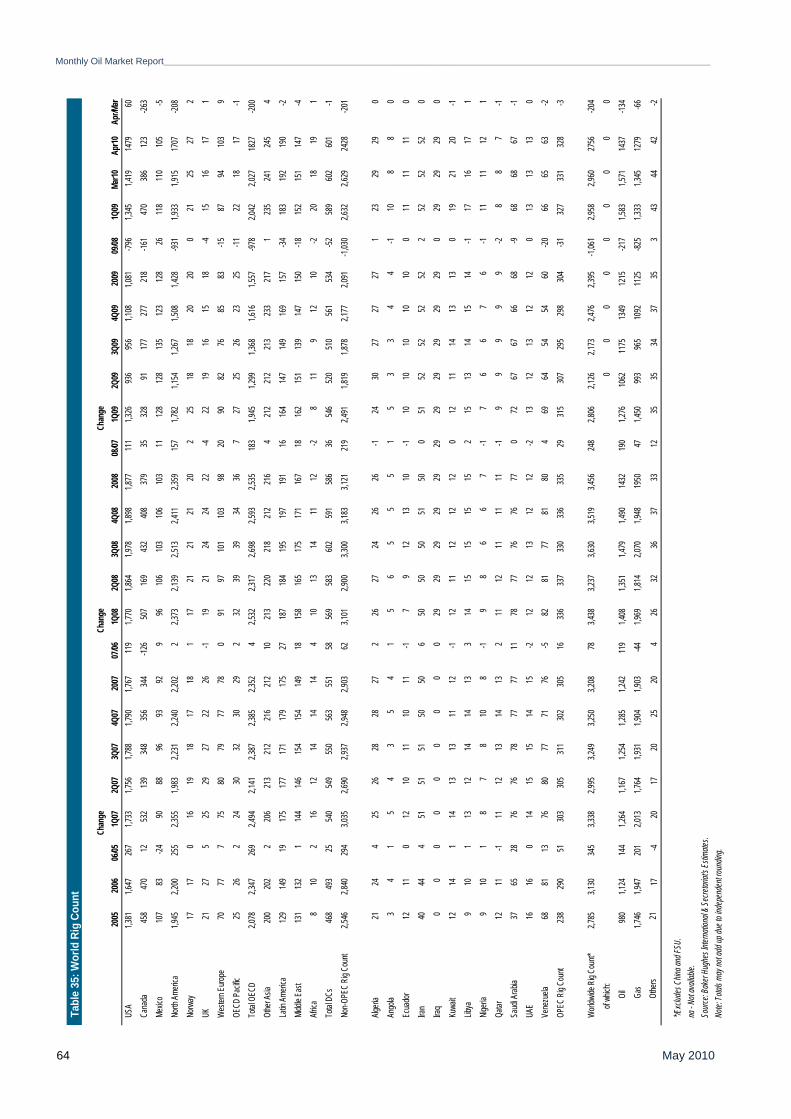
Monthly Oil Market Report_________________________________________________________________________________________________________________________________________
May 2010 64
Ch
ange
Chan
geCh
ange
2005
2006
06/05
1Q07
2Q07
3Q07
4Q07
2007
07/06
1Q08
2Q08
3Q08
4Q08
2008
08/07
1Q09
2Q09
3Q09
4Q09
2009
09/08
1Q09
Mar1
0 A
pr10
Apr/M
arUS
A1,3
811,6
4726
71,7
331,7
561,7
881,7
901,7
6711
91,7
701,8
641,9
781,8
981,8
7711
11,3
2693
695
61,1
081,0
81-79
61,3
451,4
1914
7960
Cana
da45
847
012
532
139
348
356
344
-126
507
169
432
408
379
3532
891
177
277
218
-161
470
386
123
-263
Mexic
o10
783
-2490
8896
9392
996
106
103
106
103
1112
812
813
512
312
826
118
110
105
-5No
rth Am
erica
1,945
2,200
255
2,355
1,983
2,231
2,240
2,202
22,3
732,1
392,5
132,4
112,3
5915
71,7
821,1
541,2
671,5
081,4
28-93
11,9
331,9
1517
07-20
8No
rway
1717
016
1918
1718
117
2121
2120
225
1818
2020
021
2527
2UK
2127
525
2927
2226
-119
2124
2422
-422
1916
1518
-415
1617
1We
stern
Europ
e70
777
7580
7977
780
9197
101
103
9820
9082
7685
83-15
8794
103
9OE
CD Pa
cific
2526
224
3032
3029
232
3939
3436
727
2526
2325
-1122
1817
-1To
tal O
ECD
2,078
2,347
269
2,494
2,141
2,387
2,385
2,352
42,5
322,3
172,6
982,5
932,5
3518
31,9
451,2
991,3
681,6
161,5
57-97
82,0
422,0
2718
27-20
0Ot
her A
sia20
020
22
206
213
212
216
212
1021
322
021
821
221
64
212
212
213
233
217
123
524
124
54
Latin
Ameri
ca12
914
919
175
177
171
179
175
2718
718
419
519
719
116
164
147
149
169
157
-3418
319
219
0-2
Midd
le Ea
st13
113
21
144
146
154
154
149
1815
816
517
517
116
718
162
151
139
147
150
-1815
215
114
7-4
Africa
810
216
1214
1414
410
1314
1112
-28
119
1210
-220
1819
1To
tal D
Cs46
849
325
540
549
550
563
551
5856
958
360
259
158
636
546
520
510
561
534
-5258
960
260
1-1
Non-O
PEC
Rig C
ount
2,546
2,840
294
3,035
2,690
2,937
2,948
2,903
623,1
012,9
003,3
003,1
833,1
2121
92,4
911,8
191,8
782,1
772,0
91-1,
030
2,632
2,629
2428
-201
Algeri
a21
244
2526
2828
272
2627
2426
26-1
2430
2727
271
2329
290
Ango
la3
41
54
35
41
56
55
51
53
34
4-1
108
80
Ecua
dor
1211
012
1011
1011
-17
912
1310
-110
1010
1010
011
1111
0Ira
n40
444
5151
5150
506
5050
5051
500
5152
5252
522
5252
520
Iraq
00
00
00
00
029
2929
2929
2929
2929
2929
029
2929
0Ku
wait
1214
114
1313
1112
-112
1112
1212
012
1114
1313
019
2120
-1Lib
ya9
101
1312
1414
133
1415
1515
152
1513
1415
14-1
1716
171
Nigeri
a9
101
87
810
8-1
98
66
7-1
76
67
6-1
1111
121
Qatar
1211
-111
1213
1413
211
1211
1111
-19
99
99
-28
87
-1Sa
udi A
rabia
3765
2876
7678
7777
1178
7776
7677
072
6767
6668
-968
6867
-1UA
E16
160
1415
1514
15-2
1212
1312
12-2
1312
1312
120
1313
130
Vene
zuela
6881
1376
8077
7176
-582
8177
8180
469
6454
5460
-2066
6563
-2OP
EC R
ig Co
unt
238
290
5130
330
531
130
230
516
336
337
330
336
335
2931
530
729
529
830
4-31
327
331
328
-3
World
wide R
ig Co
unt*
2,785
3,130
345
3,338
2,995
3,249
3,250
3,208
783,4
383,2
373,6
303,5
193,4
5624
82,8
062,1
262,1
732,4
762,3
95-1,
061
2,958
2,960
2756
-204
of
whic
h:0
00
00
00
00
Oil
980
1,124
144
1,264
1,167
1,254
1,285
1,242
119
1,408
1,351
1,479
1,490
1432
190
1,276
1062
1175
1349
1215
-217
1,583
1,571
1437
-134
Gas
1,746
1,947
201
2,013
1,764
1,931
1,904
1,903
-441,9
691,8
142,0
701,9
4819
5047
1,450
993
965
1092
1125
-825
1,333
1,345
1279
-66
O
thers
21
17-4
2017
2025
204
2632
3637
3312
3535
3437
353
4344
42-2
*/Exc
ludes
Chin
a and
FSU.
na - N
ot av
ailab
le.So
urce:
Bake
r Hug
hes I
nterna
tiona
l & S
ecret
ariat'
s Esti
mates
.No
te: To
tals m
ay no
t add
up du
e to i
ndep
ende
nt rou
nding
.
Tabl
e 35
: Wor
ld R
ig C
ount

_________________________________________________________________________________________________________________________________________Monthly Oil Market Report
May 2010 65
Contributors to the OPEC Monthly Oil Market Report
Editor-in-Chief Hasan M. Qabazard, Director, Research Division email: [email protected] Editor Mohammad Alipour-Jeddi, Head, Petroleum Studies Department email: [email protected] Analysts Crude Oil Price Movements
Brahim Aklil email: [email protected]
Commodity Markets Dr. O. López-Gonzalez e-mail:[email protected]
Highlights of the World Economy Claude Clemenz email: [email protected]
Joerg Spitzy email: [email protected]
World Oil Demand Esam Al-Khalifa email: [email protected]
World Oil Supply Haidar Khadadeh email: [email protected]
Product Markets and Refinery Operations Safar Keramati email: [email protected]
The Tanker Market and Oil Trade Julio Arboleda email: [email protected]
Stock Movements Aziz Yahyai email: [email protected]
Technical and editorial team Aziz Yahyai email: [email protected] Douglas Linton email: [email protected]
Data services Fuad Al-Zayer, Head Data Services Department ([email protected]) Puguh Irawan ([email protected]), Ramadan Janan ([email protected]) Monika Psenner (World Economy), Hannes Windholz (Oil Trade, Product & Refinery), Pantelis Christodoulides (World Oil Demand, Stock Movements), Mouhamad Moudassir (Tanker Market), Klaus Stoeger (World Oil Supply), Sheela Kriz (Crude Oil Prices) Production, design and circulation Viveca Hameder, Hataichanok Leimlehner, Andrea Birnbach, Evelyn Oduro-Kwateng Unless separately credited, material may be reproduced without permission, but kindly mention OPEC as source.
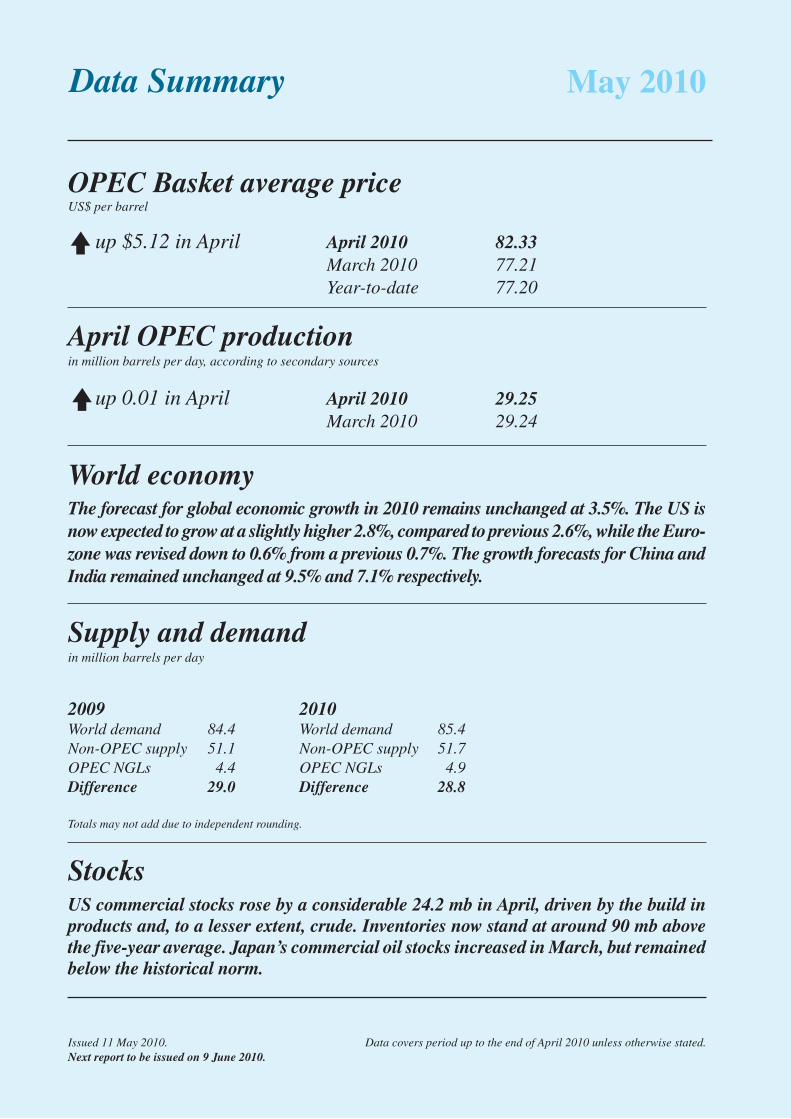
May 2010
OPEC Basket average priceUS$ per barrel
up $5.12 in April April 2010 82.33 March 2010 77.21 Year-to-date 77.20
up 0.01 in April April 2010 29.25 March 2010 29.24
April OPEC productionin million barrels per day, according to secondary sources
Supply and demandin million barrels per day
2009 2010World demand 84.4 World demand 85.4Non-OPEC supply 51.1 Non-OPEC supply 51.7OPEC NGLs 4.4 OPEC NGLs 4.9Difference 29.0 Difference 28.8
Totals may not add due to independent rounding.
StocksUS commercial stocks rose by a considerable 24.2 mb in April, driven by the build in products and, to a lesser extent, crude. Inventories now stand at around 90 mb above the five-year average. Japan’s commercial oil stocks increased in March, but remained below the historical norm.
World economyThe forecast for global economic growth in 2010 remains unchanged at 3.5%. The US is now expected to grow at a slightly higher 2.8%, compared to previous 2.6%, while the Euro-zone was revised down to 0.6% from a previous 0.7%. The growth forecasts for China and India remained unchanged at 9.5% and 7.1% respectively.
Issued 11 May 2010. Data covers period up to the end of April 2010 unless otherwise stated.Next report to be issued on 9 June 2010.
OPECOrganization of the Petroleum Exporting Countries
Monthly Oil Market Report
Tel +43 1 21112 Fax +43 1 2164320 E-mail: [email protected] Web site: www.opec.org
Data Summary