ooaakk rriiddggee hhiigghh services... · ooaakk rriiddggee hhiigghh ... music, and drama programs...
TRANSCRIPT
OOOaaakkk RRRiiidddgggeee HHHiiiggghhh
Every school in California is required by state law to publish a School Accountability Report Card (SARC), by February 1 of each year. The SARC contains information about the condition and performance of each California public school. Under the Local Control Funding Formula (LCFF) all local education agencies (LEAs) are required to prepare a Local Control Accountability Plan (LCAP), which describes how they intend to meet annual school-specific goals for all pupils, with specific activities to address state and local priorities. Additionally, data reported in an LCAP is to be consistent with data reported in the SARC. For more information about SARC requirements, see the California Department of Education (CDE) SARC Web page at http://www.cde.ca.gov/ta/ac/sa/. For additional information about the school, parents and community members should contact the school principal or the district office. For more information about the LCFF or LCAP, visit the CDE LCFF Web page at http://www.cde.ca.gov/fg/aa/lc/.
This report has been compiled by Multiple Measures, LLC (http://www.multiplemeasures.com).
The data were acquired from both the school and the CDE (http://www.cde.ca.gov/ta/ac/sa).
A single asterisk in a cell (*) means that the size of the group was numerically insignificant.
I. About This School District Contact Information (Most Recent Year) District Name El Dorado Union High
Phone Number (530) 622-5081
Superintendent Wehr, Stephen
E-mail Address [email protected]
Web Site www.eduhsd.k12.ca.us
School Contact Information (Most Recent Year) School Name Oak Ridge High
Street 1120 Harvard Way
City, State, Zip El Dorado Hills, CA 95762-4324
Phone Number (916) 933-6980
Principal Paul Burke, Principal
E-mail Address [email protected]
Web Site http://www.orhsonline.com
County-District-School (CDS) Code 09618530930081
School Accountability Report Card Reported Using Data from 2013–14 School Year
Published During 2014–15
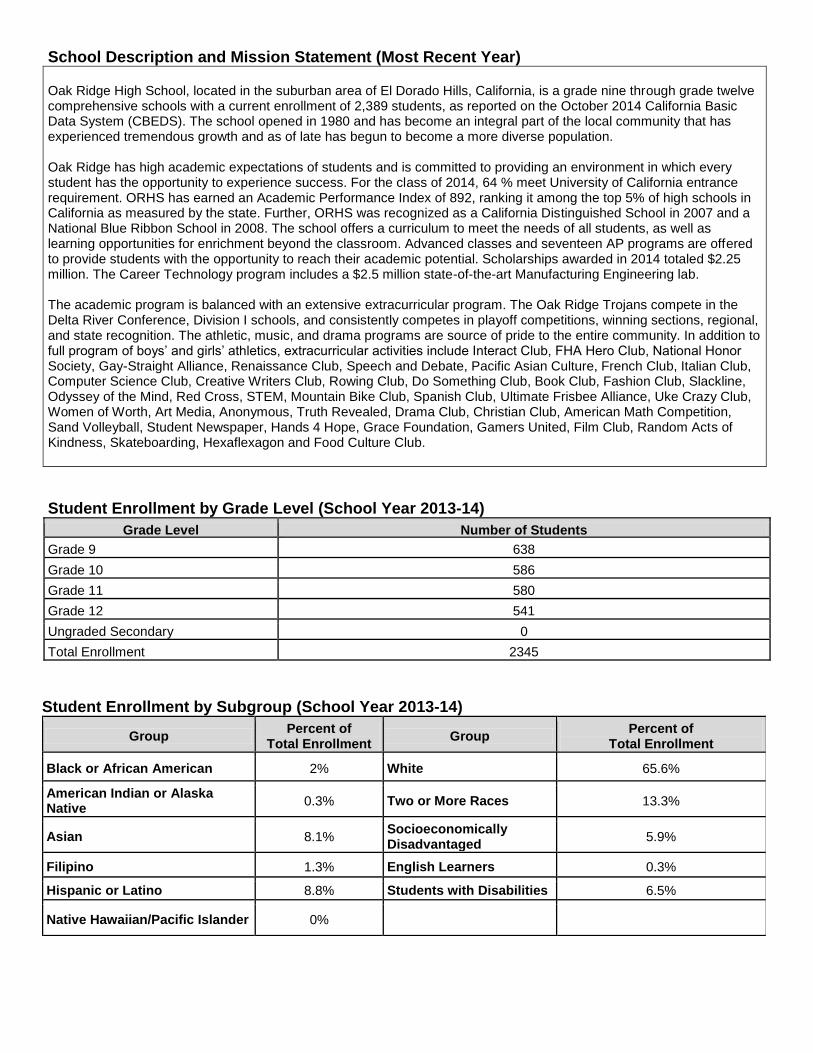
School Description and Mission Statement (Most Recent Year) Oak Ridge High School, located in the suburban area of El Dorado Hills, California, is a grade nine through grade twelve comprehensive schools with a current enrollment of 2,389 students, as reported on the October 2014 California Basic Data System (CBEDS). The school opened in 1980 and has become an integral part of the local community that has experienced tremendous growth and as of late has begun to become a more diverse population. Oak Ridge has high academic expectations of students and is committed to providing an environment in which every student has the opportunity to experience success. For the class of 2014, 64 % meet University of California entrance requirement. ORHS has earned an Academic Performance Index of 892, ranking it among the top 5% of high schools in California as measured by the state. Further, ORHS was recognized as a California Distinguished School in 2007 and a National Blue Ribbon School in 2008. The school offers a curriculum to meet the needs of all students, as well as learning opportunities for enrichment beyond the classroom. Advanced classes and seventeen AP programs are offered to provide students with the opportunity to reach their academic potential. Scholarships awarded in 2014 totaled $2.25 million. The Career Technology program includes a $2.5 million state-of-the-art Manufacturing Engineering lab. The academic program is balanced with an extensive extracurricular program. The Oak Ridge Trojans compete in the Delta River Conference, Division I schools, and consistently competes in playoff competitions, winning sections, regional, and state recognition. The athletic, music, and drama programs are source of pride to the entire community. In addition to full program of boys’ and girls’ athletics, extracurricular activities include Interact Club, FHA Hero Club, National Honor Society, Gay-Straight Alliance, Renaissance Club, Speech and Debate, Pacific Asian Culture, French Club, Italian Club, Computer Science Club, Creative Writers Club, Rowing Club, Do Something Club, Book Club, Fashion Club, Slackline, Odyssey of the Mind, Red Cross, STEM, Mountain Bike Club, Spanish Club, Ultimate Frisbee Alliance, Uke Crazy Club, Women of Worth, Art Media, Anonymous, Truth Revealed, Drama Club, Christian Club, American Math Competition, Sand Volleyball, Student Newspaper, Hands 4 Hope, Grace Foundation, Gamers United, Film Club, Random Acts of Kindness, Skateboarding, Hexaflexagon and Food Culture Club.
Student Enrollment by Grade Level (School Year 2013-14)
Grade Level Number of Students
Grade 9 638
Grade 10 586
Grade 11 580
Grade 12 541
Ungraded Secondary 0
Total Enrollment 2345
Student Enrollment by Subgroup (School Year 2013-14)
Group Percent of
Total Enrollment Group
Percent of Total Enrollment
Black or African American 2% White 65.6%
American Indian or Alaska Native
0.3% Two or More Races 13.3%
Asian 8.1% Socioeconomically Disadvantaged
5.9%
Filipino 1.3% English Learners 0.3%
Hispanic or Latino 8.8% Students with Disabilities 6.5%
Native Hawaiian/Pacific Islander 0%
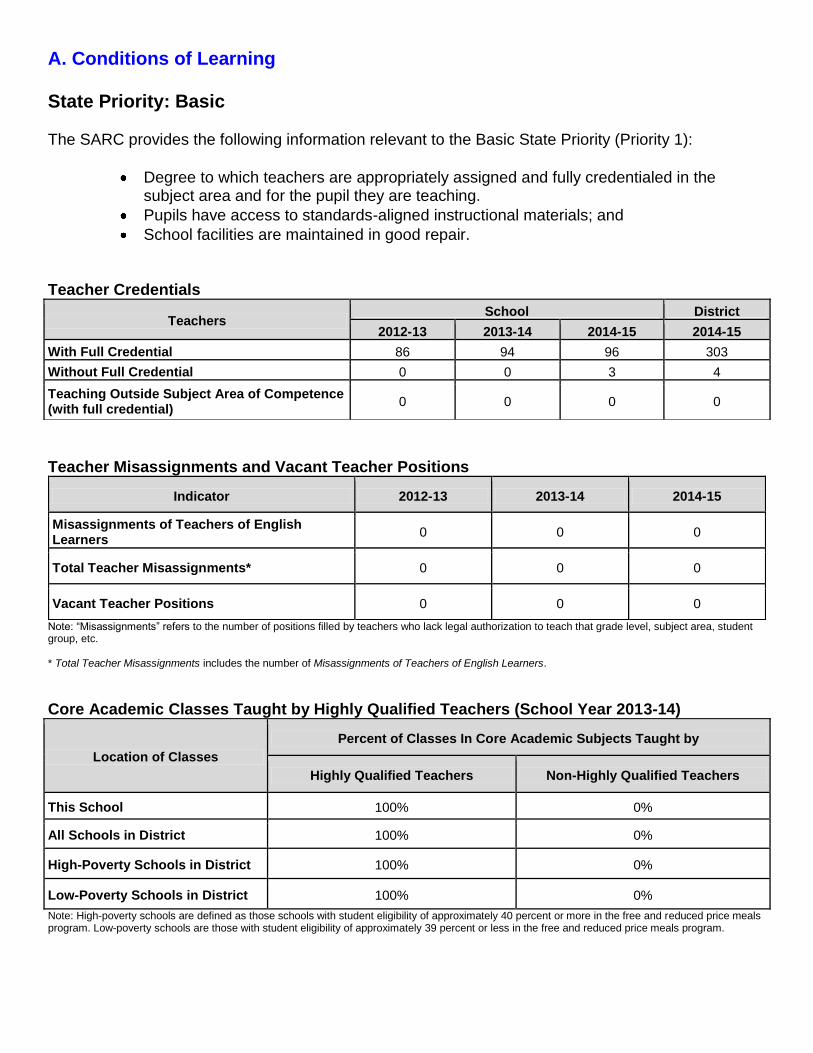
A. Conditions of Learning State Priority: Basic The SARC provides the following information relevant to the Basic State Priority (Priority 1):
Degree to which teachers are appropriately assigned and fully credentialed in the subject area and for the pupil they are teaching.
Pupils have access to standards-aligned instructional materials; and
School facilities are maintained in good repair. Teacher Credentials
Teacher Misassignments and Vacant Teacher Positions
Indicator 2012-13 2013-14 2014-15
Misassignments of Teachers of English Learners
0 0 0
Total Teacher Misassignments* 0 0 0
Vacant Teacher Positions 0 0 0
Note: “Misassignments” refers to the number of positions filled by teachers who lack legal authorization to teach that grade level, subject area, student group, etc. * Total Teacher Misassignments includes the number of Misassignments of Teachers of English Learners.
Core Academic Classes Taught by Highly Qualified Teachers (School Year 2013-14)
Location of Classes
Percent of Classes In Core Academic Subjects Taught by
Highly Qualified Teachers Non-Highly Qualified Teachers
This School 100% 0%
All Schools in District 100% 0%
High-Poverty Schools in District 100% 0%
Low-Poverty Schools in District 100% 0%
Note: High-poverty schools are defined as those schools with student eligibility of approximately 40 percent or more in the free and reduced price meals program. Low-poverty schools are those with student eligibility of approximately 39 percent or less in the free and reduced price meals program.
Teachers School District
2012-13 2013-14 2014-15 2014-15
With Full Credential 86 94 96 303
Without Full Credential 0 0 3 4
Teaching Outside Subject Area of Competence (with full credential)
0 0 0 0
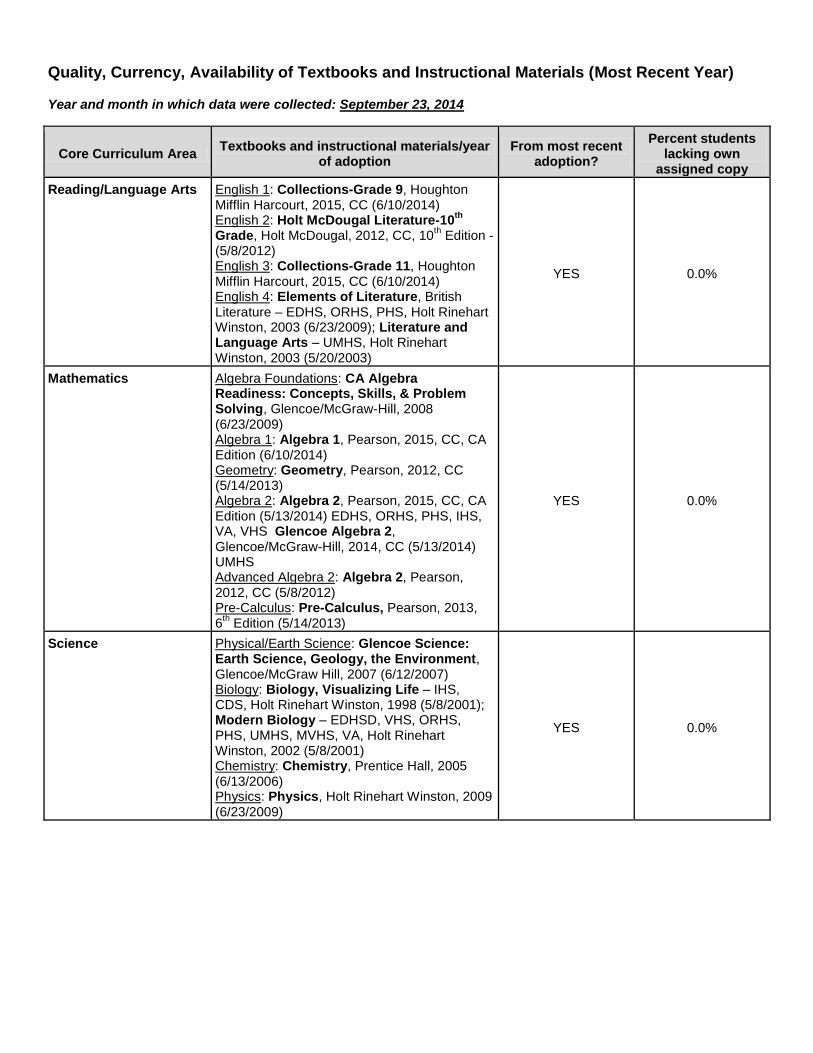
Quality, Currency, Availability of Textbooks and Instructional Materials (Most Recent Year) Year and month in which data were collected: September 23, 2014
Core Curriculum Area Textbooks and instructional materials/year
of adoption From most recent
adoption?
Percent students lacking own
assigned copy
Reading/Language Arts English 1: Collections-Grade 9, Houghton Mifflin Harcourt, 2015, CC (6/10/2014) English 2: Holt McDougal Literature-10
th
Grade, Holt McDougal, 2012, CC, 10th Edition -
(5/8/2012) English 3: Collections-Grade 11, Houghton Mifflin Harcourt, 2015, CC (6/10/2014) English 4: Elements of Literature, British Literature – EDHS, ORHS, PHS, Holt Rinehart Winston, 2003 (6/23/2009); Literature and Language Arts – UMHS, Holt Rinehart Winston, 2003 (5/20/2003)
YES 0.0%
Mathematics Algebra Foundations: CA Algebra Readiness: Concepts, Skills, & Problem Solving, Glencoe/McGraw-Hill, 2008 (6/23/2009) Algebra 1: Algebra 1, Pearson, 2015, CC, CA Edition (6/10/2014) Geometry: Geometry, Pearson, 2012, CC (5/14/2013) Algebra 2: Algebra 2, Pearson, 2015, CC, CA Edition (5/13/2014) EDHS, ORHS, PHS, IHS, VA, VHS Glencoe Algebra 2, Glencoe/McGraw-Hill, 2014, CC (5/13/2014) UMHS Advanced Algebra 2: Algebra 2, Pearson, 2012, CC (5/8/2012) Pre-Calculus: Pre-Calculus, Pearson, 2013, 6
th Edition (5/14/2013)
YES 0.0%
Science Physical/Earth Science: Glencoe Science: Earth Science, Geology, the Environment, Glencoe/McGraw Hill, 2007 (6/12/2007) Biology: Biology, Visualizing Life – IHS, CDS, Holt Rinehart Winston, 1998 (5/8/2001); Modern Biology – EDHSD, VHS, ORHS, PHS, UMHS, MVHS, VA, Holt Rinehart Winston, 2002 (5/8/2001) Chemistry: Chemistry, Prentice Hall, 2005 (6/13/2006) Physics: Physics, Holt Rinehart Winston, 2009 (6/23/2009)
YES 0.0%

Core Curriculum Area Textbooks and instructional materials/year
of adoption From most recent
adoption?
Percent students lacking own
assigned copy
History-Social Science World History: The Modern World, Prentice Hall, 2007, CA Edition (6/12/2007) U.S. History/Geography: Pursuing American Ideals, Teachers’ Curriculum Institute, 2007 (6/12/2007) American Government: Magruder’s American Government, Prentice Hall, 2006, CA Edition (6/13/06) Economics: Economics, Principles and Practices, Glencoe/McGraw Hill, 2005, (6/13/2006) Sociology: Sociology and You, McGraw-Hill, 2014 (6/11/2013) Psychology: Understanding Psychology, McGraw-Hill, 2014 (6/11/2013)
YES 0.0%
Foreign Language Spanish 1-4: ¡Avancemos! – Levels 1-4, Holt McDougal, 2013, (6/11/2013) AP Spanish: TEMAS, Vista Higher Learning, 2014 (6/11/2013) German 1-2: Deutsch Aktuell – Levels 1-2, EMC/Paradigm, 2004 – 5
th Edition (5/12/2009)
German 3-4: Deutsch Aktuell – Level 3, EMC/Paradigm, 2005 – 5
th Edition (5/12/2009)
French 1-4: T’es branché – Levels 1-3, EMC Publishing, 2014 (5/13/2014) Italian 1-4: Oggi in Italia, Houghton Mifflin,1998 (5/8/2001) Japanese 1-4: Supplemental materials (5/8/2001)
YES 0.0%
Health Health: Glencoe Health, Glencoe/McGraw Hill, 2009 (6/10/2008)
YES 0.0%
Visual and Performing Arts
Miscellaneous Supplemental Instructional Materials
NA 0.0%
Science Laboratory Equipment (grades 9-12)
Sufficient lab equipment (i.e., microscopes, beakers, test tubes, scales, centrifuges, etc.) is provided to accommodate lab stations of 2-4 students
NA 0.0%
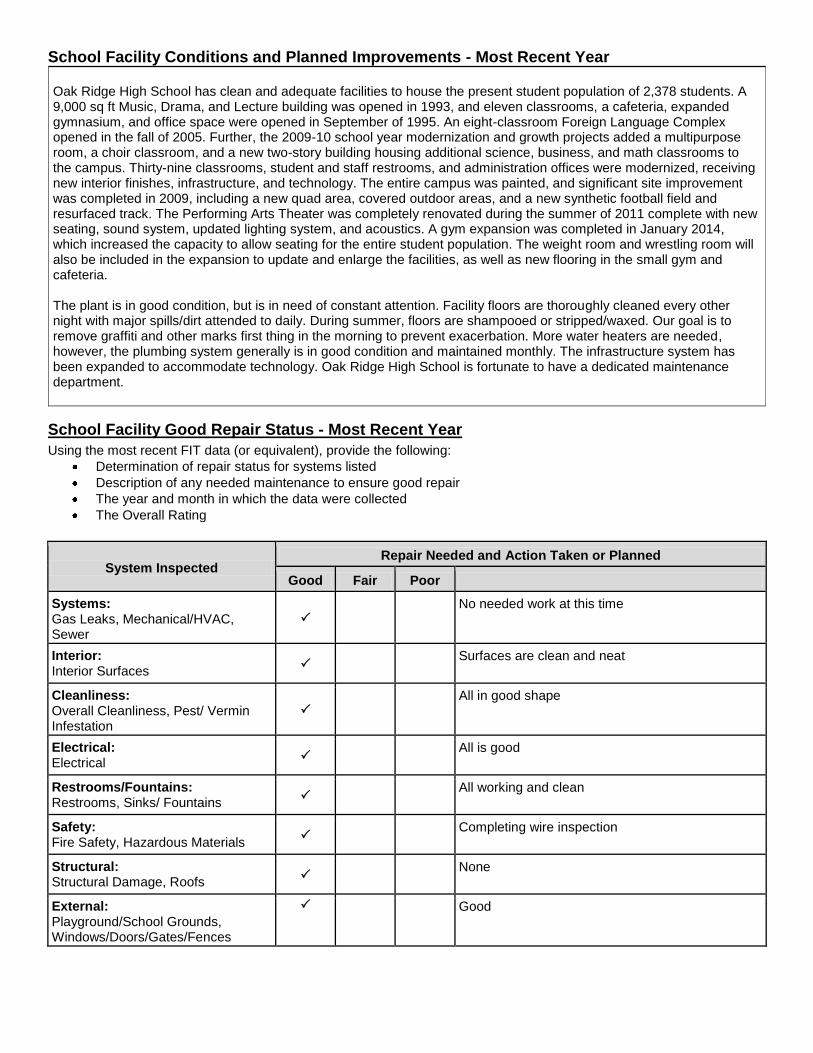
School Facility Conditions and Planned Improvements - Most Recent Year Oak Ridge High School has clean and adequate facilities to house the present student population of 2,378 students. A 9,000 sq ft Music, Drama, and Lecture building was opened in 1993, and eleven classrooms, a cafeteria, expanded gymnasium, and office space were opened in September of 1995. An eight-classroom Foreign Language Complex opened in the fall of 2005. Further, the 2009-10 school year modernization and growth projects added a multipurpose room, a choir classroom, and a new two-story building housing additional science, business, and math classrooms to the campus. Thirty-nine classrooms, student and staff restrooms, and administration offices were modernized, receiving new interior finishes, infrastructure, and technology. The entire campus was painted, and significant site improvement was completed in 2009, including a new quad area, covered outdoor areas, and a new synthetic football field and resurfaced track. The Performing Arts Theater was completely renovated during the summer of 2011 complete with new seating, sound system, updated lighting system, and acoustics. A gym expansion was completed in January 2014, which increased the capacity to allow seating for the entire student population. The weight room and wrestling room will also be included in the expansion to update and enlarge the facilities, as well as new flooring in the small gym and cafeteria. The plant is in good condition, but is in need of constant attention. Facility floors are thoroughly cleaned every other night with major spills/dirt attended to daily. During summer, floors are shampooed or stripped/waxed. Our goal is to remove graffiti and other marks first thing in the morning to prevent exacerbation. More water heaters are needed, however, the plumbing system generally is in good condition and maintained monthly. The infrastructure system has been expanded to accommodate technology. Oak Ridge High School is fortunate to have a dedicated maintenance department.
School Facility Good Repair Status - Most Recent Year
Using the most recent FIT data (or equivalent), provide the following:
Determination of repair status for systems listed
Description of any needed maintenance to ensure good repair
The year and month in which the data were collected
The Overall Rating
System Inspected Repair Needed and Action Taken or Planned
Good Fair Poor
Systems: Gas Leaks, Mechanical/HVAC, Sewer
No needed work at this time
Interior: Interior Surfaces
Surfaces are clean and neat
Cleanliness: Overall Cleanliness, Pest/ Vermin Infestation
All in good shape
Electrical: Electrical
All is good
Restrooms/Fountains: Restrooms, Sinks/ Fountains
All working and clean
Safety: Fire Safety, Hazardous Materials
Completing wire inspection
Structural: Structural Damage, Roofs
None
External: Playground/School Grounds, Windows/Doors/Gates/Fences
Good
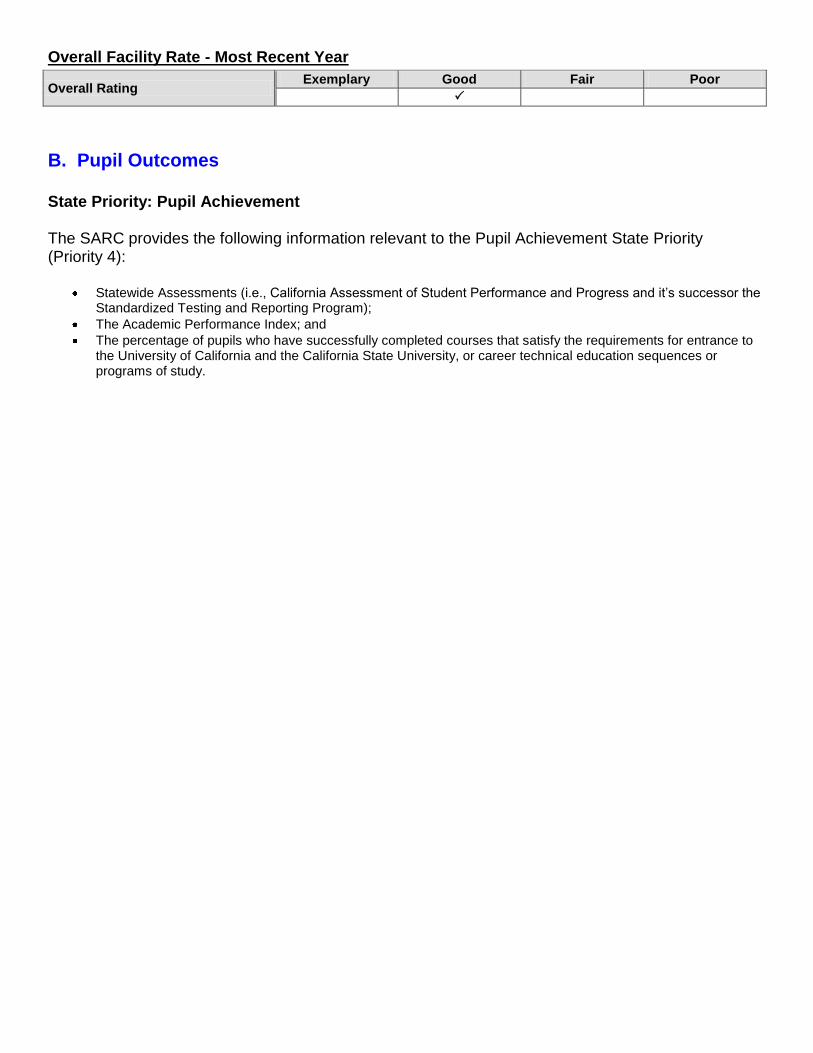
Overall Facility Rate - Most Recent Year
Overall Rating Exemplary Good Fair Poor
B. Pupil Outcomes
State Priority: Pupil Achievement The SARC provides the following information relevant to the Pupil Achievement State Priority (Priority 4):
Statewide Assessments (i.e., California Assessment of Student Performance and Progress and it’s successor the Standardized Testing and Reporting Program);
The Academic Performance Index; and
The percentage of pupils who have successfully completed courses that satisfy the requirements for entrance to the University of California and the California State University, or career technical education sequences or programs of study.

California Assessment of Student Performance and Progress/Standardized Testing and Reporting Results for All Students in Science – Three-Year Comparison
Subject
Percent of Students Scoring at Proficient or Advanced (meeting or exceeding the state standards)
School District State
2011-12 2012-13 2013-14 2011-12 2012-13 2013-14 2011-12 2012-13 2013-14
Science(Grades 5, 8, and 10)
83% 84% 84% 76% 75% 78% 60% 59% 60%
Note: Science assessments include California Standards Tests (CSTs), California Modified Assessment (CMS), and California Alternate Performance Assessment (CAPA). Note: Scores are not shown when the number of students tested is ten or less, either because the number of students in this category is too small for statistical accuracy or to protect student privacy.
California Assessment of Student Performance and Progress Results by Student Group in Science (School Year 2013-14)
Group Percent of Students Scoring at
Proficient or Advanced
All Students in the LEA 78%
All Students at the School 84%
Male 83%
Female 85%
Black or African American no data
American Indian or Alaska Native no data
Asian 84%
Filipino no data
Hispanic or Latino 75%
Native Hawaiian/Pacific Islander no data
White 84%
Two or More Races 86%
Socioeconomically Disadvantaged 66%
English Learners no data
Students with Disabilities no data
Students Receiving Migrant Education Services no data
Note: Science assessments include (CSTs), (CMS), and (CAPA) in grades 5, 8, and 10
Note: Scores are not shown when the number of students tested is ten or less, either because the number of students in this category is too small for statistical accuracy or to protect student privacy.

Standardized Testing and Reporting Results for All Students – Three-Year Comparison
Subject
Percent of Students Scoring at Proficient or Advanced (meeting or exceeding the state standards)
School District State
2010-11 2011-12 2012-13 2010-11 2011-12 2012-13 2010-11 2011-12 2012-13
English-Language Arts 78% 80% 79% 68% 68% 69% 54% 56% 55%
Mathematics 56% 58% 58% 46% 48% 45% 49% 50% 50%
History-Social Science 76% 78% 82% 65% 66% 66% 48% 49% 49%
Note: STAR Program was last administered in 2012-13. Percentages are not calculated when the number of students tested is ten or less, either because the number of students in this category is to small for statistical accuracy or to protect student privacy.
Academic Performance Index Ranks – Three-Year Comparison
API Rank 2010-11 2011-12 2012-13
Statewide 10 10 10
Similar Schools 5 5 6 Note: For 2014 and subsequent years, the statewide and similar schools ranks will no longer by produced.
Academic Performance Index Growth by Student Group – Three-Year Comparison
Group Actual API Change
2010-11 2011-12 2012-13
All Students at the School 10 9 3
Black or African American no data no data no data
American Indian or Alaska Native no data no data no data
Asian 13 -9 6
Filipino no data no data no data
Hispanic or Latino 30 -3 -20
Native Hawaiian/Pacific Islander no data no data no data
White 6 8 6
Two or More Races no data no data
Socioeconomically Disadvantaged no data no data 33
English Learners no data no data no data
Students with Disabilities no data no data no data
Note: “ND” means that no data were available to the CDE or LEA to report. “B” means the school did not have a valid API Base and there is no Growth or target information. :C: means the school had significant demographic changes and there is no Growth or target information.
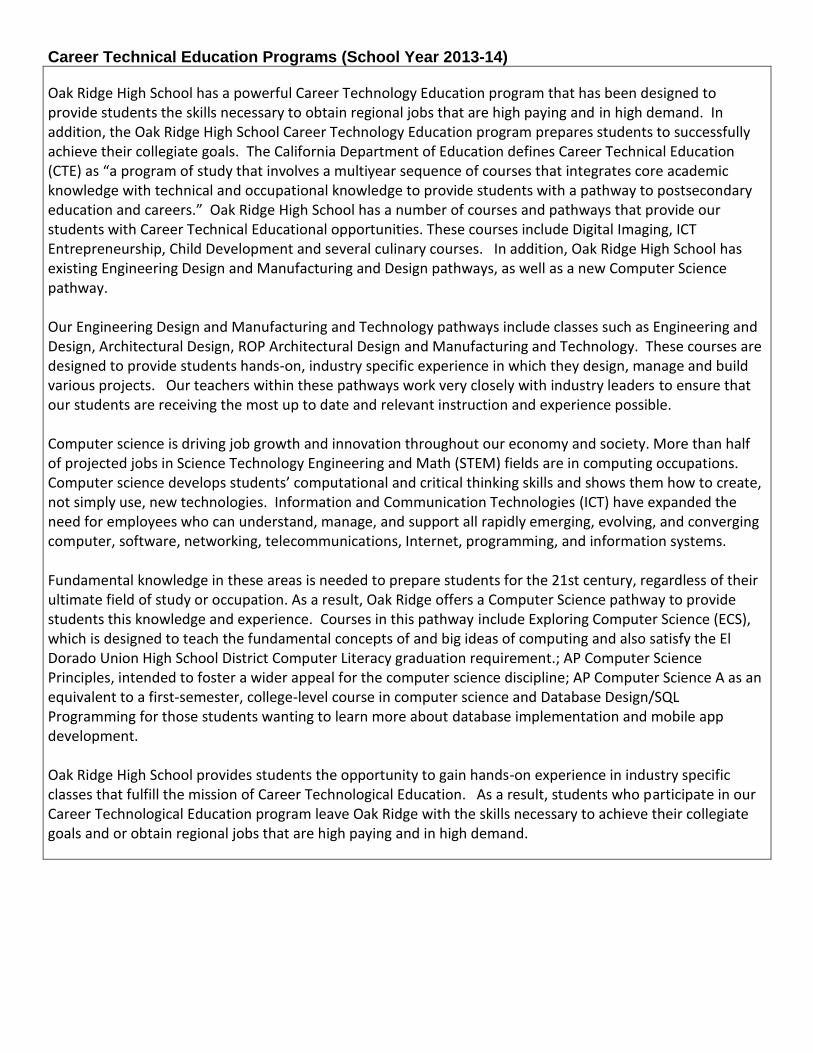
Career Technical Education Programs (School Year 2013-14)
Oak Ridge High School has a powerful Career Technology Education program that has been designed to provide students the skills necessary to obtain regional jobs that are high paying and in high demand. In addition, the Oak Ridge High School Career Technology Education program prepares students to successfully achieve their collegiate goals. The California Department of Education defines Career Technical Education (CTE) as “a program of study that involves a multiyear sequence of courses that integrates core academic knowledge with technical and occupational knowledge to provide students with a pathway to postsecondary education and careers.” Oak Ridge High School has a number of courses and pathways that provide our students with Career Technical Educational opportunities. These courses include Digital Imaging, ICT Entrepreneurship, Child Development and several culinary courses. In addition, Oak Ridge High School has existing Engineering Design and Manufacturing and Design pathways, as well as a new Computer Science pathway. Our Engineering Design and Manufacturing and Technology pathways include classes such as Engineering and Design, Architectural Design, ROP Architectural Design and Manufacturing and Technology. These courses are designed to provide students hands-on, industry specific experience in which they design, manage and build various projects. Our teachers within these pathways work very closely with industry leaders to ensure that our students are receiving the most up to date and relevant instruction and experience possible. Computer science is driving job growth and innovation throughout our economy and society. More than half of projected jobs in Science Technology Engineering and Math (STEM) fields are in computing occupations. Computer science develops students’ computational and critical thinking skills and shows them how to create, not simply use, new technologies. Information and Communication Technologies (ICT) have expanded the need for employees who can understand, manage, and support all rapidly emerging, evolving, and converging computer, software, networking, telecommunications, Internet, programming, and information systems. Fundamental knowledge in these areas is needed to prepare students for the 21st century, regardless of their ultimate field of study or occupation. As a result, Oak Ridge offers a Computer Science pathway to provide students this knowledge and experience. Courses in this pathway include Exploring Computer Science (ECS), which is designed to teach the fundamental concepts of and big ideas of computing and also satisfy the El Dorado Union High School District Computer Literacy graduation requirement.; AP Computer Science Principles, intended to foster a wider appeal for the computer science discipline; AP Computer Science A as an equivalent to a first-semester, college-level course in computer science and Database Design/SQL Programming for those students wanting to learn more about database implementation and mobile app development. Oak Ridge High School provides students the opportunity to gain hands-on experience in industry specific classes that fulfill the mission of Career Technological Education. As a result, students who participate in our Career Technological Education program leave Oak Ridge with the skills necessary to achieve their collegiate goals and or obtain regional jobs that are high paying and in high demand.
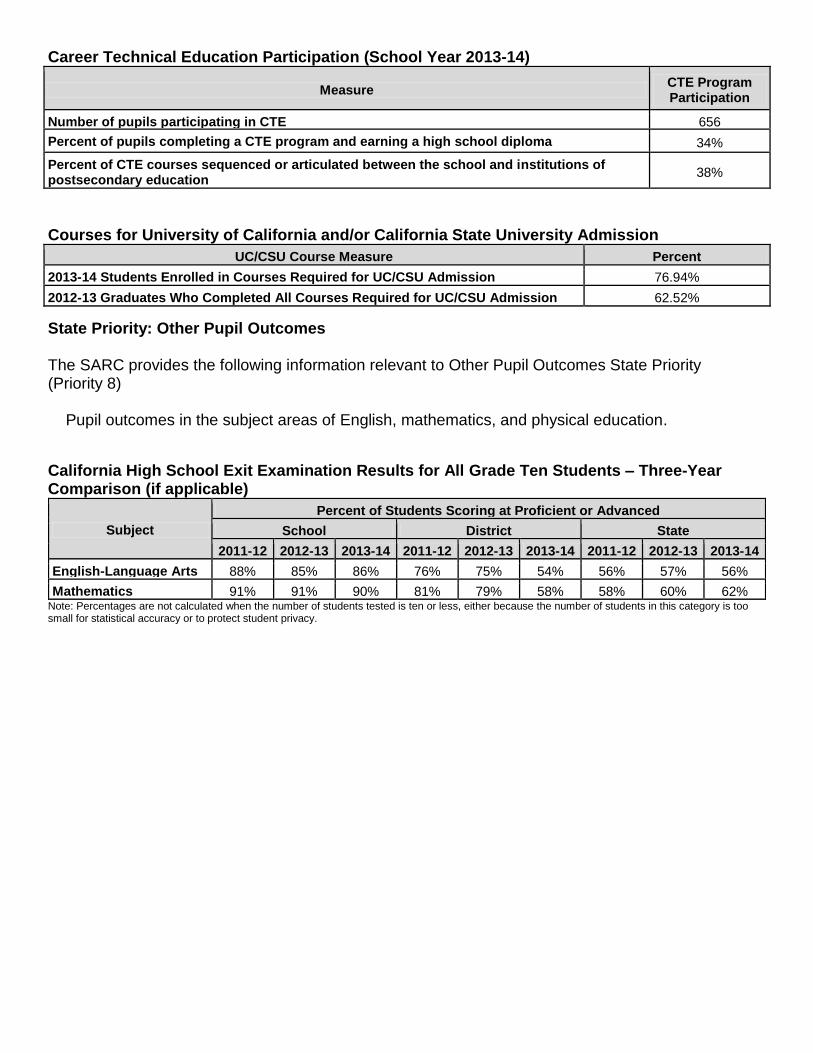
Career Technical Education Participation (School Year 2013-14)
Measure CTE Program Participation
Number of pupils participating in CTE 656
Percent of pupils completing a CTE program and earning a high school diploma 34%
Percent of CTE courses sequenced or articulated between the school and institutions of postsecondary education
38%
Courses for University of California and/or California State University Admission
UC/CSU Course Measure Percent
2013-14 Students Enrolled in Courses Required for UC/CSU Admission 76.94%
2012-13 Graduates Who Completed All Courses Required for UC/CSU Admission 62.52%
State Priority: Other Pupil Outcomes The SARC provides the following information relevant to Other Pupil Outcomes State Priority (Priority 8) Pupil outcomes in the subject areas of English, mathematics, and physical education.
California High School Exit Examination Results for All Grade Ten Students – Three-Year Comparison (if applicable)
Subject
Percent of Students Scoring at Proficient or Advanced
School District State
2011-12 2012-13 2013-14 2011-12 2012-13 2013-14 2011-12 2012-13 2013-14
English-Language Arts 88% 85% 86% 76% 75% 54% 56% 57% 56%
Mathematics 91% 91% 90% 81% 79% 58% 58% 60% 62% Note: Percentages are not calculated when the number of students tested is ten or less, either because the number of students in this category is too small for statistical accuracy or to protect student privacy.
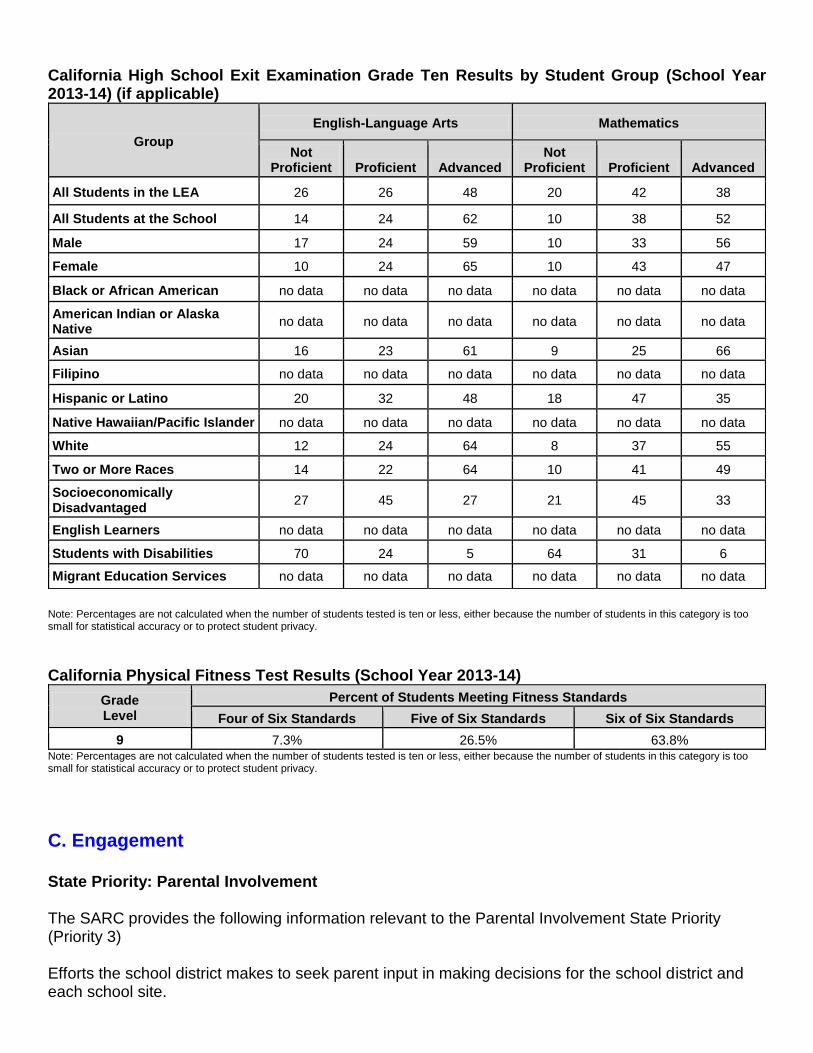
California High School Exit Examination Grade Ten Results by Student Group (School Year 2013-14) (if applicable)
Group
English-Language Arts Mathematics
Not Proficient Proficient Advanced
Not Proficient Proficient Advanced
All Students in the LEA 26 26 48 20 42 38
All Students at the School 14 24 62 10 38 52
Male 17 24 59 10 33 56
Female 10 24 65 10 43 47
Black or African American no data no data no data no data no data no data
American Indian or Alaska Native
no data no data no data no data no data no data
Asian 16 23 61 9 25 66
Filipino no data no data no data no data no data no data
Hispanic or Latino 20 32 48 18 47 35
Native Hawaiian/Pacific Islander no data no data no data no data no data no data
White 12 24 64 8 37 55
Two or More Races 14 22 64 10 41 49
Socioeconomically Disadvantaged
27 45 27 21 45 33
English Learners no data no data no data no data no data no data
Students with Disabilities 70 24 5 64 31 6
Migrant Education Services no data no data no data no data no data no data
Note: Percentages are not calculated when the number of students tested is ten or less, either because the number of students in this category is too small for statistical accuracy or to protect student privacy.
California Physical Fitness Test Results (School Year 2013-14)
Grade Level
Percent of Students Meeting Fitness Standards
Four of Six Standards Five of Six Standards Six of Six Standards
9 7.3% 26.5% 63.8% Note: Percentages are not calculated when the number of students tested is ten or less, either because the number of students in this category is too small for statistical accuracy or to protect student privacy.
C. Engagement
State Priority: Parental Involvement The SARC provides the following information relevant to the Parental Involvement State Priority (Priority 3) Efforts the school district makes to seek parent input in making decisions for the school district and each school site.
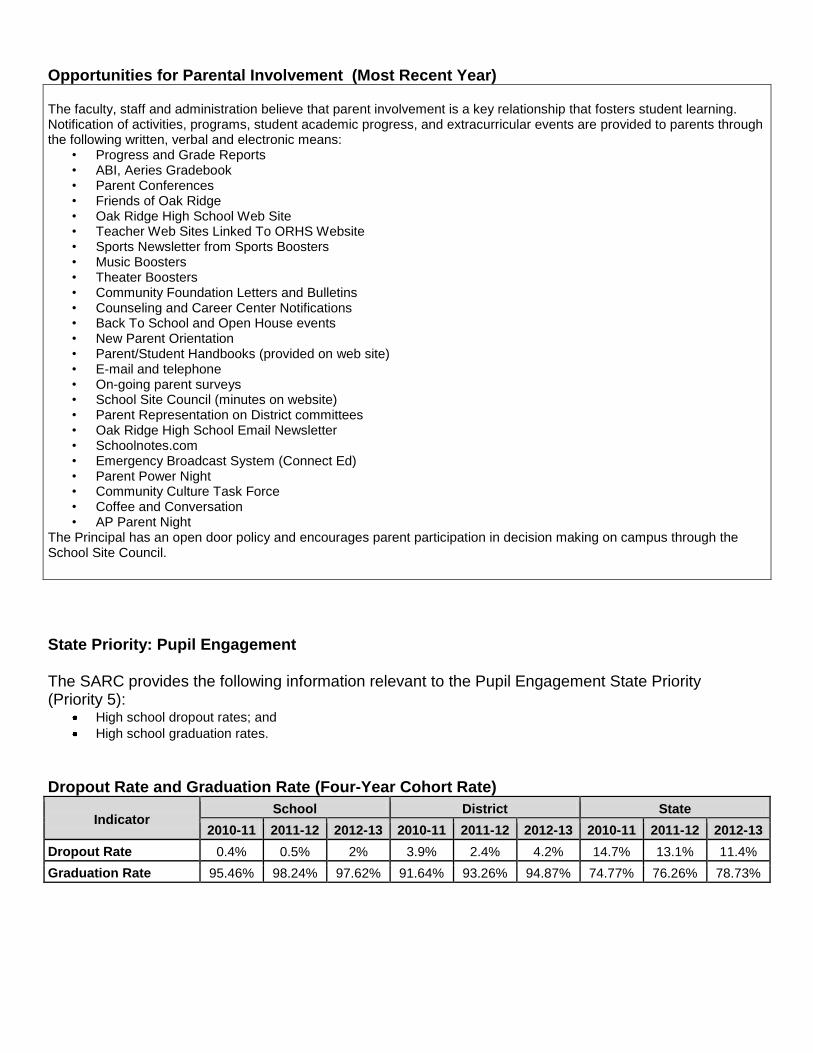
Opportunities for Parental Involvement (Most Recent Year) The faculty, staff and administration believe that parent involvement is a key relationship that fosters student learning. Notification of activities, programs, student academic progress, and extracurricular events are provided to parents through the following written, verbal and electronic means:
• Progress and Grade Reports • ABI, Aeries Gradebook • Parent Conferences • Friends of Oak Ridge • Oak Ridge High School Web Site • Teacher Web Sites Linked To ORHS Website • Sports Newsletter from Sports Boosters • Music Boosters • Theater Boosters • Community Foundation Letters and Bulletins • Counseling and Career Center Notifications • Back To School and Open House events • New Parent Orientation • Parent/Student Handbooks (provided on web site) • E-mail and telephone • On-going parent surveys • School Site Council (minutes on website) • Parent Representation on District committees • Oak Ridge High School Email Newsletter • Schoolnotes.com • Emergency Broadcast System (Connect Ed) • Parent Power Night • Community Culture Task Force • Coffee and Conversation • AP Parent Night
The Principal has an open door policy and encourages parent participation in decision making on campus through the School Site Council.
State Priority: Pupil Engagement The SARC provides the following information relevant to the Pupil Engagement State Priority (Priority 5):
High school dropout rates; and
High school graduation rates.
Dropout Rate and Graduation Rate (Four-Year Cohort Rate)
Indicator School District State
2010-11 2011-12 2012-13 2010-11 2011-12 2012-13 2010-11 2011-12 2012-13
Dropout Rate 0.4% 0.5% 2% 3.9% 2.4% 4.2% 14.7% 13.1% 11.4%
Graduation Rate 95.46% 98.24% 97.62% 91.64% 93.26% 94.87% 74.77% 76.26% 78.73%
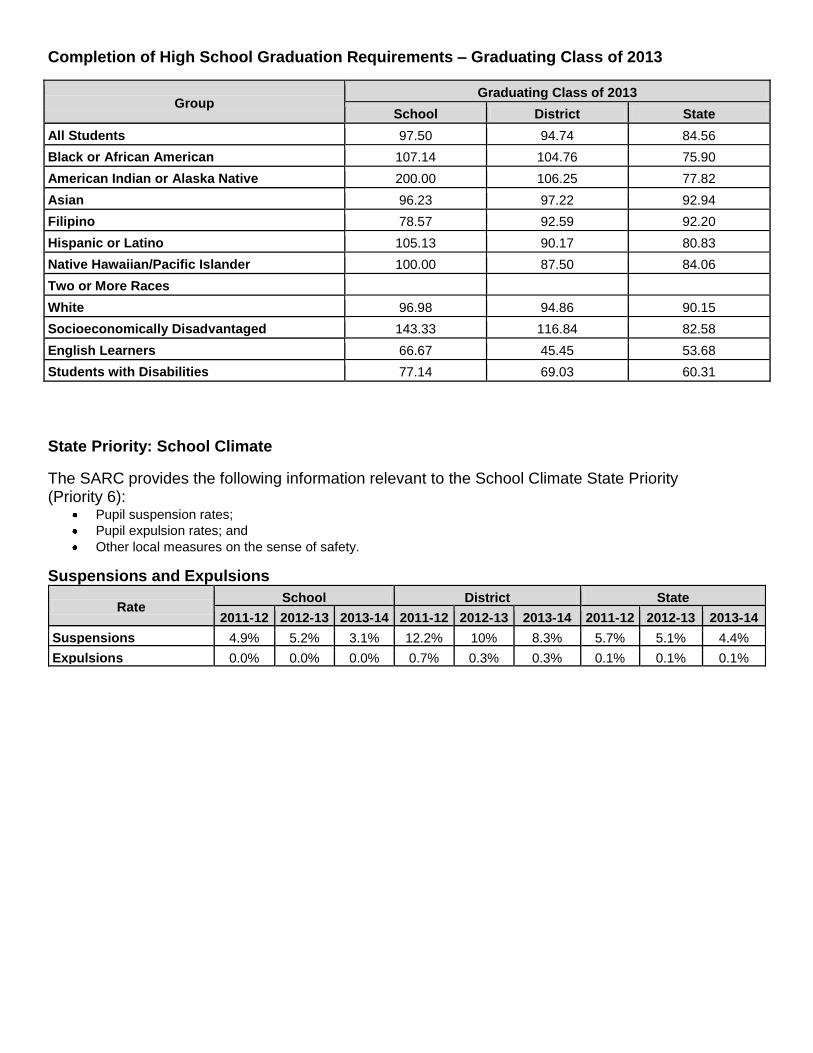
Completion of High School Graduation Requirements – Graduating Class of 2013
Group Graduating Class of 2013
School District State
All Students 97.50 94.74 84.56
Black or African American 107.14 104.76 75.90
American Indian or Alaska Native 200.00 106.25 77.82
Asian 96.23 97.22 92.94
Filipino 78.57 92.59 92.20
Hispanic or Latino 105.13 90.17 80.83
Native Hawaiian/Pacific Islander 100.00 87.50 84.06
Two or More Races
White 96.98 94.86 90.15
Socioeconomically Disadvantaged 143.33 116.84 82.58
English Learners 66.67 45.45 53.68
Students with Disabilities 77.14 69.03 60.31
State Priority: School Climate
The SARC provides the following information relevant to the School Climate State Priority (Priority 6):
Pupil suspension rates;
Pupil expulsion rates; and
Other local measures on the sense of safety.
Suspensions and Expulsions
Rate School District State
2011-12 2012-13 2013-14 2011-12 2012-13 2013-14 2011-12 2012-13 2013-14
Suspensions 4.9% 5.2% 3.1% 12.2% 10% 8.3% 5.7% 5.1% 4.4%
Expulsions 0.0% 0.0% 0.0% 0.7% 0.3% 0.3% 0.1% 0.1% 0.1%
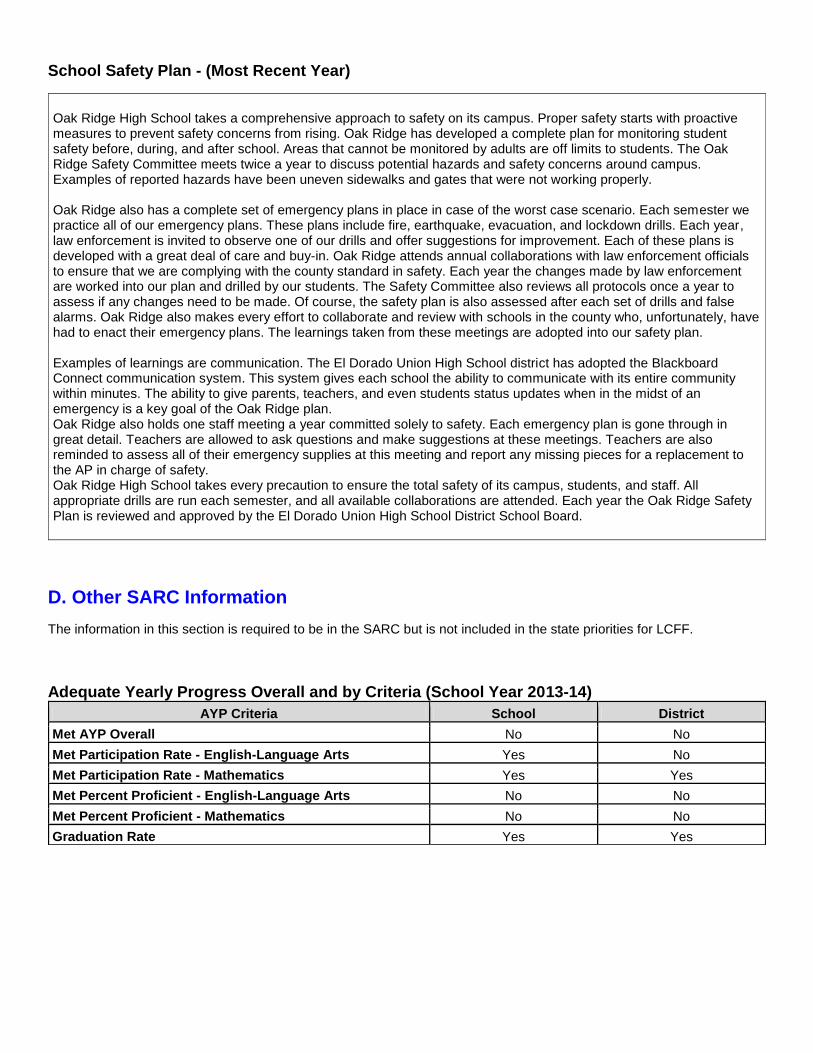
School Safety Plan - (Most Recent Year)
Oak Ridge High School takes a comprehensive approach to safety on its campus. Proper safety starts with proactive measures to prevent safety concerns from rising. Oak Ridge has developed a complete plan for monitoring student safety before, during, and after school. Areas that cannot be monitored by adults are off limits to students. The Oak Ridge Safety Committee meets twice a year to discuss potential hazards and safety concerns around campus. Examples of reported hazards have been uneven sidewalks and gates that were not working properly. Oak Ridge also has a complete set of emergency plans in place in case of the worst case scenario. Each semester we practice all of our emergency plans. These plans include fire, earthquake, evacuation, and lockdown drills. Each year, law enforcement is invited to observe one of our drills and offer suggestions for improvement. Each of these plans is developed with a great deal of care and buy-in. Oak Ridge attends annual collaborations with law enforcement officials to ensure that we are complying with the county standard in safety. Each year the changes made by law enforcement are worked into our plan and drilled by our students. The Safety Committee also reviews all protocols once a year to assess if any changes need to be made. Of course, the safety plan is also assessed after each set of drills and false alarms. Oak Ridge also makes every effort to collaborate and review with schools in the county who, unfortunately, have had to enact their emergency plans. The learnings taken from these meetings are adopted into our safety plan. Examples of learnings are communication. The El Dorado Union High School district has adopted the Blackboard Connect communication system. This system gives each school the ability to communicate with its entire community within minutes. The ability to give parents, teachers, and even students status updates when in the midst of an emergency is a key goal of the Oak Ridge plan. Oak Ridge also holds one staff meeting a year committed solely to safety. Each emergency plan is gone through in great detail. Teachers are allowed to ask questions and make suggestions at these meetings. Teachers are also reminded to assess all of their emergency supplies at this meeting and report any missing pieces for a replacement to the AP in charge of safety. Oak Ridge High School takes every precaution to ensure the total safety of its campus, students, and staff. All appropriate drills are run each semester, and all available collaborations are attended. Each year the Oak Ridge Safety Plan is reviewed and approved by the El Dorado Union High School District School Board.
D. Other SARC Information
The information in this section is required to be in the SARC but is not included in the state priorities for LCFF.
Adequate Yearly Progress Overall and by Criteria (School Year 2013-14)
AYP Criteria School District
Met AYP Overall No No
Met Participation Rate - English-Language Arts Yes No
Met Participation Rate - Mathematics Yes Yes
Met Percent Proficient - English-Language Arts No No
Met Percent Proficient - Mathematics No No
Graduation Rate Yes Yes
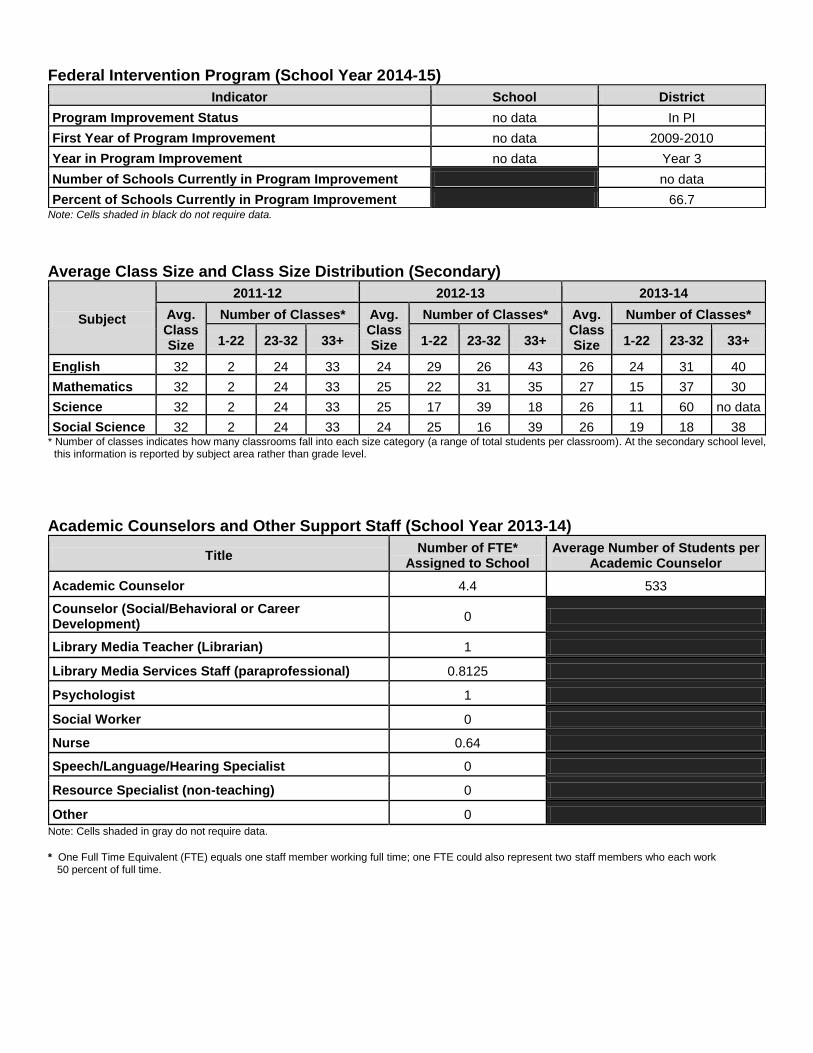
Federal Intervention Program (School Year 2014-15)
Indicator School District
Program Improvement Status no data In PI
First Year of Program Improvement no data 2009-2010
Year in Program Improvement no data Year 3
Number of Schools Currently in Program Improvement no data
Percent of Schools Currently in Program Improvement 66.7
Note: Cells shaded in black do not require data.
Average Class Size and Class Size Distribution (Secondary)
Subject
2011-12 2012-13 2013-14
Avg. Class Size
Number of Classes* Avg. Class Size
Number of Classes* Avg. Class Size
Number of Classes*
1-22 23-32 33+ 1-22 23-32 33+ 1-22 23-32 33+
English 32 2 24 33 24 29 26 43 26 24 31 40
Mathematics 32 2 24 33 25 22 31 35 27 15 37 30
Science 32 2 24 33 25 17 39 18 26 11 60 no data
Social Science 32 2 24 33 24 25 16 39 26 19 18 38 * Number of classes indicates how many classrooms fall into each size category (a range of total students per classroom). At the secondary school level,
this information is reported by subject area rather than grade level.
Academic Counselors and Other Support Staff (School Year 2013-14)
Title Number of FTE*
Assigned to School Average Number of Students per
Academic Counselor
Academic Counselor 4.4 533
Counselor (Social/Behavioral or Career Development)
0
Library Media Teacher (Librarian) 1
Library Media Services Staff (paraprofessional) 0.8125
Psychologist 1
Social Worker 0
Nurse 0.64
Speech/Language/Hearing Specialist 0
Resource Specialist (non-teaching) 0
Other 0
Note: Cells shaded in gray do not require data.
* One Full Time Equivalent (FTE) equals one staff member working full time; one FTE could also represent two staff members who each work 50 percent of full time.
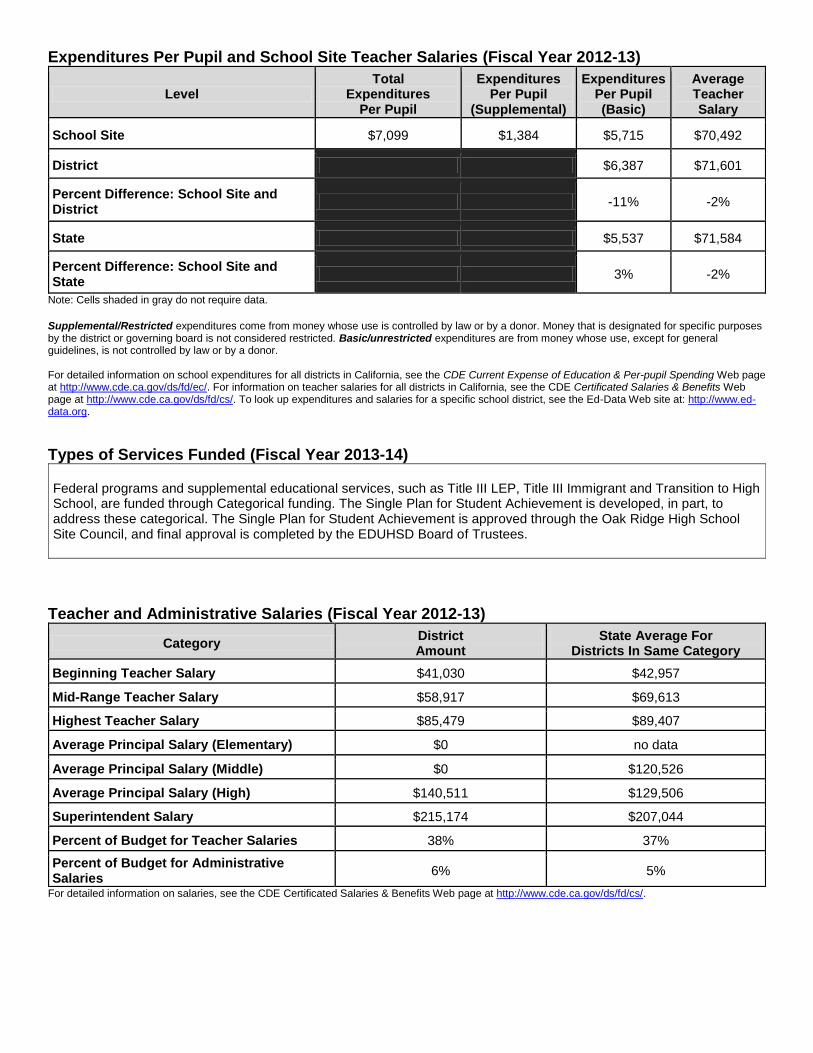
Expenditures Per Pupil and School Site Teacher Salaries (Fiscal Year 2012-13)
Level Total
Expenditures Per Pupil
Expenditures Per Pupil
(Supplemental)
Expenditures Per Pupil (Basic)
Average Teacher Salary
School Site $7,099 $1,384 $5,715 $70,492
District $6,387 $71,601
Percent Difference: School Site and District
-11% -2%
State $5,537 $71,584
Percent Difference: School Site and State
3% -2%
Note: Cells shaded in gray do not require data. Supplemental/Restricted expenditures come from money whose use is controlled by law or by a donor. Money that is designated for specific purposes by the district or governing board is not considered restricted. Basic/unrestricted expenditures are from money whose use, except for general guidelines, is not controlled by law or by a donor. For detailed information on school expenditures for all districts in California, see the CDE Current Expense of Education & Per-pupil Spending Web page at http://www.cde.ca.gov/ds/fd/ec/. For information on teacher salaries for all districts in California, see the CDE Certificated Salaries & Benefits Web page at http://www.cde.ca.gov/ds/fd/cs/. To look up expenditures and salaries for a specific school district, see the Ed-Data Web site at: http://www.ed-data.org.
Types of Services Funded (Fiscal Year 2013-14) Federal programs and supplemental educational services, such as Title III LEP, Title III Immigrant and Transition to High School, are funded through Categorical funding. The Single Plan for Student Achievement is developed, in part, to address these categorical. The Single Plan for Student Achievement is approved through the Oak Ridge High School Site Council, and final approval is completed by the EDUHSD Board of Trustees.
Teacher and Administrative Salaries (Fiscal Year 2012-13)
Category District Amount
State Average For Districts In Same Category
Beginning Teacher Salary $41,030 $42,957
Mid-Range Teacher Salary $58,917 $69,613
Highest Teacher Salary $85,479 $89,407
Average Principal Salary (Elementary) $0 no data
Average Principal Salary (Middle) $0 $120,526
Average Principal Salary (High) $140,511 $129,506
Superintendent Salary $215,174 $207,044
Percent of Budget for Teacher Salaries 38% 37%
Percent of Budget for Administrative Salaries
6% 5%
For detailed information on salaries, see the CDE Certificated Salaries & Benefits Web page at http://www.cde.ca.gov/ds/fd/cs/.
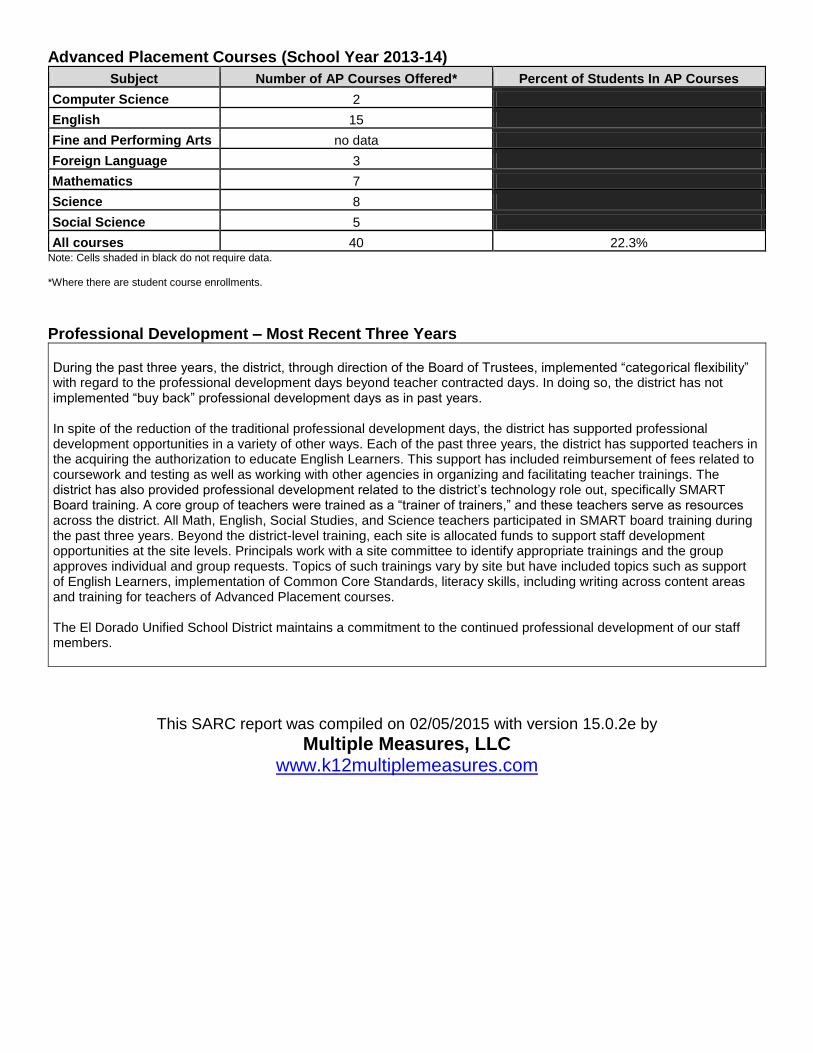
Advanced Placement Courses (School Year 2013-14)
Subject Number of AP Courses Offered* Percent of Students In AP Courses
Computer Science 2
English 15
Fine and Performing Arts no data
Foreign Language 3
Mathematics 7
Science 8
Social Science 5
All courses 40 22.3% Note: Cells shaded in black do not require data. *Where there are student course enrollments.
Professional Development – Most Recent Three Years During the past three years, the district, through direction of the Board of Trustees, implemented “categorical flexibility” with regard to the professional development days beyond teacher contracted days. In doing so, the district has not implemented “buy back” professional development days as in past years. In spite of the reduction of the traditional professional development days, the district has supported professional development opportunities in a variety of other ways. Each of the past three years, the district has supported teachers in the acquiring the authorization to educate English Learners. This support has included reimbursement of fees related to coursework and testing as well as working with other agencies in organizing and facilitating teacher trainings. The district has also provided professional development related to the district’s technology role out, specifically SMART Board training. A core group of teachers were trained as a “trainer of trainers,” and these teachers serve as resources across the district. All Math, English, Social Studies, and Science teachers participated in SMART board training during the past three years. Beyond the district-level training, each site is allocated funds to support staff development opportunities at the site levels. Principals work with a site committee to identify appropriate trainings and the group approves individual and group requests. Topics of such trainings vary by site but have included topics such as support of English Learners, implementation of Common Core Standards, literacy skills, including writing across content areas and training for teachers of Advanced Placement courses. The El Dorado Unified School District maintains a commitment to the continued professional development of our staff members.
This SARC report was compiled on 02/05/2015 with version 15.0.2e by
Multiple Measures, LLC www.k12multiplemeasures.com