onthe role atpases atp - proceedings of the national ... · onthe role ofactomyosinatpasesin...
TRANSCRIPT

Proc. Natl. Acad. Sci. USAVol. 88, pp. 5764-5768, July 1991Physiology/Pharmacology
On the role of actomyosin ATPases in regulation of ATP turnoverrates during intense exercise
(metabolic control/energy coupling/muscle metabolism/flux control/fiber-type metabolism)
P. W. HOCHACHKA*t, M. S. C. BIANCONCINItt, W. S. PARKHOUSE§, AND G. P. DOBSON¶tDepartment of Zoology, University of British Columbia, Vancouver, BC V6T 1Z4, Canada; §Department of Kinesiology, Simon Fraser University, Burnaby,BC V5A 1S6, Canada; and sNational Institute on Alcohol Abuse and Alcoholism, Laboratory of Metabolism, Rockville, MD 20852
Communicated by C. R. Taylor, March 19, 1991 (receivedfor review November 7, 1990)
ABSTRACT Actomyosin ATPase is the dominant ATPsink during muscle work. Its catalytic capacities in fast-twitchoxidative glycolytic fibers have long been known to exceed byabout 3-fold those of slow-twitch oxidative fibers, but therelative contributions to control of metabolic rates duringexercise have never been closely examined. We comparedfast-twitch oxidative glycolytic and slow-twitch oxidative fibersthat displayed similar mitochondrial abundance (similar ac-tivities of mitochondrial marker enzymes). During short-term,but near maximum, aerobic exercise, fast-twitch oxidativeglycolytic fibers displayed ATP turnover rates that were 2-4times higher than for slow-twitch oxidative fibers (despitesimilar mitochondrial metabolic capacities), implying a largeATPase contribution to control of maximum metabolic rate.Fluxes through the ATP ADP + Pi cycle were extremely wellregulated; at the lower limit, the forward flux exceeded thebackward flux by only 0.06%, whereas at the upper limit,ATPase rates exceeded ATP synthesis rates by 0.12%. Thisvery high precision of energy coupling could not be easilyexplained by standard metabolic regulation models.
Current models of metabolic regulation during exercise typ-ically emphasize a crucial role for the energetic status of thecell (expressed as the absolute concentration change in keymetabolites such as ADP and ATP, in concentration ratiossuch as ATP/ADP, in the phosphorylation potential, [ATP]/[ADP] + [Pi], or in {PCr}, defined as the ratio [PCr]/[PCr] +[Cr] (where PCr is phosphocreatine and Cr is creatine)), witha role for related changes in redox sometimes also assumedto be involved in the regulation of ATP turnover rates (1-4).Connett et al. (4) have argued cogently for a "systems"approach to unraveling metabolic regulatory mechanisms inrealistic (i.e., approximating in vivo) settings. The two maincomponents of such systems for working muscles are (i)energy-demanding pathways that may involve several inter-related functions (usually ATPases) and (ii) energy-yieldingpathways that also may be subdivided into many interlinked(enzymic, diffusive, and convective) functions:
ATP + H20 --*- ADP + Pi + H+ + cell work
ADP + Pi + H+ + glucose + 02 Ho ATP + CO2 + H20
Although the most crucial single regulatory constraint onmuscle during any kind of steady-state exercise is the re-quirement for balancing fluxes through these two pathways,most studies of muscle function regulation during work donot stress (and often seemingly overlook) the boundaryconditions imposed by coupling energy demand and energysupply. In consequence most such studies focus upon regu-latory roles only of the energy-supply half of the system
under investigation (4). (Exceptions to this are found instudies of fatigue, but in these the systems are usually so farfrom steady state that normal regulatory mechanisms may nolonger be evident.) For these reasons, we decided that it wasan opportune time to reevaluate the roles of actomyosinATPases in the regulation ofmaximum metabolic rates duringmuscle exercise. By accounting for some two-thirds of theATP turnover rates during maximum muscle work (6), theactomyosin ATPases constitute the main energy-demandcomponent of the two-pathway system under analysis. Thequestion arises of whether or not their contributions tocontrol of ATP turnover rates are commensurate with theirhigh ATP demands.We tried to assess these potential roles for actomyosin
ATPases by comparing two kinds of oxidative muscle fi-bers-slow red and fast red-that have similar oxidativecapacities but that have about a 3-fold difference in actomy-osin ATPase catalytic potential (7). If a great deal of controlwere to be vested in this step in ATP turnover then we wouldexpect that at their respective near-maximum work rates, themetabolic rates of these different kinds of muscles shoulddiffer greatly (8-10). On the other hand, if maximum meta-bolic rates were determined by regulation at other sites in thepathways of ATP turnover, then these two kinds of redmuscles should display similar maximum metabolic rates, asindeed might be predicted because of similar oxidative ca-pacities (11).
MATERIALS AND METHODSTraining and Exercise Protocol. Adult male Sprague-
Dawley rats (-300 g) were trained by running at 30 m/min ona treadmill for 10 min a day, 5 days a week, for 4-8 weeksprior to the experiment. Rats selected for a 2-min high-velocity run were familiarized with the protocol for 7 daysbefore the experiment, always carried out in the morning toavoid any diurnal variation in muscle glycogen (12). The2-min protocol consisted of running at a treadmill speed of 75m/min for 20 sec and at 56 m/min for the remaining 1 min 40sec. At these speeds and the level of training used, theoxidative fibers of hind limb muscles of the rat were consid-ered to be strongly activated to near maximum but sustain-able aerobic exercise rates (13); blood flow measurementswere available for essentially identical (1 min of steady-staterunning) conditions (14).
Anesthesia. The exercised animals were anesthetized (in60-90 sec) with an i.p. injection of 1.5 ml containing 0.5 mlof sodium pentobarbital (50 mg/ml) and 1.0 ml of curare (10mg/ml). Curare, a neuromuscular blocking agent, was found
Abbreviations: FOG, fast-twitch oxidative glycolytic; PCr, phos-phocreatine; Cr, creatine; V02, 02 consumption.*To whom reprint requests should be addressed.tPermanent address: Universidade de Sao Paulo, Instituto de Bio-ciencias, Caixa Postal 11,461, CEP 06499-01000, Sao Paulo, Brazil.
5764
The publication costs of this article were defrayed in part by page chargepayment. This article must therefore be hereby marked "advertisement"in accordance with 18 U.S.C. §1734 solely to indicate this fact.
Proc. Natl. Acad. Sci. USA 88 (1991) 5765
to be suitable in preventing muscle twitching after exercise.Nonexercised (control) rats were ether-anesthetized.
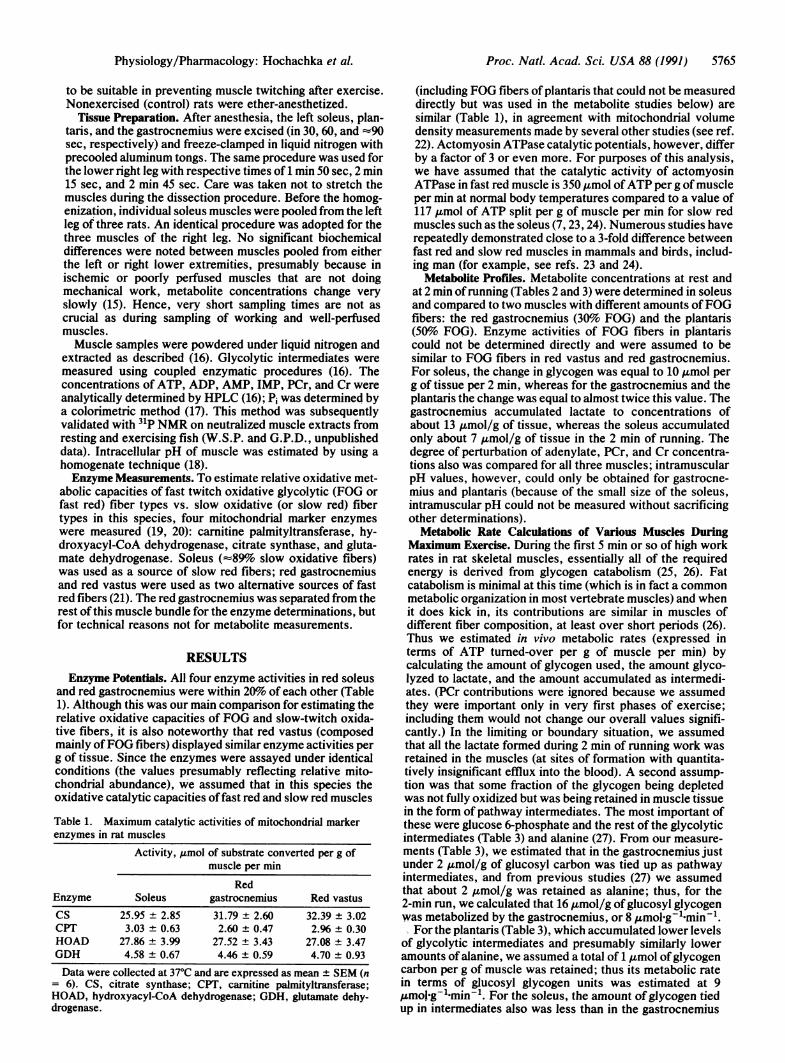
Tissue Preparation. After anesthesia, the left soleus, plan-taris, and the gastrocnemius were excised (in 30, 60, and -90sec, respectively) and freeze-clamped in liquid nitrogen withprecooled aluminum tongs. The same procedure was used forthe lower right leg with respective times of 1 min 50 sec, 2 min15 sec, and 2 min 45 sec. Care was taken not to stretch themuscles during the dissection procedure. Before the homog-enization, individual soleus muscles were pooled from the leftleg of three rats. An identical procedure was adopted for thethree muscles of the right leg. No significant biochemicaldifferences were noted between muscles pooled from eitherthe left or right lower extremities, presumably because inischemic or poorly perfused muscles that are not doingmechanical work, metabolite concentrations change veryslowly (15). Hence, very short sampling times are not ascrucial as during sampling of working and well-perfusedmuscles.Muscle samples were powdered under liquid nitrogen and
extracted as described (16). Glycolytic intermediates weremeasured using coupled enzymatic procedures (16). Theconcentrations of ATP, ADP, AMP, IMP, PCr, and Cr wereanalytically determined by HPLC (16); Pi was determined bya colorimetric method (17). This method was subsequentlyvalidated with 31P NMR on neutralized muscle extracts fromresting and exercising fish (W.S.P. and G.P.D., unpublisheddata). Intracellular pH of muscle was estimated by using ahomogenate technique (18).Enzyme Measurements. To estimate relative oxidative met-
abolic capacities of fast twitch oxidative glycolytic (FOG orfast red) fiber types vs. slow oxidative (or slow red) fibertypes in this species, four mitochondrial marker enzymeswere measured (19, 20): carnitine palmityltransferase, hy-droxyacyl-CoA dehydrogenase, citrate synthase, and gluta-mate dehydrogenase. Soleus (-89%o slow oxidative fibers)was used as a source of slow red fibers; red gastrocnemiusand red vastus were used as two alternative sources of fastred fibers (21). The red gastrocnemius was separated from therest of this muscle bundle for the enzyme determinations, butfor technical reasons not for metabolite measurements.
RESULTSEnzyme Potentials. All four enzyme activities in red soleus
and red gastrocnemius were within 20%o of each other (Table1). Although this was our main comparison for estimating therelative oxidative capacities of FOG and slow-twitch oxida-tive fibers, it is also noteworthy that red vastus (composedmainly ofFOG fibers) displayed similar enzyme activities perg of tissue. Since the enzymes were assayed under identicalconditions (the values presumably reflecting relative mito-chondrial abundance), we assumed that in this species theoxidative catalytic capacities offast red and slow red muscles
Table 1. Maximum catalytic activities of mitochondrial markerenzymes in rat muscles
Activity, ,umol of substrate converted per g ofmuscle per min
RedEnzyme Soleus gastrocnemius Red vastusCS 25.95 t 2.85 31.79 ± 2.60 32.39 ± 3.02CPT 3.03 + 0.63 2.60 ± 0.47 2.96 ± 0.30HOAD 27.86 ± 3.99 27.52 ± 3.43 27.08 ± 3.47GDH 4.58 + 0.67 4.46 ± 0.59 4.70 ± 0.93
(including FOG fibers of plantaris that could not be measureddirectly but was used in the metabolite studies below) aresimilar (Table 1), in agreement with mitochondrial volumedensity measurements made by several other studies (see ref.22). Actomyosin ATPase catalytic potentials, however, differby a factor of 3 or even more. For purposes of this analysis,we have assumed that the catalytic activity of actomyosinATPase in fast red muscle is 350 ,umol ofATP per g of muscleper min at normal body temperatures compared to a value of117 Amol of ATP split per g of muscle per min for slow redmuscles such as the soleus (7, 23, 24). Numerous studies haverepeatedly demonstrated close to a 3-fold difference betweenfast red and slow red muscles in mammals and birds, includ-ing man (for example, see refs. 23 and 24).
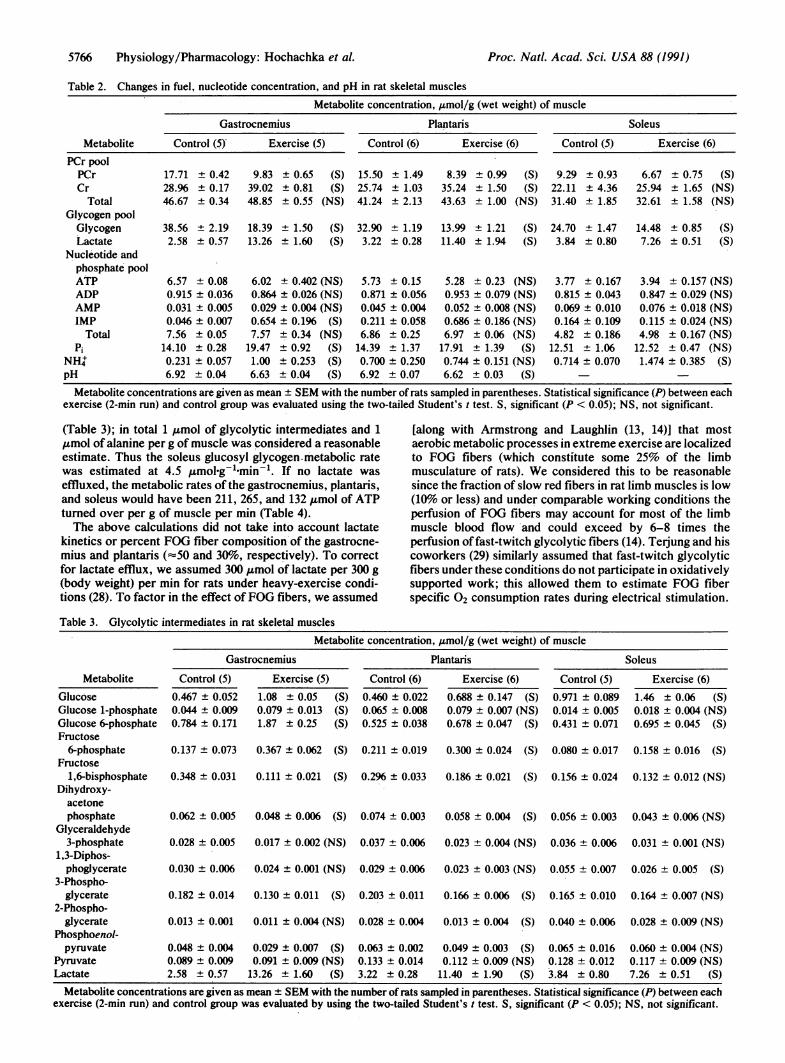
Metabolite Profiles. Metabolite concentrations at rest andat 2 min ofrunning (Tables 2 and 3) were determined in soleusand compared to two muscles with different amounts ofFOGfibers: the red gastrocnemius (30%o FOG) and the plantaris(50%o FOG). Enzyme activities of FOG fibers in plantariscould not be determined directly and were assumed to besimilar to FOG fibers in red vastus and red gastrocnemius.For soleus, the change in glycogen was equal to 10 ,umol perg of tissue per 2 min, whereas for the gastrocnemius and theplantaris the change was equal to almost twice this value. Thegastrocnemius accumulated lactate to concentrations ofabout 13 i.mol/g of tissue, whereas the soleus accumulatedonly about 7 Amol/g of tissue in the 2 min of running. Thedegree of perturbation of adenylate, PCr, and Cr concentra-tions also was compared for all three muscles; intramuscularpH values, however, could only be obtained for gastrocne-mius and plantaris (because of the small size of the soleus,intramuscular pH could not be measured without sacrificingother determinations).
Metabolic Rate Calculations of Various Muscles DuringMaximum Exercise. During the first 5 min or so of high workrates in rat skeletal muscles, essentially all of the requiredenergy is derived from glycogen catabolism (25, 26). Fatcatabolism is minimal at this time (which is in fact a commonmetabolic organization in most vertebrate muscles) and whenit does kick in, its contributions are similar in muscles ofdifferent fiber composition, at least over short periods (26).Thus we estimated in vivo metabolic rates (expressed interms of ATP turned-over per g of muscle per min) bycalculating the amount of glycogen used, the amount glyco-lyzed to lactate, and the amount accumulated as intermedi-ates. (PCr contributions were ignored because we assumedthey were important only in very first phases of exercise;including them would not change our overall values signifi-cantly.) In the limiting or boundary situation, we assumedthat all the lactate formed during 2 min of running work wasretained in the muscles (at sites of formation with quantita-tively insignificant efflux into the blood). A second assump-tion was that some fraction of the glycogen being depletedwas not fully oxidized but was being retained in muscle tissuein the form of pathway intermediates. The most important ofthese were glucose 6-phosphate and the rest of the glycolyticintermediates (Table 3) and alanine (27). From our measure-ments (Table 3), we estimated that in the gastrocnemius justunder 2 ,umol/g of glucosyl carbon was tied up as pathwayintermediates, and from previous studies (27) we assumedthat about 2 ,mol/g was retained as alanine; thus, for the2-min run, we calculated that 16 ,umol/g of glucosyl glycogenwas metabolized by the gastrocnemius, or 8 ,umol g-1 min-1.For the plantaris (Table 3), which accumulated lower levels
of glycolytic intermediates and presumably similarly loweramounts of alanine, we assumed a total of 1 ,umol ofglycogencarbon per g of muscle was retained; thus its metabolic rate
in terms of glucosyl glycogen units was estimated at 9,umoJg-1min-'. For the soleus, the amount ofglycogen tiedup in intermediates also was less than in the gastrocnemius
Data were collected at 370C and are expressed as mean + SEM (n= 6). CS, citrate synthase; CPT, carnitine palmityltransferase;HOAD, hydroxyacyl-CoA dehydrogenase; GDH, glutamate dehy-drogenase.
Physiology/Pharmacology: Hochachka et al.
5766 Physiology/Pharmacology: Hochachka et al.
Table 2. Changes in fuel, nucleotide concentration, and pH in rat skeletal muscles
Metabolite concentration, ,umol/g (wet weight) of muscle
Gastrocnemius
MetabolitePCr poolPCrCr
TotalGlycogen poolGlycogenLactate
Nucleotide andphosphate poolATPADPAMPIMP
TotalPi
NH4pH
Control (5)
17.71 ± 0.4228.96 ± 0.1746.67 + 0.34
38.56 ± 2.192.58 ± 0.57
6.57 ± 0.080.915 ± 0.0360.031 ± 0.0050.046 ± 0.0077.56 ± 0.05
14.10 ± 0.280.231 ± 0.0576.92 ± 0.04
Exercise (5)
9.83 ± 0.6539.02 + 0.8148.85 ± 0.55
Plantaris
Control (6) Exercise (6)
(S) 15.50 ± 1.49(S) 25.74 ± 1.03
(NS) 41.24 ± 2.13
18.39 ± 1.50 (S) 32.90 ± 1.1913.26 ± 1.60 (S) 3.22 ± 0.28
6.02 ± 0.402 (NS)0.864 ± 0.026 (NS)0.029 ± 0.004 (NS)0.654 ± 0.196 (S)7.57 ± 0.34 (NS)
19.47 ± 0.92 (S)1.00 ± 0.253 (S)6.63 ± 0.04 (S)
5.73 ± 0.150.871 ± 0.0560.045 ± 0.0040.211 ± 0.0586.86 ± 0.25
14.39 ± 1.370.700 ± 0.2506.92 ± 0.07
8.39 + 0.9935.24 ± 1.5043.63 ± 1.00
Soleus
Control (5) Exercise (6)
(S) 9.29 ± 0.93(S) 22.11 ± 4.36
(NS) 31.40 ± 1.85
13.99 ± 1.21 (S) 24.70 ± 1.4711.40 ± 1.94 (S) 3.84 ± 0.80
5.28 + 0.23 (NS)0.953 ± 0.079 (NS)0.052 ± 0.008 (NS)0.686 ± 0.186 (NS)6.97 ± 0.06 (NS)
17.91 ± 1.39 (S)0.744 ± 0.151 (NS)6.62 ± 0.03 (S)
3.77 ± 0.1670.815 ± 0.0430.069 ± 0.0100.164 ± 0.1094.82 ± 0.186
12.51 ± 1.060.714 ± 0.070
6.67 ± 0.75 (S)25.94 ± 1.65 (NS)32.61 ± 1.58 (NS)
14.48 ± 0.85 (S)7.26 ± 0.51 (S)
3.94 ± 0.157 (NS)0.847 ± 0.029 (NS)0.076 ± 0.018 (NS)0.115 ± 0.024 (NS)4.98 ± 0.167 (NS)
12.52 ± 0.47 (NS)1.474 ± 0.385 (S)
Metabolite concentrations are given as mean ± SEM with the number of rats sampled in parentheses. Statistical significance (P) between eachexercise (2-min run) and control group was evaluated using the two-tailed Student's t test. S, significant (P < 0.05); NS, not significant.
(Table 3); in total 1 ,mol of glycolytic intermediates and 1,mol of alanine per g of muscle was considered a reasonableestimate. Thus the soleus glucosyl glycogen metabolic ratewas estimated at 4.5 ,umol~g-1min-1. If no lactate waseffluxed, the metabolic rates of the gastrocnemius, plantaris,and soleus would have been 211, 265, and 132 Amol of ATPturned over per g of muscle per min (Table 4).The above calculations did not take into account lactate
kinetics or percent FOG fiber composition of the gastrocne-mius and plantaris (-50 and 30%, respectively). To correctfor lactate efflux, we assumed 300 umol of lactate per 300 g(body weight) per min for rats under heavy-exercise condi-tions (28). To factor in the effect of FOG fibers, we assumed
[along with Armstrong and Laughlin (13, 14)] that mostaerobic metabolic processes in extreme exercise are localizedto FOG fibers (which constitute some 25% of the limbmusculature of rats). We considered this to be reasonablesince the fraction of slow red fibers in rat limb muscles is low(10%6 or less) and under comparable working conditions theperfusion of FOG fibers may account for most of the limbmuscle blood flow and could exceed by 6-8 times theperfusion of fast-twitch glycolytic fibers (14). Terdung and hiscoworkers (29) similarly assumed that fast-twitch glycolyticfibers under these conditions do not participate in oxidativelysupported work; this allowed them to estimate FOG fiberspecific 02 consumption rates during electrical stimulation.
Table 3. Glycolytic intermediates in rat skeletal musclesMetabolite concentration, Amol/g (wet weight) of muscle
Gastrocnemius
MetaboliteGlucoseGlucose 1-phosphateGlucose 6-phosphateFructose6-phosphate
Fructose1,6-bisphosphate
Dihydroxy-acetonephosphate
Glyceraldehyde3-phosphate
1,3-Diphos-phoglycerate
3-Phospho-glycerate
2-Phospho-glycerate
Phosphoenol-pyruvate
PyruvateLactate
Control (5)0.467 + 0.0520.044 ± 0.0090.784 ± 0.171
Exercise (5)1.08 ± 0.05 (S)0.079 ± 0.013 (S)1.87 ± 0.25 (S)
Plantaris
Control (6)0.460 ± 0.0220.065 ± 0.0080.525 ± 0.038
0.137 + 0.073 0.367 ± 0.062 (S) 0.211 ± 0.019
0.348 + 0.031 0.111 ± 0.021 (S) 0.296 ± 0.033
Exercise (6)0.688 ± 0.147 (S)0.079 + 0.007 (NS)0.678 ± 0.047 (S)
Control (5)0.971 ± 0.0890.014 ± 0.0050.431 ± 0.071
0.300 ± 0.024 (S) 0.080 ± 0.017
Soleus
Exercise (6)1.46 + 0.06 (S)0.018 + 0.004 (NS)0.695 + 0.045 (S)
0.158 ± 0.016 (S)
0.186 ± 0.021 (S) 0.156 ± 0.024 0.132 ± 0.012 (NS)
0.062 ± 0.005 0.048 ± 0.006 (S) 0.074 ± 0.003 0.058 ± 0.004 (S) 0.056 ± 0.003 0.043 ± 0.006 (NS)
0.028 ± 0.005 0.017 ± 0.002 (NS) 0.037 ± 0.006 0.023 ± 0.004 (NS) 0.036 ± 0.006 0.031 ± 0.001 (NS)
0.030 ± 0.006 0.024 ± 0.001 (NS) 0.029 ± 0.006
0.182 ± 0.014 0.130 ± 0.011 (S) 0.203 ± 0.011
0.013 ± 0.001 0.011 ± 0.004 (NS) 0.028 ± 0.004
0.048 ± 0.0040.089 ± 0.0092.58 ± 0.57
0.029 + 0.007 (S)0.091 ± 0.009 (NS)13.26 ± 1.60 (S)
0.063 ± 0.0020.133 ± 0.0143.22 ± 0.28
0.023 ± 0.003 (NS) 0.055 ± 0.007 0.026 ± 0.005 (S)
0.166 ± 0.006 (S) 0.165 ± 0.010 0.164 ± 0.007 (NS)
0.013 ± 0.004 (S) 0.040 _ 0.006
0.049 ± 0.003 (S)0.112 ± 0.009 (NS)11.40 ± 1.90 ($)
0.065 + 0.0160.128 ± 0.0123.84 ± 0.80
0.028 ± 0.009 (NS)
0.060 ± 0.004 (NS)0.117 + 0.009 (NS)7.26 ± 0.51 (S)
Metabolite concentrations are given as mean + SEM with the number of rats sampled in parentheses. Statistical significance (P) between eachexercise (2-min run) and control group was evaluated by using the two-tailed Student's t test. S, significant (P < 0.05); NS, not significant.
Proc. Natl. Acad Sci. USA 88 (1991)

Proc. Natl. Acad. Sci. USA 88 (1991) 5767
Table 4. Calculated ATP turnover rates assuming nolactate efflux
Calculated ATP turnover
From From oxidativeMuscle glycolysis metabolism
Soleus 3.0 129Plantaris 6.0 259Gastrocnemius 7.5 204
ATP turnover is expressed as ,umol ofATP perg per min, assumingall lactate formed in the 2-min run was retained in muscle.
Using this framework, we estimated maximum lactate effluxrates during the 2-min run of 12 Amol of lactate per g of FOGfibers per min [muscle weight of a 300-g rat was taken to be100 g, 25% ofwhich was taken to be FOG fibers (14, 21)]. Forthe gastrocnemius, this meant that glycogen carbon flow tolactate was 5 ,umol-g'-min1 (retained in muscle) plus 4,umol g-l.mind effluxed, requiring a total of 4.5 ,umol ofglucosyl units g -min and yielding 13.5 jxmol ofATP in theprocess. Oxidation of the remaining 3.5 ,umol of glucosylglycogen by 0.3 g of FOG fibers yielded an oxidative meta-bolic rate of432Amol ofATP per g ofFOG fibers per min (3.5x 37/0.3). This more realistic set of values implied a glyco-lytic contribution of 13.5/432 or 3.1% of the oxidative rate(Table 5). Similar calculations for the plantaris (50o FOGfibers) indicated an oxidative metabolic rate of 296 .mol ofATP per g ofFOG fibers per min and a glycolytic contributionthat was about 5% as large or 15 ,mol ofATP per g per min.These values of oxidative metabolic rates were, respectively,2.3 and 3.3 times larger than the metabolic rate calculated forthe soleus (Table 5).
If our estimates of lactate efflux were too high [which isprobable (31)], then even a greater proportion ofthe glycogenutilized was presumably oxidized; in this case, our calcula-tions would have underestimated the ATP turnover rates infast red muscles. Ifour assessments of lactate efflux were toolow (as in soleus where we assumed the process to be so slowthat it could be ignored over a 2-min exercise bout), then ourcalculations would have overestimated the ATP turnoverrate. This means that the metabolic rate differences betweenthe soleus on the one hand and the gastrocnemius andplantaris on the other were minimized by these calculations,not vice versa (Table 5).
DISCUSSIONA number of unexpected and potentially interesting implica-tions arise from this analysis.Comparison of ATP Turnover Rates. The values of oxida-
tive metabolic rate calculated for FOG fibers in this studyseem unexpectedly high and the first matter to consider ishow these rates correlate with whole-organism maximum 02
Table 5. Comparative oxidative metabolic rates
ATP Actomyosin FlowMuscle type turnover rate ATPase rate
Slow oxidative fibers(soleus) 129 117 233
FOG (plantaris) 2% 350 215FOG (gastrocnemius) 432 350 403FOG (hummingbird
flight muscle)* 490 350
ATP turnover is expressed as j.mol ofATP per g per min; see textfor calculations. Actomyosin ATPase is from Marston and Taylor (7),assuming a Q1o of 2.5. Flow rate is from Armstrong and Laughlin (14)and is expressed as ml per 100 g per min.*From Suarez et al. (30) based on 02 consumption rates duringhovering flight.
consumption (Vo2) measurements. Although the literaturevalues for maximum Vo2 rates of exercising rats vary some-what, 80 ml of 02 per kg per min is a fairly widely acceptedestimate (see ref. 32). The hind limb muscles of a 300-g ratweigh about 30 g in total, so we have assumed about 50 g oflocomotory musculature. Hence a Vo2 value of 80 ml of 02per kg per min is equivalent to 20 gmol of 02 per g oflocomotory muscle per min or 120 ,mol ofATP per g per min.Since about 25% of this musculature is composed of FOGfibers [and most of the rest is composed of fast-twitchglycolytic fibers thought to play a minimal role in sustainedmetabolism and work (13, 14)], it is possible for fast redmuscles to achieve rates of oxidative metabolism equal to 480Amol of ATP per g of FOG fibers per min; these valuesapproach those of hummingbird flight muscles during hov-ering (30) and may require a significant fraction of availableactomyosin ATPase activity (Table 5).
Mitochondrial Oxidative Capacities and ATP Turnover.Perhaps the most surprising result of these studies is the largedifference in in vivo ATP turnover rates sustained by fast redand slow red muscles; it is minimally =2-fold (Table 4), butrealistically is closer to 3- to 4-fold (Table 5). At first glance,this is unexpected because the oxidative capacities of slowred and fast red muscles in the rat are almost indistinguish-able from each other. If mitochondrial volume densities aresimilar (22, 33) as are the catalytic activities of mitochondrialmarker enzymes (Table 1), then is it not reasonable to expectmaximum 02-linked ATP turnover rates also to be similar?Although this has been a debated issue in recent years, thegeneral consensus from between-species comparisons isthat maximum Vo2 correlates well with mitochondrial abun-dance (11, 22, 33). Our results however clearly show that themitochondrial-based ATP turnover rates of FOG fibers ex-ceed by far those of slow oxidative muscles, such as thesoleus (Table 5). In the language of control theory (10), thisis because the energy-demand pathways of the system (eitheractomyosin ATPases alone or in combination with Ca'ATPases and other ATP-utilizing reactions) contribute in amajor way to flux regulation particularly as the systemapproaches maximum velocities.
Regulatory Insights. In considering the overall regulation ofATP turnover during the 2-min run, the question arises ofhow closely matched are the fluxes through muscle ATPasesand muscle ATP synthases. How tightly coupled are theenergy-demand and energy-supply pathways of the systemsunder analysis? For the gastrocnemius and plantaris, fairlyrich in fast fibers, a quantitative answer to this question arisesfrom IMP concentrations. Because of the stoichiometrybetween ATP depletion and IMP accumulation and becauseof high AMP deaminase activities in fast twitch fibers (34),IMP accumulation through the 2-min run becomes a fairlyaccurate index of the degree to which ATPase fluxes exceedATP synthase fluxes. Since the accumulation observed is infact relatively modest (Table 2), energy-demand and energy-supply pathways in these muscles remained well coupledthroughout the exercise protocol: while fluxing nearly 500jumol ofATP per g per min in both ATPase and ATP synthasedirections (Table 5), these muscles accumulated only =0.151Lmol of IMP per g per min (Table 2). At this metabolic rate,for each 1666 turns ofthe ATP=ADP + Pi cycle, in only onedoes substrate escape to IMP-a surprising regulatory pre-cision. Even if we assume the lower metabolic rate of about250 ,umol of ATP per gamin (Table 4), the flux imbalanceremains low: in this case, for each 833 turns of the ATPADP + Pi cycle, one turn allows substrate escape to IMP.This means that the error signal-the degree to which ATP-ase flux exceeds ATP synthase flux-is only 0.06-0.12%whereas the overall metabolic rates, especially of FOGfibers, may be two orders of magnitude higher than at rest.
Physiology/Pharmacology: Hochachka et al.
5768 Physiology/Pharmacology: Hochachka et al.
What kind of regulatory mechanisms could account for suchprecision?
Several current models of metabolic regulation (1-4) wouldpredict that changes in concentrations of adenylates, PCr, Cr,Pi, H', and/or NADH/NAD' are able to mediate observedchanges in ATP cycling rates. These models typically incor-porate both kinetic and thermodynamic components. Al-though it is often either unstated or overlooked, only theformer can directly regulate reaction rates (by enzyme-substrate interactions controlled by effectors or modulators)while change in thermodynamic components (such as redoxor phosphorylation potentials) may correlate with, but cannotdirectly cause, change in reaction rates. In neither event,however, are our data and analyses consistent with thesetraditional models. The first problem is that our data on suchparameters cannot readily account for the different metabolicrates observed in the three muscles examined. Instead incomparing the three muscles, it is the relative similarity, notthe magnitude of difference, in these parameters that is moststriking about the data. On face value, these data are incon-sistent with the "driving functions" proposed for theseparameters by current regulation models.A second problem arises from a key requirement of current
models (cast in Michaelis-Menten form) that changes in met-abolic rate are directly related to the proposed driving func-tions. To be sure, good correlations between some parameters(such as the free concentration of ADP) and metabolic acti-vation are obtained in some studies (1-4), but these are notalways 1:1 relationships; usually a small change in free ADPconcentration correlates with a substantially larger change inVo2 or in work output (1). In an independent study of elec-trically stimulated muscle, we found that the correlationbetween free ADP concentration and ATP turnover ratedepended on 02 availability, and again, the percent change inVo2 exceeded the relative change in free ADP concentration.Similar relative stability of putative regulators (especially ofthe adenylates) during large changes in metabolic and workrates in fact are not uncommon (1, 3).For these reasons, we conclude that available data repeat-
edly point out two crucial problems: (i) not enough change insignal to account (by the Michaelis-Menten models currentlyused) for many of the extreme metabolic rates observed inworking muscle and (ii) not enough sensitivity (or gain) toaccount for the precise energy coupling observed. We con-sider the latter particularly difficult for current models ofregulation, because nowhere in our data or in data publishedby others (1, 4) do we see convincing evidence of theenormous sensitivity or gain required to respond to 0.06-0.12% change in error signal in forward and back ATP fluxrates. That is the main reason we consider that the situationmay be more analogous to that found in insect flight muscles:during flight these muscles can sustain two to three orders ofmagnitude increase in flux through the glycolytic pathwaywith modest (sometimes immeasurable) change in the con-centration of pathway intermediates (5). Such regulatoryprecision is not dependent upon mass-action-regulated en-zyme mechanisms but instead is achieved by finely tunedallosteric regulation or covalent modification of key enzymesin the pathway. The major advantage of such control is thatit allows a very large magnitude change in the flux rate withminimal or no change in substrate and product concentra-tions. Similar mechanisms may be operative in the regulationof oxidative metabolic rates in working mammalian muscles,but because of fiber type and metabolic complexity of thesystem these may have been overlooked. Ifthat should be thecase, then the observed changes during longer-term work inso called regulatory parameters of oxidative metabolism
[which undoubtedly are observed (4)] may merely be reflect-ing changes in ATP cycling rates rather than causing them. Bethat as it may, the question of how ATP. synthesis rates soclosely balance ATPase rates, although of immense interest,remains unanswered.
Especial thanks are due Dr. Angelo Belcastro and his laboratorycolleagues for helpful assistance. This work was supported by aNatural Sciences and Engineering Research Council operating grantto P.W.H.
1. Balaban, R. S. (1990) Am. J. Physiol. 258, C377-C389.2. Rumsey, W. L., Schlosser, C., Nuutinen, E. M., Robiolio, M. &
Wilson, D. F. (1990) J. Biol. Chem. 265, 15392-15399.3. From, A. H. L., Zimmer, S. D., Michursky, S. P., Mohana-Krish-
nan, P., Ulstad, V. K., Thomas, W. J. & Ugurbil, K. (1990)Biochemistry 29, 3731-3743.
4. Connett, R. J., Honig, C. R., Gayeski, R. E. J. & Brooks, G. A.(1990) J. Appl. Physiol. 68, 833-842.
5. Beenakers, A. M. T. & van der Horst, D. J. (1984) Insect Biochem.14, 243-260.
6. Rall, J. A. (1985) Exercise Sport Sci. Rev. 13, 33-74.7. Marston, S. B. & Taylor, E. W. (1980) J. Mol. Biol. 139, 573-600.8. Kacser, H. & Bums, J. A. (1973) Symp. Soc. Exp. Biol. 32, 65-104.9. Groen, A. K., Wanders, R. J. A., Westerhoff, H. V., van der Meer,
R. & Tager, J. M. (1982) J. Biol. Chem. 257, 2754-2757.10. Brown, G. C., Hafner, R. P. & Brand, M. D. (1990) Eur. J. Bio-
chem. 188, 321-325.11. Taylor, C. R., Karas, R. H., Weibel, E. R. & Hoppeler, H. (1987)
Respir. Physiol. 69, 7-26.12. Garetto, L. P. & Armstrong, R. B. (1983) J. Exp. Biol. 102, 211-222.13. Armstrong, R. B. & Laughlin, H. M. (1985) J. Appl. Physiol. 59,
1322-1328.14. Armstrong, R. B. & Laughlin, H. M. (1985) J. Exp. Biol. 115,
201-213.15. Harris, K., Walker, P. M., Mickle, D. A. G., Harding, R., Gatley,
R., Wilson, G. J., Kuzon, B., McKee, N. & Romashin, A. D. (1986)Am. J. Physiol. 250, H213-H220.
16. Dobson, G. P., Parkhouse, W. S., Weber, J. M., Stuttard, E.,Harman, J., Snow, D. H. & Hochachka, P. W. (1988) Am. J.Physiol. 255, R513-R519.
17. Black, M. J. & Jones, M. E. (1983) Anal. Biochem. 135, 233-238.18. Costill, D. L., Sharp, R. L., Fink, W. J. & Katz, A. (1982) J. Appl.
Physiol. 53, 1310-1313.19. Hochachka, P. W., Stanley, C., Merkt, J. & Sumar-Kalinowski, J.
(1982) Respir. Physiol. 52, 303-313.20. Suarez, R. K., Brownsey, R. W., Vogl, W., Brown, G. S. &
Hochachka, P. W. (1988) Am. J. Physiol. 255, R699-R702.21. Armstrong, R. B. & Phelps, R. (1984) Am. J. Anat. 171, 259-272.22. Hoppeler, H., Mathieu, O., Krauer, R., Classen, H., Armstrong,
R. B. & Weibel, E. R. (1981) Respir. Physiol. 44, 87-111.23. Thornstensson, A., Sjodin, B., Tesch, P. & Karlsson, J. (1977) Acta
Physiol. Scand. 99, 225-229.24. Ptuegg, J. C. (1986) Calcium in Muscle Activation: A Comparative
Approach (Springer, Berlin), pp. 1-300.25. Spriet, L. L., Matsos, C. G., Peters, S. J., Heigenhauser, G. J. F.
& Jones, N. L. (1985) Am. J. Physiol. 248, C109-C118.26. Spriet, L. L., Heigenhauser, G. J. F. & Jones, N. L. (1986) J. Appl.
Physiol. 60, 410-415.27. Dohm, G. L., Patel, V. K. & Kasperek, G. J. (1986) Biochem. Med.
Metab. Biol. 35, 260-266.28. Donovan, C. M. & Brooks, G. A. (1983) Am. J. Physiol. 244,
E83-E92.29. Hood, D. A., Gosski, J. & Terjung, R. L. (1986) Am. J. Physiol.
250, E449-E456.30. Suarez, R. K., Lighton, J. R. B., Moyes, C. D., Brown, G. S.,
Gass, C. L. & Hochachka, P. W. (1990) Proc. Natl. Acad. Sci. USA87, 9207-9210.
31. Wolfe, R. R., Jahoor, F. & Miyoshi, H. (1988) Am. J. Physiol. 254,E532-E535.
32. Lambert, M. I. & Noakes, T. D. (1989) J. Appl. Physiol. 66,1620-1625.
33. Dudley, G. A., Tuilson, P. C. & Terjung, R. L. (1987) J. Biol.Chem. 262, 9109-9114.
34. Mommsen, T. P. & Hochachka, P. W. (1988) Metabolism 37,552-556.
Proc. Nati. Acad. Sci. USA 88 (1991)