ontario’s grade 6 learners’ mathematics achievement ... · ontario’s grade 6 learners’...
TRANSCRIPT

Ontariorsquos Grade 6 Learnersrsquo Mathematics Achievement Profiles Underlying the EQAO Junior Division Assessment
by
Karen Lyn Coetzee
A thesis submitted in conformity with the requirements for the degree of Master of Arts
Applied Psychology and Human Development University of Toronto
copy Copyright by Karen Lyn Coetzee 2016
ii
Ontariorsquos Grade 6 Learnersrsquo Mathematics Achievement Profiles
Underlying the EQAO Junior Division Assessment
Karen Lyn Coetzee
Master of Arts
Applied Psychology and Human Development
University of Toronto
2016
Abstract
The popular approach of using overly simplistic total scores as the sole indicator of learner
performances in the complex discipline of mathematics restricts the recognition of remedial
needs (Nichols 1994) This study analyzed a random sample of 5000 Grade 6 learner responses
out of 127302 to the 2013-2014 EQAO assessment to better understand mathematical
performances Firstly an Exploratory Factor Analysis was performed to investigate the
dimensionality of the test followed by an investigation of strengths and weaknesses in these
dimensions using a Latent Class Analysis (Collins amp Lanza 2010) Results revealed that the
majority of learners were strong in their ability to apply mathematical knowledge to solve
problems but weak in applying process or thinking skills to do the same This pattern was
consistent regardless of linguistic background These results highlight the urgent need to not
only remediate learnersrsquo mathematical thinking abilities but also future research into this skill
dilemma
iii
Acknowledgments
Firstly many thanks to our Lord God Almighty for health strength and the opportunity to
pursuit this goal To my supervisor Dr Eunice Jang thank you for all the support and endless
patience As well as for sharing your limitless expertise to help me grow in my passion for
assessment and measurement Lastly but definitely not least of all many thanks to my family
To my husband for the love and constant reminder of my capabilities to Owen and Kelsie for
your patience and understanding when I could not spend time with you and my mom for the
endless hours of babysitting
iv
Table of Contents
Acknowledgments iii
Table of Contents iv
List of Tables vi
List of Figures vii
Chapter 1 Introduction 1
Chapter 2 Literature Review 5
21 Largescale Assessments in Education 5
211 Scoring and Reporting Practices of Largescale Assessments 6
212 Test Development Procedures 7
22 Mathematics Education and Curriculum 8
23 Factors Predicting Mathematical Performances 11
Chapter 3 Method 13
31 Participants 13
32 Instrument 14
33 Data Analysis 17
331 Phase 1 Establishing the Dimensionality of the Assessment 17
332 Phase 2 Identifying Mathematical Strengths and Weaknesses 19
333 Phase 3 Predicting Class and Profile Membership 21
Chapter 4 Results 23
41 Dimensionality Characteristics 23
411 Determining the Best Fitting Factor Solution Model 24
42 Mathematical Strengths and Weaknesses 30
43 Predicting Mathematics Profiles by Language and Length of Residence Background 36
Chapter 5 Discussion 38
v
51 What Characterizes the Dimensionality of the EQAO Mathematics Achievement Test
Administered to Grade 6 Students in Ontario Public Schools 38
52 In which Mathematical Dimensions and Related Strands do Students Demonstrate
Strengths and Weaknesses in their Mathematical Achievement 40
53 To What Extent Are Mathematics Performance Profiles Predicted by Student
Background such as Language and Residence Status 42
54 Study Limitations 43
55 Recommendations and Future Research 44
References 49
vi
List of Tables
Table 1 Final Random Sample used for the Analysis 14
Table 2 Knowledge and Skills Categories Strands and Descriptive Statistics of 28 Mathematics
Items 16
Table 3 Six Groups Created Based on ESL and Time Lived in Canada 21
Table 4 Eigenvalues of Correlation Matrix indicating Total Variance Explained
23
Table 5 EFA Model Fit Statistics of the 1 to 3 Factor Solutions on 28 Mathematics Items 25
Table 6 Factor Loadings of the 23 Items used in the Final Three Factor Solution Model 26
Table 7 Promax Factor Correlations Between 3 Factors 27
Table 8 LCA Fit Statistics for 2 3 and 4 Classes 30
Table 9 Item-groups Created to Describe Mathematical Performances of Grade 6 Learners 31
Table 10 Parameter Estimates for Six Groups on 3 Classes 36
vii
List of Figures
Figure 1 Scree plot 24
Figure 2 Three performance profiles of Grade 6 learners in 11 mathematical item-groups 32
1
Chapter 1 Introduction
The teaching and learning of mathematics has long since formed a fundamental part of
the curriculum in educational settings all across the globe As individuals the value we place on
the teaching and learning of this discipline is evident in the way in which we count for babies
even before they can speak or the way in which we delight in the accomplishment of shape
recognition by two year olds The Ontario Curriculum Grades 1-8 Mathematics 2005
document further illustrates the importance of mathematical skills by emphasizing that it equips
students with knowledge skills and habits of mind that are essential for successful and rewarding
participation in information and technology-based societies According to Stokke (2015) strong
mathematical knowledge predicts future academic achievement and is needed in order to be
successful in the workforce Furthermore achievement in this fundamental subject has been
directly related to the career trajectory of an individual (Shapka Domene amp Keating 2006) The
National Council of Teachers of Mathematics (2000) sums up the importance by stating that
mathematical competence opens doors to productive futures while a lack thereof keeps these
doors closed
Despite the obvious importance of mathematical competencies on both an individual and
societal level a declining trend in the performances of learners in this essential discipline has
drawn attention from educators and policymakers around the world This trend seems to be
especially true for Canadian learners as highlighted by the 2012 results of the Programme for
International Student and Assessment (PISA) survey The results of this pencil-and-paper based
test which assesses learnersrsquo abilities to apply mathematical knowledge to solve problems in the
form of real-world contexts (OECD 2016) indicated that although Canadian learners were
2
among the higher performing achievers performance of its 15 year olds declined by 14-points
compared to nine years ago (La Rose 2014)
These results have been further echoed on a provincial level as revealed by the results
produced by the provincial accountability office of Ontario namely the Education Quality and
Accountability Office (EQAO) A report produced by this organization showed that since 2009
the number of Grade 3 and Grade 6 learners to achieve the provincial standard in mathematics
has decreased significantly despite an increase in reading and writing performances over the
same time (EQAO 2014) An even more startling statistic presented in this report is the fact that
only 54 of Ontariorsquos Grade 6 learners achieved the provincial standard in 2014 a decline from
61 in the 2012 assessment The revelation of these results have sent shockwaves throughout
all stakeholder levels in Ontario from government agencies to teachers parents and learners
and have therefore sparked numerous debates and heightened the demand for remedial strategies
Largescale assessments such as the aforementioned PISA and EQAO tests serve
predominantly as tools to satisfy the demand for accountability and educational improvements in
public schooling systems (Chudowsky amp Pellegrino 2003 Rogers 2014) Educators are held
accountable for studentsrsquo academic achievement measured against standards or expectations as
laid out in the curriculum document of a particular discipline of interest School improvement
plans are directed based on the performances of students on these accountability measures In
some cases sanctions associated with the test results raise concerns about narrowing the
curriculum to the tested content as well as educatorsrsquo morale (Jang amp Ryan 2003) Although the
practice of using largescale assessments in education dates back to the 19th century and has
grown exponentially since the implementation of the No Child Left Behind Act (DePascale
3
2003) much controversy exists surrounding their impact on education without pedagogically
useful information concerning what students know and can do with their learning
The generation of a total score to serve as the sole indicator on which to reflect the
overall performances of learners on largescale assessments is a popular approach adopted by
organizations for the purpose of providing feedback to stakeholders (Nichols 1994) Total
scores however have been criticized for providing an overly simplistic representation of learner
abilities which in addition to heightening the risk of result abuse (Earl 1999) and lacks the
necessary insight into learner abilities on which to base any meaningful decisions for the
improvement of education (Nichols 1994 Rogers 2014) For this reason it is argued whether
or not any remedial action based on these results in an attempt to improve mathematical
educational practices can extend beyond anything more than the implantation of blanketed
remedial strategies without further insight
The purpose of this study was therefore to go beyond total scores to gain better insight
into the mathematical performances of Grade 6 learners of Ontario in an attempt to produce
evidence on which to base remediation Using the results of the EQAO provincial assessment
this study aimed to investigate learner strengths and weaknesses in different aspects of
mathematics as determined by an analysis of the dimensionality of the items that make up the
assessment Furthermore this study used language background variables and length of residence
in Canada in an attempt to better identify learners and predict performance profile membership
The responses of a sample of Grade 6 learners to 28 multiple choice mathematics items
on the EQAO provincial assessment were analyzed The following questions were addressed in
this study
4
i What characterizes the dimensionality of the EQAO mathematics achievement
test administered to Grade 6 students in Ontario public schools
ii In which mathematical dimensions and related strands do students demonstrate
strengths and weaknesses in their mathematical achievement
iii To what extent are mathematics performance profiles predicted by student
background such as language and length of residence status
5
Chapter 2 Literature Review
This chapter discusses largescale assessments in education as well as their scoring and
reporting practices This is followed by an overview of mathematics education and its associated
curriculum as well as the factors predicting the performances of learners therein
21 Largescale Assessments in Education
Much of the origin and development of largescale testing in education can be traced back
to 1845 in the United States where they were first implemented in Boston schools and
championed for their use as a superior way to examine pupils (Wilson 2007) Today the
concept of educational testing has expanded into a multi-million-dollar business (Wilson 2007)
with largescale assessments serving as the measurement tool of choice on which to gauge the
system of education (Rogers 2014)
Largescale assessments can be characterized by the way in which they are administered
to large groups of learners simultaneously and in a highly standardized manner (Wilson 2007)
The foundations of these assessments rest on the same ideas as criterion referenced tests and are
classified as standards-based rather than norm-referenced tests (Kaplan amp Saccuzzo 2007) In
other words these largescale standards-based assessments compare the performances of
individuals against specific types of skills tasks or knowledge such as curricular standards or
expectations whereas norm- referenced tests compare each person with a norm and therefore
forces competition among people (Kaplan amp Saccuzzo 2007)
Largescale assessments in education were originally used to sort and classify learners
today they still serve this gatekeeping purpose but are also employed to serve two other
functions to which the majority of attention has shifted namely holding those responsible for the
6
education of learners accountable (accountability) and for the improvement of education
(Chudowsky amp Pellegrino 2003 Nagy 2000) School accountability involves the process of
evaluating school performance on the basis of student performance measures (Figlio amp Loeb
2011) and forms part of the system used by officials in education to monitor the effective
functioning of schools
It can also be characterized as either a high- or low-stakes system which further
differentiates the use of the results For instance according to Rogers (2014) accountability in
Canada is considered to be a low-stakes system and therefore the emphasis is predominantly on
using the results for educational improvement In contrast the United States is considered to be
a high-stakes system as results are used chiefly to sanction and reward schools
Although the use of largescale assessments in education have been credited for providing
an objective ldquoyardstickrdquo on which to measure learnersrsquo performances (Rogers 2014) and for
their ability to simplistically rank individuals along a highly reliable scale (Huff amp Goodman
2010) they have endured much criticism from those within the field Not only has much of this
been centered around their many unintentional consequences such as promotion of teaching to
the test test preparation activities at the expense of instructional time dishonesty among
educators and student drop out (Rogers 2014 Schoenfeld 2007) but also their scoring and
reporting practices and procedures These criticisms have led to much doubt concerning their
effectiveness as a tool to serve the purposes for which they are employed
211 Scoring and Reporting Practices of Largescale Assessments
It is common practice for largescale assessments to be scored using Item Response Theory
or Classical Test Theory in order to generate a total score and to use only these to report the
overall performances of learners on the assessment (Nichols 1994) Although this scoring and
7
reporting procedure is credited for being relatively quick and cost effective (Chudowsky amp
Pellegrino 2003) they serve merely to highlight that there is a problem but provide little
direction as to what the problem is (Nichols 1994) Foster Noyceand Speigel (2007) sum up
the criticism against total scores by stating that although they may reassure a schoolrsquos staff about
student progress or alert them to trouble ahead they do little to inform teachers about how
students are thinking what they understand where they are falling down and how specifically
teachers might change their own instructional practices to address studentsrsquo difficulties
The over simplistic representation of learner performances by total scores therefore lacks
the necessary insight on which to base remedial decisions (Nichols 1994) For this reason the
effectiveness of largescale assessments as a tool for improving education has been questioned
(Rogers 2014) For instance it is expected that educators and principles use results of largescale
assessments to improve their instructional practices (Rogers 2014) however in a study
conducted by Klinger and Rogers (2013) it was discovered that they in fact found little
direction from these results to do so This has led to an increased demand from those within the
field for these assessments to report more than only overall performances in the form of total
scores (Huff amp Goodman 2010 Nichols 1994 Rogers 2014) Detailed information from
assessments can help those in education including teachers and students identify content and
curricular areas that need attention (Schoenfeld 2007) and in so doing aide in the improvement
of education in disciplines where it is needed the most
212 Test Development Procedures
Largescale assessment organisations commonly adopt traditional unidimensional
frameworks to form the basis of test development procedures A unidimensional framework is
one that assumes a single factor or latent variable as an explanation for a certain behaviour such
8
as academic ability (Kaplan amp Saccuzzo 2007) However many curricular in practice today
have been developed on a multidimensional framework such as that of mathematics where
academic ability is assumed to consist of more than one skill or factor
Furthermore test development practices are performed taking into consideration certain
test constraints for instance test format which is usually paper-and-pencil based as well as
administration time For this reason it is impossible to include items to measure all curriculum
expectations in one test (Haertel amp Herman 2005) This sampling process of curriculum
expectations therefore also means that only few items for each expectation are included in the
assessment (Rogers 2014)
In addition to these test development procedures raising construct validity concerns
(Wilson 2007) they limit the reporting of test scores beyond anything more than overall total
scores As highlighted by Rogers (2014) since the assessment was never designed from an
explicit framework in line with that of curriculum expectations from the start as well as include
only a few items targeted at each subdomain it is highly unlikely that the assessment meets the
rigorous test properties needed to allow for reporting anything beyond that of total scores
In order to satisfy the many calls for change to reporting practices assessment
organisations would need to deviate from these traditional more cost effective practices For this
reason Chudowsky and Pellegrino (2003) indicate that change is unlikely to happen soon As a
result our efforts to improve education in disciplines where it is needed the most will continue
to take place within the confinements of that which assessment organisations refuse to change
22 Mathematics Education and Curriculum
The mathematical reform movement generated in the late 1950rsquos signaled the need for the
implementation of better teaching and learning practices for mathematics in schools (Friesen
9
2005) Today many mathematics curricular worldwide including that of Canada are based on
the Principles and Standards for School Mathematics as set out by the National Council of
Teachers of Mathematics (NCTM) (Friesen 2005) Very broadly curriculum refers to the
substance or content of teaching and learning it focusses on the ldquowhatrdquo of teaching and learning
as opposed to the ldquohowrdquo (Stein Remillard amp Smith 2007)
This NCTM document calls for the teaching and learning of mathematics with the goal of
developing both content or procedural knowledge and conceptual understanding of the
discipline through the application of essential thinking or processing skills such as problem
solving or reasoning skills which in turn will be developed (NCTM 2000) This goal for
mathematics education is in stark contrast to that of traditional goals where only the teaching and
learning of procedural or content knowledge was valued and taught through rote teaching and
learning practices (Schoenfeld 2007) Procedural knowledge refers to what and how to solve
certain mathematical problems whereas conceptual understanding refers to why a certain
problem is solved the way it is (Kilpatrick Swafford Findell amp NRC 2001)
Furthermore the NCTM adopted the view that standards play a leading role in guiding
the improvement of mathematics education (NCTM 2000) It therefore highlights specific
mathematical standards or expectations that learners should achieve Specifically five Content
Standards are used to guide the teaching and learning of procedural and conceptual knowledge
namely Number and Operations Algebra Geometry Measurement and Data Analysis and
Probability Five Process Standards also guide the essential processes or thinking skills of
Problem Solving Reasoning and Proof Communication Connections and Representation
(NCTM 2000) The NCTM (2000) repeatedly proclaims the interconnectedness of these
standards by indicating that procedural knowledge should never exist without conceptual
10
understanding which in turn should not be developed without the application and acquisition of
the essential processing skills
The Content and Process Standards are further classified into groups or categories for
assessment purposes in mathematics curricular such as that of Ontario Specifically the Ontario
Curriculum Grades 1-8 Mathematics 2005 document describes four categories of Knowledge
and Understanding Thinking Communication and Application to which the standards are
allocated These four categories are known as the Knowledge and Skills categories and are
reflected in the documentrsquos Achievement Chart The first category of Knowledge and
Understanding can be described as encompassing mathematical knowledge of content and
understanding and therefore focusses predominantly on the achievement of the Content
Standards The remaining three categories focus predominantly on the use of the Process
Standards The Thinking category assesses the use of problem solving reasoning and proving
processes the Communication category focusses on the assessment of the communicating
processes and lastly the Application category focusses on the assessment of the connecting
processes
From the above mathematics curriculum we can see that the knowledge base is still
considered important in mathematics education however so is conceptual understanding and the
application and acquisition of thinking skills As stated by Schoenfeld (2007) anyone who lacks
a solid grasp of facts procedures definitions and concepts is significantly handicapped in
mathematics yet there is more to being mathematically proficient than simply reproducing
standard content on demand Therefore if we are interested in understanding mathematical
proficiency as it is taught and learned today it is important that we reflect learner abilities in all
aspects of the discipline (Kilpatrick et al 2001) In so doing we will gain better insight into
11
their strengths and weaknesses allowing us to remediate accordingly in our efforts to improve
learner performances in this essential discipline
23 Factors Predicting Mathematical Performances
Given the relative importance of mathematics it is no surprise that much research has been
dedicated to highlighting and isolating the number or factors that can influence and predict
mathematical performances By doing so early interventions and remedial strategies can be
better targeted to improve future mathematical success (Hinton 2014)
One such factor that has been given much attention is that of language proficiency and its
influence on mathematical performances Studies conducted by Hinton (2014) Howie (2005)
and Abedi and Lord (2001) for instance discovered that learners who spoke English as a second
language performed worse in mathematical assessments compared to their English proficient
counterparts Fillmore (2007) however cautions against interpreting this as a lack of
mathematical ability without firstly taking into account the aspect of language Since much of
the mathematics taught today is presented in the form of a word problem it relies heavily on a
deep understanding of language (Moschovich 2007) Therefore trying to tease out precisely
how much of the struggle is related to a language issue and how much to an issue with
mathematics is a unique challenge for teachers assessment and English Language Learners
(ELLrsquos) (Fillmore 2007) As highlighted by Moschovich (2007) assessment is certainly a
complex task perhaps especially when working with students who are learning English It is
challenging to decide whether an utterance reflects a studentrsquos conceptual understanding a
studentrsquos proficiency in expressing their ideas in English or a combination of mathematical
understanding and English proficiency
12
Canada has a high and diverse immigrant population for instance 206 of its population
in 2011 was determined to be comprised of immigrants from various countries (Statistics
Canada 2016) Thus the mathematical performances of ELLrsquos cannot be ignored Fortunately
this aspect is currently given attention in the province of Ontario as assessment organizations
such as the EQAO do attempt to report separately on these learnersrsquo performances However
Jang Dunlop Wagner Kim and Gu (2013) warn against treating ELLrsquos as a homogenous group
Their study found that when taking into account the length of residence in Canada
performances of these students varied significantly concerning their reading proficiencies
Therefore if we wish to predict mathematical performances or gain better insight based on
student background such as language factors it is necessary to consider subpopulation groups
that make up the overall ELL population such as length of residence in the country
13
Chapter 3 Method
This chapter describes the participants instrument and data as well as the three main
analyses used to answer the questions presented in this study
31 Participants
The current study used data made available by the Education Quality and Accountability
Office (EQAO) of Ontario The EQAO is an arms-length Ontario government agency that is
responsible for developing and overseeing reading writing and mathematics assessments
administered to Grade 3 6 9 and 10 students in Ontario public schools The purpose of the
results of these largescale assessments is to determine the extent to which learners have achieved
the curriculum standards of the particular discipline for educational accountability and
improvement purposes (EQAO 2016)
Learnersrsquo responses are scored by the EQAO using Classical Test Theory and Item
Response Theory (Rogers 2013) to generate a score that is then converted into a Level NIE 1 2
3 or 4 Level 3 describes a performance at the provincial standard whereas Level 4 a
performance surpassing the standard Level 2 a performance approaching the standard and Level 1
a performance much below the standard Lastly a ldquoNIErdquo rating is generated for those learners
who have not provided sufficient evidence for a Level 1 score The EQAO test scores are reported
using these proficiency levels for each of the areas tested namely reading writing and
mathematics Background information such as gender time lived in Canada and student home
language etc is also collected by questionnaires administered by the EQAO over the same time
The full population data set comprised of approximately 127 302 Grade 6 learnersrsquo
responses to the English 20132014 provincial Junior Division assessment A random sample of
5000 learner responses to the assessment was drawn from the entire data set Learners with
missing data on any of the variables were excluded from the sampling process so that the final
14
data set contained responses to all mathematics items as well as background information All
learners within the sample were enrolled at the time in Grade 6 and attended various schools
across the province Table 1 below presents the distributions of student subgroups from the
random sample based on their gender language background and time spent in Canada in
comparison with the entire population The percentage of learners in each subgroup was very
closely aligned with the larger Grade 6 population and was therefore considered a representative
sample
Table 1
Final Random Sample used for the Analysis
Standard Gender Language Time lived in Canada
Met
Below
Female
Male
Non-
ESL
ESL
CA
Born
Non-CA
born lt 5
years
Non-CA
born ge 5
years
Frequency 2765 2235 2456 2544 4460 540 4493 199 308
Sample 553 447 491 519 892 108 899 4 62
Population 54 46 49 51 887 113 871 4 89
Notes N = 5000 Standard = met the provincial standard or achieved below the provincial standard ESL = enrolled in
English as a Second language program Time lived in Canada = Canadian born learners non-Canadian born learners
who have lived in Canada for less than 5 years and non-Canadian born learners who have lived in Canada for 5 years
or more
32 Instrument
Student responses to the mathematics test items and background information on the EQAO
20132014 Junior Division assessment were used for this study This assessment is a provincially
mandated largescale assessment used by the Ontario government to measure the extent to which
learners have achieved the standards as laid out in the curriculum All the EQAO largescale
assessments are designed using rigorous development procedures and meet high testing standards
with acceptably high reliabilities (Rogers 2013) of above 80 The Junior Division assessment is
15
specifically administered to all Grade 6 learners attending schools within the province of Ontario
during the months of May and June and under highly standardized conditions (EQAO 2016) The
assessment measures reading writing and mathematical skills in each of the corresponding
sections The mathematics section specifically consists of 36 items of which 28 are multiple choice
items and 8 are constructed-response format questions This study included only the 28 multiple
choice items
While the EQAO does not claim to measure the Knowledge and Skills categories as laid out
in the Ontario Curriculum Grades 1-8 Mathematics 2005 document (Rogers 2013) it still
references each of the mathematics items to one of three of the categories namely that of
Knowledge and Understanding Thinking and Application The category of Communication is not
represented by any of the items as according to Rogers (2013) this skill is not feasible to assess in
a paper-and-pencil based test For items to be referenced to the Knowledge and Understanding
category they need to be recognized as requiring students to demonstrate subject specific content
and comprehend its meaning Those referenced to the Application category need to be recognized
as requiring students to select an appropriate mathematical tool and apply the appropriate
information Lastly those referenced to the Thinking category need to be seen as requiring of
students to select and sequence a variety of tools and think critically in order to solve problems
(Rogers 2013) Items are scrutinized by teachers and other content experts for the process of
allocating items to the most appropriate category Items are further referenced to the five content
areas or strands of the curriculum document according to their content topic namely Number Sense
and Numeration Measurement Geometry and Spatial Sense Patterning and Algebra and Data
Management and Probability
Table 2 shows the representation of each of the Knowledge and Skills categories and the
strands to which the 28 multiple choice items were referenced by the EQAO as well as the item
difficulties (p-values) and discrimination indices (pt-biserial correlations) for each of these items
According to Kaplan and Saccuzzo (2007) item difficulty values should range from 30 to 70 to
16
maximize information about the differences among individuals Furthermore item discriminability
values should not be negative or below 20 to be considered adequate Based on these
recommendations all 28 items were considered suitable to be included in the analyses of this study
Table 2
Knowledge and Skills Categories Strands and Descriptive Statistics of 28 Mathematics Items
Item Know amp Skill Strand p-value pt-biserial
1 K and U Patterning amp Algebra 86 39
14 K and U Patterning amp Algebra 74 43
3 K and U Number Sense amp Numeration 76 37
15 K and U Number Sense amp Numeration 86 35
9 K and U Data Management amp Probability 48 33
19 K and U Measurement 50 27
25 K and U Measurement 76 40
22 K and U Geometry amp Spatial Sense 87 34
73 36
11 App Patterning amp Algebra 81 43
24 App Patterning amp Algebra 70 37
26 App Patterning amp Algebra 40 30
5 App Number Sense amp Numeration 56 38
7 App Number Sense amp Numeration 82 30
10 App Data Management amp Probability 55 47
18 App Data Management amp Probability 78 47
23 App Data Management amp Probability 71 42
2 App Measurement 59 31
8 App Measurement 58 28
20 App Measurement 54 47
6 App Geometry amp Spatial Sense 68 38
64 38
17 Think Patterning amp Algebra 52 36
21 Think Number Sense amp Numeration 57 22
28 Think Number Sense amp Numeration 69 33
4 Think Data Management amp Probability 46 35
13 Think Measurement 54 39
27 Think Measurement 41 46
12 Think Geometry amp Spatial Sense 42 35
16 Think Geometry amp Spatial Sense 54 34
52 35
Notes K and U = Knowledge amp Understanding App = Application Think = Thinking p-value and pt-biserial means
for each Knowledge amp Skill category represented in bold
17
No items had p-values below 30 however 10 items had difficulty values above 70
indicating that they were relatively easy for this sample Since none of the p-values were above
90 they were considered to still possess sufficient variability to be included in the analyses
Furthermore no items had values below the recommended 20 or negative pt-biserial values Table
2 further highlights the item difficulty and discrimination means for each of the three categories
From these values it can be concluded that the items referenced to the Knowledge and
Understanding category were relatively more easy for this sample while those items referenced to
the Thinking category more difficult and those referenced to the Application category moderately
difficult Lastly it is highlighted that a greater number of items represented the Application
category (12 items) than the Knowledge and Understanding and Thinking category which had an
equal number of eight items
33 Data Analysis
The data analyses involved three phases each of which addressed one of the three questions
asked in this study The first phase used Exploratory Factor Analysis (EFA) approaches to
examine the first research question ldquoWhat characterizes the dimensionality of the EQAO
mathematics achievement test administered to Grade 6 students in Ontario public schoolsrdquo
Latent Class Analysis (LCA) approaches were used in the second phase in order to answer question
two ldquoIn which mathematical dimensions and related strands do students demonstrate strengths and
weaknesses in their mathematical achievementrdquo A multinomial logistic regression analysis was
performed to examine research question three ldquoTo what extent are mathematics performance
profiles predicted by student background such as language and length of residence statusrdquo
331 Phase 1 Establishing the Dimensionality of the Assessment
An Exploratory Factor Analysis (EFA) was conducted in order to determine the
dimensionality of the EQAO Grade 6 mathematics test based on 5000 studentsrsquo responses to 28
multiple choice items Although exploratory in nature the EFA was used to examine the extent
18
to which the test dimensionality can be accounted for by knowledge and skills and further by the
strand specified by the EQAO
EFA is a statistical procedure that simplifies the process of visually inspecting a range of
correlations in order to examine the dimensionality of measures (Furr 2011) The 28 multiple
choice items were firstly recoded as binary data thus creating dichotomous categories (0 =
incorrect responses and 1 = correct responses) In order to perform an EFA with this type of
data a more sophisticated statistical software package is required The reason for this being that
standard software such as IBMrsquos SPSS (version 230) creates correlation matrices suitable only
for continuous data that assume a normal distribution (Uebersax 2015) Therefore MPLUS
version 612 (Mutheacuten amp Mutheacuten 1998-2012) was used for the analysis so that a tetrachoric
correlation matrix could be generated to suite the binary data used in this study
When conducting an EFA in Mplus a correlation matrix eigenvalues and model fitting
statistics such as the chi-square test Root Mean Square Error of Approximation (RMSEA) and
Root Mean Square Residual (RMSR) are produced in order to assist with the process of
determining the solution that best fits the data A good fitting model will be represented by a
non-significant chi-square p-value as well as a RMSEA value and RMSR value of below 05
(Schumacker amp Lomax 2004) However interpretability of the model should also be taken into
consideration when deciding on the best solution (Meyers Gamst amp Guarino 2013) The
weighted least-squares with mean (wlsm) estimation method as recommended by Mutheacuten and
Mutheacuten (1998-2012) for binary data and the oblique rotation method (Promax) was used for this
analysis based on the assumption that factors are likely to be correlated with each other
Four steps were implemented during this phase The first step entailed determining the
ideal number of factors to be extracted to best describe the data This entailed a combined
evaluation of the correlation matrix eigenvalues scree plot and fit statistics as described above
The next step entailed an evaluation of the items and their loadings on each of the factors to
determine if any should be discarded in terms of low factor loadings or cross-loadings If any
19
items were deemed unacceptable these were removed and the analysis re-run and subsequently
re-evaluated This step was repeated until a final and appropriate factor solution model was
obtained Following this the reliability for each factor was established followed by an
investigation of the factor correlations in order to determine the uniqueness of each extracted
dimension Ideally items should correlate highly with each other within each extracted
factordimension however for each dimension to be considered unique between-factor
correlations should be low (Rogers 2014) According to Meyers et al (2013) between-factor
correlations should not exceed 80 to warrant the use of a separate dimension The last step
involved an investigation of the similarities between items in each factor in order to describe the
items that make up each This was done firstly in terms of the three Knowledge and Skills
categories and secondly the five strands to which the items were referenced as well as any
further content similarities
332 Phase 2 Identifying Mathematical Strengths and Weaknesses
In an attempt to identify in which mathematical subdomains or dimensions and related
strands learner performances were strongest and weakest as asked in question two of this study a
Latent Class Analysis (LCA) was performed using MPLUS version 612 (Mutheacuten amp Mutheacuten
1998-2012)
Specifically the goal of a mixture model is to reveal unobserved heterogeneous and
meaningful population groups within the larger homogenous population by identifying similarities
in their responses to measured variables (Nylund Asparouhov amp Mutheacuten 2007) These identified
latent populations or sub-groups are called classes Therefore using this analysis allowed for the
generation of distinct performance profiles for each sub-group or class identified as performing
similarly in the largescale assessment In this way more accurate class specific strengths and
weaknesses could be described as opposed to simply those of the overall Grade 6 population
20
For an LCA the outcome variables used are specifically categorical (Nylund et al 2007)
Therefore dichotomously scored response data from the random sample of 5000 students were
used for the LCA The LCA approach is exploratory in nature because the optimal number of
classes representing all latent classes cannot be determined apriori (Nylund et al 2007) Therefore
an investigation of relevant fit statistics generated by the LCA was firstly conducted According to
Pastor Barron Miller and Davis (2007) the fit statistics commonly used to determine the optimum
number of classes include the Bayesian Information Criterion (BIC) the sample-size adjusted BIC
and the Akaike Information Criterion (AIC) where lower values indicate a better fitting model An
Entropy statistic is also commonly used to determine model fit This statistic ranges from 0 to 1
where values closest to 1 indicate higher classification accuracy
Following the identification of the best fitting model the entire sample was profiled in
terms of distinct mathematics classes In order to reduce the number of points on these profiles
items were grouped according to the strand to which they were referenced by EQAO within each
identified factor This allowed for the identification of learner strengths and weaknesses not only
surrounding factors but also each strand within each factor
As part of the LCA mean item probability scores are calculated for each class This statistic
indicates the mean probability for each class to respond correctly to an item and therefore ranges
from 0 to 1 (Nylund et al 2007) Values closest to one therefore indicate a higher probability of
responding correctly to an item Using these values for each item average item-group probability
scores were calculated and these values were then used to describe class specific strengths and
weaknesses This was done firstly by describing overall item-group performances in comparison
to other classes and secondly by describing class performances in each specific factor overall and
lastly in terms of each strand within each factor
21
333 Phase 3 Predicting Class and Profile Membership
In order to answer question three concerning whether or not English as a second language
and length of residence in Canada significantly predicted the performance profile to which a
learner belongs a multinomial logistics regression analysis was conducted This phase was
completed using IBMrsquos SPSS (version 230)
A multinomial logistic regression is used when the dependent variable for the analysis
consists of more than two categorical levels (Meyers et al 2013) Besides the item probability
mean generated by the LCA a class probability mean for each learner in the sample is also
calculated as part of the analysis This class probability indicates the likelihood of a learner
belonging to each of the classes or performance profiles Based on the highest class probability
learners were allocated to one of the performance profiles as generated in phase 2 These classes
were coded 1 2 3 etc based on the number of classes determined to best describe the sample and
represented the dependent or predicted variable of the analysis
Table 3
Six Groups Created Based on English as Second Language and Time Lived in Canada
Group Language Time lived in Canada n
1 Non-ESL CA born 4185 837
2 ESL CA born 308 62
3 Non-ESL Non-CA born lt 5 years 76 15
4 ESL Non-CA born lt 5 years 123 25
5 Non-ESL Non-CA born ge 5 years 199 40
6 ESL Non-CA born ge 5 years 109 22
Notes N = 5000 ESL = English as a second language learner CA born = Born in Canada
An independent variable used for predicting the latent class membership included six
groups based on the following background variables English Second Language (ESL) status as
22
well as whether or not they were Canadian born non-Canadian born but at the time had resided in
the country for less than 5 years or non-Canadian born but at the time had resided in the country for
five years or more This was done in order to avoid clustering ELL learners as a homogenous group
and therefore better identify learners These six categorical data groups represented the predictor
or independent variable Table 3 indicates more precisely how each of the groups were created as
well as their sizes
23
Chapter 4 Results
The results of this study are discussed according to the three questions presented and phases
of data analyses as discussed in Chapter 3 Firstly the results produced from the Exploratory
Factor Analysis (EFA) described in phase one concerning question one are reported Secondly
those produced by the Latent Class Analysis (LCA) in phase two to answer question two and lastly
those produced from the multinomial logistics regression analysis conducted in phase three to
answer question three are presented in this chapter
41 Dimensionality Characteristics
As noted an EFA was conducted on the 28 multiple choice mathematics items in order to
determine the dimensionality of the largescale assessment to which they belonged The
eigenvalues of the tetrachoric correlation matrix (Table 4) produced by Mplus ranged between
862 and 41 the first three factors showed eigenvalues greater than 1 and accounted for 3953 of
the total variance
Table 4
Eigenvalues of Correlation Matrix indicating Total Variance Explained
Item Eigenvalue Item Eigenvalue Item Eigenvalue Item Eigenvalue
1 86 2 13 3 10 4 93
5 91 6 90 7 87 8 85
9 84 10 80 11 79 12 76
13 74 14 72 15 70 16 69
17 66 18 65 19 64 20 63
21 60 22 57 23 53 24 52
25 50 26 49 27 46 28 41
24
411 Determining the Best Fitting Factor Solution Model
The eigenvalues scree plot and fit statistics were used to determine the best number of
factors to describe this data set Based on the ldquonumber of eigenvalues greater and equal to one
rulerdquo as suggested by Meyers et al (2013) together with the scree plot and relevant fit statistics it
seemed adequate to extract three factors albeit accounting for less than 50 of the variance
Figure 1 Scree plot
Although three eigenvalues were produced greater and equal to one suggesting the
existence of three factors this was contradicted by the scree plot (Figure 1) which suggested the
existence of only two factors as it appeared to level off mostly at number three Subsequently a
comparison of the one to three factor solutions was conducted in terms of the relevant fit statistics
as described in Table 5
The significant chi-square p-values (lt 001) generated for the one and two factor solutions
suggested that the data differed significantly from the model matrix Although the chi-square p-
value has been criticized in the past for being overly sensitive to large sample sizes and therefore
0
05
1
15
2
25
3
35
4
45
5
55
6
65
7
75
8
85
9
1 2 3 4 5 6 7 8 9 10 11 12 13 14 15 16 17 18 19 20 21 22 23 24 25 26 27 28
Eig
envalu
es
Items
25
almost always producing a significant value (Meyers et al 2013) this was determined not to be the
case for this analysis as the p-value generated in the three factor model increased substantially
from the one to two factor model thus ensuring the reliability of this value
Table 5
EFA Model Fit Statistics of the 1 to 3 Factor Solutions on 28 Mathematics Items
FA model Chi-Square df p-value RMSEA RMSR
1 92476 350 lt 001 018 031
2 44012 323 lt001 009 021
3 34390 297 032 006 019
Note N = 5000
Therefore since the Chi-square p-value of 032 of the three factor model was not significant
(at the 001 probability level) as well as the fact that only two items represented the fourth factor in
the four factor solution model it was deemed a good fitting model The values of 006 and 019 of
the RMSEA and RMSR respectively were well below the 05 recommended value providing
further support for this three factor solution model
A further inspection of the factor loadings from the three-factor solution as well as of the
items on each factor resulted in the removal of four items (ie 12 18 23 and 24) Items 18 23 and
24 were discarded as a result of low factor loading scores below 30 Whereas a decision was made
to remove Item 12 as it was the only item referenced to the Thinking category that did not load on
the factors in the same way that the others did Table 6 presents the final factor loadings with the
Knowledge and Skills categories to which items were originally allocated by the EQAO that is
knowledge and understanding application and thinking
The Promax factor correlation matrix produced by Mplus (Table 7) revealed that all three
factors correlated positively and moderately to high with one another The strongest correlation
26
existed between Factor 1 and Factor 3 with a relatively high coefficient value of 747 while the
weakest correlation existed between Factor 1 and Factor 2 with a coefficient of 576
Table 6
Factor Loadings of the 23 Items used in the Final 3 Factor Solution Model
Item Knowledge amp Skill Factor 1 Factor 2 Factor 3
1 KU 64 -09 13
11 App 63 -04 12
14 KU 55 13 01
6 App 51 12 -04
15 KU 51 -05 14
10 App 47 23 05
7 App 45 -12 13
25 KU 38 09 17
3 KU 35 -01 24
9 KU 35 09 07
22 KU 31 07 23
5 APP 30 09 22
13 App 10 65 -05
27 Think -04 63 23
2 Think -07 50 12
20 App 14 -03 59
17 Think -04 04 55
26 App 13 01 33
8 App 11 -01 32
28 Think 15 03 32
16 Think 11 10 31
4 Think 14 12 30
21 Think -04 08 30
α = 725 α = 536 α = 565
Notes KU = Knowledge and Understanding App = Application Think = Thinking category
As stated earlier according to Meyers et al (2013) correlations should not exceed 80 to warrant
the use of separate factors These results are therefore considered to reveal the existence of three
27
unique factors that can be used to describe the multidimensionality of these mathematics multiple
choice items
Table 7
Promax Factor Correlations Between 3 Factors
Factors FA 1 FA 2
Factor 1
Factor 2 576
Factor 3 747 626
Note N = 5000
As indicated in Table 6 Factor 1 consisted of 12 items in total with factor loading scores
ranging between 30 and 64 and achieved a relatively high Cronbachrsquos alpha of 725 All seven
items referenced to the Knowledge and Understanding category used in the final model loaded
together on Factor 1 along with five items referenced to the Application category Factor 2
consisted of only three items with factor loading scores ranging between 50 and 63 and
achieved a moderate Cronbachrsquos alpha of 536 In Factor 2 two items referenced to the Thinking
category and one to the Application category loaded together to make up the total of three items
for this factor Lastly Factor 3 consisted of a total of eight items with factor loading scores
ranging between 30 and 59 and also achieved a moderate Cronbachrsquos alpha score of 565 The
remaining five items referenced to the Thinking category and three items referenced to the
Application category loaded together to make up the eight items that loaded together on Factor 3
In terms of the strands to which the items in Factor 1 were referenced for instance
Patterning and Algebra etc no clear similarities appeared to exist to tie all the items together
based on this However similarities seemed to exist in terms of the applied skill requested of
learners to solve the mathematical problems It appeared that all the items of this factor merely
requested of learners to apply their mathematical knowledge in terms of procedures and
conceptual understanding to answer the questions For instance Item 15 which is referenced to
28
the Knowledge and Understanding category asks the following ldquoWhat is the value of 0730 ndash
0156rdquo Whereas Item 5 which is referenced to the Application category asks that learners
solve problems involving the addition of decimal numbers (the exact question was not released)
Therefore it was determined that no clear difference existed between the applied skill requested
from these two items even though they were referenced to two different Knowledge and Skills
categories It was therefore concluded that Factor 1 could be described as measuring the
application of mathematical knowledge to solve problems in various strands
An inspection of the items that loaded together on Factor 2 revealed that two of the items
were referenced to the Thinking category while one of the items was referenced to the
Application category Furthermore all three items were similar in that that they covered the
ldquoMeasurementrdquo strand and more specifically that all three items requested of learners to solve
problems relating to ldquoAreardquo Item 2 for instance asks ldquoThe parallelogram below will be cut
into two congruent triangles (provides dimensions) What is the area of one of the trianglesrdquo
Item 13 asks ldquoWhich of the following shows a rectangle and a triangle that have the same areardquo
and lastly Item 27 requests that learners compare the areas of two polygons (exact item not
released) Item 2 was referenced to the Application category whereas Items 13 and 27 were
referenced to the Thinking category It was therefore determined that Factor 2 could be
described as requesting of learners to apply thinking processes or skills such as problem solving
and reasoning in order to solve deeper mathematical problems specifically surrounding the
Measurement topic of ldquoAreardquo
Lastly for Factor 3 as with Factor 1 no clear similarities appeared to exist to tie all the
items together based on strands However as with Factor 1 similarities seemed to exist in terms
of the applied skill requested of learners to solve the mathematical problems It appeared that
all the items on this factor requested of learners to apply thinking skills to solve deeper
mathematical problems surrounding various strands in other words learners had to go beyond
the mere application of content knowledge to solve these items For instance Item 20 referenced
29
to the Application category requested that learners solve the following problem ldquoEach beaker of
water below has a capacity of 2L Which beaker appears to have about 500ml of water in itrdquo
Whereas Item 28 referenced to the Thinking category asks ldquoMrs Garrett sends surveys to 120
students and 78 students return the survey Which statement best describes the percent of
students who return the surveyrdquo Again no clear difference appeared to exist between the
applied skill requested of learners in terms of the Application and Thinking categories to which
the items were referenced It was therefore concluded that Factor 3 could be described as
measuring the ability of learners to apply thinking processes or skills such as problem solving
and reasoning in order to solve deeper mathematical problems in various strands
In sum the results of the EFA determined that a three factor model could be used to
adequately characterize the dimensionality of the multiple choice mathematics items on the
EQAO assessment Twelve items clustered adequately together in terms of factor loading scores
to form Factor 1 which achieved a relatively high Cronbachrsquos alpha of 725 three items on
Factor 2 which achieved a moderate Cronbachrsquos alpha of 536 and lastly eight items on Factor
3 which also achieved a moderate Cronbachrsquos alpha score of 565 Upon closer inspection of
the items on each factor and in terms of the Knowledge and Skills categories and strands to
which they were referenced by the EQAO it was determined that Factor 1 could be best
described as measuring the ability of learners to apply mathematical knowledge related to
procedural and conceptual understanding in order to solve problems in various mathematical
strands Factor 2 could be best described as measuring the ability of learners to apply process
or thinking skills in order to solve problems related specifically to the topic of ldquoAreardquo
Lastly Factor 3 could be best described as measuring the ability of learners to apply thinking
skills in various mathematical strands
30
42 Mathematical Strengths and Weaknesses
In an attempt to identify in which mathematical dimensions and related strands Grade 6
learner performances were strongest and weakest as asked in question two of this study a Latent
Class Analysis (LCA) was conducted This allowed for distinct performance profiles to be
generated for classes or sub-groups performing similarly in the population and therefore allowed
for more accurate descriptions of strengths and weaknesses The factors as established in the
dimensionality investigation in Phase 1 of this study were used to represent the dimensions for this
analysis
Although the four class model achieved the lowest AIC BIC and Sample-Size Adjusted
BIC statistic values in comparison to the two and three class model it also produced a much lower
Entropy value of 69 (see Table 8) Therefore it was decided that since these statistics did not
decrease that much from the three class to four class model the use of the four class model with a
much lower Entropy value did not seem warranted Thus the three class model was opted for
instead as it produced lower fit statistics than the two class model as well as a sufficiently high
Entropy value of 75 Furthermore the results indicated that each class was represented by the
following proportion of learners from the sample Class 1 comprised of 321 Class 2 of 452
and Class 3 of 227
Table 8
LCA Fit Statistics for 2 3 and 4 Classes
Fit statistics 2 Classes 3 Classes 4 Classes
AIC 12974224 12808557 12789120
BIC 13004854 12854829 12851034
Adj BIC 12989919 12832268 12820846
Entropy 81 75 69
Notes N = 5000 AIC = Akaike Information Criterion BIC = Bayesian Information Criterion Adj BIC = Sample-
Size Adjusted Bayesian Information Criterion
31
Eleven item-groups were created to describe the strengths and weaknesses of the three
classes as represented in Table 9 Item-groups were created by grouping items according to the
factor they were determined to measure (as established in the EFA) as well as the strand to which
they were allocated by the EQAO Five item-groups were created for Factor 1 one item-group for
Factor 2 and five groups for Factor 3 The number of items within each item-group varied from 1
item to 4 items The mean probability scores calculated for each class for each item-group and
overall dimension or factor are also represented in Table 9 These mean item-group probability
scores as presented in Table 9 were used to plot three distinct performance profiles for each class as
represented in Figure 2 below
Table 9
Item-Groups created to Describe Mathematical Performances of Grade 6 Learners
Factor Content Area of items Class 1 Class 2 Class 3
1 Patterning amp Algebra 3 97 86 48
1 Measurement 1 95 78 44
1 Geometry amp Spatial Sense 2 94 79 50
1 Number Sense amp Numeration 4 92 76 49
1 Data Management amp Probability 2 78 49 19
Factor 1 class probability means 91 74 44
2 Measurement (Area) 3 85 39 28
Factor 2 class probability means 85 39 28
3 Patterning amp Algebra 2 67 43 20
3 Measurement 2 79 55 25
3 Geometry amp Spatial Sense 1 79 47 31
3 Number Sense amp Numeration 2 80 60 44
3 Data Management amp Probability 1 72 40 22
Factor 3 class probability means 76 51 29
Note The factor probability means presented in bold are slightly higher as the actual item probability score was used
to calculate these values and not the item-group probability scores
Using the evidence generated from the mean item-group and factor probability scores as
represented in Table 9 and Figure 2 these performance profiles were used to describe the strengths
32
and weaknesses of each class Class specific strengths and weaknesses were described according
to firstly overall performances in the 11 item-groups in comparison to the other classes secondly
in terms of overall performances in each dimension (Factor 1 2 and 3) and lastly in terms of
performances in each strand within each dimension for Factor 1 and 3 only (as Factor 2 only
represented Measurement topic of ldquoAreardquo) A mean item-group probability score ranging from 86
- 10 was described as especially strong 71 - 85 as strong and 56 - 70 as moderately strong
while those scores ranging from 41 - 55 were described as moderately weak 26 - 40 as
moderately weak and 25 and below as especially weak
Figure 2 Three performance profiles of Grade 6 learners in 11 mathematical item-groups
Results indicated that those learners most likely to belong to Class 1 performed higher than
Class 2 and 3 in all item-groups Therefore this class to which 321 of learners from the sample
belonged can be best described as the highest performing and second largest group overall Those
most likely to belong to this class can be described as having an especially strong ability to apply
0
01
02
03
04
05
06
07
08
09
1
Item
-Gro
up
Mea
n P
rob
ab
ilit
y
Item-Groups
Class 1 (321) Class 2 (452) Class 3 (227)
33
mathematical knowledge in order to solve problems in various strands This was determined by the
average 91 overall probability for success achieved for those items related to Factor 1 They can
also be described as having a strong ability to apply thinking skills in order to solve problems
surrounding the Measurement topic of ldquoAreardquo and strong ability to do the same in various strands
This was determined by the 85 probability for success achieved for those items related to Factor
2 and 76 probability for success achieved for those related to Factor 3 Furthermore their overall
performances in the knowledge dimension can be described as stronger in comparison to their
performances in the thinking dimensions
Specifically concerning their ability to apply mathematical knowledge in various strands
(Factor 1) these learners can be described as performing slightly stronger in the Patterning and
Algebra (item-group probability score = 97) and considerably weaker in Data Management and
Probability (item-group probability score = 78) in relation to their performances in the other
strands Specifically regarding their ability to apply think skills in order to solve problems (Factor
3) they can be described as performing slightly stronger in Number Sense and Numeration (item-
group probability score = 80) and considerably weaker in Data Management and Probability (item-
group probability score = 72) and Patterning and Algebra (item-group probability score = 67) with
the latter being the weakest in relation to their performances in the other strands
Results further indicated that those learners most likely to belong to Class 2 performed
overall lower than Class 1 but higher than Class 3 in all item-groups Therefore this class to
which 452 of the learners belonged can be best described as the intermediate performing and
largest group overall Those most likely to belong to this class can be described as having a strong
ability to apply mathematical knowledge in order to solve problems in various strands This was
determined by the average 74 overall probability for success achieved for those items related to
Factor 1 They can also be described as having a weak ability to apply thinking skills in order to
solve problems surrounding the Measurement topic of ldquoAreardquo and moderately weak ability to do
the same in various strands This was determined by the 39 probability for success achieved for
34
those items related to Factor 2 and 51 probability for success achieved for those related to Factor
3 Furthermore their overall performances in the knowledge dimension can be described as
stronger in comparison to their performances in the thinking dimensions
Specifically concerning their ability to apply mathematical knowledge in various strands
(Factor 1) performances for these learners can be described as considerably stronger in Patterning
and Algebra (item-group probability score = 86) and considerably weaker in Data Management
and Probability (item-group probability score = 49) in relation to their performances in the other
strands Specifically regarding their ability to apply thinking skills in order to solve problems
(Factor 3) performances can be described as stronger in Number Sense and Numeration (item-
group probability score = 60) and considerably weaker in Data Management and Probability (item-
group probability score = 40) and Patterning and Algebra (item-group probability score = 43) with
the former being the weakest in relation to their performances in the other strands
Lastly results indicated that those learners most likely to belong to Class 3 performed lower
than Class 1 and 2 in all item-groups Therefore this class to which 227 of learners belonged
can be best described as the lowest performing group overall Those most likely to belong to this
class can be described as having a moderately weak ability to apply mathematical knowledge in
order to solve problems in various strands This was determined by the average 44 overall
probability for success achieved for those items related to Factor 1 They can also be described as
having a weak ability to apply thinking skills in order to solve problems surrounding the
Measurement topic of ldquoAreardquo and weak ability to do the same in various strands This was
determined by the 28 probability for success achieved for those items related to Factor 2 and
29 probability for success achieved for those related to Factor 3 Furthermore their overall
performances in the knowledge dimension can be described as stronger in comparison to their
performances in the thinking dimensions
Specifically concerning their ability to apply mathematical knowledge in various strands
(Factor 1) it was determined that these learners can be described as performing slightly stronger in
35
Geometry and Spatial Sense (item-group probability score = 50) and considerably weaker in Data
Management and Probability (item-group probability score = 19) in relation to their performances
in the other strands Specifically regarding their ability to apply thinking skills in order to solve
problems (Factor 3) their performance can be described as considerably stronger in Number Sense
and Numeration (item-group probability score = 44) and weaker in Data Management and
Probability (item-group probability score = 22) and Patterning and Algebra (item-group
probability score = 20) with the latter being the weakest in relation to their performances in the
other strands
In sum the results of the LCA revealed that three classes could be used to best describe the
performances of Grade 6 learners in the three dimensions as established during the EFA and their
related strands Class 1 was described as the highest performing and second largest group The
learners in the class were described as performing especially strong in Factor 1 (namely their
ability to apply mathematical knowledge to solve problems in various strands) strong in Factor 2
(namely their ability to apply thinking skills to solve problems specifically related to the
Measurement topic of ldquoAreardquo) and in Factor 3 (namely their ability to apply thinking skills in order
to solve problems in various strands) Class 2 was described as the intermediate performing and
largest group and performing strong for Factor 1 weak for Factor 2 and moderately weak for
Factor 3 Lastly Class 3 was described as the lowest performing and smallest group and
performing moderately weak for Factor 1 and weak for both Factor 2 and 3 For all classes overall
factor performances were described as weaker in the thinking dimensions namely Factor 2 and 3
than in the knowledge dimension namely Factor 1 A greater discrepancy between these
mathematical knowledges and thinking skills dimensions appears to exist for those in Class 2 than
for those in Class 1 and 3
Lastly in terms of describing the performances of each class in the strands related to each
factor for Factor 1 and 3 results revealed clear similarities between all classes in terms of those in
which performances were described as weaker For all classes regarding Factor 1 their ability to
36
apply mathematical knowledge within the Data Management and Probability strand was described
as the weakest in relation to the other strands For all classes regarding Factor 3 their ability to
apply thinking skills in the Patterning and Algebra and Data Management and Probability strand
was described as weakest in relation to their performances in the other strands
43 Predicting Mathematics Profiles by Language and Length of Residence Background
To avoid treating learners as homogenous groups based on their language background they
were allocated to one of six groups according to their ESL designation and length of residency in
Canada The six groups represented the predictor variable (independent variable) whereas the three
classes or performance profiles were treated as the predicted or dependent variable Class 1
namely the highest performing profile group was used as the reference category
Results of this analysis indicated that the final model did not significantly predict class and
performance profile membership with a -2 Log likelihood of 7740 and a Chi-square value of 957
(10 N = 5000) p = 48 The upper portion of Table 10 presents the regression coefficients the
Wald test adjusted odds ratio [Exp(B)] and the 95 confidence intervals (CI) for odds ratios for
the predictor contrasting Class 2 to Class 1 The lower portion of the table presents the regression
coefficients the Wald test adjusted odds ratio [Exp(B)] and the 95 confidence intervals (CI) for
odds ratios for the predictor contrasting Class 3 to Class 1
Results therefore revealed that ESL status and residence in Canada did not significantly
predict class or profile membership regardless of group allocation In other words regardless of
group allocation learners were found to be equally likely to belong to either Class 1 (highest
performing group) Class 2 (intermediate performing group) or Class 3 (lowest performing group)
and therefore perform according to the related profile as indicated earlier in Figure 2
37
Table 10
Parameter Estimates for Six Groups on 3 Classes
Model B SE - B Wald df Exp(B) 95 CI EXP (B)
Class 2
Intercept 43 23 351 1
Group 1 -07 23 09 1 93 60 ndash 147
Group 2 06 26 06 1 107 64 ndash 178
Group 3 -60 35 296 1 55 277 ndash 109
Group 4 01 31 00 1 101 55 ndash 183
Group 5 -08 28 09 1 92 54 ndash 158
Class 3
Intercept -13 26 27 1
Group 1 -23 26 74 1 80 48 ndash 133
Group 2 -20 31 42 1 82 47 ndash 149
Group 3 -36 39 84 1 70 33 ndash 150
Group 4 -35 37 92 1 70 34 ndash 144
Group 5 -53 33 255 1 59 31 ndash 113
Notes p lt 001 N = 5000 Class 1 is the reference category Group 1 = Non-ESL CA Born (n = 4185) Group 2 =
ESL CA Born (n = 308) Group 3 = Non-ESL Non-CA born but living in country less than 5 years (n = 76) Group 4
= ESL Non-CA born but living in country less than 5 years (n = 123) Group 5 = Non-ESL Non-CA born but living in
country 5 years or more (n = 199) Group 6 = ESL Non-CA born but living in country 5 years or more (n = 109)
38
Chapter 5 Discussion
The purpose of this study was to move beyond the total scores of a largescale assessment
in order to gain better insight into the mathematical performances of Ontariorsquos Grade 6 learners
In doing so it aimed to provide evidence of learner strengths and weaknesses in different aspects
of mathematics education on which to base remedial decisions for the improvement thereof
Using the responses of a random sample of 5000 Grade 6 learners to 28 multiple choice
mathematics items on the 20132014 EQAO Junior Division assessment an Exploratory Factor
Analysis (EFA) was firstly performed in order to investigate the dimensionality characteristics
of the assessment This was followed by a Latent Class Analysis (LCA) to determine learner
strengths and weaknesses related to the established mathematical dimensions and their related
strands Lastly a multinomial logistic regression analysis was performed in order to examine the
extent to which mathematics performance profiles were predicted by student background factors
such as language and length of residency in Canada This chapter discusses the findings of these
analyses study limitations and lastly recommendations for future research and education
51 What Characterizes the Dimensionality of the EQAO Mathematics Achievement Test Administered to Grade 6 Students in Ontario Public Schools
The multiple choice mathematics items on the EQAO assessment were characterized as
measuring the ability of learners in three interrelated yet separate mathematical dimensions
These being the ability of learners to apply mathematical knowledge related to procedural
knowledge and conceptual understanding to solve problems in various strands (Factor 1) the
ability to apply process or thinking skills such as problem solving or reasoning skills to solve
problems in ldquoAreardquo (Factor 2) and lastly the ability to apply process or thinking skills to solve
39
problems in various mathematical strands The three factors produced achieved on average
moderate reliability scores
These findings regarding the characteristics of the dimensions were considered valuable
as they allowed for the comparison of learner abilities in two essential elements of mathematical
proficiency as aligned with the Principles and Standards for School Mathematics (NCTM
2000) and as a result also with the Ontario mathematics curriculum which shares the same
foundations Only once this happens namely learner ability measured directly in relation with
mathematical curriculum expectations can we begin an effective process of remediation
(Kilpatrick et al 2001) These elements were that of mathematical knowledge consisting of
procedural and conceptual knowledge as measured by Factor 1 of this study and process or
thinking skills such as problem solving and reasoning as measured by Factor 2 and 3 Factor 2
and 3 were determined to differ based solely on the content of the items included in the
assessment This finding highlights concerns regarding the fair representation of all curriculum
expectations on the assessment and thus warrants further investigation
The fact that the ability to apply mathematical knowledge and the ability to apply
thinking skills in order to solve mathematical problems were found to be sufficiently unique
dimensions to warrant their use using the multiple choice items on this largescale mathematics
assessment adds further value to the findings of this study These findings are valuable in that
they attest to the future potential for assessment organizations to report learner performances
beyond that of total scores as demanded by those in the educational field However since the
factors achieved only moderate reliability scores we are reminded of the need for these tests to
be designed upon foundations aligned with those of the curriculum expectations they are
employed to assess from the start in order for them to meet better test properties (Chudowsky amp
Pellegrino 2003 Rogers 2014)
40
52 In which Mathematical Dimensions and Related Strands do Students Demonstrate Strengths and Weaknesses in their Mathematical Achievement
Three classes were determined to best describe the performances of all Grade 6 learners
in the established dimensions and their related strands Class 1 was described as the highest
performing and second largest group consisting of 321 of the learners Class 2 was described
as the intermediate performing and largest group consisting of 452 of the learners and lastly
Class 3 was described as the lowest performing and smallest group consisting of only 227 of
the learners from the sample
The results of this analysis further revealed that all three classes performed weaker in
their ability to apply thinking skills in order to solve problems either specifically surrounding
the topic of Area or in various strands than in their ability to apply mathematical knowledge in
order to do the same The performances of those in Class 1 were described as especially strong
in the mathematical knowledge dimension (Factor 1) and strong in the thinking dimensions
(Factor 2 and 3) Class 2 was described as strong in the mathematical knowledge dimension but
weak in the thinking skills dimensions and lastly Class 3 was described as moderately weak in
the mathematical knowledge and thinking skills dimensions The discrepancy between
performances in the two subdomains namely mathematical knowledge and thinking skills thus
appeared to be largest for those in Class 2 the intermediate performing and largest group
The findings concerning the overall performances of students in the two subdomains of
mathematical knowledge and thinking skills aligns with those concerning the performances of
US students as described by Kilpatrick et al (2001) They highlight that research evidence over
the past 30 years has consistently indicated that although US students do not fare badly in
applying their knowledge to solve basic mathematical problems they tend to have a limited
41
understanding of mathematical concepts and are noticeably deficient in their ability to apply
mathematical thinking skills to solve even simple problems
It may however be argued that this finding namely a weaker performance in thinking
skills than mathematical knowledge is to be expected given the fact that applying thinking skills
in order to solve problems is a more challenging task than simply applying what you know
(Schoenfeld 2007) However studies have also found that a strong mathematical knowledge
base leads to a better ability to apply thinking skills to solve deeper problems (Stokke 2015)
Thus given the inter-relatedness of these two dimensions together with the large discrepancy
between them for those in Class 2 (strong mathematical knowledge but weak thinking skills)
these findings demonstrate a weakness in the majority of Ontariorsquos Grade 6 learners to apply
thinking skills to solve deeper mathematical problems This finding holds important
recommendations for future research and mathematics educational practices as will be discussed
in the section below
Upon further investigation of learner performances in each of the strands as they relate to
the dimensions it was determined that all three classes performed much weaker in their ability to
apply mathematical knowledge in the Data Management and Probability strand than in the other
strands This strand was also determined to be the weakest in the thinking skills dimension
along with Patterning and Algebra This finding contradicts those of Tatsuoka Corter and
Tatsuoka (2004) in which it was found that students in the US appeared to perform poorest in
Geometry and Spatial Sense Given the inter-relatedness of mathematical knowledge and ability
to apply thinking skills as previously highlighted by Stokke (2015) this finding concerning Data
Management and Probability attests to a knowledge base weakness for Grade 6 Ontario learners
specifically surrounding this strand As for the results surrounding Patterning and Algebra they
appear to provide further support for the weak ability of the learners to apply thinking skills
42
given their relatively strong mathematical knowledge surrounding this strand These findings
also hold valuable recommendations for educational practices in Ontario which will be further
discussed below
53 To What Extent Are Mathematics Performance Profiles Predicted by Student Background such as Language and Residence Status
Findings from this analysis revealed that language background and length of residence in
Canada did not significantly predict performance profile membership Therefore regardless of
group allocation based on these variables all learners were equally likely to achieve a Class 1
(high performing) Class 2 (intermediate performing) or Class 3 (low performing) profile as
described in this study
These findings contradict the Jang et al (2013) study on the performance of learners in
reading In that study it was found that different reading patterns were achieved based on ELL
and length of residence status It was further determined that non-English speakers outperformed
monolinguals in reading achievement after living in the country for five years or more These
findings therefore do not appear to hold true for the performances of learners in mathematics
based on these variables as all learner groups were equally likely to achieve one of the three
performance profiles produced in this study However it needs to be acknowledged that this
study focused on ESL designation as opposed to ELL status which may have contributed to the
differences in findings Nonetheless these findings are considered valuable in that they provide
reassurance of the fact that the test results were not confounded by differences in language
proficiency and that the EQAO test was not biased towards first language speakers
The findings of this study further contradict those that found that English first language
speakers outperformed those for whom English was not their first language (Abedi amp Lord
43
2001 Howie 2003) Therefore they help shed perceptions of differences in mathematical
performances based solely on the aspect of language background This finding holds important
implications for mathematics education for these population groups as well as future research
54 Study Limitations
The following study limitations have been recognized and should thus be taken into
consideration when reviewing these findings Firstly this study analyzed the mathematical
performances of learners based on the results of a standardized test only We are therefore
reminded of the fact that many factors influence test scores over and above that which is random
These include the testing situation tester characteristics and test-taker characteristics (Kaplan amp
Saccuzzo 2009) For this reason it is important that learner performances in other assessment
environments also be considered such as classroom-based assessment activities
Secondly the findings of this study were based solely on learner performances on the
multiple choice items According to Schoenfeld (1992) most multiple choice items are machine
graded which limits their ability to measure learner conceptual understanding and problem
solving abilities to the degree that most people would like For this reason it is important that
future studies consider including the open response questions included on the assessment for a
better reflection of learner conceptual understanding and problem solving
Thirdly this study included performances of learners based solely on a single EQAO
administration and its data Although EQAO proclaims to instill rigorous test equating
procedures to ensure that test difficulty and discrimination properties are not compromised
across years (Rogers 2013) this does not guarantee that learner performances can be generalized
to all Grade 6 learners Furthermore this study focused on only those who took the English
44
version of the test therefore generalizing these findings to those who took the French version
should be done cautiously
Lastly the small ESL population size in comparison to the non-ESL population limits the
findings of this group and may therefore not accurately reflect their performances Furthermore
this study used ESL designation as opposed to ELL status ESL designation is a program in
which learners are enrolled or unenrolled throughout the year Therefore these findings may not
reflect that of the entire ELL population
55 Recommendations and Future Research
In light of recent poor mathematical performances of Ontariorsquos elementary learners the
education minister announced its ldquoRenewed Math Strategyrdquo designed for the purposes of
combatting further decline (Brown 2016) In this strategy requirements for improving the
performances of learners in mathematics were announced such as all learners in Grade 1-8 to
receive at least 60 minutes of mathematics instruction per day further support for weaker
schools in terms of more professional development for teachers as well as more support for
learners and parents surrounding this discipline As this study made apparent in the beginning
such strategies risk being only blanketed approaches that do not really target the heart of the
problem if not accompanied by further insight into the results upon which they are based
This study was conducted in an attempt to gain such insight and found that although
Ontario Grade 6 learners display strong mathematical knowledge the majority are particularly
weak in applying thinking skills such as reasoning and problem solving to solve deeper
mathematical problems It was further determined that learners are particularly weakest in the
Data Management and Probability strand for both mathematical knowledge and thinking skills
dimensions as well as the Patterning and Algebra strand in the latter dimension It was lastly
45
determined that background variables of language and length of residence did not significantly
predict performance and profile achievement and that both ESL and non-ESL learners were
equally likely to belong to high intermediate and low performing groups regardless of length of
residence in Canada Based on these findings the following recommendations surrounding
future research endeavors and educational practices specifically in conjunction with mathematics
education in Ontario will be discussed below
The Ontario Curriculum Grades 1-8 Mathematics 2005 document indicates that the
ultimate goal for mathematics education is to develop learner proficiency beyond that of content
knowledge and therefore also calls for the development of a deeper understanding of the
discipline along with essential thinking skills In order to accomplish these goals the
curriculum highlights that instructional practices need to deviate from a sole focus on direct
teaching methods to incorporate methods of teaching and learning through problem solving in
other words problem-based learning approaches Stokke (2015) blames this greater emphasis of
teaching mathematics using problem-based teaching strategies for the recent decline of Ontario
learnersrsquo mathematical performances She argues that the lack of direct instruction has robbed
learners of a sound knowledge base from which to draw upon when attempting to solve deeper
mathematical problems hence the weakness in this area
However the findings from this study provides evidence that contradicts this argument
as results point to the fact that the majority of Grade 6 learners in Ontario actually do possess
strong mathematical knowledge This finding may therefore perhaps be an indication of the
fact that a large portion of Ontario teachers still rely predominantly on teaching mathematics
using traditional direct teaching methods as opposed to those better suited to meet current
curriculum goals and expectations This finding therefore warrants further investigation into
current teaching trends and holds valuable insight as to where to direct efforts for remediation
46
In order to meet reformed curriculum goals and expectations teaching practices need to
change for which the teacher is the key actor (Ross amp McDougall 2006) Therefore this study
supports those calling for increased efforts directed at teachers and the need to reshape their roles
and perceptions of what it means to ldquoteachrdquo mathematics in a reformed curriculum classroom
For instance Milgram (2007) urges for strategies directed at ensuring that teachers truly
understand what it means to teach using problem-based teaching methods to develop thinking
skills He further illustrates that teaching thinking skills such as problem solving is a
challenging task as it is in itself complex involving both verbal and nonverbal mental processes
For this reason it is essential that learners solve problems for which the answer is not apparent
and requires a novel idea if we wish to effectively develop these skills (Milgram 2007) Such a
teaching and learning process requires that teachers step back allowing learners to grapple with
the task before them as well as interact with each other stepping in only when necessary to
guide the process (Milgram 2007)
Changing the role of the teacher from the traditional sole knowledge bearer and
transferor to one in which heshe shares the responsibility of learning with students is however
only one of 10 dimensions that requires attention when urging teachers to adopt instructional
practices better suited to accomplish curriculum goals and expectations (Ross amp McDougall
2007) Ross and McDougall (2006) further illustrate that in order to ensure that teaching for
deeper understanding as aligned with current reformed mathematics education takes place
teachers need to consider change in all 10 of these dimensions These dimensions as cited in
Ross and McDougall (2006) are summarized as follows 1) the need for program scope 2)
access to all forms of mathematics by students 3) raising self-confidence of students by teachers
4) complex and open-ended student tasks 5) instruction that focuses on constructing
mathematical ideas through self-discovery 6) change in the role of teachers to that of co-learner
47
and co-knowledge creator 7) solving of mathematical problems with the aid of manipulatives 8)
classroom organization in a manner that promotes sharing and interaction for solutions 9)
authentic assessment and lastly 10) a conception of mathematics as a dynamic subject by
teachers
Specifically regarding the first dimension namely the need for program scope Ross and
McDougall (2006) describe it as urging teachers to teach multiple mathematical strands with
increased attention on those less commonly taught such as the Data Management and
Probability and Patterning and Algebra strands The results of this analysis indicated that
learners were weakest in precisely these two strands therefore perhaps providing evidence in
support of the fact that these strands are given less attention by Ontario teachers when teaching
the mathematics curriculum expectations This finding therefore provides added support for the
need to further promote the implementation of these 10 dimensions of teaching for deeper
understanding as indicated above so as to ensure that teachers view all curriculum strands as
equally important and deserving of attention
In calling for these increased efforts directed at changing the way in which mathematics
teaching and learning occurs in classrooms it is important to acknowledge the fact that this is
easier said than done Teaching in a manner that supports the development of a deeper
understanding for mathematics and promotes thinking skills is a lengthy process that takes time
(Milgram 2007) A commodity in short supply for the teacher already feeling pressured to
cover all curriculum expectations before mandatory accountability assessments take place
(Milgram 2007) Therefore not only does this study call for increased efforts directed at
changing teacher perceptions and instructional practices in the classroom but also for policy
makers to consider practical constraints placed on teachers that may restrict the implementation
thereof
48
Lastly the need to predict mathematical performances of learners based on background
variables is made apparent by Hinton (2014) who found that early success in mathematics
predicts future success Therefore for the sake of early intervention especially for the lowest
performing group identified in this study it is urged that further research studies be directed at
determining background variables that better predict performances However it is further urged
that such studies focus on class or profile membership as used in this study as opposed to overall
mathematics performances used in the past In this way not only will we be able to better
identify low intermediate and high performers but also their related strengths and weaknesses
upon which specific remedial efforts can be targeted As for the equal likelihood of ESL and
non-ESL learners to achieve either low intermediate or high performing profiles this study
recommends future studies targeted at shedding perceptions of non-English speakers
underperforming in relation to first language speakers that have perhaps been shaped by previous
studies Without doing so we risk assuming the need for remediation directed at one group
whilst ignoring the needs of others
49
References
Abedi J amp Lord C (2001) The language factor in mathematics tests Applied Measurement
in Education 14(3) doi 101207S15324818AME1403_2
Brown J (2016) Elementary student to get hour of math every day under new Ontario plan
Retrieved July 23 2016 from
httpswwwthestarcomyourtorontoeducation20160404elementary-students-to-get-
hour-of-math-every-day-under-new-ontario-planhtml
Chudowsky N amp Pellegrino JW (2003) Large-scale assessments that support learning what
will it take Theory into Practice 42(1) 75+ Retrieved from
httpgogalegroupcommyaccesslibraryutorontocapsidop=AONEampu=utoronto_mai
nampid=GALE|A99909373ampv=21ampit=rampsid=summonampuserGroup=utoronto_mainampauth
Count=1
Collins L K amp Lanza S T (2010) Latent class and latent transitional analysis with
applications in the social behavioral and health sciences Hoboken NJ Wiley amp Sons
DePascale C (2014) The ideal role of large-scale testing in a comprehensive assessment
system Journal of Applied Testing Technology 5(1) 1-11 Retrieved from
httpwwwjattjournalcomindexphpatparticleview48343
Education Quality and Accountability Office (2016) About the agency Retrieved May 26
2016 from EQAO
httpwwweqaocomenabout_eqaoabout_the_agencyPagesabout-the-agencyaspx
Education Quality and Accountability Office (2014) EQAOrsquos provincial elementary school
report 2014 Retrieved September 26 2015 from EQAO
httpwwweqaocomenassessmentsresultsPagesprovincial-report-elementary-
2014aspx
Figlio D amp Loeb S (2011) School accountability In EA Hanushek S Machin and L
Woessmann (Eds) Handbooks in Economic The Netherlands North-Holland pp 383-
421
Foster D Noyce P amp Spiegel S (2007) When assessment guides instruction Silicon
Valleyrsquos mathematics assessment collaboration In AH Schoenfeld (Ed) Assessing
mathematical proficiency (pp 137-154) Cambridge Cambridge University Press
Friesen S (2005) Math Teaching it better Education Canada 46(1) 6-10
Furr R M (2011) Scale construction and psychometrics for social and personality psychology
Los Angeles SAGE
Fillmore L W (2007) English learners and mathematics learning language issues to consider
In AH Schoenfeld (Eds) Assessing mathematical proficiency (pp 333-344) Cambridge
Cambridge University Press
50
Haertel E H amp Herman J l (2005) A historical perspective on validity arguments for
accountability testing Yearbook of the National Society for the Study of
Education 104(2) 1-34 doi101111j1744-7984200500023x
Hinton A (2014) Tracking student achievement in mathematics over time in English language
schools Retrieved from
httpwwweqaocomenresearch_dataResearch_ReportsPagesstudent-
achievementaspx
Howie S (2005) System-level evaluation Language and other background factors affecting
mathematics achievement Prospects 35(2) 175-186 doi101007s11125-005-1820-
8
Huff K amp Goodman DP (2007) The demand for cognitive diagnostic assessment In JP
Leighton amp MJ Gierl (Eds) Cognitive Diagnostic Assessment for Education (19-60)
New York Cambridge University Press
IBM Corp Released 2013 IBM SPSS Statistics for Windows Version 230 Armonk NY IBM
Corp
Jang E E amp Ryan K (2003) Bridging gaps among curriculum teaching and learning and
assessment Book review Kifer E (2001) Large-scale assessment Dimensions
dilemmas and policy Journal of Curriculum Studies 35(4) 499-512
Jang EE Dunlop M Wagner M Kim Y amp Gu Z (2013) Elementary school ELLsrsquo
reading skill profiles using cognitive diagnosis modelling Roles of length of residence
and home language environment Language Learning 63(3) 400-436 doi
101111lang12016
Kaplan RM amp Saccuzzo DP (2009) Psychological Testing Principles Applications and
Issues Belmont Wadsworth Cengage Learning
Kilpatrick J Swafford J Findell B amp National Research Council (US) (2001) Adding it
up Helping children learn mathematics Washington DC National Academy Press
Klinger D A amp Rogers W T (2011) Teachers perceptions of large-scale assessment
programs within low-stakes accountability frameworks International Journal of
Testing 11(2) 122-143 doi101080153050582011552748
La Rose L (2014) PISA results Canada students high level achievers but math and science
scores dip The Huffington Post Retrieved October 5 2015 from
httpwwwhuffingtonpostca20131203pisa-results-canada-
studentrankings_n_4376190html
Meyers L S Gamst G amp Guarino A J (2006) Applied multivariate research Design and
interpretation Los Angeles Sage
Milgram R J (2007) What is mathematical proficiency In AH Schoenfeld (Eds) Assessing
mathematical proficiency (pp 31-58) Cambridge Cambridge University Press
51
Moschkovich J (2007) Beyond words to mathematical content Assessing English learners in
the mathematical classrooms In AH Schoenfeld (Eds) Assessing mathematical
proficiency (345-352) Cambridge Cambridge University Press
Mutheacuten LK amp Mutheacuten BO (1998-2010) Mplus Userrsquos Guide (6th Ed)
Los Angeles CA Mutheacuten amp Mutheacuten
Nagy P (2000) The three roles of assessment Gatekeeping accountability and instructional
diagnosis Canadian Journal of Education 25(2) Retrieved from
httpmyaccesslibraryutorontocaloginurl=httpsearchproquestcomdocview215374
855accountid=14771
National Council of Teachers of Mathematics (2000) Principles and standards for school
mathematics Reston VA National Council of Teachers of Mathematics
Nichols P D (1994) A framework for developing cognitively diagnostic assessments Review
of Educational Research 64(4) 575 Retrieved from
httpmyaccesslibraryutorontocaloginurl=httpsearchproquestcomdocview214116
755accountid=14771
Nylund K L Asparouhov T amp Mutheacuten B O (2007) Deciding on the number of classes in
latent class analysis and growth mixture modeling A monte carlo simulation
study Structural Equation Modeling A Multidisciplinary Journal 14(4) 535-569
doi10108010705510701575396
OECD (2014) PISA 2012 Results What Students Know and Can Do Student Performance in
Mathematics Reading and Science doi httpdxdoiorg1017879789264208780-en
Ontario (2005) The Ontario curriculum grades 1-8 Toronto Ontario Ministry of Education
Pastor D A Barron K E Miller B J amp Davis S L (2007) A latent profile analysis of
college students achievement goal orientation Contemporary Educational
Psychology 32(1) 8-47 doi101016jcedpsych200610003
Rogers WT (2013) What is the quality of EQAO assessments Excellent Retrieved
September 24 2015 from
httpwwweqaocomenresearch_dataResearch_ReportsPagesbest-assessment-
practicesaspx
Rogers WT (2014) Improving the utility of large-scale assessments in Canada Canadian
Journal of Education 37(3) Retrieved from httpcje-rcecaindexphpcje-
rcearticleview1732
Ross JA amp McDougall D E (2006) Mathematics In K Leithwood P McAdrie N Bascia
amp A Rodrigue A (Eds) Teaching for deep understanding Towards the Ontario
curriculum that we need (pp 33-39) Thousand Oaks CA Corwin Publishing
Schoenfeld A H (2007) Issues and tensions in the assessment of mathematical proficiency In
52
AH Schoenfeld (Ed) Assessing mathematical proficiency (pp3-15) Cambridge
Cambridge University Press
Schoenfeld A H (2007) What is mathematical proficiency and how can it be assessed In
AH Schoenfeld (Ed) Assessing mathematical proficiency (pp 59-73) Cambridge
Cambridge University Press
Schoenfeld A H (1992) Learning to think mathematically Problem solving metacognition
and sense making in mathematics In D Gouws (Ed) Handbook for research on
mathematics teaching and learning (pp 334-370) New York Macmillan
Schumacker R E amp Lomax R G (2004) A beginnerrsquos guide to structural equation modeling
(2nd ed) Mahwah NJ Lawrence Erlbaum Associates
Shapka J Domene J amp Keating D (2006) Trajectories of career aspirations through
adolescence and young adulthood Early math achievement as a critical filter
Educational Research and Evaluation 12(4) 347-358 Retrieved from
httpdxdoiorg10108013803610600765752
Statistics Canada (2016) Immigration and Ethnocultural Diversity in Canada Retrieved May
31 2016 from httpswww12statcangccanhs-enm2011as-sa99-010-x99-010-
x2011001-engcfm
Stein MK Remillard J amp Smith MS (2007) How curriculum influences student learning
In FK Lester amp National Council of Teachers of Mathematics (Eds) Second handbook
of research on mathematics teaching and learning a project of the National Council of
Teachers of Mathematics (pp 1099) Charlotte NC Information Age Pub
Stokke A (2015) What to do about Canadarsquos declining math scores Retrieved from
httpswwwcdhoweorgpdfcommentary_427pdf
Tatsuoka K Corter J amp Tatsuoka C (2004) Patterns of Diagnosed Mathematical Content
and Process Skills in TIMSS-R across a Sample of 20 Countries American Educational
Research Journal41(4) 901-926 Retrieved from
httpwwwjstororgmyaccesslibraryutorontocastable3699467
Uebersax JS (2015) Introduction to the Tetrachoric and Polychoric Correlation Coefficients
Retrieved July 20 2015 from httpjohn-uebersaxcomstattetrahtm
Wilson L D (2007) High-stakes testing In FK Lester and National Council of Teachers of
Mathematics (Eds) Second handbook of research on mathematics teaching and learning
a project of the National Council of Teachers of Mathematics (pp 1053 -1098)
Charlotte NC Information Age Pub

1
Chapter 1 Introduction
The teaching and learning of mathematics has long since formed a fundamental part of
the curriculum in educational settings all across the globe As individuals the value we place on
the teaching and learning of this discipline is evident in the way in which we count for babies
even before they can speak or the way in which we delight in the accomplishment of shape
recognition by two year olds The Ontario Curriculum Grades 1-8 Mathematics 2005
document further illustrates the importance of mathematical skills by emphasizing that it equips
students with knowledge skills and habits of mind that are essential for successful and rewarding
participation in information and technology-based societies According to Stokke (2015) strong
mathematical knowledge predicts future academic achievement and is needed in order to be
successful in the workforce Furthermore achievement in this fundamental subject has been
directly related to the career trajectory of an individual (Shapka Domene amp Keating 2006) The
National Council of Teachers of Mathematics (2000) sums up the importance by stating that
mathematical competence opens doors to productive futures while a lack thereof keeps these
doors closed
Despite the obvious importance of mathematical competencies on both an individual and
societal level a declining trend in the performances of learners in this essential discipline has
drawn attention from educators and policymakers around the world This trend seems to be
especially true for Canadian learners as highlighted by the 2012 results of the Programme for
International Student and Assessment (PISA) survey The results of this pencil-and-paper based
test which assesses learnersrsquo abilities to apply mathematical knowledge to solve problems in the
form of real-world contexts (OECD 2016) indicated that although Canadian learners were
2
among the higher performing achievers performance of its 15 year olds declined by 14-points
compared to nine years ago (La Rose 2014)
These results have been further echoed on a provincial level as revealed by the results
produced by the provincial accountability office of Ontario namely the Education Quality and
Accountability Office (EQAO) A report produced by this organization showed that since 2009
the number of Grade 3 and Grade 6 learners to achieve the provincial standard in mathematics
has decreased significantly despite an increase in reading and writing performances over the
same time (EQAO 2014) An even more startling statistic presented in this report is the fact that
only 54 of Ontariorsquos Grade 6 learners achieved the provincial standard in 2014 a decline from
61 in the 2012 assessment The revelation of these results have sent shockwaves throughout
all stakeholder levels in Ontario from government agencies to teachers parents and learners
and have therefore sparked numerous debates and heightened the demand for remedial strategies
Largescale assessments such as the aforementioned PISA and EQAO tests serve
predominantly as tools to satisfy the demand for accountability and educational improvements in
public schooling systems (Chudowsky amp Pellegrino 2003 Rogers 2014) Educators are held
accountable for studentsrsquo academic achievement measured against standards or expectations as
laid out in the curriculum document of a particular discipline of interest School improvement
plans are directed based on the performances of students on these accountability measures In
some cases sanctions associated with the test results raise concerns about narrowing the
curriculum to the tested content as well as educatorsrsquo morale (Jang amp Ryan 2003) Although the
practice of using largescale assessments in education dates back to the 19th century and has
grown exponentially since the implementation of the No Child Left Behind Act (DePascale
3
2003) much controversy exists surrounding their impact on education without pedagogically
useful information concerning what students know and can do with their learning
The generation of a total score to serve as the sole indicator on which to reflect the
overall performances of learners on largescale assessments is a popular approach adopted by
organizations for the purpose of providing feedback to stakeholders (Nichols 1994) Total
scores however have been criticized for providing an overly simplistic representation of learner
abilities which in addition to heightening the risk of result abuse (Earl 1999) and lacks the
necessary insight into learner abilities on which to base any meaningful decisions for the
improvement of education (Nichols 1994 Rogers 2014) For this reason it is argued whether
or not any remedial action based on these results in an attempt to improve mathematical
educational practices can extend beyond anything more than the implantation of blanketed
remedial strategies without further insight
The purpose of this study was therefore to go beyond total scores to gain better insight
into the mathematical performances of Grade 6 learners of Ontario in an attempt to produce
evidence on which to base remediation Using the results of the EQAO provincial assessment
this study aimed to investigate learner strengths and weaknesses in different aspects of
mathematics as determined by an analysis of the dimensionality of the items that make up the
assessment Furthermore this study used language background variables and length of residence
in Canada in an attempt to better identify learners and predict performance profile membership
The responses of a sample of Grade 6 learners to 28 multiple choice mathematics items
on the EQAO provincial assessment were analyzed The following questions were addressed in
this study
4
i What characterizes the dimensionality of the EQAO mathematics achievement
test administered to Grade 6 students in Ontario public schools
ii In which mathematical dimensions and related strands do students demonstrate
strengths and weaknesses in their mathematical achievement
iii To what extent are mathematics performance profiles predicted by student
background such as language and length of residence status
5
Chapter 2 Literature Review
This chapter discusses largescale assessments in education as well as their scoring and
reporting practices This is followed by an overview of mathematics education and its associated
curriculum as well as the factors predicting the performances of learners therein
21 Largescale Assessments in Education
Much of the origin and development of largescale testing in education can be traced back
to 1845 in the United States where they were first implemented in Boston schools and
championed for their use as a superior way to examine pupils (Wilson 2007) Today the
concept of educational testing has expanded into a multi-million-dollar business (Wilson 2007)
with largescale assessments serving as the measurement tool of choice on which to gauge the
system of education (Rogers 2014)
Largescale assessments can be characterized by the way in which they are administered
to large groups of learners simultaneously and in a highly standardized manner (Wilson 2007)
The foundations of these assessments rest on the same ideas as criterion referenced tests and are
classified as standards-based rather than norm-referenced tests (Kaplan amp Saccuzzo 2007) In
other words these largescale standards-based assessments compare the performances of
individuals against specific types of skills tasks or knowledge such as curricular standards or
expectations whereas norm- referenced tests compare each person with a norm and therefore
forces competition among people (Kaplan amp Saccuzzo 2007)
Largescale assessments in education were originally used to sort and classify learners
today they still serve this gatekeeping purpose but are also employed to serve two other
functions to which the majority of attention has shifted namely holding those responsible for the
6
education of learners accountable (accountability) and for the improvement of education
(Chudowsky amp Pellegrino 2003 Nagy 2000) School accountability involves the process of
evaluating school performance on the basis of student performance measures (Figlio amp Loeb
2011) and forms part of the system used by officials in education to monitor the effective
functioning of schools
It can also be characterized as either a high- or low-stakes system which further
differentiates the use of the results For instance according to Rogers (2014) accountability in
Canada is considered to be a low-stakes system and therefore the emphasis is predominantly on
using the results for educational improvement In contrast the United States is considered to be
a high-stakes system as results are used chiefly to sanction and reward schools
Although the use of largescale assessments in education have been credited for providing
an objective ldquoyardstickrdquo on which to measure learnersrsquo performances (Rogers 2014) and for
their ability to simplistically rank individuals along a highly reliable scale (Huff amp Goodman
2010) they have endured much criticism from those within the field Not only has much of this
been centered around their many unintentional consequences such as promotion of teaching to
the test test preparation activities at the expense of instructional time dishonesty among
educators and student drop out (Rogers 2014 Schoenfeld 2007) but also their scoring and
reporting practices and procedures These criticisms have led to much doubt concerning their
effectiveness as a tool to serve the purposes for which they are employed
211 Scoring and Reporting Practices of Largescale Assessments
It is common practice for largescale assessments to be scored using Item Response Theory
or Classical Test Theory in order to generate a total score and to use only these to report the
overall performances of learners on the assessment (Nichols 1994) Although this scoring and
7
reporting procedure is credited for being relatively quick and cost effective (Chudowsky amp
Pellegrino 2003) they serve merely to highlight that there is a problem but provide little
direction as to what the problem is (Nichols 1994) Foster Noyceand Speigel (2007) sum up
the criticism against total scores by stating that although they may reassure a schoolrsquos staff about
student progress or alert them to trouble ahead they do little to inform teachers about how
students are thinking what they understand where they are falling down and how specifically
teachers might change their own instructional practices to address studentsrsquo difficulties
The over simplistic representation of learner performances by total scores therefore lacks
the necessary insight on which to base remedial decisions (Nichols 1994) For this reason the
effectiveness of largescale assessments as a tool for improving education has been questioned
(Rogers 2014) For instance it is expected that educators and principles use results of largescale
assessments to improve their instructional practices (Rogers 2014) however in a study
conducted by Klinger and Rogers (2013) it was discovered that they in fact found little
direction from these results to do so This has led to an increased demand from those within the
field for these assessments to report more than only overall performances in the form of total
scores (Huff amp Goodman 2010 Nichols 1994 Rogers 2014) Detailed information from
assessments can help those in education including teachers and students identify content and
curricular areas that need attention (Schoenfeld 2007) and in so doing aide in the improvement
of education in disciplines where it is needed the most
212 Test Development Procedures
Largescale assessment organisations commonly adopt traditional unidimensional
frameworks to form the basis of test development procedures A unidimensional framework is
one that assumes a single factor or latent variable as an explanation for a certain behaviour such
8
as academic ability (Kaplan amp Saccuzzo 2007) However many curricular in practice today
have been developed on a multidimensional framework such as that of mathematics where
academic ability is assumed to consist of more than one skill or factor
Furthermore test development practices are performed taking into consideration certain
test constraints for instance test format which is usually paper-and-pencil based as well as
administration time For this reason it is impossible to include items to measure all curriculum
expectations in one test (Haertel amp Herman 2005) This sampling process of curriculum
expectations therefore also means that only few items for each expectation are included in the
assessment (Rogers 2014)
In addition to these test development procedures raising construct validity concerns
(Wilson 2007) they limit the reporting of test scores beyond anything more than overall total
scores As highlighted by Rogers (2014) since the assessment was never designed from an
explicit framework in line with that of curriculum expectations from the start as well as include
only a few items targeted at each subdomain it is highly unlikely that the assessment meets the
rigorous test properties needed to allow for reporting anything beyond that of total scores
In order to satisfy the many calls for change to reporting practices assessment
organisations would need to deviate from these traditional more cost effective practices For this
reason Chudowsky and Pellegrino (2003) indicate that change is unlikely to happen soon As a
result our efforts to improve education in disciplines where it is needed the most will continue
to take place within the confinements of that which assessment organisations refuse to change
22 Mathematics Education and Curriculum
The mathematical reform movement generated in the late 1950rsquos signaled the need for the
implementation of better teaching and learning practices for mathematics in schools (Friesen
9
2005) Today many mathematics curricular worldwide including that of Canada are based on
the Principles and Standards for School Mathematics as set out by the National Council of
Teachers of Mathematics (NCTM) (Friesen 2005) Very broadly curriculum refers to the
substance or content of teaching and learning it focusses on the ldquowhatrdquo of teaching and learning
as opposed to the ldquohowrdquo (Stein Remillard amp Smith 2007)
This NCTM document calls for the teaching and learning of mathematics with the goal of
developing both content or procedural knowledge and conceptual understanding of the
discipline through the application of essential thinking or processing skills such as problem
solving or reasoning skills which in turn will be developed (NCTM 2000) This goal for
mathematics education is in stark contrast to that of traditional goals where only the teaching and
learning of procedural or content knowledge was valued and taught through rote teaching and
learning practices (Schoenfeld 2007) Procedural knowledge refers to what and how to solve
certain mathematical problems whereas conceptual understanding refers to why a certain
problem is solved the way it is (Kilpatrick Swafford Findell amp NRC 2001)
Furthermore the NCTM adopted the view that standards play a leading role in guiding
the improvement of mathematics education (NCTM 2000) It therefore highlights specific
mathematical standards or expectations that learners should achieve Specifically five Content
Standards are used to guide the teaching and learning of procedural and conceptual knowledge
namely Number and Operations Algebra Geometry Measurement and Data Analysis and
Probability Five Process Standards also guide the essential processes or thinking skills of
Problem Solving Reasoning and Proof Communication Connections and Representation
(NCTM 2000) The NCTM (2000) repeatedly proclaims the interconnectedness of these
standards by indicating that procedural knowledge should never exist without conceptual
10
understanding which in turn should not be developed without the application and acquisition of
the essential processing skills
The Content and Process Standards are further classified into groups or categories for
assessment purposes in mathematics curricular such as that of Ontario Specifically the Ontario
Curriculum Grades 1-8 Mathematics 2005 document describes four categories of Knowledge
and Understanding Thinking Communication and Application to which the standards are
allocated These four categories are known as the Knowledge and Skills categories and are
reflected in the documentrsquos Achievement Chart The first category of Knowledge and
Understanding can be described as encompassing mathematical knowledge of content and
understanding and therefore focusses predominantly on the achievement of the Content
Standards The remaining three categories focus predominantly on the use of the Process
Standards The Thinking category assesses the use of problem solving reasoning and proving
processes the Communication category focusses on the assessment of the communicating
processes and lastly the Application category focusses on the assessment of the connecting
processes
From the above mathematics curriculum we can see that the knowledge base is still
considered important in mathematics education however so is conceptual understanding and the
application and acquisition of thinking skills As stated by Schoenfeld (2007) anyone who lacks
a solid grasp of facts procedures definitions and concepts is significantly handicapped in
mathematics yet there is more to being mathematically proficient than simply reproducing
standard content on demand Therefore if we are interested in understanding mathematical
proficiency as it is taught and learned today it is important that we reflect learner abilities in all
aspects of the discipline (Kilpatrick et al 2001) In so doing we will gain better insight into
11
their strengths and weaknesses allowing us to remediate accordingly in our efforts to improve
learner performances in this essential discipline
23 Factors Predicting Mathematical Performances
Given the relative importance of mathematics it is no surprise that much research has been
dedicated to highlighting and isolating the number or factors that can influence and predict
mathematical performances By doing so early interventions and remedial strategies can be
better targeted to improve future mathematical success (Hinton 2014)
One such factor that has been given much attention is that of language proficiency and its
influence on mathematical performances Studies conducted by Hinton (2014) Howie (2005)
and Abedi and Lord (2001) for instance discovered that learners who spoke English as a second
language performed worse in mathematical assessments compared to their English proficient
counterparts Fillmore (2007) however cautions against interpreting this as a lack of
mathematical ability without firstly taking into account the aspect of language Since much of
the mathematics taught today is presented in the form of a word problem it relies heavily on a
deep understanding of language (Moschovich 2007) Therefore trying to tease out precisely
how much of the struggle is related to a language issue and how much to an issue with
mathematics is a unique challenge for teachers assessment and English Language Learners
(ELLrsquos) (Fillmore 2007) As highlighted by Moschovich (2007) assessment is certainly a
complex task perhaps especially when working with students who are learning English It is
challenging to decide whether an utterance reflects a studentrsquos conceptual understanding a
studentrsquos proficiency in expressing their ideas in English or a combination of mathematical
understanding and English proficiency
12
Canada has a high and diverse immigrant population for instance 206 of its population
in 2011 was determined to be comprised of immigrants from various countries (Statistics
Canada 2016) Thus the mathematical performances of ELLrsquos cannot be ignored Fortunately
this aspect is currently given attention in the province of Ontario as assessment organizations
such as the EQAO do attempt to report separately on these learnersrsquo performances However
Jang Dunlop Wagner Kim and Gu (2013) warn against treating ELLrsquos as a homogenous group
Their study found that when taking into account the length of residence in Canada
performances of these students varied significantly concerning their reading proficiencies
Therefore if we wish to predict mathematical performances or gain better insight based on
student background such as language factors it is necessary to consider subpopulation groups
that make up the overall ELL population such as length of residence in the country
13
Chapter 3 Method
This chapter describes the participants instrument and data as well as the three main
analyses used to answer the questions presented in this study
31 Participants
The current study used data made available by the Education Quality and Accountability
Office (EQAO) of Ontario The EQAO is an arms-length Ontario government agency that is
responsible for developing and overseeing reading writing and mathematics assessments
administered to Grade 3 6 9 and 10 students in Ontario public schools The purpose of the
results of these largescale assessments is to determine the extent to which learners have achieved
the curriculum standards of the particular discipline for educational accountability and
improvement purposes (EQAO 2016)
Learnersrsquo responses are scored by the EQAO using Classical Test Theory and Item
Response Theory (Rogers 2013) to generate a score that is then converted into a Level NIE 1 2
3 or 4 Level 3 describes a performance at the provincial standard whereas Level 4 a
performance surpassing the standard Level 2 a performance approaching the standard and Level 1
a performance much below the standard Lastly a ldquoNIErdquo rating is generated for those learners
who have not provided sufficient evidence for a Level 1 score The EQAO test scores are reported
using these proficiency levels for each of the areas tested namely reading writing and
mathematics Background information such as gender time lived in Canada and student home
language etc is also collected by questionnaires administered by the EQAO over the same time
The full population data set comprised of approximately 127 302 Grade 6 learnersrsquo
responses to the English 20132014 provincial Junior Division assessment A random sample of
5000 learner responses to the assessment was drawn from the entire data set Learners with
missing data on any of the variables were excluded from the sampling process so that the final
14
data set contained responses to all mathematics items as well as background information All
learners within the sample were enrolled at the time in Grade 6 and attended various schools
across the province Table 1 below presents the distributions of student subgroups from the
random sample based on their gender language background and time spent in Canada in
comparison with the entire population The percentage of learners in each subgroup was very
closely aligned with the larger Grade 6 population and was therefore considered a representative
sample
Table 1
Final Random Sample used for the Analysis
Standard Gender Language Time lived in Canada
Met
Below
Female
Male
Non-
ESL
ESL
CA
Born
Non-CA
born lt 5
years
Non-CA
born ge 5
years
Frequency 2765 2235 2456 2544 4460 540 4493 199 308
Sample 553 447 491 519 892 108 899 4 62
Population 54 46 49 51 887 113 871 4 89
Notes N = 5000 Standard = met the provincial standard or achieved below the provincial standard ESL = enrolled in
English as a Second language program Time lived in Canada = Canadian born learners non-Canadian born learners
who have lived in Canada for less than 5 years and non-Canadian born learners who have lived in Canada for 5 years
or more
32 Instrument
Student responses to the mathematics test items and background information on the EQAO
20132014 Junior Division assessment were used for this study This assessment is a provincially
mandated largescale assessment used by the Ontario government to measure the extent to which
learners have achieved the standards as laid out in the curriculum All the EQAO largescale
assessments are designed using rigorous development procedures and meet high testing standards
with acceptably high reliabilities (Rogers 2013) of above 80 The Junior Division assessment is
15
specifically administered to all Grade 6 learners attending schools within the province of Ontario
during the months of May and June and under highly standardized conditions (EQAO 2016) The
assessment measures reading writing and mathematical skills in each of the corresponding
sections The mathematics section specifically consists of 36 items of which 28 are multiple choice
items and 8 are constructed-response format questions This study included only the 28 multiple
choice items
While the EQAO does not claim to measure the Knowledge and Skills categories as laid out
in the Ontario Curriculum Grades 1-8 Mathematics 2005 document (Rogers 2013) it still
references each of the mathematics items to one of three of the categories namely that of
Knowledge and Understanding Thinking and Application The category of Communication is not
represented by any of the items as according to Rogers (2013) this skill is not feasible to assess in
a paper-and-pencil based test For items to be referenced to the Knowledge and Understanding
category they need to be recognized as requiring students to demonstrate subject specific content
and comprehend its meaning Those referenced to the Application category need to be recognized
as requiring students to select an appropriate mathematical tool and apply the appropriate
information Lastly those referenced to the Thinking category need to be seen as requiring of
students to select and sequence a variety of tools and think critically in order to solve problems
(Rogers 2013) Items are scrutinized by teachers and other content experts for the process of
allocating items to the most appropriate category Items are further referenced to the five content
areas or strands of the curriculum document according to their content topic namely Number Sense
and Numeration Measurement Geometry and Spatial Sense Patterning and Algebra and Data
Management and Probability
Table 2 shows the representation of each of the Knowledge and Skills categories and the
strands to which the 28 multiple choice items were referenced by the EQAO as well as the item
difficulties (p-values) and discrimination indices (pt-biserial correlations) for each of these items
According to Kaplan and Saccuzzo (2007) item difficulty values should range from 30 to 70 to
16
maximize information about the differences among individuals Furthermore item discriminability
values should not be negative or below 20 to be considered adequate Based on these
recommendations all 28 items were considered suitable to be included in the analyses of this study
Table 2
Knowledge and Skills Categories Strands and Descriptive Statistics of 28 Mathematics Items
Item Know amp Skill Strand p-value pt-biserial
1 K and U Patterning amp Algebra 86 39
14 K and U Patterning amp Algebra 74 43
3 K and U Number Sense amp Numeration 76 37
15 K and U Number Sense amp Numeration 86 35
9 K and U Data Management amp Probability 48 33
19 K and U Measurement 50 27
25 K and U Measurement 76 40
22 K and U Geometry amp Spatial Sense 87 34
73 36
11 App Patterning amp Algebra 81 43
24 App Patterning amp Algebra 70 37
26 App Patterning amp Algebra 40 30
5 App Number Sense amp Numeration 56 38
7 App Number Sense amp Numeration 82 30
10 App Data Management amp Probability 55 47
18 App Data Management amp Probability 78 47
23 App Data Management amp Probability 71 42
2 App Measurement 59 31
8 App Measurement 58 28
20 App Measurement 54 47
6 App Geometry amp Spatial Sense 68 38
64 38
17 Think Patterning amp Algebra 52 36
21 Think Number Sense amp Numeration 57 22
28 Think Number Sense amp Numeration 69 33
4 Think Data Management amp Probability 46 35
13 Think Measurement 54 39
27 Think Measurement 41 46
12 Think Geometry amp Spatial Sense 42 35
16 Think Geometry amp Spatial Sense 54 34
52 35
Notes K and U = Knowledge amp Understanding App = Application Think = Thinking p-value and pt-biserial means
for each Knowledge amp Skill category represented in bold
17
No items had p-values below 30 however 10 items had difficulty values above 70
indicating that they were relatively easy for this sample Since none of the p-values were above
90 they were considered to still possess sufficient variability to be included in the analyses
Furthermore no items had values below the recommended 20 or negative pt-biserial values Table
2 further highlights the item difficulty and discrimination means for each of the three categories
From these values it can be concluded that the items referenced to the Knowledge and
Understanding category were relatively more easy for this sample while those items referenced to
the Thinking category more difficult and those referenced to the Application category moderately
difficult Lastly it is highlighted that a greater number of items represented the Application
category (12 items) than the Knowledge and Understanding and Thinking category which had an
equal number of eight items
33 Data Analysis
The data analyses involved three phases each of which addressed one of the three questions
asked in this study The first phase used Exploratory Factor Analysis (EFA) approaches to
examine the first research question ldquoWhat characterizes the dimensionality of the EQAO
mathematics achievement test administered to Grade 6 students in Ontario public schoolsrdquo
Latent Class Analysis (LCA) approaches were used in the second phase in order to answer question
two ldquoIn which mathematical dimensions and related strands do students demonstrate strengths and
weaknesses in their mathematical achievementrdquo A multinomial logistic regression analysis was
performed to examine research question three ldquoTo what extent are mathematics performance
profiles predicted by student background such as language and length of residence statusrdquo
331 Phase 1 Establishing the Dimensionality of the Assessment
An Exploratory Factor Analysis (EFA) was conducted in order to determine the
dimensionality of the EQAO Grade 6 mathematics test based on 5000 studentsrsquo responses to 28
multiple choice items Although exploratory in nature the EFA was used to examine the extent
18
to which the test dimensionality can be accounted for by knowledge and skills and further by the
strand specified by the EQAO
EFA is a statistical procedure that simplifies the process of visually inspecting a range of
correlations in order to examine the dimensionality of measures (Furr 2011) The 28 multiple
choice items were firstly recoded as binary data thus creating dichotomous categories (0 =
incorrect responses and 1 = correct responses) In order to perform an EFA with this type of
data a more sophisticated statistical software package is required The reason for this being that
standard software such as IBMrsquos SPSS (version 230) creates correlation matrices suitable only
for continuous data that assume a normal distribution (Uebersax 2015) Therefore MPLUS
version 612 (Mutheacuten amp Mutheacuten 1998-2012) was used for the analysis so that a tetrachoric
correlation matrix could be generated to suite the binary data used in this study
When conducting an EFA in Mplus a correlation matrix eigenvalues and model fitting
statistics such as the chi-square test Root Mean Square Error of Approximation (RMSEA) and
Root Mean Square Residual (RMSR) are produced in order to assist with the process of
determining the solution that best fits the data A good fitting model will be represented by a
non-significant chi-square p-value as well as a RMSEA value and RMSR value of below 05
(Schumacker amp Lomax 2004) However interpretability of the model should also be taken into
consideration when deciding on the best solution (Meyers Gamst amp Guarino 2013) The
weighted least-squares with mean (wlsm) estimation method as recommended by Mutheacuten and
Mutheacuten (1998-2012) for binary data and the oblique rotation method (Promax) was used for this
analysis based on the assumption that factors are likely to be correlated with each other
Four steps were implemented during this phase The first step entailed determining the
ideal number of factors to be extracted to best describe the data This entailed a combined
evaluation of the correlation matrix eigenvalues scree plot and fit statistics as described above
The next step entailed an evaluation of the items and their loadings on each of the factors to
determine if any should be discarded in terms of low factor loadings or cross-loadings If any
19
items were deemed unacceptable these were removed and the analysis re-run and subsequently
re-evaluated This step was repeated until a final and appropriate factor solution model was
obtained Following this the reliability for each factor was established followed by an
investigation of the factor correlations in order to determine the uniqueness of each extracted
dimension Ideally items should correlate highly with each other within each extracted
factordimension however for each dimension to be considered unique between-factor
correlations should be low (Rogers 2014) According to Meyers et al (2013) between-factor
correlations should not exceed 80 to warrant the use of a separate dimension The last step
involved an investigation of the similarities between items in each factor in order to describe the
items that make up each This was done firstly in terms of the three Knowledge and Skills
categories and secondly the five strands to which the items were referenced as well as any
further content similarities
332 Phase 2 Identifying Mathematical Strengths and Weaknesses
In an attempt to identify in which mathematical subdomains or dimensions and related
strands learner performances were strongest and weakest as asked in question two of this study a
Latent Class Analysis (LCA) was performed using MPLUS version 612 (Mutheacuten amp Mutheacuten
1998-2012)
Specifically the goal of a mixture model is to reveal unobserved heterogeneous and
meaningful population groups within the larger homogenous population by identifying similarities
in their responses to measured variables (Nylund Asparouhov amp Mutheacuten 2007) These identified
latent populations or sub-groups are called classes Therefore using this analysis allowed for the
generation of distinct performance profiles for each sub-group or class identified as performing
similarly in the largescale assessment In this way more accurate class specific strengths and
weaknesses could be described as opposed to simply those of the overall Grade 6 population
20
For an LCA the outcome variables used are specifically categorical (Nylund et al 2007)
Therefore dichotomously scored response data from the random sample of 5000 students were
used for the LCA The LCA approach is exploratory in nature because the optimal number of
classes representing all latent classes cannot be determined apriori (Nylund et al 2007) Therefore
an investigation of relevant fit statistics generated by the LCA was firstly conducted According to
Pastor Barron Miller and Davis (2007) the fit statistics commonly used to determine the optimum
number of classes include the Bayesian Information Criterion (BIC) the sample-size adjusted BIC
and the Akaike Information Criterion (AIC) where lower values indicate a better fitting model An
Entropy statistic is also commonly used to determine model fit This statistic ranges from 0 to 1
where values closest to 1 indicate higher classification accuracy
Following the identification of the best fitting model the entire sample was profiled in
terms of distinct mathematics classes In order to reduce the number of points on these profiles
items were grouped according to the strand to which they were referenced by EQAO within each
identified factor This allowed for the identification of learner strengths and weaknesses not only
surrounding factors but also each strand within each factor
As part of the LCA mean item probability scores are calculated for each class This statistic
indicates the mean probability for each class to respond correctly to an item and therefore ranges
from 0 to 1 (Nylund et al 2007) Values closest to one therefore indicate a higher probability of
responding correctly to an item Using these values for each item average item-group probability
scores were calculated and these values were then used to describe class specific strengths and
weaknesses This was done firstly by describing overall item-group performances in comparison
to other classes and secondly by describing class performances in each specific factor overall and
lastly in terms of each strand within each factor
21
333 Phase 3 Predicting Class and Profile Membership
In order to answer question three concerning whether or not English as a second language
and length of residence in Canada significantly predicted the performance profile to which a
learner belongs a multinomial logistics regression analysis was conducted This phase was
completed using IBMrsquos SPSS (version 230)
A multinomial logistic regression is used when the dependent variable for the analysis
consists of more than two categorical levels (Meyers et al 2013) Besides the item probability
mean generated by the LCA a class probability mean for each learner in the sample is also
calculated as part of the analysis This class probability indicates the likelihood of a learner
belonging to each of the classes or performance profiles Based on the highest class probability
learners were allocated to one of the performance profiles as generated in phase 2 These classes
were coded 1 2 3 etc based on the number of classes determined to best describe the sample and
represented the dependent or predicted variable of the analysis
Table 3
Six Groups Created Based on English as Second Language and Time Lived in Canada
Group Language Time lived in Canada n
1 Non-ESL CA born 4185 837
2 ESL CA born 308 62
3 Non-ESL Non-CA born lt 5 years 76 15
4 ESL Non-CA born lt 5 years 123 25
5 Non-ESL Non-CA born ge 5 years 199 40
6 ESL Non-CA born ge 5 years 109 22
Notes N = 5000 ESL = English as a second language learner CA born = Born in Canada
An independent variable used for predicting the latent class membership included six
groups based on the following background variables English Second Language (ESL) status as
22
well as whether or not they were Canadian born non-Canadian born but at the time had resided in
the country for less than 5 years or non-Canadian born but at the time had resided in the country for
five years or more This was done in order to avoid clustering ELL learners as a homogenous group
and therefore better identify learners These six categorical data groups represented the predictor
or independent variable Table 3 indicates more precisely how each of the groups were created as
well as their sizes
23
Chapter 4 Results
The results of this study are discussed according to the three questions presented and phases
of data analyses as discussed in Chapter 3 Firstly the results produced from the Exploratory
Factor Analysis (EFA) described in phase one concerning question one are reported Secondly
those produced by the Latent Class Analysis (LCA) in phase two to answer question two and lastly
those produced from the multinomial logistics regression analysis conducted in phase three to
answer question three are presented in this chapter
41 Dimensionality Characteristics
As noted an EFA was conducted on the 28 multiple choice mathematics items in order to
determine the dimensionality of the largescale assessment to which they belonged The
eigenvalues of the tetrachoric correlation matrix (Table 4) produced by Mplus ranged between
862 and 41 the first three factors showed eigenvalues greater than 1 and accounted for 3953 of
the total variance
Table 4
Eigenvalues of Correlation Matrix indicating Total Variance Explained
Item Eigenvalue Item Eigenvalue Item Eigenvalue Item Eigenvalue
1 86 2 13 3 10 4 93
5 91 6 90 7 87 8 85
9 84 10 80 11 79 12 76
13 74 14 72 15 70 16 69
17 66 18 65 19 64 20 63
21 60 22 57 23 53 24 52
25 50 26 49 27 46 28 41
24
411 Determining the Best Fitting Factor Solution Model
The eigenvalues scree plot and fit statistics were used to determine the best number of
factors to describe this data set Based on the ldquonumber of eigenvalues greater and equal to one
rulerdquo as suggested by Meyers et al (2013) together with the scree plot and relevant fit statistics it
seemed adequate to extract three factors albeit accounting for less than 50 of the variance
Figure 1 Scree plot
Although three eigenvalues were produced greater and equal to one suggesting the
existence of three factors this was contradicted by the scree plot (Figure 1) which suggested the
existence of only two factors as it appeared to level off mostly at number three Subsequently a
comparison of the one to three factor solutions was conducted in terms of the relevant fit statistics
as described in Table 5
The significant chi-square p-values (lt 001) generated for the one and two factor solutions
suggested that the data differed significantly from the model matrix Although the chi-square p-
value has been criticized in the past for being overly sensitive to large sample sizes and therefore
0
05
1
15
2
25
3
35
4
45
5
55
6
65
7
75
8
85
9
1 2 3 4 5 6 7 8 9 10 11 12 13 14 15 16 17 18 19 20 21 22 23 24 25 26 27 28
Eig
envalu
es
Items
25
almost always producing a significant value (Meyers et al 2013) this was determined not to be the
case for this analysis as the p-value generated in the three factor model increased substantially
from the one to two factor model thus ensuring the reliability of this value
Table 5
EFA Model Fit Statistics of the 1 to 3 Factor Solutions on 28 Mathematics Items
FA model Chi-Square df p-value RMSEA RMSR
1 92476 350 lt 001 018 031
2 44012 323 lt001 009 021
3 34390 297 032 006 019
Note N = 5000
Therefore since the Chi-square p-value of 032 of the three factor model was not significant
(at the 001 probability level) as well as the fact that only two items represented the fourth factor in
the four factor solution model it was deemed a good fitting model The values of 006 and 019 of
the RMSEA and RMSR respectively were well below the 05 recommended value providing
further support for this three factor solution model
A further inspection of the factor loadings from the three-factor solution as well as of the
items on each factor resulted in the removal of four items (ie 12 18 23 and 24) Items 18 23 and
24 were discarded as a result of low factor loading scores below 30 Whereas a decision was made
to remove Item 12 as it was the only item referenced to the Thinking category that did not load on
the factors in the same way that the others did Table 6 presents the final factor loadings with the
Knowledge and Skills categories to which items were originally allocated by the EQAO that is
knowledge and understanding application and thinking
The Promax factor correlation matrix produced by Mplus (Table 7) revealed that all three
factors correlated positively and moderately to high with one another The strongest correlation
26
existed between Factor 1 and Factor 3 with a relatively high coefficient value of 747 while the
weakest correlation existed between Factor 1 and Factor 2 with a coefficient of 576
Table 6
Factor Loadings of the 23 Items used in the Final 3 Factor Solution Model
Item Knowledge amp Skill Factor 1 Factor 2 Factor 3
1 KU 64 -09 13
11 App 63 -04 12
14 KU 55 13 01
6 App 51 12 -04
15 KU 51 -05 14
10 App 47 23 05
7 App 45 -12 13
25 KU 38 09 17
3 KU 35 -01 24
9 KU 35 09 07
22 KU 31 07 23
5 APP 30 09 22
13 App 10 65 -05
27 Think -04 63 23
2 Think -07 50 12
20 App 14 -03 59
17 Think -04 04 55
26 App 13 01 33
8 App 11 -01 32
28 Think 15 03 32
16 Think 11 10 31
4 Think 14 12 30
21 Think -04 08 30
α = 725 α = 536 α = 565
Notes KU = Knowledge and Understanding App = Application Think = Thinking category
As stated earlier according to Meyers et al (2013) correlations should not exceed 80 to warrant
the use of separate factors These results are therefore considered to reveal the existence of three
27
unique factors that can be used to describe the multidimensionality of these mathematics multiple
choice items
Table 7
Promax Factor Correlations Between 3 Factors
Factors FA 1 FA 2
Factor 1
Factor 2 576
Factor 3 747 626
Note N = 5000
As indicated in Table 6 Factor 1 consisted of 12 items in total with factor loading scores
ranging between 30 and 64 and achieved a relatively high Cronbachrsquos alpha of 725 All seven
items referenced to the Knowledge and Understanding category used in the final model loaded
together on Factor 1 along with five items referenced to the Application category Factor 2
consisted of only three items with factor loading scores ranging between 50 and 63 and
achieved a moderate Cronbachrsquos alpha of 536 In Factor 2 two items referenced to the Thinking
category and one to the Application category loaded together to make up the total of three items
for this factor Lastly Factor 3 consisted of a total of eight items with factor loading scores
ranging between 30 and 59 and also achieved a moderate Cronbachrsquos alpha score of 565 The
remaining five items referenced to the Thinking category and three items referenced to the
Application category loaded together to make up the eight items that loaded together on Factor 3
In terms of the strands to which the items in Factor 1 were referenced for instance
Patterning and Algebra etc no clear similarities appeared to exist to tie all the items together
based on this However similarities seemed to exist in terms of the applied skill requested of
learners to solve the mathematical problems It appeared that all the items of this factor merely
requested of learners to apply their mathematical knowledge in terms of procedures and
conceptual understanding to answer the questions For instance Item 15 which is referenced to
28
the Knowledge and Understanding category asks the following ldquoWhat is the value of 0730 ndash
0156rdquo Whereas Item 5 which is referenced to the Application category asks that learners
solve problems involving the addition of decimal numbers (the exact question was not released)
Therefore it was determined that no clear difference existed between the applied skill requested
from these two items even though they were referenced to two different Knowledge and Skills
categories It was therefore concluded that Factor 1 could be described as measuring the
application of mathematical knowledge to solve problems in various strands
An inspection of the items that loaded together on Factor 2 revealed that two of the items
were referenced to the Thinking category while one of the items was referenced to the
Application category Furthermore all three items were similar in that that they covered the
ldquoMeasurementrdquo strand and more specifically that all three items requested of learners to solve
problems relating to ldquoAreardquo Item 2 for instance asks ldquoThe parallelogram below will be cut
into two congruent triangles (provides dimensions) What is the area of one of the trianglesrdquo
Item 13 asks ldquoWhich of the following shows a rectangle and a triangle that have the same areardquo
and lastly Item 27 requests that learners compare the areas of two polygons (exact item not
released) Item 2 was referenced to the Application category whereas Items 13 and 27 were
referenced to the Thinking category It was therefore determined that Factor 2 could be
described as requesting of learners to apply thinking processes or skills such as problem solving
and reasoning in order to solve deeper mathematical problems specifically surrounding the
Measurement topic of ldquoAreardquo
Lastly for Factor 3 as with Factor 1 no clear similarities appeared to exist to tie all the
items together based on strands However as with Factor 1 similarities seemed to exist in terms
of the applied skill requested of learners to solve the mathematical problems It appeared that
all the items on this factor requested of learners to apply thinking skills to solve deeper
mathematical problems surrounding various strands in other words learners had to go beyond
the mere application of content knowledge to solve these items For instance Item 20 referenced
29
to the Application category requested that learners solve the following problem ldquoEach beaker of
water below has a capacity of 2L Which beaker appears to have about 500ml of water in itrdquo
Whereas Item 28 referenced to the Thinking category asks ldquoMrs Garrett sends surveys to 120
students and 78 students return the survey Which statement best describes the percent of
students who return the surveyrdquo Again no clear difference appeared to exist between the
applied skill requested of learners in terms of the Application and Thinking categories to which
the items were referenced It was therefore concluded that Factor 3 could be described as
measuring the ability of learners to apply thinking processes or skills such as problem solving
and reasoning in order to solve deeper mathematical problems in various strands
In sum the results of the EFA determined that a three factor model could be used to
adequately characterize the dimensionality of the multiple choice mathematics items on the
EQAO assessment Twelve items clustered adequately together in terms of factor loading scores
to form Factor 1 which achieved a relatively high Cronbachrsquos alpha of 725 three items on
Factor 2 which achieved a moderate Cronbachrsquos alpha of 536 and lastly eight items on Factor
3 which also achieved a moderate Cronbachrsquos alpha score of 565 Upon closer inspection of
the items on each factor and in terms of the Knowledge and Skills categories and strands to
which they were referenced by the EQAO it was determined that Factor 1 could be best
described as measuring the ability of learners to apply mathematical knowledge related to
procedural and conceptual understanding in order to solve problems in various mathematical
strands Factor 2 could be best described as measuring the ability of learners to apply process
or thinking skills in order to solve problems related specifically to the topic of ldquoAreardquo
Lastly Factor 3 could be best described as measuring the ability of learners to apply thinking
skills in various mathematical strands
30
42 Mathematical Strengths and Weaknesses
In an attempt to identify in which mathematical dimensions and related strands Grade 6
learner performances were strongest and weakest as asked in question two of this study a Latent
Class Analysis (LCA) was conducted This allowed for distinct performance profiles to be
generated for classes or sub-groups performing similarly in the population and therefore allowed
for more accurate descriptions of strengths and weaknesses The factors as established in the
dimensionality investigation in Phase 1 of this study were used to represent the dimensions for this
analysis
Although the four class model achieved the lowest AIC BIC and Sample-Size Adjusted
BIC statistic values in comparison to the two and three class model it also produced a much lower
Entropy value of 69 (see Table 8) Therefore it was decided that since these statistics did not
decrease that much from the three class to four class model the use of the four class model with a
much lower Entropy value did not seem warranted Thus the three class model was opted for
instead as it produced lower fit statistics than the two class model as well as a sufficiently high
Entropy value of 75 Furthermore the results indicated that each class was represented by the
following proportion of learners from the sample Class 1 comprised of 321 Class 2 of 452
and Class 3 of 227
Table 8
LCA Fit Statistics for 2 3 and 4 Classes
Fit statistics 2 Classes 3 Classes 4 Classes
AIC 12974224 12808557 12789120
BIC 13004854 12854829 12851034
Adj BIC 12989919 12832268 12820846
Entropy 81 75 69
Notes N = 5000 AIC = Akaike Information Criterion BIC = Bayesian Information Criterion Adj BIC = Sample-
Size Adjusted Bayesian Information Criterion
31
Eleven item-groups were created to describe the strengths and weaknesses of the three
classes as represented in Table 9 Item-groups were created by grouping items according to the
factor they were determined to measure (as established in the EFA) as well as the strand to which
they were allocated by the EQAO Five item-groups were created for Factor 1 one item-group for
Factor 2 and five groups for Factor 3 The number of items within each item-group varied from 1
item to 4 items The mean probability scores calculated for each class for each item-group and
overall dimension or factor are also represented in Table 9 These mean item-group probability
scores as presented in Table 9 were used to plot three distinct performance profiles for each class as
represented in Figure 2 below
Table 9
Item-Groups created to Describe Mathematical Performances of Grade 6 Learners
Factor Content Area of items Class 1 Class 2 Class 3
1 Patterning amp Algebra 3 97 86 48
1 Measurement 1 95 78 44
1 Geometry amp Spatial Sense 2 94 79 50
1 Number Sense amp Numeration 4 92 76 49
1 Data Management amp Probability 2 78 49 19
Factor 1 class probability means 91 74 44
2 Measurement (Area) 3 85 39 28
Factor 2 class probability means 85 39 28
3 Patterning amp Algebra 2 67 43 20
3 Measurement 2 79 55 25
3 Geometry amp Spatial Sense 1 79 47 31
3 Number Sense amp Numeration 2 80 60 44
3 Data Management amp Probability 1 72 40 22
Factor 3 class probability means 76 51 29
Note The factor probability means presented in bold are slightly higher as the actual item probability score was used
to calculate these values and not the item-group probability scores
Using the evidence generated from the mean item-group and factor probability scores as
represented in Table 9 and Figure 2 these performance profiles were used to describe the strengths
32
and weaknesses of each class Class specific strengths and weaknesses were described according
to firstly overall performances in the 11 item-groups in comparison to the other classes secondly
in terms of overall performances in each dimension (Factor 1 2 and 3) and lastly in terms of
performances in each strand within each dimension for Factor 1 and 3 only (as Factor 2 only
represented Measurement topic of ldquoAreardquo) A mean item-group probability score ranging from 86
- 10 was described as especially strong 71 - 85 as strong and 56 - 70 as moderately strong
while those scores ranging from 41 - 55 were described as moderately weak 26 - 40 as
moderately weak and 25 and below as especially weak
Figure 2 Three performance profiles of Grade 6 learners in 11 mathematical item-groups
Results indicated that those learners most likely to belong to Class 1 performed higher than
Class 2 and 3 in all item-groups Therefore this class to which 321 of learners from the sample
belonged can be best described as the highest performing and second largest group overall Those
most likely to belong to this class can be described as having an especially strong ability to apply
0
01
02
03
04
05
06
07
08
09
1
Item
-Gro
up
Mea
n P
rob
ab
ilit
y
Item-Groups
Class 1 (321) Class 2 (452) Class 3 (227)
33
mathematical knowledge in order to solve problems in various strands This was determined by the
average 91 overall probability for success achieved for those items related to Factor 1 They can
also be described as having a strong ability to apply thinking skills in order to solve problems
surrounding the Measurement topic of ldquoAreardquo and strong ability to do the same in various strands
This was determined by the 85 probability for success achieved for those items related to Factor
2 and 76 probability for success achieved for those related to Factor 3 Furthermore their overall
performances in the knowledge dimension can be described as stronger in comparison to their
performances in the thinking dimensions
Specifically concerning their ability to apply mathematical knowledge in various strands
(Factor 1) these learners can be described as performing slightly stronger in the Patterning and
Algebra (item-group probability score = 97) and considerably weaker in Data Management and
Probability (item-group probability score = 78) in relation to their performances in the other
strands Specifically regarding their ability to apply think skills in order to solve problems (Factor
3) they can be described as performing slightly stronger in Number Sense and Numeration (item-
group probability score = 80) and considerably weaker in Data Management and Probability (item-
group probability score = 72) and Patterning and Algebra (item-group probability score = 67) with
the latter being the weakest in relation to their performances in the other strands
Results further indicated that those learners most likely to belong to Class 2 performed
overall lower than Class 1 but higher than Class 3 in all item-groups Therefore this class to
which 452 of the learners belonged can be best described as the intermediate performing and
largest group overall Those most likely to belong to this class can be described as having a strong
ability to apply mathematical knowledge in order to solve problems in various strands This was
determined by the average 74 overall probability for success achieved for those items related to
Factor 1 They can also be described as having a weak ability to apply thinking skills in order to
solve problems surrounding the Measurement topic of ldquoAreardquo and moderately weak ability to do
the same in various strands This was determined by the 39 probability for success achieved for
34
those items related to Factor 2 and 51 probability for success achieved for those related to Factor
3 Furthermore their overall performances in the knowledge dimension can be described as
stronger in comparison to their performances in the thinking dimensions
Specifically concerning their ability to apply mathematical knowledge in various strands
(Factor 1) performances for these learners can be described as considerably stronger in Patterning
and Algebra (item-group probability score = 86) and considerably weaker in Data Management
and Probability (item-group probability score = 49) in relation to their performances in the other
strands Specifically regarding their ability to apply thinking skills in order to solve problems
(Factor 3) performances can be described as stronger in Number Sense and Numeration (item-
group probability score = 60) and considerably weaker in Data Management and Probability (item-
group probability score = 40) and Patterning and Algebra (item-group probability score = 43) with
the former being the weakest in relation to their performances in the other strands
Lastly results indicated that those learners most likely to belong to Class 3 performed lower
than Class 1 and 2 in all item-groups Therefore this class to which 227 of learners belonged
can be best described as the lowest performing group overall Those most likely to belong to this
class can be described as having a moderately weak ability to apply mathematical knowledge in
order to solve problems in various strands This was determined by the average 44 overall
probability for success achieved for those items related to Factor 1 They can also be described as
having a weak ability to apply thinking skills in order to solve problems surrounding the
Measurement topic of ldquoAreardquo and weak ability to do the same in various strands This was
determined by the 28 probability for success achieved for those items related to Factor 2 and
29 probability for success achieved for those related to Factor 3 Furthermore their overall
performances in the knowledge dimension can be described as stronger in comparison to their
performances in the thinking dimensions
Specifically concerning their ability to apply mathematical knowledge in various strands
(Factor 1) it was determined that these learners can be described as performing slightly stronger in
35
Geometry and Spatial Sense (item-group probability score = 50) and considerably weaker in Data
Management and Probability (item-group probability score = 19) in relation to their performances
in the other strands Specifically regarding their ability to apply thinking skills in order to solve
problems (Factor 3) their performance can be described as considerably stronger in Number Sense
and Numeration (item-group probability score = 44) and weaker in Data Management and
Probability (item-group probability score = 22) and Patterning and Algebra (item-group
probability score = 20) with the latter being the weakest in relation to their performances in the
other strands
In sum the results of the LCA revealed that three classes could be used to best describe the
performances of Grade 6 learners in the three dimensions as established during the EFA and their
related strands Class 1 was described as the highest performing and second largest group The
learners in the class were described as performing especially strong in Factor 1 (namely their
ability to apply mathematical knowledge to solve problems in various strands) strong in Factor 2
(namely their ability to apply thinking skills to solve problems specifically related to the
Measurement topic of ldquoAreardquo) and in Factor 3 (namely their ability to apply thinking skills in order
to solve problems in various strands) Class 2 was described as the intermediate performing and
largest group and performing strong for Factor 1 weak for Factor 2 and moderately weak for
Factor 3 Lastly Class 3 was described as the lowest performing and smallest group and
performing moderately weak for Factor 1 and weak for both Factor 2 and 3 For all classes overall
factor performances were described as weaker in the thinking dimensions namely Factor 2 and 3
than in the knowledge dimension namely Factor 1 A greater discrepancy between these
mathematical knowledges and thinking skills dimensions appears to exist for those in Class 2 than
for those in Class 1 and 3
Lastly in terms of describing the performances of each class in the strands related to each
factor for Factor 1 and 3 results revealed clear similarities between all classes in terms of those in
which performances were described as weaker For all classes regarding Factor 1 their ability to
36
apply mathematical knowledge within the Data Management and Probability strand was described
as the weakest in relation to the other strands For all classes regarding Factor 3 their ability to
apply thinking skills in the Patterning and Algebra and Data Management and Probability strand
was described as weakest in relation to their performances in the other strands
43 Predicting Mathematics Profiles by Language and Length of Residence Background
To avoid treating learners as homogenous groups based on their language background they
were allocated to one of six groups according to their ESL designation and length of residency in
Canada The six groups represented the predictor variable (independent variable) whereas the three
classes or performance profiles were treated as the predicted or dependent variable Class 1
namely the highest performing profile group was used as the reference category
Results of this analysis indicated that the final model did not significantly predict class and
performance profile membership with a -2 Log likelihood of 7740 and a Chi-square value of 957
(10 N = 5000) p = 48 The upper portion of Table 10 presents the regression coefficients the
Wald test adjusted odds ratio [Exp(B)] and the 95 confidence intervals (CI) for odds ratios for
the predictor contrasting Class 2 to Class 1 The lower portion of the table presents the regression
coefficients the Wald test adjusted odds ratio [Exp(B)] and the 95 confidence intervals (CI) for
odds ratios for the predictor contrasting Class 3 to Class 1
Results therefore revealed that ESL status and residence in Canada did not significantly
predict class or profile membership regardless of group allocation In other words regardless of
group allocation learners were found to be equally likely to belong to either Class 1 (highest
performing group) Class 2 (intermediate performing group) or Class 3 (lowest performing group)
and therefore perform according to the related profile as indicated earlier in Figure 2
37
Table 10
Parameter Estimates for Six Groups on 3 Classes
Model B SE - B Wald df Exp(B) 95 CI EXP (B)
Class 2
Intercept 43 23 351 1
Group 1 -07 23 09 1 93 60 ndash 147
Group 2 06 26 06 1 107 64 ndash 178
Group 3 -60 35 296 1 55 277 ndash 109
Group 4 01 31 00 1 101 55 ndash 183
Group 5 -08 28 09 1 92 54 ndash 158
Class 3
Intercept -13 26 27 1
Group 1 -23 26 74 1 80 48 ndash 133
Group 2 -20 31 42 1 82 47 ndash 149
Group 3 -36 39 84 1 70 33 ndash 150
Group 4 -35 37 92 1 70 34 ndash 144
Group 5 -53 33 255 1 59 31 ndash 113
Notes p lt 001 N = 5000 Class 1 is the reference category Group 1 = Non-ESL CA Born (n = 4185) Group 2 =
ESL CA Born (n = 308) Group 3 = Non-ESL Non-CA born but living in country less than 5 years (n = 76) Group 4
= ESL Non-CA born but living in country less than 5 years (n = 123) Group 5 = Non-ESL Non-CA born but living in
country 5 years or more (n = 199) Group 6 = ESL Non-CA born but living in country 5 years or more (n = 109)
38
Chapter 5 Discussion
The purpose of this study was to move beyond the total scores of a largescale assessment
in order to gain better insight into the mathematical performances of Ontariorsquos Grade 6 learners
In doing so it aimed to provide evidence of learner strengths and weaknesses in different aspects
of mathematics education on which to base remedial decisions for the improvement thereof
Using the responses of a random sample of 5000 Grade 6 learners to 28 multiple choice
mathematics items on the 20132014 EQAO Junior Division assessment an Exploratory Factor
Analysis (EFA) was firstly performed in order to investigate the dimensionality characteristics
of the assessment This was followed by a Latent Class Analysis (LCA) to determine learner
strengths and weaknesses related to the established mathematical dimensions and their related
strands Lastly a multinomial logistic regression analysis was performed in order to examine the
extent to which mathematics performance profiles were predicted by student background factors
such as language and length of residency in Canada This chapter discusses the findings of these
analyses study limitations and lastly recommendations for future research and education
51 What Characterizes the Dimensionality of the EQAO Mathematics Achievement Test Administered to Grade 6 Students in Ontario Public Schools
The multiple choice mathematics items on the EQAO assessment were characterized as
measuring the ability of learners in three interrelated yet separate mathematical dimensions
These being the ability of learners to apply mathematical knowledge related to procedural
knowledge and conceptual understanding to solve problems in various strands (Factor 1) the
ability to apply process or thinking skills such as problem solving or reasoning skills to solve
problems in ldquoAreardquo (Factor 2) and lastly the ability to apply process or thinking skills to solve
39
problems in various mathematical strands The three factors produced achieved on average
moderate reliability scores
These findings regarding the characteristics of the dimensions were considered valuable
as they allowed for the comparison of learner abilities in two essential elements of mathematical
proficiency as aligned with the Principles and Standards for School Mathematics (NCTM
2000) and as a result also with the Ontario mathematics curriculum which shares the same
foundations Only once this happens namely learner ability measured directly in relation with
mathematical curriculum expectations can we begin an effective process of remediation
(Kilpatrick et al 2001) These elements were that of mathematical knowledge consisting of
procedural and conceptual knowledge as measured by Factor 1 of this study and process or
thinking skills such as problem solving and reasoning as measured by Factor 2 and 3 Factor 2
and 3 were determined to differ based solely on the content of the items included in the
assessment This finding highlights concerns regarding the fair representation of all curriculum
expectations on the assessment and thus warrants further investigation
The fact that the ability to apply mathematical knowledge and the ability to apply
thinking skills in order to solve mathematical problems were found to be sufficiently unique
dimensions to warrant their use using the multiple choice items on this largescale mathematics
assessment adds further value to the findings of this study These findings are valuable in that
they attest to the future potential for assessment organizations to report learner performances
beyond that of total scores as demanded by those in the educational field However since the
factors achieved only moderate reliability scores we are reminded of the need for these tests to
be designed upon foundations aligned with those of the curriculum expectations they are
employed to assess from the start in order for them to meet better test properties (Chudowsky amp
Pellegrino 2003 Rogers 2014)
40
52 In which Mathematical Dimensions and Related Strands do Students Demonstrate Strengths and Weaknesses in their Mathematical Achievement
Three classes were determined to best describe the performances of all Grade 6 learners
in the established dimensions and their related strands Class 1 was described as the highest
performing and second largest group consisting of 321 of the learners Class 2 was described
as the intermediate performing and largest group consisting of 452 of the learners and lastly
Class 3 was described as the lowest performing and smallest group consisting of only 227 of
the learners from the sample
The results of this analysis further revealed that all three classes performed weaker in
their ability to apply thinking skills in order to solve problems either specifically surrounding
the topic of Area or in various strands than in their ability to apply mathematical knowledge in
order to do the same The performances of those in Class 1 were described as especially strong
in the mathematical knowledge dimension (Factor 1) and strong in the thinking dimensions
(Factor 2 and 3) Class 2 was described as strong in the mathematical knowledge dimension but
weak in the thinking skills dimensions and lastly Class 3 was described as moderately weak in
the mathematical knowledge and thinking skills dimensions The discrepancy between
performances in the two subdomains namely mathematical knowledge and thinking skills thus
appeared to be largest for those in Class 2 the intermediate performing and largest group
The findings concerning the overall performances of students in the two subdomains of
mathematical knowledge and thinking skills aligns with those concerning the performances of
US students as described by Kilpatrick et al (2001) They highlight that research evidence over
the past 30 years has consistently indicated that although US students do not fare badly in
applying their knowledge to solve basic mathematical problems they tend to have a limited
41
understanding of mathematical concepts and are noticeably deficient in their ability to apply
mathematical thinking skills to solve even simple problems
It may however be argued that this finding namely a weaker performance in thinking
skills than mathematical knowledge is to be expected given the fact that applying thinking skills
in order to solve problems is a more challenging task than simply applying what you know
(Schoenfeld 2007) However studies have also found that a strong mathematical knowledge
base leads to a better ability to apply thinking skills to solve deeper problems (Stokke 2015)
Thus given the inter-relatedness of these two dimensions together with the large discrepancy
between them for those in Class 2 (strong mathematical knowledge but weak thinking skills)
these findings demonstrate a weakness in the majority of Ontariorsquos Grade 6 learners to apply
thinking skills to solve deeper mathematical problems This finding holds important
recommendations for future research and mathematics educational practices as will be discussed
in the section below
Upon further investigation of learner performances in each of the strands as they relate to
the dimensions it was determined that all three classes performed much weaker in their ability to
apply mathematical knowledge in the Data Management and Probability strand than in the other
strands This strand was also determined to be the weakest in the thinking skills dimension
along with Patterning and Algebra This finding contradicts those of Tatsuoka Corter and
Tatsuoka (2004) in which it was found that students in the US appeared to perform poorest in
Geometry and Spatial Sense Given the inter-relatedness of mathematical knowledge and ability
to apply thinking skills as previously highlighted by Stokke (2015) this finding concerning Data
Management and Probability attests to a knowledge base weakness for Grade 6 Ontario learners
specifically surrounding this strand As for the results surrounding Patterning and Algebra they
appear to provide further support for the weak ability of the learners to apply thinking skills
42
given their relatively strong mathematical knowledge surrounding this strand These findings
also hold valuable recommendations for educational practices in Ontario which will be further
discussed below
53 To What Extent Are Mathematics Performance Profiles Predicted by Student Background such as Language and Residence Status
Findings from this analysis revealed that language background and length of residence in
Canada did not significantly predict performance profile membership Therefore regardless of
group allocation based on these variables all learners were equally likely to achieve a Class 1
(high performing) Class 2 (intermediate performing) or Class 3 (low performing) profile as
described in this study
These findings contradict the Jang et al (2013) study on the performance of learners in
reading In that study it was found that different reading patterns were achieved based on ELL
and length of residence status It was further determined that non-English speakers outperformed
monolinguals in reading achievement after living in the country for five years or more These
findings therefore do not appear to hold true for the performances of learners in mathematics
based on these variables as all learner groups were equally likely to achieve one of the three
performance profiles produced in this study However it needs to be acknowledged that this
study focused on ESL designation as opposed to ELL status which may have contributed to the
differences in findings Nonetheless these findings are considered valuable in that they provide
reassurance of the fact that the test results were not confounded by differences in language
proficiency and that the EQAO test was not biased towards first language speakers
The findings of this study further contradict those that found that English first language
speakers outperformed those for whom English was not their first language (Abedi amp Lord
43
2001 Howie 2003) Therefore they help shed perceptions of differences in mathematical
performances based solely on the aspect of language background This finding holds important
implications for mathematics education for these population groups as well as future research
54 Study Limitations
The following study limitations have been recognized and should thus be taken into
consideration when reviewing these findings Firstly this study analyzed the mathematical
performances of learners based on the results of a standardized test only We are therefore
reminded of the fact that many factors influence test scores over and above that which is random
These include the testing situation tester characteristics and test-taker characteristics (Kaplan amp
Saccuzzo 2009) For this reason it is important that learner performances in other assessment
environments also be considered such as classroom-based assessment activities
Secondly the findings of this study were based solely on learner performances on the
multiple choice items According to Schoenfeld (1992) most multiple choice items are machine
graded which limits their ability to measure learner conceptual understanding and problem
solving abilities to the degree that most people would like For this reason it is important that
future studies consider including the open response questions included on the assessment for a
better reflection of learner conceptual understanding and problem solving
Thirdly this study included performances of learners based solely on a single EQAO
administration and its data Although EQAO proclaims to instill rigorous test equating
procedures to ensure that test difficulty and discrimination properties are not compromised
across years (Rogers 2013) this does not guarantee that learner performances can be generalized
to all Grade 6 learners Furthermore this study focused on only those who took the English
44
version of the test therefore generalizing these findings to those who took the French version
should be done cautiously
Lastly the small ESL population size in comparison to the non-ESL population limits the
findings of this group and may therefore not accurately reflect their performances Furthermore
this study used ESL designation as opposed to ELL status ESL designation is a program in
which learners are enrolled or unenrolled throughout the year Therefore these findings may not
reflect that of the entire ELL population
55 Recommendations and Future Research
In light of recent poor mathematical performances of Ontariorsquos elementary learners the
education minister announced its ldquoRenewed Math Strategyrdquo designed for the purposes of
combatting further decline (Brown 2016) In this strategy requirements for improving the
performances of learners in mathematics were announced such as all learners in Grade 1-8 to
receive at least 60 minutes of mathematics instruction per day further support for weaker
schools in terms of more professional development for teachers as well as more support for
learners and parents surrounding this discipline As this study made apparent in the beginning
such strategies risk being only blanketed approaches that do not really target the heart of the
problem if not accompanied by further insight into the results upon which they are based
This study was conducted in an attempt to gain such insight and found that although
Ontario Grade 6 learners display strong mathematical knowledge the majority are particularly
weak in applying thinking skills such as reasoning and problem solving to solve deeper
mathematical problems It was further determined that learners are particularly weakest in the
Data Management and Probability strand for both mathematical knowledge and thinking skills
dimensions as well as the Patterning and Algebra strand in the latter dimension It was lastly
45
determined that background variables of language and length of residence did not significantly
predict performance and profile achievement and that both ESL and non-ESL learners were
equally likely to belong to high intermediate and low performing groups regardless of length of
residence in Canada Based on these findings the following recommendations surrounding
future research endeavors and educational practices specifically in conjunction with mathematics
education in Ontario will be discussed below
The Ontario Curriculum Grades 1-8 Mathematics 2005 document indicates that the
ultimate goal for mathematics education is to develop learner proficiency beyond that of content
knowledge and therefore also calls for the development of a deeper understanding of the
discipline along with essential thinking skills In order to accomplish these goals the
curriculum highlights that instructional practices need to deviate from a sole focus on direct
teaching methods to incorporate methods of teaching and learning through problem solving in
other words problem-based learning approaches Stokke (2015) blames this greater emphasis of
teaching mathematics using problem-based teaching strategies for the recent decline of Ontario
learnersrsquo mathematical performances She argues that the lack of direct instruction has robbed
learners of a sound knowledge base from which to draw upon when attempting to solve deeper
mathematical problems hence the weakness in this area
However the findings from this study provides evidence that contradicts this argument
as results point to the fact that the majority of Grade 6 learners in Ontario actually do possess
strong mathematical knowledge This finding may therefore perhaps be an indication of the
fact that a large portion of Ontario teachers still rely predominantly on teaching mathematics
using traditional direct teaching methods as opposed to those better suited to meet current
curriculum goals and expectations This finding therefore warrants further investigation into
current teaching trends and holds valuable insight as to where to direct efforts for remediation
46
In order to meet reformed curriculum goals and expectations teaching practices need to
change for which the teacher is the key actor (Ross amp McDougall 2006) Therefore this study
supports those calling for increased efforts directed at teachers and the need to reshape their roles
and perceptions of what it means to ldquoteachrdquo mathematics in a reformed curriculum classroom
For instance Milgram (2007) urges for strategies directed at ensuring that teachers truly
understand what it means to teach using problem-based teaching methods to develop thinking
skills He further illustrates that teaching thinking skills such as problem solving is a
challenging task as it is in itself complex involving both verbal and nonverbal mental processes
For this reason it is essential that learners solve problems for which the answer is not apparent
and requires a novel idea if we wish to effectively develop these skills (Milgram 2007) Such a
teaching and learning process requires that teachers step back allowing learners to grapple with
the task before them as well as interact with each other stepping in only when necessary to
guide the process (Milgram 2007)
Changing the role of the teacher from the traditional sole knowledge bearer and
transferor to one in which heshe shares the responsibility of learning with students is however
only one of 10 dimensions that requires attention when urging teachers to adopt instructional
practices better suited to accomplish curriculum goals and expectations (Ross amp McDougall
2007) Ross and McDougall (2006) further illustrate that in order to ensure that teaching for
deeper understanding as aligned with current reformed mathematics education takes place
teachers need to consider change in all 10 of these dimensions These dimensions as cited in
Ross and McDougall (2006) are summarized as follows 1) the need for program scope 2)
access to all forms of mathematics by students 3) raising self-confidence of students by teachers
4) complex and open-ended student tasks 5) instruction that focuses on constructing
mathematical ideas through self-discovery 6) change in the role of teachers to that of co-learner
47
and co-knowledge creator 7) solving of mathematical problems with the aid of manipulatives 8)
classroom organization in a manner that promotes sharing and interaction for solutions 9)
authentic assessment and lastly 10) a conception of mathematics as a dynamic subject by
teachers
Specifically regarding the first dimension namely the need for program scope Ross and
McDougall (2006) describe it as urging teachers to teach multiple mathematical strands with
increased attention on those less commonly taught such as the Data Management and
Probability and Patterning and Algebra strands The results of this analysis indicated that
learners were weakest in precisely these two strands therefore perhaps providing evidence in
support of the fact that these strands are given less attention by Ontario teachers when teaching
the mathematics curriculum expectations This finding therefore provides added support for the
need to further promote the implementation of these 10 dimensions of teaching for deeper
understanding as indicated above so as to ensure that teachers view all curriculum strands as
equally important and deserving of attention
In calling for these increased efforts directed at changing the way in which mathematics
teaching and learning occurs in classrooms it is important to acknowledge the fact that this is
easier said than done Teaching in a manner that supports the development of a deeper
understanding for mathematics and promotes thinking skills is a lengthy process that takes time
(Milgram 2007) A commodity in short supply for the teacher already feeling pressured to
cover all curriculum expectations before mandatory accountability assessments take place
(Milgram 2007) Therefore not only does this study call for increased efforts directed at
changing teacher perceptions and instructional practices in the classroom but also for policy
makers to consider practical constraints placed on teachers that may restrict the implementation
thereof
48
Lastly the need to predict mathematical performances of learners based on background
variables is made apparent by Hinton (2014) who found that early success in mathematics
predicts future success Therefore for the sake of early intervention especially for the lowest
performing group identified in this study it is urged that further research studies be directed at
determining background variables that better predict performances However it is further urged
that such studies focus on class or profile membership as used in this study as opposed to overall
mathematics performances used in the past In this way not only will we be able to better
identify low intermediate and high performers but also their related strengths and weaknesses
upon which specific remedial efforts can be targeted As for the equal likelihood of ESL and
non-ESL learners to achieve either low intermediate or high performing profiles this study
recommends future studies targeted at shedding perceptions of non-English speakers
underperforming in relation to first language speakers that have perhaps been shaped by previous
studies Without doing so we risk assuming the need for remediation directed at one group
whilst ignoring the needs of others
49
References
Abedi J amp Lord C (2001) The language factor in mathematics tests Applied Measurement
in Education 14(3) doi 101207S15324818AME1403_2
Brown J (2016) Elementary student to get hour of math every day under new Ontario plan
Retrieved July 23 2016 from
httpswwwthestarcomyourtorontoeducation20160404elementary-students-to-get-
hour-of-math-every-day-under-new-ontario-planhtml
Chudowsky N amp Pellegrino JW (2003) Large-scale assessments that support learning what
will it take Theory into Practice 42(1) 75+ Retrieved from
httpgogalegroupcommyaccesslibraryutorontocapsidop=AONEampu=utoronto_mai
nampid=GALE|A99909373ampv=21ampit=rampsid=summonampuserGroup=utoronto_mainampauth
Count=1
Collins L K amp Lanza S T (2010) Latent class and latent transitional analysis with
applications in the social behavioral and health sciences Hoboken NJ Wiley amp Sons
DePascale C (2014) The ideal role of large-scale testing in a comprehensive assessment
system Journal of Applied Testing Technology 5(1) 1-11 Retrieved from
httpwwwjattjournalcomindexphpatparticleview48343
Education Quality and Accountability Office (2016) About the agency Retrieved May 26
2016 from EQAO
httpwwweqaocomenabout_eqaoabout_the_agencyPagesabout-the-agencyaspx
Education Quality and Accountability Office (2014) EQAOrsquos provincial elementary school
report 2014 Retrieved September 26 2015 from EQAO
httpwwweqaocomenassessmentsresultsPagesprovincial-report-elementary-
2014aspx
Figlio D amp Loeb S (2011) School accountability In EA Hanushek S Machin and L
Woessmann (Eds) Handbooks in Economic The Netherlands North-Holland pp 383-
421
Foster D Noyce P amp Spiegel S (2007) When assessment guides instruction Silicon
Valleyrsquos mathematics assessment collaboration In AH Schoenfeld (Ed) Assessing
mathematical proficiency (pp 137-154) Cambridge Cambridge University Press
Friesen S (2005) Math Teaching it better Education Canada 46(1) 6-10
Furr R M (2011) Scale construction and psychometrics for social and personality psychology
Los Angeles SAGE
Fillmore L W (2007) English learners and mathematics learning language issues to consider
In AH Schoenfeld (Eds) Assessing mathematical proficiency (pp 333-344) Cambridge
Cambridge University Press
50
Haertel E H amp Herman J l (2005) A historical perspective on validity arguments for
accountability testing Yearbook of the National Society for the Study of
Education 104(2) 1-34 doi101111j1744-7984200500023x
Hinton A (2014) Tracking student achievement in mathematics over time in English language
schools Retrieved from
httpwwweqaocomenresearch_dataResearch_ReportsPagesstudent-
achievementaspx
Howie S (2005) System-level evaluation Language and other background factors affecting
mathematics achievement Prospects 35(2) 175-186 doi101007s11125-005-1820-
8
Huff K amp Goodman DP (2007) The demand for cognitive diagnostic assessment In JP
Leighton amp MJ Gierl (Eds) Cognitive Diagnostic Assessment for Education (19-60)
New York Cambridge University Press
IBM Corp Released 2013 IBM SPSS Statistics for Windows Version 230 Armonk NY IBM
Corp
Jang E E amp Ryan K (2003) Bridging gaps among curriculum teaching and learning and
assessment Book review Kifer E (2001) Large-scale assessment Dimensions
dilemmas and policy Journal of Curriculum Studies 35(4) 499-512
Jang EE Dunlop M Wagner M Kim Y amp Gu Z (2013) Elementary school ELLsrsquo
reading skill profiles using cognitive diagnosis modelling Roles of length of residence
and home language environment Language Learning 63(3) 400-436 doi
101111lang12016
Kaplan RM amp Saccuzzo DP (2009) Psychological Testing Principles Applications and
Issues Belmont Wadsworth Cengage Learning
Kilpatrick J Swafford J Findell B amp National Research Council (US) (2001) Adding it
up Helping children learn mathematics Washington DC National Academy Press
Klinger D A amp Rogers W T (2011) Teachers perceptions of large-scale assessment
programs within low-stakes accountability frameworks International Journal of
Testing 11(2) 122-143 doi101080153050582011552748
La Rose L (2014) PISA results Canada students high level achievers but math and science
scores dip The Huffington Post Retrieved October 5 2015 from
httpwwwhuffingtonpostca20131203pisa-results-canada-
studentrankings_n_4376190html
Meyers L S Gamst G amp Guarino A J (2006) Applied multivariate research Design and
interpretation Los Angeles Sage
Milgram R J (2007) What is mathematical proficiency In AH Schoenfeld (Eds) Assessing
mathematical proficiency (pp 31-58) Cambridge Cambridge University Press
51
Moschkovich J (2007) Beyond words to mathematical content Assessing English learners in
the mathematical classrooms In AH Schoenfeld (Eds) Assessing mathematical
proficiency (345-352) Cambridge Cambridge University Press
Mutheacuten LK amp Mutheacuten BO (1998-2010) Mplus Userrsquos Guide (6th Ed)
Los Angeles CA Mutheacuten amp Mutheacuten
Nagy P (2000) The three roles of assessment Gatekeeping accountability and instructional
diagnosis Canadian Journal of Education 25(2) Retrieved from
httpmyaccesslibraryutorontocaloginurl=httpsearchproquestcomdocview215374
855accountid=14771
National Council of Teachers of Mathematics (2000) Principles and standards for school
mathematics Reston VA National Council of Teachers of Mathematics
Nichols P D (1994) A framework for developing cognitively diagnostic assessments Review
of Educational Research 64(4) 575 Retrieved from
httpmyaccesslibraryutorontocaloginurl=httpsearchproquestcomdocview214116
755accountid=14771
Nylund K L Asparouhov T amp Mutheacuten B O (2007) Deciding on the number of classes in
latent class analysis and growth mixture modeling A monte carlo simulation
study Structural Equation Modeling A Multidisciplinary Journal 14(4) 535-569
doi10108010705510701575396
OECD (2014) PISA 2012 Results What Students Know and Can Do Student Performance in
Mathematics Reading and Science doi httpdxdoiorg1017879789264208780-en
Ontario (2005) The Ontario curriculum grades 1-8 Toronto Ontario Ministry of Education
Pastor D A Barron K E Miller B J amp Davis S L (2007) A latent profile analysis of
college students achievement goal orientation Contemporary Educational
Psychology 32(1) 8-47 doi101016jcedpsych200610003
Rogers WT (2013) What is the quality of EQAO assessments Excellent Retrieved
September 24 2015 from
httpwwweqaocomenresearch_dataResearch_ReportsPagesbest-assessment-
practicesaspx
Rogers WT (2014) Improving the utility of large-scale assessments in Canada Canadian
Journal of Education 37(3) Retrieved from httpcje-rcecaindexphpcje-
rcearticleview1732
Ross JA amp McDougall D E (2006) Mathematics In K Leithwood P McAdrie N Bascia
amp A Rodrigue A (Eds) Teaching for deep understanding Towards the Ontario
curriculum that we need (pp 33-39) Thousand Oaks CA Corwin Publishing
Schoenfeld A H (2007) Issues and tensions in the assessment of mathematical proficiency In
52
AH Schoenfeld (Ed) Assessing mathematical proficiency (pp3-15) Cambridge
Cambridge University Press
Schoenfeld A H (2007) What is mathematical proficiency and how can it be assessed In
AH Schoenfeld (Ed) Assessing mathematical proficiency (pp 59-73) Cambridge
Cambridge University Press
Schoenfeld A H (1992) Learning to think mathematically Problem solving metacognition
and sense making in mathematics In D Gouws (Ed) Handbook for research on
mathematics teaching and learning (pp 334-370) New York Macmillan
Schumacker R E amp Lomax R G (2004) A beginnerrsquos guide to structural equation modeling
(2nd ed) Mahwah NJ Lawrence Erlbaum Associates
Shapka J Domene J amp Keating D (2006) Trajectories of career aspirations through
adolescence and young adulthood Early math achievement as a critical filter
Educational Research and Evaluation 12(4) 347-358 Retrieved from
httpdxdoiorg10108013803610600765752
Statistics Canada (2016) Immigration and Ethnocultural Diversity in Canada Retrieved May
31 2016 from httpswww12statcangccanhs-enm2011as-sa99-010-x99-010-
x2011001-engcfm
Stein MK Remillard J amp Smith MS (2007) How curriculum influences student learning
In FK Lester amp National Council of Teachers of Mathematics (Eds) Second handbook
of research on mathematics teaching and learning a project of the National Council of
Teachers of Mathematics (pp 1099) Charlotte NC Information Age Pub
Stokke A (2015) What to do about Canadarsquos declining math scores Retrieved from
httpswwwcdhoweorgpdfcommentary_427pdf
Tatsuoka K Corter J amp Tatsuoka C (2004) Patterns of Diagnosed Mathematical Content
and Process Skills in TIMSS-R across a Sample of 20 Countries American Educational
Research Journal41(4) 901-926 Retrieved from
httpwwwjstororgmyaccesslibraryutorontocastable3699467
Uebersax JS (2015) Introduction to the Tetrachoric and Polychoric Correlation Coefficients
Retrieved July 20 2015 from httpjohn-uebersaxcomstattetrahtm
Wilson L D (2007) High-stakes testing In FK Lester and National Council of Teachers of
Mathematics (Eds) Second handbook of research on mathematics teaching and learning
a project of the National Council of Teachers of Mathematics (pp 1053 -1098)
Charlotte NC Information Age Pub

2
among the higher performing achievers performance of its 15 year olds declined by 14-points
compared to nine years ago (La Rose 2014)
These results have been further echoed on a provincial level as revealed by the results
produced by the provincial accountability office of Ontario namely the Education Quality and
Accountability Office (EQAO) A report produced by this organization showed that since 2009
the number of Grade 3 and Grade 6 learners to achieve the provincial standard in mathematics
has decreased significantly despite an increase in reading and writing performances over the
same time (EQAO 2014) An even more startling statistic presented in this report is the fact that
only 54 of Ontariorsquos Grade 6 learners achieved the provincial standard in 2014 a decline from
61 in the 2012 assessment The revelation of these results have sent shockwaves throughout
all stakeholder levels in Ontario from government agencies to teachers parents and learners
and have therefore sparked numerous debates and heightened the demand for remedial strategies
Largescale assessments such as the aforementioned PISA and EQAO tests serve
predominantly as tools to satisfy the demand for accountability and educational improvements in
public schooling systems (Chudowsky amp Pellegrino 2003 Rogers 2014) Educators are held
accountable for studentsrsquo academic achievement measured against standards or expectations as
laid out in the curriculum document of a particular discipline of interest School improvement
plans are directed based on the performances of students on these accountability measures In
some cases sanctions associated with the test results raise concerns about narrowing the
curriculum to the tested content as well as educatorsrsquo morale (Jang amp Ryan 2003) Although the
practice of using largescale assessments in education dates back to the 19th century and has
grown exponentially since the implementation of the No Child Left Behind Act (DePascale
3
2003) much controversy exists surrounding their impact on education without pedagogically
useful information concerning what students know and can do with their learning
The generation of a total score to serve as the sole indicator on which to reflect the
overall performances of learners on largescale assessments is a popular approach adopted by
organizations for the purpose of providing feedback to stakeholders (Nichols 1994) Total
scores however have been criticized for providing an overly simplistic representation of learner
abilities which in addition to heightening the risk of result abuse (Earl 1999) and lacks the
necessary insight into learner abilities on which to base any meaningful decisions for the
improvement of education (Nichols 1994 Rogers 2014) For this reason it is argued whether
or not any remedial action based on these results in an attempt to improve mathematical
educational practices can extend beyond anything more than the implantation of blanketed
remedial strategies without further insight
The purpose of this study was therefore to go beyond total scores to gain better insight
into the mathematical performances of Grade 6 learners of Ontario in an attempt to produce
evidence on which to base remediation Using the results of the EQAO provincial assessment
this study aimed to investigate learner strengths and weaknesses in different aspects of
mathematics as determined by an analysis of the dimensionality of the items that make up the
assessment Furthermore this study used language background variables and length of residence
in Canada in an attempt to better identify learners and predict performance profile membership
The responses of a sample of Grade 6 learners to 28 multiple choice mathematics items
on the EQAO provincial assessment were analyzed The following questions were addressed in
this study
4
i What characterizes the dimensionality of the EQAO mathematics achievement
test administered to Grade 6 students in Ontario public schools
ii In which mathematical dimensions and related strands do students demonstrate
strengths and weaknesses in their mathematical achievement
iii To what extent are mathematics performance profiles predicted by student
background such as language and length of residence status
5
Chapter 2 Literature Review
This chapter discusses largescale assessments in education as well as their scoring and
reporting practices This is followed by an overview of mathematics education and its associated
curriculum as well as the factors predicting the performances of learners therein
21 Largescale Assessments in Education
Much of the origin and development of largescale testing in education can be traced back
to 1845 in the United States where they were first implemented in Boston schools and
championed for their use as a superior way to examine pupils (Wilson 2007) Today the
concept of educational testing has expanded into a multi-million-dollar business (Wilson 2007)
with largescale assessments serving as the measurement tool of choice on which to gauge the
system of education (Rogers 2014)
Largescale assessments can be characterized by the way in which they are administered
to large groups of learners simultaneously and in a highly standardized manner (Wilson 2007)
The foundations of these assessments rest on the same ideas as criterion referenced tests and are
classified as standards-based rather than norm-referenced tests (Kaplan amp Saccuzzo 2007) In
other words these largescale standards-based assessments compare the performances of
individuals against specific types of skills tasks or knowledge such as curricular standards or
expectations whereas norm- referenced tests compare each person with a norm and therefore
forces competition among people (Kaplan amp Saccuzzo 2007)
Largescale assessments in education were originally used to sort and classify learners
today they still serve this gatekeeping purpose but are also employed to serve two other
functions to which the majority of attention has shifted namely holding those responsible for the
6
education of learners accountable (accountability) and for the improvement of education
(Chudowsky amp Pellegrino 2003 Nagy 2000) School accountability involves the process of
evaluating school performance on the basis of student performance measures (Figlio amp Loeb
2011) and forms part of the system used by officials in education to monitor the effective
functioning of schools
It can also be characterized as either a high- or low-stakes system which further
differentiates the use of the results For instance according to Rogers (2014) accountability in
Canada is considered to be a low-stakes system and therefore the emphasis is predominantly on
using the results for educational improvement In contrast the United States is considered to be
a high-stakes system as results are used chiefly to sanction and reward schools
Although the use of largescale assessments in education have been credited for providing
an objective ldquoyardstickrdquo on which to measure learnersrsquo performances (Rogers 2014) and for
their ability to simplistically rank individuals along a highly reliable scale (Huff amp Goodman
2010) they have endured much criticism from those within the field Not only has much of this
been centered around their many unintentional consequences such as promotion of teaching to
the test test preparation activities at the expense of instructional time dishonesty among
educators and student drop out (Rogers 2014 Schoenfeld 2007) but also their scoring and
reporting practices and procedures These criticisms have led to much doubt concerning their
effectiveness as a tool to serve the purposes for which they are employed
211 Scoring and Reporting Practices of Largescale Assessments
It is common practice for largescale assessments to be scored using Item Response Theory
or Classical Test Theory in order to generate a total score and to use only these to report the
overall performances of learners on the assessment (Nichols 1994) Although this scoring and
7
reporting procedure is credited for being relatively quick and cost effective (Chudowsky amp
Pellegrino 2003) they serve merely to highlight that there is a problem but provide little
direction as to what the problem is (Nichols 1994) Foster Noyceand Speigel (2007) sum up
the criticism against total scores by stating that although they may reassure a schoolrsquos staff about
student progress or alert them to trouble ahead they do little to inform teachers about how
students are thinking what they understand where they are falling down and how specifically
teachers might change their own instructional practices to address studentsrsquo difficulties
The over simplistic representation of learner performances by total scores therefore lacks
the necessary insight on which to base remedial decisions (Nichols 1994) For this reason the
effectiveness of largescale assessments as a tool for improving education has been questioned
(Rogers 2014) For instance it is expected that educators and principles use results of largescale
assessments to improve their instructional practices (Rogers 2014) however in a study
conducted by Klinger and Rogers (2013) it was discovered that they in fact found little
direction from these results to do so This has led to an increased demand from those within the
field for these assessments to report more than only overall performances in the form of total
scores (Huff amp Goodman 2010 Nichols 1994 Rogers 2014) Detailed information from
assessments can help those in education including teachers and students identify content and
curricular areas that need attention (Schoenfeld 2007) and in so doing aide in the improvement
of education in disciplines where it is needed the most
212 Test Development Procedures
Largescale assessment organisations commonly adopt traditional unidimensional
frameworks to form the basis of test development procedures A unidimensional framework is
one that assumes a single factor or latent variable as an explanation for a certain behaviour such
8
as academic ability (Kaplan amp Saccuzzo 2007) However many curricular in practice today
have been developed on a multidimensional framework such as that of mathematics where
academic ability is assumed to consist of more than one skill or factor
Furthermore test development practices are performed taking into consideration certain
test constraints for instance test format which is usually paper-and-pencil based as well as
administration time For this reason it is impossible to include items to measure all curriculum
expectations in one test (Haertel amp Herman 2005) This sampling process of curriculum
expectations therefore also means that only few items for each expectation are included in the
assessment (Rogers 2014)
In addition to these test development procedures raising construct validity concerns
(Wilson 2007) they limit the reporting of test scores beyond anything more than overall total
scores As highlighted by Rogers (2014) since the assessment was never designed from an
explicit framework in line with that of curriculum expectations from the start as well as include
only a few items targeted at each subdomain it is highly unlikely that the assessment meets the
rigorous test properties needed to allow for reporting anything beyond that of total scores
In order to satisfy the many calls for change to reporting practices assessment
organisations would need to deviate from these traditional more cost effective practices For this
reason Chudowsky and Pellegrino (2003) indicate that change is unlikely to happen soon As a
result our efforts to improve education in disciplines where it is needed the most will continue
to take place within the confinements of that which assessment organisations refuse to change
22 Mathematics Education and Curriculum
The mathematical reform movement generated in the late 1950rsquos signaled the need for the
implementation of better teaching and learning practices for mathematics in schools (Friesen
9
2005) Today many mathematics curricular worldwide including that of Canada are based on
the Principles and Standards for School Mathematics as set out by the National Council of
Teachers of Mathematics (NCTM) (Friesen 2005) Very broadly curriculum refers to the
substance or content of teaching and learning it focusses on the ldquowhatrdquo of teaching and learning
as opposed to the ldquohowrdquo (Stein Remillard amp Smith 2007)
This NCTM document calls for the teaching and learning of mathematics with the goal of
developing both content or procedural knowledge and conceptual understanding of the
discipline through the application of essential thinking or processing skills such as problem
solving or reasoning skills which in turn will be developed (NCTM 2000) This goal for
mathematics education is in stark contrast to that of traditional goals where only the teaching and
learning of procedural or content knowledge was valued and taught through rote teaching and
learning practices (Schoenfeld 2007) Procedural knowledge refers to what and how to solve
certain mathematical problems whereas conceptual understanding refers to why a certain
problem is solved the way it is (Kilpatrick Swafford Findell amp NRC 2001)
Furthermore the NCTM adopted the view that standards play a leading role in guiding
the improvement of mathematics education (NCTM 2000) It therefore highlights specific
mathematical standards or expectations that learners should achieve Specifically five Content
Standards are used to guide the teaching and learning of procedural and conceptual knowledge
namely Number and Operations Algebra Geometry Measurement and Data Analysis and
Probability Five Process Standards also guide the essential processes or thinking skills of
Problem Solving Reasoning and Proof Communication Connections and Representation
(NCTM 2000) The NCTM (2000) repeatedly proclaims the interconnectedness of these
standards by indicating that procedural knowledge should never exist without conceptual
10
understanding which in turn should not be developed without the application and acquisition of
the essential processing skills
The Content and Process Standards are further classified into groups or categories for
assessment purposes in mathematics curricular such as that of Ontario Specifically the Ontario
Curriculum Grades 1-8 Mathematics 2005 document describes four categories of Knowledge
and Understanding Thinking Communication and Application to which the standards are
allocated These four categories are known as the Knowledge and Skills categories and are
reflected in the documentrsquos Achievement Chart The first category of Knowledge and
Understanding can be described as encompassing mathematical knowledge of content and
understanding and therefore focusses predominantly on the achievement of the Content
Standards The remaining three categories focus predominantly on the use of the Process
Standards The Thinking category assesses the use of problem solving reasoning and proving
processes the Communication category focusses on the assessment of the communicating
processes and lastly the Application category focusses on the assessment of the connecting
processes
From the above mathematics curriculum we can see that the knowledge base is still
considered important in mathematics education however so is conceptual understanding and the
application and acquisition of thinking skills As stated by Schoenfeld (2007) anyone who lacks
a solid grasp of facts procedures definitions and concepts is significantly handicapped in
mathematics yet there is more to being mathematically proficient than simply reproducing
standard content on demand Therefore if we are interested in understanding mathematical
proficiency as it is taught and learned today it is important that we reflect learner abilities in all
aspects of the discipline (Kilpatrick et al 2001) In so doing we will gain better insight into
11
their strengths and weaknesses allowing us to remediate accordingly in our efforts to improve
learner performances in this essential discipline
23 Factors Predicting Mathematical Performances
Given the relative importance of mathematics it is no surprise that much research has been
dedicated to highlighting and isolating the number or factors that can influence and predict
mathematical performances By doing so early interventions and remedial strategies can be
better targeted to improve future mathematical success (Hinton 2014)
One such factor that has been given much attention is that of language proficiency and its
influence on mathematical performances Studies conducted by Hinton (2014) Howie (2005)
and Abedi and Lord (2001) for instance discovered that learners who spoke English as a second
language performed worse in mathematical assessments compared to their English proficient
counterparts Fillmore (2007) however cautions against interpreting this as a lack of
mathematical ability without firstly taking into account the aspect of language Since much of
the mathematics taught today is presented in the form of a word problem it relies heavily on a
deep understanding of language (Moschovich 2007) Therefore trying to tease out precisely
how much of the struggle is related to a language issue and how much to an issue with
mathematics is a unique challenge for teachers assessment and English Language Learners
(ELLrsquos) (Fillmore 2007) As highlighted by Moschovich (2007) assessment is certainly a
complex task perhaps especially when working with students who are learning English It is
challenging to decide whether an utterance reflects a studentrsquos conceptual understanding a
studentrsquos proficiency in expressing their ideas in English or a combination of mathematical
understanding and English proficiency
12
Canada has a high and diverse immigrant population for instance 206 of its population
in 2011 was determined to be comprised of immigrants from various countries (Statistics
Canada 2016) Thus the mathematical performances of ELLrsquos cannot be ignored Fortunately
this aspect is currently given attention in the province of Ontario as assessment organizations
such as the EQAO do attempt to report separately on these learnersrsquo performances However
Jang Dunlop Wagner Kim and Gu (2013) warn against treating ELLrsquos as a homogenous group
Their study found that when taking into account the length of residence in Canada
performances of these students varied significantly concerning their reading proficiencies
Therefore if we wish to predict mathematical performances or gain better insight based on
student background such as language factors it is necessary to consider subpopulation groups
that make up the overall ELL population such as length of residence in the country
13
Chapter 3 Method
This chapter describes the participants instrument and data as well as the three main
analyses used to answer the questions presented in this study
31 Participants
The current study used data made available by the Education Quality and Accountability
Office (EQAO) of Ontario The EQAO is an arms-length Ontario government agency that is
responsible for developing and overseeing reading writing and mathematics assessments
administered to Grade 3 6 9 and 10 students in Ontario public schools The purpose of the
results of these largescale assessments is to determine the extent to which learners have achieved
the curriculum standards of the particular discipline for educational accountability and
improvement purposes (EQAO 2016)
Learnersrsquo responses are scored by the EQAO using Classical Test Theory and Item
Response Theory (Rogers 2013) to generate a score that is then converted into a Level NIE 1 2
3 or 4 Level 3 describes a performance at the provincial standard whereas Level 4 a
performance surpassing the standard Level 2 a performance approaching the standard and Level 1
a performance much below the standard Lastly a ldquoNIErdquo rating is generated for those learners
who have not provided sufficient evidence for a Level 1 score The EQAO test scores are reported
using these proficiency levels for each of the areas tested namely reading writing and
mathematics Background information such as gender time lived in Canada and student home
language etc is also collected by questionnaires administered by the EQAO over the same time
The full population data set comprised of approximately 127 302 Grade 6 learnersrsquo
responses to the English 20132014 provincial Junior Division assessment A random sample of
5000 learner responses to the assessment was drawn from the entire data set Learners with
missing data on any of the variables were excluded from the sampling process so that the final
14
data set contained responses to all mathematics items as well as background information All
learners within the sample were enrolled at the time in Grade 6 and attended various schools
across the province Table 1 below presents the distributions of student subgroups from the
random sample based on their gender language background and time spent in Canada in
comparison with the entire population The percentage of learners in each subgroup was very
closely aligned with the larger Grade 6 population and was therefore considered a representative
sample
Table 1
Final Random Sample used for the Analysis
Standard Gender Language Time lived in Canada
Met
Below
Female
Male
Non-
ESL
ESL
CA
Born
Non-CA
born lt 5
years
Non-CA
born ge 5
years
Frequency 2765 2235 2456 2544 4460 540 4493 199 308
Sample 553 447 491 519 892 108 899 4 62
Population 54 46 49 51 887 113 871 4 89
Notes N = 5000 Standard = met the provincial standard or achieved below the provincial standard ESL = enrolled in
English as a Second language program Time lived in Canada = Canadian born learners non-Canadian born learners
who have lived in Canada for less than 5 years and non-Canadian born learners who have lived in Canada for 5 years
or more
32 Instrument
Student responses to the mathematics test items and background information on the EQAO
20132014 Junior Division assessment were used for this study This assessment is a provincially
mandated largescale assessment used by the Ontario government to measure the extent to which
learners have achieved the standards as laid out in the curriculum All the EQAO largescale
assessments are designed using rigorous development procedures and meet high testing standards
with acceptably high reliabilities (Rogers 2013) of above 80 The Junior Division assessment is
15
specifically administered to all Grade 6 learners attending schools within the province of Ontario
during the months of May and June and under highly standardized conditions (EQAO 2016) The
assessment measures reading writing and mathematical skills in each of the corresponding
sections The mathematics section specifically consists of 36 items of which 28 are multiple choice
items and 8 are constructed-response format questions This study included only the 28 multiple
choice items
While the EQAO does not claim to measure the Knowledge and Skills categories as laid out
in the Ontario Curriculum Grades 1-8 Mathematics 2005 document (Rogers 2013) it still
references each of the mathematics items to one of three of the categories namely that of
Knowledge and Understanding Thinking and Application The category of Communication is not
represented by any of the items as according to Rogers (2013) this skill is not feasible to assess in
a paper-and-pencil based test For items to be referenced to the Knowledge and Understanding
category they need to be recognized as requiring students to demonstrate subject specific content
and comprehend its meaning Those referenced to the Application category need to be recognized
as requiring students to select an appropriate mathematical tool and apply the appropriate
information Lastly those referenced to the Thinking category need to be seen as requiring of
students to select and sequence a variety of tools and think critically in order to solve problems
(Rogers 2013) Items are scrutinized by teachers and other content experts for the process of
allocating items to the most appropriate category Items are further referenced to the five content
areas or strands of the curriculum document according to their content topic namely Number Sense
and Numeration Measurement Geometry and Spatial Sense Patterning and Algebra and Data
Management and Probability
Table 2 shows the representation of each of the Knowledge and Skills categories and the
strands to which the 28 multiple choice items were referenced by the EQAO as well as the item
difficulties (p-values) and discrimination indices (pt-biserial correlations) for each of these items
According to Kaplan and Saccuzzo (2007) item difficulty values should range from 30 to 70 to
16
maximize information about the differences among individuals Furthermore item discriminability
values should not be negative or below 20 to be considered adequate Based on these
recommendations all 28 items were considered suitable to be included in the analyses of this study
Table 2
Knowledge and Skills Categories Strands and Descriptive Statistics of 28 Mathematics Items
Item Know amp Skill Strand p-value pt-biserial
1 K and U Patterning amp Algebra 86 39
14 K and U Patterning amp Algebra 74 43
3 K and U Number Sense amp Numeration 76 37
15 K and U Number Sense amp Numeration 86 35
9 K and U Data Management amp Probability 48 33
19 K and U Measurement 50 27
25 K and U Measurement 76 40
22 K and U Geometry amp Spatial Sense 87 34
73 36
11 App Patterning amp Algebra 81 43
24 App Patterning amp Algebra 70 37
26 App Patterning amp Algebra 40 30
5 App Number Sense amp Numeration 56 38
7 App Number Sense amp Numeration 82 30
10 App Data Management amp Probability 55 47
18 App Data Management amp Probability 78 47
23 App Data Management amp Probability 71 42
2 App Measurement 59 31
8 App Measurement 58 28
20 App Measurement 54 47
6 App Geometry amp Spatial Sense 68 38
64 38
17 Think Patterning amp Algebra 52 36
21 Think Number Sense amp Numeration 57 22
28 Think Number Sense amp Numeration 69 33
4 Think Data Management amp Probability 46 35
13 Think Measurement 54 39
27 Think Measurement 41 46
12 Think Geometry amp Spatial Sense 42 35
16 Think Geometry amp Spatial Sense 54 34
52 35
Notes K and U = Knowledge amp Understanding App = Application Think = Thinking p-value and pt-biserial means
for each Knowledge amp Skill category represented in bold
17
No items had p-values below 30 however 10 items had difficulty values above 70
indicating that they were relatively easy for this sample Since none of the p-values were above
90 they were considered to still possess sufficient variability to be included in the analyses
Furthermore no items had values below the recommended 20 or negative pt-biserial values Table
2 further highlights the item difficulty and discrimination means for each of the three categories
From these values it can be concluded that the items referenced to the Knowledge and
Understanding category were relatively more easy for this sample while those items referenced to
the Thinking category more difficult and those referenced to the Application category moderately
difficult Lastly it is highlighted that a greater number of items represented the Application
category (12 items) than the Knowledge and Understanding and Thinking category which had an
equal number of eight items
33 Data Analysis
The data analyses involved three phases each of which addressed one of the three questions
asked in this study The first phase used Exploratory Factor Analysis (EFA) approaches to
examine the first research question ldquoWhat characterizes the dimensionality of the EQAO
mathematics achievement test administered to Grade 6 students in Ontario public schoolsrdquo
Latent Class Analysis (LCA) approaches were used in the second phase in order to answer question
two ldquoIn which mathematical dimensions and related strands do students demonstrate strengths and
weaknesses in their mathematical achievementrdquo A multinomial logistic regression analysis was
performed to examine research question three ldquoTo what extent are mathematics performance
profiles predicted by student background such as language and length of residence statusrdquo
331 Phase 1 Establishing the Dimensionality of the Assessment
An Exploratory Factor Analysis (EFA) was conducted in order to determine the
dimensionality of the EQAO Grade 6 mathematics test based on 5000 studentsrsquo responses to 28
multiple choice items Although exploratory in nature the EFA was used to examine the extent
18
to which the test dimensionality can be accounted for by knowledge and skills and further by the
strand specified by the EQAO
EFA is a statistical procedure that simplifies the process of visually inspecting a range of
correlations in order to examine the dimensionality of measures (Furr 2011) The 28 multiple
choice items were firstly recoded as binary data thus creating dichotomous categories (0 =
incorrect responses and 1 = correct responses) In order to perform an EFA with this type of
data a more sophisticated statistical software package is required The reason for this being that
standard software such as IBMrsquos SPSS (version 230) creates correlation matrices suitable only
for continuous data that assume a normal distribution (Uebersax 2015) Therefore MPLUS
version 612 (Mutheacuten amp Mutheacuten 1998-2012) was used for the analysis so that a tetrachoric
correlation matrix could be generated to suite the binary data used in this study
When conducting an EFA in Mplus a correlation matrix eigenvalues and model fitting
statistics such as the chi-square test Root Mean Square Error of Approximation (RMSEA) and
Root Mean Square Residual (RMSR) are produced in order to assist with the process of
determining the solution that best fits the data A good fitting model will be represented by a
non-significant chi-square p-value as well as a RMSEA value and RMSR value of below 05
(Schumacker amp Lomax 2004) However interpretability of the model should also be taken into
consideration when deciding on the best solution (Meyers Gamst amp Guarino 2013) The
weighted least-squares with mean (wlsm) estimation method as recommended by Mutheacuten and
Mutheacuten (1998-2012) for binary data and the oblique rotation method (Promax) was used for this
analysis based on the assumption that factors are likely to be correlated with each other
Four steps were implemented during this phase The first step entailed determining the
ideal number of factors to be extracted to best describe the data This entailed a combined
evaluation of the correlation matrix eigenvalues scree plot and fit statistics as described above
The next step entailed an evaluation of the items and their loadings on each of the factors to
determine if any should be discarded in terms of low factor loadings or cross-loadings If any
19
items were deemed unacceptable these were removed and the analysis re-run and subsequently
re-evaluated This step was repeated until a final and appropriate factor solution model was
obtained Following this the reliability for each factor was established followed by an
investigation of the factor correlations in order to determine the uniqueness of each extracted
dimension Ideally items should correlate highly with each other within each extracted
factordimension however for each dimension to be considered unique between-factor
correlations should be low (Rogers 2014) According to Meyers et al (2013) between-factor
correlations should not exceed 80 to warrant the use of a separate dimension The last step
involved an investigation of the similarities between items in each factor in order to describe the
items that make up each This was done firstly in terms of the three Knowledge and Skills
categories and secondly the five strands to which the items were referenced as well as any
further content similarities
332 Phase 2 Identifying Mathematical Strengths and Weaknesses
In an attempt to identify in which mathematical subdomains or dimensions and related
strands learner performances were strongest and weakest as asked in question two of this study a
Latent Class Analysis (LCA) was performed using MPLUS version 612 (Mutheacuten amp Mutheacuten
1998-2012)
Specifically the goal of a mixture model is to reveal unobserved heterogeneous and
meaningful population groups within the larger homogenous population by identifying similarities
in their responses to measured variables (Nylund Asparouhov amp Mutheacuten 2007) These identified
latent populations or sub-groups are called classes Therefore using this analysis allowed for the
generation of distinct performance profiles for each sub-group or class identified as performing
similarly in the largescale assessment In this way more accurate class specific strengths and
weaknesses could be described as opposed to simply those of the overall Grade 6 population
20
For an LCA the outcome variables used are specifically categorical (Nylund et al 2007)
Therefore dichotomously scored response data from the random sample of 5000 students were
used for the LCA The LCA approach is exploratory in nature because the optimal number of
classes representing all latent classes cannot be determined apriori (Nylund et al 2007) Therefore
an investigation of relevant fit statistics generated by the LCA was firstly conducted According to
Pastor Barron Miller and Davis (2007) the fit statistics commonly used to determine the optimum
number of classes include the Bayesian Information Criterion (BIC) the sample-size adjusted BIC
and the Akaike Information Criterion (AIC) where lower values indicate a better fitting model An
Entropy statistic is also commonly used to determine model fit This statistic ranges from 0 to 1
where values closest to 1 indicate higher classification accuracy
Following the identification of the best fitting model the entire sample was profiled in
terms of distinct mathematics classes In order to reduce the number of points on these profiles
items were grouped according to the strand to which they were referenced by EQAO within each
identified factor This allowed for the identification of learner strengths and weaknesses not only
surrounding factors but also each strand within each factor
As part of the LCA mean item probability scores are calculated for each class This statistic
indicates the mean probability for each class to respond correctly to an item and therefore ranges
from 0 to 1 (Nylund et al 2007) Values closest to one therefore indicate a higher probability of
responding correctly to an item Using these values for each item average item-group probability
scores were calculated and these values were then used to describe class specific strengths and
weaknesses This was done firstly by describing overall item-group performances in comparison
to other classes and secondly by describing class performances in each specific factor overall and
lastly in terms of each strand within each factor
21
333 Phase 3 Predicting Class and Profile Membership
In order to answer question three concerning whether or not English as a second language
and length of residence in Canada significantly predicted the performance profile to which a
learner belongs a multinomial logistics regression analysis was conducted This phase was
completed using IBMrsquos SPSS (version 230)
A multinomial logistic regression is used when the dependent variable for the analysis
consists of more than two categorical levels (Meyers et al 2013) Besides the item probability
mean generated by the LCA a class probability mean for each learner in the sample is also
calculated as part of the analysis This class probability indicates the likelihood of a learner
belonging to each of the classes or performance profiles Based on the highest class probability
learners were allocated to one of the performance profiles as generated in phase 2 These classes
were coded 1 2 3 etc based on the number of classes determined to best describe the sample and
represented the dependent or predicted variable of the analysis
Table 3
Six Groups Created Based on English as Second Language and Time Lived in Canada
Group Language Time lived in Canada n
1 Non-ESL CA born 4185 837
2 ESL CA born 308 62
3 Non-ESL Non-CA born lt 5 years 76 15
4 ESL Non-CA born lt 5 years 123 25
5 Non-ESL Non-CA born ge 5 years 199 40
6 ESL Non-CA born ge 5 years 109 22
Notes N = 5000 ESL = English as a second language learner CA born = Born in Canada
An independent variable used for predicting the latent class membership included six
groups based on the following background variables English Second Language (ESL) status as
22
well as whether or not they were Canadian born non-Canadian born but at the time had resided in
the country for less than 5 years or non-Canadian born but at the time had resided in the country for
five years or more This was done in order to avoid clustering ELL learners as a homogenous group
and therefore better identify learners These six categorical data groups represented the predictor
or independent variable Table 3 indicates more precisely how each of the groups were created as
well as their sizes
23
Chapter 4 Results
The results of this study are discussed according to the three questions presented and phases
of data analyses as discussed in Chapter 3 Firstly the results produced from the Exploratory
Factor Analysis (EFA) described in phase one concerning question one are reported Secondly
those produced by the Latent Class Analysis (LCA) in phase two to answer question two and lastly
those produced from the multinomial logistics regression analysis conducted in phase three to
answer question three are presented in this chapter
41 Dimensionality Characteristics
As noted an EFA was conducted on the 28 multiple choice mathematics items in order to
determine the dimensionality of the largescale assessment to which they belonged The
eigenvalues of the tetrachoric correlation matrix (Table 4) produced by Mplus ranged between
862 and 41 the first three factors showed eigenvalues greater than 1 and accounted for 3953 of
the total variance
Table 4
Eigenvalues of Correlation Matrix indicating Total Variance Explained
Item Eigenvalue Item Eigenvalue Item Eigenvalue Item Eigenvalue
1 86 2 13 3 10 4 93
5 91 6 90 7 87 8 85
9 84 10 80 11 79 12 76
13 74 14 72 15 70 16 69
17 66 18 65 19 64 20 63
21 60 22 57 23 53 24 52
25 50 26 49 27 46 28 41
24
411 Determining the Best Fitting Factor Solution Model
The eigenvalues scree plot and fit statistics were used to determine the best number of
factors to describe this data set Based on the ldquonumber of eigenvalues greater and equal to one
rulerdquo as suggested by Meyers et al (2013) together with the scree plot and relevant fit statistics it
seemed adequate to extract three factors albeit accounting for less than 50 of the variance
Figure 1 Scree plot
Although three eigenvalues were produced greater and equal to one suggesting the
existence of three factors this was contradicted by the scree plot (Figure 1) which suggested the
existence of only two factors as it appeared to level off mostly at number three Subsequently a
comparison of the one to three factor solutions was conducted in terms of the relevant fit statistics
as described in Table 5
The significant chi-square p-values (lt 001) generated for the one and two factor solutions
suggested that the data differed significantly from the model matrix Although the chi-square p-
value has been criticized in the past for being overly sensitive to large sample sizes and therefore
0
05
1
15
2
25
3
35
4
45
5
55
6
65
7
75
8
85
9
1 2 3 4 5 6 7 8 9 10 11 12 13 14 15 16 17 18 19 20 21 22 23 24 25 26 27 28
Eig
envalu
es
Items
25
almost always producing a significant value (Meyers et al 2013) this was determined not to be the
case for this analysis as the p-value generated in the three factor model increased substantially
from the one to two factor model thus ensuring the reliability of this value
Table 5
EFA Model Fit Statistics of the 1 to 3 Factor Solutions on 28 Mathematics Items
FA model Chi-Square df p-value RMSEA RMSR
1 92476 350 lt 001 018 031
2 44012 323 lt001 009 021
3 34390 297 032 006 019
Note N = 5000
Therefore since the Chi-square p-value of 032 of the three factor model was not significant
(at the 001 probability level) as well as the fact that only two items represented the fourth factor in
the four factor solution model it was deemed a good fitting model The values of 006 and 019 of
the RMSEA and RMSR respectively were well below the 05 recommended value providing
further support for this three factor solution model
A further inspection of the factor loadings from the three-factor solution as well as of the
items on each factor resulted in the removal of four items (ie 12 18 23 and 24) Items 18 23 and
24 were discarded as a result of low factor loading scores below 30 Whereas a decision was made
to remove Item 12 as it was the only item referenced to the Thinking category that did not load on
the factors in the same way that the others did Table 6 presents the final factor loadings with the
Knowledge and Skills categories to which items were originally allocated by the EQAO that is
knowledge and understanding application and thinking
The Promax factor correlation matrix produced by Mplus (Table 7) revealed that all three
factors correlated positively and moderately to high with one another The strongest correlation
26
existed between Factor 1 and Factor 3 with a relatively high coefficient value of 747 while the
weakest correlation existed between Factor 1 and Factor 2 with a coefficient of 576
Table 6
Factor Loadings of the 23 Items used in the Final 3 Factor Solution Model
Item Knowledge amp Skill Factor 1 Factor 2 Factor 3
1 KU 64 -09 13
11 App 63 -04 12
14 KU 55 13 01
6 App 51 12 -04
15 KU 51 -05 14
10 App 47 23 05
7 App 45 -12 13
25 KU 38 09 17
3 KU 35 -01 24
9 KU 35 09 07
22 KU 31 07 23
5 APP 30 09 22
13 App 10 65 -05
27 Think -04 63 23
2 Think -07 50 12
20 App 14 -03 59
17 Think -04 04 55
26 App 13 01 33
8 App 11 -01 32
28 Think 15 03 32
16 Think 11 10 31
4 Think 14 12 30
21 Think -04 08 30
α = 725 α = 536 α = 565
Notes KU = Knowledge and Understanding App = Application Think = Thinking category
As stated earlier according to Meyers et al (2013) correlations should not exceed 80 to warrant
the use of separate factors These results are therefore considered to reveal the existence of three
27
unique factors that can be used to describe the multidimensionality of these mathematics multiple
choice items
Table 7
Promax Factor Correlations Between 3 Factors
Factors FA 1 FA 2
Factor 1
Factor 2 576
Factor 3 747 626
Note N = 5000
As indicated in Table 6 Factor 1 consisted of 12 items in total with factor loading scores
ranging between 30 and 64 and achieved a relatively high Cronbachrsquos alpha of 725 All seven
items referenced to the Knowledge and Understanding category used in the final model loaded
together on Factor 1 along with five items referenced to the Application category Factor 2
consisted of only three items with factor loading scores ranging between 50 and 63 and
achieved a moderate Cronbachrsquos alpha of 536 In Factor 2 two items referenced to the Thinking
category and one to the Application category loaded together to make up the total of three items
for this factor Lastly Factor 3 consisted of a total of eight items with factor loading scores
ranging between 30 and 59 and also achieved a moderate Cronbachrsquos alpha score of 565 The
remaining five items referenced to the Thinking category and three items referenced to the
Application category loaded together to make up the eight items that loaded together on Factor 3
In terms of the strands to which the items in Factor 1 were referenced for instance
Patterning and Algebra etc no clear similarities appeared to exist to tie all the items together
based on this However similarities seemed to exist in terms of the applied skill requested of
learners to solve the mathematical problems It appeared that all the items of this factor merely
requested of learners to apply their mathematical knowledge in terms of procedures and
conceptual understanding to answer the questions For instance Item 15 which is referenced to
28
the Knowledge and Understanding category asks the following ldquoWhat is the value of 0730 ndash
0156rdquo Whereas Item 5 which is referenced to the Application category asks that learners
solve problems involving the addition of decimal numbers (the exact question was not released)
Therefore it was determined that no clear difference existed between the applied skill requested
from these two items even though they were referenced to two different Knowledge and Skills
categories It was therefore concluded that Factor 1 could be described as measuring the
application of mathematical knowledge to solve problems in various strands
An inspection of the items that loaded together on Factor 2 revealed that two of the items
were referenced to the Thinking category while one of the items was referenced to the
Application category Furthermore all three items were similar in that that they covered the
ldquoMeasurementrdquo strand and more specifically that all three items requested of learners to solve
problems relating to ldquoAreardquo Item 2 for instance asks ldquoThe parallelogram below will be cut
into two congruent triangles (provides dimensions) What is the area of one of the trianglesrdquo
Item 13 asks ldquoWhich of the following shows a rectangle and a triangle that have the same areardquo
and lastly Item 27 requests that learners compare the areas of two polygons (exact item not
released) Item 2 was referenced to the Application category whereas Items 13 and 27 were
referenced to the Thinking category It was therefore determined that Factor 2 could be
described as requesting of learners to apply thinking processes or skills such as problem solving
and reasoning in order to solve deeper mathematical problems specifically surrounding the
Measurement topic of ldquoAreardquo
Lastly for Factor 3 as with Factor 1 no clear similarities appeared to exist to tie all the
items together based on strands However as with Factor 1 similarities seemed to exist in terms
of the applied skill requested of learners to solve the mathematical problems It appeared that
all the items on this factor requested of learners to apply thinking skills to solve deeper
mathematical problems surrounding various strands in other words learners had to go beyond
the mere application of content knowledge to solve these items For instance Item 20 referenced
29
to the Application category requested that learners solve the following problem ldquoEach beaker of
water below has a capacity of 2L Which beaker appears to have about 500ml of water in itrdquo
Whereas Item 28 referenced to the Thinking category asks ldquoMrs Garrett sends surveys to 120
students and 78 students return the survey Which statement best describes the percent of
students who return the surveyrdquo Again no clear difference appeared to exist between the
applied skill requested of learners in terms of the Application and Thinking categories to which
the items were referenced It was therefore concluded that Factor 3 could be described as
measuring the ability of learners to apply thinking processes or skills such as problem solving
and reasoning in order to solve deeper mathematical problems in various strands
In sum the results of the EFA determined that a three factor model could be used to
adequately characterize the dimensionality of the multiple choice mathematics items on the
EQAO assessment Twelve items clustered adequately together in terms of factor loading scores
to form Factor 1 which achieved a relatively high Cronbachrsquos alpha of 725 three items on
Factor 2 which achieved a moderate Cronbachrsquos alpha of 536 and lastly eight items on Factor
3 which also achieved a moderate Cronbachrsquos alpha score of 565 Upon closer inspection of
the items on each factor and in terms of the Knowledge and Skills categories and strands to
which they were referenced by the EQAO it was determined that Factor 1 could be best
described as measuring the ability of learners to apply mathematical knowledge related to
procedural and conceptual understanding in order to solve problems in various mathematical
strands Factor 2 could be best described as measuring the ability of learners to apply process
or thinking skills in order to solve problems related specifically to the topic of ldquoAreardquo
Lastly Factor 3 could be best described as measuring the ability of learners to apply thinking
skills in various mathematical strands
30
42 Mathematical Strengths and Weaknesses
In an attempt to identify in which mathematical dimensions and related strands Grade 6
learner performances were strongest and weakest as asked in question two of this study a Latent
Class Analysis (LCA) was conducted This allowed for distinct performance profiles to be
generated for classes or sub-groups performing similarly in the population and therefore allowed
for more accurate descriptions of strengths and weaknesses The factors as established in the
dimensionality investigation in Phase 1 of this study were used to represent the dimensions for this
analysis
Although the four class model achieved the lowest AIC BIC and Sample-Size Adjusted
BIC statistic values in comparison to the two and three class model it also produced a much lower
Entropy value of 69 (see Table 8) Therefore it was decided that since these statistics did not
decrease that much from the three class to four class model the use of the four class model with a
much lower Entropy value did not seem warranted Thus the three class model was opted for
instead as it produced lower fit statistics than the two class model as well as a sufficiently high
Entropy value of 75 Furthermore the results indicated that each class was represented by the
following proportion of learners from the sample Class 1 comprised of 321 Class 2 of 452
and Class 3 of 227
Table 8
LCA Fit Statistics for 2 3 and 4 Classes
Fit statistics 2 Classes 3 Classes 4 Classes
AIC 12974224 12808557 12789120
BIC 13004854 12854829 12851034
Adj BIC 12989919 12832268 12820846
Entropy 81 75 69
Notes N = 5000 AIC = Akaike Information Criterion BIC = Bayesian Information Criterion Adj BIC = Sample-
Size Adjusted Bayesian Information Criterion
31
Eleven item-groups were created to describe the strengths and weaknesses of the three
classes as represented in Table 9 Item-groups were created by grouping items according to the
factor they were determined to measure (as established in the EFA) as well as the strand to which
they were allocated by the EQAO Five item-groups were created for Factor 1 one item-group for
Factor 2 and five groups for Factor 3 The number of items within each item-group varied from 1
item to 4 items The mean probability scores calculated for each class for each item-group and
overall dimension or factor are also represented in Table 9 These mean item-group probability
scores as presented in Table 9 were used to plot three distinct performance profiles for each class as
represented in Figure 2 below
Table 9
Item-Groups created to Describe Mathematical Performances of Grade 6 Learners
Factor Content Area of items Class 1 Class 2 Class 3
1 Patterning amp Algebra 3 97 86 48
1 Measurement 1 95 78 44
1 Geometry amp Spatial Sense 2 94 79 50
1 Number Sense amp Numeration 4 92 76 49
1 Data Management amp Probability 2 78 49 19
Factor 1 class probability means 91 74 44
2 Measurement (Area) 3 85 39 28
Factor 2 class probability means 85 39 28
3 Patterning amp Algebra 2 67 43 20
3 Measurement 2 79 55 25
3 Geometry amp Spatial Sense 1 79 47 31
3 Number Sense amp Numeration 2 80 60 44
3 Data Management amp Probability 1 72 40 22
Factor 3 class probability means 76 51 29
Note The factor probability means presented in bold are slightly higher as the actual item probability score was used
to calculate these values and not the item-group probability scores
Using the evidence generated from the mean item-group and factor probability scores as
represented in Table 9 and Figure 2 these performance profiles were used to describe the strengths
32
and weaknesses of each class Class specific strengths and weaknesses were described according
to firstly overall performances in the 11 item-groups in comparison to the other classes secondly
in terms of overall performances in each dimension (Factor 1 2 and 3) and lastly in terms of
performances in each strand within each dimension for Factor 1 and 3 only (as Factor 2 only
represented Measurement topic of ldquoAreardquo) A mean item-group probability score ranging from 86
- 10 was described as especially strong 71 - 85 as strong and 56 - 70 as moderately strong
while those scores ranging from 41 - 55 were described as moderately weak 26 - 40 as
moderately weak and 25 and below as especially weak
Figure 2 Three performance profiles of Grade 6 learners in 11 mathematical item-groups
Results indicated that those learners most likely to belong to Class 1 performed higher than
Class 2 and 3 in all item-groups Therefore this class to which 321 of learners from the sample
belonged can be best described as the highest performing and second largest group overall Those
most likely to belong to this class can be described as having an especially strong ability to apply
0
01
02
03
04
05
06
07
08
09
1
Item
-Gro
up
Mea
n P
rob
ab
ilit
y
Item-Groups
Class 1 (321) Class 2 (452) Class 3 (227)
33
mathematical knowledge in order to solve problems in various strands This was determined by the
average 91 overall probability for success achieved for those items related to Factor 1 They can
also be described as having a strong ability to apply thinking skills in order to solve problems
surrounding the Measurement topic of ldquoAreardquo and strong ability to do the same in various strands
This was determined by the 85 probability for success achieved for those items related to Factor
2 and 76 probability for success achieved for those related to Factor 3 Furthermore their overall
performances in the knowledge dimension can be described as stronger in comparison to their
performances in the thinking dimensions
Specifically concerning their ability to apply mathematical knowledge in various strands
(Factor 1) these learners can be described as performing slightly stronger in the Patterning and
Algebra (item-group probability score = 97) and considerably weaker in Data Management and
Probability (item-group probability score = 78) in relation to their performances in the other
strands Specifically regarding their ability to apply think skills in order to solve problems (Factor
3) they can be described as performing slightly stronger in Number Sense and Numeration (item-
group probability score = 80) and considerably weaker in Data Management and Probability (item-
group probability score = 72) and Patterning and Algebra (item-group probability score = 67) with
the latter being the weakest in relation to their performances in the other strands
Results further indicated that those learners most likely to belong to Class 2 performed
overall lower than Class 1 but higher than Class 3 in all item-groups Therefore this class to
which 452 of the learners belonged can be best described as the intermediate performing and
largest group overall Those most likely to belong to this class can be described as having a strong
ability to apply mathematical knowledge in order to solve problems in various strands This was
determined by the average 74 overall probability for success achieved for those items related to
Factor 1 They can also be described as having a weak ability to apply thinking skills in order to
solve problems surrounding the Measurement topic of ldquoAreardquo and moderately weak ability to do
the same in various strands This was determined by the 39 probability for success achieved for
34
those items related to Factor 2 and 51 probability for success achieved for those related to Factor
3 Furthermore their overall performances in the knowledge dimension can be described as
stronger in comparison to their performances in the thinking dimensions
Specifically concerning their ability to apply mathematical knowledge in various strands
(Factor 1) performances for these learners can be described as considerably stronger in Patterning
and Algebra (item-group probability score = 86) and considerably weaker in Data Management
and Probability (item-group probability score = 49) in relation to their performances in the other
strands Specifically regarding their ability to apply thinking skills in order to solve problems
(Factor 3) performances can be described as stronger in Number Sense and Numeration (item-
group probability score = 60) and considerably weaker in Data Management and Probability (item-
group probability score = 40) and Patterning and Algebra (item-group probability score = 43) with
the former being the weakest in relation to their performances in the other strands
Lastly results indicated that those learners most likely to belong to Class 3 performed lower
than Class 1 and 2 in all item-groups Therefore this class to which 227 of learners belonged
can be best described as the lowest performing group overall Those most likely to belong to this
class can be described as having a moderately weak ability to apply mathematical knowledge in
order to solve problems in various strands This was determined by the average 44 overall
probability for success achieved for those items related to Factor 1 They can also be described as
having a weak ability to apply thinking skills in order to solve problems surrounding the
Measurement topic of ldquoAreardquo and weak ability to do the same in various strands This was
determined by the 28 probability for success achieved for those items related to Factor 2 and
29 probability for success achieved for those related to Factor 3 Furthermore their overall
performances in the knowledge dimension can be described as stronger in comparison to their
performances in the thinking dimensions
Specifically concerning their ability to apply mathematical knowledge in various strands
(Factor 1) it was determined that these learners can be described as performing slightly stronger in
35
Geometry and Spatial Sense (item-group probability score = 50) and considerably weaker in Data
Management and Probability (item-group probability score = 19) in relation to their performances
in the other strands Specifically regarding their ability to apply thinking skills in order to solve
problems (Factor 3) their performance can be described as considerably stronger in Number Sense
and Numeration (item-group probability score = 44) and weaker in Data Management and
Probability (item-group probability score = 22) and Patterning and Algebra (item-group
probability score = 20) with the latter being the weakest in relation to their performances in the
other strands
In sum the results of the LCA revealed that three classes could be used to best describe the
performances of Grade 6 learners in the three dimensions as established during the EFA and their
related strands Class 1 was described as the highest performing and second largest group The
learners in the class were described as performing especially strong in Factor 1 (namely their
ability to apply mathematical knowledge to solve problems in various strands) strong in Factor 2
(namely their ability to apply thinking skills to solve problems specifically related to the
Measurement topic of ldquoAreardquo) and in Factor 3 (namely their ability to apply thinking skills in order
to solve problems in various strands) Class 2 was described as the intermediate performing and
largest group and performing strong for Factor 1 weak for Factor 2 and moderately weak for
Factor 3 Lastly Class 3 was described as the lowest performing and smallest group and
performing moderately weak for Factor 1 and weak for both Factor 2 and 3 For all classes overall
factor performances were described as weaker in the thinking dimensions namely Factor 2 and 3
than in the knowledge dimension namely Factor 1 A greater discrepancy between these
mathematical knowledges and thinking skills dimensions appears to exist for those in Class 2 than
for those in Class 1 and 3
Lastly in terms of describing the performances of each class in the strands related to each
factor for Factor 1 and 3 results revealed clear similarities between all classes in terms of those in
which performances were described as weaker For all classes regarding Factor 1 their ability to
36
apply mathematical knowledge within the Data Management and Probability strand was described
as the weakest in relation to the other strands For all classes regarding Factor 3 their ability to
apply thinking skills in the Patterning and Algebra and Data Management and Probability strand
was described as weakest in relation to their performances in the other strands
43 Predicting Mathematics Profiles by Language and Length of Residence Background
To avoid treating learners as homogenous groups based on their language background they
were allocated to one of six groups according to their ESL designation and length of residency in
Canada The six groups represented the predictor variable (independent variable) whereas the three
classes or performance profiles were treated as the predicted or dependent variable Class 1
namely the highest performing profile group was used as the reference category
Results of this analysis indicated that the final model did not significantly predict class and
performance profile membership with a -2 Log likelihood of 7740 and a Chi-square value of 957
(10 N = 5000) p = 48 The upper portion of Table 10 presents the regression coefficients the
Wald test adjusted odds ratio [Exp(B)] and the 95 confidence intervals (CI) for odds ratios for
the predictor contrasting Class 2 to Class 1 The lower portion of the table presents the regression
coefficients the Wald test adjusted odds ratio [Exp(B)] and the 95 confidence intervals (CI) for
odds ratios for the predictor contrasting Class 3 to Class 1
Results therefore revealed that ESL status and residence in Canada did not significantly
predict class or profile membership regardless of group allocation In other words regardless of
group allocation learners were found to be equally likely to belong to either Class 1 (highest
performing group) Class 2 (intermediate performing group) or Class 3 (lowest performing group)
and therefore perform according to the related profile as indicated earlier in Figure 2
37
Table 10
Parameter Estimates for Six Groups on 3 Classes
Model B SE - B Wald df Exp(B) 95 CI EXP (B)
Class 2
Intercept 43 23 351 1
Group 1 -07 23 09 1 93 60 ndash 147
Group 2 06 26 06 1 107 64 ndash 178
Group 3 -60 35 296 1 55 277 ndash 109
Group 4 01 31 00 1 101 55 ndash 183
Group 5 -08 28 09 1 92 54 ndash 158
Class 3
Intercept -13 26 27 1
Group 1 -23 26 74 1 80 48 ndash 133
Group 2 -20 31 42 1 82 47 ndash 149
Group 3 -36 39 84 1 70 33 ndash 150
Group 4 -35 37 92 1 70 34 ndash 144
Group 5 -53 33 255 1 59 31 ndash 113
Notes p lt 001 N = 5000 Class 1 is the reference category Group 1 = Non-ESL CA Born (n = 4185) Group 2 =
ESL CA Born (n = 308) Group 3 = Non-ESL Non-CA born but living in country less than 5 years (n = 76) Group 4
= ESL Non-CA born but living in country less than 5 years (n = 123) Group 5 = Non-ESL Non-CA born but living in
country 5 years or more (n = 199) Group 6 = ESL Non-CA born but living in country 5 years or more (n = 109)
38
Chapter 5 Discussion
The purpose of this study was to move beyond the total scores of a largescale assessment
in order to gain better insight into the mathematical performances of Ontariorsquos Grade 6 learners
In doing so it aimed to provide evidence of learner strengths and weaknesses in different aspects
of mathematics education on which to base remedial decisions for the improvement thereof
Using the responses of a random sample of 5000 Grade 6 learners to 28 multiple choice
mathematics items on the 20132014 EQAO Junior Division assessment an Exploratory Factor
Analysis (EFA) was firstly performed in order to investigate the dimensionality characteristics
of the assessment This was followed by a Latent Class Analysis (LCA) to determine learner
strengths and weaknesses related to the established mathematical dimensions and their related
strands Lastly a multinomial logistic regression analysis was performed in order to examine the
extent to which mathematics performance profiles were predicted by student background factors
such as language and length of residency in Canada This chapter discusses the findings of these
analyses study limitations and lastly recommendations for future research and education
51 What Characterizes the Dimensionality of the EQAO Mathematics Achievement Test Administered to Grade 6 Students in Ontario Public Schools
The multiple choice mathematics items on the EQAO assessment were characterized as
measuring the ability of learners in three interrelated yet separate mathematical dimensions
These being the ability of learners to apply mathematical knowledge related to procedural
knowledge and conceptual understanding to solve problems in various strands (Factor 1) the
ability to apply process or thinking skills such as problem solving or reasoning skills to solve
problems in ldquoAreardquo (Factor 2) and lastly the ability to apply process or thinking skills to solve
39
problems in various mathematical strands The three factors produced achieved on average
moderate reliability scores
These findings regarding the characteristics of the dimensions were considered valuable
as they allowed for the comparison of learner abilities in two essential elements of mathematical
proficiency as aligned with the Principles and Standards for School Mathematics (NCTM
2000) and as a result also with the Ontario mathematics curriculum which shares the same
foundations Only once this happens namely learner ability measured directly in relation with
mathematical curriculum expectations can we begin an effective process of remediation
(Kilpatrick et al 2001) These elements were that of mathematical knowledge consisting of
procedural and conceptual knowledge as measured by Factor 1 of this study and process or
thinking skills such as problem solving and reasoning as measured by Factor 2 and 3 Factor 2
and 3 were determined to differ based solely on the content of the items included in the
assessment This finding highlights concerns regarding the fair representation of all curriculum
expectations on the assessment and thus warrants further investigation
The fact that the ability to apply mathematical knowledge and the ability to apply
thinking skills in order to solve mathematical problems were found to be sufficiently unique
dimensions to warrant their use using the multiple choice items on this largescale mathematics
assessment adds further value to the findings of this study These findings are valuable in that
they attest to the future potential for assessment organizations to report learner performances
beyond that of total scores as demanded by those in the educational field However since the
factors achieved only moderate reliability scores we are reminded of the need for these tests to
be designed upon foundations aligned with those of the curriculum expectations they are
employed to assess from the start in order for them to meet better test properties (Chudowsky amp
Pellegrino 2003 Rogers 2014)
40
52 In which Mathematical Dimensions and Related Strands do Students Demonstrate Strengths and Weaknesses in their Mathematical Achievement
Three classes were determined to best describe the performances of all Grade 6 learners
in the established dimensions and their related strands Class 1 was described as the highest
performing and second largest group consisting of 321 of the learners Class 2 was described
as the intermediate performing and largest group consisting of 452 of the learners and lastly
Class 3 was described as the lowest performing and smallest group consisting of only 227 of
the learners from the sample
The results of this analysis further revealed that all three classes performed weaker in
their ability to apply thinking skills in order to solve problems either specifically surrounding
the topic of Area or in various strands than in their ability to apply mathematical knowledge in
order to do the same The performances of those in Class 1 were described as especially strong
in the mathematical knowledge dimension (Factor 1) and strong in the thinking dimensions
(Factor 2 and 3) Class 2 was described as strong in the mathematical knowledge dimension but
weak in the thinking skills dimensions and lastly Class 3 was described as moderately weak in
the mathematical knowledge and thinking skills dimensions The discrepancy between
performances in the two subdomains namely mathematical knowledge and thinking skills thus
appeared to be largest for those in Class 2 the intermediate performing and largest group
The findings concerning the overall performances of students in the two subdomains of
mathematical knowledge and thinking skills aligns with those concerning the performances of
US students as described by Kilpatrick et al (2001) They highlight that research evidence over
the past 30 years has consistently indicated that although US students do not fare badly in
applying their knowledge to solve basic mathematical problems they tend to have a limited
41
understanding of mathematical concepts and are noticeably deficient in their ability to apply
mathematical thinking skills to solve even simple problems
It may however be argued that this finding namely a weaker performance in thinking
skills than mathematical knowledge is to be expected given the fact that applying thinking skills
in order to solve problems is a more challenging task than simply applying what you know
(Schoenfeld 2007) However studies have also found that a strong mathematical knowledge
base leads to a better ability to apply thinking skills to solve deeper problems (Stokke 2015)
Thus given the inter-relatedness of these two dimensions together with the large discrepancy
between them for those in Class 2 (strong mathematical knowledge but weak thinking skills)
these findings demonstrate a weakness in the majority of Ontariorsquos Grade 6 learners to apply
thinking skills to solve deeper mathematical problems This finding holds important
recommendations for future research and mathematics educational practices as will be discussed
in the section below
Upon further investigation of learner performances in each of the strands as they relate to
the dimensions it was determined that all three classes performed much weaker in their ability to
apply mathematical knowledge in the Data Management and Probability strand than in the other
strands This strand was also determined to be the weakest in the thinking skills dimension
along with Patterning and Algebra This finding contradicts those of Tatsuoka Corter and
Tatsuoka (2004) in which it was found that students in the US appeared to perform poorest in
Geometry and Spatial Sense Given the inter-relatedness of mathematical knowledge and ability
to apply thinking skills as previously highlighted by Stokke (2015) this finding concerning Data
Management and Probability attests to a knowledge base weakness for Grade 6 Ontario learners
specifically surrounding this strand As for the results surrounding Patterning and Algebra they
appear to provide further support for the weak ability of the learners to apply thinking skills
42
given their relatively strong mathematical knowledge surrounding this strand These findings
also hold valuable recommendations for educational practices in Ontario which will be further
discussed below
53 To What Extent Are Mathematics Performance Profiles Predicted by Student Background such as Language and Residence Status
Findings from this analysis revealed that language background and length of residence in
Canada did not significantly predict performance profile membership Therefore regardless of
group allocation based on these variables all learners were equally likely to achieve a Class 1
(high performing) Class 2 (intermediate performing) or Class 3 (low performing) profile as
described in this study
These findings contradict the Jang et al (2013) study on the performance of learners in
reading In that study it was found that different reading patterns were achieved based on ELL
and length of residence status It was further determined that non-English speakers outperformed
monolinguals in reading achievement after living in the country for five years or more These
findings therefore do not appear to hold true for the performances of learners in mathematics
based on these variables as all learner groups were equally likely to achieve one of the three
performance profiles produced in this study However it needs to be acknowledged that this
study focused on ESL designation as opposed to ELL status which may have contributed to the
differences in findings Nonetheless these findings are considered valuable in that they provide
reassurance of the fact that the test results were not confounded by differences in language
proficiency and that the EQAO test was not biased towards first language speakers
The findings of this study further contradict those that found that English first language
speakers outperformed those for whom English was not their first language (Abedi amp Lord
43
2001 Howie 2003) Therefore they help shed perceptions of differences in mathematical
performances based solely on the aspect of language background This finding holds important
implications for mathematics education for these population groups as well as future research
54 Study Limitations
The following study limitations have been recognized and should thus be taken into
consideration when reviewing these findings Firstly this study analyzed the mathematical
performances of learners based on the results of a standardized test only We are therefore
reminded of the fact that many factors influence test scores over and above that which is random
These include the testing situation tester characteristics and test-taker characteristics (Kaplan amp
Saccuzzo 2009) For this reason it is important that learner performances in other assessment
environments also be considered such as classroom-based assessment activities
Secondly the findings of this study were based solely on learner performances on the
multiple choice items According to Schoenfeld (1992) most multiple choice items are machine
graded which limits their ability to measure learner conceptual understanding and problem
solving abilities to the degree that most people would like For this reason it is important that
future studies consider including the open response questions included on the assessment for a
better reflection of learner conceptual understanding and problem solving
Thirdly this study included performances of learners based solely on a single EQAO
administration and its data Although EQAO proclaims to instill rigorous test equating
procedures to ensure that test difficulty and discrimination properties are not compromised
across years (Rogers 2013) this does not guarantee that learner performances can be generalized
to all Grade 6 learners Furthermore this study focused on only those who took the English
44
version of the test therefore generalizing these findings to those who took the French version
should be done cautiously
Lastly the small ESL population size in comparison to the non-ESL population limits the
findings of this group and may therefore not accurately reflect their performances Furthermore
this study used ESL designation as opposed to ELL status ESL designation is a program in
which learners are enrolled or unenrolled throughout the year Therefore these findings may not
reflect that of the entire ELL population
55 Recommendations and Future Research
In light of recent poor mathematical performances of Ontariorsquos elementary learners the
education minister announced its ldquoRenewed Math Strategyrdquo designed for the purposes of
combatting further decline (Brown 2016) In this strategy requirements for improving the
performances of learners in mathematics were announced such as all learners in Grade 1-8 to
receive at least 60 minutes of mathematics instruction per day further support for weaker
schools in terms of more professional development for teachers as well as more support for
learners and parents surrounding this discipline As this study made apparent in the beginning
such strategies risk being only blanketed approaches that do not really target the heart of the
problem if not accompanied by further insight into the results upon which they are based
This study was conducted in an attempt to gain such insight and found that although
Ontario Grade 6 learners display strong mathematical knowledge the majority are particularly
weak in applying thinking skills such as reasoning and problem solving to solve deeper
mathematical problems It was further determined that learners are particularly weakest in the
Data Management and Probability strand for both mathematical knowledge and thinking skills
dimensions as well as the Patterning and Algebra strand in the latter dimension It was lastly
45
determined that background variables of language and length of residence did not significantly
predict performance and profile achievement and that both ESL and non-ESL learners were
equally likely to belong to high intermediate and low performing groups regardless of length of
residence in Canada Based on these findings the following recommendations surrounding
future research endeavors and educational practices specifically in conjunction with mathematics
education in Ontario will be discussed below
The Ontario Curriculum Grades 1-8 Mathematics 2005 document indicates that the
ultimate goal for mathematics education is to develop learner proficiency beyond that of content
knowledge and therefore also calls for the development of a deeper understanding of the
discipline along with essential thinking skills In order to accomplish these goals the
curriculum highlights that instructional practices need to deviate from a sole focus on direct
teaching methods to incorporate methods of teaching and learning through problem solving in
other words problem-based learning approaches Stokke (2015) blames this greater emphasis of
teaching mathematics using problem-based teaching strategies for the recent decline of Ontario
learnersrsquo mathematical performances She argues that the lack of direct instruction has robbed
learners of a sound knowledge base from which to draw upon when attempting to solve deeper
mathematical problems hence the weakness in this area
However the findings from this study provides evidence that contradicts this argument
as results point to the fact that the majority of Grade 6 learners in Ontario actually do possess
strong mathematical knowledge This finding may therefore perhaps be an indication of the
fact that a large portion of Ontario teachers still rely predominantly on teaching mathematics
using traditional direct teaching methods as opposed to those better suited to meet current
curriculum goals and expectations This finding therefore warrants further investigation into
current teaching trends and holds valuable insight as to where to direct efforts for remediation
46
In order to meet reformed curriculum goals and expectations teaching practices need to
change for which the teacher is the key actor (Ross amp McDougall 2006) Therefore this study
supports those calling for increased efforts directed at teachers and the need to reshape their roles
and perceptions of what it means to ldquoteachrdquo mathematics in a reformed curriculum classroom
For instance Milgram (2007) urges for strategies directed at ensuring that teachers truly
understand what it means to teach using problem-based teaching methods to develop thinking
skills He further illustrates that teaching thinking skills such as problem solving is a
challenging task as it is in itself complex involving both verbal and nonverbal mental processes
For this reason it is essential that learners solve problems for which the answer is not apparent
and requires a novel idea if we wish to effectively develop these skills (Milgram 2007) Such a
teaching and learning process requires that teachers step back allowing learners to grapple with
the task before them as well as interact with each other stepping in only when necessary to
guide the process (Milgram 2007)
Changing the role of the teacher from the traditional sole knowledge bearer and
transferor to one in which heshe shares the responsibility of learning with students is however
only one of 10 dimensions that requires attention when urging teachers to adopt instructional
practices better suited to accomplish curriculum goals and expectations (Ross amp McDougall
2007) Ross and McDougall (2006) further illustrate that in order to ensure that teaching for
deeper understanding as aligned with current reformed mathematics education takes place
teachers need to consider change in all 10 of these dimensions These dimensions as cited in
Ross and McDougall (2006) are summarized as follows 1) the need for program scope 2)
access to all forms of mathematics by students 3) raising self-confidence of students by teachers
4) complex and open-ended student tasks 5) instruction that focuses on constructing
mathematical ideas through self-discovery 6) change in the role of teachers to that of co-learner
47
and co-knowledge creator 7) solving of mathematical problems with the aid of manipulatives 8)
classroom organization in a manner that promotes sharing and interaction for solutions 9)
authentic assessment and lastly 10) a conception of mathematics as a dynamic subject by
teachers
Specifically regarding the first dimension namely the need for program scope Ross and
McDougall (2006) describe it as urging teachers to teach multiple mathematical strands with
increased attention on those less commonly taught such as the Data Management and
Probability and Patterning and Algebra strands The results of this analysis indicated that
learners were weakest in precisely these two strands therefore perhaps providing evidence in
support of the fact that these strands are given less attention by Ontario teachers when teaching
the mathematics curriculum expectations This finding therefore provides added support for the
need to further promote the implementation of these 10 dimensions of teaching for deeper
understanding as indicated above so as to ensure that teachers view all curriculum strands as
equally important and deserving of attention
In calling for these increased efforts directed at changing the way in which mathematics
teaching and learning occurs in classrooms it is important to acknowledge the fact that this is
easier said than done Teaching in a manner that supports the development of a deeper
understanding for mathematics and promotes thinking skills is a lengthy process that takes time
(Milgram 2007) A commodity in short supply for the teacher already feeling pressured to
cover all curriculum expectations before mandatory accountability assessments take place
(Milgram 2007) Therefore not only does this study call for increased efforts directed at
changing teacher perceptions and instructional practices in the classroom but also for policy
makers to consider practical constraints placed on teachers that may restrict the implementation
thereof
48
Lastly the need to predict mathematical performances of learners based on background
variables is made apparent by Hinton (2014) who found that early success in mathematics
predicts future success Therefore for the sake of early intervention especially for the lowest
performing group identified in this study it is urged that further research studies be directed at
determining background variables that better predict performances However it is further urged
that such studies focus on class or profile membership as used in this study as opposed to overall
mathematics performances used in the past In this way not only will we be able to better
identify low intermediate and high performers but also their related strengths and weaknesses
upon which specific remedial efforts can be targeted As for the equal likelihood of ESL and
non-ESL learners to achieve either low intermediate or high performing profiles this study
recommends future studies targeted at shedding perceptions of non-English speakers
underperforming in relation to first language speakers that have perhaps been shaped by previous
studies Without doing so we risk assuming the need for remediation directed at one group
whilst ignoring the needs of others
49
References
Abedi J amp Lord C (2001) The language factor in mathematics tests Applied Measurement
in Education 14(3) doi 101207S15324818AME1403_2
Brown J (2016) Elementary student to get hour of math every day under new Ontario plan
Retrieved July 23 2016 from
httpswwwthestarcomyourtorontoeducation20160404elementary-students-to-get-
hour-of-math-every-day-under-new-ontario-planhtml
Chudowsky N amp Pellegrino JW (2003) Large-scale assessments that support learning what
will it take Theory into Practice 42(1) 75+ Retrieved from
httpgogalegroupcommyaccesslibraryutorontocapsidop=AONEampu=utoronto_mai
nampid=GALE|A99909373ampv=21ampit=rampsid=summonampuserGroup=utoronto_mainampauth
Count=1
Collins L K amp Lanza S T (2010) Latent class and latent transitional analysis with
applications in the social behavioral and health sciences Hoboken NJ Wiley amp Sons
DePascale C (2014) The ideal role of large-scale testing in a comprehensive assessment
system Journal of Applied Testing Technology 5(1) 1-11 Retrieved from
httpwwwjattjournalcomindexphpatparticleview48343
Education Quality and Accountability Office (2016) About the agency Retrieved May 26
2016 from EQAO
httpwwweqaocomenabout_eqaoabout_the_agencyPagesabout-the-agencyaspx
Education Quality and Accountability Office (2014) EQAOrsquos provincial elementary school
report 2014 Retrieved September 26 2015 from EQAO
httpwwweqaocomenassessmentsresultsPagesprovincial-report-elementary-
2014aspx
Figlio D amp Loeb S (2011) School accountability In EA Hanushek S Machin and L
Woessmann (Eds) Handbooks in Economic The Netherlands North-Holland pp 383-
421
Foster D Noyce P amp Spiegel S (2007) When assessment guides instruction Silicon
Valleyrsquos mathematics assessment collaboration In AH Schoenfeld (Ed) Assessing
mathematical proficiency (pp 137-154) Cambridge Cambridge University Press
Friesen S (2005) Math Teaching it better Education Canada 46(1) 6-10
Furr R M (2011) Scale construction and psychometrics for social and personality psychology
Los Angeles SAGE
Fillmore L W (2007) English learners and mathematics learning language issues to consider
In AH Schoenfeld (Eds) Assessing mathematical proficiency (pp 333-344) Cambridge
Cambridge University Press
50
Haertel E H amp Herman J l (2005) A historical perspective on validity arguments for
accountability testing Yearbook of the National Society for the Study of
Education 104(2) 1-34 doi101111j1744-7984200500023x
Hinton A (2014) Tracking student achievement in mathematics over time in English language
schools Retrieved from
httpwwweqaocomenresearch_dataResearch_ReportsPagesstudent-
achievementaspx
Howie S (2005) System-level evaluation Language and other background factors affecting
mathematics achievement Prospects 35(2) 175-186 doi101007s11125-005-1820-
8
Huff K amp Goodman DP (2007) The demand for cognitive diagnostic assessment In JP
Leighton amp MJ Gierl (Eds) Cognitive Diagnostic Assessment for Education (19-60)
New York Cambridge University Press
IBM Corp Released 2013 IBM SPSS Statistics for Windows Version 230 Armonk NY IBM
Corp
Jang E E amp Ryan K (2003) Bridging gaps among curriculum teaching and learning and
assessment Book review Kifer E (2001) Large-scale assessment Dimensions
dilemmas and policy Journal of Curriculum Studies 35(4) 499-512
Jang EE Dunlop M Wagner M Kim Y amp Gu Z (2013) Elementary school ELLsrsquo
reading skill profiles using cognitive diagnosis modelling Roles of length of residence
and home language environment Language Learning 63(3) 400-436 doi
101111lang12016
Kaplan RM amp Saccuzzo DP (2009) Psychological Testing Principles Applications and
Issues Belmont Wadsworth Cengage Learning
Kilpatrick J Swafford J Findell B amp National Research Council (US) (2001) Adding it
up Helping children learn mathematics Washington DC National Academy Press
Klinger D A amp Rogers W T (2011) Teachers perceptions of large-scale assessment
programs within low-stakes accountability frameworks International Journal of
Testing 11(2) 122-143 doi101080153050582011552748
La Rose L (2014) PISA results Canada students high level achievers but math and science
scores dip The Huffington Post Retrieved October 5 2015 from
httpwwwhuffingtonpostca20131203pisa-results-canada-
studentrankings_n_4376190html
Meyers L S Gamst G amp Guarino A J (2006) Applied multivariate research Design and
interpretation Los Angeles Sage
Milgram R J (2007) What is mathematical proficiency In AH Schoenfeld (Eds) Assessing
mathematical proficiency (pp 31-58) Cambridge Cambridge University Press
51
Moschkovich J (2007) Beyond words to mathematical content Assessing English learners in
the mathematical classrooms In AH Schoenfeld (Eds) Assessing mathematical
proficiency (345-352) Cambridge Cambridge University Press
Mutheacuten LK amp Mutheacuten BO (1998-2010) Mplus Userrsquos Guide (6th Ed)
Los Angeles CA Mutheacuten amp Mutheacuten
Nagy P (2000) The three roles of assessment Gatekeeping accountability and instructional
diagnosis Canadian Journal of Education 25(2) Retrieved from
httpmyaccesslibraryutorontocaloginurl=httpsearchproquestcomdocview215374
855accountid=14771
National Council of Teachers of Mathematics (2000) Principles and standards for school
mathematics Reston VA National Council of Teachers of Mathematics
Nichols P D (1994) A framework for developing cognitively diagnostic assessments Review
of Educational Research 64(4) 575 Retrieved from
httpmyaccesslibraryutorontocaloginurl=httpsearchproquestcomdocview214116
755accountid=14771
Nylund K L Asparouhov T amp Mutheacuten B O (2007) Deciding on the number of classes in
latent class analysis and growth mixture modeling A monte carlo simulation
study Structural Equation Modeling A Multidisciplinary Journal 14(4) 535-569
doi10108010705510701575396
OECD (2014) PISA 2012 Results What Students Know and Can Do Student Performance in
Mathematics Reading and Science doi httpdxdoiorg1017879789264208780-en
Ontario (2005) The Ontario curriculum grades 1-8 Toronto Ontario Ministry of Education
Pastor D A Barron K E Miller B J amp Davis S L (2007) A latent profile analysis of
college students achievement goal orientation Contemporary Educational
Psychology 32(1) 8-47 doi101016jcedpsych200610003
Rogers WT (2013) What is the quality of EQAO assessments Excellent Retrieved
September 24 2015 from
httpwwweqaocomenresearch_dataResearch_ReportsPagesbest-assessment-
practicesaspx
Rogers WT (2014) Improving the utility of large-scale assessments in Canada Canadian
Journal of Education 37(3) Retrieved from httpcje-rcecaindexphpcje-
rcearticleview1732
Ross JA amp McDougall D E (2006) Mathematics In K Leithwood P McAdrie N Bascia
amp A Rodrigue A (Eds) Teaching for deep understanding Towards the Ontario
curriculum that we need (pp 33-39) Thousand Oaks CA Corwin Publishing
Schoenfeld A H (2007) Issues and tensions in the assessment of mathematical proficiency In
52
AH Schoenfeld (Ed) Assessing mathematical proficiency (pp3-15) Cambridge
Cambridge University Press
Schoenfeld A H (2007) What is mathematical proficiency and how can it be assessed In
AH Schoenfeld (Ed) Assessing mathematical proficiency (pp 59-73) Cambridge
Cambridge University Press
Schoenfeld A H (1992) Learning to think mathematically Problem solving metacognition
and sense making in mathematics In D Gouws (Ed) Handbook for research on
mathematics teaching and learning (pp 334-370) New York Macmillan
Schumacker R E amp Lomax R G (2004) A beginnerrsquos guide to structural equation modeling
(2nd ed) Mahwah NJ Lawrence Erlbaum Associates
Shapka J Domene J amp Keating D (2006) Trajectories of career aspirations through
adolescence and young adulthood Early math achievement as a critical filter
Educational Research and Evaluation 12(4) 347-358 Retrieved from
httpdxdoiorg10108013803610600765752
Statistics Canada (2016) Immigration and Ethnocultural Diversity in Canada Retrieved May
31 2016 from httpswww12statcangccanhs-enm2011as-sa99-010-x99-010-
x2011001-engcfm
Stein MK Remillard J amp Smith MS (2007) How curriculum influences student learning
In FK Lester amp National Council of Teachers of Mathematics (Eds) Second handbook
of research on mathematics teaching and learning a project of the National Council of
Teachers of Mathematics (pp 1099) Charlotte NC Information Age Pub
Stokke A (2015) What to do about Canadarsquos declining math scores Retrieved from
httpswwwcdhoweorgpdfcommentary_427pdf
Tatsuoka K Corter J amp Tatsuoka C (2004) Patterns of Diagnosed Mathematical Content
and Process Skills in TIMSS-R across a Sample of 20 Countries American Educational
Research Journal41(4) 901-926 Retrieved from
httpwwwjstororgmyaccesslibraryutorontocastable3699467
Uebersax JS (2015) Introduction to the Tetrachoric and Polychoric Correlation Coefficients
Retrieved July 20 2015 from httpjohn-uebersaxcomstattetrahtm
Wilson L D (2007) High-stakes testing In FK Lester and National Council of Teachers of
Mathematics (Eds) Second handbook of research on mathematics teaching and learning
a project of the National Council of Teachers of Mathematics (pp 1053 -1098)
Charlotte NC Information Age Pub

3
2003) much controversy exists surrounding their impact on education without pedagogically
useful information concerning what students know and can do with their learning
The generation of a total score to serve as the sole indicator on which to reflect the
overall performances of learners on largescale assessments is a popular approach adopted by
organizations for the purpose of providing feedback to stakeholders (Nichols 1994) Total
scores however have been criticized for providing an overly simplistic representation of learner
abilities which in addition to heightening the risk of result abuse (Earl 1999) and lacks the
necessary insight into learner abilities on which to base any meaningful decisions for the
improvement of education (Nichols 1994 Rogers 2014) For this reason it is argued whether
or not any remedial action based on these results in an attempt to improve mathematical
educational practices can extend beyond anything more than the implantation of blanketed
remedial strategies without further insight
The purpose of this study was therefore to go beyond total scores to gain better insight
into the mathematical performances of Grade 6 learners of Ontario in an attempt to produce
evidence on which to base remediation Using the results of the EQAO provincial assessment
this study aimed to investigate learner strengths and weaknesses in different aspects of
mathematics as determined by an analysis of the dimensionality of the items that make up the
assessment Furthermore this study used language background variables and length of residence
in Canada in an attempt to better identify learners and predict performance profile membership
The responses of a sample of Grade 6 learners to 28 multiple choice mathematics items
on the EQAO provincial assessment were analyzed The following questions were addressed in
this study
4
i What characterizes the dimensionality of the EQAO mathematics achievement
test administered to Grade 6 students in Ontario public schools
ii In which mathematical dimensions and related strands do students demonstrate
strengths and weaknesses in their mathematical achievement
iii To what extent are mathematics performance profiles predicted by student
background such as language and length of residence status
5
Chapter 2 Literature Review
This chapter discusses largescale assessments in education as well as their scoring and
reporting practices This is followed by an overview of mathematics education and its associated
curriculum as well as the factors predicting the performances of learners therein
21 Largescale Assessments in Education
Much of the origin and development of largescale testing in education can be traced back
to 1845 in the United States where they were first implemented in Boston schools and
championed for their use as a superior way to examine pupils (Wilson 2007) Today the
concept of educational testing has expanded into a multi-million-dollar business (Wilson 2007)
with largescale assessments serving as the measurement tool of choice on which to gauge the
system of education (Rogers 2014)
Largescale assessments can be characterized by the way in which they are administered
to large groups of learners simultaneously and in a highly standardized manner (Wilson 2007)
The foundations of these assessments rest on the same ideas as criterion referenced tests and are
classified as standards-based rather than norm-referenced tests (Kaplan amp Saccuzzo 2007) In
other words these largescale standards-based assessments compare the performances of
individuals against specific types of skills tasks or knowledge such as curricular standards or
expectations whereas norm- referenced tests compare each person with a norm and therefore
forces competition among people (Kaplan amp Saccuzzo 2007)
Largescale assessments in education were originally used to sort and classify learners
today they still serve this gatekeeping purpose but are also employed to serve two other
functions to which the majority of attention has shifted namely holding those responsible for the
6
education of learners accountable (accountability) and for the improvement of education
(Chudowsky amp Pellegrino 2003 Nagy 2000) School accountability involves the process of
evaluating school performance on the basis of student performance measures (Figlio amp Loeb
2011) and forms part of the system used by officials in education to monitor the effective
functioning of schools
It can also be characterized as either a high- or low-stakes system which further
differentiates the use of the results For instance according to Rogers (2014) accountability in
Canada is considered to be a low-stakes system and therefore the emphasis is predominantly on
using the results for educational improvement In contrast the United States is considered to be
a high-stakes system as results are used chiefly to sanction and reward schools
Although the use of largescale assessments in education have been credited for providing
an objective ldquoyardstickrdquo on which to measure learnersrsquo performances (Rogers 2014) and for
their ability to simplistically rank individuals along a highly reliable scale (Huff amp Goodman
2010) they have endured much criticism from those within the field Not only has much of this
been centered around their many unintentional consequences such as promotion of teaching to
the test test preparation activities at the expense of instructional time dishonesty among
educators and student drop out (Rogers 2014 Schoenfeld 2007) but also their scoring and
reporting practices and procedures These criticisms have led to much doubt concerning their
effectiveness as a tool to serve the purposes for which they are employed
211 Scoring and Reporting Practices of Largescale Assessments
It is common practice for largescale assessments to be scored using Item Response Theory
or Classical Test Theory in order to generate a total score and to use only these to report the
overall performances of learners on the assessment (Nichols 1994) Although this scoring and
7
reporting procedure is credited for being relatively quick and cost effective (Chudowsky amp
Pellegrino 2003) they serve merely to highlight that there is a problem but provide little
direction as to what the problem is (Nichols 1994) Foster Noyceand Speigel (2007) sum up
the criticism against total scores by stating that although they may reassure a schoolrsquos staff about
student progress or alert them to trouble ahead they do little to inform teachers about how
students are thinking what they understand where they are falling down and how specifically
teachers might change their own instructional practices to address studentsrsquo difficulties
The over simplistic representation of learner performances by total scores therefore lacks
the necessary insight on which to base remedial decisions (Nichols 1994) For this reason the
effectiveness of largescale assessments as a tool for improving education has been questioned
(Rogers 2014) For instance it is expected that educators and principles use results of largescale
assessments to improve their instructional practices (Rogers 2014) however in a study
conducted by Klinger and Rogers (2013) it was discovered that they in fact found little
direction from these results to do so This has led to an increased demand from those within the
field for these assessments to report more than only overall performances in the form of total
scores (Huff amp Goodman 2010 Nichols 1994 Rogers 2014) Detailed information from
assessments can help those in education including teachers and students identify content and
curricular areas that need attention (Schoenfeld 2007) and in so doing aide in the improvement
of education in disciplines where it is needed the most
212 Test Development Procedures
Largescale assessment organisations commonly adopt traditional unidimensional
frameworks to form the basis of test development procedures A unidimensional framework is
one that assumes a single factor or latent variable as an explanation for a certain behaviour such
8
as academic ability (Kaplan amp Saccuzzo 2007) However many curricular in practice today
have been developed on a multidimensional framework such as that of mathematics where
academic ability is assumed to consist of more than one skill or factor
Furthermore test development practices are performed taking into consideration certain
test constraints for instance test format which is usually paper-and-pencil based as well as
administration time For this reason it is impossible to include items to measure all curriculum
expectations in one test (Haertel amp Herman 2005) This sampling process of curriculum
expectations therefore also means that only few items for each expectation are included in the
assessment (Rogers 2014)
In addition to these test development procedures raising construct validity concerns
(Wilson 2007) they limit the reporting of test scores beyond anything more than overall total
scores As highlighted by Rogers (2014) since the assessment was never designed from an
explicit framework in line with that of curriculum expectations from the start as well as include
only a few items targeted at each subdomain it is highly unlikely that the assessment meets the
rigorous test properties needed to allow for reporting anything beyond that of total scores
In order to satisfy the many calls for change to reporting practices assessment
organisations would need to deviate from these traditional more cost effective practices For this
reason Chudowsky and Pellegrino (2003) indicate that change is unlikely to happen soon As a
result our efforts to improve education in disciplines where it is needed the most will continue
to take place within the confinements of that which assessment organisations refuse to change
22 Mathematics Education and Curriculum
The mathematical reform movement generated in the late 1950rsquos signaled the need for the
implementation of better teaching and learning practices for mathematics in schools (Friesen
9
2005) Today many mathematics curricular worldwide including that of Canada are based on
the Principles and Standards for School Mathematics as set out by the National Council of
Teachers of Mathematics (NCTM) (Friesen 2005) Very broadly curriculum refers to the
substance or content of teaching and learning it focusses on the ldquowhatrdquo of teaching and learning
as opposed to the ldquohowrdquo (Stein Remillard amp Smith 2007)
This NCTM document calls for the teaching and learning of mathematics with the goal of
developing both content or procedural knowledge and conceptual understanding of the
discipline through the application of essential thinking or processing skills such as problem
solving or reasoning skills which in turn will be developed (NCTM 2000) This goal for
mathematics education is in stark contrast to that of traditional goals where only the teaching and
learning of procedural or content knowledge was valued and taught through rote teaching and
learning practices (Schoenfeld 2007) Procedural knowledge refers to what and how to solve
certain mathematical problems whereas conceptual understanding refers to why a certain
problem is solved the way it is (Kilpatrick Swafford Findell amp NRC 2001)
Furthermore the NCTM adopted the view that standards play a leading role in guiding
the improvement of mathematics education (NCTM 2000) It therefore highlights specific
mathematical standards or expectations that learners should achieve Specifically five Content
Standards are used to guide the teaching and learning of procedural and conceptual knowledge
namely Number and Operations Algebra Geometry Measurement and Data Analysis and
Probability Five Process Standards also guide the essential processes or thinking skills of
Problem Solving Reasoning and Proof Communication Connections and Representation
(NCTM 2000) The NCTM (2000) repeatedly proclaims the interconnectedness of these
standards by indicating that procedural knowledge should never exist without conceptual
10
understanding which in turn should not be developed without the application and acquisition of
the essential processing skills
The Content and Process Standards are further classified into groups or categories for
assessment purposes in mathematics curricular such as that of Ontario Specifically the Ontario
Curriculum Grades 1-8 Mathematics 2005 document describes four categories of Knowledge
and Understanding Thinking Communication and Application to which the standards are
allocated These four categories are known as the Knowledge and Skills categories and are
reflected in the documentrsquos Achievement Chart The first category of Knowledge and
Understanding can be described as encompassing mathematical knowledge of content and
understanding and therefore focusses predominantly on the achievement of the Content
Standards The remaining three categories focus predominantly on the use of the Process
Standards The Thinking category assesses the use of problem solving reasoning and proving
processes the Communication category focusses on the assessment of the communicating
processes and lastly the Application category focusses on the assessment of the connecting
processes
From the above mathematics curriculum we can see that the knowledge base is still
considered important in mathematics education however so is conceptual understanding and the
application and acquisition of thinking skills As stated by Schoenfeld (2007) anyone who lacks
a solid grasp of facts procedures definitions and concepts is significantly handicapped in
mathematics yet there is more to being mathematically proficient than simply reproducing
standard content on demand Therefore if we are interested in understanding mathematical
proficiency as it is taught and learned today it is important that we reflect learner abilities in all
aspects of the discipline (Kilpatrick et al 2001) In so doing we will gain better insight into
11
their strengths and weaknesses allowing us to remediate accordingly in our efforts to improve
learner performances in this essential discipline
23 Factors Predicting Mathematical Performances
Given the relative importance of mathematics it is no surprise that much research has been
dedicated to highlighting and isolating the number or factors that can influence and predict
mathematical performances By doing so early interventions and remedial strategies can be
better targeted to improve future mathematical success (Hinton 2014)
One such factor that has been given much attention is that of language proficiency and its
influence on mathematical performances Studies conducted by Hinton (2014) Howie (2005)
and Abedi and Lord (2001) for instance discovered that learners who spoke English as a second
language performed worse in mathematical assessments compared to their English proficient
counterparts Fillmore (2007) however cautions against interpreting this as a lack of
mathematical ability without firstly taking into account the aspect of language Since much of
the mathematics taught today is presented in the form of a word problem it relies heavily on a
deep understanding of language (Moschovich 2007) Therefore trying to tease out precisely
how much of the struggle is related to a language issue and how much to an issue with
mathematics is a unique challenge for teachers assessment and English Language Learners
(ELLrsquos) (Fillmore 2007) As highlighted by Moschovich (2007) assessment is certainly a
complex task perhaps especially when working with students who are learning English It is
challenging to decide whether an utterance reflects a studentrsquos conceptual understanding a
studentrsquos proficiency in expressing their ideas in English or a combination of mathematical
understanding and English proficiency
12
Canada has a high and diverse immigrant population for instance 206 of its population
in 2011 was determined to be comprised of immigrants from various countries (Statistics
Canada 2016) Thus the mathematical performances of ELLrsquos cannot be ignored Fortunately
this aspect is currently given attention in the province of Ontario as assessment organizations
such as the EQAO do attempt to report separately on these learnersrsquo performances However
Jang Dunlop Wagner Kim and Gu (2013) warn against treating ELLrsquos as a homogenous group
Their study found that when taking into account the length of residence in Canada
performances of these students varied significantly concerning their reading proficiencies
Therefore if we wish to predict mathematical performances or gain better insight based on
student background such as language factors it is necessary to consider subpopulation groups
that make up the overall ELL population such as length of residence in the country
13
Chapter 3 Method
This chapter describes the participants instrument and data as well as the three main
analyses used to answer the questions presented in this study
31 Participants
The current study used data made available by the Education Quality and Accountability
Office (EQAO) of Ontario The EQAO is an arms-length Ontario government agency that is
responsible for developing and overseeing reading writing and mathematics assessments
administered to Grade 3 6 9 and 10 students in Ontario public schools The purpose of the
results of these largescale assessments is to determine the extent to which learners have achieved
the curriculum standards of the particular discipline for educational accountability and
improvement purposes (EQAO 2016)
Learnersrsquo responses are scored by the EQAO using Classical Test Theory and Item
Response Theory (Rogers 2013) to generate a score that is then converted into a Level NIE 1 2
3 or 4 Level 3 describes a performance at the provincial standard whereas Level 4 a
performance surpassing the standard Level 2 a performance approaching the standard and Level 1
a performance much below the standard Lastly a ldquoNIErdquo rating is generated for those learners
who have not provided sufficient evidence for a Level 1 score The EQAO test scores are reported
using these proficiency levels for each of the areas tested namely reading writing and
mathematics Background information such as gender time lived in Canada and student home
language etc is also collected by questionnaires administered by the EQAO over the same time
The full population data set comprised of approximately 127 302 Grade 6 learnersrsquo
responses to the English 20132014 provincial Junior Division assessment A random sample of
5000 learner responses to the assessment was drawn from the entire data set Learners with
missing data on any of the variables were excluded from the sampling process so that the final
14
data set contained responses to all mathematics items as well as background information All
learners within the sample were enrolled at the time in Grade 6 and attended various schools
across the province Table 1 below presents the distributions of student subgroups from the
random sample based on their gender language background and time spent in Canada in
comparison with the entire population The percentage of learners in each subgroup was very
closely aligned with the larger Grade 6 population and was therefore considered a representative
sample
Table 1
Final Random Sample used for the Analysis
Standard Gender Language Time lived in Canada
Met
Below
Female
Male
Non-
ESL
ESL
CA
Born
Non-CA
born lt 5
years
Non-CA
born ge 5
years
Frequency 2765 2235 2456 2544 4460 540 4493 199 308
Sample 553 447 491 519 892 108 899 4 62
Population 54 46 49 51 887 113 871 4 89
Notes N = 5000 Standard = met the provincial standard or achieved below the provincial standard ESL = enrolled in
English as a Second language program Time lived in Canada = Canadian born learners non-Canadian born learners
who have lived in Canada for less than 5 years and non-Canadian born learners who have lived in Canada for 5 years
or more
32 Instrument
Student responses to the mathematics test items and background information on the EQAO
20132014 Junior Division assessment were used for this study This assessment is a provincially
mandated largescale assessment used by the Ontario government to measure the extent to which
learners have achieved the standards as laid out in the curriculum All the EQAO largescale
assessments are designed using rigorous development procedures and meet high testing standards
with acceptably high reliabilities (Rogers 2013) of above 80 The Junior Division assessment is
15
specifically administered to all Grade 6 learners attending schools within the province of Ontario
during the months of May and June and under highly standardized conditions (EQAO 2016) The
assessment measures reading writing and mathematical skills in each of the corresponding
sections The mathematics section specifically consists of 36 items of which 28 are multiple choice
items and 8 are constructed-response format questions This study included only the 28 multiple
choice items
While the EQAO does not claim to measure the Knowledge and Skills categories as laid out
in the Ontario Curriculum Grades 1-8 Mathematics 2005 document (Rogers 2013) it still
references each of the mathematics items to one of three of the categories namely that of
Knowledge and Understanding Thinking and Application The category of Communication is not
represented by any of the items as according to Rogers (2013) this skill is not feasible to assess in
a paper-and-pencil based test For items to be referenced to the Knowledge and Understanding
category they need to be recognized as requiring students to demonstrate subject specific content
and comprehend its meaning Those referenced to the Application category need to be recognized
as requiring students to select an appropriate mathematical tool and apply the appropriate
information Lastly those referenced to the Thinking category need to be seen as requiring of
students to select and sequence a variety of tools and think critically in order to solve problems
(Rogers 2013) Items are scrutinized by teachers and other content experts for the process of
allocating items to the most appropriate category Items are further referenced to the five content
areas or strands of the curriculum document according to their content topic namely Number Sense
and Numeration Measurement Geometry and Spatial Sense Patterning and Algebra and Data
Management and Probability
Table 2 shows the representation of each of the Knowledge and Skills categories and the
strands to which the 28 multiple choice items were referenced by the EQAO as well as the item
difficulties (p-values) and discrimination indices (pt-biserial correlations) for each of these items
According to Kaplan and Saccuzzo (2007) item difficulty values should range from 30 to 70 to
16
maximize information about the differences among individuals Furthermore item discriminability
values should not be negative or below 20 to be considered adequate Based on these
recommendations all 28 items were considered suitable to be included in the analyses of this study
Table 2
Knowledge and Skills Categories Strands and Descriptive Statistics of 28 Mathematics Items
Item Know amp Skill Strand p-value pt-biserial
1 K and U Patterning amp Algebra 86 39
14 K and U Patterning amp Algebra 74 43
3 K and U Number Sense amp Numeration 76 37
15 K and U Number Sense amp Numeration 86 35
9 K and U Data Management amp Probability 48 33
19 K and U Measurement 50 27
25 K and U Measurement 76 40
22 K and U Geometry amp Spatial Sense 87 34
73 36
11 App Patterning amp Algebra 81 43
24 App Patterning amp Algebra 70 37
26 App Patterning amp Algebra 40 30
5 App Number Sense amp Numeration 56 38
7 App Number Sense amp Numeration 82 30
10 App Data Management amp Probability 55 47
18 App Data Management amp Probability 78 47
23 App Data Management amp Probability 71 42
2 App Measurement 59 31
8 App Measurement 58 28
20 App Measurement 54 47
6 App Geometry amp Spatial Sense 68 38
64 38
17 Think Patterning amp Algebra 52 36
21 Think Number Sense amp Numeration 57 22
28 Think Number Sense amp Numeration 69 33
4 Think Data Management amp Probability 46 35
13 Think Measurement 54 39
27 Think Measurement 41 46
12 Think Geometry amp Spatial Sense 42 35
16 Think Geometry amp Spatial Sense 54 34
52 35
Notes K and U = Knowledge amp Understanding App = Application Think = Thinking p-value and pt-biserial means
for each Knowledge amp Skill category represented in bold
17
No items had p-values below 30 however 10 items had difficulty values above 70
indicating that they were relatively easy for this sample Since none of the p-values were above
90 they were considered to still possess sufficient variability to be included in the analyses
Furthermore no items had values below the recommended 20 or negative pt-biserial values Table
2 further highlights the item difficulty and discrimination means for each of the three categories
From these values it can be concluded that the items referenced to the Knowledge and
Understanding category were relatively more easy for this sample while those items referenced to
the Thinking category more difficult and those referenced to the Application category moderately
difficult Lastly it is highlighted that a greater number of items represented the Application
category (12 items) than the Knowledge and Understanding and Thinking category which had an
equal number of eight items
33 Data Analysis
The data analyses involved three phases each of which addressed one of the three questions
asked in this study The first phase used Exploratory Factor Analysis (EFA) approaches to
examine the first research question ldquoWhat characterizes the dimensionality of the EQAO
mathematics achievement test administered to Grade 6 students in Ontario public schoolsrdquo
Latent Class Analysis (LCA) approaches were used in the second phase in order to answer question
two ldquoIn which mathematical dimensions and related strands do students demonstrate strengths and
weaknesses in their mathematical achievementrdquo A multinomial logistic regression analysis was
performed to examine research question three ldquoTo what extent are mathematics performance
profiles predicted by student background such as language and length of residence statusrdquo
331 Phase 1 Establishing the Dimensionality of the Assessment
An Exploratory Factor Analysis (EFA) was conducted in order to determine the
dimensionality of the EQAO Grade 6 mathematics test based on 5000 studentsrsquo responses to 28
multiple choice items Although exploratory in nature the EFA was used to examine the extent
18
to which the test dimensionality can be accounted for by knowledge and skills and further by the
strand specified by the EQAO
EFA is a statistical procedure that simplifies the process of visually inspecting a range of
correlations in order to examine the dimensionality of measures (Furr 2011) The 28 multiple
choice items were firstly recoded as binary data thus creating dichotomous categories (0 =
incorrect responses and 1 = correct responses) In order to perform an EFA with this type of
data a more sophisticated statistical software package is required The reason for this being that
standard software such as IBMrsquos SPSS (version 230) creates correlation matrices suitable only
for continuous data that assume a normal distribution (Uebersax 2015) Therefore MPLUS
version 612 (Mutheacuten amp Mutheacuten 1998-2012) was used for the analysis so that a tetrachoric
correlation matrix could be generated to suite the binary data used in this study
When conducting an EFA in Mplus a correlation matrix eigenvalues and model fitting
statistics such as the chi-square test Root Mean Square Error of Approximation (RMSEA) and
Root Mean Square Residual (RMSR) are produced in order to assist with the process of
determining the solution that best fits the data A good fitting model will be represented by a
non-significant chi-square p-value as well as a RMSEA value and RMSR value of below 05
(Schumacker amp Lomax 2004) However interpretability of the model should also be taken into
consideration when deciding on the best solution (Meyers Gamst amp Guarino 2013) The
weighted least-squares with mean (wlsm) estimation method as recommended by Mutheacuten and
Mutheacuten (1998-2012) for binary data and the oblique rotation method (Promax) was used for this
analysis based on the assumption that factors are likely to be correlated with each other
Four steps were implemented during this phase The first step entailed determining the
ideal number of factors to be extracted to best describe the data This entailed a combined
evaluation of the correlation matrix eigenvalues scree plot and fit statistics as described above
The next step entailed an evaluation of the items and their loadings on each of the factors to
determine if any should be discarded in terms of low factor loadings or cross-loadings If any
19
items were deemed unacceptable these were removed and the analysis re-run and subsequently
re-evaluated This step was repeated until a final and appropriate factor solution model was
obtained Following this the reliability for each factor was established followed by an
investigation of the factor correlations in order to determine the uniqueness of each extracted
dimension Ideally items should correlate highly with each other within each extracted
factordimension however for each dimension to be considered unique between-factor
correlations should be low (Rogers 2014) According to Meyers et al (2013) between-factor
correlations should not exceed 80 to warrant the use of a separate dimension The last step
involved an investigation of the similarities between items in each factor in order to describe the
items that make up each This was done firstly in terms of the three Knowledge and Skills
categories and secondly the five strands to which the items were referenced as well as any
further content similarities
332 Phase 2 Identifying Mathematical Strengths and Weaknesses
In an attempt to identify in which mathematical subdomains or dimensions and related
strands learner performances were strongest and weakest as asked in question two of this study a
Latent Class Analysis (LCA) was performed using MPLUS version 612 (Mutheacuten amp Mutheacuten
1998-2012)
Specifically the goal of a mixture model is to reveal unobserved heterogeneous and
meaningful population groups within the larger homogenous population by identifying similarities
in their responses to measured variables (Nylund Asparouhov amp Mutheacuten 2007) These identified
latent populations or sub-groups are called classes Therefore using this analysis allowed for the
generation of distinct performance profiles for each sub-group or class identified as performing
similarly in the largescale assessment In this way more accurate class specific strengths and
weaknesses could be described as opposed to simply those of the overall Grade 6 population
20
For an LCA the outcome variables used are specifically categorical (Nylund et al 2007)
Therefore dichotomously scored response data from the random sample of 5000 students were
used for the LCA The LCA approach is exploratory in nature because the optimal number of
classes representing all latent classes cannot be determined apriori (Nylund et al 2007) Therefore
an investigation of relevant fit statistics generated by the LCA was firstly conducted According to
Pastor Barron Miller and Davis (2007) the fit statistics commonly used to determine the optimum
number of classes include the Bayesian Information Criterion (BIC) the sample-size adjusted BIC
and the Akaike Information Criterion (AIC) where lower values indicate a better fitting model An
Entropy statistic is also commonly used to determine model fit This statistic ranges from 0 to 1
where values closest to 1 indicate higher classification accuracy
Following the identification of the best fitting model the entire sample was profiled in
terms of distinct mathematics classes In order to reduce the number of points on these profiles
items were grouped according to the strand to which they were referenced by EQAO within each
identified factor This allowed for the identification of learner strengths and weaknesses not only
surrounding factors but also each strand within each factor
As part of the LCA mean item probability scores are calculated for each class This statistic
indicates the mean probability for each class to respond correctly to an item and therefore ranges
from 0 to 1 (Nylund et al 2007) Values closest to one therefore indicate a higher probability of
responding correctly to an item Using these values for each item average item-group probability
scores were calculated and these values were then used to describe class specific strengths and
weaknesses This was done firstly by describing overall item-group performances in comparison
to other classes and secondly by describing class performances in each specific factor overall and
lastly in terms of each strand within each factor
21
333 Phase 3 Predicting Class and Profile Membership
In order to answer question three concerning whether or not English as a second language
and length of residence in Canada significantly predicted the performance profile to which a
learner belongs a multinomial logistics regression analysis was conducted This phase was
completed using IBMrsquos SPSS (version 230)
A multinomial logistic regression is used when the dependent variable for the analysis
consists of more than two categorical levels (Meyers et al 2013) Besides the item probability
mean generated by the LCA a class probability mean for each learner in the sample is also
calculated as part of the analysis This class probability indicates the likelihood of a learner
belonging to each of the classes or performance profiles Based on the highest class probability
learners were allocated to one of the performance profiles as generated in phase 2 These classes
were coded 1 2 3 etc based on the number of classes determined to best describe the sample and
represented the dependent or predicted variable of the analysis
Table 3
Six Groups Created Based on English as Second Language and Time Lived in Canada
Group Language Time lived in Canada n
1 Non-ESL CA born 4185 837
2 ESL CA born 308 62
3 Non-ESL Non-CA born lt 5 years 76 15
4 ESL Non-CA born lt 5 years 123 25
5 Non-ESL Non-CA born ge 5 years 199 40
6 ESL Non-CA born ge 5 years 109 22
Notes N = 5000 ESL = English as a second language learner CA born = Born in Canada
An independent variable used for predicting the latent class membership included six
groups based on the following background variables English Second Language (ESL) status as
22
well as whether or not they were Canadian born non-Canadian born but at the time had resided in
the country for less than 5 years or non-Canadian born but at the time had resided in the country for
five years or more This was done in order to avoid clustering ELL learners as a homogenous group
and therefore better identify learners These six categorical data groups represented the predictor
or independent variable Table 3 indicates more precisely how each of the groups were created as
well as their sizes
23
Chapter 4 Results
The results of this study are discussed according to the three questions presented and phases
of data analyses as discussed in Chapter 3 Firstly the results produced from the Exploratory
Factor Analysis (EFA) described in phase one concerning question one are reported Secondly
those produced by the Latent Class Analysis (LCA) in phase two to answer question two and lastly
those produced from the multinomial logistics regression analysis conducted in phase three to
answer question three are presented in this chapter
41 Dimensionality Characteristics
As noted an EFA was conducted on the 28 multiple choice mathematics items in order to
determine the dimensionality of the largescale assessment to which they belonged The
eigenvalues of the tetrachoric correlation matrix (Table 4) produced by Mplus ranged between
862 and 41 the first three factors showed eigenvalues greater than 1 and accounted for 3953 of
the total variance
Table 4
Eigenvalues of Correlation Matrix indicating Total Variance Explained
Item Eigenvalue Item Eigenvalue Item Eigenvalue Item Eigenvalue
1 86 2 13 3 10 4 93
5 91 6 90 7 87 8 85
9 84 10 80 11 79 12 76
13 74 14 72 15 70 16 69
17 66 18 65 19 64 20 63
21 60 22 57 23 53 24 52
25 50 26 49 27 46 28 41
24
411 Determining the Best Fitting Factor Solution Model
The eigenvalues scree plot and fit statistics were used to determine the best number of
factors to describe this data set Based on the ldquonumber of eigenvalues greater and equal to one
rulerdquo as suggested by Meyers et al (2013) together with the scree plot and relevant fit statistics it
seemed adequate to extract three factors albeit accounting for less than 50 of the variance
Figure 1 Scree plot
Although three eigenvalues were produced greater and equal to one suggesting the
existence of three factors this was contradicted by the scree plot (Figure 1) which suggested the
existence of only two factors as it appeared to level off mostly at number three Subsequently a
comparison of the one to three factor solutions was conducted in terms of the relevant fit statistics
as described in Table 5
The significant chi-square p-values (lt 001) generated for the one and two factor solutions
suggested that the data differed significantly from the model matrix Although the chi-square p-
value has been criticized in the past for being overly sensitive to large sample sizes and therefore
0
05
1
15
2
25
3
35
4
45
5
55
6
65
7
75
8
85
9
1 2 3 4 5 6 7 8 9 10 11 12 13 14 15 16 17 18 19 20 21 22 23 24 25 26 27 28
Eig
envalu
es
Items
25
almost always producing a significant value (Meyers et al 2013) this was determined not to be the
case for this analysis as the p-value generated in the three factor model increased substantially
from the one to two factor model thus ensuring the reliability of this value
Table 5
EFA Model Fit Statistics of the 1 to 3 Factor Solutions on 28 Mathematics Items
FA model Chi-Square df p-value RMSEA RMSR
1 92476 350 lt 001 018 031
2 44012 323 lt001 009 021
3 34390 297 032 006 019
Note N = 5000
Therefore since the Chi-square p-value of 032 of the three factor model was not significant
(at the 001 probability level) as well as the fact that only two items represented the fourth factor in
the four factor solution model it was deemed a good fitting model The values of 006 and 019 of
the RMSEA and RMSR respectively were well below the 05 recommended value providing
further support for this three factor solution model
A further inspection of the factor loadings from the three-factor solution as well as of the
items on each factor resulted in the removal of four items (ie 12 18 23 and 24) Items 18 23 and
24 were discarded as a result of low factor loading scores below 30 Whereas a decision was made
to remove Item 12 as it was the only item referenced to the Thinking category that did not load on
the factors in the same way that the others did Table 6 presents the final factor loadings with the
Knowledge and Skills categories to which items were originally allocated by the EQAO that is
knowledge and understanding application and thinking
The Promax factor correlation matrix produced by Mplus (Table 7) revealed that all three
factors correlated positively and moderately to high with one another The strongest correlation
26
existed between Factor 1 and Factor 3 with a relatively high coefficient value of 747 while the
weakest correlation existed between Factor 1 and Factor 2 with a coefficient of 576
Table 6
Factor Loadings of the 23 Items used in the Final 3 Factor Solution Model
Item Knowledge amp Skill Factor 1 Factor 2 Factor 3
1 KU 64 -09 13
11 App 63 -04 12
14 KU 55 13 01
6 App 51 12 -04
15 KU 51 -05 14
10 App 47 23 05
7 App 45 -12 13
25 KU 38 09 17
3 KU 35 -01 24
9 KU 35 09 07
22 KU 31 07 23
5 APP 30 09 22
13 App 10 65 -05
27 Think -04 63 23
2 Think -07 50 12
20 App 14 -03 59
17 Think -04 04 55
26 App 13 01 33
8 App 11 -01 32
28 Think 15 03 32
16 Think 11 10 31
4 Think 14 12 30
21 Think -04 08 30
α = 725 α = 536 α = 565
Notes KU = Knowledge and Understanding App = Application Think = Thinking category
As stated earlier according to Meyers et al (2013) correlations should not exceed 80 to warrant
the use of separate factors These results are therefore considered to reveal the existence of three
27
unique factors that can be used to describe the multidimensionality of these mathematics multiple
choice items
Table 7
Promax Factor Correlations Between 3 Factors
Factors FA 1 FA 2
Factor 1
Factor 2 576
Factor 3 747 626
Note N = 5000
As indicated in Table 6 Factor 1 consisted of 12 items in total with factor loading scores
ranging between 30 and 64 and achieved a relatively high Cronbachrsquos alpha of 725 All seven
items referenced to the Knowledge and Understanding category used in the final model loaded
together on Factor 1 along with five items referenced to the Application category Factor 2
consisted of only three items with factor loading scores ranging between 50 and 63 and
achieved a moderate Cronbachrsquos alpha of 536 In Factor 2 two items referenced to the Thinking
category and one to the Application category loaded together to make up the total of three items
for this factor Lastly Factor 3 consisted of a total of eight items with factor loading scores
ranging between 30 and 59 and also achieved a moderate Cronbachrsquos alpha score of 565 The
remaining five items referenced to the Thinking category and three items referenced to the
Application category loaded together to make up the eight items that loaded together on Factor 3
In terms of the strands to which the items in Factor 1 were referenced for instance
Patterning and Algebra etc no clear similarities appeared to exist to tie all the items together
based on this However similarities seemed to exist in terms of the applied skill requested of
learners to solve the mathematical problems It appeared that all the items of this factor merely
requested of learners to apply their mathematical knowledge in terms of procedures and
conceptual understanding to answer the questions For instance Item 15 which is referenced to
28
the Knowledge and Understanding category asks the following ldquoWhat is the value of 0730 ndash
0156rdquo Whereas Item 5 which is referenced to the Application category asks that learners
solve problems involving the addition of decimal numbers (the exact question was not released)
Therefore it was determined that no clear difference existed between the applied skill requested
from these two items even though they were referenced to two different Knowledge and Skills
categories It was therefore concluded that Factor 1 could be described as measuring the
application of mathematical knowledge to solve problems in various strands
An inspection of the items that loaded together on Factor 2 revealed that two of the items
were referenced to the Thinking category while one of the items was referenced to the
Application category Furthermore all three items were similar in that that they covered the
ldquoMeasurementrdquo strand and more specifically that all three items requested of learners to solve
problems relating to ldquoAreardquo Item 2 for instance asks ldquoThe parallelogram below will be cut
into two congruent triangles (provides dimensions) What is the area of one of the trianglesrdquo
Item 13 asks ldquoWhich of the following shows a rectangle and a triangle that have the same areardquo
and lastly Item 27 requests that learners compare the areas of two polygons (exact item not
released) Item 2 was referenced to the Application category whereas Items 13 and 27 were
referenced to the Thinking category It was therefore determined that Factor 2 could be
described as requesting of learners to apply thinking processes or skills such as problem solving
and reasoning in order to solve deeper mathematical problems specifically surrounding the
Measurement topic of ldquoAreardquo
Lastly for Factor 3 as with Factor 1 no clear similarities appeared to exist to tie all the
items together based on strands However as with Factor 1 similarities seemed to exist in terms
of the applied skill requested of learners to solve the mathematical problems It appeared that
all the items on this factor requested of learners to apply thinking skills to solve deeper
mathematical problems surrounding various strands in other words learners had to go beyond
the mere application of content knowledge to solve these items For instance Item 20 referenced
29
to the Application category requested that learners solve the following problem ldquoEach beaker of
water below has a capacity of 2L Which beaker appears to have about 500ml of water in itrdquo
Whereas Item 28 referenced to the Thinking category asks ldquoMrs Garrett sends surveys to 120
students and 78 students return the survey Which statement best describes the percent of
students who return the surveyrdquo Again no clear difference appeared to exist between the
applied skill requested of learners in terms of the Application and Thinking categories to which
the items were referenced It was therefore concluded that Factor 3 could be described as
measuring the ability of learners to apply thinking processes or skills such as problem solving
and reasoning in order to solve deeper mathematical problems in various strands
In sum the results of the EFA determined that a three factor model could be used to
adequately characterize the dimensionality of the multiple choice mathematics items on the
EQAO assessment Twelve items clustered adequately together in terms of factor loading scores
to form Factor 1 which achieved a relatively high Cronbachrsquos alpha of 725 three items on
Factor 2 which achieved a moderate Cronbachrsquos alpha of 536 and lastly eight items on Factor
3 which also achieved a moderate Cronbachrsquos alpha score of 565 Upon closer inspection of
the items on each factor and in terms of the Knowledge and Skills categories and strands to
which they were referenced by the EQAO it was determined that Factor 1 could be best
described as measuring the ability of learners to apply mathematical knowledge related to
procedural and conceptual understanding in order to solve problems in various mathematical
strands Factor 2 could be best described as measuring the ability of learners to apply process
or thinking skills in order to solve problems related specifically to the topic of ldquoAreardquo
Lastly Factor 3 could be best described as measuring the ability of learners to apply thinking
skills in various mathematical strands
30
42 Mathematical Strengths and Weaknesses
In an attempt to identify in which mathematical dimensions and related strands Grade 6
learner performances were strongest and weakest as asked in question two of this study a Latent
Class Analysis (LCA) was conducted This allowed for distinct performance profiles to be
generated for classes or sub-groups performing similarly in the population and therefore allowed
for more accurate descriptions of strengths and weaknesses The factors as established in the
dimensionality investigation in Phase 1 of this study were used to represent the dimensions for this
analysis
Although the four class model achieved the lowest AIC BIC and Sample-Size Adjusted
BIC statistic values in comparison to the two and three class model it also produced a much lower
Entropy value of 69 (see Table 8) Therefore it was decided that since these statistics did not
decrease that much from the three class to four class model the use of the four class model with a
much lower Entropy value did not seem warranted Thus the three class model was opted for
instead as it produced lower fit statistics than the two class model as well as a sufficiently high
Entropy value of 75 Furthermore the results indicated that each class was represented by the
following proportion of learners from the sample Class 1 comprised of 321 Class 2 of 452
and Class 3 of 227
Table 8
LCA Fit Statistics for 2 3 and 4 Classes
Fit statistics 2 Classes 3 Classes 4 Classes
AIC 12974224 12808557 12789120
BIC 13004854 12854829 12851034
Adj BIC 12989919 12832268 12820846
Entropy 81 75 69
Notes N = 5000 AIC = Akaike Information Criterion BIC = Bayesian Information Criterion Adj BIC = Sample-
Size Adjusted Bayesian Information Criterion
31
Eleven item-groups were created to describe the strengths and weaknesses of the three
classes as represented in Table 9 Item-groups were created by grouping items according to the
factor they were determined to measure (as established in the EFA) as well as the strand to which
they were allocated by the EQAO Five item-groups were created for Factor 1 one item-group for
Factor 2 and five groups for Factor 3 The number of items within each item-group varied from 1
item to 4 items The mean probability scores calculated for each class for each item-group and
overall dimension or factor are also represented in Table 9 These mean item-group probability
scores as presented in Table 9 were used to plot three distinct performance profiles for each class as
represented in Figure 2 below
Table 9
Item-Groups created to Describe Mathematical Performances of Grade 6 Learners
Factor Content Area of items Class 1 Class 2 Class 3
1 Patterning amp Algebra 3 97 86 48
1 Measurement 1 95 78 44
1 Geometry amp Spatial Sense 2 94 79 50
1 Number Sense amp Numeration 4 92 76 49
1 Data Management amp Probability 2 78 49 19
Factor 1 class probability means 91 74 44
2 Measurement (Area) 3 85 39 28
Factor 2 class probability means 85 39 28
3 Patterning amp Algebra 2 67 43 20
3 Measurement 2 79 55 25
3 Geometry amp Spatial Sense 1 79 47 31
3 Number Sense amp Numeration 2 80 60 44
3 Data Management amp Probability 1 72 40 22
Factor 3 class probability means 76 51 29
Note The factor probability means presented in bold are slightly higher as the actual item probability score was used
to calculate these values and not the item-group probability scores
Using the evidence generated from the mean item-group and factor probability scores as
represented in Table 9 and Figure 2 these performance profiles were used to describe the strengths
32
and weaknesses of each class Class specific strengths and weaknesses were described according
to firstly overall performances in the 11 item-groups in comparison to the other classes secondly
in terms of overall performances in each dimension (Factor 1 2 and 3) and lastly in terms of
performances in each strand within each dimension for Factor 1 and 3 only (as Factor 2 only
represented Measurement topic of ldquoAreardquo) A mean item-group probability score ranging from 86
- 10 was described as especially strong 71 - 85 as strong and 56 - 70 as moderately strong
while those scores ranging from 41 - 55 were described as moderately weak 26 - 40 as
moderately weak and 25 and below as especially weak
Figure 2 Three performance profiles of Grade 6 learners in 11 mathematical item-groups
Results indicated that those learners most likely to belong to Class 1 performed higher than
Class 2 and 3 in all item-groups Therefore this class to which 321 of learners from the sample
belonged can be best described as the highest performing and second largest group overall Those
most likely to belong to this class can be described as having an especially strong ability to apply
0
01
02
03
04
05
06
07
08
09
1
Item
-Gro
up
Mea
n P
rob
ab
ilit
y
Item-Groups
Class 1 (321) Class 2 (452) Class 3 (227)
33
mathematical knowledge in order to solve problems in various strands This was determined by the
average 91 overall probability for success achieved for those items related to Factor 1 They can
also be described as having a strong ability to apply thinking skills in order to solve problems
surrounding the Measurement topic of ldquoAreardquo and strong ability to do the same in various strands
This was determined by the 85 probability for success achieved for those items related to Factor
2 and 76 probability for success achieved for those related to Factor 3 Furthermore their overall
performances in the knowledge dimension can be described as stronger in comparison to their
performances in the thinking dimensions
Specifically concerning their ability to apply mathematical knowledge in various strands
(Factor 1) these learners can be described as performing slightly stronger in the Patterning and
Algebra (item-group probability score = 97) and considerably weaker in Data Management and
Probability (item-group probability score = 78) in relation to their performances in the other
strands Specifically regarding their ability to apply think skills in order to solve problems (Factor
3) they can be described as performing slightly stronger in Number Sense and Numeration (item-
group probability score = 80) and considerably weaker in Data Management and Probability (item-
group probability score = 72) and Patterning and Algebra (item-group probability score = 67) with
the latter being the weakest in relation to their performances in the other strands
Results further indicated that those learners most likely to belong to Class 2 performed
overall lower than Class 1 but higher than Class 3 in all item-groups Therefore this class to
which 452 of the learners belonged can be best described as the intermediate performing and
largest group overall Those most likely to belong to this class can be described as having a strong
ability to apply mathematical knowledge in order to solve problems in various strands This was
determined by the average 74 overall probability for success achieved for those items related to
Factor 1 They can also be described as having a weak ability to apply thinking skills in order to
solve problems surrounding the Measurement topic of ldquoAreardquo and moderately weak ability to do
the same in various strands This was determined by the 39 probability for success achieved for
34
those items related to Factor 2 and 51 probability for success achieved for those related to Factor
3 Furthermore their overall performances in the knowledge dimension can be described as
stronger in comparison to their performances in the thinking dimensions
Specifically concerning their ability to apply mathematical knowledge in various strands
(Factor 1) performances for these learners can be described as considerably stronger in Patterning
and Algebra (item-group probability score = 86) and considerably weaker in Data Management
and Probability (item-group probability score = 49) in relation to their performances in the other
strands Specifically regarding their ability to apply thinking skills in order to solve problems
(Factor 3) performances can be described as stronger in Number Sense and Numeration (item-
group probability score = 60) and considerably weaker in Data Management and Probability (item-
group probability score = 40) and Patterning and Algebra (item-group probability score = 43) with
the former being the weakest in relation to their performances in the other strands
Lastly results indicated that those learners most likely to belong to Class 3 performed lower
than Class 1 and 2 in all item-groups Therefore this class to which 227 of learners belonged
can be best described as the lowest performing group overall Those most likely to belong to this
class can be described as having a moderately weak ability to apply mathematical knowledge in
order to solve problems in various strands This was determined by the average 44 overall
probability for success achieved for those items related to Factor 1 They can also be described as
having a weak ability to apply thinking skills in order to solve problems surrounding the
Measurement topic of ldquoAreardquo and weak ability to do the same in various strands This was
determined by the 28 probability for success achieved for those items related to Factor 2 and
29 probability for success achieved for those related to Factor 3 Furthermore their overall
performances in the knowledge dimension can be described as stronger in comparison to their
performances in the thinking dimensions
Specifically concerning their ability to apply mathematical knowledge in various strands
(Factor 1) it was determined that these learners can be described as performing slightly stronger in
35
Geometry and Spatial Sense (item-group probability score = 50) and considerably weaker in Data
Management and Probability (item-group probability score = 19) in relation to their performances
in the other strands Specifically regarding their ability to apply thinking skills in order to solve
problems (Factor 3) their performance can be described as considerably stronger in Number Sense
and Numeration (item-group probability score = 44) and weaker in Data Management and
Probability (item-group probability score = 22) and Patterning and Algebra (item-group
probability score = 20) with the latter being the weakest in relation to their performances in the
other strands
In sum the results of the LCA revealed that three classes could be used to best describe the
performances of Grade 6 learners in the three dimensions as established during the EFA and their
related strands Class 1 was described as the highest performing and second largest group The
learners in the class were described as performing especially strong in Factor 1 (namely their
ability to apply mathematical knowledge to solve problems in various strands) strong in Factor 2
(namely their ability to apply thinking skills to solve problems specifically related to the
Measurement topic of ldquoAreardquo) and in Factor 3 (namely their ability to apply thinking skills in order
to solve problems in various strands) Class 2 was described as the intermediate performing and
largest group and performing strong for Factor 1 weak for Factor 2 and moderately weak for
Factor 3 Lastly Class 3 was described as the lowest performing and smallest group and
performing moderately weak for Factor 1 and weak for both Factor 2 and 3 For all classes overall
factor performances were described as weaker in the thinking dimensions namely Factor 2 and 3
than in the knowledge dimension namely Factor 1 A greater discrepancy between these
mathematical knowledges and thinking skills dimensions appears to exist for those in Class 2 than
for those in Class 1 and 3
Lastly in terms of describing the performances of each class in the strands related to each
factor for Factor 1 and 3 results revealed clear similarities between all classes in terms of those in
which performances were described as weaker For all classes regarding Factor 1 their ability to
36
apply mathematical knowledge within the Data Management and Probability strand was described
as the weakest in relation to the other strands For all classes regarding Factor 3 their ability to
apply thinking skills in the Patterning and Algebra and Data Management and Probability strand
was described as weakest in relation to their performances in the other strands
43 Predicting Mathematics Profiles by Language and Length of Residence Background
To avoid treating learners as homogenous groups based on their language background they
were allocated to one of six groups according to their ESL designation and length of residency in
Canada The six groups represented the predictor variable (independent variable) whereas the three
classes or performance profiles were treated as the predicted or dependent variable Class 1
namely the highest performing profile group was used as the reference category
Results of this analysis indicated that the final model did not significantly predict class and
performance profile membership with a -2 Log likelihood of 7740 and a Chi-square value of 957
(10 N = 5000) p = 48 The upper portion of Table 10 presents the regression coefficients the
Wald test adjusted odds ratio [Exp(B)] and the 95 confidence intervals (CI) for odds ratios for
the predictor contrasting Class 2 to Class 1 The lower portion of the table presents the regression
coefficients the Wald test adjusted odds ratio [Exp(B)] and the 95 confidence intervals (CI) for
odds ratios for the predictor contrasting Class 3 to Class 1
Results therefore revealed that ESL status and residence in Canada did not significantly
predict class or profile membership regardless of group allocation In other words regardless of
group allocation learners were found to be equally likely to belong to either Class 1 (highest
performing group) Class 2 (intermediate performing group) or Class 3 (lowest performing group)
and therefore perform according to the related profile as indicated earlier in Figure 2
37
Table 10
Parameter Estimates for Six Groups on 3 Classes
Model B SE - B Wald df Exp(B) 95 CI EXP (B)
Class 2
Intercept 43 23 351 1
Group 1 -07 23 09 1 93 60 ndash 147
Group 2 06 26 06 1 107 64 ndash 178
Group 3 -60 35 296 1 55 277 ndash 109
Group 4 01 31 00 1 101 55 ndash 183
Group 5 -08 28 09 1 92 54 ndash 158
Class 3
Intercept -13 26 27 1
Group 1 -23 26 74 1 80 48 ndash 133
Group 2 -20 31 42 1 82 47 ndash 149
Group 3 -36 39 84 1 70 33 ndash 150
Group 4 -35 37 92 1 70 34 ndash 144
Group 5 -53 33 255 1 59 31 ndash 113
Notes p lt 001 N = 5000 Class 1 is the reference category Group 1 = Non-ESL CA Born (n = 4185) Group 2 =
ESL CA Born (n = 308) Group 3 = Non-ESL Non-CA born but living in country less than 5 years (n = 76) Group 4
= ESL Non-CA born but living in country less than 5 years (n = 123) Group 5 = Non-ESL Non-CA born but living in
country 5 years or more (n = 199) Group 6 = ESL Non-CA born but living in country 5 years or more (n = 109)
38
Chapter 5 Discussion
The purpose of this study was to move beyond the total scores of a largescale assessment
in order to gain better insight into the mathematical performances of Ontariorsquos Grade 6 learners
In doing so it aimed to provide evidence of learner strengths and weaknesses in different aspects
of mathematics education on which to base remedial decisions for the improvement thereof
Using the responses of a random sample of 5000 Grade 6 learners to 28 multiple choice
mathematics items on the 20132014 EQAO Junior Division assessment an Exploratory Factor
Analysis (EFA) was firstly performed in order to investigate the dimensionality characteristics
of the assessment This was followed by a Latent Class Analysis (LCA) to determine learner
strengths and weaknesses related to the established mathematical dimensions and their related
strands Lastly a multinomial logistic regression analysis was performed in order to examine the
extent to which mathematics performance profiles were predicted by student background factors
such as language and length of residency in Canada This chapter discusses the findings of these
analyses study limitations and lastly recommendations for future research and education
51 What Characterizes the Dimensionality of the EQAO Mathematics Achievement Test Administered to Grade 6 Students in Ontario Public Schools
The multiple choice mathematics items on the EQAO assessment were characterized as
measuring the ability of learners in three interrelated yet separate mathematical dimensions
These being the ability of learners to apply mathematical knowledge related to procedural
knowledge and conceptual understanding to solve problems in various strands (Factor 1) the
ability to apply process or thinking skills such as problem solving or reasoning skills to solve
problems in ldquoAreardquo (Factor 2) and lastly the ability to apply process or thinking skills to solve
39
problems in various mathematical strands The three factors produced achieved on average
moderate reliability scores
These findings regarding the characteristics of the dimensions were considered valuable
as they allowed for the comparison of learner abilities in two essential elements of mathematical
proficiency as aligned with the Principles and Standards for School Mathematics (NCTM
2000) and as a result also with the Ontario mathematics curriculum which shares the same
foundations Only once this happens namely learner ability measured directly in relation with
mathematical curriculum expectations can we begin an effective process of remediation
(Kilpatrick et al 2001) These elements were that of mathematical knowledge consisting of
procedural and conceptual knowledge as measured by Factor 1 of this study and process or
thinking skills such as problem solving and reasoning as measured by Factor 2 and 3 Factor 2
and 3 were determined to differ based solely on the content of the items included in the
assessment This finding highlights concerns regarding the fair representation of all curriculum
expectations on the assessment and thus warrants further investigation
The fact that the ability to apply mathematical knowledge and the ability to apply
thinking skills in order to solve mathematical problems were found to be sufficiently unique
dimensions to warrant their use using the multiple choice items on this largescale mathematics
assessment adds further value to the findings of this study These findings are valuable in that
they attest to the future potential for assessment organizations to report learner performances
beyond that of total scores as demanded by those in the educational field However since the
factors achieved only moderate reliability scores we are reminded of the need for these tests to
be designed upon foundations aligned with those of the curriculum expectations they are
employed to assess from the start in order for them to meet better test properties (Chudowsky amp
Pellegrino 2003 Rogers 2014)
40
52 In which Mathematical Dimensions and Related Strands do Students Demonstrate Strengths and Weaknesses in their Mathematical Achievement
Three classes were determined to best describe the performances of all Grade 6 learners
in the established dimensions and their related strands Class 1 was described as the highest
performing and second largest group consisting of 321 of the learners Class 2 was described
as the intermediate performing and largest group consisting of 452 of the learners and lastly
Class 3 was described as the lowest performing and smallest group consisting of only 227 of
the learners from the sample
The results of this analysis further revealed that all three classes performed weaker in
their ability to apply thinking skills in order to solve problems either specifically surrounding
the topic of Area or in various strands than in their ability to apply mathematical knowledge in
order to do the same The performances of those in Class 1 were described as especially strong
in the mathematical knowledge dimension (Factor 1) and strong in the thinking dimensions
(Factor 2 and 3) Class 2 was described as strong in the mathematical knowledge dimension but
weak in the thinking skills dimensions and lastly Class 3 was described as moderately weak in
the mathematical knowledge and thinking skills dimensions The discrepancy between
performances in the two subdomains namely mathematical knowledge and thinking skills thus
appeared to be largest for those in Class 2 the intermediate performing and largest group
The findings concerning the overall performances of students in the two subdomains of
mathematical knowledge and thinking skills aligns with those concerning the performances of
US students as described by Kilpatrick et al (2001) They highlight that research evidence over
the past 30 years has consistently indicated that although US students do not fare badly in
applying their knowledge to solve basic mathematical problems they tend to have a limited
41
understanding of mathematical concepts and are noticeably deficient in their ability to apply
mathematical thinking skills to solve even simple problems
It may however be argued that this finding namely a weaker performance in thinking
skills than mathematical knowledge is to be expected given the fact that applying thinking skills
in order to solve problems is a more challenging task than simply applying what you know
(Schoenfeld 2007) However studies have also found that a strong mathematical knowledge
base leads to a better ability to apply thinking skills to solve deeper problems (Stokke 2015)
Thus given the inter-relatedness of these two dimensions together with the large discrepancy
between them for those in Class 2 (strong mathematical knowledge but weak thinking skills)
these findings demonstrate a weakness in the majority of Ontariorsquos Grade 6 learners to apply
thinking skills to solve deeper mathematical problems This finding holds important
recommendations for future research and mathematics educational practices as will be discussed
in the section below
Upon further investigation of learner performances in each of the strands as they relate to
the dimensions it was determined that all three classes performed much weaker in their ability to
apply mathematical knowledge in the Data Management and Probability strand than in the other
strands This strand was also determined to be the weakest in the thinking skills dimension
along with Patterning and Algebra This finding contradicts those of Tatsuoka Corter and
Tatsuoka (2004) in which it was found that students in the US appeared to perform poorest in
Geometry and Spatial Sense Given the inter-relatedness of mathematical knowledge and ability
to apply thinking skills as previously highlighted by Stokke (2015) this finding concerning Data
Management and Probability attests to a knowledge base weakness for Grade 6 Ontario learners
specifically surrounding this strand As for the results surrounding Patterning and Algebra they
appear to provide further support for the weak ability of the learners to apply thinking skills
42
given their relatively strong mathematical knowledge surrounding this strand These findings
also hold valuable recommendations for educational practices in Ontario which will be further
discussed below
53 To What Extent Are Mathematics Performance Profiles Predicted by Student Background such as Language and Residence Status
Findings from this analysis revealed that language background and length of residence in
Canada did not significantly predict performance profile membership Therefore regardless of
group allocation based on these variables all learners were equally likely to achieve a Class 1
(high performing) Class 2 (intermediate performing) or Class 3 (low performing) profile as
described in this study
These findings contradict the Jang et al (2013) study on the performance of learners in
reading In that study it was found that different reading patterns were achieved based on ELL
and length of residence status It was further determined that non-English speakers outperformed
monolinguals in reading achievement after living in the country for five years or more These
findings therefore do not appear to hold true for the performances of learners in mathematics
based on these variables as all learner groups were equally likely to achieve one of the three
performance profiles produced in this study However it needs to be acknowledged that this
study focused on ESL designation as opposed to ELL status which may have contributed to the
differences in findings Nonetheless these findings are considered valuable in that they provide
reassurance of the fact that the test results were not confounded by differences in language
proficiency and that the EQAO test was not biased towards first language speakers
The findings of this study further contradict those that found that English first language
speakers outperformed those for whom English was not their first language (Abedi amp Lord
43
2001 Howie 2003) Therefore they help shed perceptions of differences in mathematical
performances based solely on the aspect of language background This finding holds important
implications for mathematics education for these population groups as well as future research
54 Study Limitations
The following study limitations have been recognized and should thus be taken into
consideration when reviewing these findings Firstly this study analyzed the mathematical
performances of learners based on the results of a standardized test only We are therefore
reminded of the fact that many factors influence test scores over and above that which is random
These include the testing situation tester characteristics and test-taker characteristics (Kaplan amp
Saccuzzo 2009) For this reason it is important that learner performances in other assessment
environments also be considered such as classroom-based assessment activities
Secondly the findings of this study were based solely on learner performances on the
multiple choice items According to Schoenfeld (1992) most multiple choice items are machine
graded which limits their ability to measure learner conceptual understanding and problem
solving abilities to the degree that most people would like For this reason it is important that
future studies consider including the open response questions included on the assessment for a
better reflection of learner conceptual understanding and problem solving
Thirdly this study included performances of learners based solely on a single EQAO
administration and its data Although EQAO proclaims to instill rigorous test equating
procedures to ensure that test difficulty and discrimination properties are not compromised
across years (Rogers 2013) this does not guarantee that learner performances can be generalized
to all Grade 6 learners Furthermore this study focused on only those who took the English
44
version of the test therefore generalizing these findings to those who took the French version
should be done cautiously
Lastly the small ESL population size in comparison to the non-ESL population limits the
findings of this group and may therefore not accurately reflect their performances Furthermore
this study used ESL designation as opposed to ELL status ESL designation is a program in
which learners are enrolled or unenrolled throughout the year Therefore these findings may not
reflect that of the entire ELL population
55 Recommendations and Future Research
In light of recent poor mathematical performances of Ontariorsquos elementary learners the
education minister announced its ldquoRenewed Math Strategyrdquo designed for the purposes of
combatting further decline (Brown 2016) In this strategy requirements for improving the
performances of learners in mathematics were announced such as all learners in Grade 1-8 to
receive at least 60 minutes of mathematics instruction per day further support for weaker
schools in terms of more professional development for teachers as well as more support for
learners and parents surrounding this discipline As this study made apparent in the beginning
such strategies risk being only blanketed approaches that do not really target the heart of the
problem if not accompanied by further insight into the results upon which they are based
This study was conducted in an attempt to gain such insight and found that although
Ontario Grade 6 learners display strong mathematical knowledge the majority are particularly
weak in applying thinking skills such as reasoning and problem solving to solve deeper
mathematical problems It was further determined that learners are particularly weakest in the
Data Management and Probability strand for both mathematical knowledge and thinking skills
dimensions as well as the Patterning and Algebra strand in the latter dimension It was lastly
45
determined that background variables of language and length of residence did not significantly
predict performance and profile achievement and that both ESL and non-ESL learners were
equally likely to belong to high intermediate and low performing groups regardless of length of
residence in Canada Based on these findings the following recommendations surrounding
future research endeavors and educational practices specifically in conjunction with mathematics
education in Ontario will be discussed below
The Ontario Curriculum Grades 1-8 Mathematics 2005 document indicates that the
ultimate goal for mathematics education is to develop learner proficiency beyond that of content
knowledge and therefore also calls for the development of a deeper understanding of the
discipline along with essential thinking skills In order to accomplish these goals the
curriculum highlights that instructional practices need to deviate from a sole focus on direct
teaching methods to incorporate methods of teaching and learning through problem solving in
other words problem-based learning approaches Stokke (2015) blames this greater emphasis of
teaching mathematics using problem-based teaching strategies for the recent decline of Ontario
learnersrsquo mathematical performances She argues that the lack of direct instruction has robbed
learners of a sound knowledge base from which to draw upon when attempting to solve deeper
mathematical problems hence the weakness in this area
However the findings from this study provides evidence that contradicts this argument
as results point to the fact that the majority of Grade 6 learners in Ontario actually do possess
strong mathematical knowledge This finding may therefore perhaps be an indication of the
fact that a large portion of Ontario teachers still rely predominantly on teaching mathematics
using traditional direct teaching methods as opposed to those better suited to meet current
curriculum goals and expectations This finding therefore warrants further investigation into
current teaching trends and holds valuable insight as to where to direct efforts for remediation
46
In order to meet reformed curriculum goals and expectations teaching practices need to
change for which the teacher is the key actor (Ross amp McDougall 2006) Therefore this study
supports those calling for increased efforts directed at teachers and the need to reshape their roles
and perceptions of what it means to ldquoteachrdquo mathematics in a reformed curriculum classroom
For instance Milgram (2007) urges for strategies directed at ensuring that teachers truly
understand what it means to teach using problem-based teaching methods to develop thinking
skills He further illustrates that teaching thinking skills such as problem solving is a
challenging task as it is in itself complex involving both verbal and nonverbal mental processes
For this reason it is essential that learners solve problems for which the answer is not apparent
and requires a novel idea if we wish to effectively develop these skills (Milgram 2007) Such a
teaching and learning process requires that teachers step back allowing learners to grapple with
the task before them as well as interact with each other stepping in only when necessary to
guide the process (Milgram 2007)
Changing the role of the teacher from the traditional sole knowledge bearer and
transferor to one in which heshe shares the responsibility of learning with students is however
only one of 10 dimensions that requires attention when urging teachers to adopt instructional
practices better suited to accomplish curriculum goals and expectations (Ross amp McDougall
2007) Ross and McDougall (2006) further illustrate that in order to ensure that teaching for
deeper understanding as aligned with current reformed mathematics education takes place
teachers need to consider change in all 10 of these dimensions These dimensions as cited in
Ross and McDougall (2006) are summarized as follows 1) the need for program scope 2)
access to all forms of mathematics by students 3) raising self-confidence of students by teachers
4) complex and open-ended student tasks 5) instruction that focuses on constructing
mathematical ideas through self-discovery 6) change in the role of teachers to that of co-learner
47
and co-knowledge creator 7) solving of mathematical problems with the aid of manipulatives 8)
classroom organization in a manner that promotes sharing and interaction for solutions 9)
authentic assessment and lastly 10) a conception of mathematics as a dynamic subject by
teachers
Specifically regarding the first dimension namely the need for program scope Ross and
McDougall (2006) describe it as urging teachers to teach multiple mathematical strands with
increased attention on those less commonly taught such as the Data Management and
Probability and Patterning and Algebra strands The results of this analysis indicated that
learners were weakest in precisely these two strands therefore perhaps providing evidence in
support of the fact that these strands are given less attention by Ontario teachers when teaching
the mathematics curriculum expectations This finding therefore provides added support for the
need to further promote the implementation of these 10 dimensions of teaching for deeper
understanding as indicated above so as to ensure that teachers view all curriculum strands as
equally important and deserving of attention
In calling for these increased efforts directed at changing the way in which mathematics
teaching and learning occurs in classrooms it is important to acknowledge the fact that this is
easier said than done Teaching in a manner that supports the development of a deeper
understanding for mathematics and promotes thinking skills is a lengthy process that takes time
(Milgram 2007) A commodity in short supply for the teacher already feeling pressured to
cover all curriculum expectations before mandatory accountability assessments take place
(Milgram 2007) Therefore not only does this study call for increased efforts directed at
changing teacher perceptions and instructional practices in the classroom but also for policy
makers to consider practical constraints placed on teachers that may restrict the implementation
thereof
48
Lastly the need to predict mathematical performances of learners based on background
variables is made apparent by Hinton (2014) who found that early success in mathematics
predicts future success Therefore for the sake of early intervention especially for the lowest
performing group identified in this study it is urged that further research studies be directed at
determining background variables that better predict performances However it is further urged
that such studies focus on class or profile membership as used in this study as opposed to overall
mathematics performances used in the past In this way not only will we be able to better
identify low intermediate and high performers but also their related strengths and weaknesses
upon which specific remedial efforts can be targeted As for the equal likelihood of ESL and
non-ESL learners to achieve either low intermediate or high performing profiles this study
recommends future studies targeted at shedding perceptions of non-English speakers
underperforming in relation to first language speakers that have perhaps been shaped by previous
studies Without doing so we risk assuming the need for remediation directed at one group
whilst ignoring the needs of others
49
References
Abedi J amp Lord C (2001) The language factor in mathematics tests Applied Measurement
in Education 14(3) doi 101207S15324818AME1403_2
Brown J (2016) Elementary student to get hour of math every day under new Ontario plan
Retrieved July 23 2016 from
httpswwwthestarcomyourtorontoeducation20160404elementary-students-to-get-
hour-of-math-every-day-under-new-ontario-planhtml
Chudowsky N amp Pellegrino JW (2003) Large-scale assessments that support learning what
will it take Theory into Practice 42(1) 75+ Retrieved from
httpgogalegroupcommyaccesslibraryutorontocapsidop=AONEampu=utoronto_mai
nampid=GALE|A99909373ampv=21ampit=rampsid=summonampuserGroup=utoronto_mainampauth
Count=1
Collins L K amp Lanza S T (2010) Latent class and latent transitional analysis with
applications in the social behavioral and health sciences Hoboken NJ Wiley amp Sons
DePascale C (2014) The ideal role of large-scale testing in a comprehensive assessment
system Journal of Applied Testing Technology 5(1) 1-11 Retrieved from
httpwwwjattjournalcomindexphpatparticleview48343
Education Quality and Accountability Office (2016) About the agency Retrieved May 26
2016 from EQAO
httpwwweqaocomenabout_eqaoabout_the_agencyPagesabout-the-agencyaspx
Education Quality and Accountability Office (2014) EQAOrsquos provincial elementary school
report 2014 Retrieved September 26 2015 from EQAO
httpwwweqaocomenassessmentsresultsPagesprovincial-report-elementary-
2014aspx
Figlio D amp Loeb S (2011) School accountability In EA Hanushek S Machin and L
Woessmann (Eds) Handbooks in Economic The Netherlands North-Holland pp 383-
421
Foster D Noyce P amp Spiegel S (2007) When assessment guides instruction Silicon
Valleyrsquos mathematics assessment collaboration In AH Schoenfeld (Ed) Assessing
mathematical proficiency (pp 137-154) Cambridge Cambridge University Press
Friesen S (2005) Math Teaching it better Education Canada 46(1) 6-10
Furr R M (2011) Scale construction and psychometrics for social and personality psychology
Los Angeles SAGE
Fillmore L W (2007) English learners and mathematics learning language issues to consider
In AH Schoenfeld (Eds) Assessing mathematical proficiency (pp 333-344) Cambridge
Cambridge University Press
50
Haertel E H amp Herman J l (2005) A historical perspective on validity arguments for
accountability testing Yearbook of the National Society for the Study of
Education 104(2) 1-34 doi101111j1744-7984200500023x
Hinton A (2014) Tracking student achievement in mathematics over time in English language
schools Retrieved from
httpwwweqaocomenresearch_dataResearch_ReportsPagesstudent-
achievementaspx
Howie S (2005) System-level evaluation Language and other background factors affecting
mathematics achievement Prospects 35(2) 175-186 doi101007s11125-005-1820-
8
Huff K amp Goodman DP (2007) The demand for cognitive diagnostic assessment In JP
Leighton amp MJ Gierl (Eds) Cognitive Diagnostic Assessment for Education (19-60)
New York Cambridge University Press
IBM Corp Released 2013 IBM SPSS Statistics for Windows Version 230 Armonk NY IBM
Corp
Jang E E amp Ryan K (2003) Bridging gaps among curriculum teaching and learning and
assessment Book review Kifer E (2001) Large-scale assessment Dimensions
dilemmas and policy Journal of Curriculum Studies 35(4) 499-512
Jang EE Dunlop M Wagner M Kim Y amp Gu Z (2013) Elementary school ELLsrsquo
reading skill profiles using cognitive diagnosis modelling Roles of length of residence
and home language environment Language Learning 63(3) 400-436 doi
101111lang12016
Kaplan RM amp Saccuzzo DP (2009) Psychological Testing Principles Applications and
Issues Belmont Wadsworth Cengage Learning
Kilpatrick J Swafford J Findell B amp National Research Council (US) (2001) Adding it
up Helping children learn mathematics Washington DC National Academy Press
Klinger D A amp Rogers W T (2011) Teachers perceptions of large-scale assessment
programs within low-stakes accountability frameworks International Journal of
Testing 11(2) 122-143 doi101080153050582011552748
La Rose L (2014) PISA results Canada students high level achievers but math and science
scores dip The Huffington Post Retrieved October 5 2015 from
httpwwwhuffingtonpostca20131203pisa-results-canada-
studentrankings_n_4376190html
Meyers L S Gamst G amp Guarino A J (2006) Applied multivariate research Design and
interpretation Los Angeles Sage
Milgram R J (2007) What is mathematical proficiency In AH Schoenfeld (Eds) Assessing
mathematical proficiency (pp 31-58) Cambridge Cambridge University Press
51
Moschkovich J (2007) Beyond words to mathematical content Assessing English learners in
the mathematical classrooms In AH Schoenfeld (Eds) Assessing mathematical
proficiency (345-352) Cambridge Cambridge University Press
Mutheacuten LK amp Mutheacuten BO (1998-2010) Mplus Userrsquos Guide (6th Ed)
Los Angeles CA Mutheacuten amp Mutheacuten
Nagy P (2000) The three roles of assessment Gatekeeping accountability and instructional
diagnosis Canadian Journal of Education 25(2) Retrieved from
httpmyaccesslibraryutorontocaloginurl=httpsearchproquestcomdocview215374
855accountid=14771
National Council of Teachers of Mathematics (2000) Principles and standards for school
mathematics Reston VA National Council of Teachers of Mathematics
Nichols P D (1994) A framework for developing cognitively diagnostic assessments Review
of Educational Research 64(4) 575 Retrieved from
httpmyaccesslibraryutorontocaloginurl=httpsearchproquestcomdocview214116
755accountid=14771
Nylund K L Asparouhov T amp Mutheacuten B O (2007) Deciding on the number of classes in
latent class analysis and growth mixture modeling A monte carlo simulation
study Structural Equation Modeling A Multidisciplinary Journal 14(4) 535-569
doi10108010705510701575396
OECD (2014) PISA 2012 Results What Students Know and Can Do Student Performance in
Mathematics Reading and Science doi httpdxdoiorg1017879789264208780-en
Ontario (2005) The Ontario curriculum grades 1-8 Toronto Ontario Ministry of Education
Pastor D A Barron K E Miller B J amp Davis S L (2007) A latent profile analysis of
college students achievement goal orientation Contemporary Educational
Psychology 32(1) 8-47 doi101016jcedpsych200610003
Rogers WT (2013) What is the quality of EQAO assessments Excellent Retrieved
September 24 2015 from
httpwwweqaocomenresearch_dataResearch_ReportsPagesbest-assessment-
practicesaspx
Rogers WT (2014) Improving the utility of large-scale assessments in Canada Canadian
Journal of Education 37(3) Retrieved from httpcje-rcecaindexphpcje-
rcearticleview1732
Ross JA amp McDougall D E (2006) Mathematics In K Leithwood P McAdrie N Bascia
amp A Rodrigue A (Eds) Teaching for deep understanding Towards the Ontario
curriculum that we need (pp 33-39) Thousand Oaks CA Corwin Publishing
Schoenfeld A H (2007) Issues and tensions in the assessment of mathematical proficiency In
52
AH Schoenfeld (Ed) Assessing mathematical proficiency (pp3-15) Cambridge
Cambridge University Press
Schoenfeld A H (2007) What is mathematical proficiency and how can it be assessed In
AH Schoenfeld (Ed) Assessing mathematical proficiency (pp 59-73) Cambridge
Cambridge University Press
Schoenfeld A H (1992) Learning to think mathematically Problem solving metacognition
and sense making in mathematics In D Gouws (Ed) Handbook for research on
mathematics teaching and learning (pp 334-370) New York Macmillan
Schumacker R E amp Lomax R G (2004) A beginnerrsquos guide to structural equation modeling
(2nd ed) Mahwah NJ Lawrence Erlbaum Associates
Shapka J Domene J amp Keating D (2006) Trajectories of career aspirations through
adolescence and young adulthood Early math achievement as a critical filter
Educational Research and Evaluation 12(4) 347-358 Retrieved from
httpdxdoiorg10108013803610600765752
Statistics Canada (2016) Immigration and Ethnocultural Diversity in Canada Retrieved May
31 2016 from httpswww12statcangccanhs-enm2011as-sa99-010-x99-010-
x2011001-engcfm
Stein MK Remillard J amp Smith MS (2007) How curriculum influences student learning
In FK Lester amp National Council of Teachers of Mathematics (Eds) Second handbook
of research on mathematics teaching and learning a project of the National Council of
Teachers of Mathematics (pp 1099) Charlotte NC Information Age Pub
Stokke A (2015) What to do about Canadarsquos declining math scores Retrieved from
httpswwwcdhoweorgpdfcommentary_427pdf
Tatsuoka K Corter J amp Tatsuoka C (2004) Patterns of Diagnosed Mathematical Content
and Process Skills in TIMSS-R across a Sample of 20 Countries American Educational
Research Journal41(4) 901-926 Retrieved from
httpwwwjstororgmyaccesslibraryutorontocastable3699467
Uebersax JS (2015) Introduction to the Tetrachoric and Polychoric Correlation Coefficients
Retrieved July 20 2015 from httpjohn-uebersaxcomstattetrahtm
Wilson L D (2007) High-stakes testing In FK Lester and National Council of Teachers of
Mathematics (Eds) Second handbook of research on mathematics teaching and learning
a project of the National Council of Teachers of Mathematics (pp 1053 -1098)
Charlotte NC Information Age Pub

4
i What characterizes the dimensionality of the EQAO mathematics achievement
test administered to Grade 6 students in Ontario public schools
ii In which mathematical dimensions and related strands do students demonstrate
strengths and weaknesses in their mathematical achievement
iii To what extent are mathematics performance profiles predicted by student
background such as language and length of residence status
5
Chapter 2 Literature Review
This chapter discusses largescale assessments in education as well as their scoring and
reporting practices This is followed by an overview of mathematics education and its associated
curriculum as well as the factors predicting the performances of learners therein
21 Largescale Assessments in Education
Much of the origin and development of largescale testing in education can be traced back
to 1845 in the United States where they were first implemented in Boston schools and
championed for their use as a superior way to examine pupils (Wilson 2007) Today the
concept of educational testing has expanded into a multi-million-dollar business (Wilson 2007)
with largescale assessments serving as the measurement tool of choice on which to gauge the
system of education (Rogers 2014)
Largescale assessments can be characterized by the way in which they are administered
to large groups of learners simultaneously and in a highly standardized manner (Wilson 2007)
The foundations of these assessments rest on the same ideas as criterion referenced tests and are
classified as standards-based rather than norm-referenced tests (Kaplan amp Saccuzzo 2007) In
other words these largescale standards-based assessments compare the performances of
individuals against specific types of skills tasks or knowledge such as curricular standards or
expectations whereas norm- referenced tests compare each person with a norm and therefore
forces competition among people (Kaplan amp Saccuzzo 2007)
Largescale assessments in education were originally used to sort and classify learners
today they still serve this gatekeeping purpose but are also employed to serve two other
functions to which the majority of attention has shifted namely holding those responsible for the
6
education of learners accountable (accountability) and for the improvement of education
(Chudowsky amp Pellegrino 2003 Nagy 2000) School accountability involves the process of
evaluating school performance on the basis of student performance measures (Figlio amp Loeb
2011) and forms part of the system used by officials in education to monitor the effective
functioning of schools
It can also be characterized as either a high- or low-stakes system which further
differentiates the use of the results For instance according to Rogers (2014) accountability in
Canada is considered to be a low-stakes system and therefore the emphasis is predominantly on
using the results for educational improvement In contrast the United States is considered to be
a high-stakes system as results are used chiefly to sanction and reward schools
Although the use of largescale assessments in education have been credited for providing
an objective ldquoyardstickrdquo on which to measure learnersrsquo performances (Rogers 2014) and for
their ability to simplistically rank individuals along a highly reliable scale (Huff amp Goodman
2010) they have endured much criticism from those within the field Not only has much of this
been centered around their many unintentional consequences such as promotion of teaching to
the test test preparation activities at the expense of instructional time dishonesty among
educators and student drop out (Rogers 2014 Schoenfeld 2007) but also their scoring and
reporting practices and procedures These criticisms have led to much doubt concerning their
effectiveness as a tool to serve the purposes for which they are employed
211 Scoring and Reporting Practices of Largescale Assessments
It is common practice for largescale assessments to be scored using Item Response Theory
or Classical Test Theory in order to generate a total score and to use only these to report the
overall performances of learners on the assessment (Nichols 1994) Although this scoring and
7
reporting procedure is credited for being relatively quick and cost effective (Chudowsky amp
Pellegrino 2003) they serve merely to highlight that there is a problem but provide little
direction as to what the problem is (Nichols 1994) Foster Noyceand Speigel (2007) sum up
the criticism against total scores by stating that although they may reassure a schoolrsquos staff about
student progress or alert them to trouble ahead they do little to inform teachers about how
students are thinking what they understand where they are falling down and how specifically
teachers might change their own instructional practices to address studentsrsquo difficulties
The over simplistic representation of learner performances by total scores therefore lacks
the necessary insight on which to base remedial decisions (Nichols 1994) For this reason the
effectiveness of largescale assessments as a tool for improving education has been questioned
(Rogers 2014) For instance it is expected that educators and principles use results of largescale
assessments to improve their instructional practices (Rogers 2014) however in a study
conducted by Klinger and Rogers (2013) it was discovered that they in fact found little
direction from these results to do so This has led to an increased demand from those within the
field for these assessments to report more than only overall performances in the form of total
scores (Huff amp Goodman 2010 Nichols 1994 Rogers 2014) Detailed information from
assessments can help those in education including teachers and students identify content and
curricular areas that need attention (Schoenfeld 2007) and in so doing aide in the improvement
of education in disciplines where it is needed the most
212 Test Development Procedures
Largescale assessment organisations commonly adopt traditional unidimensional
frameworks to form the basis of test development procedures A unidimensional framework is
one that assumes a single factor or latent variable as an explanation for a certain behaviour such
8
as academic ability (Kaplan amp Saccuzzo 2007) However many curricular in practice today
have been developed on a multidimensional framework such as that of mathematics where
academic ability is assumed to consist of more than one skill or factor
Furthermore test development practices are performed taking into consideration certain
test constraints for instance test format which is usually paper-and-pencil based as well as
administration time For this reason it is impossible to include items to measure all curriculum
expectations in one test (Haertel amp Herman 2005) This sampling process of curriculum
expectations therefore also means that only few items for each expectation are included in the
assessment (Rogers 2014)
In addition to these test development procedures raising construct validity concerns
(Wilson 2007) they limit the reporting of test scores beyond anything more than overall total
scores As highlighted by Rogers (2014) since the assessment was never designed from an
explicit framework in line with that of curriculum expectations from the start as well as include
only a few items targeted at each subdomain it is highly unlikely that the assessment meets the
rigorous test properties needed to allow for reporting anything beyond that of total scores
In order to satisfy the many calls for change to reporting practices assessment
organisations would need to deviate from these traditional more cost effective practices For this
reason Chudowsky and Pellegrino (2003) indicate that change is unlikely to happen soon As a
result our efforts to improve education in disciplines where it is needed the most will continue
to take place within the confinements of that which assessment organisations refuse to change
22 Mathematics Education and Curriculum
The mathematical reform movement generated in the late 1950rsquos signaled the need for the
implementation of better teaching and learning practices for mathematics in schools (Friesen
9
2005) Today many mathematics curricular worldwide including that of Canada are based on
the Principles and Standards for School Mathematics as set out by the National Council of
Teachers of Mathematics (NCTM) (Friesen 2005) Very broadly curriculum refers to the
substance or content of teaching and learning it focusses on the ldquowhatrdquo of teaching and learning
as opposed to the ldquohowrdquo (Stein Remillard amp Smith 2007)
This NCTM document calls for the teaching and learning of mathematics with the goal of
developing both content or procedural knowledge and conceptual understanding of the
discipline through the application of essential thinking or processing skills such as problem
solving or reasoning skills which in turn will be developed (NCTM 2000) This goal for
mathematics education is in stark contrast to that of traditional goals where only the teaching and
learning of procedural or content knowledge was valued and taught through rote teaching and
learning practices (Schoenfeld 2007) Procedural knowledge refers to what and how to solve
certain mathematical problems whereas conceptual understanding refers to why a certain
problem is solved the way it is (Kilpatrick Swafford Findell amp NRC 2001)
Furthermore the NCTM adopted the view that standards play a leading role in guiding
the improvement of mathematics education (NCTM 2000) It therefore highlights specific
mathematical standards or expectations that learners should achieve Specifically five Content
Standards are used to guide the teaching and learning of procedural and conceptual knowledge
namely Number and Operations Algebra Geometry Measurement and Data Analysis and
Probability Five Process Standards also guide the essential processes or thinking skills of
Problem Solving Reasoning and Proof Communication Connections and Representation
(NCTM 2000) The NCTM (2000) repeatedly proclaims the interconnectedness of these
standards by indicating that procedural knowledge should never exist without conceptual
10
understanding which in turn should not be developed without the application and acquisition of
the essential processing skills
The Content and Process Standards are further classified into groups or categories for
assessment purposes in mathematics curricular such as that of Ontario Specifically the Ontario
Curriculum Grades 1-8 Mathematics 2005 document describes four categories of Knowledge
and Understanding Thinking Communication and Application to which the standards are
allocated These four categories are known as the Knowledge and Skills categories and are
reflected in the documentrsquos Achievement Chart The first category of Knowledge and
Understanding can be described as encompassing mathematical knowledge of content and
understanding and therefore focusses predominantly on the achievement of the Content
Standards The remaining three categories focus predominantly on the use of the Process
Standards The Thinking category assesses the use of problem solving reasoning and proving
processes the Communication category focusses on the assessment of the communicating
processes and lastly the Application category focusses on the assessment of the connecting
processes
From the above mathematics curriculum we can see that the knowledge base is still
considered important in mathematics education however so is conceptual understanding and the
application and acquisition of thinking skills As stated by Schoenfeld (2007) anyone who lacks
a solid grasp of facts procedures definitions and concepts is significantly handicapped in
mathematics yet there is more to being mathematically proficient than simply reproducing
standard content on demand Therefore if we are interested in understanding mathematical
proficiency as it is taught and learned today it is important that we reflect learner abilities in all
aspects of the discipline (Kilpatrick et al 2001) In so doing we will gain better insight into
11
their strengths and weaknesses allowing us to remediate accordingly in our efforts to improve
learner performances in this essential discipline
23 Factors Predicting Mathematical Performances
Given the relative importance of mathematics it is no surprise that much research has been
dedicated to highlighting and isolating the number or factors that can influence and predict
mathematical performances By doing so early interventions and remedial strategies can be
better targeted to improve future mathematical success (Hinton 2014)
One such factor that has been given much attention is that of language proficiency and its
influence on mathematical performances Studies conducted by Hinton (2014) Howie (2005)
and Abedi and Lord (2001) for instance discovered that learners who spoke English as a second
language performed worse in mathematical assessments compared to their English proficient
counterparts Fillmore (2007) however cautions against interpreting this as a lack of
mathematical ability without firstly taking into account the aspect of language Since much of
the mathematics taught today is presented in the form of a word problem it relies heavily on a
deep understanding of language (Moschovich 2007) Therefore trying to tease out precisely
how much of the struggle is related to a language issue and how much to an issue with
mathematics is a unique challenge for teachers assessment and English Language Learners
(ELLrsquos) (Fillmore 2007) As highlighted by Moschovich (2007) assessment is certainly a
complex task perhaps especially when working with students who are learning English It is
challenging to decide whether an utterance reflects a studentrsquos conceptual understanding a
studentrsquos proficiency in expressing their ideas in English or a combination of mathematical
understanding and English proficiency
12
Canada has a high and diverse immigrant population for instance 206 of its population
in 2011 was determined to be comprised of immigrants from various countries (Statistics
Canada 2016) Thus the mathematical performances of ELLrsquos cannot be ignored Fortunately
this aspect is currently given attention in the province of Ontario as assessment organizations
such as the EQAO do attempt to report separately on these learnersrsquo performances However
Jang Dunlop Wagner Kim and Gu (2013) warn against treating ELLrsquos as a homogenous group
Their study found that when taking into account the length of residence in Canada
performances of these students varied significantly concerning their reading proficiencies
Therefore if we wish to predict mathematical performances or gain better insight based on
student background such as language factors it is necessary to consider subpopulation groups
that make up the overall ELL population such as length of residence in the country
13
Chapter 3 Method
This chapter describes the participants instrument and data as well as the three main
analyses used to answer the questions presented in this study
31 Participants
The current study used data made available by the Education Quality and Accountability
Office (EQAO) of Ontario The EQAO is an arms-length Ontario government agency that is
responsible for developing and overseeing reading writing and mathematics assessments
administered to Grade 3 6 9 and 10 students in Ontario public schools The purpose of the
results of these largescale assessments is to determine the extent to which learners have achieved
the curriculum standards of the particular discipline for educational accountability and
improvement purposes (EQAO 2016)
Learnersrsquo responses are scored by the EQAO using Classical Test Theory and Item
Response Theory (Rogers 2013) to generate a score that is then converted into a Level NIE 1 2
3 or 4 Level 3 describes a performance at the provincial standard whereas Level 4 a
performance surpassing the standard Level 2 a performance approaching the standard and Level 1
a performance much below the standard Lastly a ldquoNIErdquo rating is generated for those learners
who have not provided sufficient evidence for a Level 1 score The EQAO test scores are reported
using these proficiency levels for each of the areas tested namely reading writing and
mathematics Background information such as gender time lived in Canada and student home
language etc is also collected by questionnaires administered by the EQAO over the same time
The full population data set comprised of approximately 127 302 Grade 6 learnersrsquo
responses to the English 20132014 provincial Junior Division assessment A random sample of
5000 learner responses to the assessment was drawn from the entire data set Learners with
missing data on any of the variables were excluded from the sampling process so that the final
14
data set contained responses to all mathematics items as well as background information All
learners within the sample were enrolled at the time in Grade 6 and attended various schools
across the province Table 1 below presents the distributions of student subgroups from the
random sample based on their gender language background and time spent in Canada in
comparison with the entire population The percentage of learners in each subgroup was very
closely aligned with the larger Grade 6 population and was therefore considered a representative
sample
Table 1
Final Random Sample used for the Analysis
Standard Gender Language Time lived in Canada
Met
Below
Female
Male
Non-
ESL
ESL
CA
Born
Non-CA
born lt 5
years
Non-CA
born ge 5
years
Frequency 2765 2235 2456 2544 4460 540 4493 199 308
Sample 553 447 491 519 892 108 899 4 62
Population 54 46 49 51 887 113 871 4 89
Notes N = 5000 Standard = met the provincial standard or achieved below the provincial standard ESL = enrolled in
English as a Second language program Time lived in Canada = Canadian born learners non-Canadian born learners
who have lived in Canada for less than 5 years and non-Canadian born learners who have lived in Canada for 5 years
or more
32 Instrument
Student responses to the mathematics test items and background information on the EQAO
20132014 Junior Division assessment were used for this study This assessment is a provincially
mandated largescale assessment used by the Ontario government to measure the extent to which
learners have achieved the standards as laid out in the curriculum All the EQAO largescale
assessments are designed using rigorous development procedures and meet high testing standards
with acceptably high reliabilities (Rogers 2013) of above 80 The Junior Division assessment is
15
specifically administered to all Grade 6 learners attending schools within the province of Ontario
during the months of May and June and under highly standardized conditions (EQAO 2016) The
assessment measures reading writing and mathematical skills in each of the corresponding
sections The mathematics section specifically consists of 36 items of which 28 are multiple choice
items and 8 are constructed-response format questions This study included only the 28 multiple
choice items
While the EQAO does not claim to measure the Knowledge and Skills categories as laid out
in the Ontario Curriculum Grades 1-8 Mathematics 2005 document (Rogers 2013) it still
references each of the mathematics items to one of three of the categories namely that of
Knowledge and Understanding Thinking and Application The category of Communication is not
represented by any of the items as according to Rogers (2013) this skill is not feasible to assess in
a paper-and-pencil based test For items to be referenced to the Knowledge and Understanding
category they need to be recognized as requiring students to demonstrate subject specific content
and comprehend its meaning Those referenced to the Application category need to be recognized
as requiring students to select an appropriate mathematical tool and apply the appropriate
information Lastly those referenced to the Thinking category need to be seen as requiring of
students to select and sequence a variety of tools and think critically in order to solve problems
(Rogers 2013) Items are scrutinized by teachers and other content experts for the process of
allocating items to the most appropriate category Items are further referenced to the five content
areas or strands of the curriculum document according to their content topic namely Number Sense
and Numeration Measurement Geometry and Spatial Sense Patterning and Algebra and Data
Management and Probability
Table 2 shows the representation of each of the Knowledge and Skills categories and the
strands to which the 28 multiple choice items were referenced by the EQAO as well as the item
difficulties (p-values) and discrimination indices (pt-biserial correlations) for each of these items
According to Kaplan and Saccuzzo (2007) item difficulty values should range from 30 to 70 to
16
maximize information about the differences among individuals Furthermore item discriminability
values should not be negative or below 20 to be considered adequate Based on these
recommendations all 28 items were considered suitable to be included in the analyses of this study
Table 2
Knowledge and Skills Categories Strands and Descriptive Statistics of 28 Mathematics Items
Item Know amp Skill Strand p-value pt-biserial
1 K and U Patterning amp Algebra 86 39
14 K and U Patterning amp Algebra 74 43
3 K and U Number Sense amp Numeration 76 37
15 K and U Number Sense amp Numeration 86 35
9 K and U Data Management amp Probability 48 33
19 K and U Measurement 50 27
25 K and U Measurement 76 40
22 K and U Geometry amp Spatial Sense 87 34
73 36
11 App Patterning amp Algebra 81 43
24 App Patterning amp Algebra 70 37
26 App Patterning amp Algebra 40 30
5 App Number Sense amp Numeration 56 38
7 App Number Sense amp Numeration 82 30
10 App Data Management amp Probability 55 47
18 App Data Management amp Probability 78 47
23 App Data Management amp Probability 71 42
2 App Measurement 59 31
8 App Measurement 58 28
20 App Measurement 54 47
6 App Geometry amp Spatial Sense 68 38
64 38
17 Think Patterning amp Algebra 52 36
21 Think Number Sense amp Numeration 57 22
28 Think Number Sense amp Numeration 69 33
4 Think Data Management amp Probability 46 35
13 Think Measurement 54 39
27 Think Measurement 41 46
12 Think Geometry amp Spatial Sense 42 35
16 Think Geometry amp Spatial Sense 54 34
52 35
Notes K and U = Knowledge amp Understanding App = Application Think = Thinking p-value and pt-biserial means
for each Knowledge amp Skill category represented in bold
17
No items had p-values below 30 however 10 items had difficulty values above 70
indicating that they were relatively easy for this sample Since none of the p-values were above
90 they were considered to still possess sufficient variability to be included in the analyses
Furthermore no items had values below the recommended 20 or negative pt-biserial values Table
2 further highlights the item difficulty and discrimination means for each of the three categories
From these values it can be concluded that the items referenced to the Knowledge and
Understanding category were relatively more easy for this sample while those items referenced to
the Thinking category more difficult and those referenced to the Application category moderately
difficult Lastly it is highlighted that a greater number of items represented the Application
category (12 items) than the Knowledge and Understanding and Thinking category which had an
equal number of eight items
33 Data Analysis
The data analyses involved three phases each of which addressed one of the three questions
asked in this study The first phase used Exploratory Factor Analysis (EFA) approaches to
examine the first research question ldquoWhat characterizes the dimensionality of the EQAO
mathematics achievement test administered to Grade 6 students in Ontario public schoolsrdquo
Latent Class Analysis (LCA) approaches were used in the second phase in order to answer question
two ldquoIn which mathematical dimensions and related strands do students demonstrate strengths and
weaknesses in their mathematical achievementrdquo A multinomial logistic regression analysis was
performed to examine research question three ldquoTo what extent are mathematics performance
profiles predicted by student background such as language and length of residence statusrdquo
331 Phase 1 Establishing the Dimensionality of the Assessment
An Exploratory Factor Analysis (EFA) was conducted in order to determine the
dimensionality of the EQAO Grade 6 mathematics test based on 5000 studentsrsquo responses to 28
multiple choice items Although exploratory in nature the EFA was used to examine the extent
18
to which the test dimensionality can be accounted for by knowledge and skills and further by the
strand specified by the EQAO
EFA is a statistical procedure that simplifies the process of visually inspecting a range of
correlations in order to examine the dimensionality of measures (Furr 2011) The 28 multiple
choice items were firstly recoded as binary data thus creating dichotomous categories (0 =
incorrect responses and 1 = correct responses) In order to perform an EFA with this type of
data a more sophisticated statistical software package is required The reason for this being that
standard software such as IBMrsquos SPSS (version 230) creates correlation matrices suitable only
for continuous data that assume a normal distribution (Uebersax 2015) Therefore MPLUS
version 612 (Mutheacuten amp Mutheacuten 1998-2012) was used for the analysis so that a tetrachoric
correlation matrix could be generated to suite the binary data used in this study
When conducting an EFA in Mplus a correlation matrix eigenvalues and model fitting
statistics such as the chi-square test Root Mean Square Error of Approximation (RMSEA) and
Root Mean Square Residual (RMSR) are produced in order to assist with the process of
determining the solution that best fits the data A good fitting model will be represented by a
non-significant chi-square p-value as well as a RMSEA value and RMSR value of below 05
(Schumacker amp Lomax 2004) However interpretability of the model should also be taken into
consideration when deciding on the best solution (Meyers Gamst amp Guarino 2013) The
weighted least-squares with mean (wlsm) estimation method as recommended by Mutheacuten and
Mutheacuten (1998-2012) for binary data and the oblique rotation method (Promax) was used for this
analysis based on the assumption that factors are likely to be correlated with each other
Four steps were implemented during this phase The first step entailed determining the
ideal number of factors to be extracted to best describe the data This entailed a combined
evaluation of the correlation matrix eigenvalues scree plot and fit statistics as described above
The next step entailed an evaluation of the items and their loadings on each of the factors to
determine if any should be discarded in terms of low factor loadings or cross-loadings If any
19
items were deemed unacceptable these were removed and the analysis re-run and subsequently
re-evaluated This step was repeated until a final and appropriate factor solution model was
obtained Following this the reliability for each factor was established followed by an
investigation of the factor correlations in order to determine the uniqueness of each extracted
dimension Ideally items should correlate highly with each other within each extracted
factordimension however for each dimension to be considered unique between-factor
correlations should be low (Rogers 2014) According to Meyers et al (2013) between-factor
correlations should not exceed 80 to warrant the use of a separate dimension The last step
involved an investigation of the similarities between items in each factor in order to describe the
items that make up each This was done firstly in terms of the three Knowledge and Skills
categories and secondly the five strands to which the items were referenced as well as any
further content similarities
332 Phase 2 Identifying Mathematical Strengths and Weaknesses
In an attempt to identify in which mathematical subdomains or dimensions and related
strands learner performances were strongest and weakest as asked in question two of this study a
Latent Class Analysis (LCA) was performed using MPLUS version 612 (Mutheacuten amp Mutheacuten
1998-2012)
Specifically the goal of a mixture model is to reveal unobserved heterogeneous and
meaningful population groups within the larger homogenous population by identifying similarities
in their responses to measured variables (Nylund Asparouhov amp Mutheacuten 2007) These identified
latent populations or sub-groups are called classes Therefore using this analysis allowed for the
generation of distinct performance profiles for each sub-group or class identified as performing
similarly in the largescale assessment In this way more accurate class specific strengths and
weaknesses could be described as opposed to simply those of the overall Grade 6 population
20
For an LCA the outcome variables used are specifically categorical (Nylund et al 2007)
Therefore dichotomously scored response data from the random sample of 5000 students were
used for the LCA The LCA approach is exploratory in nature because the optimal number of
classes representing all latent classes cannot be determined apriori (Nylund et al 2007) Therefore
an investigation of relevant fit statistics generated by the LCA was firstly conducted According to
Pastor Barron Miller and Davis (2007) the fit statistics commonly used to determine the optimum
number of classes include the Bayesian Information Criterion (BIC) the sample-size adjusted BIC
and the Akaike Information Criterion (AIC) where lower values indicate a better fitting model An
Entropy statistic is also commonly used to determine model fit This statistic ranges from 0 to 1
where values closest to 1 indicate higher classification accuracy
Following the identification of the best fitting model the entire sample was profiled in
terms of distinct mathematics classes In order to reduce the number of points on these profiles
items were grouped according to the strand to which they were referenced by EQAO within each
identified factor This allowed for the identification of learner strengths and weaknesses not only
surrounding factors but also each strand within each factor
As part of the LCA mean item probability scores are calculated for each class This statistic
indicates the mean probability for each class to respond correctly to an item and therefore ranges
from 0 to 1 (Nylund et al 2007) Values closest to one therefore indicate a higher probability of
responding correctly to an item Using these values for each item average item-group probability
scores were calculated and these values were then used to describe class specific strengths and
weaknesses This was done firstly by describing overall item-group performances in comparison
to other classes and secondly by describing class performances in each specific factor overall and
lastly in terms of each strand within each factor
21
333 Phase 3 Predicting Class and Profile Membership
In order to answer question three concerning whether or not English as a second language
and length of residence in Canada significantly predicted the performance profile to which a
learner belongs a multinomial logistics regression analysis was conducted This phase was
completed using IBMrsquos SPSS (version 230)
A multinomial logistic regression is used when the dependent variable for the analysis
consists of more than two categorical levels (Meyers et al 2013) Besides the item probability
mean generated by the LCA a class probability mean for each learner in the sample is also
calculated as part of the analysis This class probability indicates the likelihood of a learner
belonging to each of the classes or performance profiles Based on the highest class probability
learners were allocated to one of the performance profiles as generated in phase 2 These classes
were coded 1 2 3 etc based on the number of classes determined to best describe the sample and
represented the dependent or predicted variable of the analysis
Table 3
Six Groups Created Based on English as Second Language and Time Lived in Canada
Group Language Time lived in Canada n
1 Non-ESL CA born 4185 837
2 ESL CA born 308 62
3 Non-ESL Non-CA born lt 5 years 76 15
4 ESL Non-CA born lt 5 years 123 25
5 Non-ESL Non-CA born ge 5 years 199 40
6 ESL Non-CA born ge 5 years 109 22
Notes N = 5000 ESL = English as a second language learner CA born = Born in Canada
An independent variable used for predicting the latent class membership included six
groups based on the following background variables English Second Language (ESL) status as
22
well as whether or not they were Canadian born non-Canadian born but at the time had resided in
the country for less than 5 years or non-Canadian born but at the time had resided in the country for
five years or more This was done in order to avoid clustering ELL learners as a homogenous group
and therefore better identify learners These six categorical data groups represented the predictor
or independent variable Table 3 indicates more precisely how each of the groups were created as
well as their sizes
23
Chapter 4 Results
The results of this study are discussed according to the three questions presented and phases
of data analyses as discussed in Chapter 3 Firstly the results produced from the Exploratory
Factor Analysis (EFA) described in phase one concerning question one are reported Secondly
those produced by the Latent Class Analysis (LCA) in phase two to answer question two and lastly
those produced from the multinomial logistics regression analysis conducted in phase three to
answer question three are presented in this chapter
41 Dimensionality Characteristics
As noted an EFA was conducted on the 28 multiple choice mathematics items in order to
determine the dimensionality of the largescale assessment to which they belonged The
eigenvalues of the tetrachoric correlation matrix (Table 4) produced by Mplus ranged between
862 and 41 the first three factors showed eigenvalues greater than 1 and accounted for 3953 of
the total variance
Table 4
Eigenvalues of Correlation Matrix indicating Total Variance Explained
Item Eigenvalue Item Eigenvalue Item Eigenvalue Item Eigenvalue
1 86 2 13 3 10 4 93
5 91 6 90 7 87 8 85
9 84 10 80 11 79 12 76
13 74 14 72 15 70 16 69
17 66 18 65 19 64 20 63
21 60 22 57 23 53 24 52
25 50 26 49 27 46 28 41
24
411 Determining the Best Fitting Factor Solution Model
The eigenvalues scree plot and fit statistics were used to determine the best number of
factors to describe this data set Based on the ldquonumber of eigenvalues greater and equal to one
rulerdquo as suggested by Meyers et al (2013) together with the scree plot and relevant fit statistics it
seemed adequate to extract three factors albeit accounting for less than 50 of the variance
Figure 1 Scree plot
Although three eigenvalues were produced greater and equal to one suggesting the
existence of three factors this was contradicted by the scree plot (Figure 1) which suggested the
existence of only two factors as it appeared to level off mostly at number three Subsequently a
comparison of the one to three factor solutions was conducted in terms of the relevant fit statistics
as described in Table 5
The significant chi-square p-values (lt 001) generated for the one and two factor solutions
suggested that the data differed significantly from the model matrix Although the chi-square p-
value has been criticized in the past for being overly sensitive to large sample sizes and therefore
0
05
1
15
2
25
3
35
4
45
5
55
6
65
7
75
8
85
9
1 2 3 4 5 6 7 8 9 10 11 12 13 14 15 16 17 18 19 20 21 22 23 24 25 26 27 28
Eig
envalu
es
Items
25
almost always producing a significant value (Meyers et al 2013) this was determined not to be the
case for this analysis as the p-value generated in the three factor model increased substantially
from the one to two factor model thus ensuring the reliability of this value
Table 5
EFA Model Fit Statistics of the 1 to 3 Factor Solutions on 28 Mathematics Items
FA model Chi-Square df p-value RMSEA RMSR
1 92476 350 lt 001 018 031
2 44012 323 lt001 009 021
3 34390 297 032 006 019
Note N = 5000
Therefore since the Chi-square p-value of 032 of the three factor model was not significant
(at the 001 probability level) as well as the fact that only two items represented the fourth factor in
the four factor solution model it was deemed a good fitting model The values of 006 and 019 of
the RMSEA and RMSR respectively were well below the 05 recommended value providing
further support for this three factor solution model
A further inspection of the factor loadings from the three-factor solution as well as of the
items on each factor resulted in the removal of four items (ie 12 18 23 and 24) Items 18 23 and
24 were discarded as a result of low factor loading scores below 30 Whereas a decision was made
to remove Item 12 as it was the only item referenced to the Thinking category that did not load on
the factors in the same way that the others did Table 6 presents the final factor loadings with the
Knowledge and Skills categories to which items were originally allocated by the EQAO that is
knowledge and understanding application and thinking
The Promax factor correlation matrix produced by Mplus (Table 7) revealed that all three
factors correlated positively and moderately to high with one another The strongest correlation
26
existed between Factor 1 and Factor 3 with a relatively high coefficient value of 747 while the
weakest correlation existed between Factor 1 and Factor 2 with a coefficient of 576
Table 6
Factor Loadings of the 23 Items used in the Final 3 Factor Solution Model
Item Knowledge amp Skill Factor 1 Factor 2 Factor 3
1 KU 64 -09 13
11 App 63 -04 12
14 KU 55 13 01
6 App 51 12 -04
15 KU 51 -05 14
10 App 47 23 05
7 App 45 -12 13
25 KU 38 09 17
3 KU 35 -01 24
9 KU 35 09 07
22 KU 31 07 23
5 APP 30 09 22
13 App 10 65 -05
27 Think -04 63 23
2 Think -07 50 12
20 App 14 -03 59
17 Think -04 04 55
26 App 13 01 33
8 App 11 -01 32
28 Think 15 03 32
16 Think 11 10 31
4 Think 14 12 30
21 Think -04 08 30
α = 725 α = 536 α = 565
Notes KU = Knowledge and Understanding App = Application Think = Thinking category
As stated earlier according to Meyers et al (2013) correlations should not exceed 80 to warrant
the use of separate factors These results are therefore considered to reveal the existence of three
27
unique factors that can be used to describe the multidimensionality of these mathematics multiple
choice items
Table 7
Promax Factor Correlations Between 3 Factors
Factors FA 1 FA 2
Factor 1
Factor 2 576
Factor 3 747 626
Note N = 5000
As indicated in Table 6 Factor 1 consisted of 12 items in total with factor loading scores
ranging between 30 and 64 and achieved a relatively high Cronbachrsquos alpha of 725 All seven
items referenced to the Knowledge and Understanding category used in the final model loaded
together on Factor 1 along with five items referenced to the Application category Factor 2
consisted of only three items with factor loading scores ranging between 50 and 63 and
achieved a moderate Cronbachrsquos alpha of 536 In Factor 2 two items referenced to the Thinking
category and one to the Application category loaded together to make up the total of three items
for this factor Lastly Factor 3 consisted of a total of eight items with factor loading scores
ranging between 30 and 59 and also achieved a moderate Cronbachrsquos alpha score of 565 The
remaining five items referenced to the Thinking category and three items referenced to the
Application category loaded together to make up the eight items that loaded together on Factor 3
In terms of the strands to which the items in Factor 1 were referenced for instance
Patterning and Algebra etc no clear similarities appeared to exist to tie all the items together
based on this However similarities seemed to exist in terms of the applied skill requested of
learners to solve the mathematical problems It appeared that all the items of this factor merely
requested of learners to apply their mathematical knowledge in terms of procedures and
conceptual understanding to answer the questions For instance Item 15 which is referenced to
28
the Knowledge and Understanding category asks the following ldquoWhat is the value of 0730 ndash
0156rdquo Whereas Item 5 which is referenced to the Application category asks that learners
solve problems involving the addition of decimal numbers (the exact question was not released)
Therefore it was determined that no clear difference existed between the applied skill requested
from these two items even though they were referenced to two different Knowledge and Skills
categories It was therefore concluded that Factor 1 could be described as measuring the
application of mathematical knowledge to solve problems in various strands
An inspection of the items that loaded together on Factor 2 revealed that two of the items
were referenced to the Thinking category while one of the items was referenced to the
Application category Furthermore all three items were similar in that that they covered the
ldquoMeasurementrdquo strand and more specifically that all three items requested of learners to solve
problems relating to ldquoAreardquo Item 2 for instance asks ldquoThe parallelogram below will be cut
into two congruent triangles (provides dimensions) What is the area of one of the trianglesrdquo
Item 13 asks ldquoWhich of the following shows a rectangle and a triangle that have the same areardquo
and lastly Item 27 requests that learners compare the areas of two polygons (exact item not
released) Item 2 was referenced to the Application category whereas Items 13 and 27 were
referenced to the Thinking category It was therefore determined that Factor 2 could be
described as requesting of learners to apply thinking processes or skills such as problem solving
and reasoning in order to solve deeper mathematical problems specifically surrounding the
Measurement topic of ldquoAreardquo
Lastly for Factor 3 as with Factor 1 no clear similarities appeared to exist to tie all the
items together based on strands However as with Factor 1 similarities seemed to exist in terms
of the applied skill requested of learners to solve the mathematical problems It appeared that
all the items on this factor requested of learners to apply thinking skills to solve deeper
mathematical problems surrounding various strands in other words learners had to go beyond
the mere application of content knowledge to solve these items For instance Item 20 referenced
29
to the Application category requested that learners solve the following problem ldquoEach beaker of
water below has a capacity of 2L Which beaker appears to have about 500ml of water in itrdquo
Whereas Item 28 referenced to the Thinking category asks ldquoMrs Garrett sends surveys to 120
students and 78 students return the survey Which statement best describes the percent of
students who return the surveyrdquo Again no clear difference appeared to exist between the
applied skill requested of learners in terms of the Application and Thinking categories to which
the items were referenced It was therefore concluded that Factor 3 could be described as
measuring the ability of learners to apply thinking processes or skills such as problem solving
and reasoning in order to solve deeper mathematical problems in various strands
In sum the results of the EFA determined that a three factor model could be used to
adequately characterize the dimensionality of the multiple choice mathematics items on the
EQAO assessment Twelve items clustered adequately together in terms of factor loading scores
to form Factor 1 which achieved a relatively high Cronbachrsquos alpha of 725 three items on
Factor 2 which achieved a moderate Cronbachrsquos alpha of 536 and lastly eight items on Factor
3 which also achieved a moderate Cronbachrsquos alpha score of 565 Upon closer inspection of
the items on each factor and in terms of the Knowledge and Skills categories and strands to
which they were referenced by the EQAO it was determined that Factor 1 could be best
described as measuring the ability of learners to apply mathematical knowledge related to
procedural and conceptual understanding in order to solve problems in various mathematical
strands Factor 2 could be best described as measuring the ability of learners to apply process
or thinking skills in order to solve problems related specifically to the topic of ldquoAreardquo
Lastly Factor 3 could be best described as measuring the ability of learners to apply thinking
skills in various mathematical strands
30
42 Mathematical Strengths and Weaknesses
In an attempt to identify in which mathematical dimensions and related strands Grade 6
learner performances were strongest and weakest as asked in question two of this study a Latent
Class Analysis (LCA) was conducted This allowed for distinct performance profiles to be
generated for classes or sub-groups performing similarly in the population and therefore allowed
for more accurate descriptions of strengths and weaknesses The factors as established in the
dimensionality investigation in Phase 1 of this study were used to represent the dimensions for this
analysis
Although the four class model achieved the lowest AIC BIC and Sample-Size Adjusted
BIC statistic values in comparison to the two and three class model it also produced a much lower
Entropy value of 69 (see Table 8) Therefore it was decided that since these statistics did not
decrease that much from the three class to four class model the use of the four class model with a
much lower Entropy value did not seem warranted Thus the three class model was opted for
instead as it produced lower fit statistics than the two class model as well as a sufficiently high
Entropy value of 75 Furthermore the results indicated that each class was represented by the
following proportion of learners from the sample Class 1 comprised of 321 Class 2 of 452
and Class 3 of 227
Table 8
LCA Fit Statistics for 2 3 and 4 Classes
Fit statistics 2 Classes 3 Classes 4 Classes
AIC 12974224 12808557 12789120
BIC 13004854 12854829 12851034
Adj BIC 12989919 12832268 12820846
Entropy 81 75 69
Notes N = 5000 AIC = Akaike Information Criterion BIC = Bayesian Information Criterion Adj BIC = Sample-
Size Adjusted Bayesian Information Criterion
31
Eleven item-groups were created to describe the strengths and weaknesses of the three
classes as represented in Table 9 Item-groups were created by grouping items according to the
factor they were determined to measure (as established in the EFA) as well as the strand to which
they were allocated by the EQAO Five item-groups were created for Factor 1 one item-group for
Factor 2 and five groups for Factor 3 The number of items within each item-group varied from 1
item to 4 items The mean probability scores calculated for each class for each item-group and
overall dimension or factor are also represented in Table 9 These mean item-group probability
scores as presented in Table 9 were used to plot three distinct performance profiles for each class as
represented in Figure 2 below
Table 9
Item-Groups created to Describe Mathematical Performances of Grade 6 Learners
Factor Content Area of items Class 1 Class 2 Class 3
1 Patterning amp Algebra 3 97 86 48
1 Measurement 1 95 78 44
1 Geometry amp Spatial Sense 2 94 79 50
1 Number Sense amp Numeration 4 92 76 49
1 Data Management amp Probability 2 78 49 19
Factor 1 class probability means 91 74 44
2 Measurement (Area) 3 85 39 28
Factor 2 class probability means 85 39 28
3 Patterning amp Algebra 2 67 43 20
3 Measurement 2 79 55 25
3 Geometry amp Spatial Sense 1 79 47 31
3 Number Sense amp Numeration 2 80 60 44
3 Data Management amp Probability 1 72 40 22
Factor 3 class probability means 76 51 29
Note The factor probability means presented in bold are slightly higher as the actual item probability score was used
to calculate these values and not the item-group probability scores
Using the evidence generated from the mean item-group and factor probability scores as
represented in Table 9 and Figure 2 these performance profiles were used to describe the strengths
32
and weaknesses of each class Class specific strengths and weaknesses were described according
to firstly overall performances in the 11 item-groups in comparison to the other classes secondly
in terms of overall performances in each dimension (Factor 1 2 and 3) and lastly in terms of
performances in each strand within each dimension for Factor 1 and 3 only (as Factor 2 only
represented Measurement topic of ldquoAreardquo) A mean item-group probability score ranging from 86
- 10 was described as especially strong 71 - 85 as strong and 56 - 70 as moderately strong
while those scores ranging from 41 - 55 were described as moderately weak 26 - 40 as
moderately weak and 25 and below as especially weak
Figure 2 Three performance profiles of Grade 6 learners in 11 mathematical item-groups
Results indicated that those learners most likely to belong to Class 1 performed higher than
Class 2 and 3 in all item-groups Therefore this class to which 321 of learners from the sample
belonged can be best described as the highest performing and second largest group overall Those
most likely to belong to this class can be described as having an especially strong ability to apply
0
01
02
03
04
05
06
07
08
09
1
Item
-Gro
up
Mea
n P
rob
ab
ilit
y
Item-Groups
Class 1 (321) Class 2 (452) Class 3 (227)
33
mathematical knowledge in order to solve problems in various strands This was determined by the
average 91 overall probability for success achieved for those items related to Factor 1 They can
also be described as having a strong ability to apply thinking skills in order to solve problems
surrounding the Measurement topic of ldquoAreardquo and strong ability to do the same in various strands
This was determined by the 85 probability for success achieved for those items related to Factor
2 and 76 probability for success achieved for those related to Factor 3 Furthermore their overall
performances in the knowledge dimension can be described as stronger in comparison to their
performances in the thinking dimensions
Specifically concerning their ability to apply mathematical knowledge in various strands
(Factor 1) these learners can be described as performing slightly stronger in the Patterning and
Algebra (item-group probability score = 97) and considerably weaker in Data Management and
Probability (item-group probability score = 78) in relation to their performances in the other
strands Specifically regarding their ability to apply think skills in order to solve problems (Factor
3) they can be described as performing slightly stronger in Number Sense and Numeration (item-
group probability score = 80) and considerably weaker in Data Management and Probability (item-
group probability score = 72) and Patterning and Algebra (item-group probability score = 67) with
the latter being the weakest in relation to their performances in the other strands
Results further indicated that those learners most likely to belong to Class 2 performed
overall lower than Class 1 but higher than Class 3 in all item-groups Therefore this class to
which 452 of the learners belonged can be best described as the intermediate performing and
largest group overall Those most likely to belong to this class can be described as having a strong
ability to apply mathematical knowledge in order to solve problems in various strands This was
determined by the average 74 overall probability for success achieved for those items related to
Factor 1 They can also be described as having a weak ability to apply thinking skills in order to
solve problems surrounding the Measurement topic of ldquoAreardquo and moderately weak ability to do
the same in various strands This was determined by the 39 probability for success achieved for
34
those items related to Factor 2 and 51 probability for success achieved for those related to Factor
3 Furthermore their overall performances in the knowledge dimension can be described as
stronger in comparison to their performances in the thinking dimensions
Specifically concerning their ability to apply mathematical knowledge in various strands
(Factor 1) performances for these learners can be described as considerably stronger in Patterning
and Algebra (item-group probability score = 86) and considerably weaker in Data Management
and Probability (item-group probability score = 49) in relation to their performances in the other
strands Specifically regarding their ability to apply thinking skills in order to solve problems
(Factor 3) performances can be described as stronger in Number Sense and Numeration (item-
group probability score = 60) and considerably weaker in Data Management and Probability (item-
group probability score = 40) and Patterning and Algebra (item-group probability score = 43) with
the former being the weakest in relation to their performances in the other strands
Lastly results indicated that those learners most likely to belong to Class 3 performed lower
than Class 1 and 2 in all item-groups Therefore this class to which 227 of learners belonged
can be best described as the lowest performing group overall Those most likely to belong to this
class can be described as having a moderately weak ability to apply mathematical knowledge in
order to solve problems in various strands This was determined by the average 44 overall
probability for success achieved for those items related to Factor 1 They can also be described as
having a weak ability to apply thinking skills in order to solve problems surrounding the
Measurement topic of ldquoAreardquo and weak ability to do the same in various strands This was
determined by the 28 probability for success achieved for those items related to Factor 2 and
29 probability for success achieved for those related to Factor 3 Furthermore their overall
performances in the knowledge dimension can be described as stronger in comparison to their
performances in the thinking dimensions
Specifically concerning their ability to apply mathematical knowledge in various strands
(Factor 1) it was determined that these learners can be described as performing slightly stronger in
35
Geometry and Spatial Sense (item-group probability score = 50) and considerably weaker in Data
Management and Probability (item-group probability score = 19) in relation to their performances
in the other strands Specifically regarding their ability to apply thinking skills in order to solve
problems (Factor 3) their performance can be described as considerably stronger in Number Sense
and Numeration (item-group probability score = 44) and weaker in Data Management and
Probability (item-group probability score = 22) and Patterning and Algebra (item-group
probability score = 20) with the latter being the weakest in relation to their performances in the
other strands
In sum the results of the LCA revealed that three classes could be used to best describe the
performances of Grade 6 learners in the three dimensions as established during the EFA and their
related strands Class 1 was described as the highest performing and second largest group The
learners in the class were described as performing especially strong in Factor 1 (namely their
ability to apply mathematical knowledge to solve problems in various strands) strong in Factor 2
(namely their ability to apply thinking skills to solve problems specifically related to the
Measurement topic of ldquoAreardquo) and in Factor 3 (namely their ability to apply thinking skills in order
to solve problems in various strands) Class 2 was described as the intermediate performing and
largest group and performing strong for Factor 1 weak for Factor 2 and moderately weak for
Factor 3 Lastly Class 3 was described as the lowest performing and smallest group and
performing moderately weak for Factor 1 and weak for both Factor 2 and 3 For all classes overall
factor performances were described as weaker in the thinking dimensions namely Factor 2 and 3
than in the knowledge dimension namely Factor 1 A greater discrepancy between these
mathematical knowledges and thinking skills dimensions appears to exist for those in Class 2 than
for those in Class 1 and 3
Lastly in terms of describing the performances of each class in the strands related to each
factor for Factor 1 and 3 results revealed clear similarities between all classes in terms of those in
which performances were described as weaker For all classes regarding Factor 1 their ability to
36
apply mathematical knowledge within the Data Management and Probability strand was described
as the weakest in relation to the other strands For all classes regarding Factor 3 their ability to
apply thinking skills in the Patterning and Algebra and Data Management and Probability strand
was described as weakest in relation to their performances in the other strands
43 Predicting Mathematics Profiles by Language and Length of Residence Background
To avoid treating learners as homogenous groups based on their language background they
were allocated to one of six groups according to their ESL designation and length of residency in
Canada The six groups represented the predictor variable (independent variable) whereas the three
classes or performance profiles were treated as the predicted or dependent variable Class 1
namely the highest performing profile group was used as the reference category
Results of this analysis indicated that the final model did not significantly predict class and
performance profile membership with a -2 Log likelihood of 7740 and a Chi-square value of 957
(10 N = 5000) p = 48 The upper portion of Table 10 presents the regression coefficients the
Wald test adjusted odds ratio [Exp(B)] and the 95 confidence intervals (CI) for odds ratios for
the predictor contrasting Class 2 to Class 1 The lower portion of the table presents the regression
coefficients the Wald test adjusted odds ratio [Exp(B)] and the 95 confidence intervals (CI) for
odds ratios for the predictor contrasting Class 3 to Class 1
Results therefore revealed that ESL status and residence in Canada did not significantly
predict class or profile membership regardless of group allocation In other words regardless of
group allocation learners were found to be equally likely to belong to either Class 1 (highest
performing group) Class 2 (intermediate performing group) or Class 3 (lowest performing group)
and therefore perform according to the related profile as indicated earlier in Figure 2
37
Table 10
Parameter Estimates for Six Groups on 3 Classes
Model B SE - B Wald df Exp(B) 95 CI EXP (B)
Class 2
Intercept 43 23 351 1
Group 1 -07 23 09 1 93 60 ndash 147
Group 2 06 26 06 1 107 64 ndash 178
Group 3 -60 35 296 1 55 277 ndash 109
Group 4 01 31 00 1 101 55 ndash 183
Group 5 -08 28 09 1 92 54 ndash 158
Class 3
Intercept -13 26 27 1
Group 1 -23 26 74 1 80 48 ndash 133
Group 2 -20 31 42 1 82 47 ndash 149
Group 3 -36 39 84 1 70 33 ndash 150
Group 4 -35 37 92 1 70 34 ndash 144
Group 5 -53 33 255 1 59 31 ndash 113
Notes p lt 001 N = 5000 Class 1 is the reference category Group 1 = Non-ESL CA Born (n = 4185) Group 2 =
ESL CA Born (n = 308) Group 3 = Non-ESL Non-CA born but living in country less than 5 years (n = 76) Group 4
= ESL Non-CA born but living in country less than 5 years (n = 123) Group 5 = Non-ESL Non-CA born but living in
country 5 years or more (n = 199) Group 6 = ESL Non-CA born but living in country 5 years or more (n = 109)
38
Chapter 5 Discussion
The purpose of this study was to move beyond the total scores of a largescale assessment
in order to gain better insight into the mathematical performances of Ontariorsquos Grade 6 learners
In doing so it aimed to provide evidence of learner strengths and weaknesses in different aspects
of mathematics education on which to base remedial decisions for the improvement thereof
Using the responses of a random sample of 5000 Grade 6 learners to 28 multiple choice
mathematics items on the 20132014 EQAO Junior Division assessment an Exploratory Factor
Analysis (EFA) was firstly performed in order to investigate the dimensionality characteristics
of the assessment This was followed by a Latent Class Analysis (LCA) to determine learner
strengths and weaknesses related to the established mathematical dimensions and their related
strands Lastly a multinomial logistic regression analysis was performed in order to examine the
extent to which mathematics performance profiles were predicted by student background factors
such as language and length of residency in Canada This chapter discusses the findings of these
analyses study limitations and lastly recommendations for future research and education
51 What Characterizes the Dimensionality of the EQAO Mathematics Achievement Test Administered to Grade 6 Students in Ontario Public Schools
The multiple choice mathematics items on the EQAO assessment were characterized as
measuring the ability of learners in three interrelated yet separate mathematical dimensions
These being the ability of learners to apply mathematical knowledge related to procedural
knowledge and conceptual understanding to solve problems in various strands (Factor 1) the
ability to apply process or thinking skills such as problem solving or reasoning skills to solve
problems in ldquoAreardquo (Factor 2) and lastly the ability to apply process or thinking skills to solve
39
problems in various mathematical strands The three factors produced achieved on average
moderate reliability scores
These findings regarding the characteristics of the dimensions were considered valuable
as they allowed for the comparison of learner abilities in two essential elements of mathematical
proficiency as aligned with the Principles and Standards for School Mathematics (NCTM
2000) and as a result also with the Ontario mathematics curriculum which shares the same
foundations Only once this happens namely learner ability measured directly in relation with
mathematical curriculum expectations can we begin an effective process of remediation
(Kilpatrick et al 2001) These elements were that of mathematical knowledge consisting of
procedural and conceptual knowledge as measured by Factor 1 of this study and process or
thinking skills such as problem solving and reasoning as measured by Factor 2 and 3 Factor 2
and 3 were determined to differ based solely on the content of the items included in the
assessment This finding highlights concerns regarding the fair representation of all curriculum
expectations on the assessment and thus warrants further investigation
The fact that the ability to apply mathematical knowledge and the ability to apply
thinking skills in order to solve mathematical problems were found to be sufficiently unique
dimensions to warrant their use using the multiple choice items on this largescale mathematics
assessment adds further value to the findings of this study These findings are valuable in that
they attest to the future potential for assessment organizations to report learner performances
beyond that of total scores as demanded by those in the educational field However since the
factors achieved only moderate reliability scores we are reminded of the need for these tests to
be designed upon foundations aligned with those of the curriculum expectations they are
employed to assess from the start in order for them to meet better test properties (Chudowsky amp
Pellegrino 2003 Rogers 2014)
40
52 In which Mathematical Dimensions and Related Strands do Students Demonstrate Strengths and Weaknesses in their Mathematical Achievement
Three classes were determined to best describe the performances of all Grade 6 learners
in the established dimensions and their related strands Class 1 was described as the highest
performing and second largest group consisting of 321 of the learners Class 2 was described
as the intermediate performing and largest group consisting of 452 of the learners and lastly
Class 3 was described as the lowest performing and smallest group consisting of only 227 of
the learners from the sample
The results of this analysis further revealed that all three classes performed weaker in
their ability to apply thinking skills in order to solve problems either specifically surrounding
the topic of Area or in various strands than in their ability to apply mathematical knowledge in
order to do the same The performances of those in Class 1 were described as especially strong
in the mathematical knowledge dimension (Factor 1) and strong in the thinking dimensions
(Factor 2 and 3) Class 2 was described as strong in the mathematical knowledge dimension but
weak in the thinking skills dimensions and lastly Class 3 was described as moderately weak in
the mathematical knowledge and thinking skills dimensions The discrepancy between
performances in the two subdomains namely mathematical knowledge and thinking skills thus
appeared to be largest for those in Class 2 the intermediate performing and largest group
The findings concerning the overall performances of students in the two subdomains of
mathematical knowledge and thinking skills aligns with those concerning the performances of
US students as described by Kilpatrick et al (2001) They highlight that research evidence over
the past 30 years has consistently indicated that although US students do not fare badly in
applying their knowledge to solve basic mathematical problems they tend to have a limited
41
understanding of mathematical concepts and are noticeably deficient in their ability to apply
mathematical thinking skills to solve even simple problems
It may however be argued that this finding namely a weaker performance in thinking
skills than mathematical knowledge is to be expected given the fact that applying thinking skills
in order to solve problems is a more challenging task than simply applying what you know
(Schoenfeld 2007) However studies have also found that a strong mathematical knowledge
base leads to a better ability to apply thinking skills to solve deeper problems (Stokke 2015)
Thus given the inter-relatedness of these two dimensions together with the large discrepancy
between them for those in Class 2 (strong mathematical knowledge but weak thinking skills)
these findings demonstrate a weakness in the majority of Ontariorsquos Grade 6 learners to apply
thinking skills to solve deeper mathematical problems This finding holds important
recommendations for future research and mathematics educational practices as will be discussed
in the section below
Upon further investigation of learner performances in each of the strands as they relate to
the dimensions it was determined that all three classes performed much weaker in their ability to
apply mathematical knowledge in the Data Management and Probability strand than in the other
strands This strand was also determined to be the weakest in the thinking skills dimension
along with Patterning and Algebra This finding contradicts those of Tatsuoka Corter and
Tatsuoka (2004) in which it was found that students in the US appeared to perform poorest in
Geometry and Spatial Sense Given the inter-relatedness of mathematical knowledge and ability
to apply thinking skills as previously highlighted by Stokke (2015) this finding concerning Data
Management and Probability attests to a knowledge base weakness for Grade 6 Ontario learners
specifically surrounding this strand As for the results surrounding Patterning and Algebra they
appear to provide further support for the weak ability of the learners to apply thinking skills
42
given their relatively strong mathematical knowledge surrounding this strand These findings
also hold valuable recommendations for educational practices in Ontario which will be further
discussed below
53 To What Extent Are Mathematics Performance Profiles Predicted by Student Background such as Language and Residence Status
Findings from this analysis revealed that language background and length of residence in
Canada did not significantly predict performance profile membership Therefore regardless of
group allocation based on these variables all learners were equally likely to achieve a Class 1
(high performing) Class 2 (intermediate performing) or Class 3 (low performing) profile as
described in this study
These findings contradict the Jang et al (2013) study on the performance of learners in
reading In that study it was found that different reading patterns were achieved based on ELL
and length of residence status It was further determined that non-English speakers outperformed
monolinguals in reading achievement after living in the country for five years or more These
findings therefore do not appear to hold true for the performances of learners in mathematics
based on these variables as all learner groups were equally likely to achieve one of the three
performance profiles produced in this study However it needs to be acknowledged that this
study focused on ESL designation as opposed to ELL status which may have contributed to the
differences in findings Nonetheless these findings are considered valuable in that they provide
reassurance of the fact that the test results were not confounded by differences in language
proficiency and that the EQAO test was not biased towards first language speakers
The findings of this study further contradict those that found that English first language
speakers outperformed those for whom English was not their first language (Abedi amp Lord
43
2001 Howie 2003) Therefore they help shed perceptions of differences in mathematical
performances based solely on the aspect of language background This finding holds important
implications for mathematics education for these population groups as well as future research
54 Study Limitations
The following study limitations have been recognized and should thus be taken into
consideration when reviewing these findings Firstly this study analyzed the mathematical
performances of learners based on the results of a standardized test only We are therefore
reminded of the fact that many factors influence test scores over and above that which is random
These include the testing situation tester characteristics and test-taker characteristics (Kaplan amp
Saccuzzo 2009) For this reason it is important that learner performances in other assessment
environments also be considered such as classroom-based assessment activities
Secondly the findings of this study were based solely on learner performances on the
multiple choice items According to Schoenfeld (1992) most multiple choice items are machine
graded which limits their ability to measure learner conceptual understanding and problem
solving abilities to the degree that most people would like For this reason it is important that
future studies consider including the open response questions included on the assessment for a
better reflection of learner conceptual understanding and problem solving
Thirdly this study included performances of learners based solely on a single EQAO
administration and its data Although EQAO proclaims to instill rigorous test equating
procedures to ensure that test difficulty and discrimination properties are not compromised
across years (Rogers 2013) this does not guarantee that learner performances can be generalized
to all Grade 6 learners Furthermore this study focused on only those who took the English
44
version of the test therefore generalizing these findings to those who took the French version
should be done cautiously
Lastly the small ESL population size in comparison to the non-ESL population limits the
findings of this group and may therefore not accurately reflect their performances Furthermore
this study used ESL designation as opposed to ELL status ESL designation is a program in
which learners are enrolled or unenrolled throughout the year Therefore these findings may not
reflect that of the entire ELL population
55 Recommendations and Future Research
In light of recent poor mathematical performances of Ontariorsquos elementary learners the
education minister announced its ldquoRenewed Math Strategyrdquo designed for the purposes of
combatting further decline (Brown 2016) In this strategy requirements for improving the
performances of learners in mathematics were announced such as all learners in Grade 1-8 to
receive at least 60 minutes of mathematics instruction per day further support for weaker
schools in terms of more professional development for teachers as well as more support for
learners and parents surrounding this discipline As this study made apparent in the beginning
such strategies risk being only blanketed approaches that do not really target the heart of the
problem if not accompanied by further insight into the results upon which they are based
This study was conducted in an attempt to gain such insight and found that although
Ontario Grade 6 learners display strong mathematical knowledge the majority are particularly
weak in applying thinking skills such as reasoning and problem solving to solve deeper
mathematical problems It was further determined that learners are particularly weakest in the
Data Management and Probability strand for both mathematical knowledge and thinking skills
dimensions as well as the Patterning and Algebra strand in the latter dimension It was lastly
45
determined that background variables of language and length of residence did not significantly
predict performance and profile achievement and that both ESL and non-ESL learners were
equally likely to belong to high intermediate and low performing groups regardless of length of
residence in Canada Based on these findings the following recommendations surrounding
future research endeavors and educational practices specifically in conjunction with mathematics
education in Ontario will be discussed below
The Ontario Curriculum Grades 1-8 Mathematics 2005 document indicates that the
ultimate goal for mathematics education is to develop learner proficiency beyond that of content
knowledge and therefore also calls for the development of a deeper understanding of the
discipline along with essential thinking skills In order to accomplish these goals the
curriculum highlights that instructional practices need to deviate from a sole focus on direct
teaching methods to incorporate methods of teaching and learning through problem solving in
other words problem-based learning approaches Stokke (2015) blames this greater emphasis of
teaching mathematics using problem-based teaching strategies for the recent decline of Ontario
learnersrsquo mathematical performances She argues that the lack of direct instruction has robbed
learners of a sound knowledge base from which to draw upon when attempting to solve deeper
mathematical problems hence the weakness in this area
However the findings from this study provides evidence that contradicts this argument
as results point to the fact that the majority of Grade 6 learners in Ontario actually do possess
strong mathematical knowledge This finding may therefore perhaps be an indication of the
fact that a large portion of Ontario teachers still rely predominantly on teaching mathematics
using traditional direct teaching methods as opposed to those better suited to meet current
curriculum goals and expectations This finding therefore warrants further investigation into
current teaching trends and holds valuable insight as to where to direct efforts for remediation
46
In order to meet reformed curriculum goals and expectations teaching practices need to
change for which the teacher is the key actor (Ross amp McDougall 2006) Therefore this study
supports those calling for increased efforts directed at teachers and the need to reshape their roles
and perceptions of what it means to ldquoteachrdquo mathematics in a reformed curriculum classroom
For instance Milgram (2007) urges for strategies directed at ensuring that teachers truly
understand what it means to teach using problem-based teaching methods to develop thinking
skills He further illustrates that teaching thinking skills such as problem solving is a
challenging task as it is in itself complex involving both verbal and nonverbal mental processes
For this reason it is essential that learners solve problems for which the answer is not apparent
and requires a novel idea if we wish to effectively develop these skills (Milgram 2007) Such a
teaching and learning process requires that teachers step back allowing learners to grapple with
the task before them as well as interact with each other stepping in only when necessary to
guide the process (Milgram 2007)
Changing the role of the teacher from the traditional sole knowledge bearer and
transferor to one in which heshe shares the responsibility of learning with students is however
only one of 10 dimensions that requires attention when urging teachers to adopt instructional
practices better suited to accomplish curriculum goals and expectations (Ross amp McDougall
2007) Ross and McDougall (2006) further illustrate that in order to ensure that teaching for
deeper understanding as aligned with current reformed mathematics education takes place
teachers need to consider change in all 10 of these dimensions These dimensions as cited in
Ross and McDougall (2006) are summarized as follows 1) the need for program scope 2)
access to all forms of mathematics by students 3) raising self-confidence of students by teachers
4) complex and open-ended student tasks 5) instruction that focuses on constructing
mathematical ideas through self-discovery 6) change in the role of teachers to that of co-learner
47
and co-knowledge creator 7) solving of mathematical problems with the aid of manipulatives 8)
classroom organization in a manner that promotes sharing and interaction for solutions 9)
authentic assessment and lastly 10) a conception of mathematics as a dynamic subject by
teachers
Specifically regarding the first dimension namely the need for program scope Ross and
McDougall (2006) describe it as urging teachers to teach multiple mathematical strands with
increased attention on those less commonly taught such as the Data Management and
Probability and Patterning and Algebra strands The results of this analysis indicated that
learners were weakest in precisely these two strands therefore perhaps providing evidence in
support of the fact that these strands are given less attention by Ontario teachers when teaching
the mathematics curriculum expectations This finding therefore provides added support for the
need to further promote the implementation of these 10 dimensions of teaching for deeper
understanding as indicated above so as to ensure that teachers view all curriculum strands as
equally important and deserving of attention
In calling for these increased efforts directed at changing the way in which mathematics
teaching and learning occurs in classrooms it is important to acknowledge the fact that this is
easier said than done Teaching in a manner that supports the development of a deeper
understanding for mathematics and promotes thinking skills is a lengthy process that takes time
(Milgram 2007) A commodity in short supply for the teacher already feeling pressured to
cover all curriculum expectations before mandatory accountability assessments take place
(Milgram 2007) Therefore not only does this study call for increased efforts directed at
changing teacher perceptions and instructional practices in the classroom but also for policy
makers to consider practical constraints placed on teachers that may restrict the implementation
thereof
48
Lastly the need to predict mathematical performances of learners based on background
variables is made apparent by Hinton (2014) who found that early success in mathematics
predicts future success Therefore for the sake of early intervention especially for the lowest
performing group identified in this study it is urged that further research studies be directed at
determining background variables that better predict performances However it is further urged
that such studies focus on class or profile membership as used in this study as opposed to overall
mathematics performances used in the past In this way not only will we be able to better
identify low intermediate and high performers but also their related strengths and weaknesses
upon which specific remedial efforts can be targeted As for the equal likelihood of ESL and
non-ESL learners to achieve either low intermediate or high performing profiles this study
recommends future studies targeted at shedding perceptions of non-English speakers
underperforming in relation to first language speakers that have perhaps been shaped by previous
studies Without doing so we risk assuming the need for remediation directed at one group
whilst ignoring the needs of others
49
References
Abedi J amp Lord C (2001) The language factor in mathematics tests Applied Measurement
in Education 14(3) doi 101207S15324818AME1403_2
Brown J (2016) Elementary student to get hour of math every day under new Ontario plan
Retrieved July 23 2016 from
httpswwwthestarcomyourtorontoeducation20160404elementary-students-to-get-
hour-of-math-every-day-under-new-ontario-planhtml
Chudowsky N amp Pellegrino JW (2003) Large-scale assessments that support learning what
will it take Theory into Practice 42(1) 75+ Retrieved from
httpgogalegroupcommyaccesslibraryutorontocapsidop=AONEampu=utoronto_mai
nampid=GALE|A99909373ampv=21ampit=rampsid=summonampuserGroup=utoronto_mainampauth
Count=1
Collins L K amp Lanza S T (2010) Latent class and latent transitional analysis with
applications in the social behavioral and health sciences Hoboken NJ Wiley amp Sons
DePascale C (2014) The ideal role of large-scale testing in a comprehensive assessment
system Journal of Applied Testing Technology 5(1) 1-11 Retrieved from
httpwwwjattjournalcomindexphpatparticleview48343
Education Quality and Accountability Office (2016) About the agency Retrieved May 26
2016 from EQAO
httpwwweqaocomenabout_eqaoabout_the_agencyPagesabout-the-agencyaspx
Education Quality and Accountability Office (2014) EQAOrsquos provincial elementary school
report 2014 Retrieved September 26 2015 from EQAO
httpwwweqaocomenassessmentsresultsPagesprovincial-report-elementary-
2014aspx
Figlio D amp Loeb S (2011) School accountability In EA Hanushek S Machin and L
Woessmann (Eds) Handbooks in Economic The Netherlands North-Holland pp 383-
421
Foster D Noyce P amp Spiegel S (2007) When assessment guides instruction Silicon
Valleyrsquos mathematics assessment collaboration In AH Schoenfeld (Ed) Assessing
mathematical proficiency (pp 137-154) Cambridge Cambridge University Press
Friesen S (2005) Math Teaching it better Education Canada 46(1) 6-10
Furr R M (2011) Scale construction and psychometrics for social and personality psychology
Los Angeles SAGE
Fillmore L W (2007) English learners and mathematics learning language issues to consider
In AH Schoenfeld (Eds) Assessing mathematical proficiency (pp 333-344) Cambridge
Cambridge University Press
50
Haertel E H amp Herman J l (2005) A historical perspective on validity arguments for
accountability testing Yearbook of the National Society for the Study of
Education 104(2) 1-34 doi101111j1744-7984200500023x
Hinton A (2014) Tracking student achievement in mathematics over time in English language
schools Retrieved from
httpwwweqaocomenresearch_dataResearch_ReportsPagesstudent-
achievementaspx
Howie S (2005) System-level evaluation Language and other background factors affecting
mathematics achievement Prospects 35(2) 175-186 doi101007s11125-005-1820-
8
Huff K amp Goodman DP (2007) The demand for cognitive diagnostic assessment In JP
Leighton amp MJ Gierl (Eds) Cognitive Diagnostic Assessment for Education (19-60)
New York Cambridge University Press
IBM Corp Released 2013 IBM SPSS Statistics for Windows Version 230 Armonk NY IBM
Corp
Jang E E amp Ryan K (2003) Bridging gaps among curriculum teaching and learning and
assessment Book review Kifer E (2001) Large-scale assessment Dimensions
dilemmas and policy Journal of Curriculum Studies 35(4) 499-512
Jang EE Dunlop M Wagner M Kim Y amp Gu Z (2013) Elementary school ELLsrsquo
reading skill profiles using cognitive diagnosis modelling Roles of length of residence
and home language environment Language Learning 63(3) 400-436 doi
101111lang12016
Kaplan RM amp Saccuzzo DP (2009) Psychological Testing Principles Applications and
Issues Belmont Wadsworth Cengage Learning
Kilpatrick J Swafford J Findell B amp National Research Council (US) (2001) Adding it
up Helping children learn mathematics Washington DC National Academy Press
Klinger D A amp Rogers W T (2011) Teachers perceptions of large-scale assessment
programs within low-stakes accountability frameworks International Journal of
Testing 11(2) 122-143 doi101080153050582011552748
La Rose L (2014) PISA results Canada students high level achievers but math and science
scores dip The Huffington Post Retrieved October 5 2015 from
httpwwwhuffingtonpostca20131203pisa-results-canada-
studentrankings_n_4376190html
Meyers L S Gamst G amp Guarino A J (2006) Applied multivariate research Design and
interpretation Los Angeles Sage
Milgram R J (2007) What is mathematical proficiency In AH Schoenfeld (Eds) Assessing
mathematical proficiency (pp 31-58) Cambridge Cambridge University Press
51
Moschkovich J (2007) Beyond words to mathematical content Assessing English learners in
the mathematical classrooms In AH Schoenfeld (Eds) Assessing mathematical
proficiency (345-352) Cambridge Cambridge University Press
Mutheacuten LK amp Mutheacuten BO (1998-2010) Mplus Userrsquos Guide (6th Ed)
Los Angeles CA Mutheacuten amp Mutheacuten
Nagy P (2000) The three roles of assessment Gatekeeping accountability and instructional
diagnosis Canadian Journal of Education 25(2) Retrieved from
httpmyaccesslibraryutorontocaloginurl=httpsearchproquestcomdocview215374
855accountid=14771
National Council of Teachers of Mathematics (2000) Principles and standards for school
mathematics Reston VA National Council of Teachers of Mathematics
Nichols P D (1994) A framework for developing cognitively diagnostic assessments Review
of Educational Research 64(4) 575 Retrieved from
httpmyaccesslibraryutorontocaloginurl=httpsearchproquestcomdocview214116
755accountid=14771
Nylund K L Asparouhov T amp Mutheacuten B O (2007) Deciding on the number of classes in
latent class analysis and growth mixture modeling A monte carlo simulation
study Structural Equation Modeling A Multidisciplinary Journal 14(4) 535-569
doi10108010705510701575396
OECD (2014) PISA 2012 Results What Students Know and Can Do Student Performance in
Mathematics Reading and Science doi httpdxdoiorg1017879789264208780-en
Ontario (2005) The Ontario curriculum grades 1-8 Toronto Ontario Ministry of Education
Pastor D A Barron K E Miller B J amp Davis S L (2007) A latent profile analysis of
college students achievement goal orientation Contemporary Educational
Psychology 32(1) 8-47 doi101016jcedpsych200610003
Rogers WT (2013) What is the quality of EQAO assessments Excellent Retrieved
September 24 2015 from
httpwwweqaocomenresearch_dataResearch_ReportsPagesbest-assessment-
practicesaspx
Rogers WT (2014) Improving the utility of large-scale assessments in Canada Canadian
Journal of Education 37(3) Retrieved from httpcje-rcecaindexphpcje-
rcearticleview1732
Ross JA amp McDougall D E (2006) Mathematics In K Leithwood P McAdrie N Bascia
amp A Rodrigue A (Eds) Teaching for deep understanding Towards the Ontario
curriculum that we need (pp 33-39) Thousand Oaks CA Corwin Publishing
Schoenfeld A H (2007) Issues and tensions in the assessment of mathematical proficiency In
52
AH Schoenfeld (Ed) Assessing mathematical proficiency (pp3-15) Cambridge
Cambridge University Press
Schoenfeld A H (2007) What is mathematical proficiency and how can it be assessed In
AH Schoenfeld (Ed) Assessing mathematical proficiency (pp 59-73) Cambridge
Cambridge University Press
Schoenfeld A H (1992) Learning to think mathematically Problem solving metacognition
and sense making in mathematics In D Gouws (Ed) Handbook for research on
mathematics teaching and learning (pp 334-370) New York Macmillan
Schumacker R E amp Lomax R G (2004) A beginnerrsquos guide to structural equation modeling
(2nd ed) Mahwah NJ Lawrence Erlbaum Associates
Shapka J Domene J amp Keating D (2006) Trajectories of career aspirations through
adolescence and young adulthood Early math achievement as a critical filter
Educational Research and Evaluation 12(4) 347-358 Retrieved from
httpdxdoiorg10108013803610600765752
Statistics Canada (2016) Immigration and Ethnocultural Diversity in Canada Retrieved May
31 2016 from httpswww12statcangccanhs-enm2011as-sa99-010-x99-010-
x2011001-engcfm
Stein MK Remillard J amp Smith MS (2007) How curriculum influences student learning
In FK Lester amp National Council of Teachers of Mathematics (Eds) Second handbook
of research on mathematics teaching and learning a project of the National Council of
Teachers of Mathematics (pp 1099) Charlotte NC Information Age Pub
Stokke A (2015) What to do about Canadarsquos declining math scores Retrieved from
httpswwwcdhoweorgpdfcommentary_427pdf
Tatsuoka K Corter J amp Tatsuoka C (2004) Patterns of Diagnosed Mathematical Content
and Process Skills in TIMSS-R across a Sample of 20 Countries American Educational
Research Journal41(4) 901-926 Retrieved from
httpwwwjstororgmyaccesslibraryutorontocastable3699467
Uebersax JS (2015) Introduction to the Tetrachoric and Polychoric Correlation Coefficients
Retrieved July 20 2015 from httpjohn-uebersaxcomstattetrahtm
Wilson L D (2007) High-stakes testing In FK Lester and National Council of Teachers of
Mathematics (Eds) Second handbook of research on mathematics teaching and learning
a project of the National Council of Teachers of Mathematics (pp 1053 -1098)
Charlotte NC Information Age Pub

5
Chapter 2 Literature Review
This chapter discusses largescale assessments in education as well as their scoring and
reporting practices This is followed by an overview of mathematics education and its associated
curriculum as well as the factors predicting the performances of learners therein
21 Largescale Assessments in Education
Much of the origin and development of largescale testing in education can be traced back
to 1845 in the United States where they were first implemented in Boston schools and
championed for their use as a superior way to examine pupils (Wilson 2007) Today the
concept of educational testing has expanded into a multi-million-dollar business (Wilson 2007)
with largescale assessments serving as the measurement tool of choice on which to gauge the
system of education (Rogers 2014)
Largescale assessments can be characterized by the way in which they are administered
to large groups of learners simultaneously and in a highly standardized manner (Wilson 2007)
The foundations of these assessments rest on the same ideas as criterion referenced tests and are
classified as standards-based rather than norm-referenced tests (Kaplan amp Saccuzzo 2007) In
other words these largescale standards-based assessments compare the performances of
individuals against specific types of skills tasks or knowledge such as curricular standards or
expectations whereas norm- referenced tests compare each person with a norm and therefore
forces competition among people (Kaplan amp Saccuzzo 2007)
Largescale assessments in education were originally used to sort and classify learners
today they still serve this gatekeeping purpose but are also employed to serve two other
functions to which the majority of attention has shifted namely holding those responsible for the
6
education of learners accountable (accountability) and for the improvement of education
(Chudowsky amp Pellegrino 2003 Nagy 2000) School accountability involves the process of
evaluating school performance on the basis of student performance measures (Figlio amp Loeb
2011) and forms part of the system used by officials in education to monitor the effective
functioning of schools
It can also be characterized as either a high- or low-stakes system which further
differentiates the use of the results For instance according to Rogers (2014) accountability in
Canada is considered to be a low-stakes system and therefore the emphasis is predominantly on
using the results for educational improvement In contrast the United States is considered to be
a high-stakes system as results are used chiefly to sanction and reward schools
Although the use of largescale assessments in education have been credited for providing
an objective ldquoyardstickrdquo on which to measure learnersrsquo performances (Rogers 2014) and for
their ability to simplistically rank individuals along a highly reliable scale (Huff amp Goodman
2010) they have endured much criticism from those within the field Not only has much of this
been centered around their many unintentional consequences such as promotion of teaching to
the test test preparation activities at the expense of instructional time dishonesty among
educators and student drop out (Rogers 2014 Schoenfeld 2007) but also their scoring and
reporting practices and procedures These criticisms have led to much doubt concerning their
effectiveness as a tool to serve the purposes for which they are employed
211 Scoring and Reporting Practices of Largescale Assessments
It is common practice for largescale assessments to be scored using Item Response Theory
or Classical Test Theory in order to generate a total score and to use only these to report the
overall performances of learners on the assessment (Nichols 1994) Although this scoring and
7
reporting procedure is credited for being relatively quick and cost effective (Chudowsky amp
Pellegrino 2003) they serve merely to highlight that there is a problem but provide little
direction as to what the problem is (Nichols 1994) Foster Noyceand Speigel (2007) sum up
the criticism against total scores by stating that although they may reassure a schoolrsquos staff about
student progress or alert them to trouble ahead they do little to inform teachers about how
students are thinking what they understand where they are falling down and how specifically
teachers might change their own instructional practices to address studentsrsquo difficulties
The over simplistic representation of learner performances by total scores therefore lacks
the necessary insight on which to base remedial decisions (Nichols 1994) For this reason the
effectiveness of largescale assessments as a tool for improving education has been questioned
(Rogers 2014) For instance it is expected that educators and principles use results of largescale
assessments to improve their instructional practices (Rogers 2014) however in a study
conducted by Klinger and Rogers (2013) it was discovered that they in fact found little
direction from these results to do so This has led to an increased demand from those within the
field for these assessments to report more than only overall performances in the form of total
scores (Huff amp Goodman 2010 Nichols 1994 Rogers 2014) Detailed information from
assessments can help those in education including teachers and students identify content and
curricular areas that need attention (Schoenfeld 2007) and in so doing aide in the improvement
of education in disciplines where it is needed the most
212 Test Development Procedures
Largescale assessment organisations commonly adopt traditional unidimensional
frameworks to form the basis of test development procedures A unidimensional framework is
one that assumes a single factor or latent variable as an explanation for a certain behaviour such
8
as academic ability (Kaplan amp Saccuzzo 2007) However many curricular in practice today
have been developed on a multidimensional framework such as that of mathematics where
academic ability is assumed to consist of more than one skill or factor
Furthermore test development practices are performed taking into consideration certain
test constraints for instance test format which is usually paper-and-pencil based as well as
administration time For this reason it is impossible to include items to measure all curriculum
expectations in one test (Haertel amp Herman 2005) This sampling process of curriculum
expectations therefore also means that only few items for each expectation are included in the
assessment (Rogers 2014)
In addition to these test development procedures raising construct validity concerns
(Wilson 2007) they limit the reporting of test scores beyond anything more than overall total
scores As highlighted by Rogers (2014) since the assessment was never designed from an
explicit framework in line with that of curriculum expectations from the start as well as include
only a few items targeted at each subdomain it is highly unlikely that the assessment meets the
rigorous test properties needed to allow for reporting anything beyond that of total scores
In order to satisfy the many calls for change to reporting practices assessment
organisations would need to deviate from these traditional more cost effective practices For this
reason Chudowsky and Pellegrino (2003) indicate that change is unlikely to happen soon As a
result our efforts to improve education in disciplines where it is needed the most will continue
to take place within the confinements of that which assessment organisations refuse to change
22 Mathematics Education and Curriculum
The mathematical reform movement generated in the late 1950rsquos signaled the need for the
implementation of better teaching and learning practices for mathematics in schools (Friesen
9
2005) Today many mathematics curricular worldwide including that of Canada are based on
the Principles and Standards for School Mathematics as set out by the National Council of
Teachers of Mathematics (NCTM) (Friesen 2005) Very broadly curriculum refers to the
substance or content of teaching and learning it focusses on the ldquowhatrdquo of teaching and learning
as opposed to the ldquohowrdquo (Stein Remillard amp Smith 2007)
This NCTM document calls for the teaching and learning of mathematics with the goal of
developing both content or procedural knowledge and conceptual understanding of the
discipline through the application of essential thinking or processing skills such as problem
solving or reasoning skills which in turn will be developed (NCTM 2000) This goal for
mathematics education is in stark contrast to that of traditional goals where only the teaching and
learning of procedural or content knowledge was valued and taught through rote teaching and
learning practices (Schoenfeld 2007) Procedural knowledge refers to what and how to solve
certain mathematical problems whereas conceptual understanding refers to why a certain
problem is solved the way it is (Kilpatrick Swafford Findell amp NRC 2001)
Furthermore the NCTM adopted the view that standards play a leading role in guiding
the improvement of mathematics education (NCTM 2000) It therefore highlights specific
mathematical standards or expectations that learners should achieve Specifically five Content
Standards are used to guide the teaching and learning of procedural and conceptual knowledge
namely Number and Operations Algebra Geometry Measurement and Data Analysis and
Probability Five Process Standards also guide the essential processes or thinking skills of
Problem Solving Reasoning and Proof Communication Connections and Representation
(NCTM 2000) The NCTM (2000) repeatedly proclaims the interconnectedness of these
standards by indicating that procedural knowledge should never exist without conceptual
10
understanding which in turn should not be developed without the application and acquisition of
the essential processing skills
The Content and Process Standards are further classified into groups or categories for
assessment purposes in mathematics curricular such as that of Ontario Specifically the Ontario
Curriculum Grades 1-8 Mathematics 2005 document describes four categories of Knowledge
and Understanding Thinking Communication and Application to which the standards are
allocated These four categories are known as the Knowledge and Skills categories and are
reflected in the documentrsquos Achievement Chart The first category of Knowledge and
Understanding can be described as encompassing mathematical knowledge of content and
understanding and therefore focusses predominantly on the achievement of the Content
Standards The remaining three categories focus predominantly on the use of the Process
Standards The Thinking category assesses the use of problem solving reasoning and proving
processes the Communication category focusses on the assessment of the communicating
processes and lastly the Application category focusses on the assessment of the connecting
processes
From the above mathematics curriculum we can see that the knowledge base is still
considered important in mathematics education however so is conceptual understanding and the
application and acquisition of thinking skills As stated by Schoenfeld (2007) anyone who lacks
a solid grasp of facts procedures definitions and concepts is significantly handicapped in
mathematics yet there is more to being mathematically proficient than simply reproducing
standard content on demand Therefore if we are interested in understanding mathematical
proficiency as it is taught and learned today it is important that we reflect learner abilities in all
aspects of the discipline (Kilpatrick et al 2001) In so doing we will gain better insight into
11
their strengths and weaknesses allowing us to remediate accordingly in our efforts to improve
learner performances in this essential discipline
23 Factors Predicting Mathematical Performances
Given the relative importance of mathematics it is no surprise that much research has been
dedicated to highlighting and isolating the number or factors that can influence and predict
mathematical performances By doing so early interventions and remedial strategies can be
better targeted to improve future mathematical success (Hinton 2014)
One such factor that has been given much attention is that of language proficiency and its
influence on mathematical performances Studies conducted by Hinton (2014) Howie (2005)
and Abedi and Lord (2001) for instance discovered that learners who spoke English as a second
language performed worse in mathematical assessments compared to their English proficient
counterparts Fillmore (2007) however cautions against interpreting this as a lack of
mathematical ability without firstly taking into account the aspect of language Since much of
the mathematics taught today is presented in the form of a word problem it relies heavily on a
deep understanding of language (Moschovich 2007) Therefore trying to tease out precisely
how much of the struggle is related to a language issue and how much to an issue with
mathematics is a unique challenge for teachers assessment and English Language Learners
(ELLrsquos) (Fillmore 2007) As highlighted by Moschovich (2007) assessment is certainly a
complex task perhaps especially when working with students who are learning English It is
challenging to decide whether an utterance reflects a studentrsquos conceptual understanding a
studentrsquos proficiency in expressing their ideas in English or a combination of mathematical
understanding and English proficiency
12
Canada has a high and diverse immigrant population for instance 206 of its population
in 2011 was determined to be comprised of immigrants from various countries (Statistics
Canada 2016) Thus the mathematical performances of ELLrsquos cannot be ignored Fortunately
this aspect is currently given attention in the province of Ontario as assessment organizations
such as the EQAO do attempt to report separately on these learnersrsquo performances However
Jang Dunlop Wagner Kim and Gu (2013) warn against treating ELLrsquos as a homogenous group
Their study found that when taking into account the length of residence in Canada
performances of these students varied significantly concerning their reading proficiencies
Therefore if we wish to predict mathematical performances or gain better insight based on
student background such as language factors it is necessary to consider subpopulation groups
that make up the overall ELL population such as length of residence in the country
13
Chapter 3 Method
This chapter describes the participants instrument and data as well as the three main
analyses used to answer the questions presented in this study
31 Participants
The current study used data made available by the Education Quality and Accountability
Office (EQAO) of Ontario The EQAO is an arms-length Ontario government agency that is
responsible for developing and overseeing reading writing and mathematics assessments
administered to Grade 3 6 9 and 10 students in Ontario public schools The purpose of the
results of these largescale assessments is to determine the extent to which learners have achieved
the curriculum standards of the particular discipline for educational accountability and
improvement purposes (EQAO 2016)
Learnersrsquo responses are scored by the EQAO using Classical Test Theory and Item
Response Theory (Rogers 2013) to generate a score that is then converted into a Level NIE 1 2
3 or 4 Level 3 describes a performance at the provincial standard whereas Level 4 a
performance surpassing the standard Level 2 a performance approaching the standard and Level 1
a performance much below the standard Lastly a ldquoNIErdquo rating is generated for those learners
who have not provided sufficient evidence for a Level 1 score The EQAO test scores are reported
using these proficiency levels for each of the areas tested namely reading writing and
mathematics Background information such as gender time lived in Canada and student home
language etc is also collected by questionnaires administered by the EQAO over the same time
The full population data set comprised of approximately 127 302 Grade 6 learnersrsquo
responses to the English 20132014 provincial Junior Division assessment A random sample of
5000 learner responses to the assessment was drawn from the entire data set Learners with
missing data on any of the variables were excluded from the sampling process so that the final
14
data set contained responses to all mathematics items as well as background information All
learners within the sample were enrolled at the time in Grade 6 and attended various schools
across the province Table 1 below presents the distributions of student subgroups from the
random sample based on their gender language background and time spent in Canada in
comparison with the entire population The percentage of learners in each subgroup was very
closely aligned with the larger Grade 6 population and was therefore considered a representative
sample
Table 1
Final Random Sample used for the Analysis
Standard Gender Language Time lived in Canada
Met
Below
Female
Male
Non-
ESL
ESL
CA
Born
Non-CA
born lt 5
years
Non-CA
born ge 5
years
Frequency 2765 2235 2456 2544 4460 540 4493 199 308
Sample 553 447 491 519 892 108 899 4 62
Population 54 46 49 51 887 113 871 4 89
Notes N = 5000 Standard = met the provincial standard or achieved below the provincial standard ESL = enrolled in
English as a Second language program Time lived in Canada = Canadian born learners non-Canadian born learners
who have lived in Canada for less than 5 years and non-Canadian born learners who have lived in Canada for 5 years
or more
32 Instrument
Student responses to the mathematics test items and background information on the EQAO
20132014 Junior Division assessment were used for this study This assessment is a provincially
mandated largescale assessment used by the Ontario government to measure the extent to which
learners have achieved the standards as laid out in the curriculum All the EQAO largescale
assessments are designed using rigorous development procedures and meet high testing standards
with acceptably high reliabilities (Rogers 2013) of above 80 The Junior Division assessment is
15
specifically administered to all Grade 6 learners attending schools within the province of Ontario
during the months of May and June and under highly standardized conditions (EQAO 2016) The
assessment measures reading writing and mathematical skills in each of the corresponding
sections The mathematics section specifically consists of 36 items of which 28 are multiple choice
items and 8 are constructed-response format questions This study included only the 28 multiple
choice items
While the EQAO does not claim to measure the Knowledge and Skills categories as laid out
in the Ontario Curriculum Grades 1-8 Mathematics 2005 document (Rogers 2013) it still
references each of the mathematics items to one of three of the categories namely that of
Knowledge and Understanding Thinking and Application The category of Communication is not
represented by any of the items as according to Rogers (2013) this skill is not feasible to assess in
a paper-and-pencil based test For items to be referenced to the Knowledge and Understanding
category they need to be recognized as requiring students to demonstrate subject specific content
and comprehend its meaning Those referenced to the Application category need to be recognized
as requiring students to select an appropriate mathematical tool and apply the appropriate
information Lastly those referenced to the Thinking category need to be seen as requiring of
students to select and sequence a variety of tools and think critically in order to solve problems
(Rogers 2013) Items are scrutinized by teachers and other content experts for the process of
allocating items to the most appropriate category Items are further referenced to the five content
areas or strands of the curriculum document according to their content topic namely Number Sense
and Numeration Measurement Geometry and Spatial Sense Patterning and Algebra and Data
Management and Probability
Table 2 shows the representation of each of the Knowledge and Skills categories and the
strands to which the 28 multiple choice items were referenced by the EQAO as well as the item
difficulties (p-values) and discrimination indices (pt-biserial correlations) for each of these items
According to Kaplan and Saccuzzo (2007) item difficulty values should range from 30 to 70 to
16
maximize information about the differences among individuals Furthermore item discriminability
values should not be negative or below 20 to be considered adequate Based on these
recommendations all 28 items were considered suitable to be included in the analyses of this study
Table 2
Knowledge and Skills Categories Strands and Descriptive Statistics of 28 Mathematics Items
Item Know amp Skill Strand p-value pt-biserial
1 K and U Patterning amp Algebra 86 39
14 K and U Patterning amp Algebra 74 43
3 K and U Number Sense amp Numeration 76 37
15 K and U Number Sense amp Numeration 86 35
9 K and U Data Management amp Probability 48 33
19 K and U Measurement 50 27
25 K and U Measurement 76 40
22 K and U Geometry amp Spatial Sense 87 34
73 36
11 App Patterning amp Algebra 81 43
24 App Patterning amp Algebra 70 37
26 App Patterning amp Algebra 40 30
5 App Number Sense amp Numeration 56 38
7 App Number Sense amp Numeration 82 30
10 App Data Management amp Probability 55 47
18 App Data Management amp Probability 78 47
23 App Data Management amp Probability 71 42
2 App Measurement 59 31
8 App Measurement 58 28
20 App Measurement 54 47
6 App Geometry amp Spatial Sense 68 38
64 38
17 Think Patterning amp Algebra 52 36
21 Think Number Sense amp Numeration 57 22
28 Think Number Sense amp Numeration 69 33
4 Think Data Management amp Probability 46 35
13 Think Measurement 54 39
27 Think Measurement 41 46
12 Think Geometry amp Spatial Sense 42 35
16 Think Geometry amp Spatial Sense 54 34
52 35
Notes K and U = Knowledge amp Understanding App = Application Think = Thinking p-value and pt-biserial means
for each Knowledge amp Skill category represented in bold
17
No items had p-values below 30 however 10 items had difficulty values above 70
indicating that they were relatively easy for this sample Since none of the p-values were above
90 they were considered to still possess sufficient variability to be included in the analyses
Furthermore no items had values below the recommended 20 or negative pt-biserial values Table
2 further highlights the item difficulty and discrimination means for each of the three categories
From these values it can be concluded that the items referenced to the Knowledge and
Understanding category were relatively more easy for this sample while those items referenced to
the Thinking category more difficult and those referenced to the Application category moderately
difficult Lastly it is highlighted that a greater number of items represented the Application
category (12 items) than the Knowledge and Understanding and Thinking category which had an
equal number of eight items
33 Data Analysis
The data analyses involved three phases each of which addressed one of the three questions
asked in this study The first phase used Exploratory Factor Analysis (EFA) approaches to
examine the first research question ldquoWhat characterizes the dimensionality of the EQAO
mathematics achievement test administered to Grade 6 students in Ontario public schoolsrdquo
Latent Class Analysis (LCA) approaches were used in the second phase in order to answer question
two ldquoIn which mathematical dimensions and related strands do students demonstrate strengths and
weaknesses in their mathematical achievementrdquo A multinomial logistic regression analysis was
performed to examine research question three ldquoTo what extent are mathematics performance
profiles predicted by student background such as language and length of residence statusrdquo
331 Phase 1 Establishing the Dimensionality of the Assessment
An Exploratory Factor Analysis (EFA) was conducted in order to determine the
dimensionality of the EQAO Grade 6 mathematics test based on 5000 studentsrsquo responses to 28
multiple choice items Although exploratory in nature the EFA was used to examine the extent
18
to which the test dimensionality can be accounted for by knowledge and skills and further by the
strand specified by the EQAO
EFA is a statistical procedure that simplifies the process of visually inspecting a range of
correlations in order to examine the dimensionality of measures (Furr 2011) The 28 multiple
choice items were firstly recoded as binary data thus creating dichotomous categories (0 =
incorrect responses and 1 = correct responses) In order to perform an EFA with this type of
data a more sophisticated statistical software package is required The reason for this being that
standard software such as IBMrsquos SPSS (version 230) creates correlation matrices suitable only
for continuous data that assume a normal distribution (Uebersax 2015) Therefore MPLUS
version 612 (Mutheacuten amp Mutheacuten 1998-2012) was used for the analysis so that a tetrachoric
correlation matrix could be generated to suite the binary data used in this study
When conducting an EFA in Mplus a correlation matrix eigenvalues and model fitting
statistics such as the chi-square test Root Mean Square Error of Approximation (RMSEA) and
Root Mean Square Residual (RMSR) are produced in order to assist with the process of
determining the solution that best fits the data A good fitting model will be represented by a
non-significant chi-square p-value as well as a RMSEA value and RMSR value of below 05
(Schumacker amp Lomax 2004) However interpretability of the model should also be taken into
consideration when deciding on the best solution (Meyers Gamst amp Guarino 2013) The
weighted least-squares with mean (wlsm) estimation method as recommended by Mutheacuten and
Mutheacuten (1998-2012) for binary data and the oblique rotation method (Promax) was used for this
analysis based on the assumption that factors are likely to be correlated with each other
Four steps were implemented during this phase The first step entailed determining the
ideal number of factors to be extracted to best describe the data This entailed a combined
evaluation of the correlation matrix eigenvalues scree plot and fit statistics as described above
The next step entailed an evaluation of the items and their loadings on each of the factors to
determine if any should be discarded in terms of low factor loadings or cross-loadings If any
19
items were deemed unacceptable these were removed and the analysis re-run and subsequently
re-evaluated This step was repeated until a final and appropriate factor solution model was
obtained Following this the reliability for each factor was established followed by an
investigation of the factor correlations in order to determine the uniqueness of each extracted
dimension Ideally items should correlate highly with each other within each extracted
factordimension however for each dimension to be considered unique between-factor
correlations should be low (Rogers 2014) According to Meyers et al (2013) between-factor
correlations should not exceed 80 to warrant the use of a separate dimension The last step
involved an investigation of the similarities between items in each factor in order to describe the
items that make up each This was done firstly in terms of the three Knowledge and Skills
categories and secondly the five strands to which the items were referenced as well as any
further content similarities
332 Phase 2 Identifying Mathematical Strengths and Weaknesses
In an attempt to identify in which mathematical subdomains or dimensions and related
strands learner performances were strongest and weakest as asked in question two of this study a
Latent Class Analysis (LCA) was performed using MPLUS version 612 (Mutheacuten amp Mutheacuten
1998-2012)
Specifically the goal of a mixture model is to reveal unobserved heterogeneous and
meaningful population groups within the larger homogenous population by identifying similarities
in their responses to measured variables (Nylund Asparouhov amp Mutheacuten 2007) These identified
latent populations or sub-groups are called classes Therefore using this analysis allowed for the
generation of distinct performance profiles for each sub-group or class identified as performing
similarly in the largescale assessment In this way more accurate class specific strengths and
weaknesses could be described as opposed to simply those of the overall Grade 6 population
20
For an LCA the outcome variables used are specifically categorical (Nylund et al 2007)
Therefore dichotomously scored response data from the random sample of 5000 students were
used for the LCA The LCA approach is exploratory in nature because the optimal number of
classes representing all latent classes cannot be determined apriori (Nylund et al 2007) Therefore
an investigation of relevant fit statistics generated by the LCA was firstly conducted According to
Pastor Barron Miller and Davis (2007) the fit statistics commonly used to determine the optimum
number of classes include the Bayesian Information Criterion (BIC) the sample-size adjusted BIC
and the Akaike Information Criterion (AIC) where lower values indicate a better fitting model An
Entropy statistic is also commonly used to determine model fit This statistic ranges from 0 to 1
where values closest to 1 indicate higher classification accuracy
Following the identification of the best fitting model the entire sample was profiled in
terms of distinct mathematics classes In order to reduce the number of points on these profiles
items were grouped according to the strand to which they were referenced by EQAO within each
identified factor This allowed for the identification of learner strengths and weaknesses not only
surrounding factors but also each strand within each factor
As part of the LCA mean item probability scores are calculated for each class This statistic
indicates the mean probability for each class to respond correctly to an item and therefore ranges
from 0 to 1 (Nylund et al 2007) Values closest to one therefore indicate a higher probability of
responding correctly to an item Using these values for each item average item-group probability
scores were calculated and these values were then used to describe class specific strengths and
weaknesses This was done firstly by describing overall item-group performances in comparison
to other classes and secondly by describing class performances in each specific factor overall and
lastly in terms of each strand within each factor
21
333 Phase 3 Predicting Class and Profile Membership
In order to answer question three concerning whether or not English as a second language
and length of residence in Canada significantly predicted the performance profile to which a
learner belongs a multinomial logistics regression analysis was conducted This phase was
completed using IBMrsquos SPSS (version 230)
A multinomial logistic regression is used when the dependent variable for the analysis
consists of more than two categorical levels (Meyers et al 2013) Besides the item probability
mean generated by the LCA a class probability mean for each learner in the sample is also
calculated as part of the analysis This class probability indicates the likelihood of a learner
belonging to each of the classes or performance profiles Based on the highest class probability
learners were allocated to one of the performance profiles as generated in phase 2 These classes
were coded 1 2 3 etc based on the number of classes determined to best describe the sample and
represented the dependent or predicted variable of the analysis
Table 3
Six Groups Created Based on English as Second Language and Time Lived in Canada
Group Language Time lived in Canada n
1 Non-ESL CA born 4185 837
2 ESL CA born 308 62
3 Non-ESL Non-CA born lt 5 years 76 15
4 ESL Non-CA born lt 5 years 123 25
5 Non-ESL Non-CA born ge 5 years 199 40
6 ESL Non-CA born ge 5 years 109 22
Notes N = 5000 ESL = English as a second language learner CA born = Born in Canada
An independent variable used for predicting the latent class membership included six
groups based on the following background variables English Second Language (ESL) status as
22
well as whether or not they were Canadian born non-Canadian born but at the time had resided in
the country for less than 5 years or non-Canadian born but at the time had resided in the country for
five years or more This was done in order to avoid clustering ELL learners as a homogenous group
and therefore better identify learners These six categorical data groups represented the predictor
or independent variable Table 3 indicates more precisely how each of the groups were created as
well as their sizes
23
Chapter 4 Results
The results of this study are discussed according to the three questions presented and phases
of data analyses as discussed in Chapter 3 Firstly the results produced from the Exploratory
Factor Analysis (EFA) described in phase one concerning question one are reported Secondly
those produced by the Latent Class Analysis (LCA) in phase two to answer question two and lastly
those produced from the multinomial logistics regression analysis conducted in phase three to
answer question three are presented in this chapter
41 Dimensionality Characteristics
As noted an EFA was conducted on the 28 multiple choice mathematics items in order to
determine the dimensionality of the largescale assessment to which they belonged The
eigenvalues of the tetrachoric correlation matrix (Table 4) produced by Mplus ranged between
862 and 41 the first three factors showed eigenvalues greater than 1 and accounted for 3953 of
the total variance
Table 4
Eigenvalues of Correlation Matrix indicating Total Variance Explained
Item Eigenvalue Item Eigenvalue Item Eigenvalue Item Eigenvalue
1 86 2 13 3 10 4 93
5 91 6 90 7 87 8 85
9 84 10 80 11 79 12 76
13 74 14 72 15 70 16 69
17 66 18 65 19 64 20 63
21 60 22 57 23 53 24 52
25 50 26 49 27 46 28 41
24
411 Determining the Best Fitting Factor Solution Model
The eigenvalues scree plot and fit statistics were used to determine the best number of
factors to describe this data set Based on the ldquonumber of eigenvalues greater and equal to one
rulerdquo as suggested by Meyers et al (2013) together with the scree plot and relevant fit statistics it
seemed adequate to extract three factors albeit accounting for less than 50 of the variance
Figure 1 Scree plot
Although three eigenvalues were produced greater and equal to one suggesting the
existence of three factors this was contradicted by the scree plot (Figure 1) which suggested the
existence of only two factors as it appeared to level off mostly at number three Subsequently a
comparison of the one to three factor solutions was conducted in terms of the relevant fit statistics
as described in Table 5
The significant chi-square p-values (lt 001) generated for the one and two factor solutions
suggested that the data differed significantly from the model matrix Although the chi-square p-
value has been criticized in the past for being overly sensitive to large sample sizes and therefore
0
05
1
15
2
25
3
35
4
45
5
55
6
65
7
75
8
85
9
1 2 3 4 5 6 7 8 9 10 11 12 13 14 15 16 17 18 19 20 21 22 23 24 25 26 27 28
Eig
envalu
es
Items
25
almost always producing a significant value (Meyers et al 2013) this was determined not to be the
case for this analysis as the p-value generated in the three factor model increased substantially
from the one to two factor model thus ensuring the reliability of this value
Table 5
EFA Model Fit Statistics of the 1 to 3 Factor Solutions on 28 Mathematics Items
FA model Chi-Square df p-value RMSEA RMSR
1 92476 350 lt 001 018 031
2 44012 323 lt001 009 021
3 34390 297 032 006 019
Note N = 5000
Therefore since the Chi-square p-value of 032 of the three factor model was not significant
(at the 001 probability level) as well as the fact that only two items represented the fourth factor in
the four factor solution model it was deemed a good fitting model The values of 006 and 019 of
the RMSEA and RMSR respectively were well below the 05 recommended value providing
further support for this three factor solution model
A further inspection of the factor loadings from the three-factor solution as well as of the
items on each factor resulted in the removal of four items (ie 12 18 23 and 24) Items 18 23 and
24 were discarded as a result of low factor loading scores below 30 Whereas a decision was made
to remove Item 12 as it was the only item referenced to the Thinking category that did not load on
the factors in the same way that the others did Table 6 presents the final factor loadings with the
Knowledge and Skills categories to which items were originally allocated by the EQAO that is
knowledge and understanding application and thinking
The Promax factor correlation matrix produced by Mplus (Table 7) revealed that all three
factors correlated positively and moderately to high with one another The strongest correlation
26
existed between Factor 1 and Factor 3 with a relatively high coefficient value of 747 while the
weakest correlation existed between Factor 1 and Factor 2 with a coefficient of 576
Table 6
Factor Loadings of the 23 Items used in the Final 3 Factor Solution Model
Item Knowledge amp Skill Factor 1 Factor 2 Factor 3
1 KU 64 -09 13
11 App 63 -04 12
14 KU 55 13 01
6 App 51 12 -04
15 KU 51 -05 14
10 App 47 23 05
7 App 45 -12 13
25 KU 38 09 17
3 KU 35 -01 24
9 KU 35 09 07
22 KU 31 07 23
5 APP 30 09 22
13 App 10 65 -05
27 Think -04 63 23
2 Think -07 50 12
20 App 14 -03 59
17 Think -04 04 55
26 App 13 01 33
8 App 11 -01 32
28 Think 15 03 32
16 Think 11 10 31
4 Think 14 12 30
21 Think -04 08 30
α = 725 α = 536 α = 565
Notes KU = Knowledge and Understanding App = Application Think = Thinking category
As stated earlier according to Meyers et al (2013) correlations should not exceed 80 to warrant
the use of separate factors These results are therefore considered to reveal the existence of three
27
unique factors that can be used to describe the multidimensionality of these mathematics multiple
choice items
Table 7
Promax Factor Correlations Between 3 Factors
Factors FA 1 FA 2
Factor 1
Factor 2 576
Factor 3 747 626
Note N = 5000
As indicated in Table 6 Factor 1 consisted of 12 items in total with factor loading scores
ranging between 30 and 64 and achieved a relatively high Cronbachrsquos alpha of 725 All seven
items referenced to the Knowledge and Understanding category used in the final model loaded
together on Factor 1 along with five items referenced to the Application category Factor 2
consisted of only three items with factor loading scores ranging between 50 and 63 and
achieved a moderate Cronbachrsquos alpha of 536 In Factor 2 two items referenced to the Thinking
category and one to the Application category loaded together to make up the total of three items
for this factor Lastly Factor 3 consisted of a total of eight items with factor loading scores
ranging between 30 and 59 and also achieved a moderate Cronbachrsquos alpha score of 565 The
remaining five items referenced to the Thinking category and three items referenced to the
Application category loaded together to make up the eight items that loaded together on Factor 3
In terms of the strands to which the items in Factor 1 were referenced for instance
Patterning and Algebra etc no clear similarities appeared to exist to tie all the items together
based on this However similarities seemed to exist in terms of the applied skill requested of
learners to solve the mathematical problems It appeared that all the items of this factor merely
requested of learners to apply their mathematical knowledge in terms of procedures and
conceptual understanding to answer the questions For instance Item 15 which is referenced to
28
the Knowledge and Understanding category asks the following ldquoWhat is the value of 0730 ndash
0156rdquo Whereas Item 5 which is referenced to the Application category asks that learners
solve problems involving the addition of decimal numbers (the exact question was not released)
Therefore it was determined that no clear difference existed between the applied skill requested
from these two items even though they were referenced to two different Knowledge and Skills
categories It was therefore concluded that Factor 1 could be described as measuring the
application of mathematical knowledge to solve problems in various strands
An inspection of the items that loaded together on Factor 2 revealed that two of the items
were referenced to the Thinking category while one of the items was referenced to the
Application category Furthermore all three items were similar in that that they covered the
ldquoMeasurementrdquo strand and more specifically that all three items requested of learners to solve
problems relating to ldquoAreardquo Item 2 for instance asks ldquoThe parallelogram below will be cut
into two congruent triangles (provides dimensions) What is the area of one of the trianglesrdquo
Item 13 asks ldquoWhich of the following shows a rectangle and a triangle that have the same areardquo
and lastly Item 27 requests that learners compare the areas of two polygons (exact item not
released) Item 2 was referenced to the Application category whereas Items 13 and 27 were
referenced to the Thinking category It was therefore determined that Factor 2 could be
described as requesting of learners to apply thinking processes or skills such as problem solving
and reasoning in order to solve deeper mathematical problems specifically surrounding the
Measurement topic of ldquoAreardquo
Lastly for Factor 3 as with Factor 1 no clear similarities appeared to exist to tie all the
items together based on strands However as with Factor 1 similarities seemed to exist in terms
of the applied skill requested of learners to solve the mathematical problems It appeared that
all the items on this factor requested of learners to apply thinking skills to solve deeper
mathematical problems surrounding various strands in other words learners had to go beyond
the mere application of content knowledge to solve these items For instance Item 20 referenced
29
to the Application category requested that learners solve the following problem ldquoEach beaker of
water below has a capacity of 2L Which beaker appears to have about 500ml of water in itrdquo
Whereas Item 28 referenced to the Thinking category asks ldquoMrs Garrett sends surveys to 120
students and 78 students return the survey Which statement best describes the percent of
students who return the surveyrdquo Again no clear difference appeared to exist between the
applied skill requested of learners in terms of the Application and Thinking categories to which
the items were referenced It was therefore concluded that Factor 3 could be described as
measuring the ability of learners to apply thinking processes or skills such as problem solving
and reasoning in order to solve deeper mathematical problems in various strands
In sum the results of the EFA determined that a three factor model could be used to
adequately characterize the dimensionality of the multiple choice mathematics items on the
EQAO assessment Twelve items clustered adequately together in terms of factor loading scores
to form Factor 1 which achieved a relatively high Cronbachrsquos alpha of 725 three items on
Factor 2 which achieved a moderate Cronbachrsquos alpha of 536 and lastly eight items on Factor
3 which also achieved a moderate Cronbachrsquos alpha score of 565 Upon closer inspection of
the items on each factor and in terms of the Knowledge and Skills categories and strands to
which they were referenced by the EQAO it was determined that Factor 1 could be best
described as measuring the ability of learners to apply mathematical knowledge related to
procedural and conceptual understanding in order to solve problems in various mathematical
strands Factor 2 could be best described as measuring the ability of learners to apply process
or thinking skills in order to solve problems related specifically to the topic of ldquoAreardquo
Lastly Factor 3 could be best described as measuring the ability of learners to apply thinking
skills in various mathematical strands
30
42 Mathematical Strengths and Weaknesses
In an attempt to identify in which mathematical dimensions and related strands Grade 6
learner performances were strongest and weakest as asked in question two of this study a Latent
Class Analysis (LCA) was conducted This allowed for distinct performance profiles to be
generated for classes or sub-groups performing similarly in the population and therefore allowed
for more accurate descriptions of strengths and weaknesses The factors as established in the
dimensionality investigation in Phase 1 of this study were used to represent the dimensions for this
analysis
Although the four class model achieved the lowest AIC BIC and Sample-Size Adjusted
BIC statistic values in comparison to the two and three class model it also produced a much lower
Entropy value of 69 (see Table 8) Therefore it was decided that since these statistics did not
decrease that much from the three class to four class model the use of the four class model with a
much lower Entropy value did not seem warranted Thus the three class model was opted for
instead as it produced lower fit statistics than the two class model as well as a sufficiently high
Entropy value of 75 Furthermore the results indicated that each class was represented by the
following proportion of learners from the sample Class 1 comprised of 321 Class 2 of 452
and Class 3 of 227
Table 8
LCA Fit Statistics for 2 3 and 4 Classes
Fit statistics 2 Classes 3 Classes 4 Classes
AIC 12974224 12808557 12789120
BIC 13004854 12854829 12851034
Adj BIC 12989919 12832268 12820846
Entropy 81 75 69
Notes N = 5000 AIC = Akaike Information Criterion BIC = Bayesian Information Criterion Adj BIC = Sample-
Size Adjusted Bayesian Information Criterion
31
Eleven item-groups were created to describe the strengths and weaknesses of the three
classes as represented in Table 9 Item-groups were created by grouping items according to the
factor they were determined to measure (as established in the EFA) as well as the strand to which
they were allocated by the EQAO Five item-groups were created for Factor 1 one item-group for
Factor 2 and five groups for Factor 3 The number of items within each item-group varied from 1
item to 4 items The mean probability scores calculated for each class for each item-group and
overall dimension or factor are also represented in Table 9 These mean item-group probability
scores as presented in Table 9 were used to plot three distinct performance profiles for each class as
represented in Figure 2 below
Table 9
Item-Groups created to Describe Mathematical Performances of Grade 6 Learners
Factor Content Area of items Class 1 Class 2 Class 3
1 Patterning amp Algebra 3 97 86 48
1 Measurement 1 95 78 44
1 Geometry amp Spatial Sense 2 94 79 50
1 Number Sense amp Numeration 4 92 76 49
1 Data Management amp Probability 2 78 49 19
Factor 1 class probability means 91 74 44
2 Measurement (Area) 3 85 39 28
Factor 2 class probability means 85 39 28
3 Patterning amp Algebra 2 67 43 20
3 Measurement 2 79 55 25
3 Geometry amp Spatial Sense 1 79 47 31
3 Number Sense amp Numeration 2 80 60 44
3 Data Management amp Probability 1 72 40 22
Factor 3 class probability means 76 51 29
Note The factor probability means presented in bold are slightly higher as the actual item probability score was used
to calculate these values and not the item-group probability scores
Using the evidence generated from the mean item-group and factor probability scores as
represented in Table 9 and Figure 2 these performance profiles were used to describe the strengths
32
and weaknesses of each class Class specific strengths and weaknesses were described according
to firstly overall performances in the 11 item-groups in comparison to the other classes secondly
in terms of overall performances in each dimension (Factor 1 2 and 3) and lastly in terms of
performances in each strand within each dimension for Factor 1 and 3 only (as Factor 2 only
represented Measurement topic of ldquoAreardquo) A mean item-group probability score ranging from 86
- 10 was described as especially strong 71 - 85 as strong and 56 - 70 as moderately strong
while those scores ranging from 41 - 55 were described as moderately weak 26 - 40 as
moderately weak and 25 and below as especially weak
Figure 2 Three performance profiles of Grade 6 learners in 11 mathematical item-groups
Results indicated that those learners most likely to belong to Class 1 performed higher than
Class 2 and 3 in all item-groups Therefore this class to which 321 of learners from the sample
belonged can be best described as the highest performing and second largest group overall Those
most likely to belong to this class can be described as having an especially strong ability to apply
0
01
02
03
04
05
06
07
08
09
1
Item
-Gro
up
Mea
n P
rob
ab
ilit
y
Item-Groups
Class 1 (321) Class 2 (452) Class 3 (227)
33
mathematical knowledge in order to solve problems in various strands This was determined by the
average 91 overall probability for success achieved for those items related to Factor 1 They can
also be described as having a strong ability to apply thinking skills in order to solve problems
surrounding the Measurement topic of ldquoAreardquo and strong ability to do the same in various strands
This was determined by the 85 probability for success achieved for those items related to Factor
2 and 76 probability for success achieved for those related to Factor 3 Furthermore their overall
performances in the knowledge dimension can be described as stronger in comparison to their
performances in the thinking dimensions
Specifically concerning their ability to apply mathematical knowledge in various strands
(Factor 1) these learners can be described as performing slightly stronger in the Patterning and
Algebra (item-group probability score = 97) and considerably weaker in Data Management and
Probability (item-group probability score = 78) in relation to their performances in the other
strands Specifically regarding their ability to apply think skills in order to solve problems (Factor
3) they can be described as performing slightly stronger in Number Sense and Numeration (item-
group probability score = 80) and considerably weaker in Data Management and Probability (item-
group probability score = 72) and Patterning and Algebra (item-group probability score = 67) with
the latter being the weakest in relation to their performances in the other strands
Results further indicated that those learners most likely to belong to Class 2 performed
overall lower than Class 1 but higher than Class 3 in all item-groups Therefore this class to
which 452 of the learners belonged can be best described as the intermediate performing and
largest group overall Those most likely to belong to this class can be described as having a strong
ability to apply mathematical knowledge in order to solve problems in various strands This was
determined by the average 74 overall probability for success achieved for those items related to
Factor 1 They can also be described as having a weak ability to apply thinking skills in order to
solve problems surrounding the Measurement topic of ldquoAreardquo and moderately weak ability to do
the same in various strands This was determined by the 39 probability for success achieved for
34
those items related to Factor 2 and 51 probability for success achieved for those related to Factor
3 Furthermore their overall performances in the knowledge dimension can be described as
stronger in comparison to their performances in the thinking dimensions
Specifically concerning their ability to apply mathematical knowledge in various strands
(Factor 1) performances for these learners can be described as considerably stronger in Patterning
and Algebra (item-group probability score = 86) and considerably weaker in Data Management
and Probability (item-group probability score = 49) in relation to their performances in the other
strands Specifically regarding their ability to apply thinking skills in order to solve problems
(Factor 3) performances can be described as stronger in Number Sense and Numeration (item-
group probability score = 60) and considerably weaker in Data Management and Probability (item-
group probability score = 40) and Patterning and Algebra (item-group probability score = 43) with
the former being the weakest in relation to their performances in the other strands
Lastly results indicated that those learners most likely to belong to Class 3 performed lower
than Class 1 and 2 in all item-groups Therefore this class to which 227 of learners belonged
can be best described as the lowest performing group overall Those most likely to belong to this
class can be described as having a moderately weak ability to apply mathematical knowledge in
order to solve problems in various strands This was determined by the average 44 overall
probability for success achieved for those items related to Factor 1 They can also be described as
having a weak ability to apply thinking skills in order to solve problems surrounding the
Measurement topic of ldquoAreardquo and weak ability to do the same in various strands This was
determined by the 28 probability for success achieved for those items related to Factor 2 and
29 probability for success achieved for those related to Factor 3 Furthermore their overall
performances in the knowledge dimension can be described as stronger in comparison to their
performances in the thinking dimensions
Specifically concerning their ability to apply mathematical knowledge in various strands
(Factor 1) it was determined that these learners can be described as performing slightly stronger in
35
Geometry and Spatial Sense (item-group probability score = 50) and considerably weaker in Data
Management and Probability (item-group probability score = 19) in relation to their performances
in the other strands Specifically regarding their ability to apply thinking skills in order to solve
problems (Factor 3) their performance can be described as considerably stronger in Number Sense
and Numeration (item-group probability score = 44) and weaker in Data Management and
Probability (item-group probability score = 22) and Patterning and Algebra (item-group
probability score = 20) with the latter being the weakest in relation to their performances in the
other strands
In sum the results of the LCA revealed that three classes could be used to best describe the
performances of Grade 6 learners in the three dimensions as established during the EFA and their
related strands Class 1 was described as the highest performing and second largest group The
learners in the class were described as performing especially strong in Factor 1 (namely their
ability to apply mathematical knowledge to solve problems in various strands) strong in Factor 2
(namely their ability to apply thinking skills to solve problems specifically related to the
Measurement topic of ldquoAreardquo) and in Factor 3 (namely their ability to apply thinking skills in order
to solve problems in various strands) Class 2 was described as the intermediate performing and
largest group and performing strong for Factor 1 weak for Factor 2 and moderately weak for
Factor 3 Lastly Class 3 was described as the lowest performing and smallest group and
performing moderately weak for Factor 1 and weak for both Factor 2 and 3 For all classes overall
factor performances were described as weaker in the thinking dimensions namely Factor 2 and 3
than in the knowledge dimension namely Factor 1 A greater discrepancy between these
mathematical knowledges and thinking skills dimensions appears to exist for those in Class 2 than
for those in Class 1 and 3
Lastly in terms of describing the performances of each class in the strands related to each
factor for Factor 1 and 3 results revealed clear similarities between all classes in terms of those in
which performances were described as weaker For all classes regarding Factor 1 their ability to
36
apply mathematical knowledge within the Data Management and Probability strand was described
as the weakest in relation to the other strands For all classes regarding Factor 3 their ability to
apply thinking skills in the Patterning and Algebra and Data Management and Probability strand
was described as weakest in relation to their performances in the other strands
43 Predicting Mathematics Profiles by Language and Length of Residence Background
To avoid treating learners as homogenous groups based on their language background they
were allocated to one of six groups according to their ESL designation and length of residency in
Canada The six groups represented the predictor variable (independent variable) whereas the three
classes or performance profiles were treated as the predicted or dependent variable Class 1
namely the highest performing profile group was used as the reference category
Results of this analysis indicated that the final model did not significantly predict class and
performance profile membership with a -2 Log likelihood of 7740 and a Chi-square value of 957
(10 N = 5000) p = 48 The upper portion of Table 10 presents the regression coefficients the
Wald test adjusted odds ratio [Exp(B)] and the 95 confidence intervals (CI) for odds ratios for
the predictor contrasting Class 2 to Class 1 The lower portion of the table presents the regression
coefficients the Wald test adjusted odds ratio [Exp(B)] and the 95 confidence intervals (CI) for
odds ratios for the predictor contrasting Class 3 to Class 1
Results therefore revealed that ESL status and residence in Canada did not significantly
predict class or profile membership regardless of group allocation In other words regardless of
group allocation learners were found to be equally likely to belong to either Class 1 (highest
performing group) Class 2 (intermediate performing group) or Class 3 (lowest performing group)
and therefore perform according to the related profile as indicated earlier in Figure 2
37
Table 10
Parameter Estimates for Six Groups on 3 Classes
Model B SE - B Wald df Exp(B) 95 CI EXP (B)
Class 2
Intercept 43 23 351 1
Group 1 -07 23 09 1 93 60 ndash 147
Group 2 06 26 06 1 107 64 ndash 178
Group 3 -60 35 296 1 55 277 ndash 109
Group 4 01 31 00 1 101 55 ndash 183
Group 5 -08 28 09 1 92 54 ndash 158
Class 3
Intercept -13 26 27 1
Group 1 -23 26 74 1 80 48 ndash 133
Group 2 -20 31 42 1 82 47 ndash 149
Group 3 -36 39 84 1 70 33 ndash 150
Group 4 -35 37 92 1 70 34 ndash 144
Group 5 -53 33 255 1 59 31 ndash 113
Notes p lt 001 N = 5000 Class 1 is the reference category Group 1 = Non-ESL CA Born (n = 4185) Group 2 =
ESL CA Born (n = 308) Group 3 = Non-ESL Non-CA born but living in country less than 5 years (n = 76) Group 4
= ESL Non-CA born but living in country less than 5 years (n = 123) Group 5 = Non-ESL Non-CA born but living in
country 5 years or more (n = 199) Group 6 = ESL Non-CA born but living in country 5 years or more (n = 109)
38
Chapter 5 Discussion
The purpose of this study was to move beyond the total scores of a largescale assessment
in order to gain better insight into the mathematical performances of Ontariorsquos Grade 6 learners
In doing so it aimed to provide evidence of learner strengths and weaknesses in different aspects
of mathematics education on which to base remedial decisions for the improvement thereof
Using the responses of a random sample of 5000 Grade 6 learners to 28 multiple choice
mathematics items on the 20132014 EQAO Junior Division assessment an Exploratory Factor
Analysis (EFA) was firstly performed in order to investigate the dimensionality characteristics
of the assessment This was followed by a Latent Class Analysis (LCA) to determine learner
strengths and weaknesses related to the established mathematical dimensions and their related
strands Lastly a multinomial logistic regression analysis was performed in order to examine the
extent to which mathematics performance profiles were predicted by student background factors
such as language and length of residency in Canada This chapter discusses the findings of these
analyses study limitations and lastly recommendations for future research and education
51 What Characterizes the Dimensionality of the EQAO Mathematics Achievement Test Administered to Grade 6 Students in Ontario Public Schools
The multiple choice mathematics items on the EQAO assessment were characterized as
measuring the ability of learners in three interrelated yet separate mathematical dimensions
These being the ability of learners to apply mathematical knowledge related to procedural
knowledge and conceptual understanding to solve problems in various strands (Factor 1) the
ability to apply process or thinking skills such as problem solving or reasoning skills to solve
problems in ldquoAreardquo (Factor 2) and lastly the ability to apply process or thinking skills to solve
39
problems in various mathematical strands The three factors produced achieved on average
moderate reliability scores
These findings regarding the characteristics of the dimensions were considered valuable
as they allowed for the comparison of learner abilities in two essential elements of mathematical
proficiency as aligned with the Principles and Standards for School Mathematics (NCTM
2000) and as a result also with the Ontario mathematics curriculum which shares the same
foundations Only once this happens namely learner ability measured directly in relation with
mathematical curriculum expectations can we begin an effective process of remediation
(Kilpatrick et al 2001) These elements were that of mathematical knowledge consisting of
procedural and conceptual knowledge as measured by Factor 1 of this study and process or
thinking skills such as problem solving and reasoning as measured by Factor 2 and 3 Factor 2
and 3 were determined to differ based solely on the content of the items included in the
assessment This finding highlights concerns regarding the fair representation of all curriculum
expectations on the assessment and thus warrants further investigation
The fact that the ability to apply mathematical knowledge and the ability to apply
thinking skills in order to solve mathematical problems were found to be sufficiently unique
dimensions to warrant their use using the multiple choice items on this largescale mathematics
assessment adds further value to the findings of this study These findings are valuable in that
they attest to the future potential for assessment organizations to report learner performances
beyond that of total scores as demanded by those in the educational field However since the
factors achieved only moderate reliability scores we are reminded of the need for these tests to
be designed upon foundations aligned with those of the curriculum expectations they are
employed to assess from the start in order for them to meet better test properties (Chudowsky amp
Pellegrino 2003 Rogers 2014)
40
52 In which Mathematical Dimensions and Related Strands do Students Demonstrate Strengths and Weaknesses in their Mathematical Achievement
Three classes were determined to best describe the performances of all Grade 6 learners
in the established dimensions and their related strands Class 1 was described as the highest
performing and second largest group consisting of 321 of the learners Class 2 was described
as the intermediate performing and largest group consisting of 452 of the learners and lastly
Class 3 was described as the lowest performing and smallest group consisting of only 227 of
the learners from the sample
The results of this analysis further revealed that all three classes performed weaker in
their ability to apply thinking skills in order to solve problems either specifically surrounding
the topic of Area or in various strands than in their ability to apply mathematical knowledge in
order to do the same The performances of those in Class 1 were described as especially strong
in the mathematical knowledge dimension (Factor 1) and strong in the thinking dimensions
(Factor 2 and 3) Class 2 was described as strong in the mathematical knowledge dimension but
weak in the thinking skills dimensions and lastly Class 3 was described as moderately weak in
the mathematical knowledge and thinking skills dimensions The discrepancy between
performances in the two subdomains namely mathematical knowledge and thinking skills thus
appeared to be largest for those in Class 2 the intermediate performing and largest group
The findings concerning the overall performances of students in the two subdomains of
mathematical knowledge and thinking skills aligns with those concerning the performances of
US students as described by Kilpatrick et al (2001) They highlight that research evidence over
the past 30 years has consistently indicated that although US students do not fare badly in
applying their knowledge to solve basic mathematical problems they tend to have a limited
41
understanding of mathematical concepts and are noticeably deficient in their ability to apply
mathematical thinking skills to solve even simple problems
It may however be argued that this finding namely a weaker performance in thinking
skills than mathematical knowledge is to be expected given the fact that applying thinking skills
in order to solve problems is a more challenging task than simply applying what you know
(Schoenfeld 2007) However studies have also found that a strong mathematical knowledge
base leads to a better ability to apply thinking skills to solve deeper problems (Stokke 2015)
Thus given the inter-relatedness of these two dimensions together with the large discrepancy
between them for those in Class 2 (strong mathematical knowledge but weak thinking skills)
these findings demonstrate a weakness in the majority of Ontariorsquos Grade 6 learners to apply
thinking skills to solve deeper mathematical problems This finding holds important
recommendations for future research and mathematics educational practices as will be discussed
in the section below
Upon further investigation of learner performances in each of the strands as they relate to
the dimensions it was determined that all three classes performed much weaker in their ability to
apply mathematical knowledge in the Data Management and Probability strand than in the other
strands This strand was also determined to be the weakest in the thinking skills dimension
along with Patterning and Algebra This finding contradicts those of Tatsuoka Corter and
Tatsuoka (2004) in which it was found that students in the US appeared to perform poorest in
Geometry and Spatial Sense Given the inter-relatedness of mathematical knowledge and ability
to apply thinking skills as previously highlighted by Stokke (2015) this finding concerning Data
Management and Probability attests to a knowledge base weakness for Grade 6 Ontario learners
specifically surrounding this strand As for the results surrounding Patterning and Algebra they
appear to provide further support for the weak ability of the learners to apply thinking skills
42
given their relatively strong mathematical knowledge surrounding this strand These findings
also hold valuable recommendations for educational practices in Ontario which will be further
discussed below
53 To What Extent Are Mathematics Performance Profiles Predicted by Student Background such as Language and Residence Status
Findings from this analysis revealed that language background and length of residence in
Canada did not significantly predict performance profile membership Therefore regardless of
group allocation based on these variables all learners were equally likely to achieve a Class 1
(high performing) Class 2 (intermediate performing) or Class 3 (low performing) profile as
described in this study
These findings contradict the Jang et al (2013) study on the performance of learners in
reading In that study it was found that different reading patterns were achieved based on ELL
and length of residence status It was further determined that non-English speakers outperformed
monolinguals in reading achievement after living in the country for five years or more These
findings therefore do not appear to hold true for the performances of learners in mathematics
based on these variables as all learner groups were equally likely to achieve one of the three
performance profiles produced in this study However it needs to be acknowledged that this
study focused on ESL designation as opposed to ELL status which may have contributed to the
differences in findings Nonetheless these findings are considered valuable in that they provide
reassurance of the fact that the test results were not confounded by differences in language
proficiency and that the EQAO test was not biased towards first language speakers
The findings of this study further contradict those that found that English first language
speakers outperformed those for whom English was not their first language (Abedi amp Lord
43
2001 Howie 2003) Therefore they help shed perceptions of differences in mathematical
performances based solely on the aspect of language background This finding holds important
implications for mathematics education for these population groups as well as future research
54 Study Limitations
The following study limitations have been recognized and should thus be taken into
consideration when reviewing these findings Firstly this study analyzed the mathematical
performances of learners based on the results of a standardized test only We are therefore
reminded of the fact that many factors influence test scores over and above that which is random
These include the testing situation tester characteristics and test-taker characteristics (Kaplan amp
Saccuzzo 2009) For this reason it is important that learner performances in other assessment
environments also be considered such as classroom-based assessment activities
Secondly the findings of this study were based solely on learner performances on the
multiple choice items According to Schoenfeld (1992) most multiple choice items are machine
graded which limits their ability to measure learner conceptual understanding and problem
solving abilities to the degree that most people would like For this reason it is important that
future studies consider including the open response questions included on the assessment for a
better reflection of learner conceptual understanding and problem solving
Thirdly this study included performances of learners based solely on a single EQAO
administration and its data Although EQAO proclaims to instill rigorous test equating
procedures to ensure that test difficulty and discrimination properties are not compromised
across years (Rogers 2013) this does not guarantee that learner performances can be generalized
to all Grade 6 learners Furthermore this study focused on only those who took the English
44
version of the test therefore generalizing these findings to those who took the French version
should be done cautiously
Lastly the small ESL population size in comparison to the non-ESL population limits the
findings of this group and may therefore not accurately reflect their performances Furthermore
this study used ESL designation as opposed to ELL status ESL designation is a program in
which learners are enrolled or unenrolled throughout the year Therefore these findings may not
reflect that of the entire ELL population
55 Recommendations and Future Research
In light of recent poor mathematical performances of Ontariorsquos elementary learners the
education minister announced its ldquoRenewed Math Strategyrdquo designed for the purposes of
combatting further decline (Brown 2016) In this strategy requirements for improving the
performances of learners in mathematics were announced such as all learners in Grade 1-8 to
receive at least 60 minutes of mathematics instruction per day further support for weaker
schools in terms of more professional development for teachers as well as more support for
learners and parents surrounding this discipline As this study made apparent in the beginning
such strategies risk being only blanketed approaches that do not really target the heart of the
problem if not accompanied by further insight into the results upon which they are based
This study was conducted in an attempt to gain such insight and found that although
Ontario Grade 6 learners display strong mathematical knowledge the majority are particularly
weak in applying thinking skills such as reasoning and problem solving to solve deeper
mathematical problems It was further determined that learners are particularly weakest in the
Data Management and Probability strand for both mathematical knowledge and thinking skills
dimensions as well as the Patterning and Algebra strand in the latter dimension It was lastly
45
determined that background variables of language and length of residence did not significantly
predict performance and profile achievement and that both ESL and non-ESL learners were
equally likely to belong to high intermediate and low performing groups regardless of length of
residence in Canada Based on these findings the following recommendations surrounding
future research endeavors and educational practices specifically in conjunction with mathematics
education in Ontario will be discussed below
The Ontario Curriculum Grades 1-8 Mathematics 2005 document indicates that the
ultimate goal for mathematics education is to develop learner proficiency beyond that of content
knowledge and therefore also calls for the development of a deeper understanding of the
discipline along with essential thinking skills In order to accomplish these goals the
curriculum highlights that instructional practices need to deviate from a sole focus on direct
teaching methods to incorporate methods of teaching and learning through problem solving in
other words problem-based learning approaches Stokke (2015) blames this greater emphasis of
teaching mathematics using problem-based teaching strategies for the recent decline of Ontario
learnersrsquo mathematical performances She argues that the lack of direct instruction has robbed
learners of a sound knowledge base from which to draw upon when attempting to solve deeper
mathematical problems hence the weakness in this area
However the findings from this study provides evidence that contradicts this argument
as results point to the fact that the majority of Grade 6 learners in Ontario actually do possess
strong mathematical knowledge This finding may therefore perhaps be an indication of the
fact that a large portion of Ontario teachers still rely predominantly on teaching mathematics
using traditional direct teaching methods as opposed to those better suited to meet current
curriculum goals and expectations This finding therefore warrants further investigation into
current teaching trends and holds valuable insight as to where to direct efforts for remediation
46
In order to meet reformed curriculum goals and expectations teaching practices need to
change for which the teacher is the key actor (Ross amp McDougall 2006) Therefore this study
supports those calling for increased efforts directed at teachers and the need to reshape their roles
and perceptions of what it means to ldquoteachrdquo mathematics in a reformed curriculum classroom
For instance Milgram (2007) urges for strategies directed at ensuring that teachers truly
understand what it means to teach using problem-based teaching methods to develop thinking
skills He further illustrates that teaching thinking skills such as problem solving is a
challenging task as it is in itself complex involving both verbal and nonverbal mental processes
For this reason it is essential that learners solve problems for which the answer is not apparent
and requires a novel idea if we wish to effectively develop these skills (Milgram 2007) Such a
teaching and learning process requires that teachers step back allowing learners to grapple with
the task before them as well as interact with each other stepping in only when necessary to
guide the process (Milgram 2007)
Changing the role of the teacher from the traditional sole knowledge bearer and
transferor to one in which heshe shares the responsibility of learning with students is however
only one of 10 dimensions that requires attention when urging teachers to adopt instructional
practices better suited to accomplish curriculum goals and expectations (Ross amp McDougall
2007) Ross and McDougall (2006) further illustrate that in order to ensure that teaching for
deeper understanding as aligned with current reformed mathematics education takes place
teachers need to consider change in all 10 of these dimensions These dimensions as cited in
Ross and McDougall (2006) are summarized as follows 1) the need for program scope 2)
access to all forms of mathematics by students 3) raising self-confidence of students by teachers
4) complex and open-ended student tasks 5) instruction that focuses on constructing
mathematical ideas through self-discovery 6) change in the role of teachers to that of co-learner
47
and co-knowledge creator 7) solving of mathematical problems with the aid of manipulatives 8)
classroom organization in a manner that promotes sharing and interaction for solutions 9)
authentic assessment and lastly 10) a conception of mathematics as a dynamic subject by
teachers
Specifically regarding the first dimension namely the need for program scope Ross and
McDougall (2006) describe it as urging teachers to teach multiple mathematical strands with
increased attention on those less commonly taught such as the Data Management and
Probability and Patterning and Algebra strands The results of this analysis indicated that
learners were weakest in precisely these two strands therefore perhaps providing evidence in
support of the fact that these strands are given less attention by Ontario teachers when teaching
the mathematics curriculum expectations This finding therefore provides added support for the
need to further promote the implementation of these 10 dimensions of teaching for deeper
understanding as indicated above so as to ensure that teachers view all curriculum strands as
equally important and deserving of attention
In calling for these increased efforts directed at changing the way in which mathematics
teaching and learning occurs in classrooms it is important to acknowledge the fact that this is
easier said than done Teaching in a manner that supports the development of a deeper
understanding for mathematics and promotes thinking skills is a lengthy process that takes time
(Milgram 2007) A commodity in short supply for the teacher already feeling pressured to
cover all curriculum expectations before mandatory accountability assessments take place
(Milgram 2007) Therefore not only does this study call for increased efforts directed at
changing teacher perceptions and instructional practices in the classroom but also for policy
makers to consider practical constraints placed on teachers that may restrict the implementation
thereof
48
Lastly the need to predict mathematical performances of learners based on background
variables is made apparent by Hinton (2014) who found that early success in mathematics
predicts future success Therefore for the sake of early intervention especially for the lowest
performing group identified in this study it is urged that further research studies be directed at
determining background variables that better predict performances However it is further urged
that such studies focus on class or profile membership as used in this study as opposed to overall
mathematics performances used in the past In this way not only will we be able to better
identify low intermediate and high performers but also their related strengths and weaknesses
upon which specific remedial efforts can be targeted As for the equal likelihood of ESL and
non-ESL learners to achieve either low intermediate or high performing profiles this study
recommends future studies targeted at shedding perceptions of non-English speakers
underperforming in relation to first language speakers that have perhaps been shaped by previous
studies Without doing so we risk assuming the need for remediation directed at one group
whilst ignoring the needs of others
49
References
Abedi J amp Lord C (2001) The language factor in mathematics tests Applied Measurement
in Education 14(3) doi 101207S15324818AME1403_2
Brown J (2016) Elementary student to get hour of math every day under new Ontario plan
Retrieved July 23 2016 from
httpswwwthestarcomyourtorontoeducation20160404elementary-students-to-get-
hour-of-math-every-day-under-new-ontario-planhtml
Chudowsky N amp Pellegrino JW (2003) Large-scale assessments that support learning what
will it take Theory into Practice 42(1) 75+ Retrieved from
httpgogalegroupcommyaccesslibraryutorontocapsidop=AONEampu=utoronto_mai
nampid=GALE|A99909373ampv=21ampit=rampsid=summonampuserGroup=utoronto_mainampauth
Count=1
Collins L K amp Lanza S T (2010) Latent class and latent transitional analysis with
applications in the social behavioral and health sciences Hoboken NJ Wiley amp Sons
DePascale C (2014) The ideal role of large-scale testing in a comprehensive assessment
system Journal of Applied Testing Technology 5(1) 1-11 Retrieved from
httpwwwjattjournalcomindexphpatparticleview48343
Education Quality and Accountability Office (2016) About the agency Retrieved May 26
2016 from EQAO
httpwwweqaocomenabout_eqaoabout_the_agencyPagesabout-the-agencyaspx
Education Quality and Accountability Office (2014) EQAOrsquos provincial elementary school
report 2014 Retrieved September 26 2015 from EQAO
httpwwweqaocomenassessmentsresultsPagesprovincial-report-elementary-
2014aspx
Figlio D amp Loeb S (2011) School accountability In EA Hanushek S Machin and L
Woessmann (Eds) Handbooks in Economic The Netherlands North-Holland pp 383-
421
Foster D Noyce P amp Spiegel S (2007) When assessment guides instruction Silicon
Valleyrsquos mathematics assessment collaboration In AH Schoenfeld (Ed) Assessing
mathematical proficiency (pp 137-154) Cambridge Cambridge University Press
Friesen S (2005) Math Teaching it better Education Canada 46(1) 6-10
Furr R M (2011) Scale construction and psychometrics for social and personality psychology
Los Angeles SAGE
Fillmore L W (2007) English learners and mathematics learning language issues to consider
In AH Schoenfeld (Eds) Assessing mathematical proficiency (pp 333-344) Cambridge
Cambridge University Press
50
Haertel E H amp Herman J l (2005) A historical perspective on validity arguments for
accountability testing Yearbook of the National Society for the Study of
Education 104(2) 1-34 doi101111j1744-7984200500023x
Hinton A (2014) Tracking student achievement in mathematics over time in English language
schools Retrieved from
httpwwweqaocomenresearch_dataResearch_ReportsPagesstudent-
achievementaspx
Howie S (2005) System-level evaluation Language and other background factors affecting
mathematics achievement Prospects 35(2) 175-186 doi101007s11125-005-1820-
8
Huff K amp Goodman DP (2007) The demand for cognitive diagnostic assessment In JP
Leighton amp MJ Gierl (Eds) Cognitive Diagnostic Assessment for Education (19-60)
New York Cambridge University Press
IBM Corp Released 2013 IBM SPSS Statistics for Windows Version 230 Armonk NY IBM
Corp
Jang E E amp Ryan K (2003) Bridging gaps among curriculum teaching and learning and
assessment Book review Kifer E (2001) Large-scale assessment Dimensions
dilemmas and policy Journal of Curriculum Studies 35(4) 499-512
Jang EE Dunlop M Wagner M Kim Y amp Gu Z (2013) Elementary school ELLsrsquo
reading skill profiles using cognitive diagnosis modelling Roles of length of residence
and home language environment Language Learning 63(3) 400-436 doi
101111lang12016
Kaplan RM amp Saccuzzo DP (2009) Psychological Testing Principles Applications and
Issues Belmont Wadsworth Cengage Learning
Kilpatrick J Swafford J Findell B amp National Research Council (US) (2001) Adding it
up Helping children learn mathematics Washington DC National Academy Press
Klinger D A amp Rogers W T (2011) Teachers perceptions of large-scale assessment
programs within low-stakes accountability frameworks International Journal of
Testing 11(2) 122-143 doi101080153050582011552748
La Rose L (2014) PISA results Canada students high level achievers but math and science
scores dip The Huffington Post Retrieved October 5 2015 from
httpwwwhuffingtonpostca20131203pisa-results-canada-
studentrankings_n_4376190html
Meyers L S Gamst G amp Guarino A J (2006) Applied multivariate research Design and
interpretation Los Angeles Sage
Milgram R J (2007) What is mathematical proficiency In AH Schoenfeld (Eds) Assessing
mathematical proficiency (pp 31-58) Cambridge Cambridge University Press
51
Moschkovich J (2007) Beyond words to mathematical content Assessing English learners in
the mathematical classrooms In AH Schoenfeld (Eds) Assessing mathematical
proficiency (345-352) Cambridge Cambridge University Press
Mutheacuten LK amp Mutheacuten BO (1998-2010) Mplus Userrsquos Guide (6th Ed)
Los Angeles CA Mutheacuten amp Mutheacuten
Nagy P (2000) The three roles of assessment Gatekeeping accountability and instructional
diagnosis Canadian Journal of Education 25(2) Retrieved from
httpmyaccesslibraryutorontocaloginurl=httpsearchproquestcomdocview215374
855accountid=14771
National Council of Teachers of Mathematics (2000) Principles and standards for school
mathematics Reston VA National Council of Teachers of Mathematics
Nichols P D (1994) A framework for developing cognitively diagnostic assessments Review
of Educational Research 64(4) 575 Retrieved from
httpmyaccesslibraryutorontocaloginurl=httpsearchproquestcomdocview214116
755accountid=14771
Nylund K L Asparouhov T amp Mutheacuten B O (2007) Deciding on the number of classes in
latent class analysis and growth mixture modeling A monte carlo simulation
study Structural Equation Modeling A Multidisciplinary Journal 14(4) 535-569
doi10108010705510701575396
OECD (2014) PISA 2012 Results What Students Know and Can Do Student Performance in
Mathematics Reading and Science doi httpdxdoiorg1017879789264208780-en
Ontario (2005) The Ontario curriculum grades 1-8 Toronto Ontario Ministry of Education
Pastor D A Barron K E Miller B J amp Davis S L (2007) A latent profile analysis of
college students achievement goal orientation Contemporary Educational
Psychology 32(1) 8-47 doi101016jcedpsych200610003
Rogers WT (2013) What is the quality of EQAO assessments Excellent Retrieved
September 24 2015 from
httpwwweqaocomenresearch_dataResearch_ReportsPagesbest-assessment-
practicesaspx
Rogers WT (2014) Improving the utility of large-scale assessments in Canada Canadian
Journal of Education 37(3) Retrieved from httpcje-rcecaindexphpcje-
rcearticleview1732
Ross JA amp McDougall D E (2006) Mathematics In K Leithwood P McAdrie N Bascia
amp A Rodrigue A (Eds) Teaching for deep understanding Towards the Ontario
curriculum that we need (pp 33-39) Thousand Oaks CA Corwin Publishing
Schoenfeld A H (2007) Issues and tensions in the assessment of mathematical proficiency In
52
AH Schoenfeld (Ed) Assessing mathematical proficiency (pp3-15) Cambridge
Cambridge University Press
Schoenfeld A H (2007) What is mathematical proficiency and how can it be assessed In
AH Schoenfeld (Ed) Assessing mathematical proficiency (pp 59-73) Cambridge
Cambridge University Press
Schoenfeld A H (1992) Learning to think mathematically Problem solving metacognition
and sense making in mathematics In D Gouws (Ed) Handbook for research on
mathematics teaching and learning (pp 334-370) New York Macmillan
Schumacker R E amp Lomax R G (2004) A beginnerrsquos guide to structural equation modeling
(2nd ed) Mahwah NJ Lawrence Erlbaum Associates
Shapka J Domene J amp Keating D (2006) Trajectories of career aspirations through
adolescence and young adulthood Early math achievement as a critical filter
Educational Research and Evaluation 12(4) 347-358 Retrieved from
httpdxdoiorg10108013803610600765752
Statistics Canada (2016) Immigration and Ethnocultural Diversity in Canada Retrieved May
31 2016 from httpswww12statcangccanhs-enm2011as-sa99-010-x99-010-
x2011001-engcfm
Stein MK Remillard J amp Smith MS (2007) How curriculum influences student learning
In FK Lester amp National Council of Teachers of Mathematics (Eds) Second handbook
of research on mathematics teaching and learning a project of the National Council of
Teachers of Mathematics (pp 1099) Charlotte NC Information Age Pub
Stokke A (2015) What to do about Canadarsquos declining math scores Retrieved from
httpswwwcdhoweorgpdfcommentary_427pdf
Tatsuoka K Corter J amp Tatsuoka C (2004) Patterns of Diagnosed Mathematical Content
and Process Skills in TIMSS-R across a Sample of 20 Countries American Educational
Research Journal41(4) 901-926 Retrieved from
httpwwwjstororgmyaccesslibraryutorontocastable3699467
Uebersax JS (2015) Introduction to the Tetrachoric and Polychoric Correlation Coefficients
Retrieved July 20 2015 from httpjohn-uebersaxcomstattetrahtm
Wilson L D (2007) High-stakes testing In FK Lester and National Council of Teachers of
Mathematics (Eds) Second handbook of research on mathematics teaching and learning
a project of the National Council of Teachers of Mathematics (pp 1053 -1098)
Charlotte NC Information Age Pub

6
education of learners accountable (accountability) and for the improvement of education
(Chudowsky amp Pellegrino 2003 Nagy 2000) School accountability involves the process of
evaluating school performance on the basis of student performance measures (Figlio amp Loeb
2011) and forms part of the system used by officials in education to monitor the effective
functioning of schools
It can also be characterized as either a high- or low-stakes system which further
differentiates the use of the results For instance according to Rogers (2014) accountability in
Canada is considered to be a low-stakes system and therefore the emphasis is predominantly on
using the results for educational improvement In contrast the United States is considered to be
a high-stakes system as results are used chiefly to sanction and reward schools
Although the use of largescale assessments in education have been credited for providing
an objective ldquoyardstickrdquo on which to measure learnersrsquo performances (Rogers 2014) and for
their ability to simplistically rank individuals along a highly reliable scale (Huff amp Goodman
2010) they have endured much criticism from those within the field Not only has much of this
been centered around their many unintentional consequences such as promotion of teaching to
the test test preparation activities at the expense of instructional time dishonesty among
educators and student drop out (Rogers 2014 Schoenfeld 2007) but also their scoring and
reporting practices and procedures These criticisms have led to much doubt concerning their
effectiveness as a tool to serve the purposes for which they are employed
211 Scoring and Reporting Practices of Largescale Assessments
It is common practice for largescale assessments to be scored using Item Response Theory
or Classical Test Theory in order to generate a total score and to use only these to report the
overall performances of learners on the assessment (Nichols 1994) Although this scoring and
7
reporting procedure is credited for being relatively quick and cost effective (Chudowsky amp
Pellegrino 2003) they serve merely to highlight that there is a problem but provide little
direction as to what the problem is (Nichols 1994) Foster Noyceand Speigel (2007) sum up
the criticism against total scores by stating that although they may reassure a schoolrsquos staff about
student progress or alert them to trouble ahead they do little to inform teachers about how
students are thinking what they understand where they are falling down and how specifically
teachers might change their own instructional practices to address studentsrsquo difficulties
The over simplistic representation of learner performances by total scores therefore lacks
the necessary insight on which to base remedial decisions (Nichols 1994) For this reason the
effectiveness of largescale assessments as a tool for improving education has been questioned
(Rogers 2014) For instance it is expected that educators and principles use results of largescale
assessments to improve their instructional practices (Rogers 2014) however in a study
conducted by Klinger and Rogers (2013) it was discovered that they in fact found little
direction from these results to do so This has led to an increased demand from those within the
field for these assessments to report more than only overall performances in the form of total
scores (Huff amp Goodman 2010 Nichols 1994 Rogers 2014) Detailed information from
assessments can help those in education including teachers and students identify content and
curricular areas that need attention (Schoenfeld 2007) and in so doing aide in the improvement
of education in disciplines where it is needed the most
212 Test Development Procedures
Largescale assessment organisations commonly adopt traditional unidimensional
frameworks to form the basis of test development procedures A unidimensional framework is
one that assumes a single factor or latent variable as an explanation for a certain behaviour such
8
as academic ability (Kaplan amp Saccuzzo 2007) However many curricular in practice today
have been developed on a multidimensional framework such as that of mathematics where
academic ability is assumed to consist of more than one skill or factor
Furthermore test development practices are performed taking into consideration certain
test constraints for instance test format which is usually paper-and-pencil based as well as
administration time For this reason it is impossible to include items to measure all curriculum
expectations in one test (Haertel amp Herman 2005) This sampling process of curriculum
expectations therefore also means that only few items for each expectation are included in the
assessment (Rogers 2014)
In addition to these test development procedures raising construct validity concerns
(Wilson 2007) they limit the reporting of test scores beyond anything more than overall total
scores As highlighted by Rogers (2014) since the assessment was never designed from an
explicit framework in line with that of curriculum expectations from the start as well as include
only a few items targeted at each subdomain it is highly unlikely that the assessment meets the
rigorous test properties needed to allow for reporting anything beyond that of total scores
In order to satisfy the many calls for change to reporting practices assessment
organisations would need to deviate from these traditional more cost effective practices For this
reason Chudowsky and Pellegrino (2003) indicate that change is unlikely to happen soon As a
result our efforts to improve education in disciplines where it is needed the most will continue
to take place within the confinements of that which assessment organisations refuse to change
22 Mathematics Education and Curriculum
The mathematical reform movement generated in the late 1950rsquos signaled the need for the
implementation of better teaching and learning practices for mathematics in schools (Friesen
9
2005) Today many mathematics curricular worldwide including that of Canada are based on
the Principles and Standards for School Mathematics as set out by the National Council of
Teachers of Mathematics (NCTM) (Friesen 2005) Very broadly curriculum refers to the
substance or content of teaching and learning it focusses on the ldquowhatrdquo of teaching and learning
as opposed to the ldquohowrdquo (Stein Remillard amp Smith 2007)
This NCTM document calls for the teaching and learning of mathematics with the goal of
developing both content or procedural knowledge and conceptual understanding of the
discipline through the application of essential thinking or processing skills such as problem
solving or reasoning skills which in turn will be developed (NCTM 2000) This goal for
mathematics education is in stark contrast to that of traditional goals where only the teaching and
learning of procedural or content knowledge was valued and taught through rote teaching and
learning practices (Schoenfeld 2007) Procedural knowledge refers to what and how to solve
certain mathematical problems whereas conceptual understanding refers to why a certain
problem is solved the way it is (Kilpatrick Swafford Findell amp NRC 2001)
Furthermore the NCTM adopted the view that standards play a leading role in guiding
the improvement of mathematics education (NCTM 2000) It therefore highlights specific
mathematical standards or expectations that learners should achieve Specifically five Content
Standards are used to guide the teaching and learning of procedural and conceptual knowledge
namely Number and Operations Algebra Geometry Measurement and Data Analysis and
Probability Five Process Standards also guide the essential processes or thinking skills of
Problem Solving Reasoning and Proof Communication Connections and Representation
(NCTM 2000) The NCTM (2000) repeatedly proclaims the interconnectedness of these
standards by indicating that procedural knowledge should never exist without conceptual
10
understanding which in turn should not be developed without the application and acquisition of
the essential processing skills
The Content and Process Standards are further classified into groups or categories for
assessment purposes in mathematics curricular such as that of Ontario Specifically the Ontario
Curriculum Grades 1-8 Mathematics 2005 document describes four categories of Knowledge
and Understanding Thinking Communication and Application to which the standards are
allocated These four categories are known as the Knowledge and Skills categories and are
reflected in the documentrsquos Achievement Chart The first category of Knowledge and
Understanding can be described as encompassing mathematical knowledge of content and
understanding and therefore focusses predominantly on the achievement of the Content
Standards The remaining three categories focus predominantly on the use of the Process
Standards The Thinking category assesses the use of problem solving reasoning and proving
processes the Communication category focusses on the assessment of the communicating
processes and lastly the Application category focusses on the assessment of the connecting
processes
From the above mathematics curriculum we can see that the knowledge base is still
considered important in mathematics education however so is conceptual understanding and the
application and acquisition of thinking skills As stated by Schoenfeld (2007) anyone who lacks
a solid grasp of facts procedures definitions and concepts is significantly handicapped in
mathematics yet there is more to being mathematically proficient than simply reproducing
standard content on demand Therefore if we are interested in understanding mathematical
proficiency as it is taught and learned today it is important that we reflect learner abilities in all
aspects of the discipline (Kilpatrick et al 2001) In so doing we will gain better insight into
11
their strengths and weaknesses allowing us to remediate accordingly in our efforts to improve
learner performances in this essential discipline
23 Factors Predicting Mathematical Performances
Given the relative importance of mathematics it is no surprise that much research has been
dedicated to highlighting and isolating the number or factors that can influence and predict
mathematical performances By doing so early interventions and remedial strategies can be
better targeted to improve future mathematical success (Hinton 2014)
One such factor that has been given much attention is that of language proficiency and its
influence on mathematical performances Studies conducted by Hinton (2014) Howie (2005)
and Abedi and Lord (2001) for instance discovered that learners who spoke English as a second
language performed worse in mathematical assessments compared to their English proficient
counterparts Fillmore (2007) however cautions against interpreting this as a lack of
mathematical ability without firstly taking into account the aspect of language Since much of
the mathematics taught today is presented in the form of a word problem it relies heavily on a
deep understanding of language (Moschovich 2007) Therefore trying to tease out precisely
how much of the struggle is related to a language issue and how much to an issue with
mathematics is a unique challenge for teachers assessment and English Language Learners
(ELLrsquos) (Fillmore 2007) As highlighted by Moschovich (2007) assessment is certainly a
complex task perhaps especially when working with students who are learning English It is
challenging to decide whether an utterance reflects a studentrsquos conceptual understanding a
studentrsquos proficiency in expressing their ideas in English or a combination of mathematical
understanding and English proficiency
12
Canada has a high and diverse immigrant population for instance 206 of its population
in 2011 was determined to be comprised of immigrants from various countries (Statistics
Canada 2016) Thus the mathematical performances of ELLrsquos cannot be ignored Fortunately
this aspect is currently given attention in the province of Ontario as assessment organizations
such as the EQAO do attempt to report separately on these learnersrsquo performances However
Jang Dunlop Wagner Kim and Gu (2013) warn against treating ELLrsquos as a homogenous group
Their study found that when taking into account the length of residence in Canada
performances of these students varied significantly concerning their reading proficiencies
Therefore if we wish to predict mathematical performances or gain better insight based on
student background such as language factors it is necessary to consider subpopulation groups
that make up the overall ELL population such as length of residence in the country
13
Chapter 3 Method
This chapter describes the participants instrument and data as well as the three main
analyses used to answer the questions presented in this study
31 Participants
The current study used data made available by the Education Quality and Accountability
Office (EQAO) of Ontario The EQAO is an arms-length Ontario government agency that is
responsible for developing and overseeing reading writing and mathematics assessments
administered to Grade 3 6 9 and 10 students in Ontario public schools The purpose of the
results of these largescale assessments is to determine the extent to which learners have achieved
the curriculum standards of the particular discipline for educational accountability and
improvement purposes (EQAO 2016)
Learnersrsquo responses are scored by the EQAO using Classical Test Theory and Item
Response Theory (Rogers 2013) to generate a score that is then converted into a Level NIE 1 2
3 or 4 Level 3 describes a performance at the provincial standard whereas Level 4 a
performance surpassing the standard Level 2 a performance approaching the standard and Level 1
a performance much below the standard Lastly a ldquoNIErdquo rating is generated for those learners
who have not provided sufficient evidence for a Level 1 score The EQAO test scores are reported
using these proficiency levels for each of the areas tested namely reading writing and
mathematics Background information such as gender time lived in Canada and student home
language etc is also collected by questionnaires administered by the EQAO over the same time
The full population data set comprised of approximately 127 302 Grade 6 learnersrsquo
responses to the English 20132014 provincial Junior Division assessment A random sample of
5000 learner responses to the assessment was drawn from the entire data set Learners with
missing data on any of the variables were excluded from the sampling process so that the final
14
data set contained responses to all mathematics items as well as background information All
learners within the sample were enrolled at the time in Grade 6 and attended various schools
across the province Table 1 below presents the distributions of student subgroups from the
random sample based on their gender language background and time spent in Canada in
comparison with the entire population The percentage of learners in each subgroup was very
closely aligned with the larger Grade 6 population and was therefore considered a representative
sample
Table 1
Final Random Sample used for the Analysis
Standard Gender Language Time lived in Canada
Met
Below
Female
Male
Non-
ESL
ESL
CA
Born
Non-CA
born lt 5
years
Non-CA
born ge 5
years
Frequency 2765 2235 2456 2544 4460 540 4493 199 308
Sample 553 447 491 519 892 108 899 4 62
Population 54 46 49 51 887 113 871 4 89
Notes N = 5000 Standard = met the provincial standard or achieved below the provincial standard ESL = enrolled in
English as a Second language program Time lived in Canada = Canadian born learners non-Canadian born learners
who have lived in Canada for less than 5 years and non-Canadian born learners who have lived in Canada for 5 years
or more
32 Instrument
Student responses to the mathematics test items and background information on the EQAO
20132014 Junior Division assessment were used for this study This assessment is a provincially
mandated largescale assessment used by the Ontario government to measure the extent to which
learners have achieved the standards as laid out in the curriculum All the EQAO largescale
assessments are designed using rigorous development procedures and meet high testing standards
with acceptably high reliabilities (Rogers 2013) of above 80 The Junior Division assessment is
15
specifically administered to all Grade 6 learners attending schools within the province of Ontario
during the months of May and June and under highly standardized conditions (EQAO 2016) The
assessment measures reading writing and mathematical skills in each of the corresponding
sections The mathematics section specifically consists of 36 items of which 28 are multiple choice
items and 8 are constructed-response format questions This study included only the 28 multiple
choice items
While the EQAO does not claim to measure the Knowledge and Skills categories as laid out
in the Ontario Curriculum Grades 1-8 Mathematics 2005 document (Rogers 2013) it still
references each of the mathematics items to one of three of the categories namely that of
Knowledge and Understanding Thinking and Application The category of Communication is not
represented by any of the items as according to Rogers (2013) this skill is not feasible to assess in
a paper-and-pencil based test For items to be referenced to the Knowledge and Understanding
category they need to be recognized as requiring students to demonstrate subject specific content
and comprehend its meaning Those referenced to the Application category need to be recognized
as requiring students to select an appropriate mathematical tool and apply the appropriate
information Lastly those referenced to the Thinking category need to be seen as requiring of
students to select and sequence a variety of tools and think critically in order to solve problems
(Rogers 2013) Items are scrutinized by teachers and other content experts for the process of
allocating items to the most appropriate category Items are further referenced to the five content
areas or strands of the curriculum document according to their content topic namely Number Sense
and Numeration Measurement Geometry and Spatial Sense Patterning and Algebra and Data
Management and Probability
Table 2 shows the representation of each of the Knowledge and Skills categories and the
strands to which the 28 multiple choice items were referenced by the EQAO as well as the item
difficulties (p-values) and discrimination indices (pt-biserial correlations) for each of these items
According to Kaplan and Saccuzzo (2007) item difficulty values should range from 30 to 70 to
16
maximize information about the differences among individuals Furthermore item discriminability
values should not be negative or below 20 to be considered adequate Based on these
recommendations all 28 items were considered suitable to be included in the analyses of this study
Table 2
Knowledge and Skills Categories Strands and Descriptive Statistics of 28 Mathematics Items
Item Know amp Skill Strand p-value pt-biserial
1 K and U Patterning amp Algebra 86 39
14 K and U Patterning amp Algebra 74 43
3 K and U Number Sense amp Numeration 76 37
15 K and U Number Sense amp Numeration 86 35
9 K and U Data Management amp Probability 48 33
19 K and U Measurement 50 27
25 K and U Measurement 76 40
22 K and U Geometry amp Spatial Sense 87 34
73 36
11 App Patterning amp Algebra 81 43
24 App Patterning amp Algebra 70 37
26 App Patterning amp Algebra 40 30
5 App Number Sense amp Numeration 56 38
7 App Number Sense amp Numeration 82 30
10 App Data Management amp Probability 55 47
18 App Data Management amp Probability 78 47
23 App Data Management amp Probability 71 42
2 App Measurement 59 31
8 App Measurement 58 28
20 App Measurement 54 47
6 App Geometry amp Spatial Sense 68 38
64 38
17 Think Patterning amp Algebra 52 36
21 Think Number Sense amp Numeration 57 22
28 Think Number Sense amp Numeration 69 33
4 Think Data Management amp Probability 46 35
13 Think Measurement 54 39
27 Think Measurement 41 46
12 Think Geometry amp Spatial Sense 42 35
16 Think Geometry amp Spatial Sense 54 34
52 35
Notes K and U = Knowledge amp Understanding App = Application Think = Thinking p-value and pt-biserial means
for each Knowledge amp Skill category represented in bold
17
No items had p-values below 30 however 10 items had difficulty values above 70
indicating that they were relatively easy for this sample Since none of the p-values were above
90 they were considered to still possess sufficient variability to be included in the analyses
Furthermore no items had values below the recommended 20 or negative pt-biserial values Table
2 further highlights the item difficulty and discrimination means for each of the three categories
From these values it can be concluded that the items referenced to the Knowledge and
Understanding category were relatively more easy for this sample while those items referenced to
the Thinking category more difficult and those referenced to the Application category moderately
difficult Lastly it is highlighted that a greater number of items represented the Application
category (12 items) than the Knowledge and Understanding and Thinking category which had an
equal number of eight items
33 Data Analysis
The data analyses involved three phases each of which addressed one of the three questions
asked in this study The first phase used Exploratory Factor Analysis (EFA) approaches to
examine the first research question ldquoWhat characterizes the dimensionality of the EQAO
mathematics achievement test administered to Grade 6 students in Ontario public schoolsrdquo
Latent Class Analysis (LCA) approaches were used in the second phase in order to answer question
two ldquoIn which mathematical dimensions and related strands do students demonstrate strengths and
weaknesses in their mathematical achievementrdquo A multinomial logistic regression analysis was
performed to examine research question three ldquoTo what extent are mathematics performance
profiles predicted by student background such as language and length of residence statusrdquo
331 Phase 1 Establishing the Dimensionality of the Assessment
An Exploratory Factor Analysis (EFA) was conducted in order to determine the
dimensionality of the EQAO Grade 6 mathematics test based on 5000 studentsrsquo responses to 28
multiple choice items Although exploratory in nature the EFA was used to examine the extent
18
to which the test dimensionality can be accounted for by knowledge and skills and further by the
strand specified by the EQAO
EFA is a statistical procedure that simplifies the process of visually inspecting a range of
correlations in order to examine the dimensionality of measures (Furr 2011) The 28 multiple
choice items were firstly recoded as binary data thus creating dichotomous categories (0 =
incorrect responses and 1 = correct responses) In order to perform an EFA with this type of
data a more sophisticated statistical software package is required The reason for this being that
standard software such as IBMrsquos SPSS (version 230) creates correlation matrices suitable only
for continuous data that assume a normal distribution (Uebersax 2015) Therefore MPLUS
version 612 (Mutheacuten amp Mutheacuten 1998-2012) was used for the analysis so that a tetrachoric
correlation matrix could be generated to suite the binary data used in this study
When conducting an EFA in Mplus a correlation matrix eigenvalues and model fitting
statistics such as the chi-square test Root Mean Square Error of Approximation (RMSEA) and
Root Mean Square Residual (RMSR) are produced in order to assist with the process of
determining the solution that best fits the data A good fitting model will be represented by a
non-significant chi-square p-value as well as a RMSEA value and RMSR value of below 05
(Schumacker amp Lomax 2004) However interpretability of the model should also be taken into
consideration when deciding on the best solution (Meyers Gamst amp Guarino 2013) The
weighted least-squares with mean (wlsm) estimation method as recommended by Mutheacuten and
Mutheacuten (1998-2012) for binary data and the oblique rotation method (Promax) was used for this
analysis based on the assumption that factors are likely to be correlated with each other
Four steps were implemented during this phase The first step entailed determining the
ideal number of factors to be extracted to best describe the data This entailed a combined
evaluation of the correlation matrix eigenvalues scree plot and fit statistics as described above
The next step entailed an evaluation of the items and their loadings on each of the factors to
determine if any should be discarded in terms of low factor loadings or cross-loadings If any
19
items were deemed unacceptable these were removed and the analysis re-run and subsequently
re-evaluated This step was repeated until a final and appropriate factor solution model was
obtained Following this the reliability for each factor was established followed by an
investigation of the factor correlations in order to determine the uniqueness of each extracted
dimension Ideally items should correlate highly with each other within each extracted
factordimension however for each dimension to be considered unique between-factor
correlations should be low (Rogers 2014) According to Meyers et al (2013) between-factor
correlations should not exceed 80 to warrant the use of a separate dimension The last step
involved an investigation of the similarities between items in each factor in order to describe the
items that make up each This was done firstly in terms of the three Knowledge and Skills
categories and secondly the five strands to which the items were referenced as well as any
further content similarities
332 Phase 2 Identifying Mathematical Strengths and Weaknesses
In an attempt to identify in which mathematical subdomains or dimensions and related
strands learner performances were strongest and weakest as asked in question two of this study a
Latent Class Analysis (LCA) was performed using MPLUS version 612 (Mutheacuten amp Mutheacuten
1998-2012)
Specifically the goal of a mixture model is to reveal unobserved heterogeneous and
meaningful population groups within the larger homogenous population by identifying similarities
in their responses to measured variables (Nylund Asparouhov amp Mutheacuten 2007) These identified
latent populations or sub-groups are called classes Therefore using this analysis allowed for the
generation of distinct performance profiles for each sub-group or class identified as performing
similarly in the largescale assessment In this way more accurate class specific strengths and
weaknesses could be described as opposed to simply those of the overall Grade 6 population
20
For an LCA the outcome variables used are specifically categorical (Nylund et al 2007)
Therefore dichotomously scored response data from the random sample of 5000 students were
used for the LCA The LCA approach is exploratory in nature because the optimal number of
classes representing all latent classes cannot be determined apriori (Nylund et al 2007) Therefore
an investigation of relevant fit statistics generated by the LCA was firstly conducted According to
Pastor Barron Miller and Davis (2007) the fit statistics commonly used to determine the optimum
number of classes include the Bayesian Information Criterion (BIC) the sample-size adjusted BIC
and the Akaike Information Criterion (AIC) where lower values indicate a better fitting model An
Entropy statistic is also commonly used to determine model fit This statistic ranges from 0 to 1
where values closest to 1 indicate higher classification accuracy
Following the identification of the best fitting model the entire sample was profiled in
terms of distinct mathematics classes In order to reduce the number of points on these profiles
items were grouped according to the strand to which they were referenced by EQAO within each
identified factor This allowed for the identification of learner strengths and weaknesses not only
surrounding factors but also each strand within each factor
As part of the LCA mean item probability scores are calculated for each class This statistic
indicates the mean probability for each class to respond correctly to an item and therefore ranges
from 0 to 1 (Nylund et al 2007) Values closest to one therefore indicate a higher probability of
responding correctly to an item Using these values for each item average item-group probability
scores were calculated and these values were then used to describe class specific strengths and
weaknesses This was done firstly by describing overall item-group performances in comparison
to other classes and secondly by describing class performances in each specific factor overall and
lastly in terms of each strand within each factor
21
333 Phase 3 Predicting Class and Profile Membership
In order to answer question three concerning whether or not English as a second language
and length of residence in Canada significantly predicted the performance profile to which a
learner belongs a multinomial logistics regression analysis was conducted This phase was
completed using IBMrsquos SPSS (version 230)
A multinomial logistic regression is used when the dependent variable for the analysis
consists of more than two categorical levels (Meyers et al 2013) Besides the item probability
mean generated by the LCA a class probability mean for each learner in the sample is also
calculated as part of the analysis This class probability indicates the likelihood of a learner
belonging to each of the classes or performance profiles Based on the highest class probability
learners were allocated to one of the performance profiles as generated in phase 2 These classes
were coded 1 2 3 etc based on the number of classes determined to best describe the sample and
represented the dependent or predicted variable of the analysis
Table 3
Six Groups Created Based on English as Second Language and Time Lived in Canada
Group Language Time lived in Canada n
1 Non-ESL CA born 4185 837
2 ESL CA born 308 62
3 Non-ESL Non-CA born lt 5 years 76 15
4 ESL Non-CA born lt 5 years 123 25
5 Non-ESL Non-CA born ge 5 years 199 40
6 ESL Non-CA born ge 5 years 109 22
Notes N = 5000 ESL = English as a second language learner CA born = Born in Canada
An independent variable used for predicting the latent class membership included six
groups based on the following background variables English Second Language (ESL) status as
22
well as whether or not they were Canadian born non-Canadian born but at the time had resided in
the country for less than 5 years or non-Canadian born but at the time had resided in the country for
five years or more This was done in order to avoid clustering ELL learners as a homogenous group
and therefore better identify learners These six categorical data groups represented the predictor
or independent variable Table 3 indicates more precisely how each of the groups were created as
well as their sizes
23
Chapter 4 Results
The results of this study are discussed according to the three questions presented and phases
of data analyses as discussed in Chapter 3 Firstly the results produced from the Exploratory
Factor Analysis (EFA) described in phase one concerning question one are reported Secondly
those produced by the Latent Class Analysis (LCA) in phase two to answer question two and lastly
those produced from the multinomial logistics regression analysis conducted in phase three to
answer question three are presented in this chapter
41 Dimensionality Characteristics
As noted an EFA was conducted on the 28 multiple choice mathematics items in order to
determine the dimensionality of the largescale assessment to which they belonged The
eigenvalues of the tetrachoric correlation matrix (Table 4) produced by Mplus ranged between
862 and 41 the first three factors showed eigenvalues greater than 1 and accounted for 3953 of
the total variance
Table 4
Eigenvalues of Correlation Matrix indicating Total Variance Explained
Item Eigenvalue Item Eigenvalue Item Eigenvalue Item Eigenvalue
1 86 2 13 3 10 4 93
5 91 6 90 7 87 8 85
9 84 10 80 11 79 12 76
13 74 14 72 15 70 16 69
17 66 18 65 19 64 20 63
21 60 22 57 23 53 24 52
25 50 26 49 27 46 28 41
24
411 Determining the Best Fitting Factor Solution Model
The eigenvalues scree plot and fit statistics were used to determine the best number of
factors to describe this data set Based on the ldquonumber of eigenvalues greater and equal to one
rulerdquo as suggested by Meyers et al (2013) together with the scree plot and relevant fit statistics it
seemed adequate to extract three factors albeit accounting for less than 50 of the variance
Figure 1 Scree plot
Although three eigenvalues were produced greater and equal to one suggesting the
existence of three factors this was contradicted by the scree plot (Figure 1) which suggested the
existence of only two factors as it appeared to level off mostly at number three Subsequently a
comparison of the one to three factor solutions was conducted in terms of the relevant fit statistics
as described in Table 5
The significant chi-square p-values (lt 001) generated for the one and two factor solutions
suggested that the data differed significantly from the model matrix Although the chi-square p-
value has been criticized in the past for being overly sensitive to large sample sizes and therefore
0
05
1
15
2
25
3
35
4
45
5
55
6
65
7
75
8
85
9
1 2 3 4 5 6 7 8 9 10 11 12 13 14 15 16 17 18 19 20 21 22 23 24 25 26 27 28
Eig
envalu
es
Items
25
almost always producing a significant value (Meyers et al 2013) this was determined not to be the
case for this analysis as the p-value generated in the three factor model increased substantially
from the one to two factor model thus ensuring the reliability of this value
Table 5
EFA Model Fit Statistics of the 1 to 3 Factor Solutions on 28 Mathematics Items
FA model Chi-Square df p-value RMSEA RMSR
1 92476 350 lt 001 018 031
2 44012 323 lt001 009 021
3 34390 297 032 006 019
Note N = 5000
Therefore since the Chi-square p-value of 032 of the three factor model was not significant
(at the 001 probability level) as well as the fact that only two items represented the fourth factor in
the four factor solution model it was deemed a good fitting model The values of 006 and 019 of
the RMSEA and RMSR respectively were well below the 05 recommended value providing
further support for this three factor solution model
A further inspection of the factor loadings from the three-factor solution as well as of the
items on each factor resulted in the removal of four items (ie 12 18 23 and 24) Items 18 23 and
24 were discarded as a result of low factor loading scores below 30 Whereas a decision was made
to remove Item 12 as it was the only item referenced to the Thinking category that did not load on
the factors in the same way that the others did Table 6 presents the final factor loadings with the
Knowledge and Skills categories to which items were originally allocated by the EQAO that is
knowledge and understanding application and thinking
The Promax factor correlation matrix produced by Mplus (Table 7) revealed that all three
factors correlated positively and moderately to high with one another The strongest correlation
26
existed between Factor 1 and Factor 3 with a relatively high coefficient value of 747 while the
weakest correlation existed between Factor 1 and Factor 2 with a coefficient of 576
Table 6
Factor Loadings of the 23 Items used in the Final 3 Factor Solution Model
Item Knowledge amp Skill Factor 1 Factor 2 Factor 3
1 KU 64 -09 13
11 App 63 -04 12
14 KU 55 13 01
6 App 51 12 -04
15 KU 51 -05 14
10 App 47 23 05
7 App 45 -12 13
25 KU 38 09 17
3 KU 35 -01 24
9 KU 35 09 07
22 KU 31 07 23
5 APP 30 09 22
13 App 10 65 -05
27 Think -04 63 23
2 Think -07 50 12
20 App 14 -03 59
17 Think -04 04 55
26 App 13 01 33
8 App 11 -01 32
28 Think 15 03 32
16 Think 11 10 31
4 Think 14 12 30
21 Think -04 08 30
α = 725 α = 536 α = 565
Notes KU = Knowledge and Understanding App = Application Think = Thinking category
As stated earlier according to Meyers et al (2013) correlations should not exceed 80 to warrant
the use of separate factors These results are therefore considered to reveal the existence of three
27
unique factors that can be used to describe the multidimensionality of these mathematics multiple
choice items
Table 7
Promax Factor Correlations Between 3 Factors
Factors FA 1 FA 2
Factor 1
Factor 2 576
Factor 3 747 626
Note N = 5000
As indicated in Table 6 Factor 1 consisted of 12 items in total with factor loading scores
ranging between 30 and 64 and achieved a relatively high Cronbachrsquos alpha of 725 All seven
items referenced to the Knowledge and Understanding category used in the final model loaded
together on Factor 1 along with five items referenced to the Application category Factor 2
consisted of only three items with factor loading scores ranging between 50 and 63 and
achieved a moderate Cronbachrsquos alpha of 536 In Factor 2 two items referenced to the Thinking
category and one to the Application category loaded together to make up the total of three items
for this factor Lastly Factor 3 consisted of a total of eight items with factor loading scores
ranging between 30 and 59 and also achieved a moderate Cronbachrsquos alpha score of 565 The
remaining five items referenced to the Thinking category and three items referenced to the
Application category loaded together to make up the eight items that loaded together on Factor 3
In terms of the strands to which the items in Factor 1 were referenced for instance
Patterning and Algebra etc no clear similarities appeared to exist to tie all the items together
based on this However similarities seemed to exist in terms of the applied skill requested of
learners to solve the mathematical problems It appeared that all the items of this factor merely
requested of learners to apply their mathematical knowledge in terms of procedures and
conceptual understanding to answer the questions For instance Item 15 which is referenced to
28
the Knowledge and Understanding category asks the following ldquoWhat is the value of 0730 ndash
0156rdquo Whereas Item 5 which is referenced to the Application category asks that learners
solve problems involving the addition of decimal numbers (the exact question was not released)
Therefore it was determined that no clear difference existed between the applied skill requested
from these two items even though they were referenced to two different Knowledge and Skills
categories It was therefore concluded that Factor 1 could be described as measuring the
application of mathematical knowledge to solve problems in various strands
An inspection of the items that loaded together on Factor 2 revealed that two of the items
were referenced to the Thinking category while one of the items was referenced to the
Application category Furthermore all three items were similar in that that they covered the
ldquoMeasurementrdquo strand and more specifically that all three items requested of learners to solve
problems relating to ldquoAreardquo Item 2 for instance asks ldquoThe parallelogram below will be cut
into two congruent triangles (provides dimensions) What is the area of one of the trianglesrdquo
Item 13 asks ldquoWhich of the following shows a rectangle and a triangle that have the same areardquo
and lastly Item 27 requests that learners compare the areas of two polygons (exact item not
released) Item 2 was referenced to the Application category whereas Items 13 and 27 were
referenced to the Thinking category It was therefore determined that Factor 2 could be
described as requesting of learners to apply thinking processes or skills such as problem solving
and reasoning in order to solve deeper mathematical problems specifically surrounding the
Measurement topic of ldquoAreardquo
Lastly for Factor 3 as with Factor 1 no clear similarities appeared to exist to tie all the
items together based on strands However as with Factor 1 similarities seemed to exist in terms
of the applied skill requested of learners to solve the mathematical problems It appeared that
all the items on this factor requested of learners to apply thinking skills to solve deeper
mathematical problems surrounding various strands in other words learners had to go beyond
the mere application of content knowledge to solve these items For instance Item 20 referenced
29
to the Application category requested that learners solve the following problem ldquoEach beaker of
water below has a capacity of 2L Which beaker appears to have about 500ml of water in itrdquo
Whereas Item 28 referenced to the Thinking category asks ldquoMrs Garrett sends surveys to 120
students and 78 students return the survey Which statement best describes the percent of
students who return the surveyrdquo Again no clear difference appeared to exist between the
applied skill requested of learners in terms of the Application and Thinking categories to which
the items were referenced It was therefore concluded that Factor 3 could be described as
measuring the ability of learners to apply thinking processes or skills such as problem solving
and reasoning in order to solve deeper mathematical problems in various strands
In sum the results of the EFA determined that a three factor model could be used to
adequately characterize the dimensionality of the multiple choice mathematics items on the
EQAO assessment Twelve items clustered adequately together in terms of factor loading scores
to form Factor 1 which achieved a relatively high Cronbachrsquos alpha of 725 three items on
Factor 2 which achieved a moderate Cronbachrsquos alpha of 536 and lastly eight items on Factor
3 which also achieved a moderate Cronbachrsquos alpha score of 565 Upon closer inspection of
the items on each factor and in terms of the Knowledge and Skills categories and strands to
which they were referenced by the EQAO it was determined that Factor 1 could be best
described as measuring the ability of learners to apply mathematical knowledge related to
procedural and conceptual understanding in order to solve problems in various mathematical
strands Factor 2 could be best described as measuring the ability of learners to apply process
or thinking skills in order to solve problems related specifically to the topic of ldquoAreardquo
Lastly Factor 3 could be best described as measuring the ability of learners to apply thinking
skills in various mathematical strands
30
42 Mathematical Strengths and Weaknesses
In an attempt to identify in which mathematical dimensions and related strands Grade 6
learner performances were strongest and weakest as asked in question two of this study a Latent
Class Analysis (LCA) was conducted This allowed for distinct performance profiles to be
generated for classes or sub-groups performing similarly in the population and therefore allowed
for more accurate descriptions of strengths and weaknesses The factors as established in the
dimensionality investigation in Phase 1 of this study were used to represent the dimensions for this
analysis
Although the four class model achieved the lowest AIC BIC and Sample-Size Adjusted
BIC statistic values in comparison to the two and three class model it also produced a much lower
Entropy value of 69 (see Table 8) Therefore it was decided that since these statistics did not
decrease that much from the three class to four class model the use of the four class model with a
much lower Entropy value did not seem warranted Thus the three class model was opted for
instead as it produced lower fit statistics than the two class model as well as a sufficiently high
Entropy value of 75 Furthermore the results indicated that each class was represented by the
following proportion of learners from the sample Class 1 comprised of 321 Class 2 of 452
and Class 3 of 227
Table 8
LCA Fit Statistics for 2 3 and 4 Classes
Fit statistics 2 Classes 3 Classes 4 Classes
AIC 12974224 12808557 12789120
BIC 13004854 12854829 12851034
Adj BIC 12989919 12832268 12820846
Entropy 81 75 69
Notes N = 5000 AIC = Akaike Information Criterion BIC = Bayesian Information Criterion Adj BIC = Sample-
Size Adjusted Bayesian Information Criterion
31
Eleven item-groups were created to describe the strengths and weaknesses of the three
classes as represented in Table 9 Item-groups were created by grouping items according to the
factor they were determined to measure (as established in the EFA) as well as the strand to which
they were allocated by the EQAO Five item-groups were created for Factor 1 one item-group for
Factor 2 and five groups for Factor 3 The number of items within each item-group varied from 1
item to 4 items The mean probability scores calculated for each class for each item-group and
overall dimension or factor are also represented in Table 9 These mean item-group probability
scores as presented in Table 9 were used to plot three distinct performance profiles for each class as
represented in Figure 2 below
Table 9
Item-Groups created to Describe Mathematical Performances of Grade 6 Learners
Factor Content Area of items Class 1 Class 2 Class 3
1 Patterning amp Algebra 3 97 86 48
1 Measurement 1 95 78 44
1 Geometry amp Spatial Sense 2 94 79 50
1 Number Sense amp Numeration 4 92 76 49
1 Data Management amp Probability 2 78 49 19
Factor 1 class probability means 91 74 44
2 Measurement (Area) 3 85 39 28
Factor 2 class probability means 85 39 28
3 Patterning amp Algebra 2 67 43 20
3 Measurement 2 79 55 25
3 Geometry amp Spatial Sense 1 79 47 31
3 Number Sense amp Numeration 2 80 60 44
3 Data Management amp Probability 1 72 40 22
Factor 3 class probability means 76 51 29
Note The factor probability means presented in bold are slightly higher as the actual item probability score was used
to calculate these values and not the item-group probability scores
Using the evidence generated from the mean item-group and factor probability scores as
represented in Table 9 and Figure 2 these performance profiles were used to describe the strengths
32
and weaknesses of each class Class specific strengths and weaknesses were described according
to firstly overall performances in the 11 item-groups in comparison to the other classes secondly
in terms of overall performances in each dimension (Factor 1 2 and 3) and lastly in terms of
performances in each strand within each dimension for Factor 1 and 3 only (as Factor 2 only
represented Measurement topic of ldquoAreardquo) A mean item-group probability score ranging from 86
- 10 was described as especially strong 71 - 85 as strong and 56 - 70 as moderately strong
while those scores ranging from 41 - 55 were described as moderately weak 26 - 40 as
moderately weak and 25 and below as especially weak
Figure 2 Three performance profiles of Grade 6 learners in 11 mathematical item-groups
Results indicated that those learners most likely to belong to Class 1 performed higher than
Class 2 and 3 in all item-groups Therefore this class to which 321 of learners from the sample
belonged can be best described as the highest performing and second largest group overall Those
most likely to belong to this class can be described as having an especially strong ability to apply
0
01
02
03
04
05
06
07
08
09
1
Item
-Gro
up
Mea
n P
rob
ab
ilit
y
Item-Groups
Class 1 (321) Class 2 (452) Class 3 (227)
33
mathematical knowledge in order to solve problems in various strands This was determined by the
average 91 overall probability for success achieved for those items related to Factor 1 They can
also be described as having a strong ability to apply thinking skills in order to solve problems
surrounding the Measurement topic of ldquoAreardquo and strong ability to do the same in various strands
This was determined by the 85 probability for success achieved for those items related to Factor
2 and 76 probability for success achieved for those related to Factor 3 Furthermore their overall
performances in the knowledge dimension can be described as stronger in comparison to their
performances in the thinking dimensions
Specifically concerning their ability to apply mathematical knowledge in various strands
(Factor 1) these learners can be described as performing slightly stronger in the Patterning and
Algebra (item-group probability score = 97) and considerably weaker in Data Management and
Probability (item-group probability score = 78) in relation to their performances in the other
strands Specifically regarding their ability to apply think skills in order to solve problems (Factor
3) they can be described as performing slightly stronger in Number Sense and Numeration (item-
group probability score = 80) and considerably weaker in Data Management and Probability (item-
group probability score = 72) and Patterning and Algebra (item-group probability score = 67) with
the latter being the weakest in relation to their performances in the other strands
Results further indicated that those learners most likely to belong to Class 2 performed
overall lower than Class 1 but higher than Class 3 in all item-groups Therefore this class to
which 452 of the learners belonged can be best described as the intermediate performing and
largest group overall Those most likely to belong to this class can be described as having a strong
ability to apply mathematical knowledge in order to solve problems in various strands This was
determined by the average 74 overall probability for success achieved for those items related to
Factor 1 They can also be described as having a weak ability to apply thinking skills in order to
solve problems surrounding the Measurement topic of ldquoAreardquo and moderately weak ability to do
the same in various strands This was determined by the 39 probability for success achieved for
34
those items related to Factor 2 and 51 probability for success achieved for those related to Factor
3 Furthermore their overall performances in the knowledge dimension can be described as
stronger in comparison to their performances in the thinking dimensions
Specifically concerning their ability to apply mathematical knowledge in various strands
(Factor 1) performances for these learners can be described as considerably stronger in Patterning
and Algebra (item-group probability score = 86) and considerably weaker in Data Management
and Probability (item-group probability score = 49) in relation to their performances in the other
strands Specifically regarding their ability to apply thinking skills in order to solve problems
(Factor 3) performances can be described as stronger in Number Sense and Numeration (item-
group probability score = 60) and considerably weaker in Data Management and Probability (item-
group probability score = 40) and Patterning and Algebra (item-group probability score = 43) with
the former being the weakest in relation to their performances in the other strands
Lastly results indicated that those learners most likely to belong to Class 3 performed lower
than Class 1 and 2 in all item-groups Therefore this class to which 227 of learners belonged
can be best described as the lowest performing group overall Those most likely to belong to this
class can be described as having a moderately weak ability to apply mathematical knowledge in
order to solve problems in various strands This was determined by the average 44 overall
probability for success achieved for those items related to Factor 1 They can also be described as
having a weak ability to apply thinking skills in order to solve problems surrounding the
Measurement topic of ldquoAreardquo and weak ability to do the same in various strands This was
determined by the 28 probability for success achieved for those items related to Factor 2 and
29 probability for success achieved for those related to Factor 3 Furthermore their overall
performances in the knowledge dimension can be described as stronger in comparison to their
performances in the thinking dimensions
Specifically concerning their ability to apply mathematical knowledge in various strands
(Factor 1) it was determined that these learners can be described as performing slightly stronger in
35
Geometry and Spatial Sense (item-group probability score = 50) and considerably weaker in Data
Management and Probability (item-group probability score = 19) in relation to their performances
in the other strands Specifically regarding their ability to apply thinking skills in order to solve
problems (Factor 3) their performance can be described as considerably stronger in Number Sense
and Numeration (item-group probability score = 44) and weaker in Data Management and
Probability (item-group probability score = 22) and Patterning and Algebra (item-group
probability score = 20) with the latter being the weakest in relation to their performances in the
other strands
In sum the results of the LCA revealed that three classes could be used to best describe the
performances of Grade 6 learners in the three dimensions as established during the EFA and their
related strands Class 1 was described as the highest performing and second largest group The
learners in the class were described as performing especially strong in Factor 1 (namely their
ability to apply mathematical knowledge to solve problems in various strands) strong in Factor 2
(namely their ability to apply thinking skills to solve problems specifically related to the
Measurement topic of ldquoAreardquo) and in Factor 3 (namely their ability to apply thinking skills in order
to solve problems in various strands) Class 2 was described as the intermediate performing and
largest group and performing strong for Factor 1 weak for Factor 2 and moderately weak for
Factor 3 Lastly Class 3 was described as the lowest performing and smallest group and
performing moderately weak for Factor 1 and weak for both Factor 2 and 3 For all classes overall
factor performances were described as weaker in the thinking dimensions namely Factor 2 and 3
than in the knowledge dimension namely Factor 1 A greater discrepancy between these
mathematical knowledges and thinking skills dimensions appears to exist for those in Class 2 than
for those in Class 1 and 3
Lastly in terms of describing the performances of each class in the strands related to each
factor for Factor 1 and 3 results revealed clear similarities between all classes in terms of those in
which performances were described as weaker For all classes regarding Factor 1 their ability to
36
apply mathematical knowledge within the Data Management and Probability strand was described
as the weakest in relation to the other strands For all classes regarding Factor 3 their ability to
apply thinking skills in the Patterning and Algebra and Data Management and Probability strand
was described as weakest in relation to their performances in the other strands
43 Predicting Mathematics Profiles by Language and Length of Residence Background
To avoid treating learners as homogenous groups based on their language background they
were allocated to one of six groups according to their ESL designation and length of residency in
Canada The six groups represented the predictor variable (independent variable) whereas the three
classes or performance profiles were treated as the predicted or dependent variable Class 1
namely the highest performing profile group was used as the reference category
Results of this analysis indicated that the final model did not significantly predict class and
performance profile membership with a -2 Log likelihood of 7740 and a Chi-square value of 957
(10 N = 5000) p = 48 The upper portion of Table 10 presents the regression coefficients the
Wald test adjusted odds ratio [Exp(B)] and the 95 confidence intervals (CI) for odds ratios for
the predictor contrasting Class 2 to Class 1 The lower portion of the table presents the regression
coefficients the Wald test adjusted odds ratio [Exp(B)] and the 95 confidence intervals (CI) for
odds ratios for the predictor contrasting Class 3 to Class 1
Results therefore revealed that ESL status and residence in Canada did not significantly
predict class or profile membership regardless of group allocation In other words regardless of
group allocation learners were found to be equally likely to belong to either Class 1 (highest
performing group) Class 2 (intermediate performing group) or Class 3 (lowest performing group)
and therefore perform according to the related profile as indicated earlier in Figure 2
37
Table 10
Parameter Estimates for Six Groups on 3 Classes
Model B SE - B Wald df Exp(B) 95 CI EXP (B)
Class 2
Intercept 43 23 351 1
Group 1 -07 23 09 1 93 60 ndash 147
Group 2 06 26 06 1 107 64 ndash 178
Group 3 -60 35 296 1 55 277 ndash 109
Group 4 01 31 00 1 101 55 ndash 183
Group 5 -08 28 09 1 92 54 ndash 158
Class 3
Intercept -13 26 27 1
Group 1 -23 26 74 1 80 48 ndash 133
Group 2 -20 31 42 1 82 47 ndash 149
Group 3 -36 39 84 1 70 33 ndash 150
Group 4 -35 37 92 1 70 34 ndash 144
Group 5 -53 33 255 1 59 31 ndash 113
Notes p lt 001 N = 5000 Class 1 is the reference category Group 1 = Non-ESL CA Born (n = 4185) Group 2 =
ESL CA Born (n = 308) Group 3 = Non-ESL Non-CA born but living in country less than 5 years (n = 76) Group 4
= ESL Non-CA born but living in country less than 5 years (n = 123) Group 5 = Non-ESL Non-CA born but living in
country 5 years or more (n = 199) Group 6 = ESL Non-CA born but living in country 5 years or more (n = 109)
38
Chapter 5 Discussion
The purpose of this study was to move beyond the total scores of a largescale assessment
in order to gain better insight into the mathematical performances of Ontariorsquos Grade 6 learners
In doing so it aimed to provide evidence of learner strengths and weaknesses in different aspects
of mathematics education on which to base remedial decisions for the improvement thereof
Using the responses of a random sample of 5000 Grade 6 learners to 28 multiple choice
mathematics items on the 20132014 EQAO Junior Division assessment an Exploratory Factor
Analysis (EFA) was firstly performed in order to investigate the dimensionality characteristics
of the assessment This was followed by a Latent Class Analysis (LCA) to determine learner
strengths and weaknesses related to the established mathematical dimensions and their related
strands Lastly a multinomial logistic regression analysis was performed in order to examine the
extent to which mathematics performance profiles were predicted by student background factors
such as language and length of residency in Canada This chapter discusses the findings of these
analyses study limitations and lastly recommendations for future research and education
51 What Characterizes the Dimensionality of the EQAO Mathematics Achievement Test Administered to Grade 6 Students in Ontario Public Schools
The multiple choice mathematics items on the EQAO assessment were characterized as
measuring the ability of learners in three interrelated yet separate mathematical dimensions
These being the ability of learners to apply mathematical knowledge related to procedural
knowledge and conceptual understanding to solve problems in various strands (Factor 1) the
ability to apply process or thinking skills such as problem solving or reasoning skills to solve
problems in ldquoAreardquo (Factor 2) and lastly the ability to apply process or thinking skills to solve
39
problems in various mathematical strands The three factors produced achieved on average
moderate reliability scores
These findings regarding the characteristics of the dimensions were considered valuable
as they allowed for the comparison of learner abilities in two essential elements of mathematical
proficiency as aligned with the Principles and Standards for School Mathematics (NCTM
2000) and as a result also with the Ontario mathematics curriculum which shares the same
foundations Only once this happens namely learner ability measured directly in relation with
mathematical curriculum expectations can we begin an effective process of remediation
(Kilpatrick et al 2001) These elements were that of mathematical knowledge consisting of
procedural and conceptual knowledge as measured by Factor 1 of this study and process or
thinking skills such as problem solving and reasoning as measured by Factor 2 and 3 Factor 2
and 3 were determined to differ based solely on the content of the items included in the
assessment This finding highlights concerns regarding the fair representation of all curriculum
expectations on the assessment and thus warrants further investigation
The fact that the ability to apply mathematical knowledge and the ability to apply
thinking skills in order to solve mathematical problems were found to be sufficiently unique
dimensions to warrant their use using the multiple choice items on this largescale mathematics
assessment adds further value to the findings of this study These findings are valuable in that
they attest to the future potential for assessment organizations to report learner performances
beyond that of total scores as demanded by those in the educational field However since the
factors achieved only moderate reliability scores we are reminded of the need for these tests to
be designed upon foundations aligned with those of the curriculum expectations they are
employed to assess from the start in order for them to meet better test properties (Chudowsky amp
Pellegrino 2003 Rogers 2014)
40
52 In which Mathematical Dimensions and Related Strands do Students Demonstrate Strengths and Weaknesses in their Mathematical Achievement
Three classes were determined to best describe the performances of all Grade 6 learners
in the established dimensions and their related strands Class 1 was described as the highest
performing and second largest group consisting of 321 of the learners Class 2 was described
as the intermediate performing and largest group consisting of 452 of the learners and lastly
Class 3 was described as the lowest performing and smallest group consisting of only 227 of
the learners from the sample
The results of this analysis further revealed that all three classes performed weaker in
their ability to apply thinking skills in order to solve problems either specifically surrounding
the topic of Area or in various strands than in their ability to apply mathematical knowledge in
order to do the same The performances of those in Class 1 were described as especially strong
in the mathematical knowledge dimension (Factor 1) and strong in the thinking dimensions
(Factor 2 and 3) Class 2 was described as strong in the mathematical knowledge dimension but
weak in the thinking skills dimensions and lastly Class 3 was described as moderately weak in
the mathematical knowledge and thinking skills dimensions The discrepancy between
performances in the two subdomains namely mathematical knowledge and thinking skills thus
appeared to be largest for those in Class 2 the intermediate performing and largest group
The findings concerning the overall performances of students in the two subdomains of
mathematical knowledge and thinking skills aligns with those concerning the performances of
US students as described by Kilpatrick et al (2001) They highlight that research evidence over
the past 30 years has consistently indicated that although US students do not fare badly in
applying their knowledge to solve basic mathematical problems they tend to have a limited
41
understanding of mathematical concepts and are noticeably deficient in their ability to apply
mathematical thinking skills to solve even simple problems
It may however be argued that this finding namely a weaker performance in thinking
skills than mathematical knowledge is to be expected given the fact that applying thinking skills
in order to solve problems is a more challenging task than simply applying what you know
(Schoenfeld 2007) However studies have also found that a strong mathematical knowledge
base leads to a better ability to apply thinking skills to solve deeper problems (Stokke 2015)
Thus given the inter-relatedness of these two dimensions together with the large discrepancy
between them for those in Class 2 (strong mathematical knowledge but weak thinking skills)
these findings demonstrate a weakness in the majority of Ontariorsquos Grade 6 learners to apply
thinking skills to solve deeper mathematical problems This finding holds important
recommendations for future research and mathematics educational practices as will be discussed
in the section below
Upon further investigation of learner performances in each of the strands as they relate to
the dimensions it was determined that all three classes performed much weaker in their ability to
apply mathematical knowledge in the Data Management and Probability strand than in the other
strands This strand was also determined to be the weakest in the thinking skills dimension
along with Patterning and Algebra This finding contradicts those of Tatsuoka Corter and
Tatsuoka (2004) in which it was found that students in the US appeared to perform poorest in
Geometry and Spatial Sense Given the inter-relatedness of mathematical knowledge and ability
to apply thinking skills as previously highlighted by Stokke (2015) this finding concerning Data
Management and Probability attests to a knowledge base weakness for Grade 6 Ontario learners
specifically surrounding this strand As for the results surrounding Patterning and Algebra they
appear to provide further support for the weak ability of the learners to apply thinking skills
42
given their relatively strong mathematical knowledge surrounding this strand These findings
also hold valuable recommendations for educational practices in Ontario which will be further
discussed below
53 To What Extent Are Mathematics Performance Profiles Predicted by Student Background such as Language and Residence Status
Findings from this analysis revealed that language background and length of residence in
Canada did not significantly predict performance profile membership Therefore regardless of
group allocation based on these variables all learners were equally likely to achieve a Class 1
(high performing) Class 2 (intermediate performing) or Class 3 (low performing) profile as
described in this study
These findings contradict the Jang et al (2013) study on the performance of learners in
reading In that study it was found that different reading patterns were achieved based on ELL
and length of residence status It was further determined that non-English speakers outperformed
monolinguals in reading achievement after living in the country for five years or more These
findings therefore do not appear to hold true for the performances of learners in mathematics
based on these variables as all learner groups were equally likely to achieve one of the three
performance profiles produced in this study However it needs to be acknowledged that this
study focused on ESL designation as opposed to ELL status which may have contributed to the
differences in findings Nonetheless these findings are considered valuable in that they provide
reassurance of the fact that the test results were not confounded by differences in language
proficiency and that the EQAO test was not biased towards first language speakers
The findings of this study further contradict those that found that English first language
speakers outperformed those for whom English was not their first language (Abedi amp Lord
43
2001 Howie 2003) Therefore they help shed perceptions of differences in mathematical
performances based solely on the aspect of language background This finding holds important
implications for mathematics education for these population groups as well as future research
54 Study Limitations
The following study limitations have been recognized and should thus be taken into
consideration when reviewing these findings Firstly this study analyzed the mathematical
performances of learners based on the results of a standardized test only We are therefore
reminded of the fact that many factors influence test scores over and above that which is random
These include the testing situation tester characteristics and test-taker characteristics (Kaplan amp
Saccuzzo 2009) For this reason it is important that learner performances in other assessment
environments also be considered such as classroom-based assessment activities
Secondly the findings of this study were based solely on learner performances on the
multiple choice items According to Schoenfeld (1992) most multiple choice items are machine
graded which limits their ability to measure learner conceptual understanding and problem
solving abilities to the degree that most people would like For this reason it is important that
future studies consider including the open response questions included on the assessment for a
better reflection of learner conceptual understanding and problem solving
Thirdly this study included performances of learners based solely on a single EQAO
administration and its data Although EQAO proclaims to instill rigorous test equating
procedures to ensure that test difficulty and discrimination properties are not compromised
across years (Rogers 2013) this does not guarantee that learner performances can be generalized
to all Grade 6 learners Furthermore this study focused on only those who took the English
44
version of the test therefore generalizing these findings to those who took the French version
should be done cautiously
Lastly the small ESL population size in comparison to the non-ESL population limits the
findings of this group and may therefore not accurately reflect their performances Furthermore
this study used ESL designation as opposed to ELL status ESL designation is a program in
which learners are enrolled or unenrolled throughout the year Therefore these findings may not
reflect that of the entire ELL population
55 Recommendations and Future Research
In light of recent poor mathematical performances of Ontariorsquos elementary learners the
education minister announced its ldquoRenewed Math Strategyrdquo designed for the purposes of
combatting further decline (Brown 2016) In this strategy requirements for improving the
performances of learners in mathematics were announced such as all learners in Grade 1-8 to
receive at least 60 minutes of mathematics instruction per day further support for weaker
schools in terms of more professional development for teachers as well as more support for
learners and parents surrounding this discipline As this study made apparent in the beginning
such strategies risk being only blanketed approaches that do not really target the heart of the
problem if not accompanied by further insight into the results upon which they are based
This study was conducted in an attempt to gain such insight and found that although
Ontario Grade 6 learners display strong mathematical knowledge the majority are particularly
weak in applying thinking skills such as reasoning and problem solving to solve deeper
mathematical problems It was further determined that learners are particularly weakest in the
Data Management and Probability strand for both mathematical knowledge and thinking skills
dimensions as well as the Patterning and Algebra strand in the latter dimension It was lastly
45
determined that background variables of language and length of residence did not significantly
predict performance and profile achievement and that both ESL and non-ESL learners were
equally likely to belong to high intermediate and low performing groups regardless of length of
residence in Canada Based on these findings the following recommendations surrounding
future research endeavors and educational practices specifically in conjunction with mathematics
education in Ontario will be discussed below
The Ontario Curriculum Grades 1-8 Mathematics 2005 document indicates that the
ultimate goal for mathematics education is to develop learner proficiency beyond that of content
knowledge and therefore also calls for the development of a deeper understanding of the
discipline along with essential thinking skills In order to accomplish these goals the
curriculum highlights that instructional practices need to deviate from a sole focus on direct
teaching methods to incorporate methods of teaching and learning through problem solving in
other words problem-based learning approaches Stokke (2015) blames this greater emphasis of
teaching mathematics using problem-based teaching strategies for the recent decline of Ontario
learnersrsquo mathematical performances She argues that the lack of direct instruction has robbed
learners of a sound knowledge base from which to draw upon when attempting to solve deeper
mathematical problems hence the weakness in this area
However the findings from this study provides evidence that contradicts this argument
as results point to the fact that the majority of Grade 6 learners in Ontario actually do possess
strong mathematical knowledge This finding may therefore perhaps be an indication of the
fact that a large portion of Ontario teachers still rely predominantly on teaching mathematics
using traditional direct teaching methods as opposed to those better suited to meet current
curriculum goals and expectations This finding therefore warrants further investigation into
current teaching trends and holds valuable insight as to where to direct efforts for remediation
46
In order to meet reformed curriculum goals and expectations teaching practices need to
change for which the teacher is the key actor (Ross amp McDougall 2006) Therefore this study
supports those calling for increased efforts directed at teachers and the need to reshape their roles
and perceptions of what it means to ldquoteachrdquo mathematics in a reformed curriculum classroom
For instance Milgram (2007) urges for strategies directed at ensuring that teachers truly
understand what it means to teach using problem-based teaching methods to develop thinking
skills He further illustrates that teaching thinking skills such as problem solving is a
challenging task as it is in itself complex involving both verbal and nonverbal mental processes
For this reason it is essential that learners solve problems for which the answer is not apparent
and requires a novel idea if we wish to effectively develop these skills (Milgram 2007) Such a
teaching and learning process requires that teachers step back allowing learners to grapple with
the task before them as well as interact with each other stepping in only when necessary to
guide the process (Milgram 2007)
Changing the role of the teacher from the traditional sole knowledge bearer and
transferor to one in which heshe shares the responsibility of learning with students is however
only one of 10 dimensions that requires attention when urging teachers to adopt instructional
practices better suited to accomplish curriculum goals and expectations (Ross amp McDougall
2007) Ross and McDougall (2006) further illustrate that in order to ensure that teaching for
deeper understanding as aligned with current reformed mathematics education takes place
teachers need to consider change in all 10 of these dimensions These dimensions as cited in
Ross and McDougall (2006) are summarized as follows 1) the need for program scope 2)
access to all forms of mathematics by students 3) raising self-confidence of students by teachers
4) complex and open-ended student tasks 5) instruction that focuses on constructing
mathematical ideas through self-discovery 6) change in the role of teachers to that of co-learner
47
and co-knowledge creator 7) solving of mathematical problems with the aid of manipulatives 8)
classroom organization in a manner that promotes sharing and interaction for solutions 9)
authentic assessment and lastly 10) a conception of mathematics as a dynamic subject by
teachers
Specifically regarding the first dimension namely the need for program scope Ross and
McDougall (2006) describe it as urging teachers to teach multiple mathematical strands with
increased attention on those less commonly taught such as the Data Management and
Probability and Patterning and Algebra strands The results of this analysis indicated that
learners were weakest in precisely these two strands therefore perhaps providing evidence in
support of the fact that these strands are given less attention by Ontario teachers when teaching
the mathematics curriculum expectations This finding therefore provides added support for the
need to further promote the implementation of these 10 dimensions of teaching for deeper
understanding as indicated above so as to ensure that teachers view all curriculum strands as
equally important and deserving of attention
In calling for these increased efforts directed at changing the way in which mathematics
teaching and learning occurs in classrooms it is important to acknowledge the fact that this is
easier said than done Teaching in a manner that supports the development of a deeper
understanding for mathematics and promotes thinking skills is a lengthy process that takes time
(Milgram 2007) A commodity in short supply for the teacher already feeling pressured to
cover all curriculum expectations before mandatory accountability assessments take place
(Milgram 2007) Therefore not only does this study call for increased efforts directed at
changing teacher perceptions and instructional practices in the classroom but also for policy
makers to consider practical constraints placed on teachers that may restrict the implementation
thereof
48
Lastly the need to predict mathematical performances of learners based on background
variables is made apparent by Hinton (2014) who found that early success in mathematics
predicts future success Therefore for the sake of early intervention especially for the lowest
performing group identified in this study it is urged that further research studies be directed at
determining background variables that better predict performances However it is further urged
that such studies focus on class or profile membership as used in this study as opposed to overall
mathematics performances used in the past In this way not only will we be able to better
identify low intermediate and high performers but also their related strengths and weaknesses
upon which specific remedial efforts can be targeted As for the equal likelihood of ESL and
non-ESL learners to achieve either low intermediate or high performing profiles this study
recommends future studies targeted at shedding perceptions of non-English speakers
underperforming in relation to first language speakers that have perhaps been shaped by previous
studies Without doing so we risk assuming the need for remediation directed at one group
whilst ignoring the needs of others
49
References
Abedi J amp Lord C (2001) The language factor in mathematics tests Applied Measurement
in Education 14(3) doi 101207S15324818AME1403_2
Brown J (2016) Elementary student to get hour of math every day under new Ontario plan
Retrieved July 23 2016 from
httpswwwthestarcomyourtorontoeducation20160404elementary-students-to-get-
hour-of-math-every-day-under-new-ontario-planhtml
Chudowsky N amp Pellegrino JW (2003) Large-scale assessments that support learning what
will it take Theory into Practice 42(1) 75+ Retrieved from
httpgogalegroupcommyaccesslibraryutorontocapsidop=AONEampu=utoronto_mai
nampid=GALE|A99909373ampv=21ampit=rampsid=summonampuserGroup=utoronto_mainampauth
Count=1
Collins L K amp Lanza S T (2010) Latent class and latent transitional analysis with
applications in the social behavioral and health sciences Hoboken NJ Wiley amp Sons
DePascale C (2014) The ideal role of large-scale testing in a comprehensive assessment
system Journal of Applied Testing Technology 5(1) 1-11 Retrieved from
httpwwwjattjournalcomindexphpatparticleview48343
Education Quality and Accountability Office (2016) About the agency Retrieved May 26
2016 from EQAO
httpwwweqaocomenabout_eqaoabout_the_agencyPagesabout-the-agencyaspx
Education Quality and Accountability Office (2014) EQAOrsquos provincial elementary school
report 2014 Retrieved September 26 2015 from EQAO
httpwwweqaocomenassessmentsresultsPagesprovincial-report-elementary-
2014aspx
Figlio D amp Loeb S (2011) School accountability In EA Hanushek S Machin and L
Woessmann (Eds) Handbooks in Economic The Netherlands North-Holland pp 383-
421
Foster D Noyce P amp Spiegel S (2007) When assessment guides instruction Silicon
Valleyrsquos mathematics assessment collaboration In AH Schoenfeld (Ed) Assessing
mathematical proficiency (pp 137-154) Cambridge Cambridge University Press
Friesen S (2005) Math Teaching it better Education Canada 46(1) 6-10
Furr R M (2011) Scale construction and psychometrics for social and personality psychology
Los Angeles SAGE
Fillmore L W (2007) English learners and mathematics learning language issues to consider
In AH Schoenfeld (Eds) Assessing mathematical proficiency (pp 333-344) Cambridge
Cambridge University Press
50
Haertel E H amp Herman J l (2005) A historical perspective on validity arguments for
accountability testing Yearbook of the National Society for the Study of
Education 104(2) 1-34 doi101111j1744-7984200500023x
Hinton A (2014) Tracking student achievement in mathematics over time in English language
schools Retrieved from
httpwwweqaocomenresearch_dataResearch_ReportsPagesstudent-
achievementaspx
Howie S (2005) System-level evaluation Language and other background factors affecting
mathematics achievement Prospects 35(2) 175-186 doi101007s11125-005-1820-
8
Huff K amp Goodman DP (2007) The demand for cognitive diagnostic assessment In JP
Leighton amp MJ Gierl (Eds) Cognitive Diagnostic Assessment for Education (19-60)
New York Cambridge University Press
IBM Corp Released 2013 IBM SPSS Statistics for Windows Version 230 Armonk NY IBM
Corp
Jang E E amp Ryan K (2003) Bridging gaps among curriculum teaching and learning and
assessment Book review Kifer E (2001) Large-scale assessment Dimensions
dilemmas and policy Journal of Curriculum Studies 35(4) 499-512
Jang EE Dunlop M Wagner M Kim Y amp Gu Z (2013) Elementary school ELLsrsquo
reading skill profiles using cognitive diagnosis modelling Roles of length of residence
and home language environment Language Learning 63(3) 400-436 doi
101111lang12016
Kaplan RM amp Saccuzzo DP (2009) Psychological Testing Principles Applications and
Issues Belmont Wadsworth Cengage Learning
Kilpatrick J Swafford J Findell B amp National Research Council (US) (2001) Adding it
up Helping children learn mathematics Washington DC National Academy Press
Klinger D A amp Rogers W T (2011) Teachers perceptions of large-scale assessment
programs within low-stakes accountability frameworks International Journal of
Testing 11(2) 122-143 doi101080153050582011552748
La Rose L (2014) PISA results Canada students high level achievers but math and science
scores dip The Huffington Post Retrieved October 5 2015 from
httpwwwhuffingtonpostca20131203pisa-results-canada-
studentrankings_n_4376190html
Meyers L S Gamst G amp Guarino A J (2006) Applied multivariate research Design and
interpretation Los Angeles Sage
Milgram R J (2007) What is mathematical proficiency In AH Schoenfeld (Eds) Assessing
mathematical proficiency (pp 31-58) Cambridge Cambridge University Press
51
Moschkovich J (2007) Beyond words to mathematical content Assessing English learners in
the mathematical classrooms In AH Schoenfeld (Eds) Assessing mathematical
proficiency (345-352) Cambridge Cambridge University Press
Mutheacuten LK amp Mutheacuten BO (1998-2010) Mplus Userrsquos Guide (6th Ed)
Los Angeles CA Mutheacuten amp Mutheacuten
Nagy P (2000) The three roles of assessment Gatekeeping accountability and instructional
diagnosis Canadian Journal of Education 25(2) Retrieved from
httpmyaccesslibraryutorontocaloginurl=httpsearchproquestcomdocview215374
855accountid=14771
National Council of Teachers of Mathematics (2000) Principles and standards for school
mathematics Reston VA National Council of Teachers of Mathematics
Nichols P D (1994) A framework for developing cognitively diagnostic assessments Review
of Educational Research 64(4) 575 Retrieved from
httpmyaccesslibraryutorontocaloginurl=httpsearchproquestcomdocview214116
755accountid=14771
Nylund K L Asparouhov T amp Mutheacuten B O (2007) Deciding on the number of classes in
latent class analysis and growth mixture modeling A monte carlo simulation
study Structural Equation Modeling A Multidisciplinary Journal 14(4) 535-569
doi10108010705510701575396
OECD (2014) PISA 2012 Results What Students Know and Can Do Student Performance in
Mathematics Reading and Science doi httpdxdoiorg1017879789264208780-en
Ontario (2005) The Ontario curriculum grades 1-8 Toronto Ontario Ministry of Education
Pastor D A Barron K E Miller B J amp Davis S L (2007) A latent profile analysis of
college students achievement goal orientation Contemporary Educational
Psychology 32(1) 8-47 doi101016jcedpsych200610003
Rogers WT (2013) What is the quality of EQAO assessments Excellent Retrieved
September 24 2015 from
httpwwweqaocomenresearch_dataResearch_ReportsPagesbest-assessment-
practicesaspx
Rogers WT (2014) Improving the utility of large-scale assessments in Canada Canadian
Journal of Education 37(3) Retrieved from httpcje-rcecaindexphpcje-
rcearticleview1732
Ross JA amp McDougall D E (2006) Mathematics In K Leithwood P McAdrie N Bascia
amp A Rodrigue A (Eds) Teaching for deep understanding Towards the Ontario
curriculum that we need (pp 33-39) Thousand Oaks CA Corwin Publishing
Schoenfeld A H (2007) Issues and tensions in the assessment of mathematical proficiency In
52
AH Schoenfeld (Ed) Assessing mathematical proficiency (pp3-15) Cambridge
Cambridge University Press
Schoenfeld A H (2007) What is mathematical proficiency and how can it be assessed In
AH Schoenfeld (Ed) Assessing mathematical proficiency (pp 59-73) Cambridge
Cambridge University Press
Schoenfeld A H (1992) Learning to think mathematically Problem solving metacognition
and sense making in mathematics In D Gouws (Ed) Handbook for research on
mathematics teaching and learning (pp 334-370) New York Macmillan
Schumacker R E amp Lomax R G (2004) A beginnerrsquos guide to structural equation modeling
(2nd ed) Mahwah NJ Lawrence Erlbaum Associates
Shapka J Domene J amp Keating D (2006) Trajectories of career aspirations through
adolescence and young adulthood Early math achievement as a critical filter
Educational Research and Evaluation 12(4) 347-358 Retrieved from
httpdxdoiorg10108013803610600765752
Statistics Canada (2016) Immigration and Ethnocultural Diversity in Canada Retrieved May
31 2016 from httpswww12statcangccanhs-enm2011as-sa99-010-x99-010-
x2011001-engcfm
Stein MK Remillard J amp Smith MS (2007) How curriculum influences student learning
In FK Lester amp National Council of Teachers of Mathematics (Eds) Second handbook
of research on mathematics teaching and learning a project of the National Council of
Teachers of Mathematics (pp 1099) Charlotte NC Information Age Pub
Stokke A (2015) What to do about Canadarsquos declining math scores Retrieved from
httpswwwcdhoweorgpdfcommentary_427pdf
Tatsuoka K Corter J amp Tatsuoka C (2004) Patterns of Diagnosed Mathematical Content
and Process Skills in TIMSS-R across a Sample of 20 Countries American Educational
Research Journal41(4) 901-926 Retrieved from
httpwwwjstororgmyaccesslibraryutorontocastable3699467
Uebersax JS (2015) Introduction to the Tetrachoric and Polychoric Correlation Coefficients
Retrieved July 20 2015 from httpjohn-uebersaxcomstattetrahtm
Wilson L D (2007) High-stakes testing In FK Lester and National Council of Teachers of
Mathematics (Eds) Second handbook of research on mathematics teaching and learning
a project of the National Council of Teachers of Mathematics (pp 1053 -1098)
Charlotte NC Information Age Pub

7
reporting procedure is credited for being relatively quick and cost effective (Chudowsky amp
Pellegrino 2003) they serve merely to highlight that there is a problem but provide little
direction as to what the problem is (Nichols 1994) Foster Noyceand Speigel (2007) sum up
the criticism against total scores by stating that although they may reassure a schoolrsquos staff about
student progress or alert them to trouble ahead they do little to inform teachers about how
students are thinking what they understand where they are falling down and how specifically
teachers might change their own instructional practices to address studentsrsquo difficulties
The over simplistic representation of learner performances by total scores therefore lacks
the necessary insight on which to base remedial decisions (Nichols 1994) For this reason the
effectiveness of largescale assessments as a tool for improving education has been questioned
(Rogers 2014) For instance it is expected that educators and principles use results of largescale
assessments to improve their instructional practices (Rogers 2014) however in a study
conducted by Klinger and Rogers (2013) it was discovered that they in fact found little
direction from these results to do so This has led to an increased demand from those within the
field for these assessments to report more than only overall performances in the form of total
scores (Huff amp Goodman 2010 Nichols 1994 Rogers 2014) Detailed information from
assessments can help those in education including teachers and students identify content and
curricular areas that need attention (Schoenfeld 2007) and in so doing aide in the improvement
of education in disciplines where it is needed the most
212 Test Development Procedures
Largescale assessment organisations commonly adopt traditional unidimensional
frameworks to form the basis of test development procedures A unidimensional framework is
one that assumes a single factor or latent variable as an explanation for a certain behaviour such
8
as academic ability (Kaplan amp Saccuzzo 2007) However many curricular in practice today
have been developed on a multidimensional framework such as that of mathematics where
academic ability is assumed to consist of more than one skill or factor
Furthermore test development practices are performed taking into consideration certain
test constraints for instance test format which is usually paper-and-pencil based as well as
administration time For this reason it is impossible to include items to measure all curriculum
expectations in one test (Haertel amp Herman 2005) This sampling process of curriculum
expectations therefore also means that only few items for each expectation are included in the
assessment (Rogers 2014)
In addition to these test development procedures raising construct validity concerns
(Wilson 2007) they limit the reporting of test scores beyond anything more than overall total
scores As highlighted by Rogers (2014) since the assessment was never designed from an
explicit framework in line with that of curriculum expectations from the start as well as include
only a few items targeted at each subdomain it is highly unlikely that the assessment meets the
rigorous test properties needed to allow for reporting anything beyond that of total scores
In order to satisfy the many calls for change to reporting practices assessment
organisations would need to deviate from these traditional more cost effective practices For this
reason Chudowsky and Pellegrino (2003) indicate that change is unlikely to happen soon As a
result our efforts to improve education in disciplines where it is needed the most will continue
to take place within the confinements of that which assessment organisations refuse to change
22 Mathematics Education and Curriculum
The mathematical reform movement generated in the late 1950rsquos signaled the need for the
implementation of better teaching and learning practices for mathematics in schools (Friesen
9
2005) Today many mathematics curricular worldwide including that of Canada are based on
the Principles and Standards for School Mathematics as set out by the National Council of
Teachers of Mathematics (NCTM) (Friesen 2005) Very broadly curriculum refers to the
substance or content of teaching and learning it focusses on the ldquowhatrdquo of teaching and learning
as opposed to the ldquohowrdquo (Stein Remillard amp Smith 2007)
This NCTM document calls for the teaching and learning of mathematics with the goal of
developing both content or procedural knowledge and conceptual understanding of the
discipline through the application of essential thinking or processing skills such as problem
solving or reasoning skills which in turn will be developed (NCTM 2000) This goal for
mathematics education is in stark contrast to that of traditional goals where only the teaching and
learning of procedural or content knowledge was valued and taught through rote teaching and
learning practices (Schoenfeld 2007) Procedural knowledge refers to what and how to solve
certain mathematical problems whereas conceptual understanding refers to why a certain
problem is solved the way it is (Kilpatrick Swafford Findell amp NRC 2001)
Furthermore the NCTM adopted the view that standards play a leading role in guiding
the improvement of mathematics education (NCTM 2000) It therefore highlights specific
mathematical standards or expectations that learners should achieve Specifically five Content
Standards are used to guide the teaching and learning of procedural and conceptual knowledge
namely Number and Operations Algebra Geometry Measurement and Data Analysis and
Probability Five Process Standards also guide the essential processes or thinking skills of
Problem Solving Reasoning and Proof Communication Connections and Representation
(NCTM 2000) The NCTM (2000) repeatedly proclaims the interconnectedness of these
standards by indicating that procedural knowledge should never exist without conceptual
10
understanding which in turn should not be developed without the application and acquisition of
the essential processing skills
The Content and Process Standards are further classified into groups or categories for
assessment purposes in mathematics curricular such as that of Ontario Specifically the Ontario
Curriculum Grades 1-8 Mathematics 2005 document describes four categories of Knowledge
and Understanding Thinking Communication and Application to which the standards are
allocated These four categories are known as the Knowledge and Skills categories and are
reflected in the documentrsquos Achievement Chart The first category of Knowledge and
Understanding can be described as encompassing mathematical knowledge of content and
understanding and therefore focusses predominantly on the achievement of the Content
Standards The remaining three categories focus predominantly on the use of the Process
Standards The Thinking category assesses the use of problem solving reasoning and proving
processes the Communication category focusses on the assessment of the communicating
processes and lastly the Application category focusses on the assessment of the connecting
processes
From the above mathematics curriculum we can see that the knowledge base is still
considered important in mathematics education however so is conceptual understanding and the
application and acquisition of thinking skills As stated by Schoenfeld (2007) anyone who lacks
a solid grasp of facts procedures definitions and concepts is significantly handicapped in
mathematics yet there is more to being mathematically proficient than simply reproducing
standard content on demand Therefore if we are interested in understanding mathematical
proficiency as it is taught and learned today it is important that we reflect learner abilities in all
aspects of the discipline (Kilpatrick et al 2001) In so doing we will gain better insight into
11
their strengths and weaknesses allowing us to remediate accordingly in our efforts to improve
learner performances in this essential discipline
23 Factors Predicting Mathematical Performances
Given the relative importance of mathematics it is no surprise that much research has been
dedicated to highlighting and isolating the number or factors that can influence and predict
mathematical performances By doing so early interventions and remedial strategies can be
better targeted to improve future mathematical success (Hinton 2014)
One such factor that has been given much attention is that of language proficiency and its
influence on mathematical performances Studies conducted by Hinton (2014) Howie (2005)
and Abedi and Lord (2001) for instance discovered that learners who spoke English as a second
language performed worse in mathematical assessments compared to their English proficient
counterparts Fillmore (2007) however cautions against interpreting this as a lack of
mathematical ability without firstly taking into account the aspect of language Since much of
the mathematics taught today is presented in the form of a word problem it relies heavily on a
deep understanding of language (Moschovich 2007) Therefore trying to tease out precisely
how much of the struggle is related to a language issue and how much to an issue with
mathematics is a unique challenge for teachers assessment and English Language Learners
(ELLrsquos) (Fillmore 2007) As highlighted by Moschovich (2007) assessment is certainly a
complex task perhaps especially when working with students who are learning English It is
challenging to decide whether an utterance reflects a studentrsquos conceptual understanding a
studentrsquos proficiency in expressing their ideas in English or a combination of mathematical
understanding and English proficiency
12
Canada has a high and diverse immigrant population for instance 206 of its population
in 2011 was determined to be comprised of immigrants from various countries (Statistics
Canada 2016) Thus the mathematical performances of ELLrsquos cannot be ignored Fortunately
this aspect is currently given attention in the province of Ontario as assessment organizations
such as the EQAO do attempt to report separately on these learnersrsquo performances However
Jang Dunlop Wagner Kim and Gu (2013) warn against treating ELLrsquos as a homogenous group
Their study found that when taking into account the length of residence in Canada
performances of these students varied significantly concerning their reading proficiencies
Therefore if we wish to predict mathematical performances or gain better insight based on
student background such as language factors it is necessary to consider subpopulation groups
that make up the overall ELL population such as length of residence in the country
13
Chapter 3 Method
This chapter describes the participants instrument and data as well as the three main
analyses used to answer the questions presented in this study
31 Participants
The current study used data made available by the Education Quality and Accountability
Office (EQAO) of Ontario The EQAO is an arms-length Ontario government agency that is
responsible for developing and overseeing reading writing and mathematics assessments
administered to Grade 3 6 9 and 10 students in Ontario public schools The purpose of the
results of these largescale assessments is to determine the extent to which learners have achieved
the curriculum standards of the particular discipline for educational accountability and
improvement purposes (EQAO 2016)
Learnersrsquo responses are scored by the EQAO using Classical Test Theory and Item
Response Theory (Rogers 2013) to generate a score that is then converted into a Level NIE 1 2
3 or 4 Level 3 describes a performance at the provincial standard whereas Level 4 a
performance surpassing the standard Level 2 a performance approaching the standard and Level 1
a performance much below the standard Lastly a ldquoNIErdquo rating is generated for those learners
who have not provided sufficient evidence for a Level 1 score The EQAO test scores are reported
using these proficiency levels for each of the areas tested namely reading writing and
mathematics Background information such as gender time lived in Canada and student home
language etc is also collected by questionnaires administered by the EQAO over the same time
The full population data set comprised of approximately 127 302 Grade 6 learnersrsquo
responses to the English 20132014 provincial Junior Division assessment A random sample of
5000 learner responses to the assessment was drawn from the entire data set Learners with
missing data on any of the variables were excluded from the sampling process so that the final
14
data set contained responses to all mathematics items as well as background information All
learners within the sample were enrolled at the time in Grade 6 and attended various schools
across the province Table 1 below presents the distributions of student subgroups from the
random sample based on their gender language background and time spent in Canada in
comparison with the entire population The percentage of learners in each subgroup was very
closely aligned with the larger Grade 6 population and was therefore considered a representative
sample
Table 1
Final Random Sample used for the Analysis
Standard Gender Language Time lived in Canada
Met
Below
Female
Male
Non-
ESL
ESL
CA
Born
Non-CA
born lt 5
years
Non-CA
born ge 5
years
Frequency 2765 2235 2456 2544 4460 540 4493 199 308
Sample 553 447 491 519 892 108 899 4 62
Population 54 46 49 51 887 113 871 4 89
Notes N = 5000 Standard = met the provincial standard or achieved below the provincial standard ESL = enrolled in
English as a Second language program Time lived in Canada = Canadian born learners non-Canadian born learners
who have lived in Canada for less than 5 years and non-Canadian born learners who have lived in Canada for 5 years
or more
32 Instrument
Student responses to the mathematics test items and background information on the EQAO
20132014 Junior Division assessment were used for this study This assessment is a provincially
mandated largescale assessment used by the Ontario government to measure the extent to which
learners have achieved the standards as laid out in the curriculum All the EQAO largescale
assessments are designed using rigorous development procedures and meet high testing standards
with acceptably high reliabilities (Rogers 2013) of above 80 The Junior Division assessment is
15
specifically administered to all Grade 6 learners attending schools within the province of Ontario
during the months of May and June and under highly standardized conditions (EQAO 2016) The
assessment measures reading writing and mathematical skills in each of the corresponding
sections The mathematics section specifically consists of 36 items of which 28 are multiple choice
items and 8 are constructed-response format questions This study included only the 28 multiple
choice items
While the EQAO does not claim to measure the Knowledge and Skills categories as laid out
in the Ontario Curriculum Grades 1-8 Mathematics 2005 document (Rogers 2013) it still
references each of the mathematics items to one of three of the categories namely that of
Knowledge and Understanding Thinking and Application The category of Communication is not
represented by any of the items as according to Rogers (2013) this skill is not feasible to assess in
a paper-and-pencil based test For items to be referenced to the Knowledge and Understanding
category they need to be recognized as requiring students to demonstrate subject specific content
and comprehend its meaning Those referenced to the Application category need to be recognized
as requiring students to select an appropriate mathematical tool and apply the appropriate
information Lastly those referenced to the Thinking category need to be seen as requiring of
students to select and sequence a variety of tools and think critically in order to solve problems
(Rogers 2013) Items are scrutinized by teachers and other content experts for the process of
allocating items to the most appropriate category Items are further referenced to the five content
areas or strands of the curriculum document according to their content topic namely Number Sense
and Numeration Measurement Geometry and Spatial Sense Patterning and Algebra and Data
Management and Probability
Table 2 shows the representation of each of the Knowledge and Skills categories and the
strands to which the 28 multiple choice items were referenced by the EQAO as well as the item
difficulties (p-values) and discrimination indices (pt-biserial correlations) for each of these items
According to Kaplan and Saccuzzo (2007) item difficulty values should range from 30 to 70 to
16
maximize information about the differences among individuals Furthermore item discriminability
values should not be negative or below 20 to be considered adequate Based on these
recommendations all 28 items were considered suitable to be included in the analyses of this study
Table 2
Knowledge and Skills Categories Strands and Descriptive Statistics of 28 Mathematics Items
Item Know amp Skill Strand p-value pt-biserial
1 K and U Patterning amp Algebra 86 39
14 K and U Patterning amp Algebra 74 43
3 K and U Number Sense amp Numeration 76 37
15 K and U Number Sense amp Numeration 86 35
9 K and U Data Management amp Probability 48 33
19 K and U Measurement 50 27
25 K and U Measurement 76 40
22 K and U Geometry amp Spatial Sense 87 34
73 36
11 App Patterning amp Algebra 81 43
24 App Patterning amp Algebra 70 37
26 App Patterning amp Algebra 40 30
5 App Number Sense amp Numeration 56 38
7 App Number Sense amp Numeration 82 30
10 App Data Management amp Probability 55 47
18 App Data Management amp Probability 78 47
23 App Data Management amp Probability 71 42
2 App Measurement 59 31
8 App Measurement 58 28
20 App Measurement 54 47
6 App Geometry amp Spatial Sense 68 38
64 38
17 Think Patterning amp Algebra 52 36
21 Think Number Sense amp Numeration 57 22
28 Think Number Sense amp Numeration 69 33
4 Think Data Management amp Probability 46 35
13 Think Measurement 54 39
27 Think Measurement 41 46
12 Think Geometry amp Spatial Sense 42 35
16 Think Geometry amp Spatial Sense 54 34
52 35
Notes K and U = Knowledge amp Understanding App = Application Think = Thinking p-value and pt-biserial means
for each Knowledge amp Skill category represented in bold
17
No items had p-values below 30 however 10 items had difficulty values above 70
indicating that they were relatively easy for this sample Since none of the p-values were above
90 they were considered to still possess sufficient variability to be included in the analyses
Furthermore no items had values below the recommended 20 or negative pt-biserial values Table
2 further highlights the item difficulty and discrimination means for each of the three categories
From these values it can be concluded that the items referenced to the Knowledge and
Understanding category were relatively more easy for this sample while those items referenced to
the Thinking category more difficult and those referenced to the Application category moderately
difficult Lastly it is highlighted that a greater number of items represented the Application
category (12 items) than the Knowledge and Understanding and Thinking category which had an
equal number of eight items
33 Data Analysis
The data analyses involved three phases each of which addressed one of the three questions
asked in this study The first phase used Exploratory Factor Analysis (EFA) approaches to
examine the first research question ldquoWhat characterizes the dimensionality of the EQAO
mathematics achievement test administered to Grade 6 students in Ontario public schoolsrdquo
Latent Class Analysis (LCA) approaches were used in the second phase in order to answer question
two ldquoIn which mathematical dimensions and related strands do students demonstrate strengths and
weaknesses in their mathematical achievementrdquo A multinomial logistic regression analysis was
performed to examine research question three ldquoTo what extent are mathematics performance
profiles predicted by student background such as language and length of residence statusrdquo
331 Phase 1 Establishing the Dimensionality of the Assessment
An Exploratory Factor Analysis (EFA) was conducted in order to determine the
dimensionality of the EQAO Grade 6 mathematics test based on 5000 studentsrsquo responses to 28
multiple choice items Although exploratory in nature the EFA was used to examine the extent
18
to which the test dimensionality can be accounted for by knowledge and skills and further by the
strand specified by the EQAO
EFA is a statistical procedure that simplifies the process of visually inspecting a range of
correlations in order to examine the dimensionality of measures (Furr 2011) The 28 multiple
choice items were firstly recoded as binary data thus creating dichotomous categories (0 =
incorrect responses and 1 = correct responses) In order to perform an EFA with this type of
data a more sophisticated statistical software package is required The reason for this being that
standard software such as IBMrsquos SPSS (version 230) creates correlation matrices suitable only
for continuous data that assume a normal distribution (Uebersax 2015) Therefore MPLUS
version 612 (Mutheacuten amp Mutheacuten 1998-2012) was used for the analysis so that a tetrachoric
correlation matrix could be generated to suite the binary data used in this study
When conducting an EFA in Mplus a correlation matrix eigenvalues and model fitting
statistics such as the chi-square test Root Mean Square Error of Approximation (RMSEA) and
Root Mean Square Residual (RMSR) are produced in order to assist with the process of
determining the solution that best fits the data A good fitting model will be represented by a
non-significant chi-square p-value as well as a RMSEA value and RMSR value of below 05
(Schumacker amp Lomax 2004) However interpretability of the model should also be taken into
consideration when deciding on the best solution (Meyers Gamst amp Guarino 2013) The
weighted least-squares with mean (wlsm) estimation method as recommended by Mutheacuten and
Mutheacuten (1998-2012) for binary data and the oblique rotation method (Promax) was used for this
analysis based on the assumption that factors are likely to be correlated with each other
Four steps were implemented during this phase The first step entailed determining the
ideal number of factors to be extracted to best describe the data This entailed a combined
evaluation of the correlation matrix eigenvalues scree plot and fit statistics as described above
The next step entailed an evaluation of the items and their loadings on each of the factors to
determine if any should be discarded in terms of low factor loadings or cross-loadings If any
19
items were deemed unacceptable these were removed and the analysis re-run and subsequently
re-evaluated This step was repeated until a final and appropriate factor solution model was
obtained Following this the reliability for each factor was established followed by an
investigation of the factor correlations in order to determine the uniqueness of each extracted
dimension Ideally items should correlate highly with each other within each extracted
factordimension however for each dimension to be considered unique between-factor
correlations should be low (Rogers 2014) According to Meyers et al (2013) between-factor
correlations should not exceed 80 to warrant the use of a separate dimension The last step
involved an investigation of the similarities between items in each factor in order to describe the
items that make up each This was done firstly in terms of the three Knowledge and Skills
categories and secondly the five strands to which the items were referenced as well as any
further content similarities
332 Phase 2 Identifying Mathematical Strengths and Weaknesses
In an attempt to identify in which mathematical subdomains or dimensions and related
strands learner performances were strongest and weakest as asked in question two of this study a
Latent Class Analysis (LCA) was performed using MPLUS version 612 (Mutheacuten amp Mutheacuten
1998-2012)
Specifically the goal of a mixture model is to reveal unobserved heterogeneous and
meaningful population groups within the larger homogenous population by identifying similarities
in their responses to measured variables (Nylund Asparouhov amp Mutheacuten 2007) These identified
latent populations or sub-groups are called classes Therefore using this analysis allowed for the
generation of distinct performance profiles for each sub-group or class identified as performing
similarly in the largescale assessment In this way more accurate class specific strengths and
weaknesses could be described as opposed to simply those of the overall Grade 6 population
20
For an LCA the outcome variables used are specifically categorical (Nylund et al 2007)
Therefore dichotomously scored response data from the random sample of 5000 students were
used for the LCA The LCA approach is exploratory in nature because the optimal number of
classes representing all latent classes cannot be determined apriori (Nylund et al 2007) Therefore
an investigation of relevant fit statistics generated by the LCA was firstly conducted According to
Pastor Barron Miller and Davis (2007) the fit statistics commonly used to determine the optimum
number of classes include the Bayesian Information Criterion (BIC) the sample-size adjusted BIC
and the Akaike Information Criterion (AIC) where lower values indicate a better fitting model An
Entropy statistic is also commonly used to determine model fit This statistic ranges from 0 to 1
where values closest to 1 indicate higher classification accuracy
Following the identification of the best fitting model the entire sample was profiled in
terms of distinct mathematics classes In order to reduce the number of points on these profiles
items were grouped according to the strand to which they were referenced by EQAO within each
identified factor This allowed for the identification of learner strengths and weaknesses not only
surrounding factors but also each strand within each factor
As part of the LCA mean item probability scores are calculated for each class This statistic
indicates the mean probability for each class to respond correctly to an item and therefore ranges
from 0 to 1 (Nylund et al 2007) Values closest to one therefore indicate a higher probability of
responding correctly to an item Using these values for each item average item-group probability
scores were calculated and these values were then used to describe class specific strengths and
weaknesses This was done firstly by describing overall item-group performances in comparison
to other classes and secondly by describing class performances in each specific factor overall and
lastly in terms of each strand within each factor
21
333 Phase 3 Predicting Class and Profile Membership
In order to answer question three concerning whether or not English as a second language
and length of residence in Canada significantly predicted the performance profile to which a
learner belongs a multinomial logistics regression analysis was conducted This phase was
completed using IBMrsquos SPSS (version 230)
A multinomial logistic regression is used when the dependent variable for the analysis
consists of more than two categorical levels (Meyers et al 2013) Besides the item probability
mean generated by the LCA a class probability mean for each learner in the sample is also
calculated as part of the analysis This class probability indicates the likelihood of a learner
belonging to each of the classes or performance profiles Based on the highest class probability
learners were allocated to one of the performance profiles as generated in phase 2 These classes
were coded 1 2 3 etc based on the number of classes determined to best describe the sample and
represented the dependent or predicted variable of the analysis
Table 3
Six Groups Created Based on English as Second Language and Time Lived in Canada
Group Language Time lived in Canada n
1 Non-ESL CA born 4185 837
2 ESL CA born 308 62
3 Non-ESL Non-CA born lt 5 years 76 15
4 ESL Non-CA born lt 5 years 123 25
5 Non-ESL Non-CA born ge 5 years 199 40
6 ESL Non-CA born ge 5 years 109 22
Notes N = 5000 ESL = English as a second language learner CA born = Born in Canada
An independent variable used for predicting the latent class membership included six
groups based on the following background variables English Second Language (ESL) status as
22
well as whether or not they were Canadian born non-Canadian born but at the time had resided in
the country for less than 5 years or non-Canadian born but at the time had resided in the country for
five years or more This was done in order to avoid clustering ELL learners as a homogenous group
and therefore better identify learners These six categorical data groups represented the predictor
or independent variable Table 3 indicates more precisely how each of the groups were created as
well as their sizes
23
Chapter 4 Results
The results of this study are discussed according to the three questions presented and phases
of data analyses as discussed in Chapter 3 Firstly the results produced from the Exploratory
Factor Analysis (EFA) described in phase one concerning question one are reported Secondly
those produced by the Latent Class Analysis (LCA) in phase two to answer question two and lastly
those produced from the multinomial logistics regression analysis conducted in phase three to
answer question three are presented in this chapter
41 Dimensionality Characteristics
As noted an EFA was conducted on the 28 multiple choice mathematics items in order to
determine the dimensionality of the largescale assessment to which they belonged The
eigenvalues of the tetrachoric correlation matrix (Table 4) produced by Mplus ranged between
862 and 41 the first three factors showed eigenvalues greater than 1 and accounted for 3953 of
the total variance
Table 4
Eigenvalues of Correlation Matrix indicating Total Variance Explained
Item Eigenvalue Item Eigenvalue Item Eigenvalue Item Eigenvalue
1 86 2 13 3 10 4 93
5 91 6 90 7 87 8 85
9 84 10 80 11 79 12 76
13 74 14 72 15 70 16 69
17 66 18 65 19 64 20 63
21 60 22 57 23 53 24 52
25 50 26 49 27 46 28 41
24
411 Determining the Best Fitting Factor Solution Model
The eigenvalues scree plot and fit statistics were used to determine the best number of
factors to describe this data set Based on the ldquonumber of eigenvalues greater and equal to one
rulerdquo as suggested by Meyers et al (2013) together with the scree plot and relevant fit statistics it
seemed adequate to extract three factors albeit accounting for less than 50 of the variance
Figure 1 Scree plot
Although three eigenvalues were produced greater and equal to one suggesting the
existence of three factors this was contradicted by the scree plot (Figure 1) which suggested the
existence of only two factors as it appeared to level off mostly at number three Subsequently a
comparison of the one to three factor solutions was conducted in terms of the relevant fit statistics
as described in Table 5
The significant chi-square p-values (lt 001) generated for the one and two factor solutions
suggested that the data differed significantly from the model matrix Although the chi-square p-
value has been criticized in the past for being overly sensitive to large sample sizes and therefore
0
05
1
15
2
25
3
35
4
45
5
55
6
65
7
75
8
85
9
1 2 3 4 5 6 7 8 9 10 11 12 13 14 15 16 17 18 19 20 21 22 23 24 25 26 27 28
Eig
envalu
es
Items
25
almost always producing a significant value (Meyers et al 2013) this was determined not to be the
case for this analysis as the p-value generated in the three factor model increased substantially
from the one to two factor model thus ensuring the reliability of this value
Table 5
EFA Model Fit Statistics of the 1 to 3 Factor Solutions on 28 Mathematics Items
FA model Chi-Square df p-value RMSEA RMSR
1 92476 350 lt 001 018 031
2 44012 323 lt001 009 021
3 34390 297 032 006 019
Note N = 5000
Therefore since the Chi-square p-value of 032 of the three factor model was not significant
(at the 001 probability level) as well as the fact that only two items represented the fourth factor in
the four factor solution model it was deemed a good fitting model The values of 006 and 019 of
the RMSEA and RMSR respectively were well below the 05 recommended value providing
further support for this three factor solution model
A further inspection of the factor loadings from the three-factor solution as well as of the
items on each factor resulted in the removal of four items (ie 12 18 23 and 24) Items 18 23 and
24 were discarded as a result of low factor loading scores below 30 Whereas a decision was made
to remove Item 12 as it was the only item referenced to the Thinking category that did not load on
the factors in the same way that the others did Table 6 presents the final factor loadings with the
Knowledge and Skills categories to which items were originally allocated by the EQAO that is
knowledge and understanding application and thinking
The Promax factor correlation matrix produced by Mplus (Table 7) revealed that all three
factors correlated positively and moderately to high with one another The strongest correlation
26
existed between Factor 1 and Factor 3 with a relatively high coefficient value of 747 while the
weakest correlation existed between Factor 1 and Factor 2 with a coefficient of 576
Table 6
Factor Loadings of the 23 Items used in the Final 3 Factor Solution Model
Item Knowledge amp Skill Factor 1 Factor 2 Factor 3
1 KU 64 -09 13
11 App 63 -04 12
14 KU 55 13 01
6 App 51 12 -04
15 KU 51 -05 14
10 App 47 23 05
7 App 45 -12 13
25 KU 38 09 17
3 KU 35 -01 24
9 KU 35 09 07
22 KU 31 07 23
5 APP 30 09 22
13 App 10 65 -05
27 Think -04 63 23
2 Think -07 50 12
20 App 14 -03 59
17 Think -04 04 55
26 App 13 01 33
8 App 11 -01 32
28 Think 15 03 32
16 Think 11 10 31
4 Think 14 12 30
21 Think -04 08 30
α = 725 α = 536 α = 565
Notes KU = Knowledge and Understanding App = Application Think = Thinking category
As stated earlier according to Meyers et al (2013) correlations should not exceed 80 to warrant
the use of separate factors These results are therefore considered to reveal the existence of three
27
unique factors that can be used to describe the multidimensionality of these mathematics multiple
choice items
Table 7
Promax Factor Correlations Between 3 Factors
Factors FA 1 FA 2
Factor 1
Factor 2 576
Factor 3 747 626
Note N = 5000
As indicated in Table 6 Factor 1 consisted of 12 items in total with factor loading scores
ranging between 30 and 64 and achieved a relatively high Cronbachrsquos alpha of 725 All seven
items referenced to the Knowledge and Understanding category used in the final model loaded
together on Factor 1 along with five items referenced to the Application category Factor 2
consisted of only three items with factor loading scores ranging between 50 and 63 and
achieved a moderate Cronbachrsquos alpha of 536 In Factor 2 two items referenced to the Thinking
category and one to the Application category loaded together to make up the total of three items
for this factor Lastly Factor 3 consisted of a total of eight items with factor loading scores
ranging between 30 and 59 and also achieved a moderate Cronbachrsquos alpha score of 565 The
remaining five items referenced to the Thinking category and three items referenced to the
Application category loaded together to make up the eight items that loaded together on Factor 3
In terms of the strands to which the items in Factor 1 were referenced for instance
Patterning and Algebra etc no clear similarities appeared to exist to tie all the items together
based on this However similarities seemed to exist in terms of the applied skill requested of
learners to solve the mathematical problems It appeared that all the items of this factor merely
requested of learners to apply their mathematical knowledge in terms of procedures and
conceptual understanding to answer the questions For instance Item 15 which is referenced to
28
the Knowledge and Understanding category asks the following ldquoWhat is the value of 0730 ndash
0156rdquo Whereas Item 5 which is referenced to the Application category asks that learners
solve problems involving the addition of decimal numbers (the exact question was not released)
Therefore it was determined that no clear difference existed between the applied skill requested
from these two items even though they were referenced to two different Knowledge and Skills
categories It was therefore concluded that Factor 1 could be described as measuring the
application of mathematical knowledge to solve problems in various strands
An inspection of the items that loaded together on Factor 2 revealed that two of the items
were referenced to the Thinking category while one of the items was referenced to the
Application category Furthermore all three items were similar in that that they covered the
ldquoMeasurementrdquo strand and more specifically that all three items requested of learners to solve
problems relating to ldquoAreardquo Item 2 for instance asks ldquoThe parallelogram below will be cut
into two congruent triangles (provides dimensions) What is the area of one of the trianglesrdquo
Item 13 asks ldquoWhich of the following shows a rectangle and a triangle that have the same areardquo
and lastly Item 27 requests that learners compare the areas of two polygons (exact item not
released) Item 2 was referenced to the Application category whereas Items 13 and 27 were
referenced to the Thinking category It was therefore determined that Factor 2 could be
described as requesting of learners to apply thinking processes or skills such as problem solving
and reasoning in order to solve deeper mathematical problems specifically surrounding the
Measurement topic of ldquoAreardquo
Lastly for Factor 3 as with Factor 1 no clear similarities appeared to exist to tie all the
items together based on strands However as with Factor 1 similarities seemed to exist in terms
of the applied skill requested of learners to solve the mathematical problems It appeared that
all the items on this factor requested of learners to apply thinking skills to solve deeper
mathematical problems surrounding various strands in other words learners had to go beyond
the mere application of content knowledge to solve these items For instance Item 20 referenced
29
to the Application category requested that learners solve the following problem ldquoEach beaker of
water below has a capacity of 2L Which beaker appears to have about 500ml of water in itrdquo
Whereas Item 28 referenced to the Thinking category asks ldquoMrs Garrett sends surveys to 120
students and 78 students return the survey Which statement best describes the percent of
students who return the surveyrdquo Again no clear difference appeared to exist between the
applied skill requested of learners in terms of the Application and Thinking categories to which
the items were referenced It was therefore concluded that Factor 3 could be described as
measuring the ability of learners to apply thinking processes or skills such as problem solving
and reasoning in order to solve deeper mathematical problems in various strands
In sum the results of the EFA determined that a three factor model could be used to
adequately characterize the dimensionality of the multiple choice mathematics items on the
EQAO assessment Twelve items clustered adequately together in terms of factor loading scores
to form Factor 1 which achieved a relatively high Cronbachrsquos alpha of 725 three items on
Factor 2 which achieved a moderate Cronbachrsquos alpha of 536 and lastly eight items on Factor
3 which also achieved a moderate Cronbachrsquos alpha score of 565 Upon closer inspection of
the items on each factor and in terms of the Knowledge and Skills categories and strands to
which they were referenced by the EQAO it was determined that Factor 1 could be best
described as measuring the ability of learners to apply mathematical knowledge related to
procedural and conceptual understanding in order to solve problems in various mathematical
strands Factor 2 could be best described as measuring the ability of learners to apply process
or thinking skills in order to solve problems related specifically to the topic of ldquoAreardquo
Lastly Factor 3 could be best described as measuring the ability of learners to apply thinking
skills in various mathematical strands
30
42 Mathematical Strengths and Weaknesses
In an attempt to identify in which mathematical dimensions and related strands Grade 6
learner performances were strongest and weakest as asked in question two of this study a Latent
Class Analysis (LCA) was conducted This allowed for distinct performance profiles to be
generated for classes or sub-groups performing similarly in the population and therefore allowed
for more accurate descriptions of strengths and weaknesses The factors as established in the
dimensionality investigation in Phase 1 of this study were used to represent the dimensions for this
analysis
Although the four class model achieved the lowest AIC BIC and Sample-Size Adjusted
BIC statistic values in comparison to the two and three class model it also produced a much lower
Entropy value of 69 (see Table 8) Therefore it was decided that since these statistics did not
decrease that much from the three class to four class model the use of the four class model with a
much lower Entropy value did not seem warranted Thus the three class model was opted for
instead as it produced lower fit statistics than the two class model as well as a sufficiently high
Entropy value of 75 Furthermore the results indicated that each class was represented by the
following proportion of learners from the sample Class 1 comprised of 321 Class 2 of 452
and Class 3 of 227
Table 8
LCA Fit Statistics for 2 3 and 4 Classes
Fit statistics 2 Classes 3 Classes 4 Classes
AIC 12974224 12808557 12789120
BIC 13004854 12854829 12851034
Adj BIC 12989919 12832268 12820846
Entropy 81 75 69
Notes N = 5000 AIC = Akaike Information Criterion BIC = Bayesian Information Criterion Adj BIC = Sample-
Size Adjusted Bayesian Information Criterion
31
Eleven item-groups were created to describe the strengths and weaknesses of the three
classes as represented in Table 9 Item-groups were created by grouping items according to the
factor they were determined to measure (as established in the EFA) as well as the strand to which
they were allocated by the EQAO Five item-groups were created for Factor 1 one item-group for
Factor 2 and five groups for Factor 3 The number of items within each item-group varied from 1
item to 4 items The mean probability scores calculated for each class for each item-group and
overall dimension or factor are also represented in Table 9 These mean item-group probability
scores as presented in Table 9 were used to plot three distinct performance profiles for each class as
represented in Figure 2 below
Table 9
Item-Groups created to Describe Mathematical Performances of Grade 6 Learners
Factor Content Area of items Class 1 Class 2 Class 3
1 Patterning amp Algebra 3 97 86 48
1 Measurement 1 95 78 44
1 Geometry amp Spatial Sense 2 94 79 50
1 Number Sense amp Numeration 4 92 76 49
1 Data Management amp Probability 2 78 49 19
Factor 1 class probability means 91 74 44
2 Measurement (Area) 3 85 39 28
Factor 2 class probability means 85 39 28
3 Patterning amp Algebra 2 67 43 20
3 Measurement 2 79 55 25
3 Geometry amp Spatial Sense 1 79 47 31
3 Number Sense amp Numeration 2 80 60 44
3 Data Management amp Probability 1 72 40 22
Factor 3 class probability means 76 51 29
Note The factor probability means presented in bold are slightly higher as the actual item probability score was used
to calculate these values and not the item-group probability scores
Using the evidence generated from the mean item-group and factor probability scores as
represented in Table 9 and Figure 2 these performance profiles were used to describe the strengths
32
and weaknesses of each class Class specific strengths and weaknesses were described according
to firstly overall performances in the 11 item-groups in comparison to the other classes secondly
in terms of overall performances in each dimension (Factor 1 2 and 3) and lastly in terms of
performances in each strand within each dimension for Factor 1 and 3 only (as Factor 2 only
represented Measurement topic of ldquoAreardquo) A mean item-group probability score ranging from 86
- 10 was described as especially strong 71 - 85 as strong and 56 - 70 as moderately strong
while those scores ranging from 41 - 55 were described as moderately weak 26 - 40 as
moderately weak and 25 and below as especially weak
Figure 2 Three performance profiles of Grade 6 learners in 11 mathematical item-groups
Results indicated that those learners most likely to belong to Class 1 performed higher than
Class 2 and 3 in all item-groups Therefore this class to which 321 of learners from the sample
belonged can be best described as the highest performing and second largest group overall Those
most likely to belong to this class can be described as having an especially strong ability to apply
0
01
02
03
04
05
06
07
08
09
1
Item
-Gro
up
Mea
n P
rob
ab
ilit
y
Item-Groups
Class 1 (321) Class 2 (452) Class 3 (227)
33
mathematical knowledge in order to solve problems in various strands This was determined by the
average 91 overall probability for success achieved for those items related to Factor 1 They can
also be described as having a strong ability to apply thinking skills in order to solve problems
surrounding the Measurement topic of ldquoAreardquo and strong ability to do the same in various strands
This was determined by the 85 probability for success achieved for those items related to Factor
2 and 76 probability for success achieved for those related to Factor 3 Furthermore their overall
performances in the knowledge dimension can be described as stronger in comparison to their
performances in the thinking dimensions
Specifically concerning their ability to apply mathematical knowledge in various strands
(Factor 1) these learners can be described as performing slightly stronger in the Patterning and
Algebra (item-group probability score = 97) and considerably weaker in Data Management and
Probability (item-group probability score = 78) in relation to their performances in the other
strands Specifically regarding their ability to apply think skills in order to solve problems (Factor
3) they can be described as performing slightly stronger in Number Sense and Numeration (item-
group probability score = 80) and considerably weaker in Data Management and Probability (item-
group probability score = 72) and Patterning and Algebra (item-group probability score = 67) with
the latter being the weakest in relation to their performances in the other strands
Results further indicated that those learners most likely to belong to Class 2 performed
overall lower than Class 1 but higher than Class 3 in all item-groups Therefore this class to
which 452 of the learners belonged can be best described as the intermediate performing and
largest group overall Those most likely to belong to this class can be described as having a strong
ability to apply mathematical knowledge in order to solve problems in various strands This was
determined by the average 74 overall probability for success achieved for those items related to
Factor 1 They can also be described as having a weak ability to apply thinking skills in order to
solve problems surrounding the Measurement topic of ldquoAreardquo and moderately weak ability to do
the same in various strands This was determined by the 39 probability for success achieved for
34
those items related to Factor 2 and 51 probability for success achieved for those related to Factor
3 Furthermore their overall performances in the knowledge dimension can be described as
stronger in comparison to their performances in the thinking dimensions
Specifically concerning their ability to apply mathematical knowledge in various strands
(Factor 1) performances for these learners can be described as considerably stronger in Patterning
and Algebra (item-group probability score = 86) and considerably weaker in Data Management
and Probability (item-group probability score = 49) in relation to their performances in the other
strands Specifically regarding their ability to apply thinking skills in order to solve problems
(Factor 3) performances can be described as stronger in Number Sense and Numeration (item-
group probability score = 60) and considerably weaker in Data Management and Probability (item-
group probability score = 40) and Patterning and Algebra (item-group probability score = 43) with
the former being the weakest in relation to their performances in the other strands
Lastly results indicated that those learners most likely to belong to Class 3 performed lower
than Class 1 and 2 in all item-groups Therefore this class to which 227 of learners belonged
can be best described as the lowest performing group overall Those most likely to belong to this
class can be described as having a moderately weak ability to apply mathematical knowledge in
order to solve problems in various strands This was determined by the average 44 overall
probability for success achieved for those items related to Factor 1 They can also be described as
having a weak ability to apply thinking skills in order to solve problems surrounding the
Measurement topic of ldquoAreardquo and weak ability to do the same in various strands This was
determined by the 28 probability for success achieved for those items related to Factor 2 and
29 probability for success achieved for those related to Factor 3 Furthermore their overall
performances in the knowledge dimension can be described as stronger in comparison to their
performances in the thinking dimensions
Specifically concerning their ability to apply mathematical knowledge in various strands
(Factor 1) it was determined that these learners can be described as performing slightly stronger in
35
Geometry and Spatial Sense (item-group probability score = 50) and considerably weaker in Data
Management and Probability (item-group probability score = 19) in relation to their performances
in the other strands Specifically regarding their ability to apply thinking skills in order to solve
problems (Factor 3) their performance can be described as considerably stronger in Number Sense
and Numeration (item-group probability score = 44) and weaker in Data Management and
Probability (item-group probability score = 22) and Patterning and Algebra (item-group
probability score = 20) with the latter being the weakest in relation to their performances in the
other strands
In sum the results of the LCA revealed that three classes could be used to best describe the
performances of Grade 6 learners in the three dimensions as established during the EFA and their
related strands Class 1 was described as the highest performing and second largest group The
learners in the class were described as performing especially strong in Factor 1 (namely their
ability to apply mathematical knowledge to solve problems in various strands) strong in Factor 2
(namely their ability to apply thinking skills to solve problems specifically related to the
Measurement topic of ldquoAreardquo) and in Factor 3 (namely their ability to apply thinking skills in order
to solve problems in various strands) Class 2 was described as the intermediate performing and
largest group and performing strong for Factor 1 weak for Factor 2 and moderately weak for
Factor 3 Lastly Class 3 was described as the lowest performing and smallest group and
performing moderately weak for Factor 1 and weak for both Factor 2 and 3 For all classes overall
factor performances were described as weaker in the thinking dimensions namely Factor 2 and 3
than in the knowledge dimension namely Factor 1 A greater discrepancy between these
mathematical knowledges and thinking skills dimensions appears to exist for those in Class 2 than
for those in Class 1 and 3
Lastly in terms of describing the performances of each class in the strands related to each
factor for Factor 1 and 3 results revealed clear similarities between all classes in terms of those in
which performances were described as weaker For all classes regarding Factor 1 their ability to
36
apply mathematical knowledge within the Data Management and Probability strand was described
as the weakest in relation to the other strands For all classes regarding Factor 3 their ability to
apply thinking skills in the Patterning and Algebra and Data Management and Probability strand
was described as weakest in relation to their performances in the other strands
43 Predicting Mathematics Profiles by Language and Length of Residence Background
To avoid treating learners as homogenous groups based on their language background they
were allocated to one of six groups according to their ESL designation and length of residency in
Canada The six groups represented the predictor variable (independent variable) whereas the three
classes or performance profiles were treated as the predicted or dependent variable Class 1
namely the highest performing profile group was used as the reference category
Results of this analysis indicated that the final model did not significantly predict class and
performance profile membership with a -2 Log likelihood of 7740 and a Chi-square value of 957
(10 N = 5000) p = 48 The upper portion of Table 10 presents the regression coefficients the
Wald test adjusted odds ratio [Exp(B)] and the 95 confidence intervals (CI) for odds ratios for
the predictor contrasting Class 2 to Class 1 The lower portion of the table presents the regression
coefficients the Wald test adjusted odds ratio [Exp(B)] and the 95 confidence intervals (CI) for
odds ratios for the predictor contrasting Class 3 to Class 1
Results therefore revealed that ESL status and residence in Canada did not significantly
predict class or profile membership regardless of group allocation In other words regardless of
group allocation learners were found to be equally likely to belong to either Class 1 (highest
performing group) Class 2 (intermediate performing group) or Class 3 (lowest performing group)
and therefore perform according to the related profile as indicated earlier in Figure 2
37
Table 10
Parameter Estimates for Six Groups on 3 Classes
Model B SE - B Wald df Exp(B) 95 CI EXP (B)
Class 2
Intercept 43 23 351 1
Group 1 -07 23 09 1 93 60 ndash 147
Group 2 06 26 06 1 107 64 ndash 178
Group 3 -60 35 296 1 55 277 ndash 109
Group 4 01 31 00 1 101 55 ndash 183
Group 5 -08 28 09 1 92 54 ndash 158
Class 3
Intercept -13 26 27 1
Group 1 -23 26 74 1 80 48 ndash 133
Group 2 -20 31 42 1 82 47 ndash 149
Group 3 -36 39 84 1 70 33 ndash 150
Group 4 -35 37 92 1 70 34 ndash 144
Group 5 -53 33 255 1 59 31 ndash 113
Notes p lt 001 N = 5000 Class 1 is the reference category Group 1 = Non-ESL CA Born (n = 4185) Group 2 =
ESL CA Born (n = 308) Group 3 = Non-ESL Non-CA born but living in country less than 5 years (n = 76) Group 4
= ESL Non-CA born but living in country less than 5 years (n = 123) Group 5 = Non-ESL Non-CA born but living in
country 5 years or more (n = 199) Group 6 = ESL Non-CA born but living in country 5 years or more (n = 109)
38
Chapter 5 Discussion
The purpose of this study was to move beyond the total scores of a largescale assessment
in order to gain better insight into the mathematical performances of Ontariorsquos Grade 6 learners
In doing so it aimed to provide evidence of learner strengths and weaknesses in different aspects
of mathematics education on which to base remedial decisions for the improvement thereof
Using the responses of a random sample of 5000 Grade 6 learners to 28 multiple choice
mathematics items on the 20132014 EQAO Junior Division assessment an Exploratory Factor
Analysis (EFA) was firstly performed in order to investigate the dimensionality characteristics
of the assessment This was followed by a Latent Class Analysis (LCA) to determine learner
strengths and weaknesses related to the established mathematical dimensions and their related
strands Lastly a multinomial logistic regression analysis was performed in order to examine the
extent to which mathematics performance profiles were predicted by student background factors
such as language and length of residency in Canada This chapter discusses the findings of these
analyses study limitations and lastly recommendations for future research and education
51 What Characterizes the Dimensionality of the EQAO Mathematics Achievement Test Administered to Grade 6 Students in Ontario Public Schools
The multiple choice mathematics items on the EQAO assessment were characterized as
measuring the ability of learners in three interrelated yet separate mathematical dimensions
These being the ability of learners to apply mathematical knowledge related to procedural
knowledge and conceptual understanding to solve problems in various strands (Factor 1) the
ability to apply process or thinking skills such as problem solving or reasoning skills to solve
problems in ldquoAreardquo (Factor 2) and lastly the ability to apply process or thinking skills to solve
39
problems in various mathematical strands The three factors produced achieved on average
moderate reliability scores
These findings regarding the characteristics of the dimensions were considered valuable
as they allowed for the comparison of learner abilities in two essential elements of mathematical
proficiency as aligned with the Principles and Standards for School Mathematics (NCTM
2000) and as a result also with the Ontario mathematics curriculum which shares the same
foundations Only once this happens namely learner ability measured directly in relation with
mathematical curriculum expectations can we begin an effective process of remediation
(Kilpatrick et al 2001) These elements were that of mathematical knowledge consisting of
procedural and conceptual knowledge as measured by Factor 1 of this study and process or
thinking skills such as problem solving and reasoning as measured by Factor 2 and 3 Factor 2
and 3 were determined to differ based solely on the content of the items included in the
assessment This finding highlights concerns regarding the fair representation of all curriculum
expectations on the assessment and thus warrants further investigation
The fact that the ability to apply mathematical knowledge and the ability to apply
thinking skills in order to solve mathematical problems were found to be sufficiently unique
dimensions to warrant their use using the multiple choice items on this largescale mathematics
assessment adds further value to the findings of this study These findings are valuable in that
they attest to the future potential for assessment organizations to report learner performances
beyond that of total scores as demanded by those in the educational field However since the
factors achieved only moderate reliability scores we are reminded of the need for these tests to
be designed upon foundations aligned with those of the curriculum expectations they are
employed to assess from the start in order for them to meet better test properties (Chudowsky amp
Pellegrino 2003 Rogers 2014)
40
52 In which Mathematical Dimensions and Related Strands do Students Demonstrate Strengths and Weaknesses in their Mathematical Achievement
Three classes were determined to best describe the performances of all Grade 6 learners
in the established dimensions and their related strands Class 1 was described as the highest
performing and second largest group consisting of 321 of the learners Class 2 was described
as the intermediate performing and largest group consisting of 452 of the learners and lastly
Class 3 was described as the lowest performing and smallest group consisting of only 227 of
the learners from the sample
The results of this analysis further revealed that all three classes performed weaker in
their ability to apply thinking skills in order to solve problems either specifically surrounding
the topic of Area or in various strands than in their ability to apply mathematical knowledge in
order to do the same The performances of those in Class 1 were described as especially strong
in the mathematical knowledge dimension (Factor 1) and strong in the thinking dimensions
(Factor 2 and 3) Class 2 was described as strong in the mathematical knowledge dimension but
weak in the thinking skills dimensions and lastly Class 3 was described as moderately weak in
the mathematical knowledge and thinking skills dimensions The discrepancy between
performances in the two subdomains namely mathematical knowledge and thinking skills thus
appeared to be largest for those in Class 2 the intermediate performing and largest group
The findings concerning the overall performances of students in the two subdomains of
mathematical knowledge and thinking skills aligns with those concerning the performances of
US students as described by Kilpatrick et al (2001) They highlight that research evidence over
the past 30 years has consistently indicated that although US students do not fare badly in
applying their knowledge to solve basic mathematical problems they tend to have a limited
41
understanding of mathematical concepts and are noticeably deficient in their ability to apply
mathematical thinking skills to solve even simple problems
It may however be argued that this finding namely a weaker performance in thinking
skills than mathematical knowledge is to be expected given the fact that applying thinking skills
in order to solve problems is a more challenging task than simply applying what you know
(Schoenfeld 2007) However studies have also found that a strong mathematical knowledge
base leads to a better ability to apply thinking skills to solve deeper problems (Stokke 2015)
Thus given the inter-relatedness of these two dimensions together with the large discrepancy
between them for those in Class 2 (strong mathematical knowledge but weak thinking skills)
these findings demonstrate a weakness in the majority of Ontariorsquos Grade 6 learners to apply
thinking skills to solve deeper mathematical problems This finding holds important
recommendations for future research and mathematics educational practices as will be discussed
in the section below
Upon further investigation of learner performances in each of the strands as they relate to
the dimensions it was determined that all three classes performed much weaker in their ability to
apply mathematical knowledge in the Data Management and Probability strand than in the other
strands This strand was also determined to be the weakest in the thinking skills dimension
along with Patterning and Algebra This finding contradicts those of Tatsuoka Corter and
Tatsuoka (2004) in which it was found that students in the US appeared to perform poorest in
Geometry and Spatial Sense Given the inter-relatedness of mathematical knowledge and ability
to apply thinking skills as previously highlighted by Stokke (2015) this finding concerning Data
Management and Probability attests to a knowledge base weakness for Grade 6 Ontario learners
specifically surrounding this strand As for the results surrounding Patterning and Algebra they
appear to provide further support for the weak ability of the learners to apply thinking skills
42
given their relatively strong mathematical knowledge surrounding this strand These findings
also hold valuable recommendations for educational practices in Ontario which will be further
discussed below
53 To What Extent Are Mathematics Performance Profiles Predicted by Student Background such as Language and Residence Status
Findings from this analysis revealed that language background and length of residence in
Canada did not significantly predict performance profile membership Therefore regardless of
group allocation based on these variables all learners were equally likely to achieve a Class 1
(high performing) Class 2 (intermediate performing) or Class 3 (low performing) profile as
described in this study
These findings contradict the Jang et al (2013) study on the performance of learners in
reading In that study it was found that different reading patterns were achieved based on ELL
and length of residence status It was further determined that non-English speakers outperformed
monolinguals in reading achievement after living in the country for five years or more These
findings therefore do not appear to hold true for the performances of learners in mathematics
based on these variables as all learner groups were equally likely to achieve one of the three
performance profiles produced in this study However it needs to be acknowledged that this
study focused on ESL designation as opposed to ELL status which may have contributed to the
differences in findings Nonetheless these findings are considered valuable in that they provide
reassurance of the fact that the test results were not confounded by differences in language
proficiency and that the EQAO test was not biased towards first language speakers
The findings of this study further contradict those that found that English first language
speakers outperformed those for whom English was not their first language (Abedi amp Lord
43
2001 Howie 2003) Therefore they help shed perceptions of differences in mathematical
performances based solely on the aspect of language background This finding holds important
implications for mathematics education for these population groups as well as future research
54 Study Limitations
The following study limitations have been recognized and should thus be taken into
consideration when reviewing these findings Firstly this study analyzed the mathematical
performances of learners based on the results of a standardized test only We are therefore
reminded of the fact that many factors influence test scores over and above that which is random
These include the testing situation tester characteristics and test-taker characteristics (Kaplan amp
Saccuzzo 2009) For this reason it is important that learner performances in other assessment
environments also be considered such as classroom-based assessment activities
Secondly the findings of this study were based solely on learner performances on the
multiple choice items According to Schoenfeld (1992) most multiple choice items are machine
graded which limits their ability to measure learner conceptual understanding and problem
solving abilities to the degree that most people would like For this reason it is important that
future studies consider including the open response questions included on the assessment for a
better reflection of learner conceptual understanding and problem solving
Thirdly this study included performances of learners based solely on a single EQAO
administration and its data Although EQAO proclaims to instill rigorous test equating
procedures to ensure that test difficulty and discrimination properties are not compromised
across years (Rogers 2013) this does not guarantee that learner performances can be generalized
to all Grade 6 learners Furthermore this study focused on only those who took the English
44
version of the test therefore generalizing these findings to those who took the French version
should be done cautiously
Lastly the small ESL population size in comparison to the non-ESL population limits the
findings of this group and may therefore not accurately reflect their performances Furthermore
this study used ESL designation as opposed to ELL status ESL designation is a program in
which learners are enrolled or unenrolled throughout the year Therefore these findings may not
reflect that of the entire ELL population
55 Recommendations and Future Research
In light of recent poor mathematical performances of Ontariorsquos elementary learners the
education minister announced its ldquoRenewed Math Strategyrdquo designed for the purposes of
combatting further decline (Brown 2016) In this strategy requirements for improving the
performances of learners in mathematics were announced such as all learners in Grade 1-8 to
receive at least 60 minutes of mathematics instruction per day further support for weaker
schools in terms of more professional development for teachers as well as more support for
learners and parents surrounding this discipline As this study made apparent in the beginning
such strategies risk being only blanketed approaches that do not really target the heart of the
problem if not accompanied by further insight into the results upon which they are based
This study was conducted in an attempt to gain such insight and found that although
Ontario Grade 6 learners display strong mathematical knowledge the majority are particularly
weak in applying thinking skills such as reasoning and problem solving to solve deeper
mathematical problems It was further determined that learners are particularly weakest in the
Data Management and Probability strand for both mathematical knowledge and thinking skills
dimensions as well as the Patterning and Algebra strand in the latter dimension It was lastly
45
determined that background variables of language and length of residence did not significantly
predict performance and profile achievement and that both ESL and non-ESL learners were
equally likely to belong to high intermediate and low performing groups regardless of length of
residence in Canada Based on these findings the following recommendations surrounding
future research endeavors and educational practices specifically in conjunction with mathematics
education in Ontario will be discussed below
The Ontario Curriculum Grades 1-8 Mathematics 2005 document indicates that the
ultimate goal for mathematics education is to develop learner proficiency beyond that of content
knowledge and therefore also calls for the development of a deeper understanding of the
discipline along with essential thinking skills In order to accomplish these goals the
curriculum highlights that instructional practices need to deviate from a sole focus on direct
teaching methods to incorporate methods of teaching and learning through problem solving in
other words problem-based learning approaches Stokke (2015) blames this greater emphasis of
teaching mathematics using problem-based teaching strategies for the recent decline of Ontario
learnersrsquo mathematical performances She argues that the lack of direct instruction has robbed
learners of a sound knowledge base from which to draw upon when attempting to solve deeper
mathematical problems hence the weakness in this area
However the findings from this study provides evidence that contradicts this argument
as results point to the fact that the majority of Grade 6 learners in Ontario actually do possess
strong mathematical knowledge This finding may therefore perhaps be an indication of the
fact that a large portion of Ontario teachers still rely predominantly on teaching mathematics
using traditional direct teaching methods as opposed to those better suited to meet current
curriculum goals and expectations This finding therefore warrants further investigation into
current teaching trends and holds valuable insight as to where to direct efforts for remediation
46
In order to meet reformed curriculum goals and expectations teaching practices need to
change for which the teacher is the key actor (Ross amp McDougall 2006) Therefore this study
supports those calling for increased efforts directed at teachers and the need to reshape their roles
and perceptions of what it means to ldquoteachrdquo mathematics in a reformed curriculum classroom
For instance Milgram (2007) urges for strategies directed at ensuring that teachers truly
understand what it means to teach using problem-based teaching methods to develop thinking
skills He further illustrates that teaching thinking skills such as problem solving is a
challenging task as it is in itself complex involving both verbal and nonverbal mental processes
For this reason it is essential that learners solve problems for which the answer is not apparent
and requires a novel idea if we wish to effectively develop these skills (Milgram 2007) Such a
teaching and learning process requires that teachers step back allowing learners to grapple with
the task before them as well as interact with each other stepping in only when necessary to
guide the process (Milgram 2007)
Changing the role of the teacher from the traditional sole knowledge bearer and
transferor to one in which heshe shares the responsibility of learning with students is however
only one of 10 dimensions that requires attention when urging teachers to adopt instructional
practices better suited to accomplish curriculum goals and expectations (Ross amp McDougall
2007) Ross and McDougall (2006) further illustrate that in order to ensure that teaching for
deeper understanding as aligned with current reformed mathematics education takes place
teachers need to consider change in all 10 of these dimensions These dimensions as cited in
Ross and McDougall (2006) are summarized as follows 1) the need for program scope 2)
access to all forms of mathematics by students 3) raising self-confidence of students by teachers
4) complex and open-ended student tasks 5) instruction that focuses on constructing
mathematical ideas through self-discovery 6) change in the role of teachers to that of co-learner
47
and co-knowledge creator 7) solving of mathematical problems with the aid of manipulatives 8)
classroom organization in a manner that promotes sharing and interaction for solutions 9)
authentic assessment and lastly 10) a conception of mathematics as a dynamic subject by
teachers
Specifically regarding the first dimension namely the need for program scope Ross and
McDougall (2006) describe it as urging teachers to teach multiple mathematical strands with
increased attention on those less commonly taught such as the Data Management and
Probability and Patterning and Algebra strands The results of this analysis indicated that
learners were weakest in precisely these two strands therefore perhaps providing evidence in
support of the fact that these strands are given less attention by Ontario teachers when teaching
the mathematics curriculum expectations This finding therefore provides added support for the
need to further promote the implementation of these 10 dimensions of teaching for deeper
understanding as indicated above so as to ensure that teachers view all curriculum strands as
equally important and deserving of attention
In calling for these increased efforts directed at changing the way in which mathematics
teaching and learning occurs in classrooms it is important to acknowledge the fact that this is
easier said than done Teaching in a manner that supports the development of a deeper
understanding for mathematics and promotes thinking skills is a lengthy process that takes time
(Milgram 2007) A commodity in short supply for the teacher already feeling pressured to
cover all curriculum expectations before mandatory accountability assessments take place
(Milgram 2007) Therefore not only does this study call for increased efforts directed at
changing teacher perceptions and instructional practices in the classroom but also for policy
makers to consider practical constraints placed on teachers that may restrict the implementation
thereof
48
Lastly the need to predict mathematical performances of learners based on background
variables is made apparent by Hinton (2014) who found that early success in mathematics
predicts future success Therefore for the sake of early intervention especially for the lowest
performing group identified in this study it is urged that further research studies be directed at
determining background variables that better predict performances However it is further urged
that such studies focus on class or profile membership as used in this study as opposed to overall
mathematics performances used in the past In this way not only will we be able to better
identify low intermediate and high performers but also their related strengths and weaknesses
upon which specific remedial efforts can be targeted As for the equal likelihood of ESL and
non-ESL learners to achieve either low intermediate or high performing profiles this study
recommends future studies targeted at shedding perceptions of non-English speakers
underperforming in relation to first language speakers that have perhaps been shaped by previous
studies Without doing so we risk assuming the need for remediation directed at one group
whilst ignoring the needs of others
49
References
Abedi J amp Lord C (2001) The language factor in mathematics tests Applied Measurement
in Education 14(3) doi 101207S15324818AME1403_2
Brown J (2016) Elementary student to get hour of math every day under new Ontario plan
Retrieved July 23 2016 from
httpswwwthestarcomyourtorontoeducation20160404elementary-students-to-get-
hour-of-math-every-day-under-new-ontario-planhtml
Chudowsky N amp Pellegrino JW (2003) Large-scale assessments that support learning what
will it take Theory into Practice 42(1) 75+ Retrieved from
httpgogalegroupcommyaccesslibraryutorontocapsidop=AONEampu=utoronto_mai
nampid=GALE|A99909373ampv=21ampit=rampsid=summonampuserGroup=utoronto_mainampauth
Count=1
Collins L K amp Lanza S T (2010) Latent class and latent transitional analysis with
applications in the social behavioral and health sciences Hoboken NJ Wiley amp Sons
DePascale C (2014) The ideal role of large-scale testing in a comprehensive assessment
system Journal of Applied Testing Technology 5(1) 1-11 Retrieved from
httpwwwjattjournalcomindexphpatparticleview48343
Education Quality and Accountability Office (2016) About the agency Retrieved May 26
2016 from EQAO
httpwwweqaocomenabout_eqaoabout_the_agencyPagesabout-the-agencyaspx
Education Quality and Accountability Office (2014) EQAOrsquos provincial elementary school
report 2014 Retrieved September 26 2015 from EQAO
httpwwweqaocomenassessmentsresultsPagesprovincial-report-elementary-
2014aspx
Figlio D amp Loeb S (2011) School accountability In EA Hanushek S Machin and L
Woessmann (Eds) Handbooks in Economic The Netherlands North-Holland pp 383-
421
Foster D Noyce P amp Spiegel S (2007) When assessment guides instruction Silicon
Valleyrsquos mathematics assessment collaboration In AH Schoenfeld (Ed) Assessing
mathematical proficiency (pp 137-154) Cambridge Cambridge University Press
Friesen S (2005) Math Teaching it better Education Canada 46(1) 6-10
Furr R M (2011) Scale construction and psychometrics for social and personality psychology
Los Angeles SAGE
Fillmore L W (2007) English learners and mathematics learning language issues to consider
In AH Schoenfeld (Eds) Assessing mathematical proficiency (pp 333-344) Cambridge
Cambridge University Press
50
Haertel E H amp Herman J l (2005) A historical perspective on validity arguments for
accountability testing Yearbook of the National Society for the Study of
Education 104(2) 1-34 doi101111j1744-7984200500023x
Hinton A (2014) Tracking student achievement in mathematics over time in English language
schools Retrieved from
httpwwweqaocomenresearch_dataResearch_ReportsPagesstudent-
achievementaspx
Howie S (2005) System-level evaluation Language and other background factors affecting
mathematics achievement Prospects 35(2) 175-186 doi101007s11125-005-1820-
8
Huff K amp Goodman DP (2007) The demand for cognitive diagnostic assessment In JP
Leighton amp MJ Gierl (Eds) Cognitive Diagnostic Assessment for Education (19-60)
New York Cambridge University Press
IBM Corp Released 2013 IBM SPSS Statistics for Windows Version 230 Armonk NY IBM
Corp
Jang E E amp Ryan K (2003) Bridging gaps among curriculum teaching and learning and
assessment Book review Kifer E (2001) Large-scale assessment Dimensions
dilemmas and policy Journal of Curriculum Studies 35(4) 499-512
Jang EE Dunlop M Wagner M Kim Y amp Gu Z (2013) Elementary school ELLsrsquo
reading skill profiles using cognitive diagnosis modelling Roles of length of residence
and home language environment Language Learning 63(3) 400-436 doi
101111lang12016
Kaplan RM amp Saccuzzo DP (2009) Psychological Testing Principles Applications and
Issues Belmont Wadsworth Cengage Learning
Kilpatrick J Swafford J Findell B amp National Research Council (US) (2001) Adding it
up Helping children learn mathematics Washington DC National Academy Press
Klinger D A amp Rogers W T (2011) Teachers perceptions of large-scale assessment
programs within low-stakes accountability frameworks International Journal of
Testing 11(2) 122-143 doi101080153050582011552748
La Rose L (2014) PISA results Canada students high level achievers but math and science
scores dip The Huffington Post Retrieved October 5 2015 from
httpwwwhuffingtonpostca20131203pisa-results-canada-
studentrankings_n_4376190html
Meyers L S Gamst G amp Guarino A J (2006) Applied multivariate research Design and
interpretation Los Angeles Sage
Milgram R J (2007) What is mathematical proficiency In AH Schoenfeld (Eds) Assessing
mathematical proficiency (pp 31-58) Cambridge Cambridge University Press
51
Moschkovich J (2007) Beyond words to mathematical content Assessing English learners in
the mathematical classrooms In AH Schoenfeld (Eds) Assessing mathematical
proficiency (345-352) Cambridge Cambridge University Press
Mutheacuten LK amp Mutheacuten BO (1998-2010) Mplus Userrsquos Guide (6th Ed)
Los Angeles CA Mutheacuten amp Mutheacuten
Nagy P (2000) The three roles of assessment Gatekeeping accountability and instructional
diagnosis Canadian Journal of Education 25(2) Retrieved from
httpmyaccesslibraryutorontocaloginurl=httpsearchproquestcomdocview215374
855accountid=14771
National Council of Teachers of Mathematics (2000) Principles and standards for school
mathematics Reston VA National Council of Teachers of Mathematics
Nichols P D (1994) A framework for developing cognitively diagnostic assessments Review
of Educational Research 64(4) 575 Retrieved from
httpmyaccesslibraryutorontocaloginurl=httpsearchproquestcomdocview214116
755accountid=14771
Nylund K L Asparouhov T amp Mutheacuten B O (2007) Deciding on the number of classes in
latent class analysis and growth mixture modeling A monte carlo simulation
study Structural Equation Modeling A Multidisciplinary Journal 14(4) 535-569
doi10108010705510701575396
OECD (2014) PISA 2012 Results What Students Know and Can Do Student Performance in
Mathematics Reading and Science doi httpdxdoiorg1017879789264208780-en
Ontario (2005) The Ontario curriculum grades 1-8 Toronto Ontario Ministry of Education
Pastor D A Barron K E Miller B J amp Davis S L (2007) A latent profile analysis of
college students achievement goal orientation Contemporary Educational
Psychology 32(1) 8-47 doi101016jcedpsych200610003
Rogers WT (2013) What is the quality of EQAO assessments Excellent Retrieved
September 24 2015 from
httpwwweqaocomenresearch_dataResearch_ReportsPagesbest-assessment-
practicesaspx
Rogers WT (2014) Improving the utility of large-scale assessments in Canada Canadian
Journal of Education 37(3) Retrieved from httpcje-rcecaindexphpcje-
rcearticleview1732
Ross JA amp McDougall D E (2006) Mathematics In K Leithwood P McAdrie N Bascia
amp A Rodrigue A (Eds) Teaching for deep understanding Towards the Ontario
curriculum that we need (pp 33-39) Thousand Oaks CA Corwin Publishing
Schoenfeld A H (2007) Issues and tensions in the assessment of mathematical proficiency In
52
AH Schoenfeld (Ed) Assessing mathematical proficiency (pp3-15) Cambridge
Cambridge University Press
Schoenfeld A H (2007) What is mathematical proficiency and how can it be assessed In
AH Schoenfeld (Ed) Assessing mathematical proficiency (pp 59-73) Cambridge
Cambridge University Press
Schoenfeld A H (1992) Learning to think mathematically Problem solving metacognition
and sense making in mathematics In D Gouws (Ed) Handbook for research on
mathematics teaching and learning (pp 334-370) New York Macmillan
Schumacker R E amp Lomax R G (2004) A beginnerrsquos guide to structural equation modeling
(2nd ed) Mahwah NJ Lawrence Erlbaum Associates
Shapka J Domene J amp Keating D (2006) Trajectories of career aspirations through
adolescence and young adulthood Early math achievement as a critical filter
Educational Research and Evaluation 12(4) 347-358 Retrieved from
httpdxdoiorg10108013803610600765752
Statistics Canada (2016) Immigration and Ethnocultural Diversity in Canada Retrieved May
31 2016 from httpswww12statcangccanhs-enm2011as-sa99-010-x99-010-
x2011001-engcfm
Stein MK Remillard J amp Smith MS (2007) How curriculum influences student learning
In FK Lester amp National Council of Teachers of Mathematics (Eds) Second handbook
of research on mathematics teaching and learning a project of the National Council of
Teachers of Mathematics (pp 1099) Charlotte NC Information Age Pub
Stokke A (2015) What to do about Canadarsquos declining math scores Retrieved from
httpswwwcdhoweorgpdfcommentary_427pdf
Tatsuoka K Corter J amp Tatsuoka C (2004) Patterns of Diagnosed Mathematical Content
and Process Skills in TIMSS-R across a Sample of 20 Countries American Educational
Research Journal41(4) 901-926 Retrieved from
httpwwwjstororgmyaccesslibraryutorontocastable3699467
Uebersax JS (2015) Introduction to the Tetrachoric and Polychoric Correlation Coefficients
Retrieved July 20 2015 from httpjohn-uebersaxcomstattetrahtm
Wilson L D (2007) High-stakes testing In FK Lester and National Council of Teachers of
Mathematics (Eds) Second handbook of research on mathematics teaching and learning
a project of the National Council of Teachers of Mathematics (pp 1053 -1098)
Charlotte NC Information Age Pub

8
as academic ability (Kaplan amp Saccuzzo 2007) However many curricular in practice today
have been developed on a multidimensional framework such as that of mathematics where
academic ability is assumed to consist of more than one skill or factor
Furthermore test development practices are performed taking into consideration certain
test constraints for instance test format which is usually paper-and-pencil based as well as
administration time For this reason it is impossible to include items to measure all curriculum
expectations in one test (Haertel amp Herman 2005) This sampling process of curriculum
expectations therefore also means that only few items for each expectation are included in the
assessment (Rogers 2014)
In addition to these test development procedures raising construct validity concerns
(Wilson 2007) they limit the reporting of test scores beyond anything more than overall total
scores As highlighted by Rogers (2014) since the assessment was never designed from an
explicit framework in line with that of curriculum expectations from the start as well as include
only a few items targeted at each subdomain it is highly unlikely that the assessment meets the
rigorous test properties needed to allow for reporting anything beyond that of total scores
In order to satisfy the many calls for change to reporting practices assessment
organisations would need to deviate from these traditional more cost effective practices For this
reason Chudowsky and Pellegrino (2003) indicate that change is unlikely to happen soon As a
result our efforts to improve education in disciplines where it is needed the most will continue
to take place within the confinements of that which assessment organisations refuse to change
22 Mathematics Education and Curriculum
The mathematical reform movement generated in the late 1950rsquos signaled the need for the
implementation of better teaching and learning practices for mathematics in schools (Friesen
9
2005) Today many mathematics curricular worldwide including that of Canada are based on
the Principles and Standards for School Mathematics as set out by the National Council of
Teachers of Mathematics (NCTM) (Friesen 2005) Very broadly curriculum refers to the
substance or content of teaching and learning it focusses on the ldquowhatrdquo of teaching and learning
as opposed to the ldquohowrdquo (Stein Remillard amp Smith 2007)
This NCTM document calls for the teaching and learning of mathematics with the goal of
developing both content or procedural knowledge and conceptual understanding of the
discipline through the application of essential thinking or processing skills such as problem
solving or reasoning skills which in turn will be developed (NCTM 2000) This goal for
mathematics education is in stark contrast to that of traditional goals where only the teaching and
learning of procedural or content knowledge was valued and taught through rote teaching and
learning practices (Schoenfeld 2007) Procedural knowledge refers to what and how to solve
certain mathematical problems whereas conceptual understanding refers to why a certain
problem is solved the way it is (Kilpatrick Swafford Findell amp NRC 2001)
Furthermore the NCTM adopted the view that standards play a leading role in guiding
the improvement of mathematics education (NCTM 2000) It therefore highlights specific
mathematical standards or expectations that learners should achieve Specifically five Content
Standards are used to guide the teaching and learning of procedural and conceptual knowledge
namely Number and Operations Algebra Geometry Measurement and Data Analysis and
Probability Five Process Standards also guide the essential processes or thinking skills of
Problem Solving Reasoning and Proof Communication Connections and Representation
(NCTM 2000) The NCTM (2000) repeatedly proclaims the interconnectedness of these
standards by indicating that procedural knowledge should never exist without conceptual
10
understanding which in turn should not be developed without the application and acquisition of
the essential processing skills
The Content and Process Standards are further classified into groups or categories for
assessment purposes in mathematics curricular such as that of Ontario Specifically the Ontario
Curriculum Grades 1-8 Mathematics 2005 document describes four categories of Knowledge
and Understanding Thinking Communication and Application to which the standards are
allocated These four categories are known as the Knowledge and Skills categories and are
reflected in the documentrsquos Achievement Chart The first category of Knowledge and
Understanding can be described as encompassing mathematical knowledge of content and
understanding and therefore focusses predominantly on the achievement of the Content
Standards The remaining three categories focus predominantly on the use of the Process
Standards The Thinking category assesses the use of problem solving reasoning and proving
processes the Communication category focusses on the assessment of the communicating
processes and lastly the Application category focusses on the assessment of the connecting
processes
From the above mathematics curriculum we can see that the knowledge base is still
considered important in mathematics education however so is conceptual understanding and the
application and acquisition of thinking skills As stated by Schoenfeld (2007) anyone who lacks
a solid grasp of facts procedures definitions and concepts is significantly handicapped in
mathematics yet there is more to being mathematically proficient than simply reproducing
standard content on demand Therefore if we are interested in understanding mathematical
proficiency as it is taught and learned today it is important that we reflect learner abilities in all
aspects of the discipline (Kilpatrick et al 2001) In so doing we will gain better insight into
11
their strengths and weaknesses allowing us to remediate accordingly in our efforts to improve
learner performances in this essential discipline
23 Factors Predicting Mathematical Performances
Given the relative importance of mathematics it is no surprise that much research has been
dedicated to highlighting and isolating the number or factors that can influence and predict
mathematical performances By doing so early interventions and remedial strategies can be
better targeted to improve future mathematical success (Hinton 2014)
One such factor that has been given much attention is that of language proficiency and its
influence on mathematical performances Studies conducted by Hinton (2014) Howie (2005)
and Abedi and Lord (2001) for instance discovered that learners who spoke English as a second
language performed worse in mathematical assessments compared to their English proficient
counterparts Fillmore (2007) however cautions against interpreting this as a lack of
mathematical ability without firstly taking into account the aspect of language Since much of
the mathematics taught today is presented in the form of a word problem it relies heavily on a
deep understanding of language (Moschovich 2007) Therefore trying to tease out precisely
how much of the struggle is related to a language issue and how much to an issue with
mathematics is a unique challenge for teachers assessment and English Language Learners
(ELLrsquos) (Fillmore 2007) As highlighted by Moschovich (2007) assessment is certainly a
complex task perhaps especially when working with students who are learning English It is
challenging to decide whether an utterance reflects a studentrsquos conceptual understanding a
studentrsquos proficiency in expressing their ideas in English or a combination of mathematical
understanding and English proficiency
12
Canada has a high and diverse immigrant population for instance 206 of its population
in 2011 was determined to be comprised of immigrants from various countries (Statistics
Canada 2016) Thus the mathematical performances of ELLrsquos cannot be ignored Fortunately
this aspect is currently given attention in the province of Ontario as assessment organizations
such as the EQAO do attempt to report separately on these learnersrsquo performances However
Jang Dunlop Wagner Kim and Gu (2013) warn against treating ELLrsquos as a homogenous group
Their study found that when taking into account the length of residence in Canada
performances of these students varied significantly concerning their reading proficiencies
Therefore if we wish to predict mathematical performances or gain better insight based on
student background such as language factors it is necessary to consider subpopulation groups
that make up the overall ELL population such as length of residence in the country
13
Chapter 3 Method
This chapter describes the participants instrument and data as well as the three main
analyses used to answer the questions presented in this study
31 Participants
The current study used data made available by the Education Quality and Accountability
Office (EQAO) of Ontario The EQAO is an arms-length Ontario government agency that is
responsible for developing and overseeing reading writing and mathematics assessments
administered to Grade 3 6 9 and 10 students in Ontario public schools The purpose of the
results of these largescale assessments is to determine the extent to which learners have achieved
the curriculum standards of the particular discipline for educational accountability and
improvement purposes (EQAO 2016)
Learnersrsquo responses are scored by the EQAO using Classical Test Theory and Item
Response Theory (Rogers 2013) to generate a score that is then converted into a Level NIE 1 2
3 or 4 Level 3 describes a performance at the provincial standard whereas Level 4 a
performance surpassing the standard Level 2 a performance approaching the standard and Level 1
a performance much below the standard Lastly a ldquoNIErdquo rating is generated for those learners
who have not provided sufficient evidence for a Level 1 score The EQAO test scores are reported
using these proficiency levels for each of the areas tested namely reading writing and
mathematics Background information such as gender time lived in Canada and student home
language etc is also collected by questionnaires administered by the EQAO over the same time
The full population data set comprised of approximately 127 302 Grade 6 learnersrsquo
responses to the English 20132014 provincial Junior Division assessment A random sample of
5000 learner responses to the assessment was drawn from the entire data set Learners with
missing data on any of the variables were excluded from the sampling process so that the final
14
data set contained responses to all mathematics items as well as background information All
learners within the sample were enrolled at the time in Grade 6 and attended various schools
across the province Table 1 below presents the distributions of student subgroups from the
random sample based on their gender language background and time spent in Canada in
comparison with the entire population The percentage of learners in each subgroup was very
closely aligned with the larger Grade 6 population and was therefore considered a representative
sample
Table 1
Final Random Sample used for the Analysis
Standard Gender Language Time lived in Canada
Met
Below
Female
Male
Non-
ESL
ESL
CA
Born
Non-CA
born lt 5
years
Non-CA
born ge 5
years
Frequency 2765 2235 2456 2544 4460 540 4493 199 308
Sample 553 447 491 519 892 108 899 4 62
Population 54 46 49 51 887 113 871 4 89
Notes N = 5000 Standard = met the provincial standard or achieved below the provincial standard ESL = enrolled in
English as a Second language program Time lived in Canada = Canadian born learners non-Canadian born learners
who have lived in Canada for less than 5 years and non-Canadian born learners who have lived in Canada for 5 years
or more
32 Instrument
Student responses to the mathematics test items and background information on the EQAO
20132014 Junior Division assessment were used for this study This assessment is a provincially
mandated largescale assessment used by the Ontario government to measure the extent to which
learners have achieved the standards as laid out in the curriculum All the EQAO largescale
assessments are designed using rigorous development procedures and meet high testing standards
with acceptably high reliabilities (Rogers 2013) of above 80 The Junior Division assessment is
15
specifically administered to all Grade 6 learners attending schools within the province of Ontario
during the months of May and June and under highly standardized conditions (EQAO 2016) The
assessment measures reading writing and mathematical skills in each of the corresponding
sections The mathematics section specifically consists of 36 items of which 28 are multiple choice
items and 8 are constructed-response format questions This study included only the 28 multiple
choice items
While the EQAO does not claim to measure the Knowledge and Skills categories as laid out
in the Ontario Curriculum Grades 1-8 Mathematics 2005 document (Rogers 2013) it still
references each of the mathematics items to one of three of the categories namely that of
Knowledge and Understanding Thinking and Application The category of Communication is not
represented by any of the items as according to Rogers (2013) this skill is not feasible to assess in
a paper-and-pencil based test For items to be referenced to the Knowledge and Understanding
category they need to be recognized as requiring students to demonstrate subject specific content
and comprehend its meaning Those referenced to the Application category need to be recognized
as requiring students to select an appropriate mathematical tool and apply the appropriate
information Lastly those referenced to the Thinking category need to be seen as requiring of
students to select and sequence a variety of tools and think critically in order to solve problems
(Rogers 2013) Items are scrutinized by teachers and other content experts for the process of
allocating items to the most appropriate category Items are further referenced to the five content
areas or strands of the curriculum document according to their content topic namely Number Sense
and Numeration Measurement Geometry and Spatial Sense Patterning and Algebra and Data
Management and Probability
Table 2 shows the representation of each of the Knowledge and Skills categories and the
strands to which the 28 multiple choice items were referenced by the EQAO as well as the item
difficulties (p-values) and discrimination indices (pt-biserial correlations) for each of these items
According to Kaplan and Saccuzzo (2007) item difficulty values should range from 30 to 70 to
16
maximize information about the differences among individuals Furthermore item discriminability
values should not be negative or below 20 to be considered adequate Based on these
recommendations all 28 items were considered suitable to be included in the analyses of this study
Table 2
Knowledge and Skills Categories Strands and Descriptive Statistics of 28 Mathematics Items
Item Know amp Skill Strand p-value pt-biserial
1 K and U Patterning amp Algebra 86 39
14 K and U Patterning amp Algebra 74 43
3 K and U Number Sense amp Numeration 76 37
15 K and U Number Sense amp Numeration 86 35
9 K and U Data Management amp Probability 48 33
19 K and U Measurement 50 27
25 K and U Measurement 76 40
22 K and U Geometry amp Spatial Sense 87 34
73 36
11 App Patterning amp Algebra 81 43
24 App Patterning amp Algebra 70 37
26 App Patterning amp Algebra 40 30
5 App Number Sense amp Numeration 56 38
7 App Number Sense amp Numeration 82 30
10 App Data Management amp Probability 55 47
18 App Data Management amp Probability 78 47
23 App Data Management amp Probability 71 42
2 App Measurement 59 31
8 App Measurement 58 28
20 App Measurement 54 47
6 App Geometry amp Spatial Sense 68 38
64 38
17 Think Patterning amp Algebra 52 36
21 Think Number Sense amp Numeration 57 22
28 Think Number Sense amp Numeration 69 33
4 Think Data Management amp Probability 46 35
13 Think Measurement 54 39
27 Think Measurement 41 46
12 Think Geometry amp Spatial Sense 42 35
16 Think Geometry amp Spatial Sense 54 34
52 35
Notes K and U = Knowledge amp Understanding App = Application Think = Thinking p-value and pt-biserial means
for each Knowledge amp Skill category represented in bold
17
No items had p-values below 30 however 10 items had difficulty values above 70
indicating that they were relatively easy for this sample Since none of the p-values were above
90 they were considered to still possess sufficient variability to be included in the analyses
Furthermore no items had values below the recommended 20 or negative pt-biserial values Table
2 further highlights the item difficulty and discrimination means for each of the three categories
From these values it can be concluded that the items referenced to the Knowledge and
Understanding category were relatively more easy for this sample while those items referenced to
the Thinking category more difficult and those referenced to the Application category moderately
difficult Lastly it is highlighted that a greater number of items represented the Application
category (12 items) than the Knowledge and Understanding and Thinking category which had an
equal number of eight items
33 Data Analysis
The data analyses involved three phases each of which addressed one of the three questions
asked in this study The first phase used Exploratory Factor Analysis (EFA) approaches to
examine the first research question ldquoWhat characterizes the dimensionality of the EQAO
mathematics achievement test administered to Grade 6 students in Ontario public schoolsrdquo
Latent Class Analysis (LCA) approaches were used in the second phase in order to answer question
two ldquoIn which mathematical dimensions and related strands do students demonstrate strengths and
weaknesses in their mathematical achievementrdquo A multinomial logistic regression analysis was
performed to examine research question three ldquoTo what extent are mathematics performance
profiles predicted by student background such as language and length of residence statusrdquo
331 Phase 1 Establishing the Dimensionality of the Assessment
An Exploratory Factor Analysis (EFA) was conducted in order to determine the
dimensionality of the EQAO Grade 6 mathematics test based on 5000 studentsrsquo responses to 28
multiple choice items Although exploratory in nature the EFA was used to examine the extent
18
to which the test dimensionality can be accounted for by knowledge and skills and further by the
strand specified by the EQAO
EFA is a statistical procedure that simplifies the process of visually inspecting a range of
correlations in order to examine the dimensionality of measures (Furr 2011) The 28 multiple
choice items were firstly recoded as binary data thus creating dichotomous categories (0 =
incorrect responses and 1 = correct responses) In order to perform an EFA with this type of
data a more sophisticated statistical software package is required The reason for this being that
standard software such as IBMrsquos SPSS (version 230) creates correlation matrices suitable only
for continuous data that assume a normal distribution (Uebersax 2015) Therefore MPLUS
version 612 (Mutheacuten amp Mutheacuten 1998-2012) was used for the analysis so that a tetrachoric
correlation matrix could be generated to suite the binary data used in this study
When conducting an EFA in Mplus a correlation matrix eigenvalues and model fitting
statistics such as the chi-square test Root Mean Square Error of Approximation (RMSEA) and
Root Mean Square Residual (RMSR) are produced in order to assist with the process of
determining the solution that best fits the data A good fitting model will be represented by a
non-significant chi-square p-value as well as a RMSEA value and RMSR value of below 05
(Schumacker amp Lomax 2004) However interpretability of the model should also be taken into
consideration when deciding on the best solution (Meyers Gamst amp Guarino 2013) The
weighted least-squares with mean (wlsm) estimation method as recommended by Mutheacuten and
Mutheacuten (1998-2012) for binary data and the oblique rotation method (Promax) was used for this
analysis based on the assumption that factors are likely to be correlated with each other
Four steps were implemented during this phase The first step entailed determining the
ideal number of factors to be extracted to best describe the data This entailed a combined
evaluation of the correlation matrix eigenvalues scree plot and fit statistics as described above
The next step entailed an evaluation of the items and their loadings on each of the factors to
determine if any should be discarded in terms of low factor loadings or cross-loadings If any
19
items were deemed unacceptable these were removed and the analysis re-run and subsequently
re-evaluated This step was repeated until a final and appropriate factor solution model was
obtained Following this the reliability for each factor was established followed by an
investigation of the factor correlations in order to determine the uniqueness of each extracted
dimension Ideally items should correlate highly with each other within each extracted
factordimension however for each dimension to be considered unique between-factor
correlations should be low (Rogers 2014) According to Meyers et al (2013) between-factor
correlations should not exceed 80 to warrant the use of a separate dimension The last step
involved an investigation of the similarities between items in each factor in order to describe the
items that make up each This was done firstly in terms of the three Knowledge and Skills
categories and secondly the five strands to which the items were referenced as well as any
further content similarities
332 Phase 2 Identifying Mathematical Strengths and Weaknesses
In an attempt to identify in which mathematical subdomains or dimensions and related
strands learner performances were strongest and weakest as asked in question two of this study a
Latent Class Analysis (LCA) was performed using MPLUS version 612 (Mutheacuten amp Mutheacuten
1998-2012)
Specifically the goal of a mixture model is to reveal unobserved heterogeneous and
meaningful population groups within the larger homogenous population by identifying similarities
in their responses to measured variables (Nylund Asparouhov amp Mutheacuten 2007) These identified
latent populations or sub-groups are called classes Therefore using this analysis allowed for the
generation of distinct performance profiles for each sub-group or class identified as performing
similarly in the largescale assessment In this way more accurate class specific strengths and
weaknesses could be described as opposed to simply those of the overall Grade 6 population
20
For an LCA the outcome variables used are specifically categorical (Nylund et al 2007)
Therefore dichotomously scored response data from the random sample of 5000 students were
used for the LCA The LCA approach is exploratory in nature because the optimal number of
classes representing all latent classes cannot be determined apriori (Nylund et al 2007) Therefore
an investigation of relevant fit statistics generated by the LCA was firstly conducted According to
Pastor Barron Miller and Davis (2007) the fit statistics commonly used to determine the optimum
number of classes include the Bayesian Information Criterion (BIC) the sample-size adjusted BIC
and the Akaike Information Criterion (AIC) where lower values indicate a better fitting model An
Entropy statistic is also commonly used to determine model fit This statistic ranges from 0 to 1
where values closest to 1 indicate higher classification accuracy
Following the identification of the best fitting model the entire sample was profiled in
terms of distinct mathematics classes In order to reduce the number of points on these profiles
items were grouped according to the strand to which they were referenced by EQAO within each
identified factor This allowed for the identification of learner strengths and weaknesses not only
surrounding factors but also each strand within each factor
As part of the LCA mean item probability scores are calculated for each class This statistic
indicates the mean probability for each class to respond correctly to an item and therefore ranges
from 0 to 1 (Nylund et al 2007) Values closest to one therefore indicate a higher probability of
responding correctly to an item Using these values for each item average item-group probability
scores were calculated and these values were then used to describe class specific strengths and
weaknesses This was done firstly by describing overall item-group performances in comparison
to other classes and secondly by describing class performances in each specific factor overall and
lastly in terms of each strand within each factor
21
333 Phase 3 Predicting Class and Profile Membership
In order to answer question three concerning whether or not English as a second language
and length of residence in Canada significantly predicted the performance profile to which a
learner belongs a multinomial logistics regression analysis was conducted This phase was
completed using IBMrsquos SPSS (version 230)
A multinomial logistic regression is used when the dependent variable for the analysis
consists of more than two categorical levels (Meyers et al 2013) Besides the item probability
mean generated by the LCA a class probability mean for each learner in the sample is also
calculated as part of the analysis This class probability indicates the likelihood of a learner
belonging to each of the classes or performance profiles Based on the highest class probability
learners were allocated to one of the performance profiles as generated in phase 2 These classes
were coded 1 2 3 etc based on the number of classes determined to best describe the sample and
represented the dependent or predicted variable of the analysis
Table 3
Six Groups Created Based on English as Second Language and Time Lived in Canada
Group Language Time lived in Canada n
1 Non-ESL CA born 4185 837
2 ESL CA born 308 62
3 Non-ESL Non-CA born lt 5 years 76 15
4 ESL Non-CA born lt 5 years 123 25
5 Non-ESL Non-CA born ge 5 years 199 40
6 ESL Non-CA born ge 5 years 109 22
Notes N = 5000 ESL = English as a second language learner CA born = Born in Canada
An independent variable used for predicting the latent class membership included six
groups based on the following background variables English Second Language (ESL) status as
22
well as whether or not they were Canadian born non-Canadian born but at the time had resided in
the country for less than 5 years or non-Canadian born but at the time had resided in the country for
five years or more This was done in order to avoid clustering ELL learners as a homogenous group
and therefore better identify learners These six categorical data groups represented the predictor
or independent variable Table 3 indicates more precisely how each of the groups were created as
well as their sizes
23
Chapter 4 Results
The results of this study are discussed according to the three questions presented and phases
of data analyses as discussed in Chapter 3 Firstly the results produced from the Exploratory
Factor Analysis (EFA) described in phase one concerning question one are reported Secondly
those produced by the Latent Class Analysis (LCA) in phase two to answer question two and lastly
those produced from the multinomial logistics regression analysis conducted in phase three to
answer question three are presented in this chapter
41 Dimensionality Characteristics
As noted an EFA was conducted on the 28 multiple choice mathematics items in order to
determine the dimensionality of the largescale assessment to which they belonged The
eigenvalues of the tetrachoric correlation matrix (Table 4) produced by Mplus ranged between
862 and 41 the first three factors showed eigenvalues greater than 1 and accounted for 3953 of
the total variance
Table 4
Eigenvalues of Correlation Matrix indicating Total Variance Explained
Item Eigenvalue Item Eigenvalue Item Eigenvalue Item Eigenvalue
1 86 2 13 3 10 4 93
5 91 6 90 7 87 8 85
9 84 10 80 11 79 12 76
13 74 14 72 15 70 16 69
17 66 18 65 19 64 20 63
21 60 22 57 23 53 24 52
25 50 26 49 27 46 28 41
24
411 Determining the Best Fitting Factor Solution Model
The eigenvalues scree plot and fit statistics were used to determine the best number of
factors to describe this data set Based on the ldquonumber of eigenvalues greater and equal to one
rulerdquo as suggested by Meyers et al (2013) together with the scree plot and relevant fit statistics it
seemed adequate to extract three factors albeit accounting for less than 50 of the variance
Figure 1 Scree plot
Although three eigenvalues were produced greater and equal to one suggesting the
existence of three factors this was contradicted by the scree plot (Figure 1) which suggested the
existence of only two factors as it appeared to level off mostly at number three Subsequently a
comparison of the one to three factor solutions was conducted in terms of the relevant fit statistics
as described in Table 5
The significant chi-square p-values (lt 001) generated for the one and two factor solutions
suggested that the data differed significantly from the model matrix Although the chi-square p-
value has been criticized in the past for being overly sensitive to large sample sizes and therefore
0
05
1
15
2
25
3
35
4
45
5
55
6
65
7
75
8
85
9
1 2 3 4 5 6 7 8 9 10 11 12 13 14 15 16 17 18 19 20 21 22 23 24 25 26 27 28
Eig
envalu
es
Items
25
almost always producing a significant value (Meyers et al 2013) this was determined not to be the
case for this analysis as the p-value generated in the three factor model increased substantially
from the one to two factor model thus ensuring the reliability of this value
Table 5
EFA Model Fit Statistics of the 1 to 3 Factor Solutions on 28 Mathematics Items
FA model Chi-Square df p-value RMSEA RMSR
1 92476 350 lt 001 018 031
2 44012 323 lt001 009 021
3 34390 297 032 006 019
Note N = 5000
Therefore since the Chi-square p-value of 032 of the three factor model was not significant
(at the 001 probability level) as well as the fact that only two items represented the fourth factor in
the four factor solution model it was deemed a good fitting model The values of 006 and 019 of
the RMSEA and RMSR respectively were well below the 05 recommended value providing
further support for this three factor solution model
A further inspection of the factor loadings from the three-factor solution as well as of the
items on each factor resulted in the removal of four items (ie 12 18 23 and 24) Items 18 23 and
24 were discarded as a result of low factor loading scores below 30 Whereas a decision was made
to remove Item 12 as it was the only item referenced to the Thinking category that did not load on
the factors in the same way that the others did Table 6 presents the final factor loadings with the
Knowledge and Skills categories to which items were originally allocated by the EQAO that is
knowledge and understanding application and thinking
The Promax factor correlation matrix produced by Mplus (Table 7) revealed that all three
factors correlated positively and moderately to high with one another The strongest correlation
26
existed between Factor 1 and Factor 3 with a relatively high coefficient value of 747 while the
weakest correlation existed between Factor 1 and Factor 2 with a coefficient of 576
Table 6
Factor Loadings of the 23 Items used in the Final 3 Factor Solution Model
Item Knowledge amp Skill Factor 1 Factor 2 Factor 3
1 KU 64 -09 13
11 App 63 -04 12
14 KU 55 13 01
6 App 51 12 -04
15 KU 51 -05 14
10 App 47 23 05
7 App 45 -12 13
25 KU 38 09 17
3 KU 35 -01 24
9 KU 35 09 07
22 KU 31 07 23
5 APP 30 09 22
13 App 10 65 -05
27 Think -04 63 23
2 Think -07 50 12
20 App 14 -03 59
17 Think -04 04 55
26 App 13 01 33
8 App 11 -01 32
28 Think 15 03 32
16 Think 11 10 31
4 Think 14 12 30
21 Think -04 08 30
α = 725 α = 536 α = 565
Notes KU = Knowledge and Understanding App = Application Think = Thinking category
As stated earlier according to Meyers et al (2013) correlations should not exceed 80 to warrant
the use of separate factors These results are therefore considered to reveal the existence of three
27
unique factors that can be used to describe the multidimensionality of these mathematics multiple
choice items
Table 7
Promax Factor Correlations Between 3 Factors
Factors FA 1 FA 2
Factor 1
Factor 2 576
Factor 3 747 626
Note N = 5000
As indicated in Table 6 Factor 1 consisted of 12 items in total with factor loading scores
ranging between 30 and 64 and achieved a relatively high Cronbachrsquos alpha of 725 All seven
items referenced to the Knowledge and Understanding category used in the final model loaded
together on Factor 1 along with five items referenced to the Application category Factor 2
consisted of only three items with factor loading scores ranging between 50 and 63 and
achieved a moderate Cronbachrsquos alpha of 536 In Factor 2 two items referenced to the Thinking
category and one to the Application category loaded together to make up the total of three items
for this factor Lastly Factor 3 consisted of a total of eight items with factor loading scores
ranging between 30 and 59 and also achieved a moderate Cronbachrsquos alpha score of 565 The
remaining five items referenced to the Thinking category and three items referenced to the
Application category loaded together to make up the eight items that loaded together on Factor 3
In terms of the strands to which the items in Factor 1 were referenced for instance
Patterning and Algebra etc no clear similarities appeared to exist to tie all the items together
based on this However similarities seemed to exist in terms of the applied skill requested of
learners to solve the mathematical problems It appeared that all the items of this factor merely
requested of learners to apply their mathematical knowledge in terms of procedures and
conceptual understanding to answer the questions For instance Item 15 which is referenced to
28
the Knowledge and Understanding category asks the following ldquoWhat is the value of 0730 ndash
0156rdquo Whereas Item 5 which is referenced to the Application category asks that learners
solve problems involving the addition of decimal numbers (the exact question was not released)
Therefore it was determined that no clear difference existed between the applied skill requested
from these two items even though they were referenced to two different Knowledge and Skills
categories It was therefore concluded that Factor 1 could be described as measuring the
application of mathematical knowledge to solve problems in various strands
An inspection of the items that loaded together on Factor 2 revealed that two of the items
were referenced to the Thinking category while one of the items was referenced to the
Application category Furthermore all three items were similar in that that they covered the
ldquoMeasurementrdquo strand and more specifically that all three items requested of learners to solve
problems relating to ldquoAreardquo Item 2 for instance asks ldquoThe parallelogram below will be cut
into two congruent triangles (provides dimensions) What is the area of one of the trianglesrdquo
Item 13 asks ldquoWhich of the following shows a rectangle and a triangle that have the same areardquo
and lastly Item 27 requests that learners compare the areas of two polygons (exact item not
released) Item 2 was referenced to the Application category whereas Items 13 and 27 were
referenced to the Thinking category It was therefore determined that Factor 2 could be
described as requesting of learners to apply thinking processes or skills such as problem solving
and reasoning in order to solve deeper mathematical problems specifically surrounding the
Measurement topic of ldquoAreardquo
Lastly for Factor 3 as with Factor 1 no clear similarities appeared to exist to tie all the
items together based on strands However as with Factor 1 similarities seemed to exist in terms
of the applied skill requested of learners to solve the mathematical problems It appeared that
all the items on this factor requested of learners to apply thinking skills to solve deeper
mathematical problems surrounding various strands in other words learners had to go beyond
the mere application of content knowledge to solve these items For instance Item 20 referenced
29
to the Application category requested that learners solve the following problem ldquoEach beaker of
water below has a capacity of 2L Which beaker appears to have about 500ml of water in itrdquo
Whereas Item 28 referenced to the Thinking category asks ldquoMrs Garrett sends surveys to 120
students and 78 students return the survey Which statement best describes the percent of
students who return the surveyrdquo Again no clear difference appeared to exist between the
applied skill requested of learners in terms of the Application and Thinking categories to which
the items were referenced It was therefore concluded that Factor 3 could be described as
measuring the ability of learners to apply thinking processes or skills such as problem solving
and reasoning in order to solve deeper mathematical problems in various strands
In sum the results of the EFA determined that a three factor model could be used to
adequately characterize the dimensionality of the multiple choice mathematics items on the
EQAO assessment Twelve items clustered adequately together in terms of factor loading scores
to form Factor 1 which achieved a relatively high Cronbachrsquos alpha of 725 three items on
Factor 2 which achieved a moderate Cronbachrsquos alpha of 536 and lastly eight items on Factor
3 which also achieved a moderate Cronbachrsquos alpha score of 565 Upon closer inspection of
the items on each factor and in terms of the Knowledge and Skills categories and strands to
which they were referenced by the EQAO it was determined that Factor 1 could be best
described as measuring the ability of learners to apply mathematical knowledge related to
procedural and conceptual understanding in order to solve problems in various mathematical
strands Factor 2 could be best described as measuring the ability of learners to apply process
or thinking skills in order to solve problems related specifically to the topic of ldquoAreardquo
Lastly Factor 3 could be best described as measuring the ability of learners to apply thinking
skills in various mathematical strands
30
42 Mathematical Strengths and Weaknesses
In an attempt to identify in which mathematical dimensions and related strands Grade 6
learner performances were strongest and weakest as asked in question two of this study a Latent
Class Analysis (LCA) was conducted This allowed for distinct performance profiles to be
generated for classes or sub-groups performing similarly in the population and therefore allowed
for more accurate descriptions of strengths and weaknesses The factors as established in the
dimensionality investigation in Phase 1 of this study were used to represent the dimensions for this
analysis
Although the four class model achieved the lowest AIC BIC and Sample-Size Adjusted
BIC statistic values in comparison to the two and three class model it also produced a much lower
Entropy value of 69 (see Table 8) Therefore it was decided that since these statistics did not
decrease that much from the three class to four class model the use of the four class model with a
much lower Entropy value did not seem warranted Thus the three class model was opted for
instead as it produced lower fit statistics than the two class model as well as a sufficiently high
Entropy value of 75 Furthermore the results indicated that each class was represented by the
following proportion of learners from the sample Class 1 comprised of 321 Class 2 of 452
and Class 3 of 227
Table 8
LCA Fit Statistics for 2 3 and 4 Classes
Fit statistics 2 Classes 3 Classes 4 Classes
AIC 12974224 12808557 12789120
BIC 13004854 12854829 12851034
Adj BIC 12989919 12832268 12820846
Entropy 81 75 69
Notes N = 5000 AIC = Akaike Information Criterion BIC = Bayesian Information Criterion Adj BIC = Sample-
Size Adjusted Bayesian Information Criterion
31
Eleven item-groups were created to describe the strengths and weaknesses of the three
classes as represented in Table 9 Item-groups were created by grouping items according to the
factor they were determined to measure (as established in the EFA) as well as the strand to which
they were allocated by the EQAO Five item-groups were created for Factor 1 one item-group for
Factor 2 and five groups for Factor 3 The number of items within each item-group varied from 1
item to 4 items The mean probability scores calculated for each class for each item-group and
overall dimension or factor are also represented in Table 9 These mean item-group probability
scores as presented in Table 9 were used to plot three distinct performance profiles for each class as
represented in Figure 2 below
Table 9
Item-Groups created to Describe Mathematical Performances of Grade 6 Learners
Factor Content Area of items Class 1 Class 2 Class 3
1 Patterning amp Algebra 3 97 86 48
1 Measurement 1 95 78 44
1 Geometry amp Spatial Sense 2 94 79 50
1 Number Sense amp Numeration 4 92 76 49
1 Data Management amp Probability 2 78 49 19
Factor 1 class probability means 91 74 44
2 Measurement (Area) 3 85 39 28
Factor 2 class probability means 85 39 28
3 Patterning amp Algebra 2 67 43 20
3 Measurement 2 79 55 25
3 Geometry amp Spatial Sense 1 79 47 31
3 Number Sense amp Numeration 2 80 60 44
3 Data Management amp Probability 1 72 40 22
Factor 3 class probability means 76 51 29
Note The factor probability means presented in bold are slightly higher as the actual item probability score was used
to calculate these values and not the item-group probability scores
Using the evidence generated from the mean item-group and factor probability scores as
represented in Table 9 and Figure 2 these performance profiles were used to describe the strengths
32
and weaknesses of each class Class specific strengths and weaknesses were described according
to firstly overall performances in the 11 item-groups in comparison to the other classes secondly
in terms of overall performances in each dimension (Factor 1 2 and 3) and lastly in terms of
performances in each strand within each dimension for Factor 1 and 3 only (as Factor 2 only
represented Measurement topic of ldquoAreardquo) A mean item-group probability score ranging from 86
- 10 was described as especially strong 71 - 85 as strong and 56 - 70 as moderately strong
while those scores ranging from 41 - 55 were described as moderately weak 26 - 40 as
moderately weak and 25 and below as especially weak
Figure 2 Three performance profiles of Grade 6 learners in 11 mathematical item-groups
Results indicated that those learners most likely to belong to Class 1 performed higher than
Class 2 and 3 in all item-groups Therefore this class to which 321 of learners from the sample
belonged can be best described as the highest performing and second largest group overall Those
most likely to belong to this class can be described as having an especially strong ability to apply
0
01
02
03
04
05
06
07
08
09
1
Item
-Gro
up
Mea
n P
rob
ab
ilit
y
Item-Groups
Class 1 (321) Class 2 (452) Class 3 (227)
33
mathematical knowledge in order to solve problems in various strands This was determined by the
average 91 overall probability for success achieved for those items related to Factor 1 They can
also be described as having a strong ability to apply thinking skills in order to solve problems
surrounding the Measurement topic of ldquoAreardquo and strong ability to do the same in various strands
This was determined by the 85 probability for success achieved for those items related to Factor
2 and 76 probability for success achieved for those related to Factor 3 Furthermore their overall
performances in the knowledge dimension can be described as stronger in comparison to their
performances in the thinking dimensions
Specifically concerning their ability to apply mathematical knowledge in various strands
(Factor 1) these learners can be described as performing slightly stronger in the Patterning and
Algebra (item-group probability score = 97) and considerably weaker in Data Management and
Probability (item-group probability score = 78) in relation to their performances in the other
strands Specifically regarding their ability to apply think skills in order to solve problems (Factor
3) they can be described as performing slightly stronger in Number Sense and Numeration (item-
group probability score = 80) and considerably weaker in Data Management and Probability (item-
group probability score = 72) and Patterning and Algebra (item-group probability score = 67) with
the latter being the weakest in relation to their performances in the other strands
Results further indicated that those learners most likely to belong to Class 2 performed
overall lower than Class 1 but higher than Class 3 in all item-groups Therefore this class to
which 452 of the learners belonged can be best described as the intermediate performing and
largest group overall Those most likely to belong to this class can be described as having a strong
ability to apply mathematical knowledge in order to solve problems in various strands This was
determined by the average 74 overall probability for success achieved for those items related to
Factor 1 They can also be described as having a weak ability to apply thinking skills in order to
solve problems surrounding the Measurement topic of ldquoAreardquo and moderately weak ability to do
the same in various strands This was determined by the 39 probability for success achieved for
34
those items related to Factor 2 and 51 probability for success achieved for those related to Factor
3 Furthermore their overall performances in the knowledge dimension can be described as
stronger in comparison to their performances in the thinking dimensions
Specifically concerning their ability to apply mathematical knowledge in various strands
(Factor 1) performances for these learners can be described as considerably stronger in Patterning
and Algebra (item-group probability score = 86) and considerably weaker in Data Management
and Probability (item-group probability score = 49) in relation to their performances in the other
strands Specifically regarding their ability to apply thinking skills in order to solve problems
(Factor 3) performances can be described as stronger in Number Sense and Numeration (item-
group probability score = 60) and considerably weaker in Data Management and Probability (item-
group probability score = 40) and Patterning and Algebra (item-group probability score = 43) with
the former being the weakest in relation to their performances in the other strands
Lastly results indicated that those learners most likely to belong to Class 3 performed lower
than Class 1 and 2 in all item-groups Therefore this class to which 227 of learners belonged
can be best described as the lowest performing group overall Those most likely to belong to this
class can be described as having a moderately weak ability to apply mathematical knowledge in
order to solve problems in various strands This was determined by the average 44 overall
probability for success achieved for those items related to Factor 1 They can also be described as
having a weak ability to apply thinking skills in order to solve problems surrounding the
Measurement topic of ldquoAreardquo and weak ability to do the same in various strands This was
determined by the 28 probability for success achieved for those items related to Factor 2 and
29 probability for success achieved for those related to Factor 3 Furthermore their overall
performances in the knowledge dimension can be described as stronger in comparison to their
performances in the thinking dimensions
Specifically concerning their ability to apply mathematical knowledge in various strands
(Factor 1) it was determined that these learners can be described as performing slightly stronger in
35
Geometry and Spatial Sense (item-group probability score = 50) and considerably weaker in Data
Management and Probability (item-group probability score = 19) in relation to their performances
in the other strands Specifically regarding their ability to apply thinking skills in order to solve
problems (Factor 3) their performance can be described as considerably stronger in Number Sense
and Numeration (item-group probability score = 44) and weaker in Data Management and
Probability (item-group probability score = 22) and Patterning and Algebra (item-group
probability score = 20) with the latter being the weakest in relation to their performances in the
other strands
In sum the results of the LCA revealed that three classes could be used to best describe the
performances of Grade 6 learners in the three dimensions as established during the EFA and their
related strands Class 1 was described as the highest performing and second largest group The
learners in the class were described as performing especially strong in Factor 1 (namely their
ability to apply mathematical knowledge to solve problems in various strands) strong in Factor 2
(namely their ability to apply thinking skills to solve problems specifically related to the
Measurement topic of ldquoAreardquo) and in Factor 3 (namely their ability to apply thinking skills in order
to solve problems in various strands) Class 2 was described as the intermediate performing and
largest group and performing strong for Factor 1 weak for Factor 2 and moderately weak for
Factor 3 Lastly Class 3 was described as the lowest performing and smallest group and
performing moderately weak for Factor 1 and weak for both Factor 2 and 3 For all classes overall
factor performances were described as weaker in the thinking dimensions namely Factor 2 and 3
than in the knowledge dimension namely Factor 1 A greater discrepancy between these
mathematical knowledges and thinking skills dimensions appears to exist for those in Class 2 than
for those in Class 1 and 3
Lastly in terms of describing the performances of each class in the strands related to each
factor for Factor 1 and 3 results revealed clear similarities between all classes in terms of those in
which performances were described as weaker For all classes regarding Factor 1 their ability to
36
apply mathematical knowledge within the Data Management and Probability strand was described
as the weakest in relation to the other strands For all classes regarding Factor 3 their ability to
apply thinking skills in the Patterning and Algebra and Data Management and Probability strand
was described as weakest in relation to their performances in the other strands
43 Predicting Mathematics Profiles by Language and Length of Residence Background
To avoid treating learners as homogenous groups based on their language background they
were allocated to one of six groups according to their ESL designation and length of residency in
Canada The six groups represented the predictor variable (independent variable) whereas the three
classes or performance profiles were treated as the predicted or dependent variable Class 1
namely the highest performing profile group was used as the reference category
Results of this analysis indicated that the final model did not significantly predict class and
performance profile membership with a -2 Log likelihood of 7740 and a Chi-square value of 957
(10 N = 5000) p = 48 The upper portion of Table 10 presents the regression coefficients the
Wald test adjusted odds ratio [Exp(B)] and the 95 confidence intervals (CI) for odds ratios for
the predictor contrasting Class 2 to Class 1 The lower portion of the table presents the regression
coefficients the Wald test adjusted odds ratio [Exp(B)] and the 95 confidence intervals (CI) for
odds ratios for the predictor contrasting Class 3 to Class 1
Results therefore revealed that ESL status and residence in Canada did not significantly
predict class or profile membership regardless of group allocation In other words regardless of
group allocation learners were found to be equally likely to belong to either Class 1 (highest
performing group) Class 2 (intermediate performing group) or Class 3 (lowest performing group)
and therefore perform according to the related profile as indicated earlier in Figure 2
37
Table 10
Parameter Estimates for Six Groups on 3 Classes
Model B SE - B Wald df Exp(B) 95 CI EXP (B)
Class 2
Intercept 43 23 351 1
Group 1 -07 23 09 1 93 60 ndash 147
Group 2 06 26 06 1 107 64 ndash 178
Group 3 -60 35 296 1 55 277 ndash 109
Group 4 01 31 00 1 101 55 ndash 183
Group 5 -08 28 09 1 92 54 ndash 158
Class 3
Intercept -13 26 27 1
Group 1 -23 26 74 1 80 48 ndash 133
Group 2 -20 31 42 1 82 47 ndash 149
Group 3 -36 39 84 1 70 33 ndash 150
Group 4 -35 37 92 1 70 34 ndash 144
Group 5 -53 33 255 1 59 31 ndash 113
Notes p lt 001 N = 5000 Class 1 is the reference category Group 1 = Non-ESL CA Born (n = 4185) Group 2 =
ESL CA Born (n = 308) Group 3 = Non-ESL Non-CA born but living in country less than 5 years (n = 76) Group 4
= ESL Non-CA born but living in country less than 5 years (n = 123) Group 5 = Non-ESL Non-CA born but living in
country 5 years or more (n = 199) Group 6 = ESL Non-CA born but living in country 5 years or more (n = 109)
38
Chapter 5 Discussion
The purpose of this study was to move beyond the total scores of a largescale assessment
in order to gain better insight into the mathematical performances of Ontariorsquos Grade 6 learners
In doing so it aimed to provide evidence of learner strengths and weaknesses in different aspects
of mathematics education on which to base remedial decisions for the improvement thereof
Using the responses of a random sample of 5000 Grade 6 learners to 28 multiple choice
mathematics items on the 20132014 EQAO Junior Division assessment an Exploratory Factor
Analysis (EFA) was firstly performed in order to investigate the dimensionality characteristics
of the assessment This was followed by a Latent Class Analysis (LCA) to determine learner
strengths and weaknesses related to the established mathematical dimensions and their related
strands Lastly a multinomial logistic regression analysis was performed in order to examine the
extent to which mathematics performance profiles were predicted by student background factors
such as language and length of residency in Canada This chapter discusses the findings of these
analyses study limitations and lastly recommendations for future research and education
51 What Characterizes the Dimensionality of the EQAO Mathematics Achievement Test Administered to Grade 6 Students in Ontario Public Schools
The multiple choice mathematics items on the EQAO assessment were characterized as
measuring the ability of learners in three interrelated yet separate mathematical dimensions
These being the ability of learners to apply mathematical knowledge related to procedural
knowledge and conceptual understanding to solve problems in various strands (Factor 1) the
ability to apply process or thinking skills such as problem solving or reasoning skills to solve
problems in ldquoAreardquo (Factor 2) and lastly the ability to apply process or thinking skills to solve
39
problems in various mathematical strands The three factors produced achieved on average
moderate reliability scores
These findings regarding the characteristics of the dimensions were considered valuable
as they allowed for the comparison of learner abilities in two essential elements of mathematical
proficiency as aligned with the Principles and Standards for School Mathematics (NCTM
2000) and as a result also with the Ontario mathematics curriculum which shares the same
foundations Only once this happens namely learner ability measured directly in relation with
mathematical curriculum expectations can we begin an effective process of remediation
(Kilpatrick et al 2001) These elements were that of mathematical knowledge consisting of
procedural and conceptual knowledge as measured by Factor 1 of this study and process or
thinking skills such as problem solving and reasoning as measured by Factor 2 and 3 Factor 2
and 3 were determined to differ based solely on the content of the items included in the
assessment This finding highlights concerns regarding the fair representation of all curriculum
expectations on the assessment and thus warrants further investigation
The fact that the ability to apply mathematical knowledge and the ability to apply
thinking skills in order to solve mathematical problems were found to be sufficiently unique
dimensions to warrant their use using the multiple choice items on this largescale mathematics
assessment adds further value to the findings of this study These findings are valuable in that
they attest to the future potential for assessment organizations to report learner performances
beyond that of total scores as demanded by those in the educational field However since the
factors achieved only moderate reliability scores we are reminded of the need for these tests to
be designed upon foundations aligned with those of the curriculum expectations they are
employed to assess from the start in order for them to meet better test properties (Chudowsky amp
Pellegrino 2003 Rogers 2014)
40
52 In which Mathematical Dimensions and Related Strands do Students Demonstrate Strengths and Weaknesses in their Mathematical Achievement
Three classes were determined to best describe the performances of all Grade 6 learners
in the established dimensions and their related strands Class 1 was described as the highest
performing and second largest group consisting of 321 of the learners Class 2 was described
as the intermediate performing and largest group consisting of 452 of the learners and lastly
Class 3 was described as the lowest performing and smallest group consisting of only 227 of
the learners from the sample
The results of this analysis further revealed that all three classes performed weaker in
their ability to apply thinking skills in order to solve problems either specifically surrounding
the topic of Area or in various strands than in their ability to apply mathematical knowledge in
order to do the same The performances of those in Class 1 were described as especially strong
in the mathematical knowledge dimension (Factor 1) and strong in the thinking dimensions
(Factor 2 and 3) Class 2 was described as strong in the mathematical knowledge dimension but
weak in the thinking skills dimensions and lastly Class 3 was described as moderately weak in
the mathematical knowledge and thinking skills dimensions The discrepancy between
performances in the two subdomains namely mathematical knowledge and thinking skills thus
appeared to be largest for those in Class 2 the intermediate performing and largest group
The findings concerning the overall performances of students in the two subdomains of
mathematical knowledge and thinking skills aligns with those concerning the performances of
US students as described by Kilpatrick et al (2001) They highlight that research evidence over
the past 30 years has consistently indicated that although US students do not fare badly in
applying their knowledge to solve basic mathematical problems they tend to have a limited
41
understanding of mathematical concepts and are noticeably deficient in their ability to apply
mathematical thinking skills to solve even simple problems
It may however be argued that this finding namely a weaker performance in thinking
skills than mathematical knowledge is to be expected given the fact that applying thinking skills
in order to solve problems is a more challenging task than simply applying what you know
(Schoenfeld 2007) However studies have also found that a strong mathematical knowledge
base leads to a better ability to apply thinking skills to solve deeper problems (Stokke 2015)
Thus given the inter-relatedness of these two dimensions together with the large discrepancy
between them for those in Class 2 (strong mathematical knowledge but weak thinking skills)
these findings demonstrate a weakness in the majority of Ontariorsquos Grade 6 learners to apply
thinking skills to solve deeper mathematical problems This finding holds important
recommendations for future research and mathematics educational practices as will be discussed
in the section below
Upon further investigation of learner performances in each of the strands as they relate to
the dimensions it was determined that all three classes performed much weaker in their ability to
apply mathematical knowledge in the Data Management and Probability strand than in the other
strands This strand was also determined to be the weakest in the thinking skills dimension
along with Patterning and Algebra This finding contradicts those of Tatsuoka Corter and
Tatsuoka (2004) in which it was found that students in the US appeared to perform poorest in
Geometry and Spatial Sense Given the inter-relatedness of mathematical knowledge and ability
to apply thinking skills as previously highlighted by Stokke (2015) this finding concerning Data
Management and Probability attests to a knowledge base weakness for Grade 6 Ontario learners
specifically surrounding this strand As for the results surrounding Patterning and Algebra they
appear to provide further support for the weak ability of the learners to apply thinking skills
42
given their relatively strong mathematical knowledge surrounding this strand These findings
also hold valuable recommendations for educational practices in Ontario which will be further
discussed below
53 To What Extent Are Mathematics Performance Profiles Predicted by Student Background such as Language and Residence Status
Findings from this analysis revealed that language background and length of residence in
Canada did not significantly predict performance profile membership Therefore regardless of
group allocation based on these variables all learners were equally likely to achieve a Class 1
(high performing) Class 2 (intermediate performing) or Class 3 (low performing) profile as
described in this study
These findings contradict the Jang et al (2013) study on the performance of learners in
reading In that study it was found that different reading patterns were achieved based on ELL
and length of residence status It was further determined that non-English speakers outperformed
monolinguals in reading achievement after living in the country for five years or more These
findings therefore do not appear to hold true for the performances of learners in mathematics
based on these variables as all learner groups were equally likely to achieve one of the three
performance profiles produced in this study However it needs to be acknowledged that this
study focused on ESL designation as opposed to ELL status which may have contributed to the
differences in findings Nonetheless these findings are considered valuable in that they provide
reassurance of the fact that the test results were not confounded by differences in language
proficiency and that the EQAO test was not biased towards first language speakers
The findings of this study further contradict those that found that English first language
speakers outperformed those for whom English was not their first language (Abedi amp Lord
43
2001 Howie 2003) Therefore they help shed perceptions of differences in mathematical
performances based solely on the aspect of language background This finding holds important
implications for mathematics education for these population groups as well as future research
54 Study Limitations
The following study limitations have been recognized and should thus be taken into
consideration when reviewing these findings Firstly this study analyzed the mathematical
performances of learners based on the results of a standardized test only We are therefore
reminded of the fact that many factors influence test scores over and above that which is random
These include the testing situation tester characteristics and test-taker characteristics (Kaplan amp
Saccuzzo 2009) For this reason it is important that learner performances in other assessment
environments also be considered such as classroom-based assessment activities
Secondly the findings of this study were based solely on learner performances on the
multiple choice items According to Schoenfeld (1992) most multiple choice items are machine
graded which limits their ability to measure learner conceptual understanding and problem
solving abilities to the degree that most people would like For this reason it is important that
future studies consider including the open response questions included on the assessment for a
better reflection of learner conceptual understanding and problem solving
Thirdly this study included performances of learners based solely on a single EQAO
administration and its data Although EQAO proclaims to instill rigorous test equating
procedures to ensure that test difficulty and discrimination properties are not compromised
across years (Rogers 2013) this does not guarantee that learner performances can be generalized
to all Grade 6 learners Furthermore this study focused on only those who took the English
44
version of the test therefore generalizing these findings to those who took the French version
should be done cautiously
Lastly the small ESL population size in comparison to the non-ESL population limits the
findings of this group and may therefore not accurately reflect their performances Furthermore
this study used ESL designation as opposed to ELL status ESL designation is a program in
which learners are enrolled or unenrolled throughout the year Therefore these findings may not
reflect that of the entire ELL population
55 Recommendations and Future Research
In light of recent poor mathematical performances of Ontariorsquos elementary learners the
education minister announced its ldquoRenewed Math Strategyrdquo designed for the purposes of
combatting further decline (Brown 2016) In this strategy requirements for improving the
performances of learners in mathematics were announced such as all learners in Grade 1-8 to
receive at least 60 minutes of mathematics instruction per day further support for weaker
schools in terms of more professional development for teachers as well as more support for
learners and parents surrounding this discipline As this study made apparent in the beginning
such strategies risk being only blanketed approaches that do not really target the heart of the
problem if not accompanied by further insight into the results upon which they are based
This study was conducted in an attempt to gain such insight and found that although
Ontario Grade 6 learners display strong mathematical knowledge the majority are particularly
weak in applying thinking skills such as reasoning and problem solving to solve deeper
mathematical problems It was further determined that learners are particularly weakest in the
Data Management and Probability strand for both mathematical knowledge and thinking skills
dimensions as well as the Patterning and Algebra strand in the latter dimension It was lastly
45
determined that background variables of language and length of residence did not significantly
predict performance and profile achievement and that both ESL and non-ESL learners were
equally likely to belong to high intermediate and low performing groups regardless of length of
residence in Canada Based on these findings the following recommendations surrounding
future research endeavors and educational practices specifically in conjunction with mathematics
education in Ontario will be discussed below
The Ontario Curriculum Grades 1-8 Mathematics 2005 document indicates that the
ultimate goal for mathematics education is to develop learner proficiency beyond that of content
knowledge and therefore also calls for the development of a deeper understanding of the
discipline along with essential thinking skills In order to accomplish these goals the
curriculum highlights that instructional practices need to deviate from a sole focus on direct
teaching methods to incorporate methods of teaching and learning through problem solving in
other words problem-based learning approaches Stokke (2015) blames this greater emphasis of
teaching mathematics using problem-based teaching strategies for the recent decline of Ontario
learnersrsquo mathematical performances She argues that the lack of direct instruction has robbed
learners of a sound knowledge base from which to draw upon when attempting to solve deeper
mathematical problems hence the weakness in this area
However the findings from this study provides evidence that contradicts this argument
as results point to the fact that the majority of Grade 6 learners in Ontario actually do possess
strong mathematical knowledge This finding may therefore perhaps be an indication of the
fact that a large portion of Ontario teachers still rely predominantly on teaching mathematics
using traditional direct teaching methods as opposed to those better suited to meet current
curriculum goals and expectations This finding therefore warrants further investigation into
current teaching trends and holds valuable insight as to where to direct efforts for remediation
46
In order to meet reformed curriculum goals and expectations teaching practices need to
change for which the teacher is the key actor (Ross amp McDougall 2006) Therefore this study
supports those calling for increased efforts directed at teachers and the need to reshape their roles
and perceptions of what it means to ldquoteachrdquo mathematics in a reformed curriculum classroom
For instance Milgram (2007) urges for strategies directed at ensuring that teachers truly
understand what it means to teach using problem-based teaching methods to develop thinking
skills He further illustrates that teaching thinking skills such as problem solving is a
challenging task as it is in itself complex involving both verbal and nonverbal mental processes
For this reason it is essential that learners solve problems for which the answer is not apparent
and requires a novel idea if we wish to effectively develop these skills (Milgram 2007) Such a
teaching and learning process requires that teachers step back allowing learners to grapple with
the task before them as well as interact with each other stepping in only when necessary to
guide the process (Milgram 2007)
Changing the role of the teacher from the traditional sole knowledge bearer and
transferor to one in which heshe shares the responsibility of learning with students is however
only one of 10 dimensions that requires attention when urging teachers to adopt instructional
practices better suited to accomplish curriculum goals and expectations (Ross amp McDougall
2007) Ross and McDougall (2006) further illustrate that in order to ensure that teaching for
deeper understanding as aligned with current reformed mathematics education takes place
teachers need to consider change in all 10 of these dimensions These dimensions as cited in
Ross and McDougall (2006) are summarized as follows 1) the need for program scope 2)
access to all forms of mathematics by students 3) raising self-confidence of students by teachers
4) complex and open-ended student tasks 5) instruction that focuses on constructing
mathematical ideas through self-discovery 6) change in the role of teachers to that of co-learner
47
and co-knowledge creator 7) solving of mathematical problems with the aid of manipulatives 8)
classroom organization in a manner that promotes sharing and interaction for solutions 9)
authentic assessment and lastly 10) a conception of mathematics as a dynamic subject by
teachers
Specifically regarding the first dimension namely the need for program scope Ross and
McDougall (2006) describe it as urging teachers to teach multiple mathematical strands with
increased attention on those less commonly taught such as the Data Management and
Probability and Patterning and Algebra strands The results of this analysis indicated that
learners were weakest in precisely these two strands therefore perhaps providing evidence in
support of the fact that these strands are given less attention by Ontario teachers when teaching
the mathematics curriculum expectations This finding therefore provides added support for the
need to further promote the implementation of these 10 dimensions of teaching for deeper
understanding as indicated above so as to ensure that teachers view all curriculum strands as
equally important and deserving of attention
In calling for these increased efforts directed at changing the way in which mathematics
teaching and learning occurs in classrooms it is important to acknowledge the fact that this is
easier said than done Teaching in a manner that supports the development of a deeper
understanding for mathematics and promotes thinking skills is a lengthy process that takes time
(Milgram 2007) A commodity in short supply for the teacher already feeling pressured to
cover all curriculum expectations before mandatory accountability assessments take place
(Milgram 2007) Therefore not only does this study call for increased efforts directed at
changing teacher perceptions and instructional practices in the classroom but also for policy
makers to consider practical constraints placed on teachers that may restrict the implementation
thereof
48
Lastly the need to predict mathematical performances of learners based on background
variables is made apparent by Hinton (2014) who found that early success in mathematics
predicts future success Therefore for the sake of early intervention especially for the lowest
performing group identified in this study it is urged that further research studies be directed at
determining background variables that better predict performances However it is further urged
that such studies focus on class or profile membership as used in this study as opposed to overall
mathematics performances used in the past In this way not only will we be able to better
identify low intermediate and high performers but also their related strengths and weaknesses
upon which specific remedial efforts can be targeted As for the equal likelihood of ESL and
non-ESL learners to achieve either low intermediate or high performing profiles this study
recommends future studies targeted at shedding perceptions of non-English speakers
underperforming in relation to first language speakers that have perhaps been shaped by previous
studies Without doing so we risk assuming the need for remediation directed at one group
whilst ignoring the needs of others
49
References
Abedi J amp Lord C (2001) The language factor in mathematics tests Applied Measurement
in Education 14(3) doi 101207S15324818AME1403_2
Brown J (2016) Elementary student to get hour of math every day under new Ontario plan
Retrieved July 23 2016 from
httpswwwthestarcomyourtorontoeducation20160404elementary-students-to-get-
hour-of-math-every-day-under-new-ontario-planhtml
Chudowsky N amp Pellegrino JW (2003) Large-scale assessments that support learning what
will it take Theory into Practice 42(1) 75+ Retrieved from
httpgogalegroupcommyaccesslibraryutorontocapsidop=AONEampu=utoronto_mai
nampid=GALE|A99909373ampv=21ampit=rampsid=summonampuserGroup=utoronto_mainampauth
Count=1
Collins L K amp Lanza S T (2010) Latent class and latent transitional analysis with
applications in the social behavioral and health sciences Hoboken NJ Wiley amp Sons
DePascale C (2014) The ideal role of large-scale testing in a comprehensive assessment
system Journal of Applied Testing Technology 5(1) 1-11 Retrieved from
httpwwwjattjournalcomindexphpatparticleview48343
Education Quality and Accountability Office (2016) About the agency Retrieved May 26
2016 from EQAO
httpwwweqaocomenabout_eqaoabout_the_agencyPagesabout-the-agencyaspx
Education Quality and Accountability Office (2014) EQAOrsquos provincial elementary school
report 2014 Retrieved September 26 2015 from EQAO
httpwwweqaocomenassessmentsresultsPagesprovincial-report-elementary-
2014aspx
Figlio D amp Loeb S (2011) School accountability In EA Hanushek S Machin and L
Woessmann (Eds) Handbooks in Economic The Netherlands North-Holland pp 383-
421
Foster D Noyce P amp Spiegel S (2007) When assessment guides instruction Silicon
Valleyrsquos mathematics assessment collaboration In AH Schoenfeld (Ed) Assessing
mathematical proficiency (pp 137-154) Cambridge Cambridge University Press
Friesen S (2005) Math Teaching it better Education Canada 46(1) 6-10
Furr R M (2011) Scale construction and psychometrics for social and personality psychology
Los Angeles SAGE
Fillmore L W (2007) English learners and mathematics learning language issues to consider
In AH Schoenfeld (Eds) Assessing mathematical proficiency (pp 333-344) Cambridge
Cambridge University Press
50
Haertel E H amp Herman J l (2005) A historical perspective on validity arguments for
accountability testing Yearbook of the National Society for the Study of
Education 104(2) 1-34 doi101111j1744-7984200500023x
Hinton A (2014) Tracking student achievement in mathematics over time in English language
schools Retrieved from
httpwwweqaocomenresearch_dataResearch_ReportsPagesstudent-
achievementaspx
Howie S (2005) System-level evaluation Language and other background factors affecting
mathematics achievement Prospects 35(2) 175-186 doi101007s11125-005-1820-
8
Huff K amp Goodman DP (2007) The demand for cognitive diagnostic assessment In JP
Leighton amp MJ Gierl (Eds) Cognitive Diagnostic Assessment for Education (19-60)
New York Cambridge University Press
IBM Corp Released 2013 IBM SPSS Statistics for Windows Version 230 Armonk NY IBM
Corp
Jang E E amp Ryan K (2003) Bridging gaps among curriculum teaching and learning and
assessment Book review Kifer E (2001) Large-scale assessment Dimensions
dilemmas and policy Journal of Curriculum Studies 35(4) 499-512
Jang EE Dunlop M Wagner M Kim Y amp Gu Z (2013) Elementary school ELLsrsquo
reading skill profiles using cognitive diagnosis modelling Roles of length of residence
and home language environment Language Learning 63(3) 400-436 doi
101111lang12016
Kaplan RM amp Saccuzzo DP (2009) Psychological Testing Principles Applications and
Issues Belmont Wadsworth Cengage Learning
Kilpatrick J Swafford J Findell B amp National Research Council (US) (2001) Adding it
up Helping children learn mathematics Washington DC National Academy Press
Klinger D A amp Rogers W T (2011) Teachers perceptions of large-scale assessment
programs within low-stakes accountability frameworks International Journal of
Testing 11(2) 122-143 doi101080153050582011552748
La Rose L (2014) PISA results Canada students high level achievers but math and science
scores dip The Huffington Post Retrieved October 5 2015 from
httpwwwhuffingtonpostca20131203pisa-results-canada-
studentrankings_n_4376190html
Meyers L S Gamst G amp Guarino A J (2006) Applied multivariate research Design and
interpretation Los Angeles Sage
Milgram R J (2007) What is mathematical proficiency In AH Schoenfeld (Eds) Assessing
mathematical proficiency (pp 31-58) Cambridge Cambridge University Press
51
Moschkovich J (2007) Beyond words to mathematical content Assessing English learners in
the mathematical classrooms In AH Schoenfeld (Eds) Assessing mathematical
proficiency (345-352) Cambridge Cambridge University Press
Mutheacuten LK amp Mutheacuten BO (1998-2010) Mplus Userrsquos Guide (6th Ed)
Los Angeles CA Mutheacuten amp Mutheacuten
Nagy P (2000) The three roles of assessment Gatekeeping accountability and instructional
diagnosis Canadian Journal of Education 25(2) Retrieved from
httpmyaccesslibraryutorontocaloginurl=httpsearchproquestcomdocview215374
855accountid=14771
National Council of Teachers of Mathematics (2000) Principles and standards for school
mathematics Reston VA National Council of Teachers of Mathematics
Nichols P D (1994) A framework for developing cognitively diagnostic assessments Review
of Educational Research 64(4) 575 Retrieved from
httpmyaccesslibraryutorontocaloginurl=httpsearchproquestcomdocview214116
755accountid=14771
Nylund K L Asparouhov T amp Mutheacuten B O (2007) Deciding on the number of classes in
latent class analysis and growth mixture modeling A monte carlo simulation
study Structural Equation Modeling A Multidisciplinary Journal 14(4) 535-569
doi10108010705510701575396
OECD (2014) PISA 2012 Results What Students Know and Can Do Student Performance in
Mathematics Reading and Science doi httpdxdoiorg1017879789264208780-en
Ontario (2005) The Ontario curriculum grades 1-8 Toronto Ontario Ministry of Education
Pastor D A Barron K E Miller B J amp Davis S L (2007) A latent profile analysis of
college students achievement goal orientation Contemporary Educational
Psychology 32(1) 8-47 doi101016jcedpsych200610003
Rogers WT (2013) What is the quality of EQAO assessments Excellent Retrieved
September 24 2015 from
httpwwweqaocomenresearch_dataResearch_ReportsPagesbest-assessment-
practicesaspx
Rogers WT (2014) Improving the utility of large-scale assessments in Canada Canadian
Journal of Education 37(3) Retrieved from httpcje-rcecaindexphpcje-
rcearticleview1732
Ross JA amp McDougall D E (2006) Mathematics In K Leithwood P McAdrie N Bascia
amp A Rodrigue A (Eds) Teaching for deep understanding Towards the Ontario
curriculum that we need (pp 33-39) Thousand Oaks CA Corwin Publishing
Schoenfeld A H (2007) Issues and tensions in the assessment of mathematical proficiency In
52
AH Schoenfeld (Ed) Assessing mathematical proficiency (pp3-15) Cambridge
Cambridge University Press
Schoenfeld A H (2007) What is mathematical proficiency and how can it be assessed In
AH Schoenfeld (Ed) Assessing mathematical proficiency (pp 59-73) Cambridge
Cambridge University Press
Schoenfeld A H (1992) Learning to think mathematically Problem solving metacognition
and sense making in mathematics In D Gouws (Ed) Handbook for research on
mathematics teaching and learning (pp 334-370) New York Macmillan
Schumacker R E amp Lomax R G (2004) A beginnerrsquos guide to structural equation modeling
(2nd ed) Mahwah NJ Lawrence Erlbaum Associates
Shapka J Domene J amp Keating D (2006) Trajectories of career aspirations through
adolescence and young adulthood Early math achievement as a critical filter
Educational Research and Evaluation 12(4) 347-358 Retrieved from
httpdxdoiorg10108013803610600765752
Statistics Canada (2016) Immigration and Ethnocultural Diversity in Canada Retrieved May
31 2016 from httpswww12statcangccanhs-enm2011as-sa99-010-x99-010-
x2011001-engcfm
Stein MK Remillard J amp Smith MS (2007) How curriculum influences student learning
In FK Lester amp National Council of Teachers of Mathematics (Eds) Second handbook
of research on mathematics teaching and learning a project of the National Council of
Teachers of Mathematics (pp 1099) Charlotte NC Information Age Pub
Stokke A (2015) What to do about Canadarsquos declining math scores Retrieved from
httpswwwcdhoweorgpdfcommentary_427pdf
Tatsuoka K Corter J amp Tatsuoka C (2004) Patterns of Diagnosed Mathematical Content
and Process Skills in TIMSS-R across a Sample of 20 Countries American Educational
Research Journal41(4) 901-926 Retrieved from
httpwwwjstororgmyaccesslibraryutorontocastable3699467
Uebersax JS (2015) Introduction to the Tetrachoric and Polychoric Correlation Coefficients
Retrieved July 20 2015 from httpjohn-uebersaxcomstattetrahtm
Wilson L D (2007) High-stakes testing In FK Lester and National Council of Teachers of
Mathematics (Eds) Second handbook of research on mathematics teaching and learning
a project of the National Council of Teachers of Mathematics (pp 1053 -1098)
Charlotte NC Information Age Pub
9
2005) Today many mathematics curricular worldwide including that of Canada are based on
the Principles and Standards for School Mathematics as set out by the National Council of
Teachers of Mathematics (NCTM) (Friesen 2005) Very broadly curriculum refers to the
substance or content of teaching and learning it focusses on the ldquowhatrdquo of teaching and learning
as opposed to the ldquohowrdquo (Stein Remillard amp Smith 2007)
This NCTM document calls for the teaching and learning of mathematics with the goal of
developing both content or procedural knowledge and conceptual understanding of the
discipline through the application of essential thinking or processing skills such as problem
solving or reasoning skills which in turn will be developed (NCTM 2000) This goal for
mathematics education is in stark contrast to that of traditional goals where only the teaching and
learning of procedural or content knowledge was valued and taught through rote teaching and
learning practices (Schoenfeld 2007) Procedural knowledge refers to what and how to solve
certain mathematical problems whereas conceptual understanding refers to why a certain
problem is solved the way it is (Kilpatrick Swafford Findell amp NRC 2001)
Furthermore the NCTM adopted the view that standards play a leading role in guiding
the improvement of mathematics education (NCTM 2000) It therefore highlights specific
mathematical standards or expectations that learners should achieve Specifically five Content
Standards are used to guide the teaching and learning of procedural and conceptual knowledge
namely Number and Operations Algebra Geometry Measurement and Data Analysis and
Probability Five Process Standards also guide the essential processes or thinking skills of
Problem Solving Reasoning and Proof Communication Connections and Representation
(NCTM 2000) The NCTM (2000) repeatedly proclaims the interconnectedness of these
standards by indicating that procedural knowledge should never exist without conceptual
10
understanding which in turn should not be developed without the application and acquisition of
the essential processing skills
The Content and Process Standards are further classified into groups or categories for
assessment purposes in mathematics curricular such as that of Ontario Specifically the Ontario
Curriculum Grades 1-8 Mathematics 2005 document describes four categories of Knowledge
and Understanding Thinking Communication and Application to which the standards are
allocated These four categories are known as the Knowledge and Skills categories and are
reflected in the documentrsquos Achievement Chart The first category of Knowledge and
Understanding can be described as encompassing mathematical knowledge of content and
understanding and therefore focusses predominantly on the achievement of the Content
Standards The remaining three categories focus predominantly on the use of the Process
Standards The Thinking category assesses the use of problem solving reasoning and proving
processes the Communication category focusses on the assessment of the communicating
processes and lastly the Application category focusses on the assessment of the connecting
processes
From the above mathematics curriculum we can see that the knowledge base is still
considered important in mathematics education however so is conceptual understanding and the
application and acquisition of thinking skills As stated by Schoenfeld (2007) anyone who lacks
a solid grasp of facts procedures definitions and concepts is significantly handicapped in
mathematics yet there is more to being mathematically proficient than simply reproducing
standard content on demand Therefore if we are interested in understanding mathematical
proficiency as it is taught and learned today it is important that we reflect learner abilities in all
aspects of the discipline (Kilpatrick et al 2001) In so doing we will gain better insight into
11
their strengths and weaknesses allowing us to remediate accordingly in our efforts to improve
learner performances in this essential discipline
23 Factors Predicting Mathematical Performances
Given the relative importance of mathematics it is no surprise that much research has been
dedicated to highlighting and isolating the number or factors that can influence and predict
mathematical performances By doing so early interventions and remedial strategies can be
better targeted to improve future mathematical success (Hinton 2014)
One such factor that has been given much attention is that of language proficiency and its
influence on mathematical performances Studies conducted by Hinton (2014) Howie (2005)
and Abedi and Lord (2001) for instance discovered that learners who spoke English as a second
language performed worse in mathematical assessments compared to their English proficient
counterparts Fillmore (2007) however cautions against interpreting this as a lack of
mathematical ability without firstly taking into account the aspect of language Since much of
the mathematics taught today is presented in the form of a word problem it relies heavily on a
deep understanding of language (Moschovich 2007) Therefore trying to tease out precisely
how much of the struggle is related to a language issue and how much to an issue with
mathematics is a unique challenge for teachers assessment and English Language Learners
(ELLrsquos) (Fillmore 2007) As highlighted by Moschovich (2007) assessment is certainly a
complex task perhaps especially when working with students who are learning English It is
challenging to decide whether an utterance reflects a studentrsquos conceptual understanding a
studentrsquos proficiency in expressing their ideas in English or a combination of mathematical
understanding and English proficiency
12
Canada has a high and diverse immigrant population for instance 206 of its population
in 2011 was determined to be comprised of immigrants from various countries (Statistics
Canada 2016) Thus the mathematical performances of ELLrsquos cannot be ignored Fortunately
this aspect is currently given attention in the province of Ontario as assessment organizations
such as the EQAO do attempt to report separately on these learnersrsquo performances However
Jang Dunlop Wagner Kim and Gu (2013) warn against treating ELLrsquos as a homogenous group
Their study found that when taking into account the length of residence in Canada
performances of these students varied significantly concerning their reading proficiencies
Therefore if we wish to predict mathematical performances or gain better insight based on
student background such as language factors it is necessary to consider subpopulation groups
that make up the overall ELL population such as length of residence in the country
13
Chapter 3 Method
This chapter describes the participants instrument and data as well as the three main
analyses used to answer the questions presented in this study
31 Participants
The current study used data made available by the Education Quality and Accountability
Office (EQAO) of Ontario The EQAO is an arms-length Ontario government agency that is
responsible for developing and overseeing reading writing and mathematics assessments
administered to Grade 3 6 9 and 10 students in Ontario public schools The purpose of the
results of these largescale assessments is to determine the extent to which learners have achieved
the curriculum standards of the particular discipline for educational accountability and
improvement purposes (EQAO 2016)
Learnersrsquo responses are scored by the EQAO using Classical Test Theory and Item
Response Theory (Rogers 2013) to generate a score that is then converted into a Level NIE 1 2
3 or 4 Level 3 describes a performance at the provincial standard whereas Level 4 a
performance surpassing the standard Level 2 a performance approaching the standard and Level 1
a performance much below the standard Lastly a ldquoNIErdquo rating is generated for those learners
who have not provided sufficient evidence for a Level 1 score The EQAO test scores are reported
using these proficiency levels for each of the areas tested namely reading writing and
mathematics Background information such as gender time lived in Canada and student home
language etc is also collected by questionnaires administered by the EQAO over the same time
The full population data set comprised of approximately 127 302 Grade 6 learnersrsquo
responses to the English 20132014 provincial Junior Division assessment A random sample of
5000 learner responses to the assessment was drawn from the entire data set Learners with
missing data on any of the variables were excluded from the sampling process so that the final
14
data set contained responses to all mathematics items as well as background information All
learners within the sample were enrolled at the time in Grade 6 and attended various schools
across the province Table 1 below presents the distributions of student subgroups from the
random sample based on their gender language background and time spent in Canada in
comparison with the entire population The percentage of learners in each subgroup was very
closely aligned with the larger Grade 6 population and was therefore considered a representative
sample
Table 1
Final Random Sample used for the Analysis
Standard Gender Language Time lived in Canada
Met
Below
Female
Male
Non-
ESL
ESL
CA
Born
Non-CA
born lt 5
years
Non-CA
born ge 5
years
Frequency 2765 2235 2456 2544 4460 540 4493 199 308
Sample 553 447 491 519 892 108 899 4 62
Population 54 46 49 51 887 113 871 4 89
Notes N = 5000 Standard = met the provincial standard or achieved below the provincial standard ESL = enrolled in
English as a Second language program Time lived in Canada = Canadian born learners non-Canadian born learners
who have lived in Canada for less than 5 years and non-Canadian born learners who have lived in Canada for 5 years
or more
32 Instrument
Student responses to the mathematics test items and background information on the EQAO
20132014 Junior Division assessment were used for this study This assessment is a provincially
mandated largescale assessment used by the Ontario government to measure the extent to which
learners have achieved the standards as laid out in the curriculum All the EQAO largescale
assessments are designed using rigorous development procedures and meet high testing standards
with acceptably high reliabilities (Rogers 2013) of above 80 The Junior Division assessment is
15
specifically administered to all Grade 6 learners attending schools within the province of Ontario
during the months of May and June and under highly standardized conditions (EQAO 2016) The
assessment measures reading writing and mathematical skills in each of the corresponding
sections The mathematics section specifically consists of 36 items of which 28 are multiple choice
items and 8 are constructed-response format questions This study included only the 28 multiple
choice items
While the EQAO does not claim to measure the Knowledge and Skills categories as laid out
in the Ontario Curriculum Grades 1-8 Mathematics 2005 document (Rogers 2013) it still
references each of the mathematics items to one of three of the categories namely that of
Knowledge and Understanding Thinking and Application The category of Communication is not
represented by any of the items as according to Rogers (2013) this skill is not feasible to assess in
a paper-and-pencil based test For items to be referenced to the Knowledge and Understanding
category they need to be recognized as requiring students to demonstrate subject specific content
and comprehend its meaning Those referenced to the Application category need to be recognized
as requiring students to select an appropriate mathematical tool and apply the appropriate
information Lastly those referenced to the Thinking category need to be seen as requiring of
students to select and sequence a variety of tools and think critically in order to solve problems
(Rogers 2013) Items are scrutinized by teachers and other content experts for the process of
allocating items to the most appropriate category Items are further referenced to the five content
areas or strands of the curriculum document according to their content topic namely Number Sense
and Numeration Measurement Geometry and Spatial Sense Patterning and Algebra and Data
Management and Probability
Table 2 shows the representation of each of the Knowledge and Skills categories and the
strands to which the 28 multiple choice items were referenced by the EQAO as well as the item
difficulties (p-values) and discrimination indices (pt-biserial correlations) for each of these items
According to Kaplan and Saccuzzo (2007) item difficulty values should range from 30 to 70 to
16
maximize information about the differences among individuals Furthermore item discriminability
values should not be negative or below 20 to be considered adequate Based on these
recommendations all 28 items were considered suitable to be included in the analyses of this study
Table 2
Knowledge and Skills Categories Strands and Descriptive Statistics of 28 Mathematics Items
Item Know amp Skill Strand p-value pt-biserial
1 K and U Patterning amp Algebra 86 39
14 K and U Patterning amp Algebra 74 43
3 K and U Number Sense amp Numeration 76 37
15 K and U Number Sense amp Numeration 86 35
9 K and U Data Management amp Probability 48 33
19 K and U Measurement 50 27
25 K and U Measurement 76 40
22 K and U Geometry amp Spatial Sense 87 34
73 36
11 App Patterning amp Algebra 81 43
24 App Patterning amp Algebra 70 37
26 App Patterning amp Algebra 40 30
5 App Number Sense amp Numeration 56 38
7 App Number Sense amp Numeration 82 30
10 App Data Management amp Probability 55 47
18 App Data Management amp Probability 78 47
23 App Data Management amp Probability 71 42
2 App Measurement 59 31
8 App Measurement 58 28
20 App Measurement 54 47
6 App Geometry amp Spatial Sense 68 38
64 38
17 Think Patterning amp Algebra 52 36
21 Think Number Sense amp Numeration 57 22
28 Think Number Sense amp Numeration 69 33
4 Think Data Management amp Probability 46 35
13 Think Measurement 54 39
27 Think Measurement 41 46
12 Think Geometry amp Spatial Sense 42 35
16 Think Geometry amp Spatial Sense 54 34
52 35
Notes K and U = Knowledge amp Understanding App = Application Think = Thinking p-value and pt-biserial means
for each Knowledge amp Skill category represented in bold
17
No items had p-values below 30 however 10 items had difficulty values above 70
indicating that they were relatively easy for this sample Since none of the p-values were above
90 they were considered to still possess sufficient variability to be included in the analyses
Furthermore no items had values below the recommended 20 or negative pt-biserial values Table
2 further highlights the item difficulty and discrimination means for each of the three categories
From these values it can be concluded that the items referenced to the Knowledge and
Understanding category were relatively more easy for this sample while those items referenced to
the Thinking category more difficult and those referenced to the Application category moderately
difficult Lastly it is highlighted that a greater number of items represented the Application
category (12 items) than the Knowledge and Understanding and Thinking category which had an
equal number of eight items
33 Data Analysis
The data analyses involved three phases each of which addressed one of the three questions
asked in this study The first phase used Exploratory Factor Analysis (EFA) approaches to
examine the first research question ldquoWhat characterizes the dimensionality of the EQAO
mathematics achievement test administered to Grade 6 students in Ontario public schoolsrdquo
Latent Class Analysis (LCA) approaches were used in the second phase in order to answer question
two ldquoIn which mathematical dimensions and related strands do students demonstrate strengths and
weaknesses in their mathematical achievementrdquo A multinomial logistic regression analysis was
performed to examine research question three ldquoTo what extent are mathematics performance
profiles predicted by student background such as language and length of residence statusrdquo
331 Phase 1 Establishing the Dimensionality of the Assessment
An Exploratory Factor Analysis (EFA) was conducted in order to determine the
dimensionality of the EQAO Grade 6 mathematics test based on 5000 studentsrsquo responses to 28
multiple choice items Although exploratory in nature the EFA was used to examine the extent
18
to which the test dimensionality can be accounted for by knowledge and skills and further by the
strand specified by the EQAO
EFA is a statistical procedure that simplifies the process of visually inspecting a range of
correlations in order to examine the dimensionality of measures (Furr 2011) The 28 multiple
choice items were firstly recoded as binary data thus creating dichotomous categories (0 =
incorrect responses and 1 = correct responses) In order to perform an EFA with this type of
data a more sophisticated statistical software package is required The reason for this being that
standard software such as IBMrsquos SPSS (version 230) creates correlation matrices suitable only
for continuous data that assume a normal distribution (Uebersax 2015) Therefore MPLUS
version 612 (Mutheacuten amp Mutheacuten 1998-2012) was used for the analysis so that a tetrachoric
correlation matrix could be generated to suite the binary data used in this study
When conducting an EFA in Mplus a correlation matrix eigenvalues and model fitting
statistics such as the chi-square test Root Mean Square Error of Approximation (RMSEA) and
Root Mean Square Residual (RMSR) are produced in order to assist with the process of
determining the solution that best fits the data A good fitting model will be represented by a
non-significant chi-square p-value as well as a RMSEA value and RMSR value of below 05
(Schumacker amp Lomax 2004) However interpretability of the model should also be taken into
consideration when deciding on the best solution (Meyers Gamst amp Guarino 2013) The
weighted least-squares with mean (wlsm) estimation method as recommended by Mutheacuten and
Mutheacuten (1998-2012) for binary data and the oblique rotation method (Promax) was used for this
analysis based on the assumption that factors are likely to be correlated with each other
Four steps were implemented during this phase The first step entailed determining the
ideal number of factors to be extracted to best describe the data This entailed a combined
evaluation of the correlation matrix eigenvalues scree plot and fit statistics as described above
The next step entailed an evaluation of the items and their loadings on each of the factors to
determine if any should be discarded in terms of low factor loadings or cross-loadings If any
19
items were deemed unacceptable these were removed and the analysis re-run and subsequently
re-evaluated This step was repeated until a final and appropriate factor solution model was
obtained Following this the reliability for each factor was established followed by an
investigation of the factor correlations in order to determine the uniqueness of each extracted
dimension Ideally items should correlate highly with each other within each extracted
factordimension however for each dimension to be considered unique between-factor
correlations should be low (Rogers 2014) According to Meyers et al (2013) between-factor
correlations should not exceed 80 to warrant the use of a separate dimension The last step
involved an investigation of the similarities between items in each factor in order to describe the
items that make up each This was done firstly in terms of the three Knowledge and Skills
categories and secondly the five strands to which the items were referenced as well as any
further content similarities
332 Phase 2 Identifying Mathematical Strengths and Weaknesses
In an attempt to identify in which mathematical subdomains or dimensions and related
strands learner performances were strongest and weakest as asked in question two of this study a
Latent Class Analysis (LCA) was performed using MPLUS version 612 (Mutheacuten amp Mutheacuten
1998-2012)
Specifically the goal of a mixture model is to reveal unobserved heterogeneous and
meaningful population groups within the larger homogenous population by identifying similarities
in their responses to measured variables (Nylund Asparouhov amp Mutheacuten 2007) These identified
latent populations or sub-groups are called classes Therefore using this analysis allowed for the
generation of distinct performance profiles for each sub-group or class identified as performing
similarly in the largescale assessment In this way more accurate class specific strengths and
weaknesses could be described as opposed to simply those of the overall Grade 6 population
20
For an LCA the outcome variables used are specifically categorical (Nylund et al 2007)
Therefore dichotomously scored response data from the random sample of 5000 students were
used for the LCA The LCA approach is exploratory in nature because the optimal number of
classes representing all latent classes cannot be determined apriori (Nylund et al 2007) Therefore
an investigation of relevant fit statistics generated by the LCA was firstly conducted According to
Pastor Barron Miller and Davis (2007) the fit statistics commonly used to determine the optimum
number of classes include the Bayesian Information Criterion (BIC) the sample-size adjusted BIC
and the Akaike Information Criterion (AIC) where lower values indicate a better fitting model An
Entropy statistic is also commonly used to determine model fit This statistic ranges from 0 to 1
where values closest to 1 indicate higher classification accuracy
Following the identification of the best fitting model the entire sample was profiled in
terms of distinct mathematics classes In order to reduce the number of points on these profiles
items were grouped according to the strand to which they were referenced by EQAO within each
identified factor This allowed for the identification of learner strengths and weaknesses not only
surrounding factors but also each strand within each factor
As part of the LCA mean item probability scores are calculated for each class This statistic
indicates the mean probability for each class to respond correctly to an item and therefore ranges
from 0 to 1 (Nylund et al 2007) Values closest to one therefore indicate a higher probability of
responding correctly to an item Using these values for each item average item-group probability
scores were calculated and these values were then used to describe class specific strengths and
weaknesses This was done firstly by describing overall item-group performances in comparison
to other classes and secondly by describing class performances in each specific factor overall and
lastly in terms of each strand within each factor
21
333 Phase 3 Predicting Class and Profile Membership
In order to answer question three concerning whether or not English as a second language
and length of residence in Canada significantly predicted the performance profile to which a
learner belongs a multinomial logistics regression analysis was conducted This phase was
completed using IBMrsquos SPSS (version 230)
A multinomial logistic regression is used when the dependent variable for the analysis
consists of more than two categorical levels (Meyers et al 2013) Besides the item probability
mean generated by the LCA a class probability mean for each learner in the sample is also
calculated as part of the analysis This class probability indicates the likelihood of a learner
belonging to each of the classes or performance profiles Based on the highest class probability
learners were allocated to one of the performance profiles as generated in phase 2 These classes
were coded 1 2 3 etc based on the number of classes determined to best describe the sample and
represented the dependent or predicted variable of the analysis
Table 3
Six Groups Created Based on English as Second Language and Time Lived in Canada
Group Language Time lived in Canada n
1 Non-ESL CA born 4185 837
2 ESL CA born 308 62
3 Non-ESL Non-CA born lt 5 years 76 15
4 ESL Non-CA born lt 5 years 123 25
5 Non-ESL Non-CA born ge 5 years 199 40
6 ESL Non-CA born ge 5 years 109 22
Notes N = 5000 ESL = English as a second language learner CA born = Born in Canada
An independent variable used for predicting the latent class membership included six
groups based on the following background variables English Second Language (ESL) status as
22
well as whether or not they were Canadian born non-Canadian born but at the time had resided in
the country for less than 5 years or non-Canadian born but at the time had resided in the country for
five years or more This was done in order to avoid clustering ELL learners as a homogenous group
and therefore better identify learners These six categorical data groups represented the predictor
or independent variable Table 3 indicates more precisely how each of the groups were created as
well as their sizes
23
Chapter 4 Results
The results of this study are discussed according to the three questions presented and phases
of data analyses as discussed in Chapter 3 Firstly the results produced from the Exploratory
Factor Analysis (EFA) described in phase one concerning question one are reported Secondly
those produced by the Latent Class Analysis (LCA) in phase two to answer question two and lastly
those produced from the multinomial logistics regression analysis conducted in phase three to
answer question three are presented in this chapter
41 Dimensionality Characteristics
As noted an EFA was conducted on the 28 multiple choice mathematics items in order to
determine the dimensionality of the largescale assessment to which they belonged The
eigenvalues of the tetrachoric correlation matrix (Table 4) produced by Mplus ranged between
862 and 41 the first three factors showed eigenvalues greater than 1 and accounted for 3953 of
the total variance
Table 4
Eigenvalues of Correlation Matrix indicating Total Variance Explained
Item Eigenvalue Item Eigenvalue Item Eigenvalue Item Eigenvalue
1 86 2 13 3 10 4 93
5 91 6 90 7 87 8 85
9 84 10 80 11 79 12 76
13 74 14 72 15 70 16 69
17 66 18 65 19 64 20 63
21 60 22 57 23 53 24 52
25 50 26 49 27 46 28 41
24
411 Determining the Best Fitting Factor Solution Model
The eigenvalues scree plot and fit statistics were used to determine the best number of
factors to describe this data set Based on the ldquonumber of eigenvalues greater and equal to one
rulerdquo as suggested by Meyers et al (2013) together with the scree plot and relevant fit statistics it
seemed adequate to extract three factors albeit accounting for less than 50 of the variance
Figure 1 Scree plot
Although three eigenvalues were produced greater and equal to one suggesting the
existence of three factors this was contradicted by the scree plot (Figure 1) which suggested the
existence of only two factors as it appeared to level off mostly at number three Subsequently a
comparison of the one to three factor solutions was conducted in terms of the relevant fit statistics
as described in Table 5
The significant chi-square p-values (lt 001) generated for the one and two factor solutions
suggested that the data differed significantly from the model matrix Although the chi-square p-
value has been criticized in the past for being overly sensitive to large sample sizes and therefore
0
05
1
15
2
25
3
35
4
45
5
55
6
65
7
75
8
85
9
1 2 3 4 5 6 7 8 9 10 11 12 13 14 15 16 17 18 19 20 21 22 23 24 25 26 27 28
Eig
envalu
es
Items
25
almost always producing a significant value (Meyers et al 2013) this was determined not to be the
case for this analysis as the p-value generated in the three factor model increased substantially
from the one to two factor model thus ensuring the reliability of this value
Table 5
EFA Model Fit Statistics of the 1 to 3 Factor Solutions on 28 Mathematics Items
FA model Chi-Square df p-value RMSEA RMSR
1 92476 350 lt 001 018 031
2 44012 323 lt001 009 021
3 34390 297 032 006 019
Note N = 5000
Therefore since the Chi-square p-value of 032 of the three factor model was not significant
(at the 001 probability level) as well as the fact that only two items represented the fourth factor in
the four factor solution model it was deemed a good fitting model The values of 006 and 019 of
the RMSEA and RMSR respectively were well below the 05 recommended value providing
further support for this three factor solution model
A further inspection of the factor loadings from the three-factor solution as well as of the
items on each factor resulted in the removal of four items (ie 12 18 23 and 24) Items 18 23 and
24 were discarded as a result of low factor loading scores below 30 Whereas a decision was made
to remove Item 12 as it was the only item referenced to the Thinking category that did not load on
the factors in the same way that the others did Table 6 presents the final factor loadings with the
Knowledge and Skills categories to which items were originally allocated by the EQAO that is
knowledge and understanding application and thinking
The Promax factor correlation matrix produced by Mplus (Table 7) revealed that all three
factors correlated positively and moderately to high with one another The strongest correlation
26
existed between Factor 1 and Factor 3 with a relatively high coefficient value of 747 while the
weakest correlation existed between Factor 1 and Factor 2 with a coefficient of 576
Table 6
Factor Loadings of the 23 Items used in the Final 3 Factor Solution Model
Item Knowledge amp Skill Factor 1 Factor 2 Factor 3
1 KU 64 -09 13
11 App 63 -04 12
14 KU 55 13 01
6 App 51 12 -04
15 KU 51 -05 14
10 App 47 23 05
7 App 45 -12 13
25 KU 38 09 17
3 KU 35 -01 24
9 KU 35 09 07
22 KU 31 07 23
5 APP 30 09 22
13 App 10 65 -05
27 Think -04 63 23
2 Think -07 50 12
20 App 14 -03 59
17 Think -04 04 55
26 App 13 01 33
8 App 11 -01 32
28 Think 15 03 32
16 Think 11 10 31
4 Think 14 12 30
21 Think -04 08 30
α = 725 α = 536 α = 565
Notes KU = Knowledge and Understanding App = Application Think = Thinking category
As stated earlier according to Meyers et al (2013) correlations should not exceed 80 to warrant
the use of separate factors These results are therefore considered to reveal the existence of three
27
unique factors that can be used to describe the multidimensionality of these mathematics multiple
choice items
Table 7
Promax Factor Correlations Between 3 Factors
Factors FA 1 FA 2
Factor 1
Factor 2 576
Factor 3 747 626
Note N = 5000
As indicated in Table 6 Factor 1 consisted of 12 items in total with factor loading scores
ranging between 30 and 64 and achieved a relatively high Cronbachrsquos alpha of 725 All seven
items referenced to the Knowledge and Understanding category used in the final model loaded
together on Factor 1 along with five items referenced to the Application category Factor 2
consisted of only three items with factor loading scores ranging between 50 and 63 and
achieved a moderate Cronbachrsquos alpha of 536 In Factor 2 two items referenced to the Thinking
category and one to the Application category loaded together to make up the total of three items
for this factor Lastly Factor 3 consisted of a total of eight items with factor loading scores
ranging between 30 and 59 and also achieved a moderate Cronbachrsquos alpha score of 565 The
remaining five items referenced to the Thinking category and three items referenced to the
Application category loaded together to make up the eight items that loaded together on Factor 3
In terms of the strands to which the items in Factor 1 were referenced for instance
Patterning and Algebra etc no clear similarities appeared to exist to tie all the items together
based on this However similarities seemed to exist in terms of the applied skill requested of
learners to solve the mathematical problems It appeared that all the items of this factor merely
requested of learners to apply their mathematical knowledge in terms of procedures and
conceptual understanding to answer the questions For instance Item 15 which is referenced to
28
the Knowledge and Understanding category asks the following ldquoWhat is the value of 0730 ndash
0156rdquo Whereas Item 5 which is referenced to the Application category asks that learners
solve problems involving the addition of decimal numbers (the exact question was not released)
Therefore it was determined that no clear difference existed between the applied skill requested
from these two items even though they were referenced to two different Knowledge and Skills
categories It was therefore concluded that Factor 1 could be described as measuring the
application of mathematical knowledge to solve problems in various strands
An inspection of the items that loaded together on Factor 2 revealed that two of the items
were referenced to the Thinking category while one of the items was referenced to the
Application category Furthermore all three items were similar in that that they covered the
ldquoMeasurementrdquo strand and more specifically that all three items requested of learners to solve
problems relating to ldquoAreardquo Item 2 for instance asks ldquoThe parallelogram below will be cut
into two congruent triangles (provides dimensions) What is the area of one of the trianglesrdquo
Item 13 asks ldquoWhich of the following shows a rectangle and a triangle that have the same areardquo
and lastly Item 27 requests that learners compare the areas of two polygons (exact item not
released) Item 2 was referenced to the Application category whereas Items 13 and 27 were
referenced to the Thinking category It was therefore determined that Factor 2 could be
described as requesting of learners to apply thinking processes or skills such as problem solving
and reasoning in order to solve deeper mathematical problems specifically surrounding the
Measurement topic of ldquoAreardquo
Lastly for Factor 3 as with Factor 1 no clear similarities appeared to exist to tie all the
items together based on strands However as with Factor 1 similarities seemed to exist in terms
of the applied skill requested of learners to solve the mathematical problems It appeared that
all the items on this factor requested of learners to apply thinking skills to solve deeper
mathematical problems surrounding various strands in other words learners had to go beyond
the mere application of content knowledge to solve these items For instance Item 20 referenced
29
to the Application category requested that learners solve the following problem ldquoEach beaker of
water below has a capacity of 2L Which beaker appears to have about 500ml of water in itrdquo
Whereas Item 28 referenced to the Thinking category asks ldquoMrs Garrett sends surveys to 120
students and 78 students return the survey Which statement best describes the percent of
students who return the surveyrdquo Again no clear difference appeared to exist between the
applied skill requested of learners in terms of the Application and Thinking categories to which
the items were referenced It was therefore concluded that Factor 3 could be described as
measuring the ability of learners to apply thinking processes or skills such as problem solving
and reasoning in order to solve deeper mathematical problems in various strands
In sum the results of the EFA determined that a three factor model could be used to
adequately characterize the dimensionality of the multiple choice mathematics items on the
EQAO assessment Twelve items clustered adequately together in terms of factor loading scores
to form Factor 1 which achieved a relatively high Cronbachrsquos alpha of 725 three items on
Factor 2 which achieved a moderate Cronbachrsquos alpha of 536 and lastly eight items on Factor
3 which also achieved a moderate Cronbachrsquos alpha score of 565 Upon closer inspection of
the items on each factor and in terms of the Knowledge and Skills categories and strands to
which they were referenced by the EQAO it was determined that Factor 1 could be best
described as measuring the ability of learners to apply mathematical knowledge related to
procedural and conceptual understanding in order to solve problems in various mathematical
strands Factor 2 could be best described as measuring the ability of learners to apply process
or thinking skills in order to solve problems related specifically to the topic of ldquoAreardquo
Lastly Factor 3 could be best described as measuring the ability of learners to apply thinking
skills in various mathematical strands
30
42 Mathematical Strengths and Weaknesses
In an attempt to identify in which mathematical dimensions and related strands Grade 6
learner performances were strongest and weakest as asked in question two of this study a Latent
Class Analysis (LCA) was conducted This allowed for distinct performance profiles to be
generated for classes or sub-groups performing similarly in the population and therefore allowed
for more accurate descriptions of strengths and weaknesses The factors as established in the
dimensionality investigation in Phase 1 of this study were used to represent the dimensions for this
analysis
Although the four class model achieved the lowest AIC BIC and Sample-Size Adjusted
BIC statistic values in comparison to the two and three class model it also produced a much lower
Entropy value of 69 (see Table 8) Therefore it was decided that since these statistics did not
decrease that much from the three class to four class model the use of the four class model with a
much lower Entropy value did not seem warranted Thus the three class model was opted for
instead as it produced lower fit statistics than the two class model as well as a sufficiently high
Entropy value of 75 Furthermore the results indicated that each class was represented by the
following proportion of learners from the sample Class 1 comprised of 321 Class 2 of 452
and Class 3 of 227
Table 8
LCA Fit Statistics for 2 3 and 4 Classes
Fit statistics 2 Classes 3 Classes 4 Classes
AIC 12974224 12808557 12789120
BIC 13004854 12854829 12851034
Adj BIC 12989919 12832268 12820846
Entropy 81 75 69
Notes N = 5000 AIC = Akaike Information Criterion BIC = Bayesian Information Criterion Adj BIC = Sample-
Size Adjusted Bayesian Information Criterion
31
Eleven item-groups were created to describe the strengths and weaknesses of the three
classes as represented in Table 9 Item-groups were created by grouping items according to the
factor they were determined to measure (as established in the EFA) as well as the strand to which
they were allocated by the EQAO Five item-groups were created for Factor 1 one item-group for
Factor 2 and five groups for Factor 3 The number of items within each item-group varied from 1
item to 4 items The mean probability scores calculated for each class for each item-group and
overall dimension or factor are also represented in Table 9 These mean item-group probability
scores as presented in Table 9 were used to plot three distinct performance profiles for each class as
represented in Figure 2 below
Table 9
Item-Groups created to Describe Mathematical Performances of Grade 6 Learners
Factor Content Area of items Class 1 Class 2 Class 3
1 Patterning amp Algebra 3 97 86 48
1 Measurement 1 95 78 44
1 Geometry amp Spatial Sense 2 94 79 50
1 Number Sense amp Numeration 4 92 76 49
1 Data Management amp Probability 2 78 49 19
Factor 1 class probability means 91 74 44
2 Measurement (Area) 3 85 39 28
Factor 2 class probability means 85 39 28
3 Patterning amp Algebra 2 67 43 20
3 Measurement 2 79 55 25
3 Geometry amp Spatial Sense 1 79 47 31
3 Number Sense amp Numeration 2 80 60 44
3 Data Management amp Probability 1 72 40 22
Factor 3 class probability means 76 51 29
Note The factor probability means presented in bold are slightly higher as the actual item probability score was used
to calculate these values and not the item-group probability scores
Using the evidence generated from the mean item-group and factor probability scores as
represented in Table 9 and Figure 2 these performance profiles were used to describe the strengths
32
and weaknesses of each class Class specific strengths and weaknesses were described according
to firstly overall performances in the 11 item-groups in comparison to the other classes secondly
in terms of overall performances in each dimension (Factor 1 2 and 3) and lastly in terms of
performances in each strand within each dimension for Factor 1 and 3 only (as Factor 2 only
represented Measurement topic of ldquoAreardquo) A mean item-group probability score ranging from 86
- 10 was described as especially strong 71 - 85 as strong and 56 - 70 as moderately strong
while those scores ranging from 41 - 55 were described as moderately weak 26 - 40 as
moderately weak and 25 and below as especially weak
Figure 2 Three performance profiles of Grade 6 learners in 11 mathematical item-groups
Results indicated that those learners most likely to belong to Class 1 performed higher than
Class 2 and 3 in all item-groups Therefore this class to which 321 of learners from the sample
belonged can be best described as the highest performing and second largest group overall Those
most likely to belong to this class can be described as having an especially strong ability to apply
0
01
02
03
04
05
06
07
08
09
1
Item
-Gro
up
Mea
n P
rob
ab
ilit
y
Item-Groups
Class 1 (321) Class 2 (452) Class 3 (227)
33
mathematical knowledge in order to solve problems in various strands This was determined by the
average 91 overall probability for success achieved for those items related to Factor 1 They can
also be described as having a strong ability to apply thinking skills in order to solve problems
surrounding the Measurement topic of ldquoAreardquo and strong ability to do the same in various strands
This was determined by the 85 probability for success achieved for those items related to Factor
2 and 76 probability for success achieved for those related to Factor 3 Furthermore their overall
performances in the knowledge dimension can be described as stronger in comparison to their
performances in the thinking dimensions
Specifically concerning their ability to apply mathematical knowledge in various strands
(Factor 1) these learners can be described as performing slightly stronger in the Patterning and
Algebra (item-group probability score = 97) and considerably weaker in Data Management and
Probability (item-group probability score = 78) in relation to their performances in the other
strands Specifically regarding their ability to apply think skills in order to solve problems (Factor
3) they can be described as performing slightly stronger in Number Sense and Numeration (item-
group probability score = 80) and considerably weaker in Data Management and Probability (item-
group probability score = 72) and Patterning and Algebra (item-group probability score = 67) with
the latter being the weakest in relation to their performances in the other strands
Results further indicated that those learners most likely to belong to Class 2 performed
overall lower than Class 1 but higher than Class 3 in all item-groups Therefore this class to
which 452 of the learners belonged can be best described as the intermediate performing and
largest group overall Those most likely to belong to this class can be described as having a strong
ability to apply mathematical knowledge in order to solve problems in various strands This was
determined by the average 74 overall probability for success achieved for those items related to
Factor 1 They can also be described as having a weak ability to apply thinking skills in order to
solve problems surrounding the Measurement topic of ldquoAreardquo and moderately weak ability to do
the same in various strands This was determined by the 39 probability for success achieved for
34
those items related to Factor 2 and 51 probability for success achieved for those related to Factor
3 Furthermore their overall performances in the knowledge dimension can be described as
stronger in comparison to their performances in the thinking dimensions
Specifically concerning their ability to apply mathematical knowledge in various strands
(Factor 1) performances for these learners can be described as considerably stronger in Patterning
and Algebra (item-group probability score = 86) and considerably weaker in Data Management
and Probability (item-group probability score = 49) in relation to their performances in the other
strands Specifically regarding their ability to apply thinking skills in order to solve problems
(Factor 3) performances can be described as stronger in Number Sense and Numeration (item-
group probability score = 60) and considerably weaker in Data Management and Probability (item-
group probability score = 40) and Patterning and Algebra (item-group probability score = 43) with
the former being the weakest in relation to their performances in the other strands
Lastly results indicated that those learners most likely to belong to Class 3 performed lower
than Class 1 and 2 in all item-groups Therefore this class to which 227 of learners belonged
can be best described as the lowest performing group overall Those most likely to belong to this
class can be described as having a moderately weak ability to apply mathematical knowledge in
order to solve problems in various strands This was determined by the average 44 overall
probability for success achieved for those items related to Factor 1 They can also be described as
having a weak ability to apply thinking skills in order to solve problems surrounding the
Measurement topic of ldquoAreardquo and weak ability to do the same in various strands This was
determined by the 28 probability for success achieved for those items related to Factor 2 and
29 probability for success achieved for those related to Factor 3 Furthermore their overall
performances in the knowledge dimension can be described as stronger in comparison to their
performances in the thinking dimensions
Specifically concerning their ability to apply mathematical knowledge in various strands
(Factor 1) it was determined that these learners can be described as performing slightly stronger in
35
Geometry and Spatial Sense (item-group probability score = 50) and considerably weaker in Data
Management and Probability (item-group probability score = 19) in relation to their performances
in the other strands Specifically regarding their ability to apply thinking skills in order to solve
problems (Factor 3) their performance can be described as considerably stronger in Number Sense
and Numeration (item-group probability score = 44) and weaker in Data Management and
Probability (item-group probability score = 22) and Patterning and Algebra (item-group
probability score = 20) with the latter being the weakest in relation to their performances in the
other strands
In sum the results of the LCA revealed that three classes could be used to best describe the
performances of Grade 6 learners in the three dimensions as established during the EFA and their
related strands Class 1 was described as the highest performing and second largest group The
learners in the class were described as performing especially strong in Factor 1 (namely their
ability to apply mathematical knowledge to solve problems in various strands) strong in Factor 2
(namely their ability to apply thinking skills to solve problems specifically related to the
Measurement topic of ldquoAreardquo) and in Factor 3 (namely their ability to apply thinking skills in order
to solve problems in various strands) Class 2 was described as the intermediate performing and
largest group and performing strong for Factor 1 weak for Factor 2 and moderately weak for
Factor 3 Lastly Class 3 was described as the lowest performing and smallest group and
performing moderately weak for Factor 1 and weak for both Factor 2 and 3 For all classes overall
factor performances were described as weaker in the thinking dimensions namely Factor 2 and 3
than in the knowledge dimension namely Factor 1 A greater discrepancy between these
mathematical knowledges and thinking skills dimensions appears to exist for those in Class 2 than
for those in Class 1 and 3
Lastly in terms of describing the performances of each class in the strands related to each
factor for Factor 1 and 3 results revealed clear similarities between all classes in terms of those in
which performances were described as weaker For all classes regarding Factor 1 their ability to
36
apply mathematical knowledge within the Data Management and Probability strand was described
as the weakest in relation to the other strands For all classes regarding Factor 3 their ability to
apply thinking skills in the Patterning and Algebra and Data Management and Probability strand
was described as weakest in relation to their performances in the other strands
43 Predicting Mathematics Profiles by Language and Length of Residence Background
To avoid treating learners as homogenous groups based on their language background they
were allocated to one of six groups according to their ESL designation and length of residency in
Canada The six groups represented the predictor variable (independent variable) whereas the three
classes or performance profiles were treated as the predicted or dependent variable Class 1
namely the highest performing profile group was used as the reference category
Results of this analysis indicated that the final model did not significantly predict class and
performance profile membership with a -2 Log likelihood of 7740 and a Chi-square value of 957
(10 N = 5000) p = 48 The upper portion of Table 10 presents the regression coefficients the
Wald test adjusted odds ratio [Exp(B)] and the 95 confidence intervals (CI) for odds ratios for
the predictor contrasting Class 2 to Class 1 The lower portion of the table presents the regression
coefficients the Wald test adjusted odds ratio [Exp(B)] and the 95 confidence intervals (CI) for
odds ratios for the predictor contrasting Class 3 to Class 1
Results therefore revealed that ESL status and residence in Canada did not significantly
predict class or profile membership regardless of group allocation In other words regardless of
group allocation learners were found to be equally likely to belong to either Class 1 (highest
performing group) Class 2 (intermediate performing group) or Class 3 (lowest performing group)
and therefore perform according to the related profile as indicated earlier in Figure 2
37
Table 10
Parameter Estimates for Six Groups on 3 Classes
Model B SE - B Wald df Exp(B) 95 CI EXP (B)
Class 2
Intercept 43 23 351 1
Group 1 -07 23 09 1 93 60 ndash 147
Group 2 06 26 06 1 107 64 ndash 178
Group 3 -60 35 296 1 55 277 ndash 109
Group 4 01 31 00 1 101 55 ndash 183
Group 5 -08 28 09 1 92 54 ndash 158
Class 3
Intercept -13 26 27 1
Group 1 -23 26 74 1 80 48 ndash 133
Group 2 -20 31 42 1 82 47 ndash 149
Group 3 -36 39 84 1 70 33 ndash 150
Group 4 -35 37 92 1 70 34 ndash 144
Group 5 -53 33 255 1 59 31 ndash 113
Notes p lt 001 N = 5000 Class 1 is the reference category Group 1 = Non-ESL CA Born (n = 4185) Group 2 =
ESL CA Born (n = 308) Group 3 = Non-ESL Non-CA born but living in country less than 5 years (n = 76) Group 4
= ESL Non-CA born but living in country less than 5 years (n = 123) Group 5 = Non-ESL Non-CA born but living in
country 5 years or more (n = 199) Group 6 = ESL Non-CA born but living in country 5 years or more (n = 109)
38
Chapter 5 Discussion
The purpose of this study was to move beyond the total scores of a largescale assessment
in order to gain better insight into the mathematical performances of Ontariorsquos Grade 6 learners
In doing so it aimed to provide evidence of learner strengths and weaknesses in different aspects
of mathematics education on which to base remedial decisions for the improvement thereof
Using the responses of a random sample of 5000 Grade 6 learners to 28 multiple choice
mathematics items on the 20132014 EQAO Junior Division assessment an Exploratory Factor
Analysis (EFA) was firstly performed in order to investigate the dimensionality characteristics
of the assessment This was followed by a Latent Class Analysis (LCA) to determine learner
strengths and weaknesses related to the established mathematical dimensions and their related
strands Lastly a multinomial logistic regression analysis was performed in order to examine the
extent to which mathematics performance profiles were predicted by student background factors
such as language and length of residency in Canada This chapter discusses the findings of these
analyses study limitations and lastly recommendations for future research and education
51 What Characterizes the Dimensionality of the EQAO Mathematics Achievement Test Administered to Grade 6 Students in Ontario Public Schools
The multiple choice mathematics items on the EQAO assessment were characterized as
measuring the ability of learners in three interrelated yet separate mathematical dimensions
These being the ability of learners to apply mathematical knowledge related to procedural
knowledge and conceptual understanding to solve problems in various strands (Factor 1) the
ability to apply process or thinking skills such as problem solving or reasoning skills to solve
problems in ldquoAreardquo (Factor 2) and lastly the ability to apply process or thinking skills to solve
39
problems in various mathematical strands The three factors produced achieved on average
moderate reliability scores
These findings regarding the characteristics of the dimensions were considered valuable
as they allowed for the comparison of learner abilities in two essential elements of mathematical
proficiency as aligned with the Principles and Standards for School Mathematics (NCTM
2000) and as a result also with the Ontario mathematics curriculum which shares the same
foundations Only once this happens namely learner ability measured directly in relation with
mathematical curriculum expectations can we begin an effective process of remediation
(Kilpatrick et al 2001) These elements were that of mathematical knowledge consisting of
procedural and conceptual knowledge as measured by Factor 1 of this study and process or
thinking skills such as problem solving and reasoning as measured by Factor 2 and 3 Factor 2
and 3 were determined to differ based solely on the content of the items included in the
assessment This finding highlights concerns regarding the fair representation of all curriculum
expectations on the assessment and thus warrants further investigation
The fact that the ability to apply mathematical knowledge and the ability to apply
thinking skills in order to solve mathematical problems were found to be sufficiently unique
dimensions to warrant their use using the multiple choice items on this largescale mathematics
assessment adds further value to the findings of this study These findings are valuable in that
they attest to the future potential for assessment organizations to report learner performances
beyond that of total scores as demanded by those in the educational field However since the
factors achieved only moderate reliability scores we are reminded of the need for these tests to
be designed upon foundations aligned with those of the curriculum expectations they are
employed to assess from the start in order for them to meet better test properties (Chudowsky amp
Pellegrino 2003 Rogers 2014)
40
52 In which Mathematical Dimensions and Related Strands do Students Demonstrate Strengths and Weaknesses in their Mathematical Achievement
Three classes were determined to best describe the performances of all Grade 6 learners
in the established dimensions and their related strands Class 1 was described as the highest
performing and second largest group consisting of 321 of the learners Class 2 was described
as the intermediate performing and largest group consisting of 452 of the learners and lastly
Class 3 was described as the lowest performing and smallest group consisting of only 227 of
the learners from the sample
The results of this analysis further revealed that all three classes performed weaker in
their ability to apply thinking skills in order to solve problems either specifically surrounding
the topic of Area or in various strands than in their ability to apply mathematical knowledge in
order to do the same The performances of those in Class 1 were described as especially strong
in the mathematical knowledge dimension (Factor 1) and strong in the thinking dimensions
(Factor 2 and 3) Class 2 was described as strong in the mathematical knowledge dimension but
weak in the thinking skills dimensions and lastly Class 3 was described as moderately weak in
the mathematical knowledge and thinking skills dimensions The discrepancy between
performances in the two subdomains namely mathematical knowledge and thinking skills thus
appeared to be largest for those in Class 2 the intermediate performing and largest group
The findings concerning the overall performances of students in the two subdomains of
mathematical knowledge and thinking skills aligns with those concerning the performances of
US students as described by Kilpatrick et al (2001) They highlight that research evidence over
the past 30 years has consistently indicated that although US students do not fare badly in
applying their knowledge to solve basic mathematical problems they tend to have a limited
41
understanding of mathematical concepts and are noticeably deficient in their ability to apply
mathematical thinking skills to solve even simple problems
It may however be argued that this finding namely a weaker performance in thinking
skills than mathematical knowledge is to be expected given the fact that applying thinking skills
in order to solve problems is a more challenging task than simply applying what you know
(Schoenfeld 2007) However studies have also found that a strong mathematical knowledge
base leads to a better ability to apply thinking skills to solve deeper problems (Stokke 2015)
Thus given the inter-relatedness of these two dimensions together with the large discrepancy
between them for those in Class 2 (strong mathematical knowledge but weak thinking skills)
these findings demonstrate a weakness in the majority of Ontariorsquos Grade 6 learners to apply
thinking skills to solve deeper mathematical problems This finding holds important
recommendations for future research and mathematics educational practices as will be discussed
in the section below
Upon further investigation of learner performances in each of the strands as they relate to
the dimensions it was determined that all three classes performed much weaker in their ability to
apply mathematical knowledge in the Data Management and Probability strand than in the other
strands This strand was also determined to be the weakest in the thinking skills dimension
along with Patterning and Algebra This finding contradicts those of Tatsuoka Corter and
Tatsuoka (2004) in which it was found that students in the US appeared to perform poorest in
Geometry and Spatial Sense Given the inter-relatedness of mathematical knowledge and ability
to apply thinking skills as previously highlighted by Stokke (2015) this finding concerning Data
Management and Probability attests to a knowledge base weakness for Grade 6 Ontario learners
specifically surrounding this strand As for the results surrounding Patterning and Algebra they
appear to provide further support for the weak ability of the learners to apply thinking skills
42
given their relatively strong mathematical knowledge surrounding this strand These findings
also hold valuable recommendations for educational practices in Ontario which will be further
discussed below
53 To What Extent Are Mathematics Performance Profiles Predicted by Student Background such as Language and Residence Status
Findings from this analysis revealed that language background and length of residence in
Canada did not significantly predict performance profile membership Therefore regardless of
group allocation based on these variables all learners were equally likely to achieve a Class 1
(high performing) Class 2 (intermediate performing) or Class 3 (low performing) profile as
described in this study
These findings contradict the Jang et al (2013) study on the performance of learners in
reading In that study it was found that different reading patterns were achieved based on ELL
and length of residence status It was further determined that non-English speakers outperformed
monolinguals in reading achievement after living in the country for five years or more These
findings therefore do not appear to hold true for the performances of learners in mathematics
based on these variables as all learner groups were equally likely to achieve one of the three
performance profiles produced in this study However it needs to be acknowledged that this
study focused on ESL designation as opposed to ELL status which may have contributed to the
differences in findings Nonetheless these findings are considered valuable in that they provide
reassurance of the fact that the test results were not confounded by differences in language
proficiency and that the EQAO test was not biased towards first language speakers
The findings of this study further contradict those that found that English first language
speakers outperformed those for whom English was not their first language (Abedi amp Lord
43
2001 Howie 2003) Therefore they help shed perceptions of differences in mathematical
performances based solely on the aspect of language background This finding holds important
implications for mathematics education for these population groups as well as future research
54 Study Limitations
The following study limitations have been recognized and should thus be taken into
consideration when reviewing these findings Firstly this study analyzed the mathematical
performances of learners based on the results of a standardized test only We are therefore
reminded of the fact that many factors influence test scores over and above that which is random
These include the testing situation tester characteristics and test-taker characteristics (Kaplan amp
Saccuzzo 2009) For this reason it is important that learner performances in other assessment
environments also be considered such as classroom-based assessment activities
Secondly the findings of this study were based solely on learner performances on the
multiple choice items According to Schoenfeld (1992) most multiple choice items are machine
graded which limits their ability to measure learner conceptual understanding and problem
solving abilities to the degree that most people would like For this reason it is important that
future studies consider including the open response questions included on the assessment for a
better reflection of learner conceptual understanding and problem solving
Thirdly this study included performances of learners based solely on a single EQAO
administration and its data Although EQAO proclaims to instill rigorous test equating
procedures to ensure that test difficulty and discrimination properties are not compromised
across years (Rogers 2013) this does not guarantee that learner performances can be generalized
to all Grade 6 learners Furthermore this study focused on only those who took the English
44
version of the test therefore generalizing these findings to those who took the French version
should be done cautiously
Lastly the small ESL population size in comparison to the non-ESL population limits the
findings of this group and may therefore not accurately reflect their performances Furthermore
this study used ESL designation as opposed to ELL status ESL designation is a program in
which learners are enrolled or unenrolled throughout the year Therefore these findings may not
reflect that of the entire ELL population
55 Recommendations and Future Research
In light of recent poor mathematical performances of Ontariorsquos elementary learners the
education minister announced its ldquoRenewed Math Strategyrdquo designed for the purposes of
combatting further decline (Brown 2016) In this strategy requirements for improving the
performances of learners in mathematics were announced such as all learners in Grade 1-8 to
receive at least 60 minutes of mathematics instruction per day further support for weaker
schools in terms of more professional development for teachers as well as more support for
learners and parents surrounding this discipline As this study made apparent in the beginning
such strategies risk being only blanketed approaches that do not really target the heart of the
problem if not accompanied by further insight into the results upon which they are based
This study was conducted in an attempt to gain such insight and found that although
Ontario Grade 6 learners display strong mathematical knowledge the majority are particularly
weak in applying thinking skills such as reasoning and problem solving to solve deeper
mathematical problems It was further determined that learners are particularly weakest in the
Data Management and Probability strand for both mathematical knowledge and thinking skills
dimensions as well as the Patterning and Algebra strand in the latter dimension It was lastly
45
determined that background variables of language and length of residence did not significantly
predict performance and profile achievement and that both ESL and non-ESL learners were
equally likely to belong to high intermediate and low performing groups regardless of length of
residence in Canada Based on these findings the following recommendations surrounding
future research endeavors and educational practices specifically in conjunction with mathematics
education in Ontario will be discussed below
The Ontario Curriculum Grades 1-8 Mathematics 2005 document indicates that the
ultimate goal for mathematics education is to develop learner proficiency beyond that of content
knowledge and therefore also calls for the development of a deeper understanding of the
discipline along with essential thinking skills In order to accomplish these goals the
curriculum highlights that instructional practices need to deviate from a sole focus on direct
teaching methods to incorporate methods of teaching and learning through problem solving in
other words problem-based learning approaches Stokke (2015) blames this greater emphasis of
teaching mathematics using problem-based teaching strategies for the recent decline of Ontario
learnersrsquo mathematical performances She argues that the lack of direct instruction has robbed
learners of a sound knowledge base from which to draw upon when attempting to solve deeper
mathematical problems hence the weakness in this area
However the findings from this study provides evidence that contradicts this argument
as results point to the fact that the majority of Grade 6 learners in Ontario actually do possess
strong mathematical knowledge This finding may therefore perhaps be an indication of the
fact that a large portion of Ontario teachers still rely predominantly on teaching mathematics
using traditional direct teaching methods as opposed to those better suited to meet current
curriculum goals and expectations This finding therefore warrants further investigation into
current teaching trends and holds valuable insight as to where to direct efforts for remediation
46
In order to meet reformed curriculum goals and expectations teaching practices need to
change for which the teacher is the key actor (Ross amp McDougall 2006) Therefore this study
supports those calling for increased efforts directed at teachers and the need to reshape their roles
and perceptions of what it means to ldquoteachrdquo mathematics in a reformed curriculum classroom
For instance Milgram (2007) urges for strategies directed at ensuring that teachers truly
understand what it means to teach using problem-based teaching methods to develop thinking
skills He further illustrates that teaching thinking skills such as problem solving is a
challenging task as it is in itself complex involving both verbal and nonverbal mental processes
For this reason it is essential that learners solve problems for which the answer is not apparent
and requires a novel idea if we wish to effectively develop these skills (Milgram 2007) Such a
teaching and learning process requires that teachers step back allowing learners to grapple with
the task before them as well as interact with each other stepping in only when necessary to
guide the process (Milgram 2007)
Changing the role of the teacher from the traditional sole knowledge bearer and
transferor to one in which heshe shares the responsibility of learning with students is however
only one of 10 dimensions that requires attention when urging teachers to adopt instructional
practices better suited to accomplish curriculum goals and expectations (Ross amp McDougall
2007) Ross and McDougall (2006) further illustrate that in order to ensure that teaching for
deeper understanding as aligned with current reformed mathematics education takes place
teachers need to consider change in all 10 of these dimensions These dimensions as cited in
Ross and McDougall (2006) are summarized as follows 1) the need for program scope 2)
access to all forms of mathematics by students 3) raising self-confidence of students by teachers
4) complex and open-ended student tasks 5) instruction that focuses on constructing
mathematical ideas through self-discovery 6) change in the role of teachers to that of co-learner
47
and co-knowledge creator 7) solving of mathematical problems with the aid of manipulatives 8)
classroom organization in a manner that promotes sharing and interaction for solutions 9)
authentic assessment and lastly 10) a conception of mathematics as a dynamic subject by
teachers
Specifically regarding the first dimension namely the need for program scope Ross and
McDougall (2006) describe it as urging teachers to teach multiple mathematical strands with
increased attention on those less commonly taught such as the Data Management and
Probability and Patterning and Algebra strands The results of this analysis indicated that
learners were weakest in precisely these two strands therefore perhaps providing evidence in
support of the fact that these strands are given less attention by Ontario teachers when teaching
the mathematics curriculum expectations This finding therefore provides added support for the
need to further promote the implementation of these 10 dimensions of teaching for deeper
understanding as indicated above so as to ensure that teachers view all curriculum strands as
equally important and deserving of attention
In calling for these increased efforts directed at changing the way in which mathematics
teaching and learning occurs in classrooms it is important to acknowledge the fact that this is
easier said than done Teaching in a manner that supports the development of a deeper
understanding for mathematics and promotes thinking skills is a lengthy process that takes time
(Milgram 2007) A commodity in short supply for the teacher already feeling pressured to
cover all curriculum expectations before mandatory accountability assessments take place
(Milgram 2007) Therefore not only does this study call for increased efforts directed at
changing teacher perceptions and instructional practices in the classroom but also for policy
makers to consider practical constraints placed on teachers that may restrict the implementation
thereof
48
Lastly the need to predict mathematical performances of learners based on background
variables is made apparent by Hinton (2014) who found that early success in mathematics
predicts future success Therefore for the sake of early intervention especially for the lowest
performing group identified in this study it is urged that further research studies be directed at
determining background variables that better predict performances However it is further urged
that such studies focus on class or profile membership as used in this study as opposed to overall
mathematics performances used in the past In this way not only will we be able to better
identify low intermediate and high performers but also their related strengths and weaknesses
upon which specific remedial efforts can be targeted As for the equal likelihood of ESL and
non-ESL learners to achieve either low intermediate or high performing profiles this study
recommends future studies targeted at shedding perceptions of non-English speakers
underperforming in relation to first language speakers that have perhaps been shaped by previous
studies Without doing so we risk assuming the need for remediation directed at one group
whilst ignoring the needs of others
49
References
Abedi J amp Lord C (2001) The language factor in mathematics tests Applied Measurement
in Education 14(3) doi 101207S15324818AME1403_2
Brown J (2016) Elementary student to get hour of math every day under new Ontario plan
Retrieved July 23 2016 from
httpswwwthestarcomyourtorontoeducation20160404elementary-students-to-get-
hour-of-math-every-day-under-new-ontario-planhtml
Chudowsky N amp Pellegrino JW (2003) Large-scale assessments that support learning what
will it take Theory into Practice 42(1) 75+ Retrieved from
httpgogalegroupcommyaccesslibraryutorontocapsidop=AONEampu=utoronto_mai
nampid=GALE|A99909373ampv=21ampit=rampsid=summonampuserGroup=utoronto_mainampauth
Count=1
Collins L K amp Lanza S T (2010) Latent class and latent transitional analysis with
applications in the social behavioral and health sciences Hoboken NJ Wiley amp Sons
DePascale C (2014) The ideal role of large-scale testing in a comprehensive assessment
system Journal of Applied Testing Technology 5(1) 1-11 Retrieved from
httpwwwjattjournalcomindexphpatparticleview48343
Education Quality and Accountability Office (2016) About the agency Retrieved May 26
2016 from EQAO
httpwwweqaocomenabout_eqaoabout_the_agencyPagesabout-the-agencyaspx
Education Quality and Accountability Office (2014) EQAOrsquos provincial elementary school
report 2014 Retrieved September 26 2015 from EQAO
httpwwweqaocomenassessmentsresultsPagesprovincial-report-elementary-
2014aspx
Figlio D amp Loeb S (2011) School accountability In EA Hanushek S Machin and L
Woessmann (Eds) Handbooks in Economic The Netherlands North-Holland pp 383-
421
Foster D Noyce P amp Spiegel S (2007) When assessment guides instruction Silicon
Valleyrsquos mathematics assessment collaboration In AH Schoenfeld (Ed) Assessing
mathematical proficiency (pp 137-154) Cambridge Cambridge University Press
Friesen S (2005) Math Teaching it better Education Canada 46(1) 6-10
Furr R M (2011) Scale construction and psychometrics for social and personality psychology
Los Angeles SAGE
Fillmore L W (2007) English learners and mathematics learning language issues to consider
In AH Schoenfeld (Eds) Assessing mathematical proficiency (pp 333-344) Cambridge
Cambridge University Press
50
Haertel E H amp Herman J l (2005) A historical perspective on validity arguments for
accountability testing Yearbook of the National Society for the Study of
Education 104(2) 1-34 doi101111j1744-7984200500023x
Hinton A (2014) Tracking student achievement in mathematics over time in English language
schools Retrieved from
httpwwweqaocomenresearch_dataResearch_ReportsPagesstudent-
achievementaspx
Howie S (2005) System-level evaluation Language and other background factors affecting
mathematics achievement Prospects 35(2) 175-186 doi101007s11125-005-1820-
8
Huff K amp Goodman DP (2007) The demand for cognitive diagnostic assessment In JP
Leighton amp MJ Gierl (Eds) Cognitive Diagnostic Assessment for Education (19-60)
New York Cambridge University Press
IBM Corp Released 2013 IBM SPSS Statistics for Windows Version 230 Armonk NY IBM
Corp
Jang E E amp Ryan K (2003) Bridging gaps among curriculum teaching and learning and
assessment Book review Kifer E (2001) Large-scale assessment Dimensions
dilemmas and policy Journal of Curriculum Studies 35(4) 499-512
Jang EE Dunlop M Wagner M Kim Y amp Gu Z (2013) Elementary school ELLsrsquo
reading skill profiles using cognitive diagnosis modelling Roles of length of residence
and home language environment Language Learning 63(3) 400-436 doi
101111lang12016
Kaplan RM amp Saccuzzo DP (2009) Psychological Testing Principles Applications and
Issues Belmont Wadsworth Cengage Learning
Kilpatrick J Swafford J Findell B amp National Research Council (US) (2001) Adding it
up Helping children learn mathematics Washington DC National Academy Press
Klinger D A amp Rogers W T (2011) Teachers perceptions of large-scale assessment
programs within low-stakes accountability frameworks International Journal of
Testing 11(2) 122-143 doi101080153050582011552748
La Rose L (2014) PISA results Canada students high level achievers but math and science
scores dip The Huffington Post Retrieved October 5 2015 from
httpwwwhuffingtonpostca20131203pisa-results-canada-
studentrankings_n_4376190html
Meyers L S Gamst G amp Guarino A J (2006) Applied multivariate research Design and
interpretation Los Angeles Sage
Milgram R J (2007) What is mathematical proficiency In AH Schoenfeld (Eds) Assessing
mathematical proficiency (pp 31-58) Cambridge Cambridge University Press
51
Moschkovich J (2007) Beyond words to mathematical content Assessing English learners in
the mathematical classrooms In AH Schoenfeld (Eds) Assessing mathematical
proficiency (345-352) Cambridge Cambridge University Press
Mutheacuten LK amp Mutheacuten BO (1998-2010) Mplus Userrsquos Guide (6th Ed)
Los Angeles CA Mutheacuten amp Mutheacuten
Nagy P (2000) The three roles of assessment Gatekeeping accountability and instructional
diagnosis Canadian Journal of Education 25(2) Retrieved from
httpmyaccesslibraryutorontocaloginurl=httpsearchproquestcomdocview215374
855accountid=14771
National Council of Teachers of Mathematics (2000) Principles and standards for school
mathematics Reston VA National Council of Teachers of Mathematics
Nichols P D (1994) A framework for developing cognitively diagnostic assessments Review
of Educational Research 64(4) 575 Retrieved from
httpmyaccesslibraryutorontocaloginurl=httpsearchproquestcomdocview214116
755accountid=14771
Nylund K L Asparouhov T amp Mutheacuten B O (2007) Deciding on the number of classes in
latent class analysis and growth mixture modeling A monte carlo simulation
study Structural Equation Modeling A Multidisciplinary Journal 14(4) 535-569
doi10108010705510701575396
OECD (2014) PISA 2012 Results What Students Know and Can Do Student Performance in
Mathematics Reading and Science doi httpdxdoiorg1017879789264208780-en
Ontario (2005) The Ontario curriculum grades 1-8 Toronto Ontario Ministry of Education
Pastor D A Barron K E Miller B J amp Davis S L (2007) A latent profile analysis of
college students achievement goal orientation Contemporary Educational
Psychology 32(1) 8-47 doi101016jcedpsych200610003
Rogers WT (2013) What is the quality of EQAO assessments Excellent Retrieved
September 24 2015 from
httpwwweqaocomenresearch_dataResearch_ReportsPagesbest-assessment-
practicesaspx
Rogers WT (2014) Improving the utility of large-scale assessments in Canada Canadian
Journal of Education 37(3) Retrieved from httpcje-rcecaindexphpcje-
rcearticleview1732
Ross JA amp McDougall D E (2006) Mathematics In K Leithwood P McAdrie N Bascia
amp A Rodrigue A (Eds) Teaching for deep understanding Towards the Ontario
curriculum that we need (pp 33-39) Thousand Oaks CA Corwin Publishing
Schoenfeld A H (2007) Issues and tensions in the assessment of mathematical proficiency In
52
AH Schoenfeld (Ed) Assessing mathematical proficiency (pp3-15) Cambridge
Cambridge University Press
Schoenfeld A H (2007) What is mathematical proficiency and how can it be assessed In
AH Schoenfeld (Ed) Assessing mathematical proficiency (pp 59-73) Cambridge
Cambridge University Press
Schoenfeld A H (1992) Learning to think mathematically Problem solving metacognition
and sense making in mathematics In D Gouws (Ed) Handbook for research on
mathematics teaching and learning (pp 334-370) New York Macmillan
Schumacker R E amp Lomax R G (2004) A beginnerrsquos guide to structural equation modeling
(2nd ed) Mahwah NJ Lawrence Erlbaum Associates
Shapka J Domene J amp Keating D (2006) Trajectories of career aspirations through
adolescence and young adulthood Early math achievement as a critical filter
Educational Research and Evaluation 12(4) 347-358 Retrieved from
httpdxdoiorg10108013803610600765752
Statistics Canada (2016) Immigration and Ethnocultural Diversity in Canada Retrieved May
31 2016 from httpswww12statcangccanhs-enm2011as-sa99-010-x99-010-
x2011001-engcfm
Stein MK Remillard J amp Smith MS (2007) How curriculum influences student learning
In FK Lester amp National Council of Teachers of Mathematics (Eds) Second handbook
of research on mathematics teaching and learning a project of the National Council of
Teachers of Mathematics (pp 1099) Charlotte NC Information Age Pub
Stokke A (2015) What to do about Canadarsquos declining math scores Retrieved from
httpswwwcdhoweorgpdfcommentary_427pdf
Tatsuoka K Corter J amp Tatsuoka C (2004) Patterns of Diagnosed Mathematical Content
and Process Skills in TIMSS-R across a Sample of 20 Countries American Educational
Research Journal41(4) 901-926 Retrieved from
httpwwwjstororgmyaccesslibraryutorontocastable3699467
Uebersax JS (2015) Introduction to the Tetrachoric and Polychoric Correlation Coefficients
Retrieved July 20 2015 from httpjohn-uebersaxcomstattetrahtm
Wilson L D (2007) High-stakes testing In FK Lester and National Council of Teachers of
Mathematics (Eds) Second handbook of research on mathematics teaching and learning
a project of the National Council of Teachers of Mathematics (pp 1053 -1098)
Charlotte NC Information Age Pub

15
specifically administered to all Grade 6 learners attending schools within the province of Ontario
during the months of May and June and under highly standardized conditions (EQAO 2016) The
assessment measures reading writing and mathematical skills in each of the corresponding
sections The mathematics section specifically consists of 36 items of which 28 are multiple choice
items and 8 are constructed-response format questions This study included only the 28 multiple
choice items
While the EQAO does not claim to measure the Knowledge and Skills categories as laid out
in the Ontario Curriculum Grades 1-8 Mathematics 2005 document (Rogers 2013) it still
references each of the mathematics items to one of three of the categories namely that of
Knowledge and Understanding Thinking and Application The category of Communication is not
represented by any of the items as according to Rogers (2013) this skill is not feasible to assess in
a paper-and-pencil based test For items to be referenced to the Knowledge and Understanding
category they need to be recognized as requiring students to demonstrate subject specific content
and comprehend its meaning Those referenced to the Application category need to be recognized
as requiring students to select an appropriate mathematical tool and apply the appropriate
information Lastly those referenced to the Thinking category need to be seen as requiring of
students to select and sequence a variety of tools and think critically in order to solve problems
(Rogers 2013) Items are scrutinized by teachers and other content experts for the process of
allocating items to the most appropriate category Items are further referenced to the five content
areas or strands of the curriculum document according to their content topic namely Number Sense
and Numeration Measurement Geometry and Spatial Sense Patterning and Algebra and Data
Management and Probability
Table 2 shows the representation of each of the Knowledge and Skills categories and the
strands to which the 28 multiple choice items were referenced by the EQAO as well as the item
difficulties (p-values) and discrimination indices (pt-biserial correlations) for each of these items
According to Kaplan and Saccuzzo (2007) item difficulty values should range from 30 to 70 to
16
maximize information about the differences among individuals Furthermore item discriminability
values should not be negative or below 20 to be considered adequate Based on these
recommendations all 28 items were considered suitable to be included in the analyses of this study
Table 2
Knowledge and Skills Categories Strands and Descriptive Statistics of 28 Mathematics Items
Item Know amp Skill Strand p-value pt-biserial
1 K and U Patterning amp Algebra 86 39
14 K and U Patterning amp Algebra 74 43
3 K and U Number Sense amp Numeration 76 37
15 K and U Number Sense amp Numeration 86 35
9 K and U Data Management amp Probability 48 33
19 K and U Measurement 50 27
25 K and U Measurement 76 40
22 K and U Geometry amp Spatial Sense 87 34
73 36
11 App Patterning amp Algebra 81 43
24 App Patterning amp Algebra 70 37
26 App Patterning amp Algebra 40 30
5 App Number Sense amp Numeration 56 38
7 App Number Sense amp Numeration 82 30
10 App Data Management amp Probability 55 47
18 App Data Management amp Probability 78 47
23 App Data Management amp Probability 71 42
2 App Measurement 59 31
8 App Measurement 58 28
20 App Measurement 54 47
6 App Geometry amp Spatial Sense 68 38
64 38
17 Think Patterning amp Algebra 52 36
21 Think Number Sense amp Numeration 57 22
28 Think Number Sense amp Numeration 69 33
4 Think Data Management amp Probability 46 35
13 Think Measurement 54 39
27 Think Measurement 41 46
12 Think Geometry amp Spatial Sense 42 35
16 Think Geometry amp Spatial Sense 54 34
52 35
Notes K and U = Knowledge amp Understanding App = Application Think = Thinking p-value and pt-biserial means
for each Knowledge amp Skill category represented in bold
17
No items had p-values below 30 however 10 items had difficulty values above 70
indicating that they were relatively easy for this sample Since none of the p-values were above
90 they were considered to still possess sufficient variability to be included in the analyses
Furthermore no items had values below the recommended 20 or negative pt-biserial values Table
2 further highlights the item difficulty and discrimination means for each of the three categories
From these values it can be concluded that the items referenced to the Knowledge and
Understanding category were relatively more easy for this sample while those items referenced to
the Thinking category more difficult and those referenced to the Application category moderately
difficult Lastly it is highlighted that a greater number of items represented the Application
category (12 items) than the Knowledge and Understanding and Thinking category which had an
equal number of eight items
33 Data Analysis
The data analyses involved three phases each of which addressed one of the three questions
asked in this study The first phase used Exploratory Factor Analysis (EFA) approaches to
examine the first research question ldquoWhat characterizes the dimensionality of the EQAO
mathematics achievement test administered to Grade 6 students in Ontario public schoolsrdquo
Latent Class Analysis (LCA) approaches were used in the second phase in order to answer question
two ldquoIn which mathematical dimensions and related strands do students demonstrate strengths and
weaknesses in their mathematical achievementrdquo A multinomial logistic regression analysis was
performed to examine research question three ldquoTo what extent are mathematics performance
profiles predicted by student background such as language and length of residence statusrdquo
331 Phase 1 Establishing the Dimensionality of the Assessment
An Exploratory Factor Analysis (EFA) was conducted in order to determine the
dimensionality of the EQAO Grade 6 mathematics test based on 5000 studentsrsquo responses to 28
multiple choice items Although exploratory in nature the EFA was used to examine the extent
18
to which the test dimensionality can be accounted for by knowledge and skills and further by the
strand specified by the EQAO
EFA is a statistical procedure that simplifies the process of visually inspecting a range of
correlations in order to examine the dimensionality of measures (Furr 2011) The 28 multiple
choice items were firstly recoded as binary data thus creating dichotomous categories (0 =
incorrect responses and 1 = correct responses) In order to perform an EFA with this type of
data a more sophisticated statistical software package is required The reason for this being that
standard software such as IBMrsquos SPSS (version 230) creates correlation matrices suitable only
for continuous data that assume a normal distribution (Uebersax 2015) Therefore MPLUS
version 612 (Mutheacuten amp Mutheacuten 1998-2012) was used for the analysis so that a tetrachoric
correlation matrix could be generated to suite the binary data used in this study
When conducting an EFA in Mplus a correlation matrix eigenvalues and model fitting
statistics such as the chi-square test Root Mean Square Error of Approximation (RMSEA) and
Root Mean Square Residual (RMSR) are produced in order to assist with the process of
determining the solution that best fits the data A good fitting model will be represented by a
non-significant chi-square p-value as well as a RMSEA value and RMSR value of below 05
(Schumacker amp Lomax 2004) However interpretability of the model should also be taken into
consideration when deciding on the best solution (Meyers Gamst amp Guarino 2013) The
weighted least-squares with mean (wlsm) estimation method as recommended by Mutheacuten and
Mutheacuten (1998-2012) for binary data and the oblique rotation method (Promax) was used for this
analysis based on the assumption that factors are likely to be correlated with each other
Four steps were implemented during this phase The first step entailed determining the
ideal number of factors to be extracted to best describe the data This entailed a combined
evaluation of the correlation matrix eigenvalues scree plot and fit statistics as described above
The next step entailed an evaluation of the items and their loadings on each of the factors to
determine if any should be discarded in terms of low factor loadings or cross-loadings If any
19
items were deemed unacceptable these were removed and the analysis re-run and subsequently
re-evaluated This step was repeated until a final and appropriate factor solution model was
obtained Following this the reliability for each factor was established followed by an
investigation of the factor correlations in order to determine the uniqueness of each extracted
dimension Ideally items should correlate highly with each other within each extracted
factordimension however for each dimension to be considered unique between-factor
correlations should be low (Rogers 2014) According to Meyers et al (2013) between-factor
correlations should not exceed 80 to warrant the use of a separate dimension The last step
involved an investigation of the similarities between items in each factor in order to describe the
items that make up each This was done firstly in terms of the three Knowledge and Skills
categories and secondly the five strands to which the items were referenced as well as any
further content similarities
332 Phase 2 Identifying Mathematical Strengths and Weaknesses
In an attempt to identify in which mathematical subdomains or dimensions and related
strands learner performances were strongest and weakest as asked in question two of this study a
Latent Class Analysis (LCA) was performed using MPLUS version 612 (Mutheacuten amp Mutheacuten
1998-2012)
Specifically the goal of a mixture model is to reveal unobserved heterogeneous and
meaningful population groups within the larger homogenous population by identifying similarities
in their responses to measured variables (Nylund Asparouhov amp Mutheacuten 2007) These identified
latent populations or sub-groups are called classes Therefore using this analysis allowed for the
generation of distinct performance profiles for each sub-group or class identified as performing
similarly in the largescale assessment In this way more accurate class specific strengths and
weaknesses could be described as opposed to simply those of the overall Grade 6 population
20
For an LCA the outcome variables used are specifically categorical (Nylund et al 2007)
Therefore dichotomously scored response data from the random sample of 5000 students were
used for the LCA The LCA approach is exploratory in nature because the optimal number of
classes representing all latent classes cannot be determined apriori (Nylund et al 2007) Therefore
an investigation of relevant fit statistics generated by the LCA was firstly conducted According to
Pastor Barron Miller and Davis (2007) the fit statistics commonly used to determine the optimum
number of classes include the Bayesian Information Criterion (BIC) the sample-size adjusted BIC
and the Akaike Information Criterion (AIC) where lower values indicate a better fitting model An
Entropy statistic is also commonly used to determine model fit This statistic ranges from 0 to 1
where values closest to 1 indicate higher classification accuracy
Following the identification of the best fitting model the entire sample was profiled in
terms of distinct mathematics classes In order to reduce the number of points on these profiles
items were grouped according to the strand to which they were referenced by EQAO within each
identified factor This allowed for the identification of learner strengths and weaknesses not only
surrounding factors but also each strand within each factor
As part of the LCA mean item probability scores are calculated for each class This statistic
indicates the mean probability for each class to respond correctly to an item and therefore ranges
from 0 to 1 (Nylund et al 2007) Values closest to one therefore indicate a higher probability of
responding correctly to an item Using these values for each item average item-group probability
scores were calculated and these values were then used to describe class specific strengths and
weaknesses This was done firstly by describing overall item-group performances in comparison
to other classes and secondly by describing class performances in each specific factor overall and
lastly in terms of each strand within each factor
21
333 Phase 3 Predicting Class and Profile Membership
In order to answer question three concerning whether or not English as a second language
and length of residence in Canada significantly predicted the performance profile to which a
learner belongs a multinomial logistics regression analysis was conducted This phase was
completed using IBMrsquos SPSS (version 230)
A multinomial logistic regression is used when the dependent variable for the analysis
consists of more than two categorical levels (Meyers et al 2013) Besides the item probability
mean generated by the LCA a class probability mean for each learner in the sample is also
calculated as part of the analysis This class probability indicates the likelihood of a learner
belonging to each of the classes or performance profiles Based on the highest class probability
learners were allocated to one of the performance profiles as generated in phase 2 These classes
were coded 1 2 3 etc based on the number of classes determined to best describe the sample and
represented the dependent or predicted variable of the analysis
Table 3
Six Groups Created Based on English as Second Language and Time Lived in Canada
Group Language Time lived in Canada n
1 Non-ESL CA born 4185 837
2 ESL CA born 308 62
3 Non-ESL Non-CA born lt 5 years 76 15
4 ESL Non-CA born lt 5 years 123 25
5 Non-ESL Non-CA born ge 5 years 199 40
6 ESL Non-CA born ge 5 years 109 22
Notes N = 5000 ESL = English as a second language learner CA born = Born in Canada
An independent variable used for predicting the latent class membership included six
groups based on the following background variables English Second Language (ESL) status as
22
well as whether or not they were Canadian born non-Canadian born but at the time had resided in
the country for less than 5 years or non-Canadian born but at the time had resided in the country for
five years or more This was done in order to avoid clustering ELL learners as a homogenous group
and therefore better identify learners These six categorical data groups represented the predictor
or independent variable Table 3 indicates more precisely how each of the groups were created as
well as their sizes
23
Chapter 4 Results
The results of this study are discussed according to the three questions presented and phases
of data analyses as discussed in Chapter 3 Firstly the results produced from the Exploratory
Factor Analysis (EFA) described in phase one concerning question one are reported Secondly
those produced by the Latent Class Analysis (LCA) in phase two to answer question two and lastly
those produced from the multinomial logistics regression analysis conducted in phase three to
answer question three are presented in this chapter
41 Dimensionality Characteristics
As noted an EFA was conducted on the 28 multiple choice mathematics items in order to
determine the dimensionality of the largescale assessment to which they belonged The
eigenvalues of the tetrachoric correlation matrix (Table 4) produced by Mplus ranged between
862 and 41 the first three factors showed eigenvalues greater than 1 and accounted for 3953 of
the total variance
Table 4
Eigenvalues of Correlation Matrix indicating Total Variance Explained
Item Eigenvalue Item Eigenvalue Item Eigenvalue Item Eigenvalue
1 86 2 13 3 10 4 93
5 91 6 90 7 87 8 85
9 84 10 80 11 79 12 76
13 74 14 72 15 70 16 69
17 66 18 65 19 64 20 63
21 60 22 57 23 53 24 52
25 50 26 49 27 46 28 41
24
411 Determining the Best Fitting Factor Solution Model
The eigenvalues scree plot and fit statistics were used to determine the best number of
factors to describe this data set Based on the ldquonumber of eigenvalues greater and equal to one
rulerdquo as suggested by Meyers et al (2013) together with the scree plot and relevant fit statistics it
seemed adequate to extract three factors albeit accounting for less than 50 of the variance
Figure 1 Scree plot
Although three eigenvalues were produced greater and equal to one suggesting the
existence of three factors this was contradicted by the scree plot (Figure 1) which suggested the
existence of only two factors as it appeared to level off mostly at number three Subsequently a
comparison of the one to three factor solutions was conducted in terms of the relevant fit statistics
as described in Table 5
The significant chi-square p-values (lt 001) generated for the one and two factor solutions
suggested that the data differed significantly from the model matrix Although the chi-square p-
value has been criticized in the past for being overly sensitive to large sample sizes and therefore
0
05
1
15
2
25
3
35
4
45
5
55
6
65
7
75
8
85
9
1 2 3 4 5 6 7 8 9 10 11 12 13 14 15 16 17 18 19 20 21 22 23 24 25 26 27 28
Eig
envalu
es
Items
25
almost always producing a significant value (Meyers et al 2013) this was determined not to be the
case for this analysis as the p-value generated in the three factor model increased substantially
from the one to two factor model thus ensuring the reliability of this value
Table 5
EFA Model Fit Statistics of the 1 to 3 Factor Solutions on 28 Mathematics Items
FA model Chi-Square df p-value RMSEA RMSR
1 92476 350 lt 001 018 031
2 44012 323 lt001 009 021
3 34390 297 032 006 019
Note N = 5000
Therefore since the Chi-square p-value of 032 of the three factor model was not significant
(at the 001 probability level) as well as the fact that only two items represented the fourth factor in
the four factor solution model it was deemed a good fitting model The values of 006 and 019 of
the RMSEA and RMSR respectively were well below the 05 recommended value providing
further support for this three factor solution model
A further inspection of the factor loadings from the three-factor solution as well as of the
items on each factor resulted in the removal of four items (ie 12 18 23 and 24) Items 18 23 and
24 were discarded as a result of low factor loading scores below 30 Whereas a decision was made
to remove Item 12 as it was the only item referenced to the Thinking category that did not load on
the factors in the same way that the others did Table 6 presents the final factor loadings with the
Knowledge and Skills categories to which items were originally allocated by the EQAO that is
knowledge and understanding application and thinking
The Promax factor correlation matrix produced by Mplus (Table 7) revealed that all three
factors correlated positively and moderately to high with one another The strongest correlation
26
existed between Factor 1 and Factor 3 with a relatively high coefficient value of 747 while the
weakest correlation existed between Factor 1 and Factor 2 with a coefficient of 576
Table 6
Factor Loadings of the 23 Items used in the Final 3 Factor Solution Model
Item Knowledge amp Skill Factor 1 Factor 2 Factor 3
1 KU 64 -09 13
11 App 63 -04 12
14 KU 55 13 01
6 App 51 12 -04
15 KU 51 -05 14
10 App 47 23 05
7 App 45 -12 13
25 KU 38 09 17
3 KU 35 -01 24
9 KU 35 09 07
22 KU 31 07 23
5 APP 30 09 22
13 App 10 65 -05
27 Think -04 63 23
2 Think -07 50 12
20 App 14 -03 59
17 Think -04 04 55
26 App 13 01 33
8 App 11 -01 32
28 Think 15 03 32
16 Think 11 10 31
4 Think 14 12 30
21 Think -04 08 30
α = 725 α = 536 α = 565
Notes KU = Knowledge and Understanding App = Application Think = Thinking category
As stated earlier according to Meyers et al (2013) correlations should not exceed 80 to warrant
the use of separate factors These results are therefore considered to reveal the existence of three
27
unique factors that can be used to describe the multidimensionality of these mathematics multiple
choice items
Table 7
Promax Factor Correlations Between 3 Factors
Factors FA 1 FA 2
Factor 1
Factor 2 576
Factor 3 747 626
Note N = 5000
As indicated in Table 6 Factor 1 consisted of 12 items in total with factor loading scores
ranging between 30 and 64 and achieved a relatively high Cronbachrsquos alpha of 725 All seven
items referenced to the Knowledge and Understanding category used in the final model loaded
together on Factor 1 along with five items referenced to the Application category Factor 2
consisted of only three items with factor loading scores ranging between 50 and 63 and
achieved a moderate Cronbachrsquos alpha of 536 In Factor 2 two items referenced to the Thinking
category and one to the Application category loaded together to make up the total of three items
for this factor Lastly Factor 3 consisted of a total of eight items with factor loading scores
ranging between 30 and 59 and also achieved a moderate Cronbachrsquos alpha score of 565 The
remaining five items referenced to the Thinking category and three items referenced to the
Application category loaded together to make up the eight items that loaded together on Factor 3
In terms of the strands to which the items in Factor 1 were referenced for instance
Patterning and Algebra etc no clear similarities appeared to exist to tie all the items together
based on this However similarities seemed to exist in terms of the applied skill requested of
learners to solve the mathematical problems It appeared that all the items of this factor merely
requested of learners to apply their mathematical knowledge in terms of procedures and
conceptual understanding to answer the questions For instance Item 15 which is referenced to
28
the Knowledge and Understanding category asks the following ldquoWhat is the value of 0730 ndash
0156rdquo Whereas Item 5 which is referenced to the Application category asks that learners
solve problems involving the addition of decimal numbers (the exact question was not released)
Therefore it was determined that no clear difference existed between the applied skill requested
from these two items even though they were referenced to two different Knowledge and Skills
categories It was therefore concluded that Factor 1 could be described as measuring the
application of mathematical knowledge to solve problems in various strands
An inspection of the items that loaded together on Factor 2 revealed that two of the items
were referenced to the Thinking category while one of the items was referenced to the
Application category Furthermore all three items were similar in that that they covered the
ldquoMeasurementrdquo strand and more specifically that all three items requested of learners to solve
problems relating to ldquoAreardquo Item 2 for instance asks ldquoThe parallelogram below will be cut
into two congruent triangles (provides dimensions) What is the area of one of the trianglesrdquo
Item 13 asks ldquoWhich of the following shows a rectangle and a triangle that have the same areardquo
and lastly Item 27 requests that learners compare the areas of two polygons (exact item not
released) Item 2 was referenced to the Application category whereas Items 13 and 27 were
referenced to the Thinking category It was therefore determined that Factor 2 could be
described as requesting of learners to apply thinking processes or skills such as problem solving
and reasoning in order to solve deeper mathematical problems specifically surrounding the
Measurement topic of ldquoAreardquo
Lastly for Factor 3 as with Factor 1 no clear similarities appeared to exist to tie all the
items together based on strands However as with Factor 1 similarities seemed to exist in terms
of the applied skill requested of learners to solve the mathematical problems It appeared that
all the items on this factor requested of learners to apply thinking skills to solve deeper
mathematical problems surrounding various strands in other words learners had to go beyond
the mere application of content knowledge to solve these items For instance Item 20 referenced
29
to the Application category requested that learners solve the following problem ldquoEach beaker of
water below has a capacity of 2L Which beaker appears to have about 500ml of water in itrdquo
Whereas Item 28 referenced to the Thinking category asks ldquoMrs Garrett sends surveys to 120
students and 78 students return the survey Which statement best describes the percent of
students who return the surveyrdquo Again no clear difference appeared to exist between the
applied skill requested of learners in terms of the Application and Thinking categories to which
the items were referenced It was therefore concluded that Factor 3 could be described as
measuring the ability of learners to apply thinking processes or skills such as problem solving
and reasoning in order to solve deeper mathematical problems in various strands
In sum the results of the EFA determined that a three factor model could be used to
adequately characterize the dimensionality of the multiple choice mathematics items on the
EQAO assessment Twelve items clustered adequately together in terms of factor loading scores
to form Factor 1 which achieved a relatively high Cronbachrsquos alpha of 725 three items on
Factor 2 which achieved a moderate Cronbachrsquos alpha of 536 and lastly eight items on Factor
3 which also achieved a moderate Cronbachrsquos alpha score of 565 Upon closer inspection of
the items on each factor and in terms of the Knowledge and Skills categories and strands to
which they were referenced by the EQAO it was determined that Factor 1 could be best
described as measuring the ability of learners to apply mathematical knowledge related to
procedural and conceptual understanding in order to solve problems in various mathematical
strands Factor 2 could be best described as measuring the ability of learners to apply process
or thinking skills in order to solve problems related specifically to the topic of ldquoAreardquo
Lastly Factor 3 could be best described as measuring the ability of learners to apply thinking
skills in various mathematical strands
30
42 Mathematical Strengths and Weaknesses
In an attempt to identify in which mathematical dimensions and related strands Grade 6
learner performances were strongest and weakest as asked in question two of this study a Latent
Class Analysis (LCA) was conducted This allowed for distinct performance profiles to be
generated for classes or sub-groups performing similarly in the population and therefore allowed
for more accurate descriptions of strengths and weaknesses The factors as established in the
dimensionality investigation in Phase 1 of this study were used to represent the dimensions for this
analysis
Although the four class model achieved the lowest AIC BIC and Sample-Size Adjusted
BIC statistic values in comparison to the two and three class model it also produced a much lower
Entropy value of 69 (see Table 8) Therefore it was decided that since these statistics did not
decrease that much from the three class to four class model the use of the four class model with a
much lower Entropy value did not seem warranted Thus the three class model was opted for
instead as it produced lower fit statistics than the two class model as well as a sufficiently high
Entropy value of 75 Furthermore the results indicated that each class was represented by the
following proportion of learners from the sample Class 1 comprised of 321 Class 2 of 452
and Class 3 of 227
Table 8
LCA Fit Statistics for 2 3 and 4 Classes
Fit statistics 2 Classes 3 Classes 4 Classes
AIC 12974224 12808557 12789120
BIC 13004854 12854829 12851034
Adj BIC 12989919 12832268 12820846
Entropy 81 75 69
Notes N = 5000 AIC = Akaike Information Criterion BIC = Bayesian Information Criterion Adj BIC = Sample-
Size Adjusted Bayesian Information Criterion
31
Eleven item-groups were created to describe the strengths and weaknesses of the three
classes as represented in Table 9 Item-groups were created by grouping items according to the
factor they were determined to measure (as established in the EFA) as well as the strand to which
they were allocated by the EQAO Five item-groups were created for Factor 1 one item-group for
Factor 2 and five groups for Factor 3 The number of items within each item-group varied from 1
item to 4 items The mean probability scores calculated for each class for each item-group and
overall dimension or factor are also represented in Table 9 These mean item-group probability
scores as presented in Table 9 were used to plot three distinct performance profiles for each class as
represented in Figure 2 below
Table 9
Item-Groups created to Describe Mathematical Performances of Grade 6 Learners
Factor Content Area of items Class 1 Class 2 Class 3
1 Patterning amp Algebra 3 97 86 48
1 Measurement 1 95 78 44
1 Geometry amp Spatial Sense 2 94 79 50
1 Number Sense amp Numeration 4 92 76 49
1 Data Management amp Probability 2 78 49 19
Factor 1 class probability means 91 74 44
2 Measurement (Area) 3 85 39 28
Factor 2 class probability means 85 39 28
3 Patterning amp Algebra 2 67 43 20
3 Measurement 2 79 55 25
3 Geometry amp Spatial Sense 1 79 47 31
3 Number Sense amp Numeration 2 80 60 44
3 Data Management amp Probability 1 72 40 22
Factor 3 class probability means 76 51 29
Note The factor probability means presented in bold are slightly higher as the actual item probability score was used
to calculate these values and not the item-group probability scores
Using the evidence generated from the mean item-group and factor probability scores as
represented in Table 9 and Figure 2 these performance profiles were used to describe the strengths
32
and weaknesses of each class Class specific strengths and weaknesses were described according
to firstly overall performances in the 11 item-groups in comparison to the other classes secondly
in terms of overall performances in each dimension (Factor 1 2 and 3) and lastly in terms of
performances in each strand within each dimension for Factor 1 and 3 only (as Factor 2 only
represented Measurement topic of ldquoAreardquo) A mean item-group probability score ranging from 86
- 10 was described as especially strong 71 - 85 as strong and 56 - 70 as moderately strong
while those scores ranging from 41 - 55 were described as moderately weak 26 - 40 as
moderately weak and 25 and below as especially weak
Figure 2 Three performance profiles of Grade 6 learners in 11 mathematical item-groups
Results indicated that those learners most likely to belong to Class 1 performed higher than
Class 2 and 3 in all item-groups Therefore this class to which 321 of learners from the sample
belonged can be best described as the highest performing and second largest group overall Those
most likely to belong to this class can be described as having an especially strong ability to apply
0
01
02
03
04
05
06
07
08
09
1
Item
-Gro
up
Mea
n P
rob
ab
ilit
y
Item-Groups
Class 1 (321) Class 2 (452) Class 3 (227)
33
mathematical knowledge in order to solve problems in various strands This was determined by the
average 91 overall probability for success achieved for those items related to Factor 1 They can
also be described as having a strong ability to apply thinking skills in order to solve problems
surrounding the Measurement topic of ldquoAreardquo and strong ability to do the same in various strands
This was determined by the 85 probability for success achieved for those items related to Factor
2 and 76 probability for success achieved for those related to Factor 3 Furthermore their overall
performances in the knowledge dimension can be described as stronger in comparison to their
performances in the thinking dimensions
Specifically concerning their ability to apply mathematical knowledge in various strands
(Factor 1) these learners can be described as performing slightly stronger in the Patterning and
Algebra (item-group probability score = 97) and considerably weaker in Data Management and
Probability (item-group probability score = 78) in relation to their performances in the other
strands Specifically regarding their ability to apply think skills in order to solve problems (Factor
3) they can be described as performing slightly stronger in Number Sense and Numeration (item-
group probability score = 80) and considerably weaker in Data Management and Probability (item-
group probability score = 72) and Patterning and Algebra (item-group probability score = 67) with
the latter being the weakest in relation to their performances in the other strands
Results further indicated that those learners most likely to belong to Class 2 performed
overall lower than Class 1 but higher than Class 3 in all item-groups Therefore this class to
which 452 of the learners belonged can be best described as the intermediate performing and
largest group overall Those most likely to belong to this class can be described as having a strong
ability to apply mathematical knowledge in order to solve problems in various strands This was
determined by the average 74 overall probability for success achieved for those items related to
Factor 1 They can also be described as having a weak ability to apply thinking skills in order to
solve problems surrounding the Measurement topic of ldquoAreardquo and moderately weak ability to do
the same in various strands This was determined by the 39 probability for success achieved for
34
those items related to Factor 2 and 51 probability for success achieved for those related to Factor
3 Furthermore their overall performances in the knowledge dimension can be described as
stronger in comparison to their performances in the thinking dimensions
Specifically concerning their ability to apply mathematical knowledge in various strands
(Factor 1) performances for these learners can be described as considerably stronger in Patterning
and Algebra (item-group probability score = 86) and considerably weaker in Data Management
and Probability (item-group probability score = 49) in relation to their performances in the other
strands Specifically regarding their ability to apply thinking skills in order to solve problems
(Factor 3) performances can be described as stronger in Number Sense and Numeration (item-
group probability score = 60) and considerably weaker in Data Management and Probability (item-
group probability score = 40) and Patterning and Algebra (item-group probability score = 43) with
the former being the weakest in relation to their performances in the other strands
Lastly results indicated that those learners most likely to belong to Class 3 performed lower
than Class 1 and 2 in all item-groups Therefore this class to which 227 of learners belonged
can be best described as the lowest performing group overall Those most likely to belong to this
class can be described as having a moderately weak ability to apply mathematical knowledge in
order to solve problems in various strands This was determined by the average 44 overall
probability for success achieved for those items related to Factor 1 They can also be described as
having a weak ability to apply thinking skills in order to solve problems surrounding the
Measurement topic of ldquoAreardquo and weak ability to do the same in various strands This was
determined by the 28 probability for success achieved for those items related to Factor 2 and
29 probability for success achieved for those related to Factor 3 Furthermore their overall
performances in the knowledge dimension can be described as stronger in comparison to their
performances in the thinking dimensions
Specifically concerning their ability to apply mathematical knowledge in various strands
(Factor 1) it was determined that these learners can be described as performing slightly stronger in
35
Geometry and Spatial Sense (item-group probability score = 50) and considerably weaker in Data
Management and Probability (item-group probability score = 19) in relation to their performances
in the other strands Specifically regarding their ability to apply thinking skills in order to solve
problems (Factor 3) their performance can be described as considerably stronger in Number Sense
and Numeration (item-group probability score = 44) and weaker in Data Management and
Probability (item-group probability score = 22) and Patterning and Algebra (item-group
probability score = 20) with the latter being the weakest in relation to their performances in the
other strands
In sum the results of the LCA revealed that three classes could be used to best describe the
performances of Grade 6 learners in the three dimensions as established during the EFA and their
related strands Class 1 was described as the highest performing and second largest group The
learners in the class were described as performing especially strong in Factor 1 (namely their
ability to apply mathematical knowledge to solve problems in various strands) strong in Factor 2
(namely their ability to apply thinking skills to solve problems specifically related to the
Measurement topic of ldquoAreardquo) and in Factor 3 (namely their ability to apply thinking skills in order
to solve problems in various strands) Class 2 was described as the intermediate performing and
largest group and performing strong for Factor 1 weak for Factor 2 and moderately weak for
Factor 3 Lastly Class 3 was described as the lowest performing and smallest group and
performing moderately weak for Factor 1 and weak for both Factor 2 and 3 For all classes overall
factor performances were described as weaker in the thinking dimensions namely Factor 2 and 3
than in the knowledge dimension namely Factor 1 A greater discrepancy between these
mathematical knowledges and thinking skills dimensions appears to exist for those in Class 2 than
for those in Class 1 and 3
Lastly in terms of describing the performances of each class in the strands related to each
factor for Factor 1 and 3 results revealed clear similarities between all classes in terms of those in
which performances were described as weaker For all classes regarding Factor 1 their ability to
36
apply mathematical knowledge within the Data Management and Probability strand was described
as the weakest in relation to the other strands For all classes regarding Factor 3 their ability to
apply thinking skills in the Patterning and Algebra and Data Management and Probability strand
was described as weakest in relation to their performances in the other strands
43 Predicting Mathematics Profiles by Language and Length of Residence Background
To avoid treating learners as homogenous groups based on their language background they
were allocated to one of six groups according to their ESL designation and length of residency in
Canada The six groups represented the predictor variable (independent variable) whereas the three
classes or performance profiles were treated as the predicted or dependent variable Class 1
namely the highest performing profile group was used as the reference category
Results of this analysis indicated that the final model did not significantly predict class and
performance profile membership with a -2 Log likelihood of 7740 and a Chi-square value of 957
(10 N = 5000) p = 48 The upper portion of Table 10 presents the regression coefficients the
Wald test adjusted odds ratio [Exp(B)] and the 95 confidence intervals (CI) for odds ratios for
the predictor contrasting Class 2 to Class 1 The lower portion of the table presents the regression
coefficients the Wald test adjusted odds ratio [Exp(B)] and the 95 confidence intervals (CI) for
odds ratios for the predictor contrasting Class 3 to Class 1
Results therefore revealed that ESL status and residence in Canada did not significantly
predict class or profile membership regardless of group allocation In other words regardless of
group allocation learners were found to be equally likely to belong to either Class 1 (highest
performing group) Class 2 (intermediate performing group) or Class 3 (lowest performing group)
and therefore perform according to the related profile as indicated earlier in Figure 2
37
Table 10
Parameter Estimates for Six Groups on 3 Classes
Model B SE - B Wald df Exp(B) 95 CI EXP (B)
Class 2
Intercept 43 23 351 1
Group 1 -07 23 09 1 93 60 ndash 147
Group 2 06 26 06 1 107 64 ndash 178
Group 3 -60 35 296 1 55 277 ndash 109
Group 4 01 31 00 1 101 55 ndash 183
Group 5 -08 28 09 1 92 54 ndash 158
Class 3
Intercept -13 26 27 1
Group 1 -23 26 74 1 80 48 ndash 133
Group 2 -20 31 42 1 82 47 ndash 149
Group 3 -36 39 84 1 70 33 ndash 150
Group 4 -35 37 92 1 70 34 ndash 144
Group 5 -53 33 255 1 59 31 ndash 113
Notes p lt 001 N = 5000 Class 1 is the reference category Group 1 = Non-ESL CA Born (n = 4185) Group 2 =
ESL CA Born (n = 308) Group 3 = Non-ESL Non-CA born but living in country less than 5 years (n = 76) Group 4
= ESL Non-CA born but living in country less than 5 years (n = 123) Group 5 = Non-ESL Non-CA born but living in
country 5 years or more (n = 199) Group 6 = ESL Non-CA born but living in country 5 years or more (n = 109)
38
Chapter 5 Discussion
The purpose of this study was to move beyond the total scores of a largescale assessment
in order to gain better insight into the mathematical performances of Ontariorsquos Grade 6 learners
In doing so it aimed to provide evidence of learner strengths and weaknesses in different aspects
of mathematics education on which to base remedial decisions for the improvement thereof
Using the responses of a random sample of 5000 Grade 6 learners to 28 multiple choice
mathematics items on the 20132014 EQAO Junior Division assessment an Exploratory Factor
Analysis (EFA) was firstly performed in order to investigate the dimensionality characteristics
of the assessment This was followed by a Latent Class Analysis (LCA) to determine learner
strengths and weaknesses related to the established mathematical dimensions and their related
strands Lastly a multinomial logistic regression analysis was performed in order to examine the
extent to which mathematics performance profiles were predicted by student background factors
such as language and length of residency in Canada This chapter discusses the findings of these
analyses study limitations and lastly recommendations for future research and education
51 What Characterizes the Dimensionality of the EQAO Mathematics Achievement Test Administered to Grade 6 Students in Ontario Public Schools
The multiple choice mathematics items on the EQAO assessment were characterized as
measuring the ability of learners in three interrelated yet separate mathematical dimensions
These being the ability of learners to apply mathematical knowledge related to procedural
knowledge and conceptual understanding to solve problems in various strands (Factor 1) the
ability to apply process or thinking skills such as problem solving or reasoning skills to solve
problems in ldquoAreardquo (Factor 2) and lastly the ability to apply process or thinking skills to solve
39
problems in various mathematical strands The three factors produced achieved on average
moderate reliability scores
These findings regarding the characteristics of the dimensions were considered valuable
as they allowed for the comparison of learner abilities in two essential elements of mathematical
proficiency as aligned with the Principles and Standards for School Mathematics (NCTM
2000) and as a result also with the Ontario mathematics curriculum which shares the same
foundations Only once this happens namely learner ability measured directly in relation with
mathematical curriculum expectations can we begin an effective process of remediation
(Kilpatrick et al 2001) These elements were that of mathematical knowledge consisting of
procedural and conceptual knowledge as measured by Factor 1 of this study and process or
thinking skills such as problem solving and reasoning as measured by Factor 2 and 3 Factor 2
and 3 were determined to differ based solely on the content of the items included in the
assessment This finding highlights concerns regarding the fair representation of all curriculum
expectations on the assessment and thus warrants further investigation
The fact that the ability to apply mathematical knowledge and the ability to apply
thinking skills in order to solve mathematical problems were found to be sufficiently unique
dimensions to warrant their use using the multiple choice items on this largescale mathematics
assessment adds further value to the findings of this study These findings are valuable in that
they attest to the future potential for assessment organizations to report learner performances
beyond that of total scores as demanded by those in the educational field However since the
factors achieved only moderate reliability scores we are reminded of the need for these tests to
be designed upon foundations aligned with those of the curriculum expectations they are
employed to assess from the start in order for them to meet better test properties (Chudowsky amp
Pellegrino 2003 Rogers 2014)
40
52 In which Mathematical Dimensions and Related Strands do Students Demonstrate Strengths and Weaknesses in their Mathematical Achievement
Three classes were determined to best describe the performances of all Grade 6 learners
in the established dimensions and their related strands Class 1 was described as the highest
performing and second largest group consisting of 321 of the learners Class 2 was described
as the intermediate performing and largest group consisting of 452 of the learners and lastly
Class 3 was described as the lowest performing and smallest group consisting of only 227 of
the learners from the sample
The results of this analysis further revealed that all three classes performed weaker in
their ability to apply thinking skills in order to solve problems either specifically surrounding
the topic of Area or in various strands than in their ability to apply mathematical knowledge in
order to do the same The performances of those in Class 1 were described as especially strong
in the mathematical knowledge dimension (Factor 1) and strong in the thinking dimensions
(Factor 2 and 3) Class 2 was described as strong in the mathematical knowledge dimension but
weak in the thinking skills dimensions and lastly Class 3 was described as moderately weak in
the mathematical knowledge and thinking skills dimensions The discrepancy between
performances in the two subdomains namely mathematical knowledge and thinking skills thus
appeared to be largest for those in Class 2 the intermediate performing and largest group
The findings concerning the overall performances of students in the two subdomains of
mathematical knowledge and thinking skills aligns with those concerning the performances of
US students as described by Kilpatrick et al (2001) They highlight that research evidence over
the past 30 years has consistently indicated that although US students do not fare badly in
applying their knowledge to solve basic mathematical problems they tend to have a limited
41
understanding of mathematical concepts and are noticeably deficient in their ability to apply
mathematical thinking skills to solve even simple problems
It may however be argued that this finding namely a weaker performance in thinking
skills than mathematical knowledge is to be expected given the fact that applying thinking skills
in order to solve problems is a more challenging task than simply applying what you know
(Schoenfeld 2007) However studies have also found that a strong mathematical knowledge
base leads to a better ability to apply thinking skills to solve deeper problems (Stokke 2015)
Thus given the inter-relatedness of these two dimensions together with the large discrepancy
between them for those in Class 2 (strong mathematical knowledge but weak thinking skills)
these findings demonstrate a weakness in the majority of Ontariorsquos Grade 6 learners to apply
thinking skills to solve deeper mathematical problems This finding holds important
recommendations for future research and mathematics educational practices as will be discussed
in the section below
Upon further investigation of learner performances in each of the strands as they relate to
the dimensions it was determined that all three classes performed much weaker in their ability to
apply mathematical knowledge in the Data Management and Probability strand than in the other
strands This strand was also determined to be the weakest in the thinking skills dimension
along with Patterning and Algebra This finding contradicts those of Tatsuoka Corter and
Tatsuoka (2004) in which it was found that students in the US appeared to perform poorest in
Geometry and Spatial Sense Given the inter-relatedness of mathematical knowledge and ability
to apply thinking skills as previously highlighted by Stokke (2015) this finding concerning Data
Management and Probability attests to a knowledge base weakness for Grade 6 Ontario learners
specifically surrounding this strand As for the results surrounding Patterning and Algebra they
appear to provide further support for the weak ability of the learners to apply thinking skills
42
given their relatively strong mathematical knowledge surrounding this strand These findings
also hold valuable recommendations for educational practices in Ontario which will be further
discussed below
53 To What Extent Are Mathematics Performance Profiles Predicted by Student Background such as Language and Residence Status
Findings from this analysis revealed that language background and length of residence in
Canada did not significantly predict performance profile membership Therefore regardless of
group allocation based on these variables all learners were equally likely to achieve a Class 1
(high performing) Class 2 (intermediate performing) or Class 3 (low performing) profile as
described in this study
These findings contradict the Jang et al (2013) study on the performance of learners in
reading In that study it was found that different reading patterns were achieved based on ELL
and length of residence status It was further determined that non-English speakers outperformed
monolinguals in reading achievement after living in the country for five years or more These
findings therefore do not appear to hold true for the performances of learners in mathematics
based on these variables as all learner groups were equally likely to achieve one of the three
performance profiles produced in this study However it needs to be acknowledged that this
study focused on ESL designation as opposed to ELL status which may have contributed to the
differences in findings Nonetheless these findings are considered valuable in that they provide
reassurance of the fact that the test results were not confounded by differences in language
proficiency and that the EQAO test was not biased towards first language speakers
The findings of this study further contradict those that found that English first language
speakers outperformed those for whom English was not their first language (Abedi amp Lord
43
2001 Howie 2003) Therefore they help shed perceptions of differences in mathematical
performances based solely on the aspect of language background This finding holds important
implications for mathematics education for these population groups as well as future research
54 Study Limitations
The following study limitations have been recognized and should thus be taken into
consideration when reviewing these findings Firstly this study analyzed the mathematical
performances of learners based on the results of a standardized test only We are therefore
reminded of the fact that many factors influence test scores over and above that which is random
These include the testing situation tester characteristics and test-taker characteristics (Kaplan amp
Saccuzzo 2009) For this reason it is important that learner performances in other assessment
environments also be considered such as classroom-based assessment activities
Secondly the findings of this study were based solely on learner performances on the
multiple choice items According to Schoenfeld (1992) most multiple choice items are machine
graded which limits their ability to measure learner conceptual understanding and problem
solving abilities to the degree that most people would like For this reason it is important that
future studies consider including the open response questions included on the assessment for a
better reflection of learner conceptual understanding and problem solving
Thirdly this study included performances of learners based solely on a single EQAO
administration and its data Although EQAO proclaims to instill rigorous test equating
procedures to ensure that test difficulty and discrimination properties are not compromised
across years (Rogers 2013) this does not guarantee that learner performances can be generalized
to all Grade 6 learners Furthermore this study focused on only those who took the English
44
version of the test therefore generalizing these findings to those who took the French version
should be done cautiously
Lastly the small ESL population size in comparison to the non-ESL population limits the
findings of this group and may therefore not accurately reflect their performances Furthermore
this study used ESL designation as opposed to ELL status ESL designation is a program in
which learners are enrolled or unenrolled throughout the year Therefore these findings may not
reflect that of the entire ELL population
55 Recommendations and Future Research
In light of recent poor mathematical performances of Ontariorsquos elementary learners the
education minister announced its ldquoRenewed Math Strategyrdquo designed for the purposes of
combatting further decline (Brown 2016) In this strategy requirements for improving the
performances of learners in mathematics were announced such as all learners in Grade 1-8 to
receive at least 60 minutes of mathematics instruction per day further support for weaker
schools in terms of more professional development for teachers as well as more support for
learners and parents surrounding this discipline As this study made apparent in the beginning
such strategies risk being only blanketed approaches that do not really target the heart of the
problem if not accompanied by further insight into the results upon which they are based
This study was conducted in an attempt to gain such insight and found that although
Ontario Grade 6 learners display strong mathematical knowledge the majority are particularly
weak in applying thinking skills such as reasoning and problem solving to solve deeper
mathematical problems It was further determined that learners are particularly weakest in the
Data Management and Probability strand for both mathematical knowledge and thinking skills
dimensions as well as the Patterning and Algebra strand in the latter dimension It was lastly
45
determined that background variables of language and length of residence did not significantly
predict performance and profile achievement and that both ESL and non-ESL learners were
equally likely to belong to high intermediate and low performing groups regardless of length of
residence in Canada Based on these findings the following recommendations surrounding
future research endeavors and educational practices specifically in conjunction with mathematics
education in Ontario will be discussed below
The Ontario Curriculum Grades 1-8 Mathematics 2005 document indicates that the
ultimate goal for mathematics education is to develop learner proficiency beyond that of content
knowledge and therefore also calls for the development of a deeper understanding of the
discipline along with essential thinking skills In order to accomplish these goals the
curriculum highlights that instructional practices need to deviate from a sole focus on direct
teaching methods to incorporate methods of teaching and learning through problem solving in
other words problem-based learning approaches Stokke (2015) blames this greater emphasis of
teaching mathematics using problem-based teaching strategies for the recent decline of Ontario
learnersrsquo mathematical performances She argues that the lack of direct instruction has robbed
learners of a sound knowledge base from which to draw upon when attempting to solve deeper
mathematical problems hence the weakness in this area
However the findings from this study provides evidence that contradicts this argument
as results point to the fact that the majority of Grade 6 learners in Ontario actually do possess
strong mathematical knowledge This finding may therefore perhaps be an indication of the
fact that a large portion of Ontario teachers still rely predominantly on teaching mathematics
using traditional direct teaching methods as opposed to those better suited to meet current
curriculum goals and expectations This finding therefore warrants further investigation into
current teaching trends and holds valuable insight as to where to direct efforts for remediation
46
In order to meet reformed curriculum goals and expectations teaching practices need to
change for which the teacher is the key actor (Ross amp McDougall 2006) Therefore this study
supports those calling for increased efforts directed at teachers and the need to reshape their roles
and perceptions of what it means to ldquoteachrdquo mathematics in a reformed curriculum classroom
For instance Milgram (2007) urges for strategies directed at ensuring that teachers truly
understand what it means to teach using problem-based teaching methods to develop thinking
skills He further illustrates that teaching thinking skills such as problem solving is a
challenging task as it is in itself complex involving both verbal and nonverbal mental processes
For this reason it is essential that learners solve problems for which the answer is not apparent
and requires a novel idea if we wish to effectively develop these skills (Milgram 2007) Such a
teaching and learning process requires that teachers step back allowing learners to grapple with
the task before them as well as interact with each other stepping in only when necessary to
guide the process (Milgram 2007)
Changing the role of the teacher from the traditional sole knowledge bearer and
transferor to one in which heshe shares the responsibility of learning with students is however
only one of 10 dimensions that requires attention when urging teachers to adopt instructional
practices better suited to accomplish curriculum goals and expectations (Ross amp McDougall
2007) Ross and McDougall (2006) further illustrate that in order to ensure that teaching for
deeper understanding as aligned with current reformed mathematics education takes place
teachers need to consider change in all 10 of these dimensions These dimensions as cited in
Ross and McDougall (2006) are summarized as follows 1) the need for program scope 2)
access to all forms of mathematics by students 3) raising self-confidence of students by teachers
4) complex and open-ended student tasks 5) instruction that focuses on constructing
mathematical ideas through self-discovery 6) change in the role of teachers to that of co-learner
47
and co-knowledge creator 7) solving of mathematical problems with the aid of manipulatives 8)
classroom organization in a manner that promotes sharing and interaction for solutions 9)
authentic assessment and lastly 10) a conception of mathematics as a dynamic subject by
teachers
Specifically regarding the first dimension namely the need for program scope Ross and
McDougall (2006) describe it as urging teachers to teach multiple mathematical strands with
increased attention on those less commonly taught such as the Data Management and
Probability and Patterning and Algebra strands The results of this analysis indicated that
learners were weakest in precisely these two strands therefore perhaps providing evidence in
support of the fact that these strands are given less attention by Ontario teachers when teaching
the mathematics curriculum expectations This finding therefore provides added support for the
need to further promote the implementation of these 10 dimensions of teaching for deeper
understanding as indicated above so as to ensure that teachers view all curriculum strands as
equally important and deserving of attention
In calling for these increased efforts directed at changing the way in which mathematics
teaching and learning occurs in classrooms it is important to acknowledge the fact that this is
easier said than done Teaching in a manner that supports the development of a deeper
understanding for mathematics and promotes thinking skills is a lengthy process that takes time
(Milgram 2007) A commodity in short supply for the teacher already feeling pressured to
cover all curriculum expectations before mandatory accountability assessments take place
(Milgram 2007) Therefore not only does this study call for increased efforts directed at
changing teacher perceptions and instructional practices in the classroom but also for policy
makers to consider practical constraints placed on teachers that may restrict the implementation
thereof
48
Lastly the need to predict mathematical performances of learners based on background
variables is made apparent by Hinton (2014) who found that early success in mathematics
predicts future success Therefore for the sake of early intervention especially for the lowest
performing group identified in this study it is urged that further research studies be directed at
determining background variables that better predict performances However it is further urged
that such studies focus on class or profile membership as used in this study as opposed to overall
mathematics performances used in the past In this way not only will we be able to better
identify low intermediate and high performers but also their related strengths and weaknesses
upon which specific remedial efforts can be targeted As for the equal likelihood of ESL and
non-ESL learners to achieve either low intermediate or high performing profiles this study
recommends future studies targeted at shedding perceptions of non-English speakers
underperforming in relation to first language speakers that have perhaps been shaped by previous
studies Without doing so we risk assuming the need for remediation directed at one group
whilst ignoring the needs of others
49
References
Abedi J amp Lord C (2001) The language factor in mathematics tests Applied Measurement
in Education 14(3) doi 101207S15324818AME1403_2
Brown J (2016) Elementary student to get hour of math every day under new Ontario plan
Retrieved July 23 2016 from
httpswwwthestarcomyourtorontoeducation20160404elementary-students-to-get-
hour-of-math-every-day-under-new-ontario-planhtml
Chudowsky N amp Pellegrino JW (2003) Large-scale assessments that support learning what
will it take Theory into Practice 42(1) 75+ Retrieved from
httpgogalegroupcommyaccesslibraryutorontocapsidop=AONEampu=utoronto_mai
nampid=GALE|A99909373ampv=21ampit=rampsid=summonampuserGroup=utoronto_mainampauth
Count=1
Collins L K amp Lanza S T (2010) Latent class and latent transitional analysis with
applications in the social behavioral and health sciences Hoboken NJ Wiley amp Sons
DePascale C (2014) The ideal role of large-scale testing in a comprehensive assessment
system Journal of Applied Testing Technology 5(1) 1-11 Retrieved from
httpwwwjattjournalcomindexphpatparticleview48343
Education Quality and Accountability Office (2016) About the agency Retrieved May 26
2016 from EQAO
httpwwweqaocomenabout_eqaoabout_the_agencyPagesabout-the-agencyaspx
Education Quality and Accountability Office (2014) EQAOrsquos provincial elementary school
report 2014 Retrieved September 26 2015 from EQAO
httpwwweqaocomenassessmentsresultsPagesprovincial-report-elementary-
2014aspx
Figlio D amp Loeb S (2011) School accountability In EA Hanushek S Machin and L
Woessmann (Eds) Handbooks in Economic The Netherlands North-Holland pp 383-
421
Foster D Noyce P amp Spiegel S (2007) When assessment guides instruction Silicon
Valleyrsquos mathematics assessment collaboration In AH Schoenfeld (Ed) Assessing
mathematical proficiency (pp 137-154) Cambridge Cambridge University Press
Friesen S (2005) Math Teaching it better Education Canada 46(1) 6-10
Furr R M (2011) Scale construction and psychometrics for social and personality psychology
Los Angeles SAGE
Fillmore L W (2007) English learners and mathematics learning language issues to consider
In AH Schoenfeld (Eds) Assessing mathematical proficiency (pp 333-344) Cambridge
Cambridge University Press
50
Haertel E H amp Herman J l (2005) A historical perspective on validity arguments for
accountability testing Yearbook of the National Society for the Study of
Education 104(2) 1-34 doi101111j1744-7984200500023x
Hinton A (2014) Tracking student achievement in mathematics over time in English language
schools Retrieved from
httpwwweqaocomenresearch_dataResearch_ReportsPagesstudent-
achievementaspx
Howie S (2005) System-level evaluation Language and other background factors affecting
mathematics achievement Prospects 35(2) 175-186 doi101007s11125-005-1820-
8
Huff K amp Goodman DP (2007) The demand for cognitive diagnostic assessment In JP
Leighton amp MJ Gierl (Eds) Cognitive Diagnostic Assessment for Education (19-60)
New York Cambridge University Press
IBM Corp Released 2013 IBM SPSS Statistics for Windows Version 230 Armonk NY IBM
Corp
Jang E E amp Ryan K (2003) Bridging gaps among curriculum teaching and learning and
assessment Book review Kifer E (2001) Large-scale assessment Dimensions
dilemmas and policy Journal of Curriculum Studies 35(4) 499-512
Jang EE Dunlop M Wagner M Kim Y amp Gu Z (2013) Elementary school ELLsrsquo
reading skill profiles using cognitive diagnosis modelling Roles of length of residence
and home language environment Language Learning 63(3) 400-436 doi
101111lang12016
Kaplan RM amp Saccuzzo DP (2009) Psychological Testing Principles Applications and
Issues Belmont Wadsworth Cengage Learning
Kilpatrick J Swafford J Findell B amp National Research Council (US) (2001) Adding it
up Helping children learn mathematics Washington DC National Academy Press
Klinger D A amp Rogers W T (2011) Teachers perceptions of large-scale assessment
programs within low-stakes accountability frameworks International Journal of
Testing 11(2) 122-143 doi101080153050582011552748
La Rose L (2014) PISA results Canada students high level achievers but math and science
scores dip The Huffington Post Retrieved October 5 2015 from
httpwwwhuffingtonpostca20131203pisa-results-canada-
studentrankings_n_4376190html
Meyers L S Gamst G amp Guarino A J (2006) Applied multivariate research Design and
interpretation Los Angeles Sage
Milgram R J (2007) What is mathematical proficiency In AH Schoenfeld (Eds) Assessing
mathematical proficiency (pp 31-58) Cambridge Cambridge University Press
51
Moschkovich J (2007) Beyond words to mathematical content Assessing English learners in
the mathematical classrooms In AH Schoenfeld (Eds) Assessing mathematical
proficiency (345-352) Cambridge Cambridge University Press
Mutheacuten LK amp Mutheacuten BO (1998-2010) Mplus Userrsquos Guide (6th Ed)
Los Angeles CA Mutheacuten amp Mutheacuten
Nagy P (2000) The three roles of assessment Gatekeeping accountability and instructional
diagnosis Canadian Journal of Education 25(2) Retrieved from
httpmyaccesslibraryutorontocaloginurl=httpsearchproquestcomdocview215374
855accountid=14771
National Council of Teachers of Mathematics (2000) Principles and standards for school
mathematics Reston VA National Council of Teachers of Mathematics
Nichols P D (1994) A framework for developing cognitively diagnostic assessments Review
of Educational Research 64(4) 575 Retrieved from
httpmyaccesslibraryutorontocaloginurl=httpsearchproquestcomdocview214116
755accountid=14771
Nylund K L Asparouhov T amp Mutheacuten B O (2007) Deciding on the number of classes in
latent class analysis and growth mixture modeling A monte carlo simulation
study Structural Equation Modeling A Multidisciplinary Journal 14(4) 535-569
doi10108010705510701575396
OECD (2014) PISA 2012 Results What Students Know and Can Do Student Performance in
Mathematics Reading and Science doi httpdxdoiorg1017879789264208780-en
Ontario (2005) The Ontario curriculum grades 1-8 Toronto Ontario Ministry of Education
Pastor D A Barron K E Miller B J amp Davis S L (2007) A latent profile analysis of
college students achievement goal orientation Contemporary Educational
Psychology 32(1) 8-47 doi101016jcedpsych200610003
Rogers WT (2013) What is the quality of EQAO assessments Excellent Retrieved
September 24 2015 from
httpwwweqaocomenresearch_dataResearch_ReportsPagesbest-assessment-
practicesaspx
Rogers WT (2014) Improving the utility of large-scale assessments in Canada Canadian
Journal of Education 37(3) Retrieved from httpcje-rcecaindexphpcje-
rcearticleview1732
Ross JA amp McDougall D E (2006) Mathematics In K Leithwood P McAdrie N Bascia
amp A Rodrigue A (Eds) Teaching for deep understanding Towards the Ontario
curriculum that we need (pp 33-39) Thousand Oaks CA Corwin Publishing
Schoenfeld A H (2007) Issues and tensions in the assessment of mathematical proficiency In
52
AH Schoenfeld (Ed) Assessing mathematical proficiency (pp3-15) Cambridge
Cambridge University Press
Schoenfeld A H (2007) What is mathematical proficiency and how can it be assessed In
AH Schoenfeld (Ed) Assessing mathematical proficiency (pp 59-73) Cambridge
Cambridge University Press
Schoenfeld A H (1992) Learning to think mathematically Problem solving metacognition
and sense making in mathematics In D Gouws (Ed) Handbook for research on
mathematics teaching and learning (pp 334-370) New York Macmillan
Schumacker R E amp Lomax R G (2004) A beginnerrsquos guide to structural equation modeling
(2nd ed) Mahwah NJ Lawrence Erlbaum Associates
Shapka J Domene J amp Keating D (2006) Trajectories of career aspirations through
adolescence and young adulthood Early math achievement as a critical filter
Educational Research and Evaluation 12(4) 347-358 Retrieved from
httpdxdoiorg10108013803610600765752
Statistics Canada (2016) Immigration and Ethnocultural Diversity in Canada Retrieved May
31 2016 from httpswww12statcangccanhs-enm2011as-sa99-010-x99-010-
x2011001-engcfm
Stein MK Remillard J amp Smith MS (2007) How curriculum influences student learning
In FK Lester amp National Council of Teachers of Mathematics (Eds) Second handbook
of research on mathematics teaching and learning a project of the National Council of
Teachers of Mathematics (pp 1099) Charlotte NC Information Age Pub
Stokke A (2015) What to do about Canadarsquos declining math scores Retrieved from
httpswwwcdhoweorgpdfcommentary_427pdf
Tatsuoka K Corter J amp Tatsuoka C (2004) Patterns of Diagnosed Mathematical Content
and Process Skills in TIMSS-R across a Sample of 20 Countries American Educational
Research Journal41(4) 901-926 Retrieved from
httpwwwjstororgmyaccesslibraryutorontocastable3699467
Uebersax JS (2015) Introduction to the Tetrachoric and Polychoric Correlation Coefficients
Retrieved July 20 2015 from httpjohn-uebersaxcomstattetrahtm
Wilson L D (2007) High-stakes testing In FK Lester and National Council of Teachers of
Mathematics (Eds) Second handbook of research on mathematics teaching and learning
a project of the National Council of Teachers of Mathematics (pp 1053 -1098)
Charlotte NC Information Age Pub
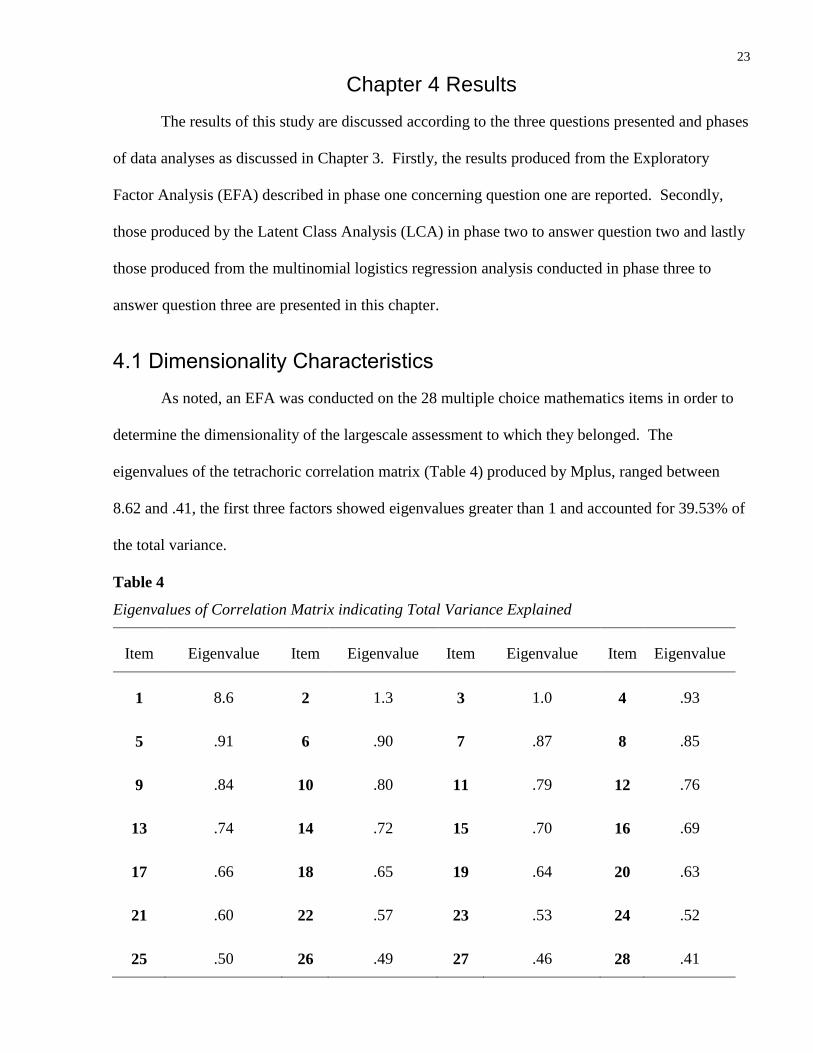
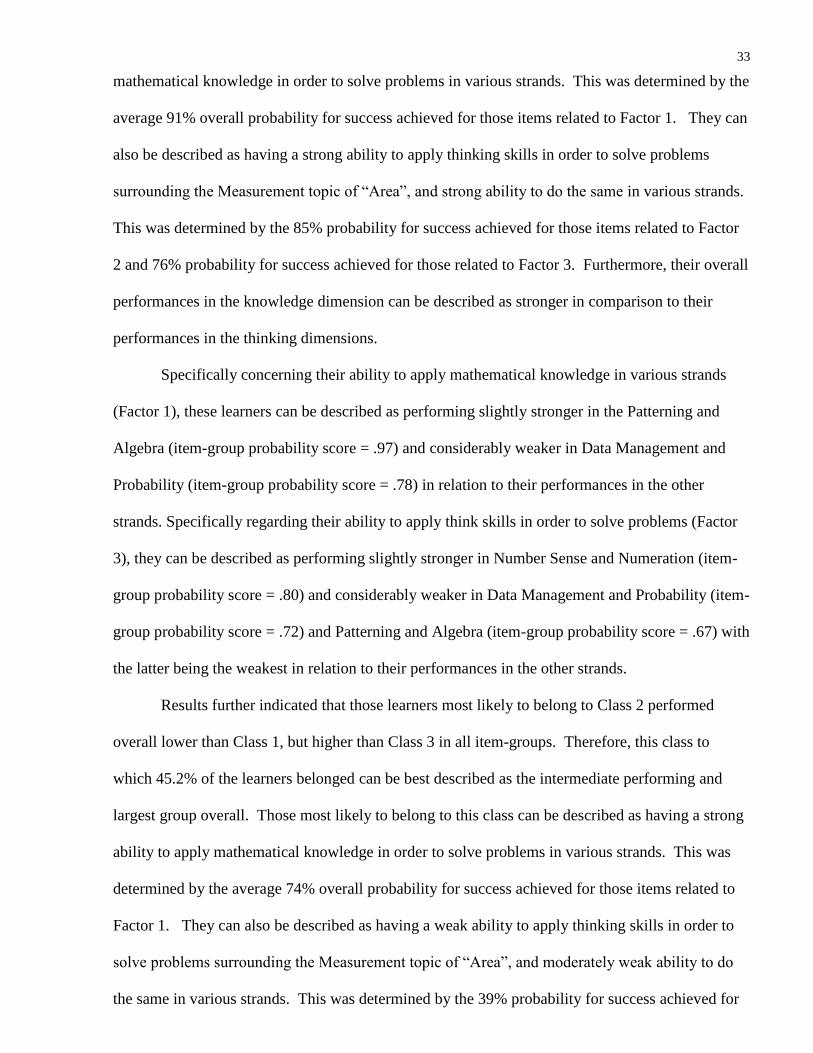
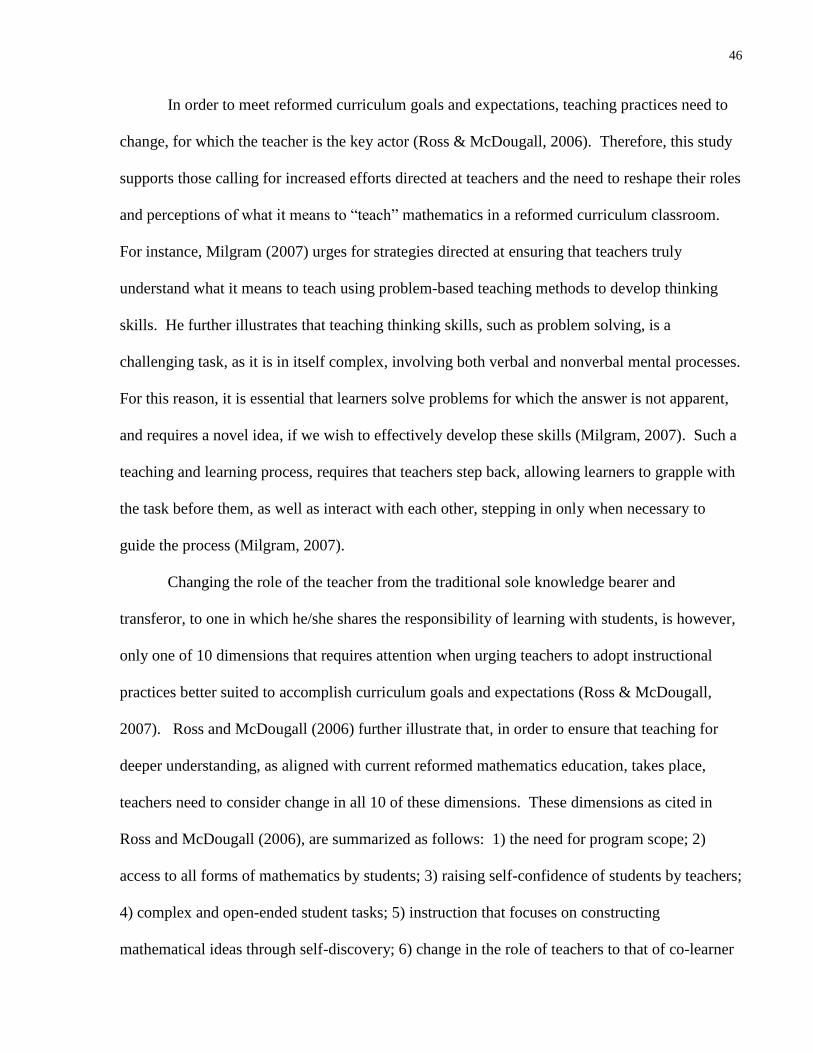