ontario professional planners institute act, 1994 -...
TRANSCRIPT

Town of Minto Integrated Sustainability Community Plan
Incite Planning Page 1 of 84 March 2011
© 2011, Town of Minto. All Rights Reserved. The preparation of this sustainable community plan was carried out with assistance from the Green Municipal Fund, a Fund financed by the Government of Canada and administered by the Federation of Canadian Municipalities. Notwithstanding this support, the views expressed are the personal views of the authors, and the Federation of Canadian Municipalities and the Government of Canada accept no responsibility for them.
This report has been prepared by:
David J. Stinson MCIP, RPP, A.Ag.
I hereby certify that this plan was prepared by a Registered Professional Planner, within the meaning of the Ontario Professional Planners Institute Act, 1994.
Date
_________________________ David J. Stinson
Town of Minto Integrated Sustainability Community Plan
Incite Planning Page 2 of 84 March 2011
Acknowledgements
I wish to thank the following for their assistance in bringing this plan to fruition: my business partner Colette Isaac, my collaborator & local liaison Jennifer Shergold, Treasurer Gordon Duff, Economic & Business Manager Belinda Wick-Grahams, Former Clerk Marsha Paley, Financial Administrative Assistant Kelli Hill, Recreational Programme Co-ordinator Matthew Lubbers, Rene Kleinecke from the Saugeen Valley Conservation Authority, Matthew Shetler from the Maitland Valley Conservation Authority, former Mayor David Anderson, former Deputy Mayor Judy Dirksen, former councillors Barbara Borrows and Wayne Martin, incumbent councillor Rick Hembly, and current Mayor George Bridge, the key informants, and colleagues Paul Nichol & Barry Cleave. Proviso The names of various individuals and companies are mentioned in this report. Incite Planning does not formally endorse the products, services, or points of view of these entities, but rather includes them as inspirational examples of those who are leading the way in various aspects of Sustainability.

Town of Minto Integrated Sustainability Community Plan
Incite Planning Page 3 of 84 March 2011
Table of Contents
INSPIRATION .......................................................................................................................... 6 ELEMENTS OF THE PLAN........................................................................................................ 7
Vision................................................................................................................................ 7 Themes.............................................................................................................................. 7 Goals................................................................................................................................. 7 Principles .......................................................................................................................... 8 Targets .............................................................................................................................. 8 Tasks & Timeline ............................................................................................................. 9
INTRODUCTION .................................................................................................................... 11 Background..................................................................................................................... 11 ISCP process in Minto.................................................................................................... 11
STAGE I: DECIDING PRIORITIES .......................................................................................... 13 Definition of Sustainability ............................................................................................ 13 Sustainability of Minto’s Vision Statement: .................................................................. 15 Sustainability of Minto’s Vision: ................................................................................... 16 Strategic TIPs ................................................................................................................. 16 Consultation.................................................................................................................... 19 Sustainability Priorities for Minto .................................................................................. 23
STAGE II: RESEARCHING PARAMETERS .............................................................................. 24 Population....................................................................................................................... 24 Food ................................................................................................................................ 36 Fiscal Responsibility....................................................................................................... 44 Main Street ..................................................................................................................... 49 Business .......................................................................................................................... 60 Social .............................................................................................................................. 67
STAGE III: IMPLEMENTING SOLUTIONS............................................................................... 72 Task Sheets ..................................................................................................................... 73 Monitoring Schedule ...................................................................................................... 79
SOURCES ............................................................................................................................. 80 APPENDICES ........................................................................................................................ 84
Town of Minto Integrated Sustainability Community Plan
Incite Planning Page 4 of 84 March 2011
Table of Figures
Figure 1: Timeline for Implementation ................................................................................ 9 Figure 2: Sustainable Development.................................................................................... 13 Figure 3: Developing Sustainably ...................................................................................... 14 Figure 4: Sustainability of Vision Statement...................................................................... 15 Figure 5: Sustainability of Vision....................................................................................... 16 Figure 6: List of Strategic Documents Analysed................................................................ 17 Figure 7: Strategic Documents with high level of problematic issues ............................... 17 Figure 8: Themes from Strategic Documents with high level of problematic issues......... 18 Figure 9: Problematic Themes from Strategic Documents ................................................ 18 Figure 10: Sustainability Phrases ....................................................................................... 19 Figure 11: Sustainability Themes ....................................................................................... 21 Figure 12: Sustainability Phrase Preferences ..................................................................... 22 Figure 13: Town of Minto - Population Pyramid - 2006.................................................... 25 Figure 14: Province of Ontario - Population Pyramid - 2006 ............................................ 26 Figure 15: Population Segments Comparison .................................................................... 26 Figure 16: Town of Minto - 15-year Population Forecast, based on historical growth rates............................................................................................................................................ 27 Figure 17: Size of the Earth................................................................................................ 28 Figure 18: Biologically Productive Area............................................................................ 28 Figure 19: Global Bio-capacity vs Ecological Footprint - Projection 2021 ....................... 30 Figure 20: Minto Bio-capacity vs Ecological Footprint - 2001.......................................... 31 Figure 21: Minto Bio-capacity vs Ecological Footprint - 2011.......................................... 31 Figure 22: Minto's Bio-capacity vs Ecological Footprint - Projection 2021...................... 32 Figure 23: Minto's Bio-capacity vs Ecological Footprint - High Growth Projection 2021 32 Figure 24: Livestock Industry Categories .......................................................................... 38 Figure 25: Crop Industry Categories .................................................................................. 38 Figure 26: Minto Cropland Use.......................................................................................... 39 Figure 27: Sustainability Matrix - Food ............................................................................. 42 Figure 28: Sources of Revenue, in Millions of Dollars...................................................... 45 Figure 29: Breakdown of Tax Revenue.............................................................................. 45 Figure 30: Sustainability Matrix – Fiscal Responsibility ................................................... 48 Figure 31: Downtown Clifford, with 2.5 and 5-minute walking distances ........................ 50 Figure 32: Downtown Harriston, with 2.5 and 5-minute walking distances ...................... 51 Figure 33: Downtown Palmerston, with 2.5 and 5-minute walking distances ................... 51 Figure 34: Is sprawl in Minto's future - should it be?......................................................... 53 Figure 35: Is this the beginning of sprawl in Minto? ......................................................... 53 Figure 36: Suburban Tim's in Minto that relies on automobile .......................................... 54 Figure 37: Urban Tim's in Listowel that supports walk-able downtown............................ 54 Figure 38: Intrusion of suburban form (single storey, parking lot) in urban core.............. 55
Town of Minto Integrated Sustainability Community Plan
Incite Planning Page 5 of 84 March 2011
Figure 39: Good store, great location, bad design (does not front onto street, single storey)............................................................................................................................................ 55 Figure 40: Public building, relegated to a side street ......................................................... 56 Figure 41: Empty space on Main Street ............................................................................. 56 Figure 42: Great building, but not located in the downtown.............................................. 57 Figure 43: Poorly sited building in downtown (does not face the street, non-commercial)............................................................................................................................................ 57 Figure 44: Major Employers in Minto................................................................................ 61 Figure 45: Employees by Business Sector ......................................................................... 62 Figure 46: Sustainability Matrix - Business ....................................................................... 65
Town of Minto Integrated Sustainability Community Plan
Incite Planning Page 6 of 84 March 2011
INSPIRATION
Tomorrow’s Child
Without a name, an unseen face and knowing not your time nor place
Tomorrow’s Child, though yet unborn, I met you first last Tuesday Morn.
A wise friend introduced us two,
and through his sobering point of view I saw a day that you would see, a day for you, but not for me.
Knowing you has changed my thinking,
for I never had an inkling That perhaps the things I do
might someday, somehow, threaten you.
Tomorrow’s Child, my daughter-son I’m afraid I’ve just begun
To think of you and of your good, Though always having known I should.
Begin I will to weigh the cost
of what I squander, what is lost If ever I forget that you
will someday come to live here too.
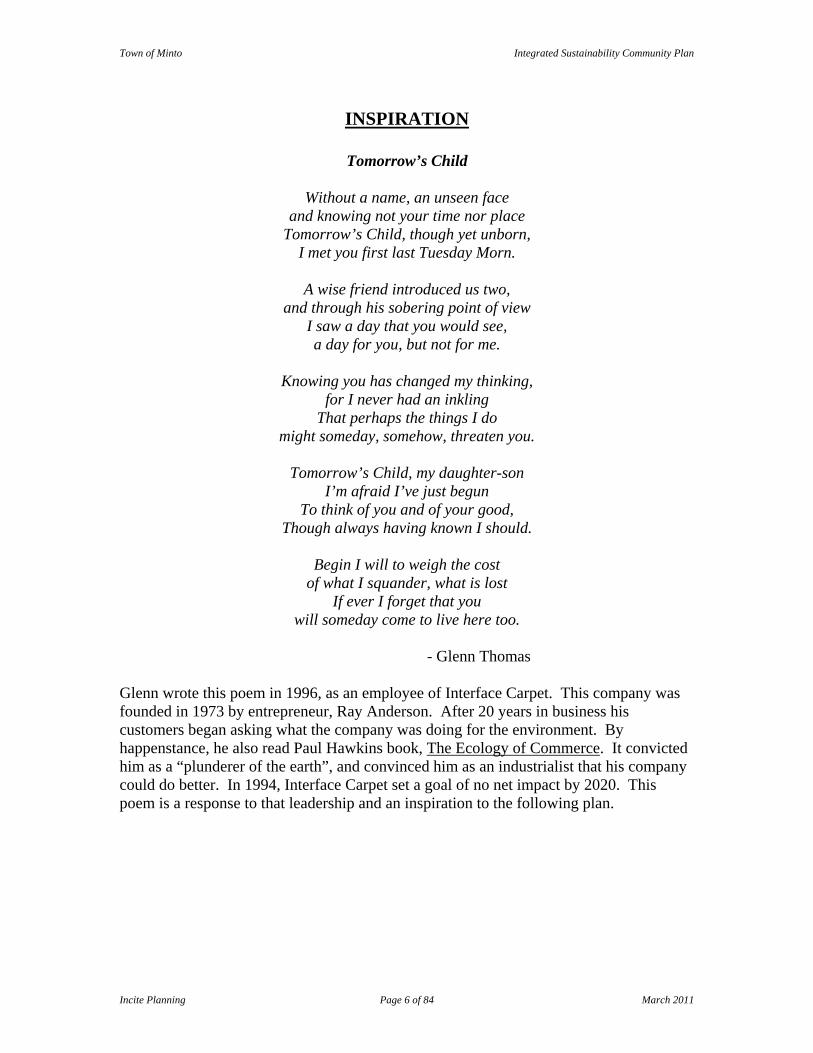
- Glenn Thomas Glenn wrote this poem in 1996, as an employee of Interface Carpet. This company was founded in 1973 by entrepreneur, Ray Anderson. After 20 years in business his customers began asking what the company was doing for the environment. By happenstance, he also read Paul Hawkins book, The Ecology of Commerce. It convicted him as a “plunderer of the earth”, and convinced him as an industrialist that his company could do better. In 1994, Interface Carpet set a goal of no net impact by 2020. This poem is a response to that leadership and an inspiration to the following plan.
Town of Minto Integrated Sustainability Community Plan
Incite Planning Page 7 of 84 March 2011
ELEMENTS OF THE PLAN
VISION The “Vision Statement” and “Vision” that the Town of Minto uses do express elements of sustainability and are fine for this plan. Indeed, the plan should be seen as an expression of them, and operating under them.
Minto…where your family belongs!
We celebrate the values of country living and community life. Neighbourliness and togetherness. Stability, safety and affordability.
Volunteerism for the benefit of each other, and the good of our town. Responsible economic growth. Respect for nature and what it provides.
These values are what make us unique, and what make the Town of Minto the community where families belong.
THEMES The following sustainability themes were derived from the analysis of Minto’s documents and vetted through the public consultation process:
1. Population 2. Food 3. Fiscal responsibility 4. Main Street 5. Business 6. Social
GOALS These themes were the basis of the following goals:
1. Grow to an optimum population that allows Minto to pay its bills, and take on new projects.
2. Use Minto’s agricultural abundance to nourish its land, its people, and its
livelihoods.
3. Pursue fiscal and ecological responsibility with equal diligence.
4. Build Main Streets that support the business and civic life of Minto.
Town of Minto Integrated Sustainability Community Plan
Incite Planning Page 8 of 84 March 2011
5. Create and retain enterprises that have low environmental impact and provide fulfilling jobs for the people of Minto.
6. Focus on the health and recreational well-being of the people of Minto.
PRINCIPLES To fulfill these goals it will be necessary to apply the following principles:
1. Population Projection a. Populations can be described b. Past growth predicts future growth
i. Analyse forecast to understand direction of current trends 2. Ecological Footprint
a. Human population depends on the biosphere b. Earth provides life support, resources, and waste assimilation
i. Calculate impact to understand direction of current levels of use 3. Fiscal Sustainability
a. Ecology and economy are mutually reinforcing. b. Fiscal tools should be used to support good stewardship.
i. Introduce fiscal measures that encourage environmental responsibility.
4. Smart Growth a. Neighbourhoods provide human habitat b. Urban sector should be encouraged
i. Design walk-able, dense, mixed-use streetscapes 5. Community Development
a. The community can help itself b. Most business development comes from within
i. Diagnose local economy for potential to create new ventures and jobs
TARGETS To fulfill these goals it will be necessary to achieve the following targets:
1. Population − Mitigate expected growth of 732 people by expanding pasture to 18% and forest to 40% − Recruit to desired growth level to an additional 2128 people − Evaluate ongoing impact of population growth
2. Food − Increase number of Organic Farms to national average of 6.8% or 20 farms − Shift livestock production to intensive rotational grazing to 18% or 5515 ha − Expand regional market for Ontario food by 1 venue − Recruit 10 new vendors to existing Farmer’s Market
Town of Minto Integrated Sustainability Community Plan
Incite Planning Page 9 of 84 March 2011
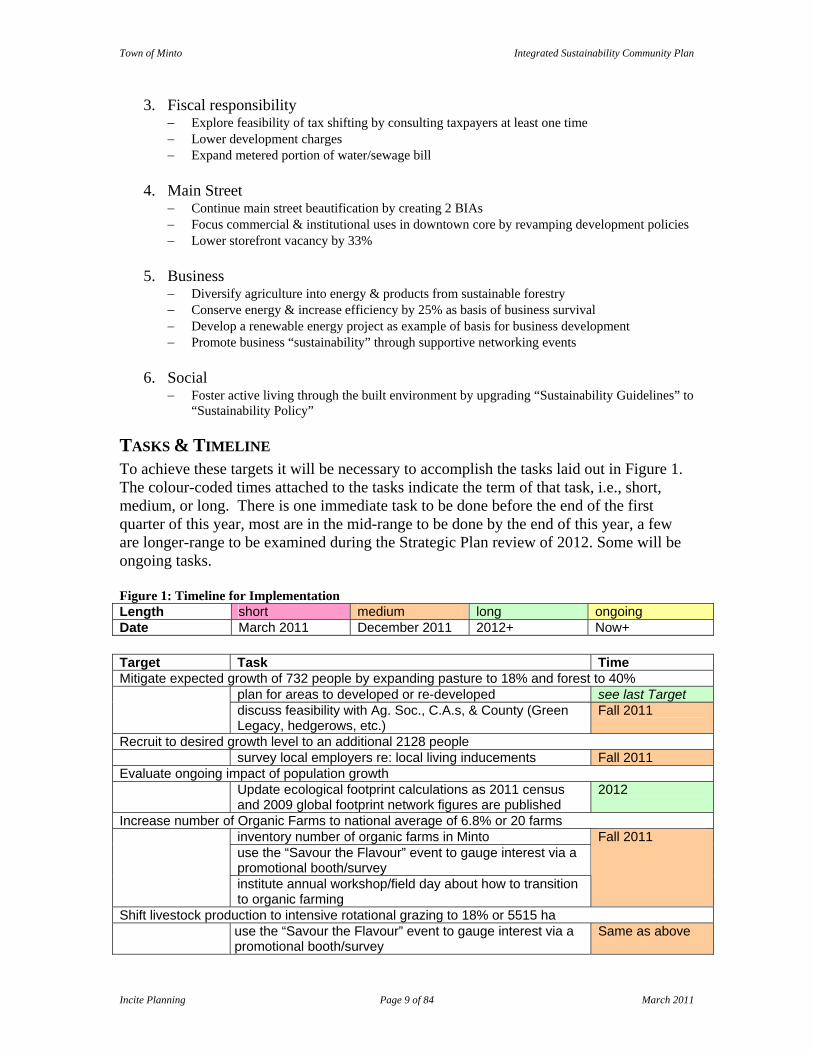
3. Fiscal responsibility − Explore feasibility of tax shifting by consulting taxpayers at least one time − Lower development charges − Expand metered portion of water/sewage bill
4. Main Street − Continue main street beautification by creating 2 BIAs − Focus commercial & institutional uses in downtown core by revamping development policies − Lower storefront vacancy by 33%
5. Business − Diversify agriculture into energy & products from sustainable forestry − Conserve energy & increase efficiency by 25% as basis of business survival − Develop a renewable energy project as example of basis for business development − Promote business “sustainability” through supportive networking events
6. Social − Foster active living through the built environment by upgrading “Sustainability Guidelines” to
“Sustainability Policy”
TASKS & TIMELINE To achieve these targets it will be necessary to accomplish the tasks laid out in Figure 1. The colour-coded times attached to the tasks indicate the term of that task, i.e., short, medium, or long. There is one immediate task to be done before the end of the first quarter of this year, most are in the mid-range to be done by the end of this year, a few are longer-range to be examined during the Strategic Plan review of 2012. Some will be ongoing tasks. Figure 1: Timeline for Implementation Length short medium long ongoing Date March 2011 December 2011 2012+ Now+ Target Task Time Mitigate expected growth of 732 people by expanding pasture to 18% and forest to 40%
plan for areas to developed or re-developed see last Target discuss feasibility with Ag. Soc., C.A.s, & County (Green Legacy, hedgerows, etc.)
Fall 2011
Recruit to desired growth level to an additional 2128 people survey local employers re: local living inducements Fall 2011
Evaluate ongoing impact of population growth Update ecological footprint calculations as 2011 census
and 2009 global footprint network figures are published 2012
Increase number of Organic Farms to national average of 6.8% or 20 farms inventory number of organic farms in Minto use the “Savour the Flavour” event to gauge interest via a promotional booth/survey institute annual workshop/field day about how to transition to organic farming
Fall 2011
Shift livestock production to intensive rotational grazing to 18% or 5515 ha
use the “Savour the Flavour” event to gauge interest via a promotional booth/survey
Same as above
Town of Minto Integrated Sustainability Community Plan
Incite Planning Page 10 of 84 March 2011
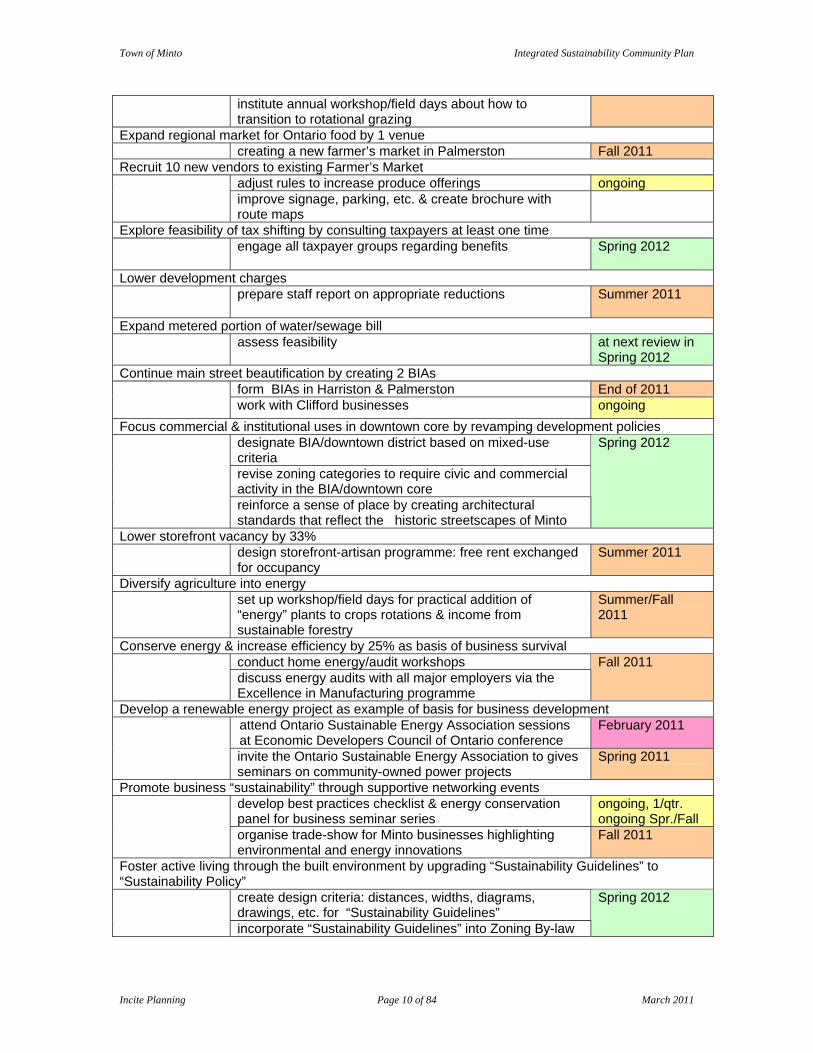
institute annual workshop/field days about how to transition to rotational grazing
Expand regional market for Ontario food by 1 venue creating a new farmer’s market in Palmerston Fall 2011
Recruit 10 new vendors to existing Farmer’s Market adjust rules to increase produce offerings ongoing improve signage, parking, etc. & create brochure with route maps
Explore feasibility of tax shifting by consulting taxpayers at least one time
engage all taxpayer groups regarding benefits Spring 2012
Lower development charges
prepare staff report on appropriate reductions Summer 2011
Expand metered portion of water/sewage bill
assess feasibility at next review in Spring 2012
Continue main street beautification by creating 2 BIAs form BIAs in Harriston & Palmerston End of 2011
work with Clifford businesses ongoing Focus commercial & institutional uses in downtown core by revamping development policies
designate BIA/downtown district based on mixed-use criteria revise zoning categories to require civic and commercial activity in the BIA/downtown core
reinforce a sense of place by creating architectural standards that reflect the historic streetscapes of Minto
Spring 2012
Lower storefront vacancy by 33% design storefront-artisan programme: free rent exchanged
for occupancy Summer 2011
Diversify agriculture into energy
set up workshop/field days for practical addition of “energy” plants to crops rotations & income from sustainable forestry
Summer/Fall 2011
Conserve energy & increase efficiency by 25% as basis of business survival conduct home energy/audit workshops
discuss energy audits with all major employers via the Excellence in Manufacturing programme
Fall 2011
Develop a renewable energy project as example of basis for business development attend Ontario Sustainable Energy Association sessions at Economic Developers Council of Ontario conference
February 2011
invite the Ontario Sustainable Energy Association to gives seminars on community-owned power projects
Spring 2011
Promote business “sustainability” through supportive networking events develop best practices checklist & energy conservation panel for business seminar series
ongoing, 1/qtr. ongoing Spr./Fall
organise trade-show for Minto businesses highlighting environmental and energy innovations
Fall 2011
Foster active living through the built environment by upgrading “Sustainability Guidelines” to “Sustainability Policy”
create design criteria: distances, widths, diagrams, drawings, etc. for “Sustainability Guidelines”
incorporate “Sustainability Guidelines” into Zoning By-law
Spring 2012
Town of Minto Integrated Sustainability Community Plan
Incite Planning Page 11 of 84 March 2011
INTRODUCTION
BACKGROUND Under the New Deal for Cities and Communities (2005), the federal government agreed to the transfer of Federal Gas Tax Revenues for environmentally-sustainable municipal infrastructure. To access these revenues, municipalities are required to do Integrated Sustainability Community Plans.
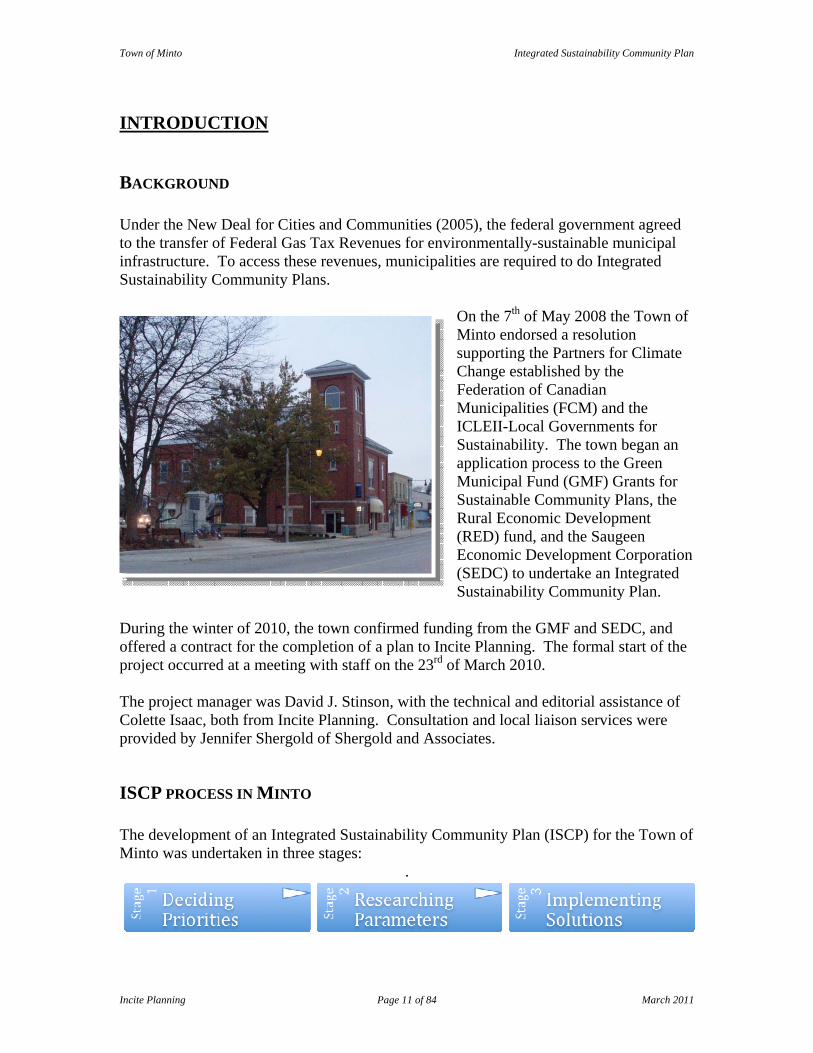
On the 7th of May 2008 the Town of Minto endorsed a resolution supporting the Partners for Climate Change established by the Federation of Canadian Municipalities (FCM) and the ICLEII-Local Governments for Sustainability. The town began an application process to the Green Municipal Fund (GMF) Grants for Sustainable Community Plans, the Rural Economic Development (RED) fund, and the Saugeen Economic Development Corporation (SEDC) to undertake an Integrated Sustainability Community Plan.
During the winter of 2010, the town confirmed funding from the GMF and SEDC, and offered a contract for the completion of a plan to Incite Planning. The formal start of the project occurred at a meeting with staff on the 23rd of March 2010. The project manager was David J. Stinson, with the technical and editorial assistance of Colette Isaac, both from Incite Planning. Consultation and local liaison services were provided by Jennifer Shergold of Shergold and Associates.
ISCP PROCESS IN MINTO The development of an Integrated Sustainability Community Plan (ISCP) for the Town of Minto was undertaken in three stages:
.

Town of Minto Integrated Sustainability Community Plan
Incite Planning Page 12 of 84 March 2011
Deciding Priorities To start, sustainability was defined to encompass both subjective and objective characteristics. This definition was used to examine the Town’s vision, and set the stage for a thorough review of its strategic documents in which themes were noted, issues listed, and problems flagged. These were summarised and reclassified into sustainability themes that were then reviewed with the Town’s Environment and Energy Committee as well as Council. Key informant interviews were done with opinion leaders and a public survey was undertaken. All of this was used to elucidate the goals for the Plan.
Researching Parameters The Goals of this plan were derived from the subjective aspirations and priorities of the people of Minto. Each goal was carefully researched to help understand it in order to determine reasonable targets. The Targets are measurable objectives intended to fulfil each goal, which in turn helped to scope out necessary tasks.
Implementing Solutions A list of tasks was created. The Tasks are a set of management activities intended to achieve the targets. A timeline and monitoring schedule was also included, to help implement the Plan.
Town of Minto Integrated Sustainability Community Plan
Incite Planning Page 13 of 84 March 2011
STAGE I: DECIDING PRIORITIES This section outlines our efforts to determine what the priorities of Minto are, there relationship to Sustainability, and how important Sustainability is to the people of Minto.
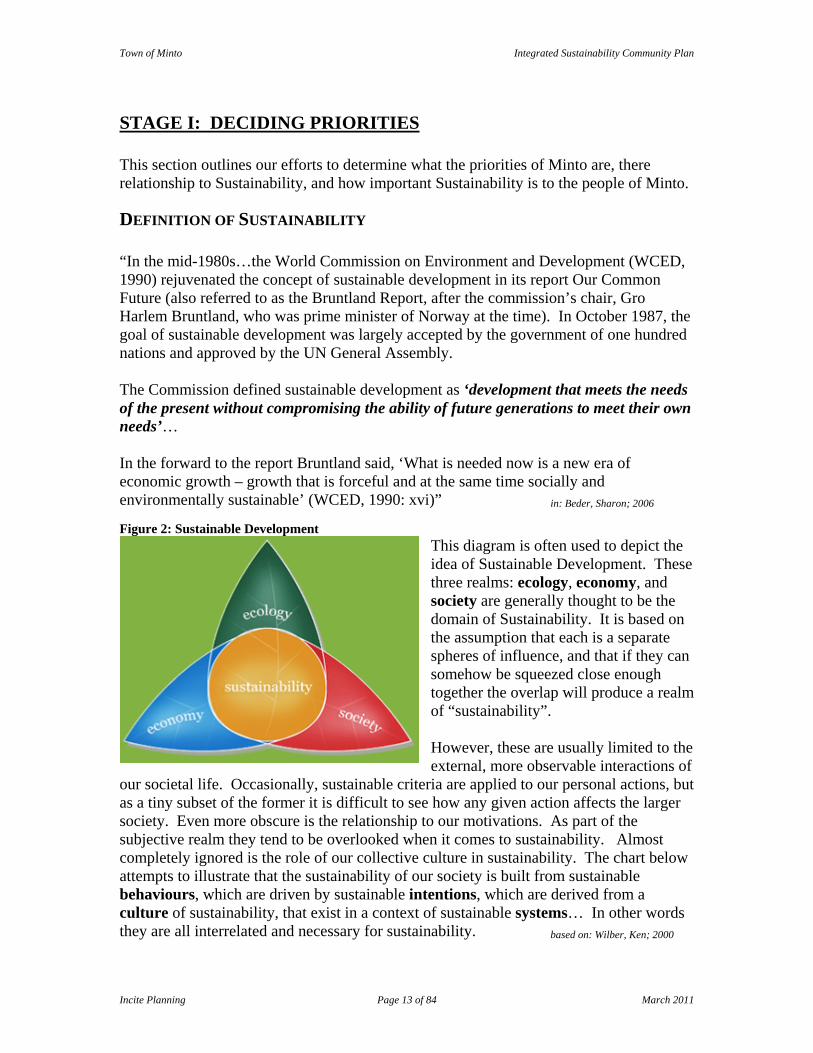
DEFINITION OF SUSTAINABILITY “In the mid-1980s…the World Commission on Environment and Development (WCED, 1990) rejuvenated the concept of sustainable development in its report Our Common Future (also referred to as the Bruntland Report, after the commission’s chair, Gro Harlem Bruntland, who was prime minister of Norway at the time). In October 1987, the goal of sustainable development was largely accepted by the government of one hundred nations and approved by the UN General Assembly. The Commission defined sustainable development as ‘development that meets the needs of the present without compromising the ability of future generations to meet their own needs’… In the forward to the report Bruntland said, ‘What is needed now is a new era of economic growth – growth that is forceful and at the same time socially and environmentally sustainable’ (WCED, 1990: xvi)” in: Beder, Sharon; 2006 Figure 2: Sustainable Development
This diagram is often used to depict the idea of Sustainable Development. These three realms: ecology, economy, and society are generally thought to be the domain of Sustainability. It is based on the assumption that each is a separate spheres of influence, and that if they can somehow be squeezed close enough together the overlap will produce a realm of “sustainability”. However, these are usually limited to the external, more observable interactions of
our societal life. Occasionally, sustainable criteria are applied to our personal actions, but as a tiny subset of the former it is difficult to see how any given action affects the larger society. Even more obscure is the relationship to our motivations. As part of the subjective realm they tend to be overlooked when it comes to sustainability. Almost completely ignored is the role of our collective culture in sustainability. The chart below attempts to illustrate that the sustainability of our society is built from sustainable behaviours, which are driven by sustainable intentions, which are derived from a culture of sustainability, that exist in a context of sustainable systems… In other words they are all interrelated and necessary for sustainability. based on: Wilber, Ken; 2000
Town of Minto Integrated Sustainability Community Plan
Incite Planning Page 14 of 84 March 2011
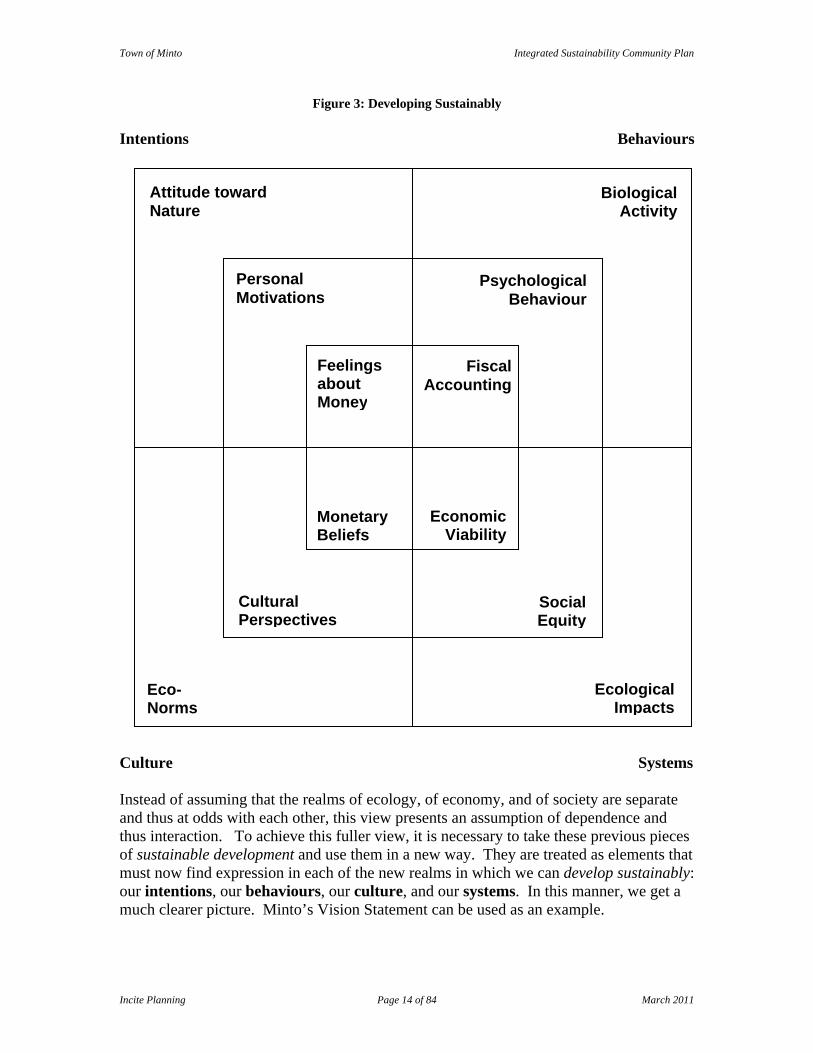
Figure 3: Developing Sustainably Intentions Behaviours Culture Systems Instead of assuming that the realms of ecology, of economy, and of society are separate and thus at odds with each other, this view presents an assumption of dependence and thus interaction. To achieve this fuller view, it is necessary to take these previous pieces of sustainable development and use them in a new way. They are treated as elements that must now find expression in each of the new realms in which we can develop sustainably: our intentions, our behaviours, our culture, and our systems. In this manner, we get a much clearer picture. Minto’s Vision Statement can be used as an example.
Feelings about Money
Fiscal Accounting
Monetary Beliefs
Economic Viability
Cultural Perspectives
Social Equity
Eco- Norms
Ecological Impacts
Attitude toward Nature
Biological Activity
Personal Motivations
Psychological Behaviour
Town of Minto Integrated Sustainability Community Plan
Incite Planning Page 15 of 84 March 2011
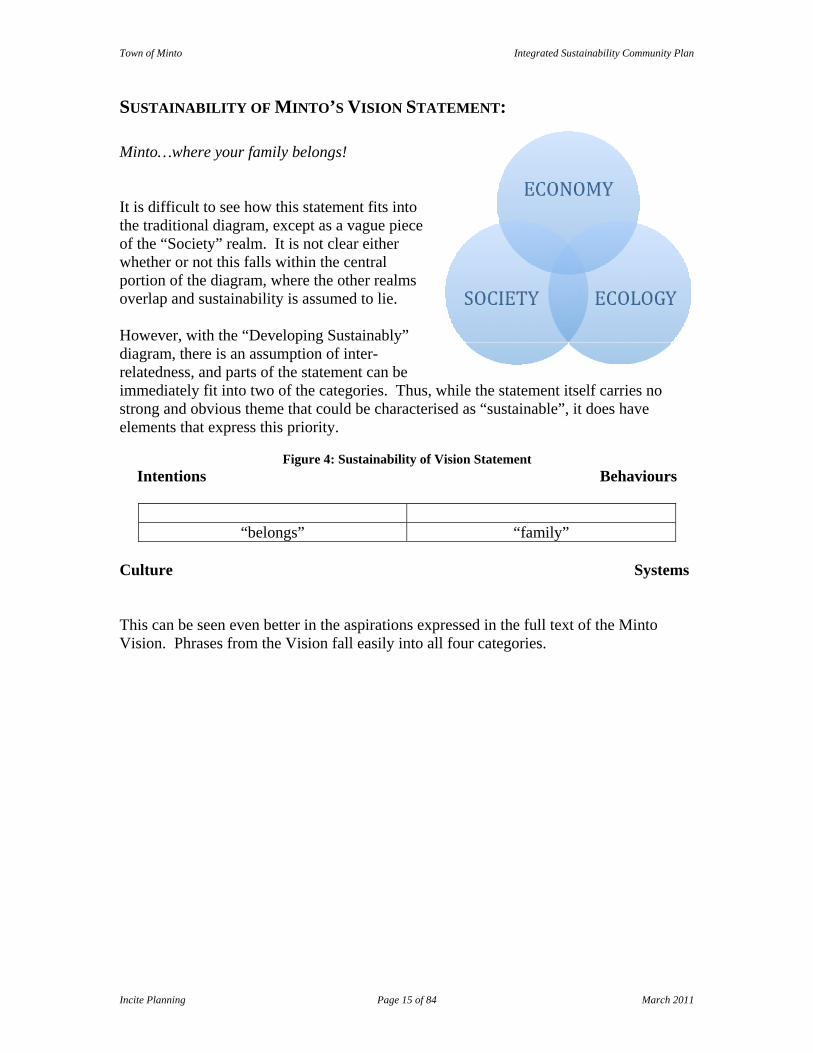
SUSTAINABILITY OF MINTO’S VISION STATEMENT: Minto…where your family belongs! It is difficult to see how this statement fits into the traditional diagram, except as a vague piece of the “Society” realm. It is not clear either whether or not this falls within the central portion of the diagram, where the other realms overlap and sustainability is assumed to lie. However, with the “Developing Sustainably” diagram, there is an assumption of inter-relatedness, and parts of the statement can be immediately fit into two of the categories. Thus, while the statement itself carries no strong and obvious theme that could be characterised as “sustainable”, it does have elements that express this priority.
Figure 4: Sustainability of Vision Statement Intentions Behaviours
“belongs” “family” Culture Systems This can be seen even better in the aspirations expressed in the full text of the Minto Vision. Phrases from the Vision fall easily into all four categories.
Town of Minto Integrated Sustainability Community Plan
Incite Planning Page 16 of 84 March 2011
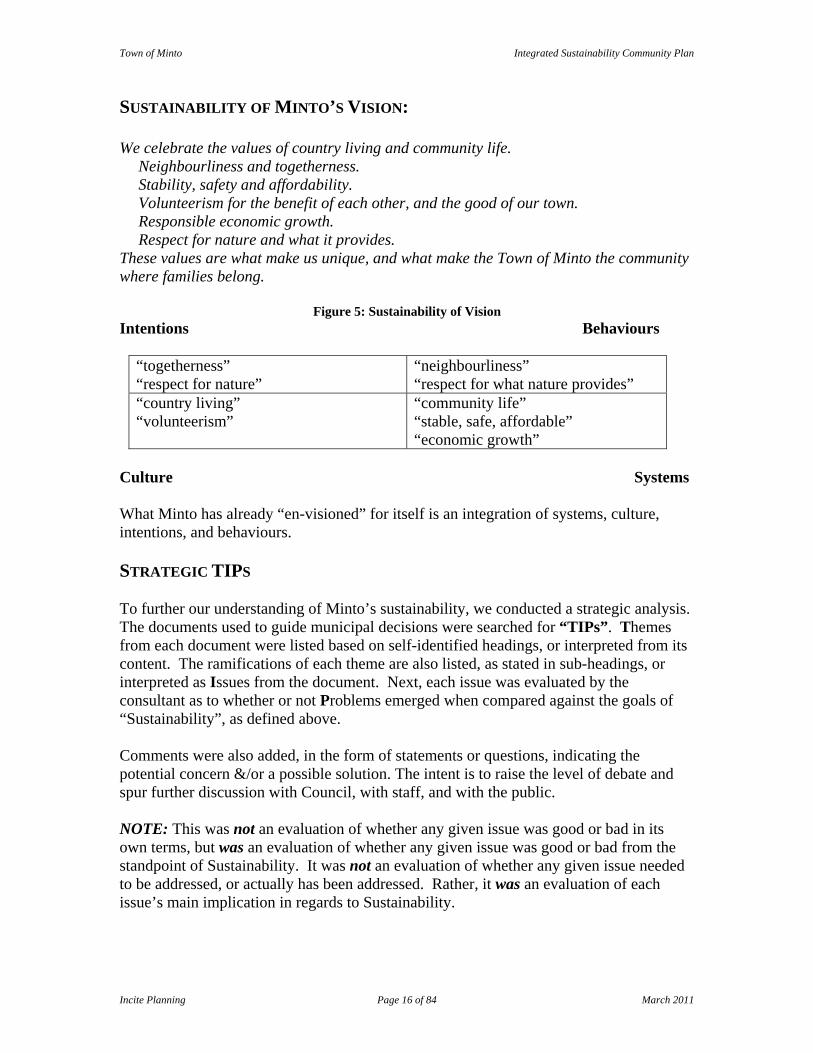
SUSTAINABILITY OF MINTO’S VISION: We celebrate the values of country living and community life. Neighbourliness and togetherness. Stability, safety and affordability.
Volunteerism for the benefit of each other, and the good of our town. Responsible economic growth. Respect for nature and what it provides. These values are what make us unique, and what make the Town of Minto the community where families belong.
Figure 5: Sustainability of Vision Intentions Behaviours
“togetherness” “respect for nature”
“neighbourliness” “respect for what nature provides”
“country living” “volunteerism”
“community life” “stable, safe, affordable” “economic growth”
Culture Systems What Minto has already “en-visioned” for itself is an integration of systems, culture, intentions, and behaviours. STRATEGIC TIPS To further our understanding of Minto’s sustainability, we conducted a strategic analysis. The documents used to guide municipal decisions were searched for “TIPs”. Themes from each document were listed based on self-identified headings, or interpreted from its content. The ramifications of each theme are also listed, as stated in sub-headings, or interpreted as Issues from the document. Next, each issue was evaluated by the consultant as to whether or not Problems emerged when compared against the goals of “Sustainability”, as defined above. Comments were also added, in the form of statements or questions, indicating the potential concern &/or a possible solution. The intent is to raise the level of debate and spur further discussion with Council, with staff, and with the public. NOTE: This was not an evaluation of whether any given issue was good or bad in its own terms, but was an evaluation of whether any given issue was good or bad from the standpoint of Sustainability. It was not an evaluation of whether any given issue needed to be addressed, or actually has been addressed. Rather, it was an evaluation of each issue’s main implication in regards to Sustainability.
Town of Minto Integrated Sustainability Community Plan
Incite Planning Page 17 of 84 March 2011
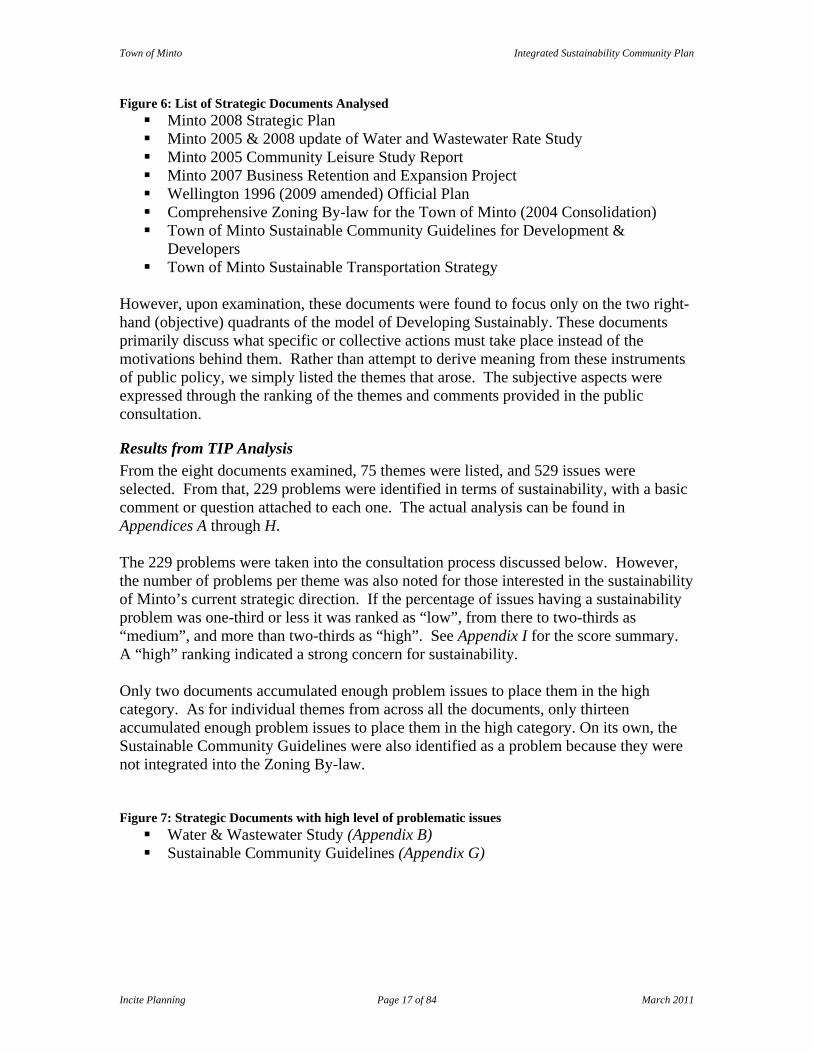
Figure 6: List of Strategic Documents Analysed Minto 2008 Strategic Plan Minto 2005 & 2008 update of Water and Wastewater Rate Study Minto 2005 Community Leisure Study Report Minto 2007 Business Retention and Expansion Project Wellington 1996 (2009 amended) Official Plan Comprehensive Zoning By-law for the Town of Minto (2004 Consolidation) Town of Minto Sustainable Community Guidelines for Development &
Developers Town of Minto Sustainable Transportation Strategy
However, upon examination, these documents were found to focus only on the two right-hand (objective) quadrants of the model of Developing Sustainably. These documents primarily discuss what specific or collective actions must take place instead of the motivations behind them. Rather than attempt to derive meaning from these instruments of public policy, we simply listed the themes that arose. The subjective aspects were expressed through the ranking of the themes and comments provided in the public consultation.
Results from TIP Analysis From the eight documents examined, 75 themes were listed, and 529 issues were selected. From that, 229 problems were identified in terms of sustainability, with a basic comment or question attached to each one. The actual analysis can be found in Appendices A through H. The 229 problems were taken into the consultation process discussed below. However, the number of problems per theme was also noted for those interested in the sustainability of Minto’s current strategic direction. If the percentage of issues having a sustainability problem was one-third or less it was ranked as “low”, from there to two-thirds as “medium”, and more than two-thirds as “high”. See Appendix I for the score summary. A “high” ranking indicated a strong concern for sustainability. Only two documents accumulated enough problem issues to place them in the high category. As for individual themes from across all the documents, only thirteen accumulated enough problem issues to place them in the high category. On its own, the Sustainable Community Guidelines were also identified as a problem because they were not integrated into the Zoning By-law. Figure 7: Strategic Documents with high level of problematic issues
Water & Wastewater Study (Appendix B) Sustainable Community Guidelines (Appendix G)
Town of Minto Integrated Sustainability Community Plan
Incite Planning Page 18 of 84 March 2011
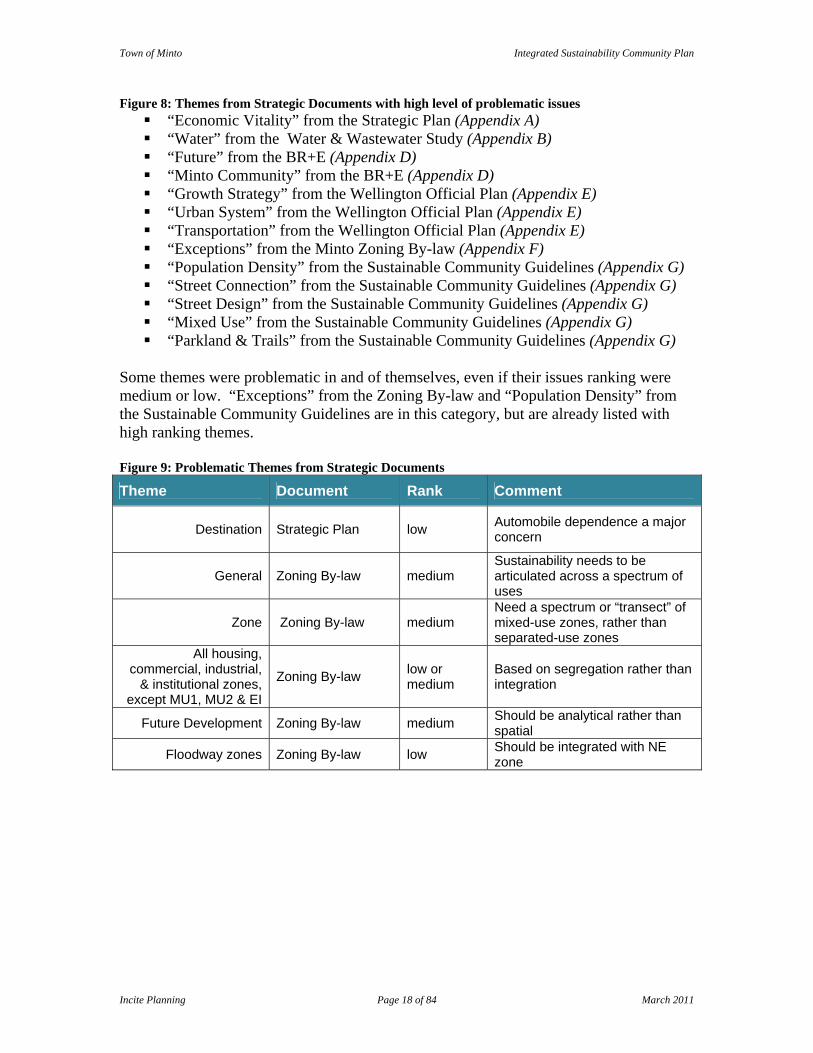
Figure 8: Themes from Strategic Documents with high level of problematic issues “Economic Vitality” from the Strategic Plan (Appendix A) “Water” from the Water & Wastewater Study (Appendix B) “Future” from the BR+E (Appendix D) “Minto Community” from the BR+E (Appendix D) “Growth Strategy” from the Wellington Official Plan (Appendix E) “Urban System” from the Wellington Official Plan (Appendix E) “Transportation” from the Wellington Official Plan (Appendix E) “Exceptions” from the Minto Zoning By-law (Appendix F) “Population Density” from the Sustainable Community Guidelines (Appendix G) “Street Connection” from the Sustainable Community Guidelines (Appendix G) “Street Design” from the Sustainable Community Guidelines (Appendix G) “Mixed Use” from the Sustainable Community Guidelines (Appendix G) “Parkland & Trails” from the Sustainable Community Guidelines (Appendix G)
Some themes were problematic in and of themselves, even if their issues ranking were medium or low. “Exceptions” from the Zoning By-law and “Population Density” from the Sustainable Community Guidelines are in this category, but are already listed with high ranking themes. Figure 9: Problematic Themes from Strategic Documents
Theme Document Rank Comment
Destination
Strategic Plan low Automobile dependence a major concern
General Zoning By-law medium Sustainability needs to be articulated across a spectrum of uses
Zone Zoning By-law medium Need a spectrum or “transect” of mixed-use zones, rather than separated-use zones
All housing, commercial, industrial,
& institutional zones, except MU1, MU2 & EI
Zoning By-law low or medium
Based on segregation rather than integration
Future Development Zoning By-law medium Should be analytical rather than spatial
Floodway zones Zoning By-law low Should be integrated with NE zone

Town of Minto Integrated Sustainability Community Plan
Incite Planning Page 19 of 84 March 2011
CONSULTATION
Environment and Energy Committee (EEC) The 229 issues flagged for sustainability problems were summarised down to 129 issues and then regrouped into15 sustainability themes, 8 main-themes with 7 associated sub-themes. We discussed these with the Environment and Energy Committee and were able to resolve several issues, reducing the number to 123. The intent of this working session was to select themes that were priorities for Minto. See Appendix J for a summary of that discussion.
Council We also made a presentation to Council, as an introduction to the project and as a request for them to privately select three to five sustainability themes that they felt were most important to Minto. See Appendix K for the handout.
Key Informant Interviews The EEC helped to select opinion leaders in the community who were then contacted and interviewed regarding their thoughts on sustainability. We asked them to comment on the adequacy of the UN definition of sustainability, to select and discus their top three to five priorities from the list of sustainability themes, or add missing ones. To gain an understanding of some the different ways that people express their beliefs and feelings about the elements of sustainability they were also asked to choose their 1st & 2nd preferences from the statements below: Figure 10: Sustainability Phrases
Ecology Society Economy
defend the land protect the clan gather the wealth
respect our earth honour our families provide work for us
use resources wisely grant rights to individuals get return on investment
care for whole world embrace every culture create job for everyone
love this planet acknowledge all beings make livelihoods based on: Brown, Barrett C; 2004 See Appendix L for the interview questionnaire.
Public Meetings Public meetings were also held in the three main communities of Clifford, Palmerston, and Harriston. Participants were asked to select and discuss their top three to five priorities from the list of sustainability themes. See Appendix M for the Public Meeting Hand-out.
Town of Minto Integrated Sustainability Community Plan
Incite Planning Page 20 of 84 March 2011
We had hoped that these meetings would be the “cap-stone” events of the priority-setting phase. However, attendance was very low (10), and we felt that adequate goals could not be written based on the participation of so few. The meetings were advertised at the Council presentation, in the local paper, and though flyers sent to our key informants. The project received some media coverage in the form of a TV interview after the Council presentation and several stories in the local press. Nevertheless, the late start of the project pushed this phase of consultation into a period of pleasant spring weather, which we suspect may have reduced the community’s participation. Yet, those who came out were enthusiastic and we learned a great deal about Minto and its concerns.
Community Survey Originally, we were going to use the survey to help scope targets for the plan. But since the themes that were emerging were backed by too few opinions, we used the survey to confirm the community’s priorities. Citizens from Minto were asked to select their top three or four priorities from the list of sustainability themes which had been collapsed from 15 themes down to 10 themes. We also asked them to rank the priorities that had emerged from the consultations to date, and add any that they felt were missing. See Appendix O for the Community Survey Questionnaire. We chose to use an availability sample, using on-street interviews. We rejected the Phone Interview as the complexity of the topic did not lend itself to this approach; besides which land-lines (i.e., complete phone listings) are becoming less common, and a distinct part of the population (Old-order Mennonites) do not have them. We also rejected the Mail-out Survey, as they have an atrociously low return rate for the expenditure involved.
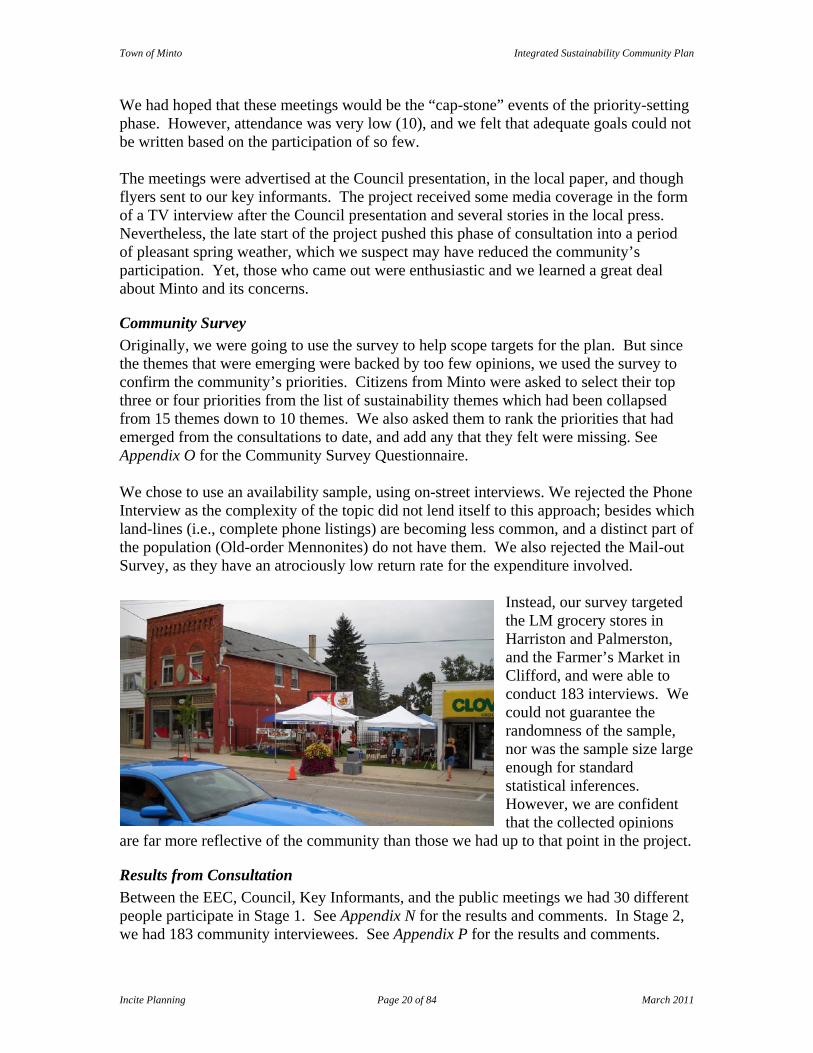
Instead, our survey targeted the LM grocery stores in Harriston and Palmerston, and the Farmer’s Market in Clifford, and were able to conduct 183 interviews. We could not guarantee the randomness of the sample, nor was the sample size large enough for standard statistical inferences. However, we are confident that the collected opinions
are far more reflective of the community than those we had up to that point in the project.
Results from Consultation Between the EEC, Council, Key Informants, and the public meetings we had 30 different people participate in Stage 1. See Appendix N for the results and comments. In Stage 2, we had 183 community interviewees. See Appendix P for the results and comments.
Town of Minto Integrated Sustainability Community Plan
Incite Planning Page 21 of 84 March 2011
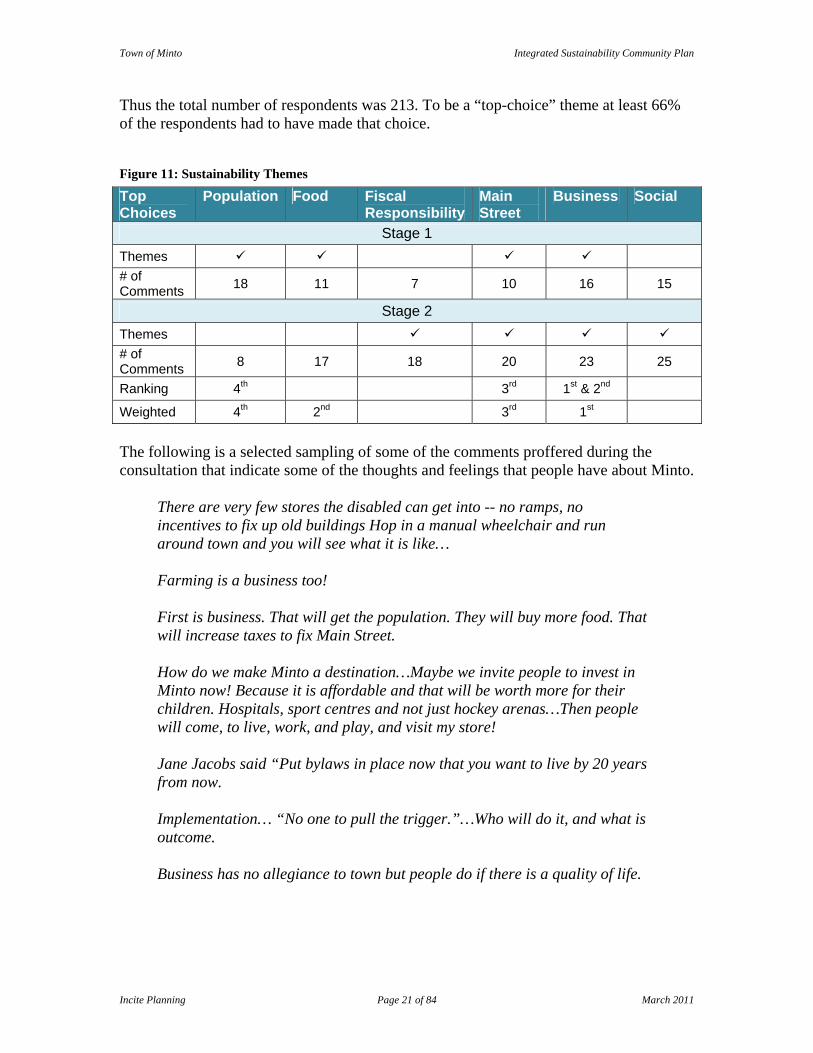
Thus the total number of respondents was 213. To be a “top-choice” theme at least 66% of the respondents had to have made that choice. Figure 11: Sustainability Themes
The following is a selected sampling of some of the comments proffered during the consultation that indicate some of the thoughts and feelings that people have about Minto.
There are very few stores the disabled can get into -- no ramps, no incentives to fix up old buildings Hop in a manual wheelchair and run around town and you will see what it is like… Farming is a business too! First is business. That will get the population. They will buy more food. That will increase taxes to fix Main Street. How do we make Minto a destination…Maybe we invite people to invest in Minto now! Because it is affordable and that will be worth more for their children. Hospitals, sport centres and not just hockey arenas…Then people will come, to live, work, and play, and visit my store! Jane Jacobs said “Put bylaws in place now that you want to live by 20 years from now. Implementation… “No one to pull the trigger.”…Who will do it, and what is outcome. Business has no allegiance to town but people do if there is a quality of life.
Top Choices
Population Food Fiscal Responsibility
Main Street
Business Social
Stage 1 Themes # of Comments 18 11 7 10 16 15
Stage 2 Themes # of Comments 8 17 18 20 23 25
Ranking 4th 3rd 1st & 2nd
Weighted 4th 2nd 3rd 1st
Town of Minto Integrated Sustainability Community Plan
Incite Planning Page 22 of 84 March 2011
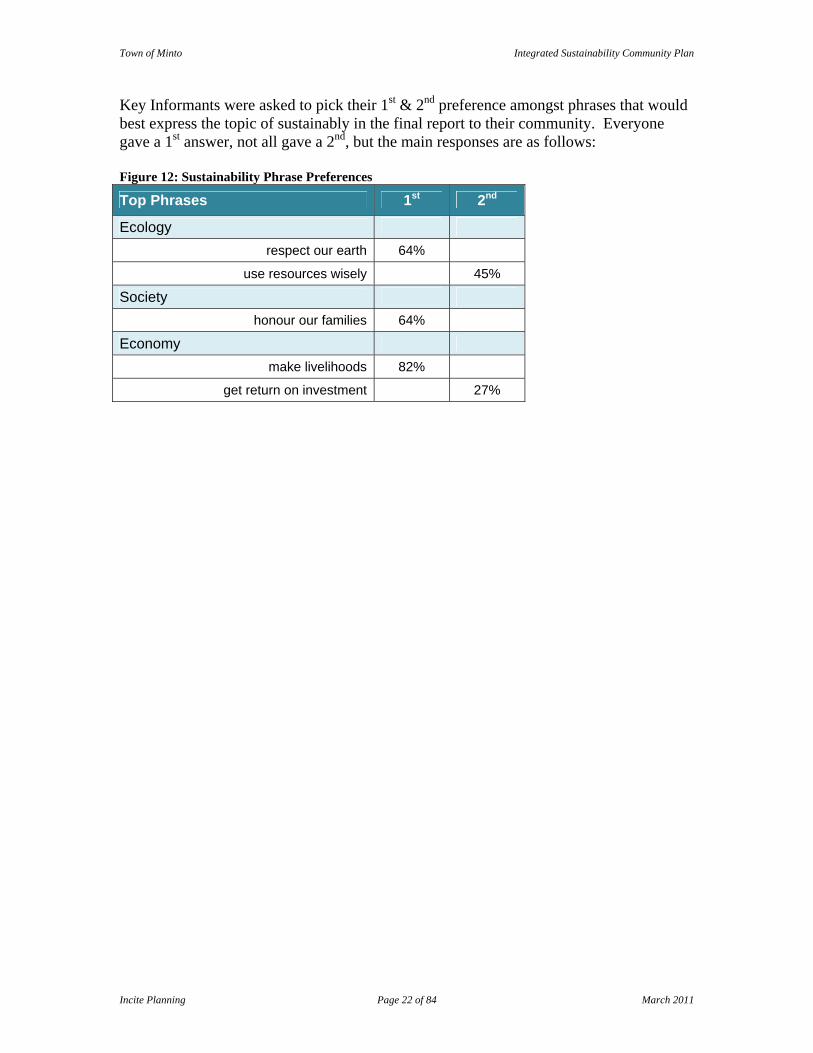
Key Informants were asked to pick their 1st & 2nd preference amongst phrases that would best express the topic of sustainably in the final report to their community. Everyone gave a 1st answer, not all gave a 2nd, but the main responses are as follows: Figure 12: Sustainability Phrase Preferences
Top Phrases 1st 2nd
Ecology respect our earth 64%
use resources wisely 45%
Society honour our families 64%
Economy make livelihoods 82%
get return on investment 27%

Town of Minto Integrated Sustainability Community Plan
Incite Planning Page 23 of 84 March 2011
SUSTAINABILITY PRIORITIES FOR MINTO Based on the Stage 1 consultation with the leaders of Minto and the Stage 2 consultation with people of Minto the following priorities emerged. Interpreted through a ‘sustainability lens’, these goals for the Town of Minto were developed: Population Though Population emerged in Stage 1, it was not prominent in Stage 2. However, as a topic it is foundational to sustainability and thus was included as a parameter.
Goal: Grow to an optimum population that allows Minto to pay its bills, and take on new projects.
Food Food emerged in Stage 1 and slips below prominence in Stage 2, but just barely. It is an important topic in sustainability and thus was included as a parameter.
Goal: Use Minto’s agricultural abundance to nourish its land, its people, and its livelihoods.
Fiscal Responsibility Fiscal Responsibility was just under prominence in Stage 1, but strongly emerged in Stage 2. It is a part of the definition of sustainability and thus was included as a parameter.
Goal: Pursue fiscal and ecological responsibility with equal diligence.
Main Street Main Street was prominent in both Stage 1 and Stage 2. As a topic, it is a large part of developing sustainability and thus was included as a parameter.
Goal: Build Main Streets that support the business and civic life of Minto.
Business Business strongly emerged in both Stage 1 and Stage 2. As a topic, it is a large part of developing sustainability and thus was included as a parameter.
Goal: Create and retain enterprises that have low environmental impact and provide fulfilling jobs for the people of Minto.
Social Social was just beneath prominence in Stage 1, but emerged in Stage 2. It is a part of the definition of sustainability and thus was included as a parameter.
Goal: Focus on the health and recreational well-being of the people of Minto.
Town of Minto Integrated Sustainability Community Plan
Incite Planning Page 24 of 84 March 2011
STAGE II: RESEARCHING PARAMETERS This section examines the extent of, and limits to, the sustainability priorities chosen in the consultation process.
Population
The TIP analysis discovered variations in the estimates of Minto’s population growth and questioned the notion of growth itself. It challenged the “planning by numbers” approach to grow in favour of managing population density through design. It proffered the proactive placement of housing along a spectrum of development with various styles, affordability, and ownership. See “Population Theme” in Appendix J for a list of the issues and the documents from which they came. To understand this priority better, a population profile, population structure, population projection, and an ecological footprint was prepared.
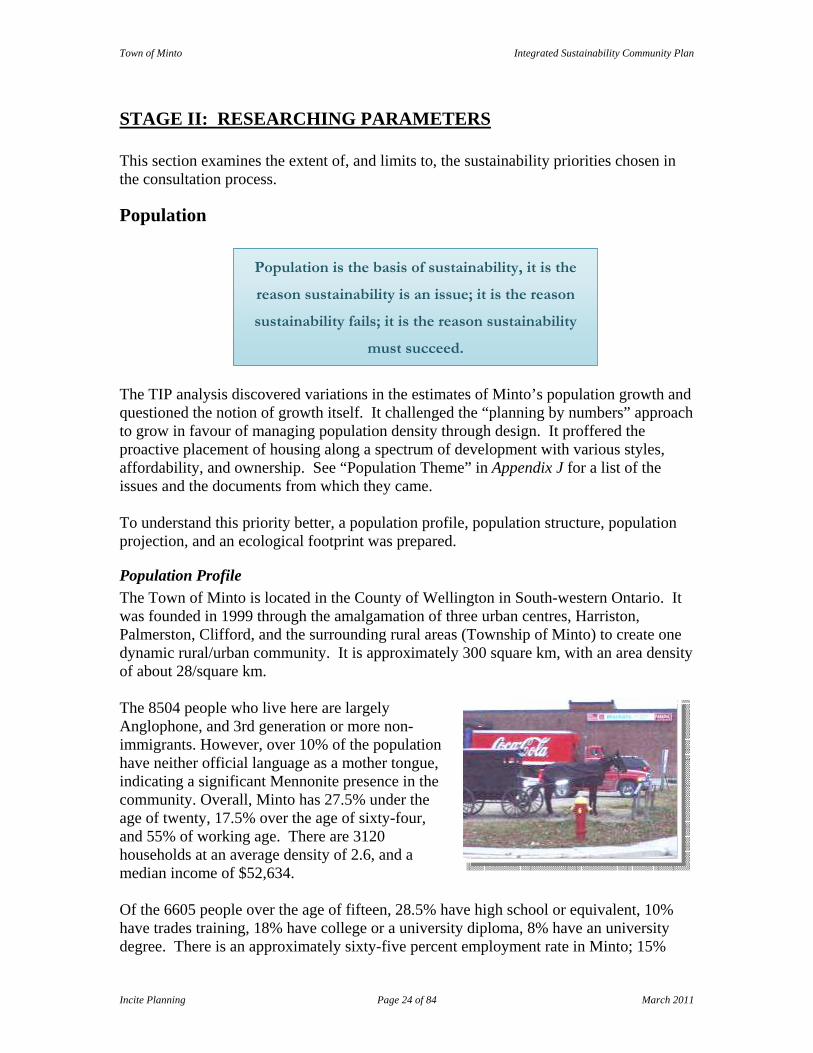
Population Profile The Town of Minto is located in the County of Wellington in South-western Ontario. It was founded in 1999 through the amalgamation of three urban centres, Harriston, Palmerston, Clifford, and the surrounding rural areas (Township of Minto) to create one dynamic rural/urban community. It is approximately 300 square km, with an area density of about 28/square km. The 8504 people who live here are largely Anglophone, and 3rd generation or more non-immigrants. However, over 10% of the population have neither official language as a mother tongue, indicating a significant Mennonite presence in the community. Overall, Minto has 27.5% under the age of twenty, 17.5% over the age of sixty-four, and 55% of working age. There are 3120 households at an average density of 2.6, and a median income of $52,634. Of the 6605 people over the age of fifteen, 28.5% have high school or equivalent, 10% have trades training, 18% have college or a university diploma, 8% have an university degree. There is an approximately sixty-five percent employment rate in Minto; 15%
Population is the basis of sustainability, it is the
reason sustainability is an issue; it is the reason
sustainability fails; it is the reason sustainability
must succeed.

Town of Minto Integrated Sustainability Community Plan
Incite Planning Page 25 of 84 March 2011
work in agriculture, 7.5% in construction, 23% in manufacturing, 14% in wholesale or retail, 22.5% in finance, real estate, business, or "other", and 16.5% in health or education. There were 16.5% who worked at home, 29% who worked within Minto and 44% outside of Minto, 10% worked beyond Ontario or had no fixed work address. Of those with a usual work address, or no fixed work address, 80.5% drove alone to their job and approximately 7.5% car-pooled, 10.5% walked or rode a bicycle, approximately 0.5% took public transit, and 1% used something else. Earnings counted for 75% of income. Of those over fifteen, 57% earned an income, the median being $24,860. There were 34% with full-time work, and the median was $35,660. There was 8% of the population in the low income bracket (~4%, after tax), and approximately 9% of children under eighteen in the same category (~5%, after tax).
Population Structure Below are two population pyramids that compare the age and sex structure of the populations of Minto and Ontario. Both have a shape reminiscent of an hour-glass. The top bulge indicates twenty years of the so-called “baby boom” that began when WWII veterans returned to Canada in 1946. The bottom bulge indicates the “echo’ generation born of the “boomer” generation. The pyramidal shape on the top half indicates a growing group of seniors. The inverted pyramid at the bottom represents a decline in the number of youth and suggests a slowing trend in population growth overall. Figure 13: Town of Minto - Population Pyramid - 2006
400 300 200 100 0 100 200 300 400
0-4
10-14
20-24
30-34
40-44
50-54
60-64
70-74
80-84
MALES FEMALES# of individuals
Town of Minto Integrated Sustainability Community Plan
Incite Planning Page 26 of 84 March 2011
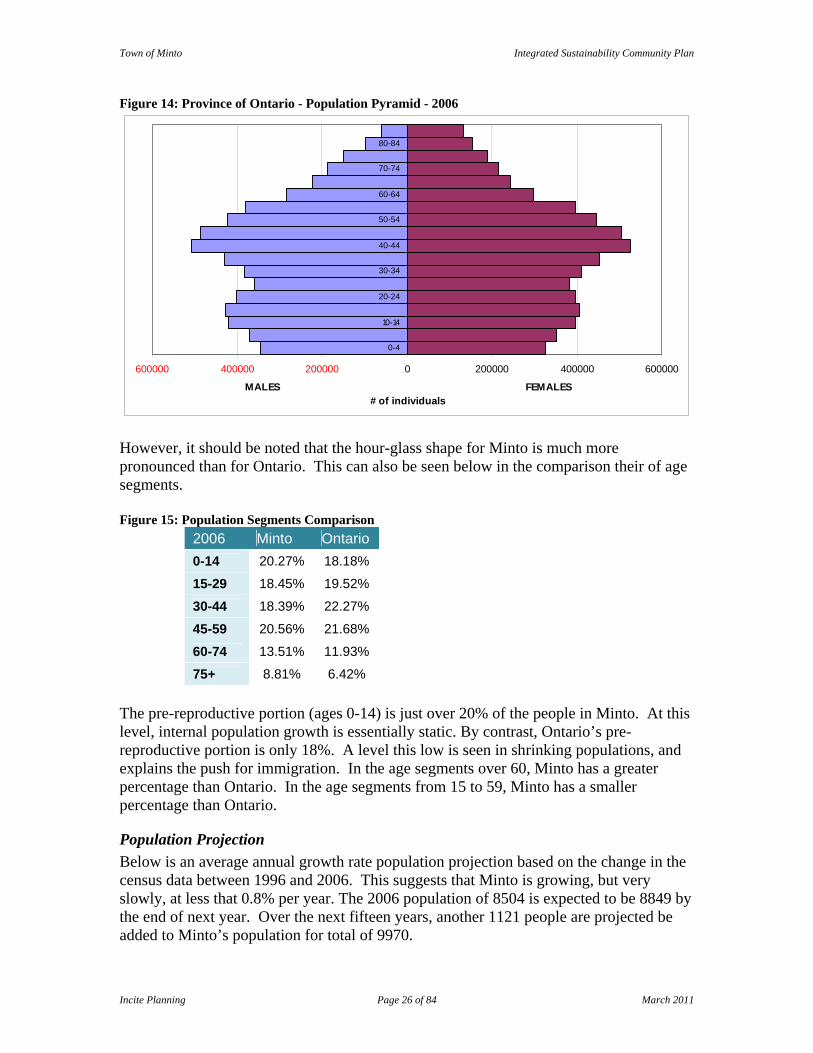
Figure 14: Province of Ontario - Population Pyramid - 2006
600000 400000 200000 0 200000 400000 600000
0-4
10-14
20-24
30-34
40-44
50-54
60-64
70-74
80-84
MALES FEMALES# of individuals
However, it should be noted that the hour-glass shape for Minto is much more pronounced than for Ontario. This can also be seen below in the comparison their of age segments. Figure 15: Population Segments Comparison
2006 Minto Ontario 0-14 20.27% 18.18%
15-29 18.45% 19.52%
30-44 18.39% 22.27%
45-59 20.56% 21.68%
60-74 13.51% 11.93%
75+ 8.81% 6.42% The pre-reproductive portion (ages 0-14) is just over 20% of the people in Minto. At this level, internal population growth is essentially static. By contrast, Ontario’s pre-reproductive portion is only 18%. A level this low is seen in shrinking populations, and explains the push for immigration. In the age segments over 60, Minto has a greater percentage than Ontario. In the age segments from 15 to 59, Minto has a smaller percentage than Ontario.
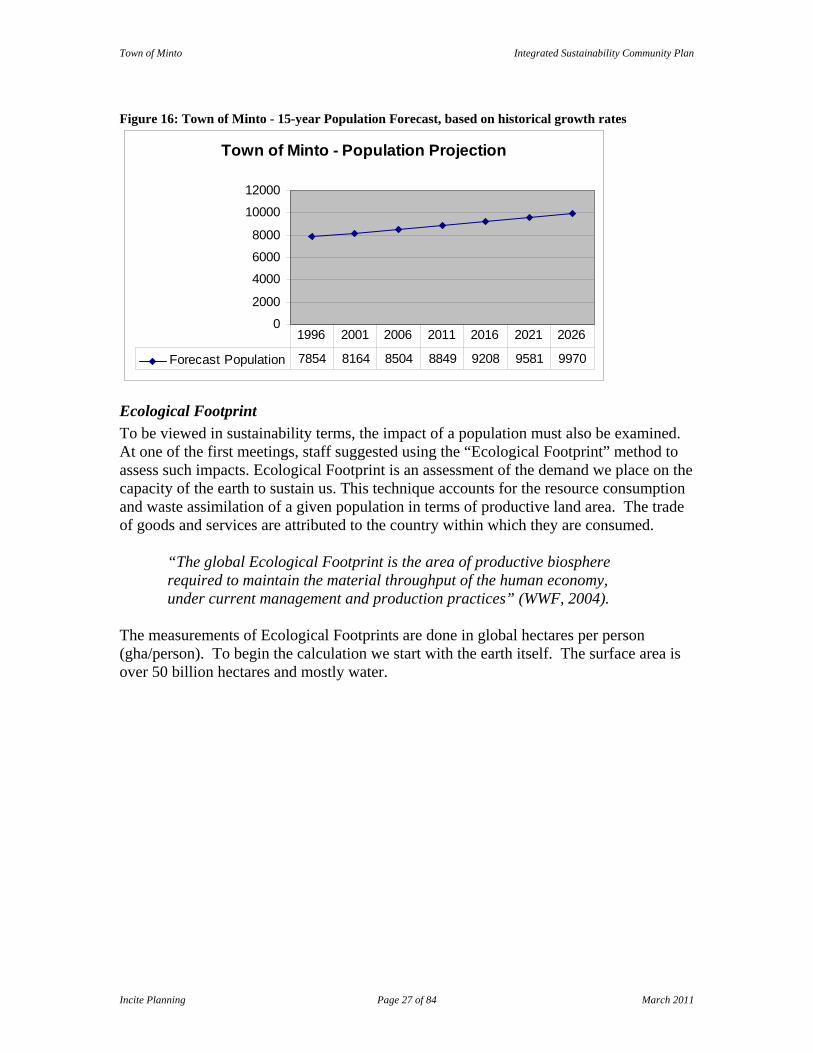
Population Projection Below is an average annual growth rate population projection based on the change in the census data between 1996 and 2006. This suggests that Minto is growing, but very slowly, at less that 0.8% per year. The 2006 population of 8504 is expected to be 8849 by the end of next year. Over the next fifteen years, another 1121 people are projected be added to Minto’s population for total of 9970.
Town of Minto Integrated Sustainability Community Plan
Incite Planning Page 27 of 84 March 2011
Figure 16: Town of Minto - 15-year Population Forecast, based on historical growth rates
Town of Minto - Population Projection
0
2000
4000
6000
8000
10000
12000
Forecast Population 7854 8164 8504 8849 9208 9581 9970
1996 2001 2006 2011 2016 2021 2026
Ecological Footprint To be viewed in sustainability terms, the impact of a population must also be examined. At one of the first meetings, staff suggested using the “Ecological Footprint” method to assess such impacts. Ecological Footprint is an assessment of the demand we place on the capacity of the earth to sustain us. This technique accounts for the resource consumption and waste assimilation of a given population in terms of productive land area. The trade of goods and services are attributed to the country within which they are consumed.
“The global Ecological Footprint is the area of productive biosphere required to maintain the material throughput of the human economy, under current management and production practices” (WWF, 2004).
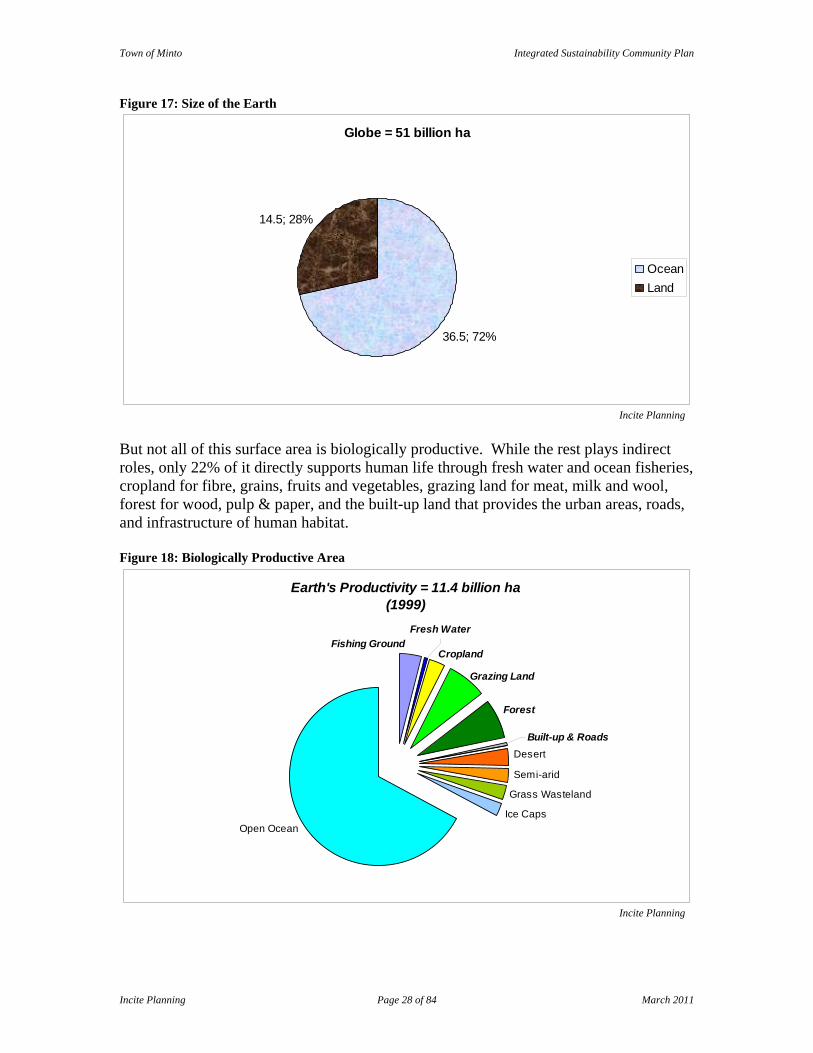
The measurements of Ecological Footprints are done in global hectares per person (gha/person). To begin the calculation we start with the earth itself. The surface area is over 50 billion hectares and mostly water.
Town of Minto Integrated Sustainability Community Plan
Incite Planning Page 28 of 84 March 2011
Figure 17: Size of the Earth
Globe = 51 billion ha
36.5; 72%
14.5; 28%
OceanLand
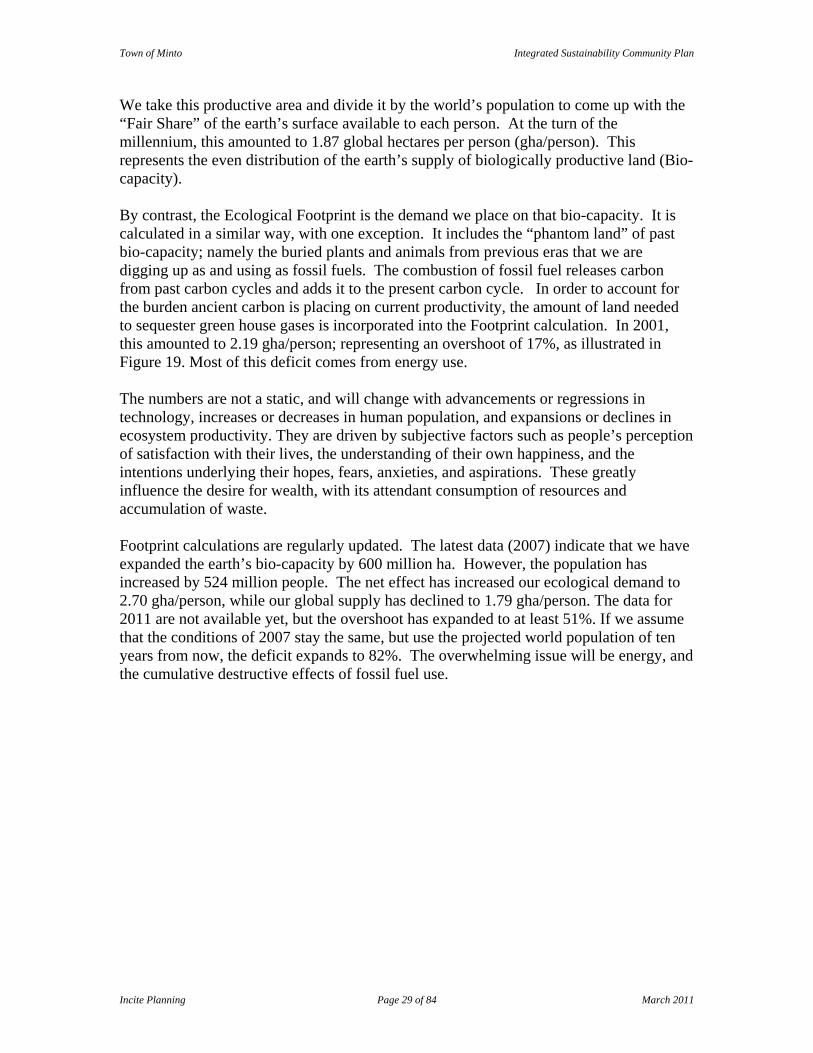
Incite Planning But not all of this surface area is biologically productive. While the rest plays indirect roles, only 22% of it directly supports human life through fresh water and ocean fisheries, cropland for fibre, grains, fruits and vegetables, grazing land for meat, milk and wool, forest for wood, pulp & paper, and the built-up land that provides the urban areas, roads, and infrastructure of human habitat. Figure 18: Biologically Productive Area
Earth's Productivity = 11.4 billion ha (1999)
Open OceanIce Caps
Grass Wasteland
Semi-arid
Desert
Fresh WaterFishing Ground
Built-up & Roads
Cropland
Grazing Land
Forest
Incite Planning
Town of Minto Integrated Sustainability Community Plan
Incite Planning Page 29 of 84 March 2011
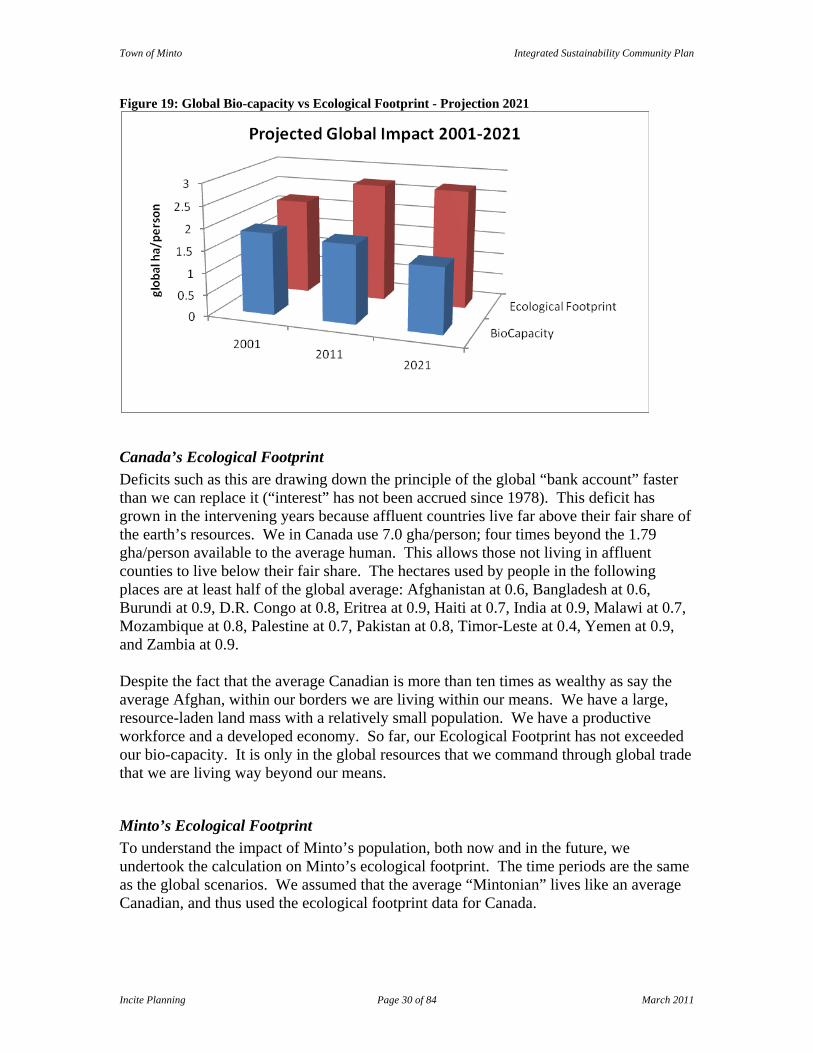
We take this productive area and divide it by the world’s population to come up with the “Fair Share” of the earth’s surface available to each person. At the turn of the millennium, this amounted to 1.87 global hectares per person (gha/person). This represents the even distribution of the earth’s supply of biologically productive land (Bio-capacity). By contrast, the Ecological Footprint is the demand we place on that bio-capacity. It is calculated in a similar way, with one exception. It includes the “phantom land” of past bio-capacity; namely the buried plants and animals from previous eras that we are digging up as and using as fossil fuels. The combustion of fossil fuel releases carbon from past carbon cycles and adds it to the present carbon cycle. In order to account for the burden ancient carbon is placing on current productivity, the amount of land needed to sequester green house gases is incorporated into the Footprint calculation. In 2001, this amounted to 2.19 gha/person; representing an overshoot of 17%, as illustrated in Figure 19. Most of this deficit comes from energy use. The numbers are not a static, and will change with advancements or regressions in technology, increases or decreases in human population, and expansions or declines in ecosystem productivity. They are driven by subjective factors such as people’s perception of satisfaction with their lives, the understanding of their own happiness, and the intentions underlying their hopes, fears, anxieties, and aspirations. These greatly influence the desire for wealth, with its attendant consumption of resources and accumulation of waste. Footprint calculations are regularly updated. The latest data (2007) indicate that we have expanded the earth’s bio-capacity by 600 million ha. However, the population has increased by 524 million people. The net effect has increased our ecological demand to 2.70 gha/person, while our global supply has declined to 1.79 gha/person. The data for 2011 are not available yet, but the overshoot has expanded to at least 51%. If we assume that the conditions of 2007 stay the same, but use the projected world population of ten years from now, the deficit expands to 82%. The overwhelming issue will be energy, and the cumulative destructive effects of fossil fuel use.
Town of Minto Integrated Sustainability Community Plan
Incite Planning Page 30 of 84 March 2011
Figure 19: Global Bio-capacity vs Ecological Footprint - Projection 2021
Canada’s Ecological Footprint Deficits such as this are drawing down the principle of the global “bank account” faster than we can replace it (“interest” has not been accrued since 1978). This deficit has grown in the intervening years because affluent countries live far above their fair share of the earth’s resources. We in Canada use 7.0 gha/person; four times beyond the 1.79 gha/person available to the average human. This allows those not living in affluent counties to live below their fair share. The hectares used by people in the following places are at least half of the global average: Afghanistan at 0.6, Bangladesh at 0.6, Burundi at 0.9, D.R. Congo at 0.8, Eritrea at 0.9, Haiti at 0.7, India at 0.9, Malawi at 0.7, Mozambique at 0.8, Palestine at 0.7, Pakistan at 0.8, Timor-Leste at 0.4, Yemen at 0.9, and Zambia at 0.9. Despite the fact that the average Canadian is more than ten times as wealthy as say the average Afghan, within our borders we are living within our means. We have a large, resource-laden land mass with a relatively small population. We have a productive workforce and a developed economy. So far, our Ecological Footprint has not exceeded our bio-capacity. It is only in the global resources that we command through global trade that we are living way beyond our means.
Minto’s Ecological Footprint To understand the impact of Minto’s population, both now and in the future, we undertook the calculation on Minto’s ecological footprint. The time periods are the same as the global scenarios. We assumed that the average “Mintonian” lives like an average Canadian, and thus used the ecological footprint data for Canada.
Town of Minto Integrated Sustainability Community Plan
Incite Planning Page 31 of 84 March 2011
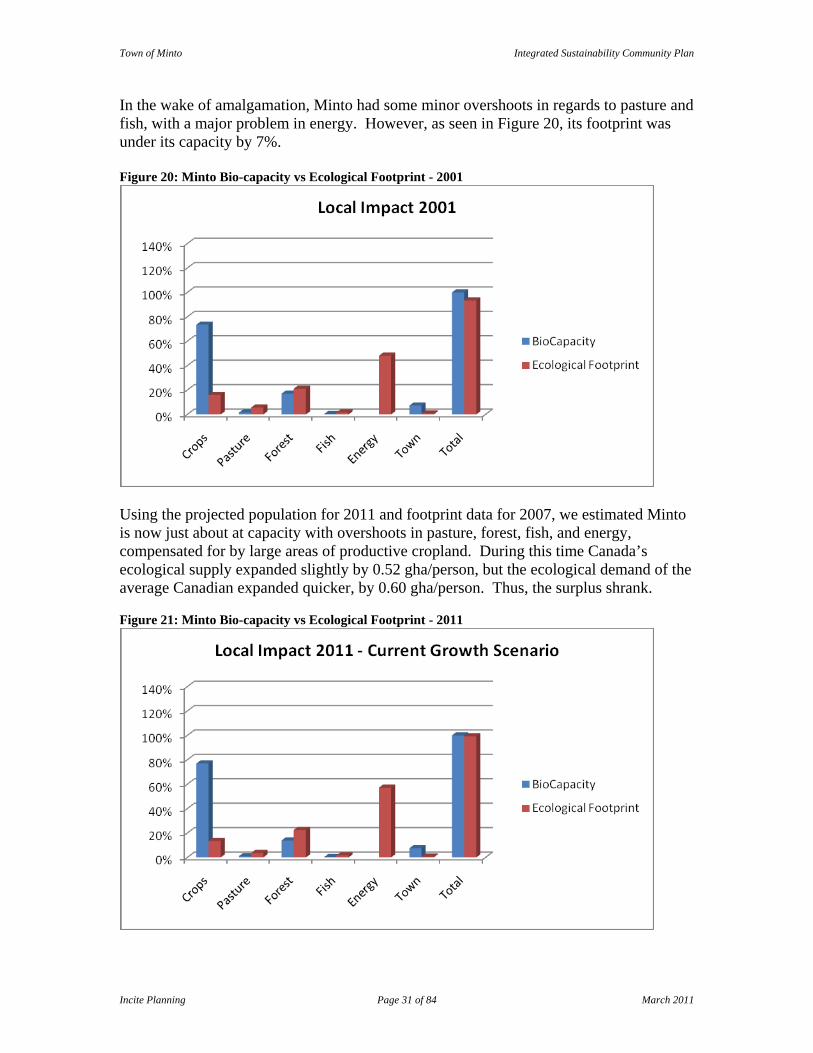
In the wake of amalgamation, Minto had some minor overshoots in regards to pasture and fish, with a major problem in energy. However, as seen in Figure 20, its footprint was under its capacity by 7%. Figure 20: Minto Bio-capacity vs Ecological Footprint - 2001
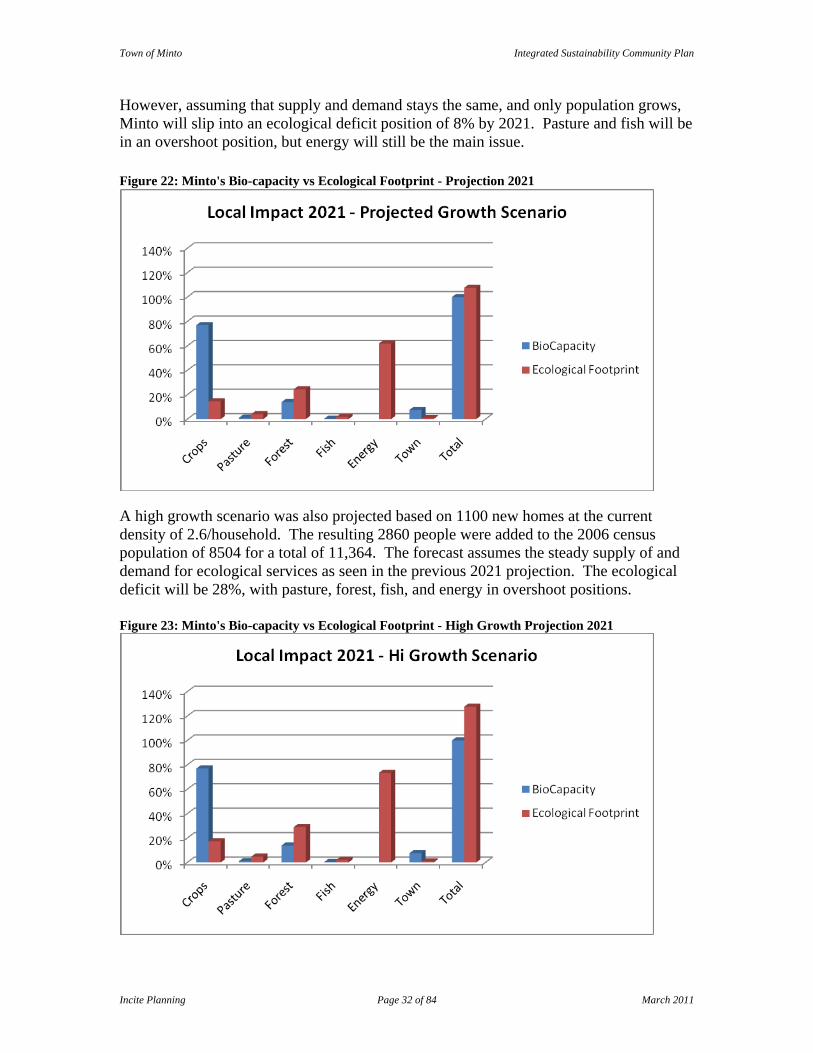
Using the projected population for 2011 and footprint data for 2007, we estimated Minto is now just about at capacity with overshoots in pasture, forest, fish, and energy, compensated for by large areas of productive cropland. During this time Canada’s ecological supply expanded slightly by 0.52 gha/person, but the ecological demand of the average Canadian expanded quicker, by 0.60 gha/person. Thus, the surplus shrank. Figure 21: Minto Bio-capacity vs Ecological Footprint - 2011
Town of Minto Integrated Sustainability Community Plan
Incite Planning Page 32 of 84 March 2011
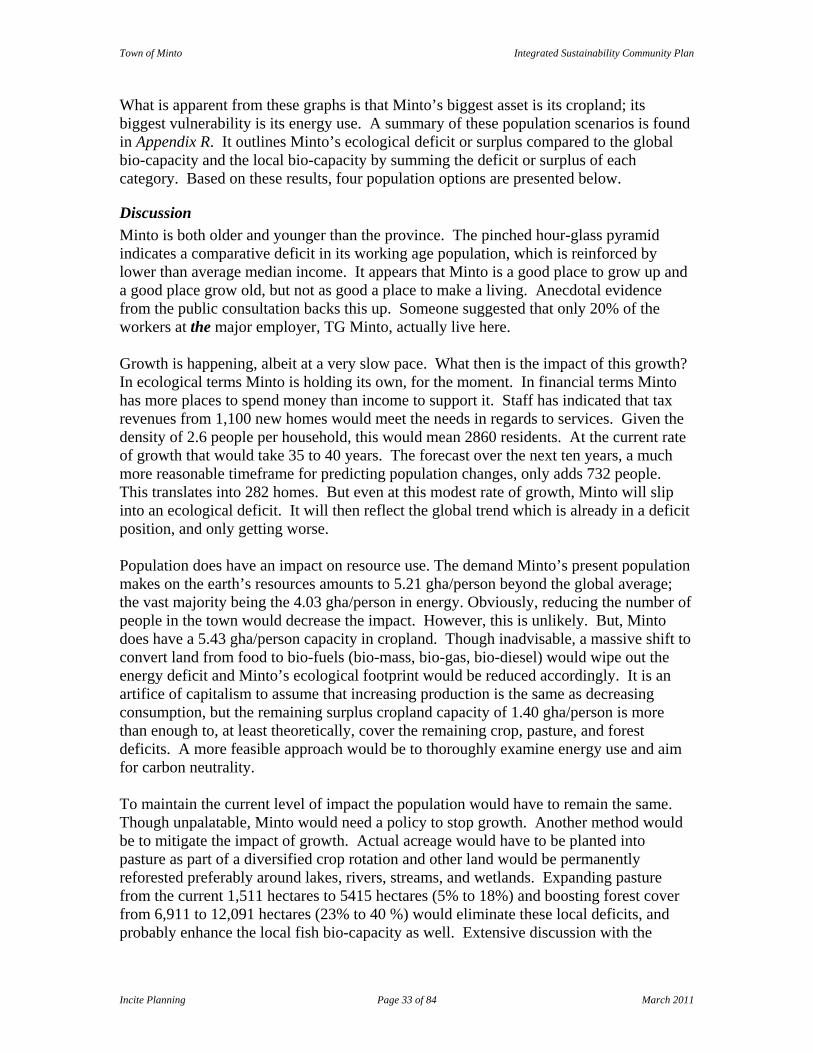
However, assuming that supply and demand stays the same, and only population grows, Minto will slip into an ecological deficit position of 8% by 2021. Pasture and fish will be in an overshoot position, but energy will still be the main issue. Figure 22: Minto's Bio-capacity vs Ecological Footprint - Projection 2021
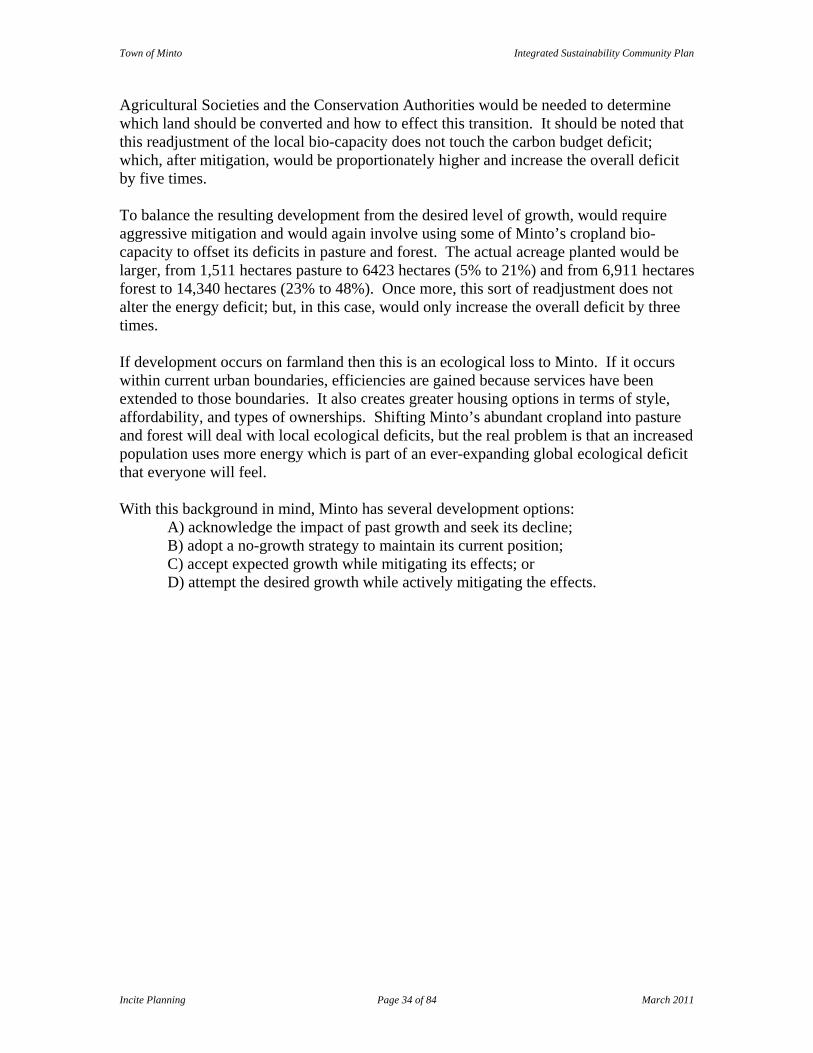
A high growth scenario was also projected based on 1100 new homes at the current density of 2.6/household. The resulting 2860 people were added to the 2006 census population of 8504 for a total of 11,364. The forecast assumes the steady supply of and demand for ecological services as seen in the previous 2021 projection. The ecological deficit will be 28%, with pasture, forest, fish, and energy in overshoot positions. Figure 23: Minto's Bio-capacity vs Ecological Footprint - High Growth Projection 2021
Town of Minto Integrated Sustainability Community Plan
Incite Planning Page 33 of 84 March 2011
What is apparent from these graphs is that Minto’s biggest asset is its cropland; its biggest vulnerability is its energy use. A summary of these population scenarios is found in Appendix R. It outlines Minto’s ecological deficit or surplus compared to the global bio-capacity and the local bio-capacity by summing the deficit or surplus of each category. Based on these results, four population options are presented below.
Discussion Minto is both older and younger than the province. The pinched hour-glass pyramid indicates a comparative deficit in its working age population, which is reinforced by lower than average median income. It appears that Minto is a good place to grow up and a good place grow old, but not as good a place to make a living. Anecdotal evidence from the public consultation backs this up. Someone suggested that only 20% of the workers at the major employer, TG Minto, actually live here. Growth is happening, albeit at a very slow pace. What then is the impact of this growth? In ecological terms Minto is holding its own, for the moment. In financial terms Minto has more places to spend money than income to support it. Staff has indicated that tax revenues from 1,100 new homes would meet the needs in regards to services. Given the density of 2.6 people per household, this would mean 2860 residents. At the current rate of growth that would take 35 to 40 years. The forecast over the next ten years, a much more reasonable timeframe for predicting population changes, only adds 732 people. This translates into 282 homes. But even at this modest rate of growth, Minto will slip into an ecological deficit. It will then reflect the global trend which is already in a deficit position, and only getting worse. Population does have an impact on resource use. The demand Minto’s present population makes on the earth’s resources amounts to 5.21 gha/person beyond the global average; the vast majority being the 4.03 gha/person in energy. Obviously, reducing the number of people in the town would decrease the impact. However, this is unlikely. But, Minto does have a 5.43 gha/person capacity in cropland. Though inadvisable, a massive shift to convert land from food to bio-fuels (bio-mass, bio-gas, bio-diesel) would wipe out the energy deficit and Minto’s ecological footprint would be reduced accordingly. It is an artifice of capitalism to assume that increasing production is the same as decreasing consumption, but the remaining surplus cropland capacity of 1.40 gha/person is more than enough to, at least theoretically, cover the remaining crop, pasture, and forest deficits. A more feasible approach would be to thoroughly examine energy use and aim for carbon neutrality. To maintain the current level of impact the population would have to remain the same. Though unpalatable, Minto would need a policy to stop growth. Another method would be to mitigate the impact of growth. Actual acreage would have to be planted into pasture as part of a diversified crop rotation and other land would be permanently reforested preferably around lakes, rivers, streams, and wetlands. Expanding pasture from the current 1,511 hectares to 5415 hectares (5% to 18%) and boosting forest cover from 6,911 to 12,091 hectares (23% to 40 %) would eliminate these local deficits, and probably enhance the local fish bio-capacity as well. Extensive discussion with the
Town of Minto Integrated Sustainability Community Plan
Incite Planning Page 34 of 84 March 2011
Agricultural Societies and the Conservation Authorities would be needed to determine which land should be converted and how to effect this transition. It should be noted that this readjustment of the local bio-capacity does not touch the carbon budget deficit; which, after mitigation, would be proportionately higher and increase the overall deficit by five times. To balance the resulting development from the desired level of growth, would require aggressive mitigation and would again involve using some of Minto’s cropland bio-capacity to offset its deficits in pasture and forest. The actual acreage planted would be larger, from 1,511 hectares pasture to 6423 hectares (5% to 21%) and from 6,911 hectares forest to 14,340 hectares (23% to 48%). Once more, this sort of readjustment does not alter the energy deficit; but, in this case, would only increase the overall deficit by three times. If development occurs on farmland then this is an ecological loss to Minto. If it occurs within current urban boundaries, efficiencies are gained because services have been extended to those boundaries. It also creates greater housing options in terms of style, affordability, and types of ownerships. Shifting Minto’s abundant cropland into pasture and forest will deal with local ecological deficits, but the real problem is that an increased population uses more energy which is part of an ever-expanding global ecological deficit that everyone will feel. With this background in mind, Minto has several development options:
A) acknowledge the impact of past growth and seek its decline; B) adopt a no-growth strategy to maintain its current position; C) accept expected growth while mitigating its effects; or D) attempt the desired growth while actively mitigating the effects.
Town of Minto Integrated Sustainability Community Plan
Incite Planning Page 35 of 84 March 2011
Targets Option A – Controlled Contraction . Reduce the effects of population by decreasing the ecological footprint to the
“Fair Share” level. The process of footprint reduction has some examples to draw on such as the energy descent planning of the “Transition Town” movement and the efforts of Eden Mills, Ontario to become the world’s first carbon-neutral village.
Option B – No Growth Ignore the global deficit and maintain a locally-sound ecological footprint
that does not exceed its bio-capacity. To maintain this status, an attempt could be made to stall growth and stabilise the population through a moratorium on development.
Option C – Expected Growth Adapt to the natural increase in the population of 732 that will occur over the
next ten years, while trying to mitigate the local effects. This would involve planning for the areas to be developed or redeveloped. Discussion would also take place with the Agricultural Societies and Conservation Authorities about using some of the large bio-capacity Minto has in cropland to offset its deficits in pasture and forest, 18% & 40% respectively.
Option D – Desired Growth Actively recruit an extra 2128 more people to increase the population over the
next ten years, while aggressively mitigating the local effects. Recruitment would involve surveying the major local employers to find out how many employees they have, the number that do not live within the borders of Minto, the reasons they do not, and what would induce them to move. This would be followed by a recruitment campaign targeting such employees, and the enhancement of those amenities that were indentified. Discussion would also take place with the Agricultural Societies and Conservation Authorities about using some of the large bio-capacity Minto has in cropland to offset even greater deficits in pasture and forest, 21% & 48% respectively.
Each option must be considered in light of the stated sustainability goal:
POPULATION GOAL
Grow to an optimum population that allows Minto to pay its bills, and take on
new projects.

Town of Minto Integrated Sustainability Community Plan
Incite Planning Page 36 of 84 March 2011
FOOD
The TIP analysis revealed a dichotomy between the notion of a family farm and the industrial model in terms of the farmland available, the careers it can provide, and the promotion of agriculture generally. Do small-scale farms, back-yard gardens, the “100-mile” diet increase food production? Can the farmers’ market be integrated into the retail strategy? Specifically how do we educate the community about these issues, and inculcate a legacy of land stewardship. See “Food Theme” in Appendix J for a list of the issues and the documents from which they came. To understand this priority better, an agricultural profile and agriculture structure were prepared, and local food distribution and ecological footprint were examined.
Agricultural Profile The Town of Minto is located in the County of Wellington in South-western Ontario, and largely made up of the former Township of Minto, from which it was created in 1999. It is approximately 30,000 hectares in size and, as of 2006, had 28,563 ha (95%) in farmland. There were 23,101 hectares of crops on 263 farms, 16 ha of summer-fallow on 5 farms, 856 ha of seeded pasture on 97 farms, 655 ha of natural pasture on 74 farms, 3,211 ha of Christmas trees, woodlands, & wetlands on 212 farms, 723 ha of “other” land on 224 farms.
The main crops, there were: 5,650 ha in soybeans on 83 farms, 5,534 ha in corn on 135 farms, 4,994 ha in wheat on 81 farms, 4,180 in alfalfa/mixes, tame hay & fodder on 235 farms, and 1,278 in barley on 62 farms. The rest is made up of mixed grains, oats, dry beans & peas, potatoes, rye, canola, forage seed, buckwheat, triticale, and “other”.
Only ten farms reported growing vegetables, such as: sweet corn, tomatoes, cucumbers, green peas, green beans, cabbage, cauliflower, broccoli, Brussels-sprouts, carrots, rutabaga & turnip, beets, radishes, onion, lettuce, peppers, pumpkins, squash, zucchini, asparagus.
At a fundamental level, sustainability means the
ability to feed ourselves in a manner that nourishes
us, promotes the health of the soil, and allows the
community that depends on it to thrive.
Town of Minto Integrated Sustainability Community Plan
Incite Planning Page 37 of 84 March 2011
The amount of land in fruit production in Minto has declined since 2001 from 8 hectares on 7 farms to 4 hectares on 5 farms. Of the apples, plums, sweet cherries, strawberries and raspberries that used to be produced here only apples & strawberries remain. There are 4 nurseries on 23 ha, 2 Christmas tree growers, 6 greenhouse operators on 1860 m2 (1,028 m2 flowers & 832 m2 vegetables). Maple syrup operations have also declined since 2001 from 7,570 taps on 29 farms to 5,426 taps on 17 farms. There were reported to be 14,768 cattle on 169 farms, of which 3,445 were dairy cows. There were 172,713 chickens on 51 farms, of which 22,142 were for laying eggs. There were, 68,623 pigs on 46 farms, 2,373 “other” poultry on 9 farms, 870 sheep on 18 farms, 451 horses on 87 farms, 355 goats on 12 farms, 34 turkeys on 4 farms, 24 bee colonies on 3 farms, and wild boars, llamas/alpacas, deer & elk on 7 farms. Of the 13 farms reported to be organic, 5 had hay or field crops (2 certified, 3 uncertified), 4 had fruit, vegetables, or greenhouse products (2 certified, 2 uncertified), 7 had animal/products (2 certified, 1 transitional, 4 uncertified), and 3 reported “other” products (1 certified, 2 uncertified). Of the 8504 people who live here, 665 work in agriculture or other resource related industries. Of those, 415 were farm operators. The average age of an operator was 49.2 years, 3.4 years younger than the average for Ontario at 52.6. There were 288 farms averaging 99 hectares in size, and excluding forest products, the total gross income was $54,738,822 from a total capitalisation of $310,748,879. Of the 6605 people over the age of fifteen, approximately 36% have post-secondary education. Of those, 395 studied business, management, or public administration; 135 studied agriculture, natural resources, or conservation. Of the 4,435 that were part of the experienced workforce, 15% were in agriculture and 14% were in wholesale or retail.
Town of Minto Integrated Sustainability Community Plan
Incite Planning Page 38 of 84 March 2011
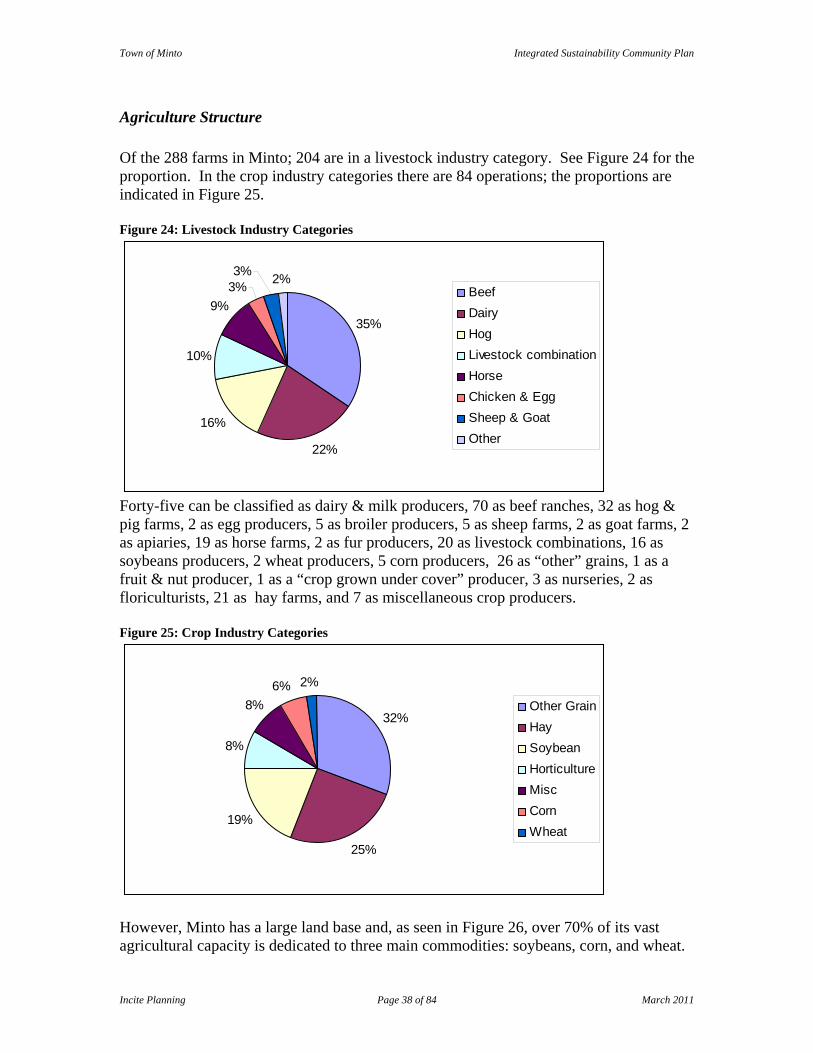
Agriculture Structure Of the 288 farms in Minto; 204 are in a livestock industry category. See Figure 24 for the proportion. In the crop industry categories there are 84 operations; the proportions are indicated in Figure 25. Figure 24: Livestock Industry Categories
35%
22%
16%
10%
9%
2%3%3% Beef
DairyHogLivestock combinationHorseChicken & EggSheep & GoatOther
Forty-five can be classified as dairy & milk producers, 70 as beef ranches, 32 as hog & pig farms, 2 as egg producers, 5 as broiler producers, 5 as sheep farms, 2 as goat farms, 2 as apiaries, 19 as horse farms, 2 as fur producers, 20 as livestock combinations, 16 as soybeans producers, 2 wheat producers, 5 corn producers, 26 as “other” grains, 1 as a fruit & nut producer, 1 as a “crop grown under cover” producer, 3 as nurseries, 2 as floriculturists, 21 as hay farms, and 7 as miscellaneous crop producers. Figure 25: Crop Industry Categories
32%
25%
19%
8%
8%6% 2%
Other GrainHaySoybeanHorticultureMiscCornWheat
However, Minto has a large land base and, as seen in Figure 26, over 70% of its vast agricultural capacity is dedicated to three main commodities: soybeans, corn, and wheat.

Town of Minto Integrated Sustainability Community Plan
Incite Planning Page 39 of 84 March 2011
Alfalfa, alfalfa/mixes, tame hay & fodder takes up 18% of the cropland and barley uses another 6%. Figure 26: Minto Cropland Use
Soybean24.5%
Corn24.0%Wheat
21.6%
Alfalfa/Fodder18.1%
Barley5.5%
Other6.3%
Minto’s livestock capacity is geared largely towards meat production. Of the 14,768 reported cattle 77% were for raised for beef, while 23% were for dairy. Of the 172,713 chickens 87% were raised as broilers, roasters, or Cornish hens, with 13% as egg layers. Of the 68,623 swine 94% were grown as weaner pigs or finishing hogs. Minto has 13 farms reporting organic products (3 certified, 1, transitional, 9 uncertified). This is up from 4 in 2001, but is only 4.5% of total farms, and represents two-thirds of the national rate of 6.8%.
Local Food Distribution Minto has thirty-four outlets in which to buy fresh produce, prepared foods, or meals. There is one farmers’ market operating in Clifford on Friday afternoons from 3 to 7 p.m. running June through October and Christmas. Clifford also has two variety stores, a specialty shop, four restaurants, a gas/convenience store outside of town, and a restaurant at the Pike Lake Golf Centre. In Harriston there is an LM grocery store, two variety stores, seven restaurant/tavern/fast-food places, and six general/bulk/specialty stores. In Palmerston there is an LM grocery store, a variety store, a gas/convenience store, four restaurant/fast-food places, a hotel restaurant, and a truck stop in Teviotdale. In terms of local food promotion, the Town of Minto, the Chamber of Commerce, the Harriston-Minto Agricultural Society & the Palmerston Agricultural Society, and the Farmers’ Market have started “Savour the Flavour of Minto”. This initiative pairs local farms and local chefs. They create 12 menu items for twelve stations at a special occasion. A local food advocate gave a presentation about the importance of local fare and its relation to local farms. Next year, in addition to the “Savour the Flavour” event, a farm tour which incorporates cooking demonstrations is planned.
Town of Minto Integrated Sustainability Community Plan
Incite Planning Page 40 of 84 March 2011
Minto is also represented on the “Taste Real Guelph/Wellington” Board. They have received funding for a local food tourism plan which includes a local food map, networking between farms and chefs, and the hiring of an outreach coordinator for the sourcing of local food.
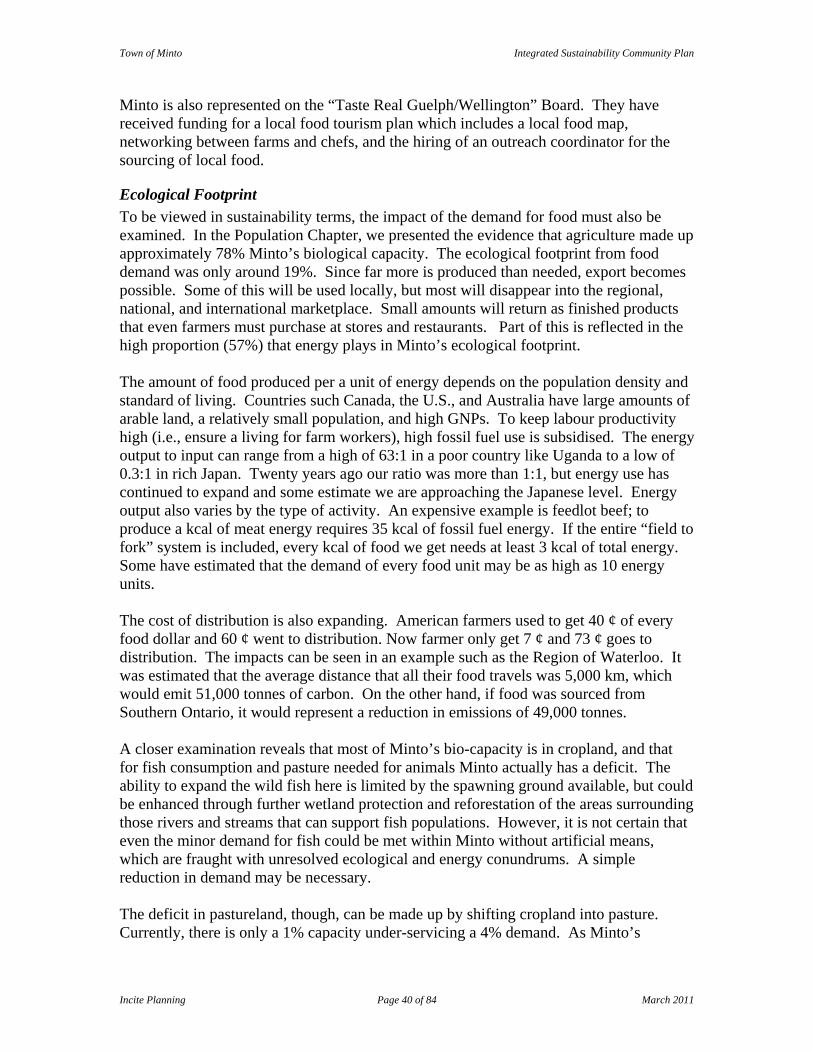
Ecological Footprint To be viewed in sustainability terms, the impact of the demand for food must also be examined. In the Population Chapter, we presented the evidence that agriculture made up approximately 78% Minto’s biological capacity. The ecological footprint from food demand was only around 19%. Since far more is produced than needed, export becomes possible. Some of this will be used locally, but most will disappear into the regional, national, and international marketplace. Small amounts will return as finished products that even farmers must purchase at stores and restaurants. Part of this is reflected in the high proportion (57%) that energy plays in Minto’s ecological footprint. The amount of food produced per a unit of energy depends on the population density and standard of living. Countries such Canada, the U.S., and Australia have large amounts of arable land, a relatively small population, and high GNPs. To keep labour productivity high (i.e., ensure a living for farm workers), high fossil fuel use is subsidised. The energy output to input can range from a high of 63:1 in a poor country like Uganda to a low of 0.3:1 in rich Japan. Twenty years ago our ratio was more than 1:1, but energy use has continued to expand and some estimate we are approaching the Japanese level. Energy output also varies by the type of activity. An expensive example is feedlot beef; to produce a kcal of meat energy requires 35 kcal of fossil fuel energy. If the entire “field to fork” system is included, every kcal of food we get needs at least 3 kcal of total energy. Some have estimated that the demand of every food unit may be as high as 10 energy units. The cost of distribution is also expanding. American farmers used to get 40 ¢ of every food dollar and 60 ¢ went to distribution. Now farmer only get 7 ¢ and 73 ¢ goes to distribution. The impacts can be seen in an example such as the Region of Waterloo. It was estimated that the average distance that all their food travels was 5,000 km, which would emit 51,000 tonnes of carbon. On the other hand, if food was sourced from Southern Ontario, it would represent a reduction in emissions of 49,000 tonnes. A closer examination reveals that most of Minto’s bio-capacity is in cropland, and that for fish consumption and pasture needed for animals Minto actually has a deficit. The ability to expand the wild fish here is limited by the spawning ground available, but could be enhanced through further wetland protection and reforestation of the areas surrounding those rivers and streams that can support fish populations. However, it is not certain that even the minor demand for fish could be met within Minto without artificial means, which are fraught with unresolved ecological and energy conundrums. A simple reduction in demand may be necessary. The deficit in pastureland, though, can be made up by shifting cropland into pasture. Currently, there is only a 1% capacity under-servicing a 4% demand. As Minto’s
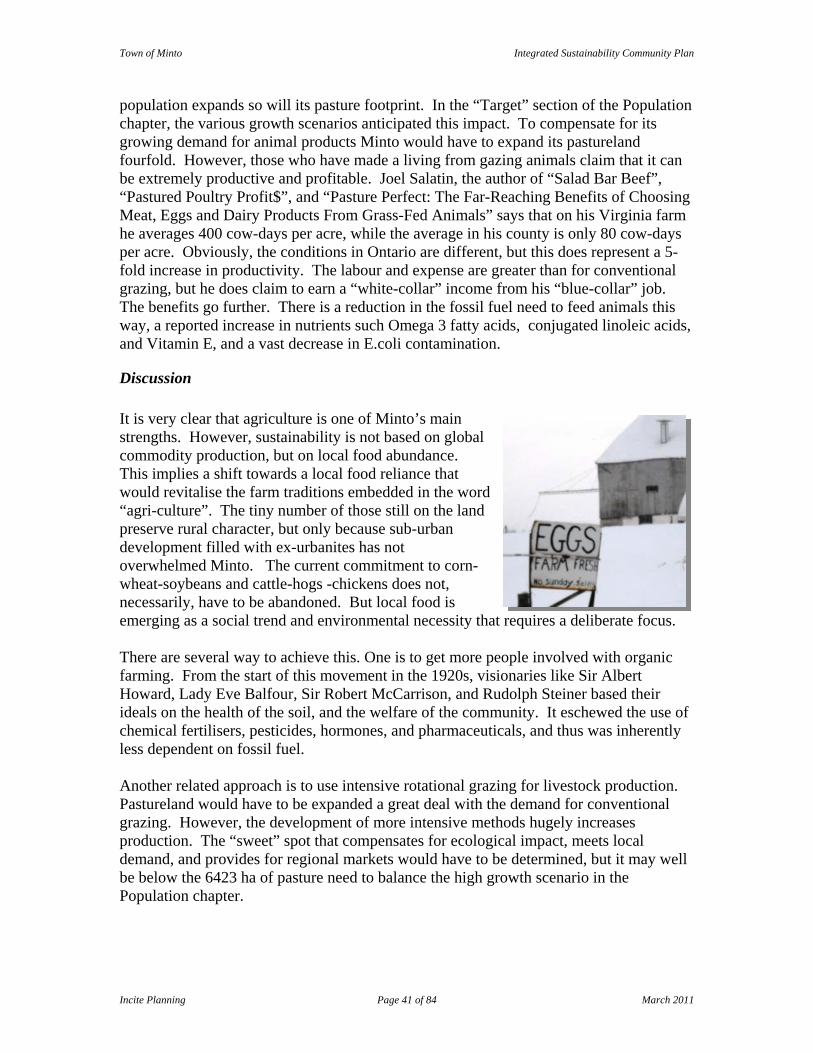
Town of Minto Integrated Sustainability Community Plan
Incite Planning Page 41 of 84 March 2011
population expands so will its pasture footprint. In the “Target” section of the Population chapter, the various growth scenarios anticipated this impact. To compensate for its growing demand for animal products Minto would have to expand its pastureland fourfold. However, those who have made a living from gazing animals claim that it can be extremely productive and profitable. Joel Salatin, the author of “Salad Bar Beef”, “Pastured Poultry Profit$”, and “Pasture Perfect: The Far-Reaching Benefits of Choosing Meat, Eggs and Dairy Products From Grass-Fed Animals” says that on his Virginia farm he averages 400 cow-days per acre, while the average in his county is only 80 cow-days per acre. Obviously, the conditions in Ontario are different, but this does represent a 5-fold increase in productivity. The labour and expense are greater than for conventional grazing, but he does claim to earn a “white-collar” income from his “blue-collar” job. The benefits go further. There is a reduction in the fossil fuel need to feed animals this way, a reported increase in nutrients such Omega 3 fatty acids, conjugated linoleic acids, and Vitamin E, and a vast decrease in E.coli contamination.
Discussion It is very clear that agriculture is one of Minto’s main strengths. However, sustainability is not based on global commodity production, but on local food abundance. This implies a shift towards a local food reliance that would revitalise the farm traditions embedded in the word “agri-culture”. The tiny number of those still on the land preserve rural character, but only because sub-urban development filled with ex-urbanites has not overwhelmed Minto. The current commitment to corn-wheat-soybeans and cattle-hogs -chickens does not, necessarily, have to be abandoned. But local food is emerging as a social trend and environmental necessity that requires a deliberate focus. There are several way to achieve this. One is to get more people involved with organic farming. From the start of this movement in the 1920s, visionaries like Sir Albert Howard, Lady Eve Balfour, Sir Robert McCarrison, and Rudolph Steiner based their ideals on the health of the soil, and the welfare of the community. It eschewed the use of chemical fertilisers, pesticides, hormones, and pharmaceuticals, and thus was inherently less dependent on fossil fuel. Another related approach is to use intensive rotational grazing for livestock production. Pastureland would have to be expanded a great deal with the demand for conventional grazing. However, the development of more intensive methods hugely increases production. The “sweet” spot that compensates for ecological impact, meets local demand, and provides for regional markets would have to be determined, but it may well be below the 6423 ha of pasture need to balance the high growth scenario in the Population chapter.
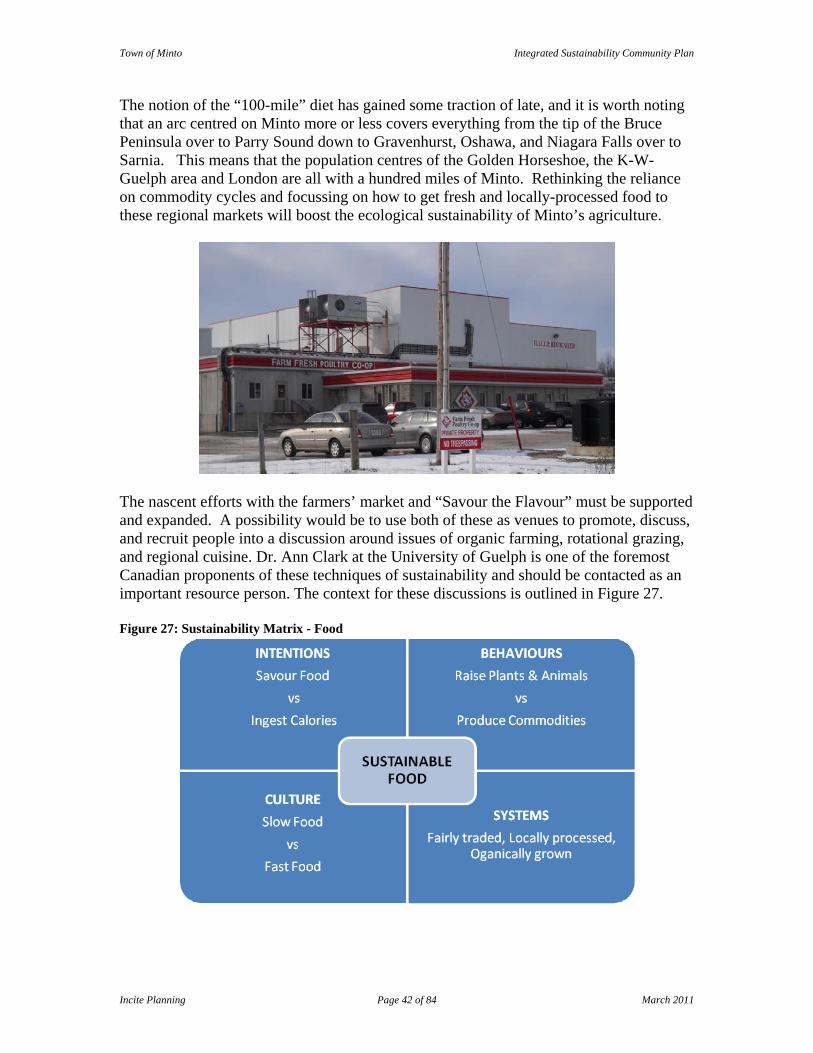
Town of Minto Integrated Sustainability Community Plan
Incite Planning Page 42 of 84 March 2011
The notion of the “100-mile” diet has gained some traction of late, and it is worth noting that an arc centred on Minto more or less covers everything from the tip of the Bruce Peninsula over to Parry Sound down to Gravenhurst, Oshawa, and Niagara Falls over to Sarnia. This means that the population centres of the Golden Horseshoe, the K-W-Guelph area and London are all with a hundred miles of Minto. Rethinking the reliance on commodity cycles and focussing on how to get fresh and locally-processed food to these regional markets will boost the ecological sustainability of Minto’s agriculture.
The nascent efforts with the farmers’ market and “Savour the Flavour” must be supported and expanded. A possibility would be to use both of these as venues to promote, discuss, and recruit people into a discussion around issues of organic farming, rotational grazing, and regional cuisine. Dr. Ann Clark at the University of Guelph is one of the foremost Canadian proponents of these techniques of sustainability and should be contacted as an important resource person. The context for these discussions is outlined in Figure 27. Figure 27: Sustainability Matrix - Food
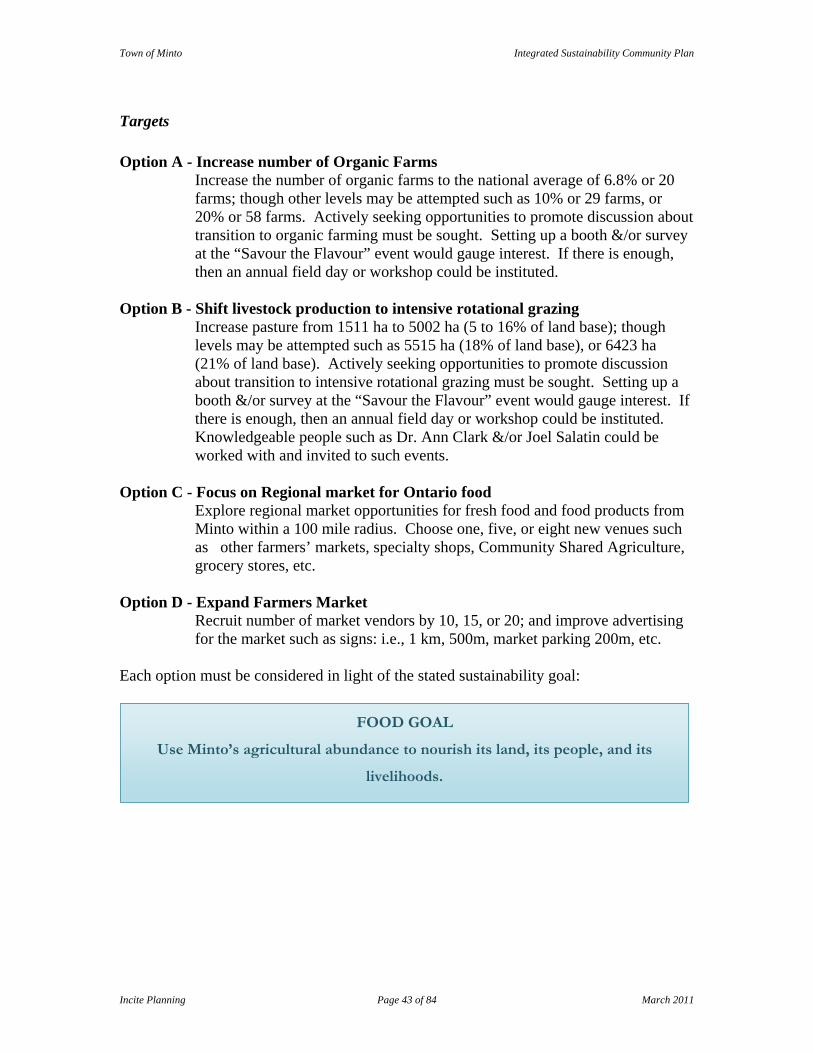
Town of Minto Integrated Sustainability Community Plan
Incite Planning Page 43 of 84 March 2011
Targets Option A - Increase number of Organic Farms
Increase the number of organic farms to the national average of 6.8% or 20 farms; though other levels may be attempted such as 10% or 29 farms, or 20% or 58 farms. Actively seeking opportunities to promote discussion about transition to organic farming must be sought. Setting up a booth &/or survey at the “Savour the Flavour” event would gauge interest. If there is enough, then an annual field day or workshop could be instituted.
Option B - Shift livestock production to intensive rotational grazing
Increase pasture from 1511 ha to 5002 ha (5 to 16% of land base); though levels may be attempted such as 5515 ha (18% of land base), or 6423 ha (21% of land base). Actively seeking opportunities to promote discussion about transition to intensive rotational grazing must be sought. Setting up a booth &/or survey at the “Savour the Flavour” event would gauge interest. If there is enough, then an annual field day or workshop could be instituted. Knowledgeable people such as Dr. Ann Clark &/or Joel Salatin could be worked with and invited to such events.
Option C - Focus on Regional market for Ontario food
Explore regional market opportunities for fresh food and food products from Minto within a 100 mile radius. Choose one, five, or eight new venues such as other farmers’ markets, specialty shops, Community Shared Agriculture, grocery stores, etc.
Option D - Expand Farmers Market
Recruit number of market vendors by 10, 15, or 20; and improve advertising for the market such as signs: i.e., 1 km, 500m, market parking 200m, etc.
Each option must be considered in light of the stated sustainability goal:
FOOD GOAL
Use Minto’s agricultural abundance to nourish its land, its people, and its
livelihoods.
Town of Minto Integrated Sustainability Community Plan
Incite Planning Page 44 of 84 March 2011
FISCAL RESPONSIBILITY
The TIP analysis raised questions regarding external funding such as grants, cost sharing efforts, and public-private partnerships and whether public responsibility is distorted by them. On the one hand, does capital financing maintain flexibility, while increasing reserves miss opportunities on the other? Can taxes be shifted from buildings and improvements to lands values? Can development charges be shifted from a fixed rate to a variable rate based on sustainable performance? Should Sustainable Asset Management (SAM) be based on past users or future users? See the Fiscal Resources section of the “Culture Theme” in Appendix J for a list of the issues and the documents from which they came. To understand this priority better, a fiscal profile and structure were prepared, and the implications for the ecological footprint were examined.
Fiscal Profile As indicated in the Population chapter Minto has a small population, but it also has a fair amount of infrastructure. Not only have the urban areas been serviced with water and sewage, but all the former buildings and recreational facilities from before amalgamation are still in the new Town’s name. Thus, there is a concern over capital expenditures, particularly with the funding formula of the Ontario Municipal Partnership Fund being restructured. The available grant revenue could decline by $450,000. To simply make up this short-fall, i.e., no increase in services, taxes would have to rise by 15%. Currently, the value of homes is the lowest in the county, the assessment then is the lowest, and therefore so are the tax revenues. However, the tax rate is the highest per 100,000 Roads, pipes, and buildings do cost money to maintain, but there is no desire to go into debt. The desired approach is to increase the assessment base.
Fiscal Structure Minto’s budget is divided into 35% capital expenditures and 65% operational expenditures. At present the books are balanced. The revenues that Minto has at its disposal come from the various taxes, grants, user fees, transfers, and borrowing that is available. The amounts from these sources are displayed in Figure 28. The taxes revenues come from residential, commercial, and industrial uses, but homes provide the lion’s share as seen in Figure 29. Current cash reserves exceed the debt due during the current Council term by more than 25%.
Sustainability implies a responsibility to pay one’s
bills whether they are fiscal or ecological.
Diligence is needed for both.

Town of Minto Integrated Sustainability Community Plan
Incite Planning Page 45 of 84 March 2011
Figure 28: Sources of Revenue, in Millions of Dollars
Figure 29: Breakdown of Tax Revenue
Ecological Footprint As indicated in the Population chapter Minto’s small population growth has kept it in a local ecological-surplus position. None-the-less, its natural growth will soon place it into deficit. By 2021, the deficit will be 8%. If the level of desired growth occurs (2860 people) then the deficit rises to 28%. The areas of impact will be with the demand for pasture, forest, fish, and energy. The first three have been addressed in the preceding chapters, and though energy has been touched on, it will be addressed in the Business chapter.
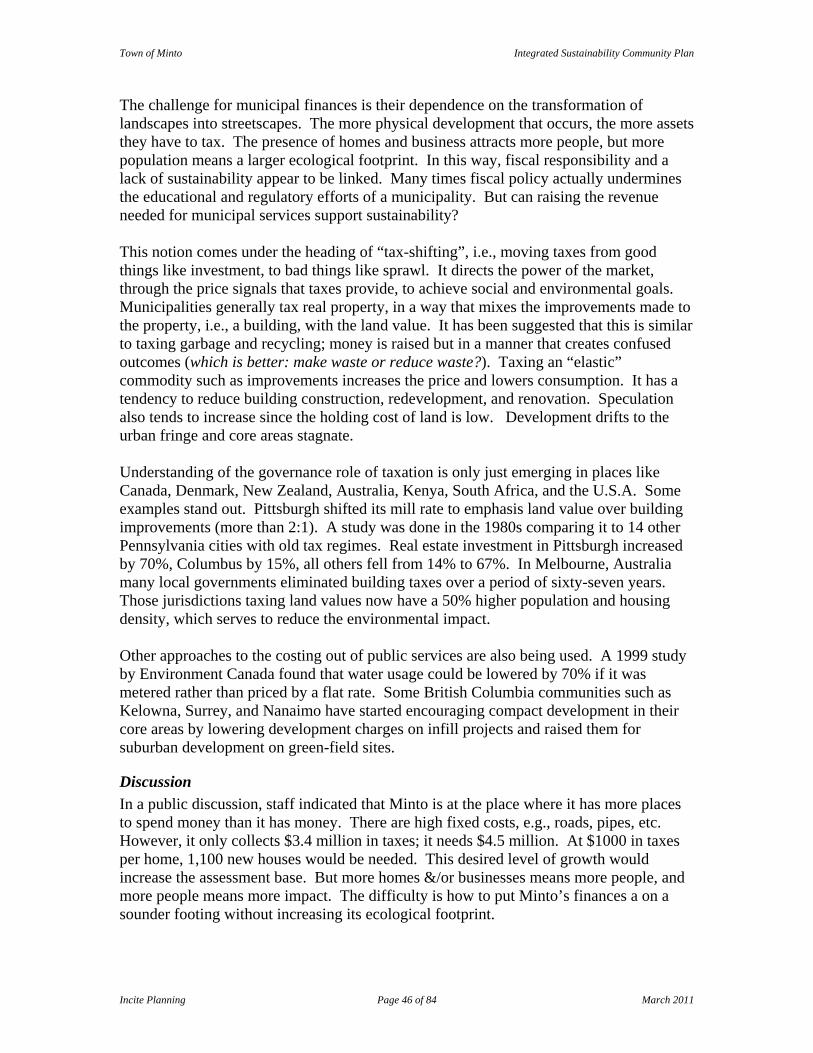
Town of Minto Integrated Sustainability Community Plan
Incite Planning Page 46 of 84 March 2011
The challenge for municipal finances is their dependence on the transformation of landscapes into streetscapes. The more physical development that occurs, the more assets they have to tax. The presence of homes and business attracts more people, but more population means a larger ecological footprint. In this way, fiscal responsibility and a lack of sustainability appear to be linked. Many times fiscal policy actually undermines the educational and regulatory efforts of a municipality. But can raising the revenue needed for municipal services support sustainability? This notion comes under the heading of “tax-shifting”, i.e., moving taxes from good things like investment, to bad things like sprawl. It directs the power of the market, through the price signals that taxes provide, to achieve social and environmental goals. Municipalities generally tax real property, in a way that mixes the improvements made to the property, i.e., a building, with the land value. It has been suggested that this is similar to taxing garbage and recycling; money is raised but in a manner that creates confused outcomes (which is better: make waste or reduce waste?). Taxing an “elastic” commodity such as improvements increases the price and lowers consumption. It has a tendency to reduce building construction, redevelopment, and renovation. Speculation also tends to increase since the holding cost of land is low. Development drifts to the urban fringe and core areas stagnate. Understanding of the governance role of taxation is only just emerging in places like Canada, Denmark, New Zealand, Australia, Kenya, South Africa, and the U.S.A. Some examples stand out. Pittsburgh shifted its mill rate to emphasis land value over building improvements (more than 2:1). A study was done in the 1980s comparing it to 14 other Pennsylvania cities with old tax regimes. Real estate investment in Pittsburgh increased by 70%, Columbus by 15%, all others fell from 14% to 67%. In Melbourne, Australia many local governments eliminated building taxes over a period of sixty-seven years. Those jurisdictions taxing land values now have a 50% higher population and housing density, which serves to reduce the environmental impact. Other approaches to the costing out of public services are also being used. A 1999 study by Environment Canada found that water usage could be lowered by 70% if it was metered rather than priced by a flat rate. Some British Columbia communities such as Kelowna, Surrey, and Nanaimo have started encouraging compact development in their core areas by lowering development charges on infill projects and raised them for suburban development on green-field sites.
Discussion In a public discussion, staff indicated that Minto is at the place where it has more places to spend money than it has money. There are high fixed costs, e.g., roads, pipes, etc. However, it only collects $3.4 million in taxes; it needs $4.5 million. At $1000 in taxes per home, 1,100 new houses would be needed. This desired level of growth would increase the assessment base. But more homes &/or businesses means more people, and more people means more impact. The difficulty is how to put Minto’s finances a on a sounder footing without increasing its ecological footprint.
Town of Minto Integrated Sustainability Community Plan
Incite Planning Page 47 of 84 March 2011
Option D from the Target section of the Population chapter has some ecological suggestions for accomplishing this. However, from a fiscal point of view, developing sustainably requires a monetary return. A tax shift can potentially encourage growth that expands revenue streams and environmental dividends. By taxing land value rather than improvement Minto could encourage home building on the highest value land, i.e., serviced, urban locations, and assist in its revitalisation efforts of its downtowns. This cannot be done quickly or glibly. Minto has a small population on a large land base, and is at some distance from major economic activity. The benefits of such a shift can vary depending on current real estate market and development patterns. An understanding of and support for such change must be carefully crafted with politicians, staff, community groups, developers, businesses, and the public. Change creates uncertainty, and people can be remarkably committed to their current taxes. The cooperation of the province would certainly be necessary administratively, perhaps even legislatively. If this were to be contemplated, a through study and complete consultation would be required. A less onerous, though complementary, approach involves the lowering of development fees for projects that meet certain criteria for environmental performance. No change would be contemplated for suburban (just housing) development in rural settings. Few environmental benefits are to be had; either farmland or forest is destroyed and greenhouse gases from traffic increase. However, for development within walking distance of civic and retail amenities, jobs, and particularly the downtown cores a lower develop charge should be contemplated. For a project that excels in its performance, such as a LEED-ND (Leadership in Energy and Environmental Design – Neighbourhood Development) certified project consideration should be given to waiving fees altogether. One other approach is the “per unit use” pricing of municipal services such as water & sewage. Minto has just finalised its rate structure based on a 2009 study by C.N. Watson and Associates Ltd. Minto has adopted a blended flat rate/use rate approach. Metering is expensive, but as the Town’s experience should show usage should drop where it has been implemented. Re-examining metering would be wise during the next round of review for this topic. Using the items outlined in Figure 30 will assist Minto in its ongoing discussions regarding its fiscal responsibility.
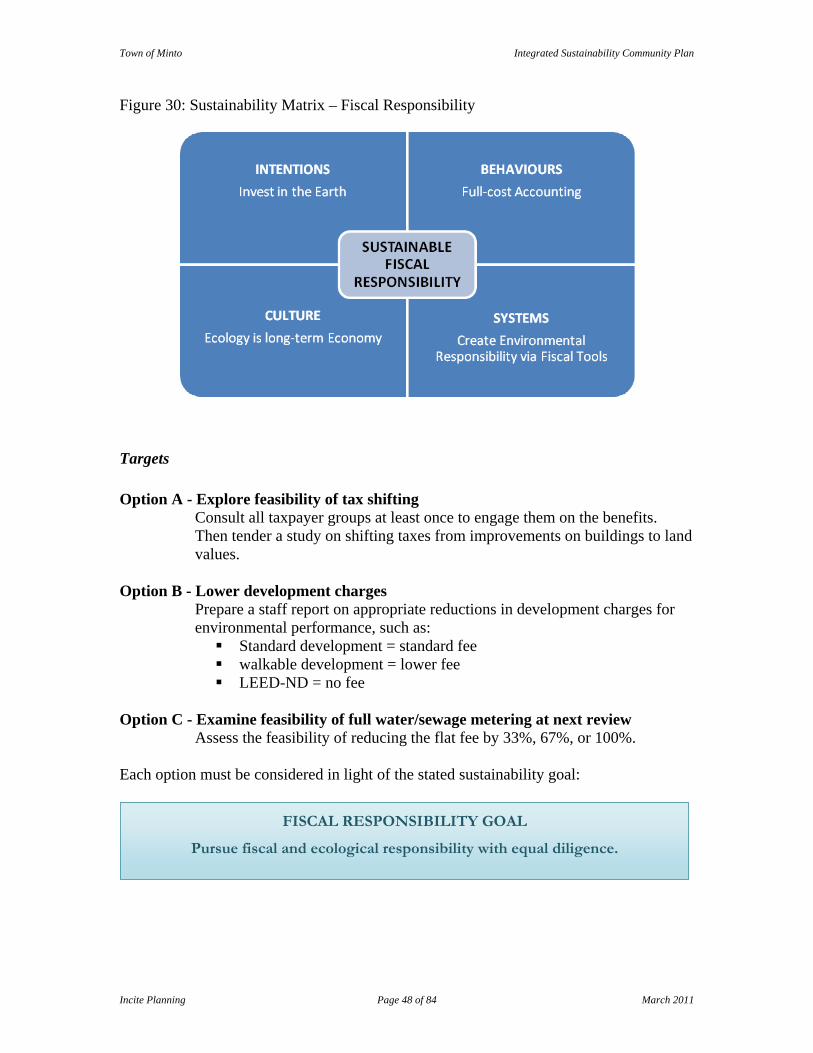
Town of Minto Integrated Sustainability Community Plan
Incite Planning Page 48 of 84 March 2011
Figure 30: Sustainability Matrix – Fiscal Responsibility
Targets Option A - Explore feasibility of tax shifting
Consult all taxpayer groups at least once to engage them on the benefits. Then tender a study on shifting taxes from improvements on buildings to land values.
Option B - Lower development charges
Prepare a staff report on appropriate reductions in development charges for environmental performance, such as:
Standard development = standard fee walkable development = lower fee LEED-ND = no fee
Option C - Examine feasibility of full water/sewage metering at next review
Assess the feasibility of reducing the flat fee by 33%, 67%, or 100%.
Each option must be considered in light of the stated sustainability goal:
FISCAL RESPONSIBILITY GOAL
Pursue fiscal and ecological responsibility with equal diligence.
Town of Minto Integrated Sustainability Community Plan
Incite Planning Page 49 of 84 March 2011
MAIN STREET
The TIP analysis raised questions regarding the use of the downtown areas. Is its role to support the community or is it a tourist niche? Will it be a narrowly-defined commercial zone, or will it be a “high street” designed for mixed use? Will it function as a separated, car-dependent location, or as a walk-able/cycle-able destination? Storefronts, safety, and whether cultural facilities could be on the main streets were also concerns, as was parking. On-site requirements may be unsustainable and should be reconsidered in favour of on-street parking and then parking behind buildings. Caution was urged regarding “regional centres” that are not designed as main streets with adjoining neighbourhoods. See the Main Street section of the “Land Use Theme” in Appendix J for a list of the issues and the documents from which they came. To understand this priority better, a main street profile and structure were prepared, and the implications for the ecological footprint were examined.
Main Street Profile Minto has several initiatives to improve its downtown areas. There is a façade matching grant programme where Minto will pay 50% of the cost of a façade improvement, up to $3,000. A similar programme exists for signage, but the limit is $1,000. Minto has tracked participation in these programmes and found that for every dollar it has spent, business owners have, on average, invested $3.86 of their own money. Anecdotal evidence suggests that owners who have taken advantage of these grants have seen an improvement in tourist traffic. Minto has also obtained grants to do its own streetscape improvements. It has upgraded the light standards, installed interlocking brick in boulevard spaces, sponsored public art such as murals on buildings, added benches, planters, flowers, trees, garbage containers, and created a public gathering space around the cenotaph in Harriston. However, the funding of grant programmes is starting to dry up and Minto is examining the formation of Business Improvement Areas in Harriston and Palmerston in order to raise the money needed to continue this work.
Main Street Structure There are three “main streets” in Minto. Each is found in one of the downtowns areas of the pre-amalgamation urban settlements; Elora Street in Clifford, Elora Street in Harriston, and Main Street Palmerston. Along their length, are generally found the
Main Street is the heart of a town. When it cradles
the civic and business life of a community it
becomes a large part of developing sustainably.
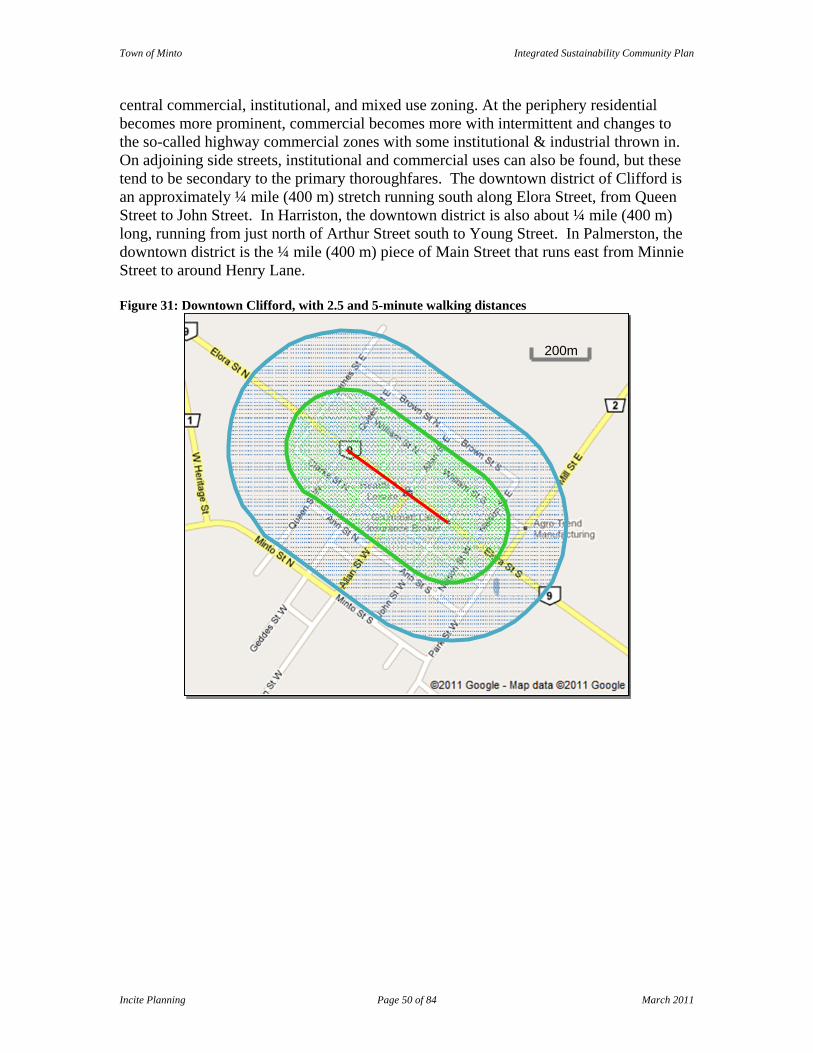
Town of Minto Integrated Sustainability Community Plan
Incite Planning Page 50 of 84 March 2011
central commercial, institutional, and mixed use zoning. At the periphery residential becomes more prominent, commercial becomes more with intermittent and changes to the so-called highway commercial zones with some institutional & industrial thrown in. On adjoining side streets, institutional and commercial uses can also be found, but these tend to be secondary to the primary thoroughfares. The downtown district of Clifford is an approximately ¼ mile (400 m) stretch running south along Elora Street, from Queen Street to John Street. In Harriston, the downtown district is also about ¼ mile (400 m) long, running from just north of Arthur Street south to Young Street. In Palmerston, the downtown district is the ¼ mile (400 m) piece of Main Street that runs east from Minnie Street to around Henry Lane. Figure 31: Downtown Clifford, with 2.5 and 5-minute walking distances
200m
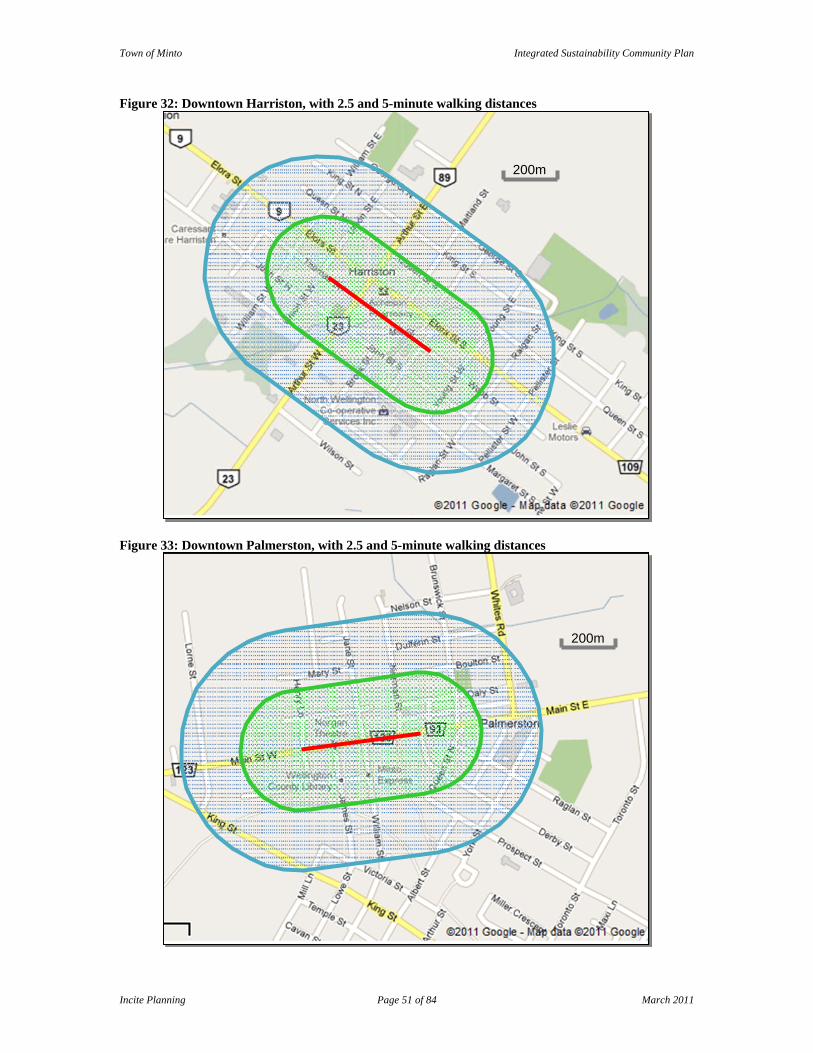
Town of Minto Integrated Sustainability Community Plan
Incite Planning Page 51 of 84 March 2011
Figure 32: Downtown Harriston, with 2.5 and 5-minute walking distances
Figure 33: Downtown Palmerston, with 2.5 and 5-minute walking distances
200m
200m
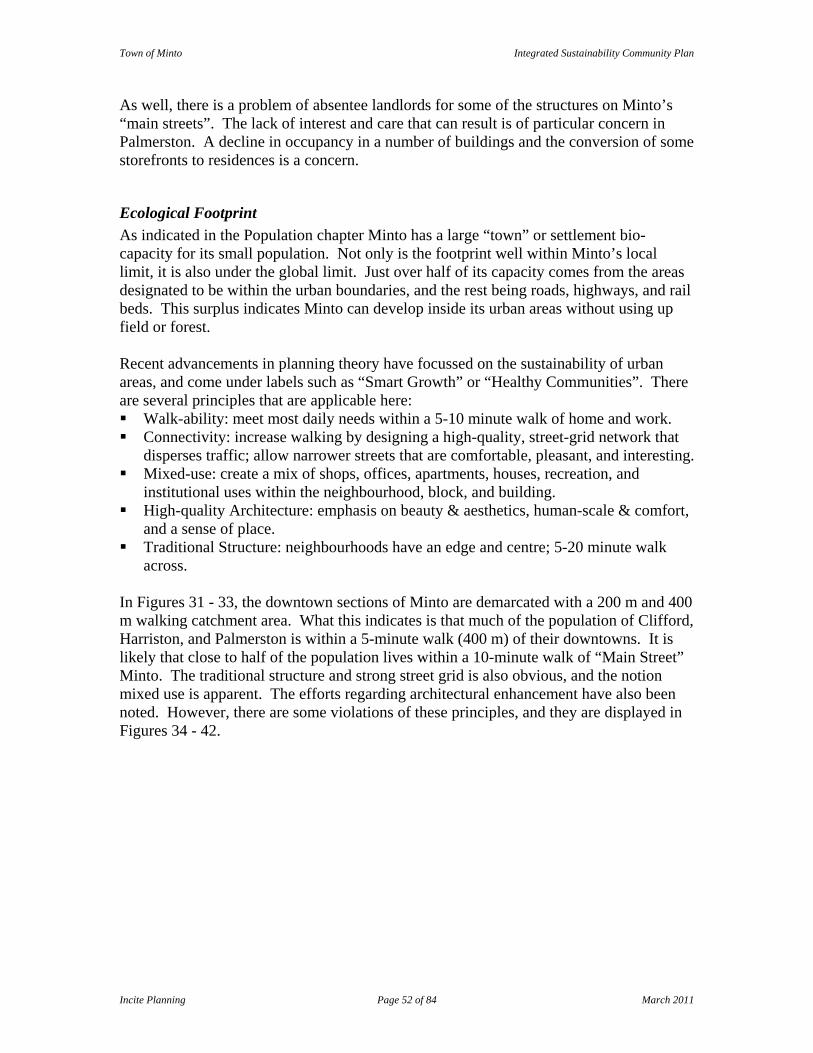
Town of Minto Integrated Sustainability Community Plan
Incite Planning Page 52 of 84 March 2011
As well, there is a problem of absentee landlords for some of the structures on Minto’s “main streets”. The lack of interest and care that can result is of particular concern in Palmerston. A decline in occupancy in a number of buildings and the conversion of some storefronts to residences is a concern.
Ecological Footprint As indicated in the Population chapter Minto has a large “town” or settlement bio-capacity for its small population. Not only is the footprint well within Minto’s local limit, it is also under the global limit. Just over half of its capacity comes from the areas designated to be within the urban boundaries, and the rest being roads, highways, and rail beds. This surplus indicates Minto can develop inside its urban areas without using up field or forest. Recent advancements in planning theory have focussed on the sustainability of urban areas, and come under labels such as “Smart Growth” or “Healthy Communities”. There are several principles that are applicable here: Walk-ability: meet most daily needs within a 5-10 minute walk of home and work. Connectivity: increase walking by designing a high-quality, street-grid network that
disperses traffic; allow narrower streets that are comfortable, pleasant, and interesting. Mixed-use: create a mix of shops, offices, apartments, houses, recreation, and
institutional uses within the neighbourhood, block, and building. High-quality Architecture: emphasis on beauty & aesthetics, human-scale & comfort,
and a sense of place. Traditional Structure: neighbourhoods have an edge and centre; 5-20 minute walk
across. In Figures 31 - 33, the downtown sections of Minto are demarcated with a 200 m and 400 m walking catchment area. What this indicates is that much of the population of Clifford, Harriston, and Palmerston is within a 5-minute walk (400 m) of their downtowns. It is likely that close to half of the population lives within a 10-minute walk of “Main Street” Minto. The traditional structure and strong street grid is also obvious, and the notion mixed use is apparent. The efforts regarding architectural enhancement have also been noted. However, there are some violations of these principles, and they are displayed in Figures 34 - 42.
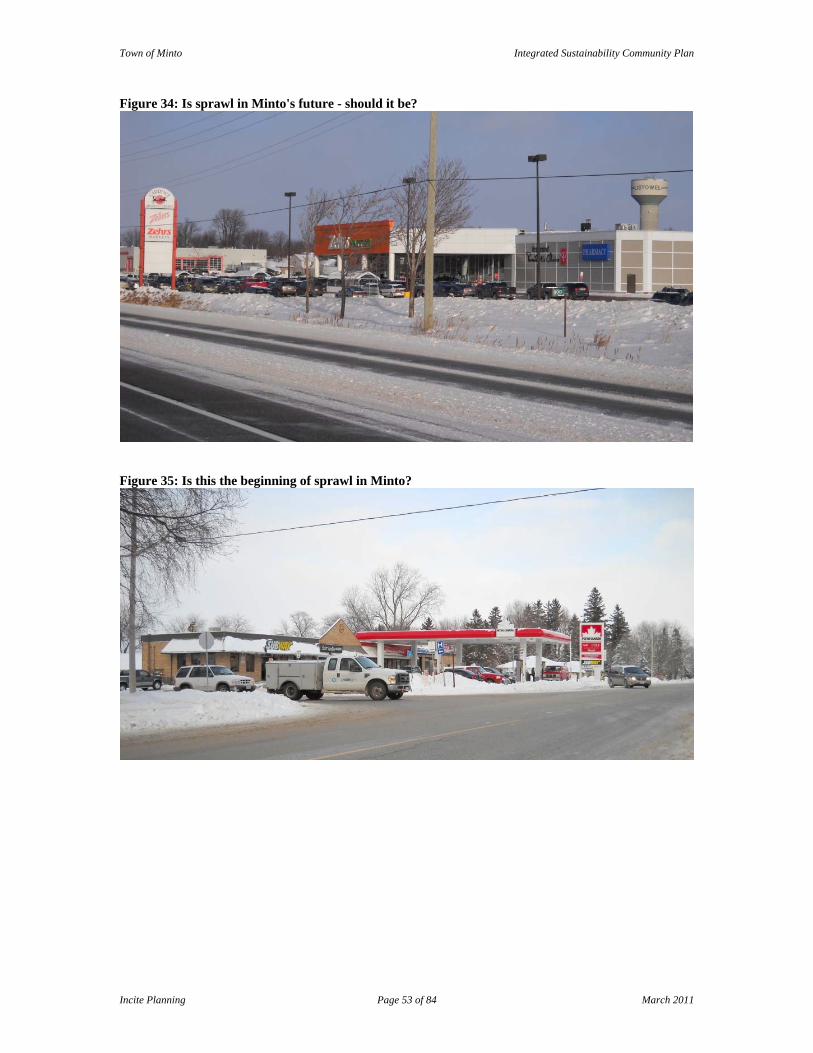
Town of Minto Integrated Sustainability Community Plan
Incite Planning Page 53 of 84 March 2011
Figure 34: Is sprawl in Minto's future - should it be?
Figure 35: Is this the beginning of sprawl in Minto?
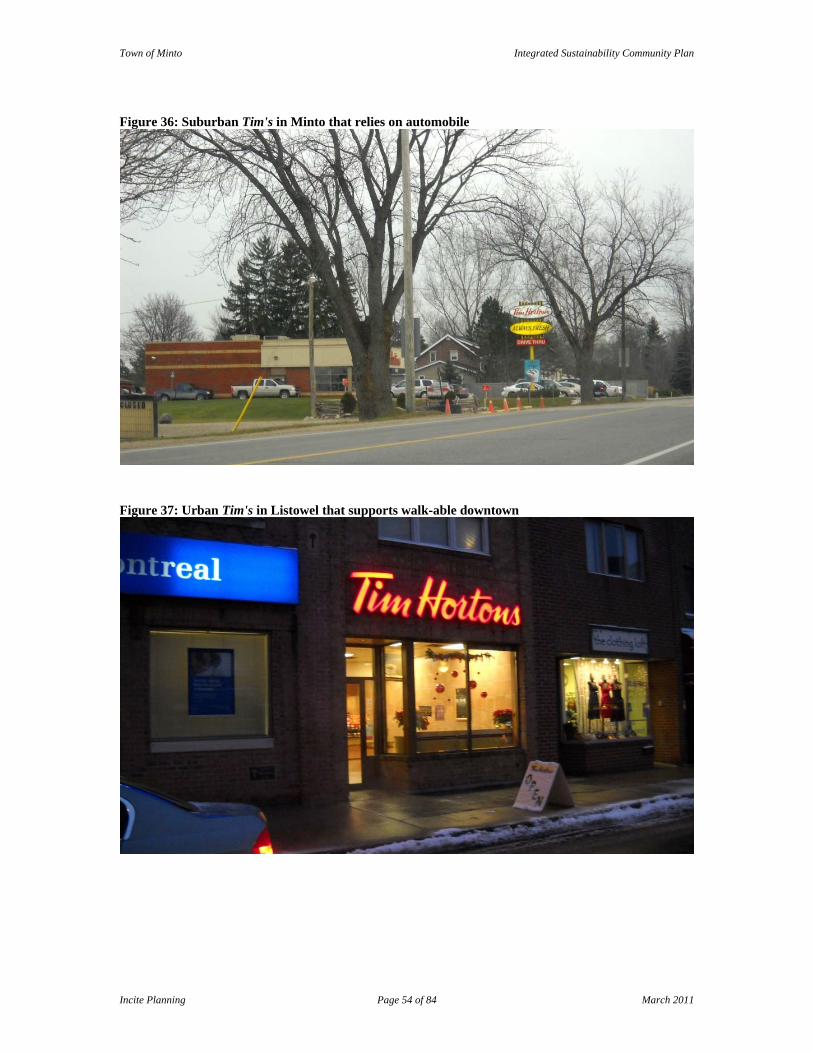
Town of Minto Integrated Sustainability Community Plan
Incite Planning Page 54 of 84 March 2011
Figure 36: Suburban Tim's in Minto that relies on automobile
Figure 37: Urban Tim's in Listowel that supports walk-able downtown
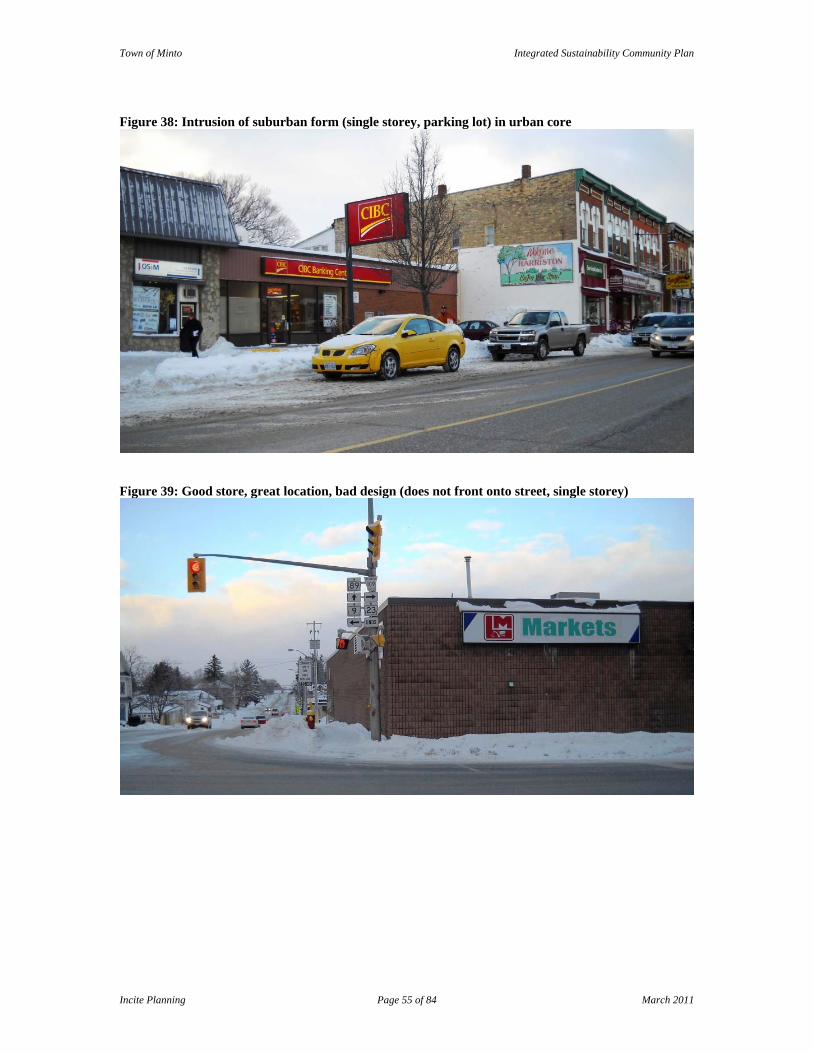
Town of Minto Integrated Sustainability Community Plan
Incite Planning Page 55 of 84 March 2011
Figure 38: Intrusion of suburban form (single storey, parking lot) in urban core
Figure 39: Good store, great location, bad design (does not front onto street, single storey)
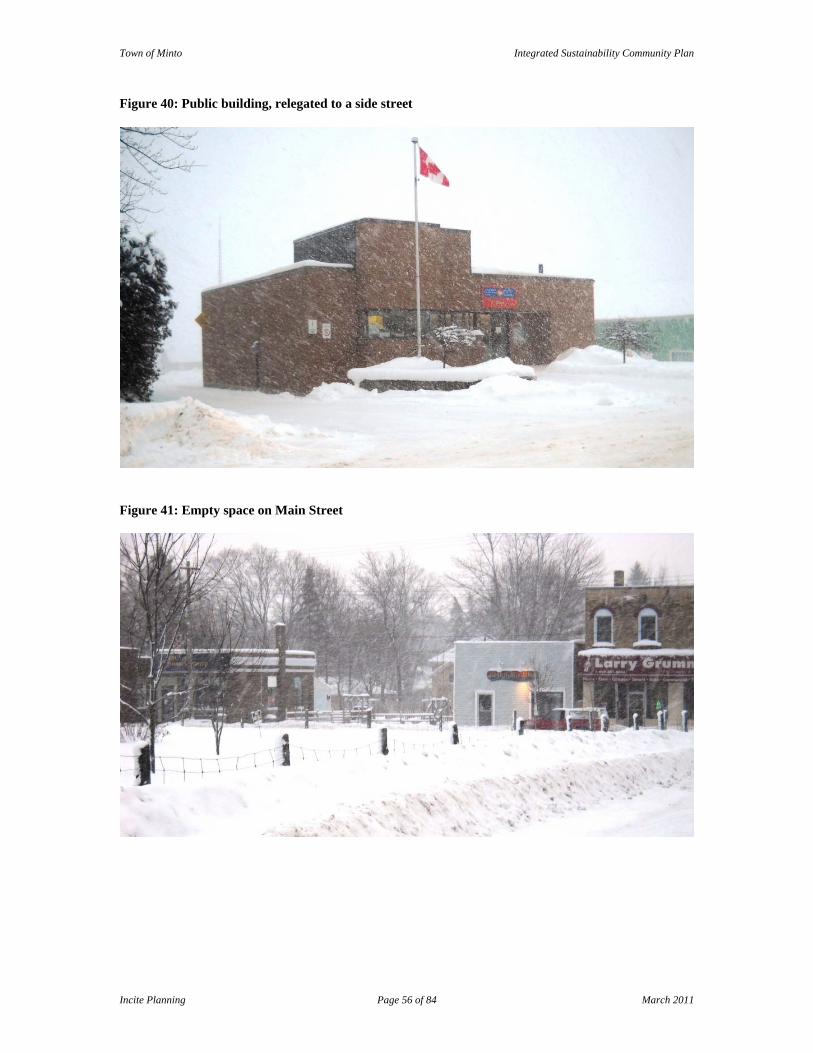
Town of Minto Integrated Sustainability Community Plan
Incite Planning Page 56 of 84 March 2011
Figure 40: Public building, relegated to a side street
Figure 41: Empty space on Main Street
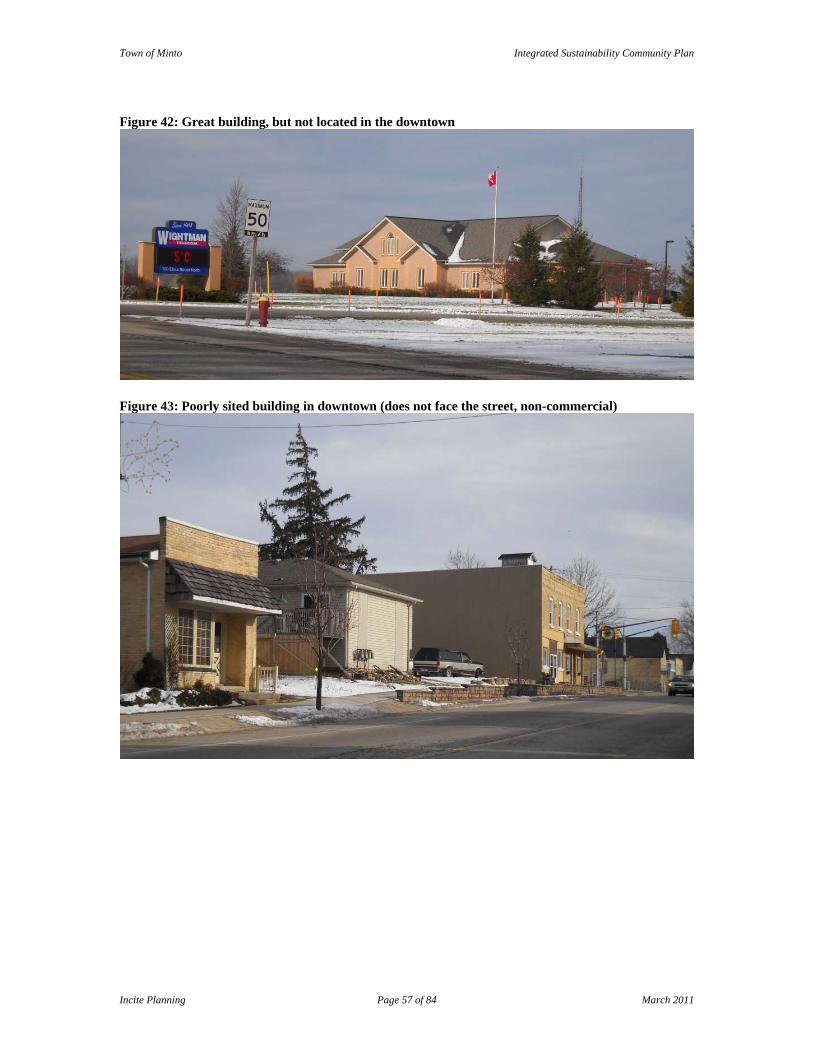
Town of Minto Integrated Sustainability Community Plan
Incite Planning Page 57 of 84 March 2011
Figure 42: Great building, but not located in the downtown
Figure 43: Poorly sited building in downtown (does not face the street, non-commercial)
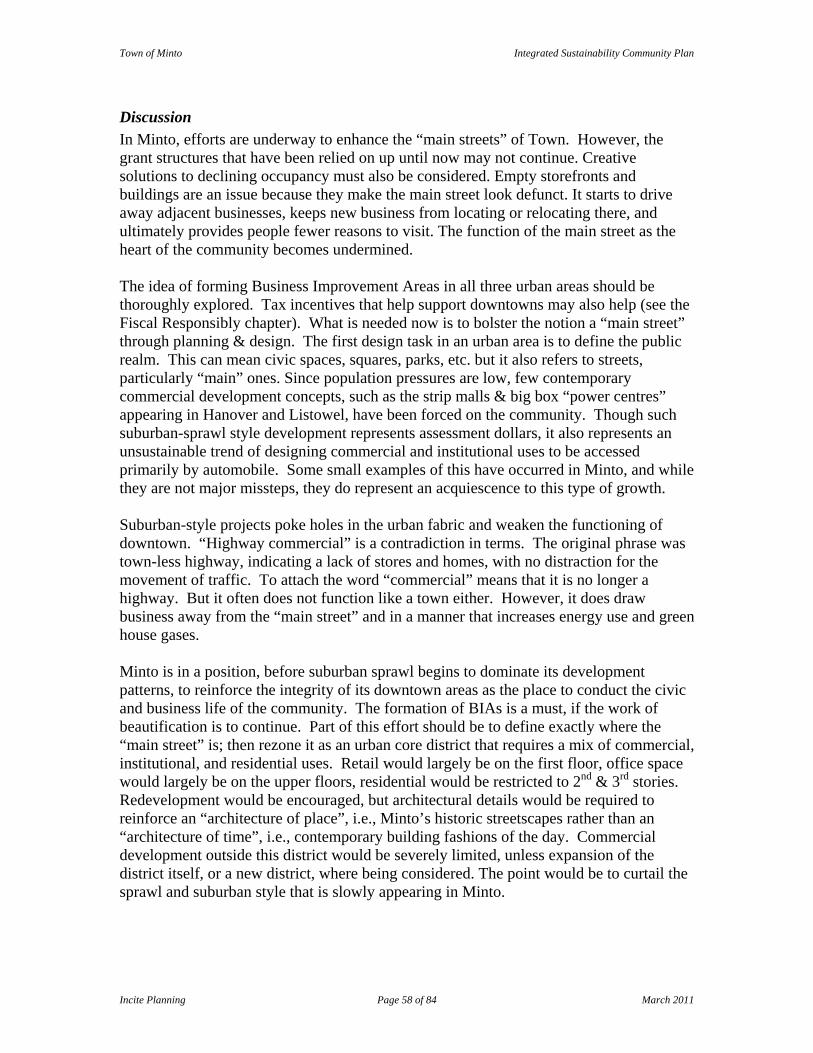
Town of Minto Integrated Sustainability Community Plan
Incite Planning Page 58 of 84 March 2011
Discussion In Minto, efforts are underway to enhance the “main streets” of Town. However, the grant structures that have been relied on up until now may not continue. Creative solutions to declining occupancy must also be considered. Empty storefronts and buildings are an issue because they make the main street look defunct. It starts to drive away adjacent businesses, keeps new business from locating or relocating there, and ultimately provides people fewer reasons to visit. The function of the main street as the heart of the community becomes undermined. The idea of forming Business Improvement Areas in all three urban areas should be thoroughly explored. Tax incentives that help support downtowns may also help (see the Fiscal Responsibly chapter). What is needed now is to bolster the notion a “main street” through planning & design. The first design task in an urban area is to define the public realm. This can mean civic spaces, squares, parks, etc. but it also refers to streets, particularly “main” ones. Since population pressures are low, few contemporary commercial development concepts, such as the strip malls & big box “power centres” appearing in Hanover and Listowel, have been forced on the community. Though such suburban-sprawl style development represents assessment dollars, it also represents an unsustainable trend of designing commercial and institutional uses to be accessed primarily by automobile. Some small examples of this have occurred in Minto, and while they are not major missteps, they do represent an acquiescence to this type of growth. Suburban-style projects poke holes in the urban fabric and weaken the functioning of downtown. “Highway commercial” is a contradiction in terms. The original phrase was town-less highway, indicating a lack of stores and homes, with no distraction for the movement of traffic. To attach the word “commercial” means that it is no longer a highway. But it often does not function like a town either. However, it does draw business away from the “main street” and in a manner that increases energy use and green house gases. Minto is in a position, before suburban sprawl begins to dominate its development patterns, to reinforce the integrity of its downtown areas as the place to conduct the civic and business life of the community. The formation of BIAs is a must, if the work of beautification is to continue. Part of this effort should be to define exactly where the “main street” is; then rezone it as an urban core district that requires a mix of commercial, institutional, and residential uses. Retail would largely be on the first floor, office space would largely be on the upper floors, residential would be restricted to 2nd & 3rd stories. Redevelopment would be encouraged, but architectural details would be required to reinforce an “architecture of place”, i.e., Minto’s historic streetscapes rather than an “architecture of time”, i.e., contemporary building fashions of the day. Commercial development outside this district would be severely limited, unless expansion of the district itself, or a new district, where being considered. The point would be to curtail the sprawl and suburban style that is slowly appearing in Minto.
Town of Minto Integrated Sustainability Community Plan
Incite Planning Page 59 of 84 March 2011
These efforts will begin to provide a structure to for supporting the downtown areas. A more immediate result may come from a suggestion that arose during the public consultation; that of “renting” storefronts to artisans for free, until paying clients are
found. They receive a space in which to practise their craft, display it, and perhaps accommodate themselves, in exchange for occupying the space the, keeping it tidy, and thus contributing to the street life of the community.
Targets Option A - Establish a mechanism to continue main street beautification
Form BIAs in Clifford, Harriston, and Palmerston Option B - Focus commercial & institutional development in downtown core
Define downtown districts that require a mix of commercial, institutional, residential uses within the building, the lot, and the district. Zoning categories would have to be revised to require civic and commercial activity in the core. Architectural Standards would have to be created to reinforce a sense of place that reflects the detail of Minto’s historic streetscapes.
Option C: Lower storefront vacancy
Decrease vacancies by 33%, 67%, or 100%, by designing a storefront-artisan programme that offers free rent in exchange for occupancy of an otherwise derelict space on Minto’s main streets.
Each option must be considered in light of the stated sustainability goal:
MAIN STREET GOAL
Build Main Streets that support the business and civic life of Minto.
Town of Minto Integrated Sustainability Community Plan
Incite Planning Page 60 of 84 March 2011
BUSINESS
The TIP analysis raised concerns regarding the type of business that Minto wants to attract or create, and the social and ecological impact that it might have. Tourism was a theme in Minto’s documents, in terms of integrating it with agricultural, retail, and Community Improvement Plan activities. However, money is lost with a reliance on external retail & tourist operators. Whether existing businesses will expand or contract in the current circumstances is a question as well. Can innovative funding be found to assist them, and is developing sustainability a priority? The level of knowledge regarding the community’s Economic Plan and questions about its effectiveness were also a concern. The amount of shopping outside the community and the segregation of land uses were flagged as undermining the central business districts of Minto.
Business Profile Minto has a number of initiatives underway to improve the sustainability of business. “Think Minto First” is a buy-local campaign run by the Chamber of Commerce. A postcard has been published summarising the benefits of shopping locally, which in many ways is a checklist of developing sustainably: Keep Dollars in Minto’s Economy – local shopping has 3x the impact in terms of
jobs, services, community improvement & development than shopping elsewhere. Community Well-Being – local businesses link neighbourhoods and support local
causes. Jobs & Wages – local businesses create more jobs than national chains. Preserve Entrepreneurship – local business provides prosperity, innovation, and
inspiration to the youth of Minto. Environmental Sustainability – local business can support walkable, vibrant
downtowns which reduce traffic and pollution. Benefit from Local Owners & Expertise – local owners and employees often possess
a passion and knowledge about what they provide, and an interest in understanding their customers/neighbours.
The Chamber sells “Minto Chamber Bucks”, a coupon redeemable at participating local businesses. They can be purchased at specific depots in Clifford, Harriston, and Palmerston at a 10% discount subsidised by the Chamber and is an incentive to shop locally. Chamber gift certificates are also available through local associations, such as minor hockey. They sell the certificates on behalf of a community business. The business then donates a percentage back to the group.
Sustainability requires that money be made in a
manner that does not harm people or the planet.
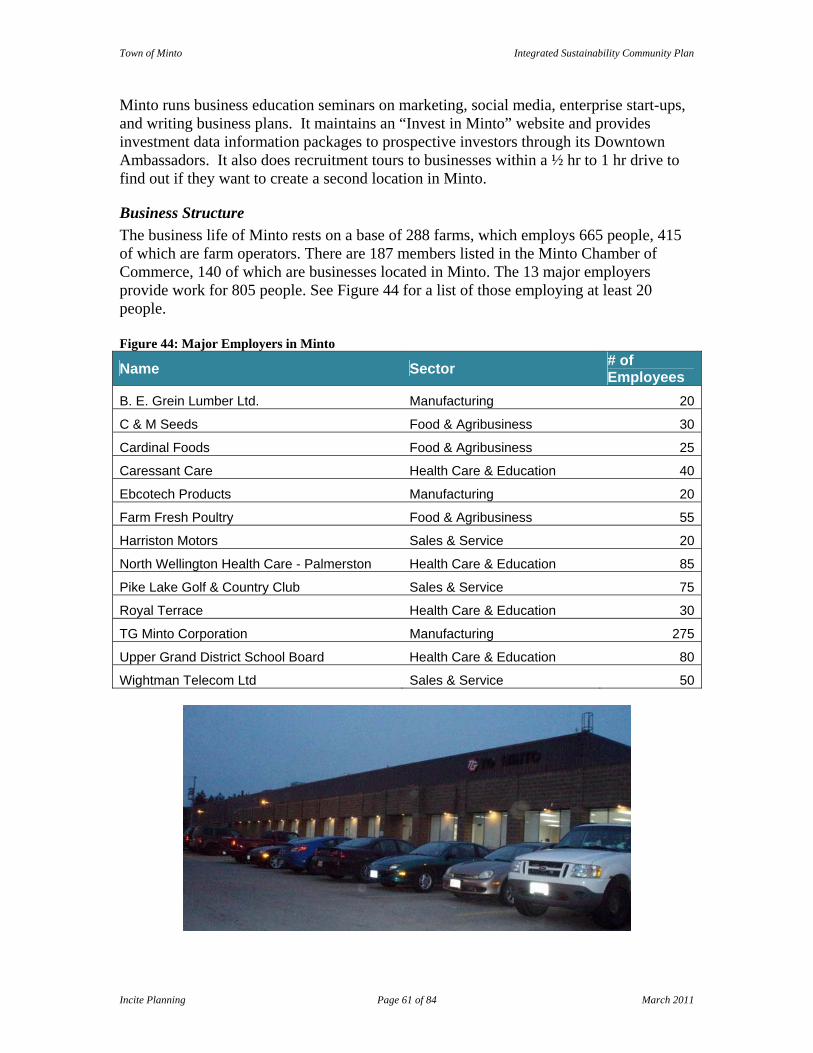
Town of Minto Integrated Sustainability Community Plan
Incite Planning Page 61 of 84 March 2011
Minto runs business education seminars on marketing, social media, enterprise start-ups, and writing business plans. It maintains an “Invest in Minto” website and provides investment data information packages to prospective investors through its Downtown Ambassadors. It also does recruitment tours to businesses within a ½ hr to 1 hr drive to find out if they want to create a second location in Minto.
Business Structure The business life of Minto rests on a base of 288 farms, which employs 665 people, 415 of which are farm operators. There are 187 members listed in the Minto Chamber of Commerce, 140 of which are businesses located in Minto. The 13 major employers provide work for 805 people. See Figure 44 for a list of those employing at least 20 people. Figure 44: Major Employers in Minto
Name Sector # of Employees
B. E. Grein Lumber Ltd. Manufacturing 20
C & M Seeds Food & Agribusiness 30
Cardinal Foods Food & Agribusiness 25
Caressant Care Health Care & Education 40
Ebcotech Products Manufacturing 20
Farm Fresh Poultry Food & Agribusiness 55
Harriston Motors Sales & Service 20
North Wellington Health Care - Palmerston Health Care & Education 85
Pike Lake Golf & Country Club Sales & Service 75
Royal Terrace Health Care & Education 30
TG Minto Corporation Manufacturing 275
Upper Grand District School Board Health Care & Education 80
Wightman Telecom Ltd Sales & Service 50
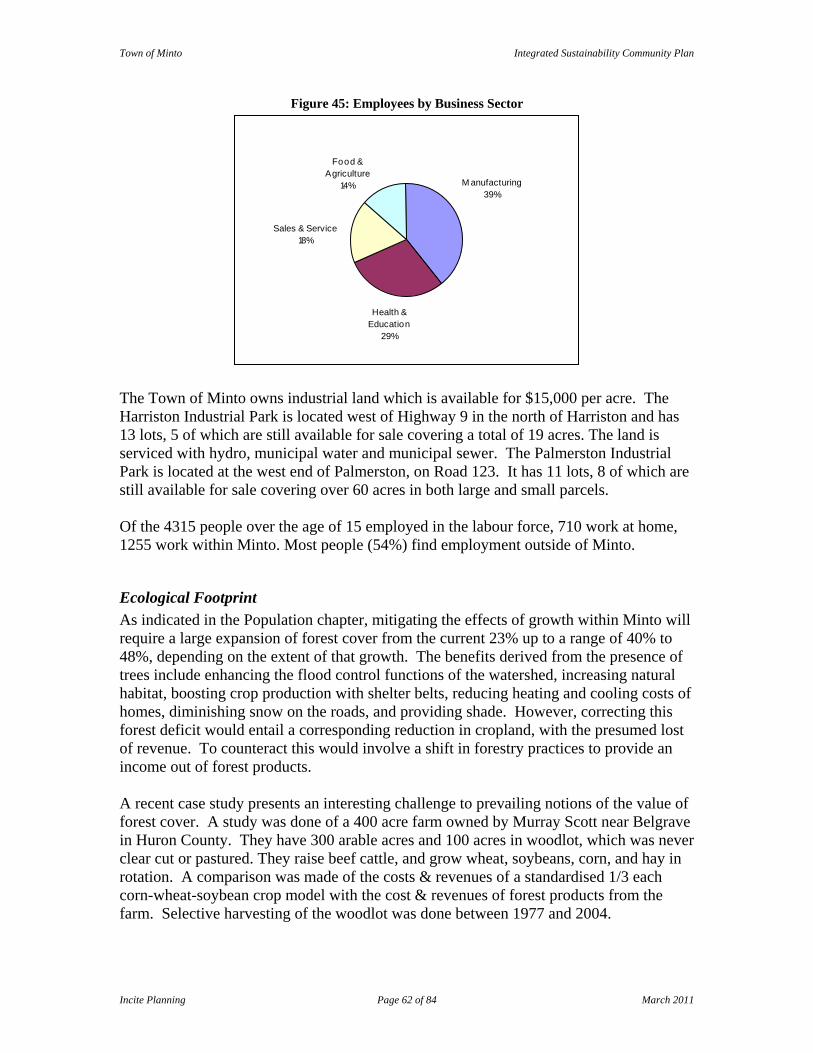
Town of Minto Integrated Sustainability Community Plan
Incite Planning Page 62 of 84 March 2011
Figure 45: Employees by Business Sector
Health & Education
29%
Food & Agriculture
14%
Sales & Service18%
M anufacturing39%
The Town of Minto owns industrial land which is available for $15,000 per acre. The Harriston Industrial Park is located west of Highway 9 in the north of Harriston and has 13 lots, 5 of which are still available for sale covering a total of 19 acres. The land is serviced with hydro, municipal water and municipal sewer. The Palmerston Industrial Park is located at the west end of Palmerston, on Road 123. It has 11 lots, 8 of which are still available for sale covering over 60 acres in both large and small parcels. Of the 4315 people over the age of 15 employed in the labour force, 710 work at home, 1255 work within Minto. Most people (54%) find employment outside of Minto.
Ecological Footprint As indicated in the Population chapter, mitigating the effects of growth within Minto will require a large expansion of forest cover from the current 23% up to a range of 40% to 48%, depending on the extent of that growth. The benefits derived from the presence of trees include enhancing the flood control functions of the watershed, increasing natural habitat, boosting crop production with shelter belts, reducing heating and cooling costs of homes, diminishing snow on the roads, and providing shade. However, correcting this forest deficit would entail a corresponding reduction in cropland, with the presumed lost of revenue. To counteract this would involve a shift in forestry practices to provide an income out of forest products. A recent case study presents an interesting challenge to prevailing notions of the value of forest cover. A study was done of a 400 acre farm owned by Murray Scott near Belgrave in Huron County. They have 300 arable acres and 100 acres in woodlot, which was never clear cut or pastured. They raise beef cattle, and grow wheat, soybeans, corn, and hay in rotation. A comparison was made of the costs & revenues of a standardised 1/3 each corn-wheat-soybean crop model with the cost & revenues of forest products from the farm. Selective harvesting of the woodlot was done between 1977 and 2004.
Town of Minto Integrated Sustainability Community Plan
Incite Planning Page 63 of 84 March 2011
To make the comparison fair the margins were calculated according to their Net Present Value in 2004 based on investing the profits at a 5%, 7.5%, & 10% compound rate of return over that twenty-seven year period. The results on a per acre basis were quite revealing. At the lowest rate cropland earned $3,148/acre while forest earned $7,775/acre. At the highest rate cropland earned $6,937/acre while forest earned $18,357/acre. This means that the Scott woodlot earned anywhere from 147% to 165% more profit/acre than did their cropland. Thus, the expansion of Minto’s forest cover could actually be the foundation for enhancing the agricultural basis of Minto’s business community. Also indicated in the Population chapter, is the fact that a large part of the ecological footprint that Minto has comes from the energy required to maintain daily activities, including driving to jobs, plus the energy required to produce goods and services. Energy is consumed in shipping both in and out of the community. Currently (2011), Minto’s energy deficit is 57%; in 10 years it will be 62% assuming current trends in consumption remain the same. It will rise to 73% if the desired level of population growth is achieved. Addressing this energy deficit will involve a shift from the centralised energy grid to a distributed energy grid. Power will have to be generated in as many places as possible, rather than a few, and as close as possible the user. Rather than relying on the elite energies of coal, petroleum, and uranium, secured only at vast expense, it will involve a modest investment to obtain readily available renewable energies. These can be found wherever the sun shines, the wind blows, the waves roll, the ground is warm, the fields & forests are harvested, or municipal & personal wastes are generated. Storage mechanisms for this energy and an updating of the grid to manage both use and generation will also be necessary. Despite the difficulties with implementation, the introduction of the Green Energy and Green Economy Act (2009) in Ontario has pointed the way to this next economy. As an industrialised country, Canada is inefficient. We do have long distances and cold weather to overcome, but we are also wasteful with energy and have pursued energy intense industry. It has been predicted that energy use will become a primary economic driver in the next decade. Therefore both the conservation of energy and renewable forms of energy will be crucial for business.
Town of Minto Integrated Sustainability Community Plan
Incite Planning Page 64 of 84 March 2011
Discussion In Minto, efforts are underway to support local business and encourage local shopping. What has not been addressed is the impact of energy use in the sustainability of business, nor the business that can be created from the energy sector. Given the agricultural base of business in Minto, much could be done to improve energy use through on-farm power production. Methane digestion from cow manure can create 2 kWh a day. A farm co-op setup for this purpose can generate electricity under the Feed-in-Tariff (FIT) programme of the Ontario Power Authority. Minto also cultivates 5,650 ha of soybeans; 565 to 1130 ha could be converted to the production of biodiesel for on-farm use, since 10-20 acres of soybeans is enough to run a 100 acre farm. There are 4,180 ha in alfalfa/mixes, tame hay & fodder. Crops such switch-grass could be easily introduced into this system and produced for its energy content. As a perennial it can protect the soil and supplement farm income; as part of a cropping rotation, it can be used as pellet feedstock and not compete directly with food. Initiating a discussion with the farm community regarding the possibilities for farm-based renewables would expand agricultural diversification and help reduce the impact of Minto’s energy deficit. Business and industry will also benefit from the exploration of renewable energy and conservation as the core of business development. Efficiency with resources, rather than labour, will become the basis of business survival and growth. The promotion of energy audits, and their completion, will start Minto business down this path. The next step for Minto is to begin discussing with its businesses the impact that they currently have, and the potential impact that future businesses in Minto would not have.
CASE STUDY
One of the foremost leaders in
industrial innovation is American Ray
Anderson, who started Interface Carpet
in 1973. By the mid-90s his customers
began to question what environmental
efforts they were making. He began to
think about the role of business in
environmental issues, and after reading
Paul Hawkins “Natural Capitalism” in
1994, he set a goal for his company of
having no net ecological impact by the
year 2020. They began by reducing
waste in their processes. Next they
looked at how to lower the emissions
the company was generating. After
that they examined how to shift to
renewal forms of energy. By re-
engineering their material flows they
essentially rent carpets and take it back
for reprocessing rather than sending it
to landfill. They looked at the
transportation systems in order to
reduce the impact of shipping. These
changes culminated in a corporate
culture shift that made sustainability
the way business was done. Ray has
now taken on an advocacy role in the
effort to ‘reinvent’ commerce and place
it on a sustainable footing.
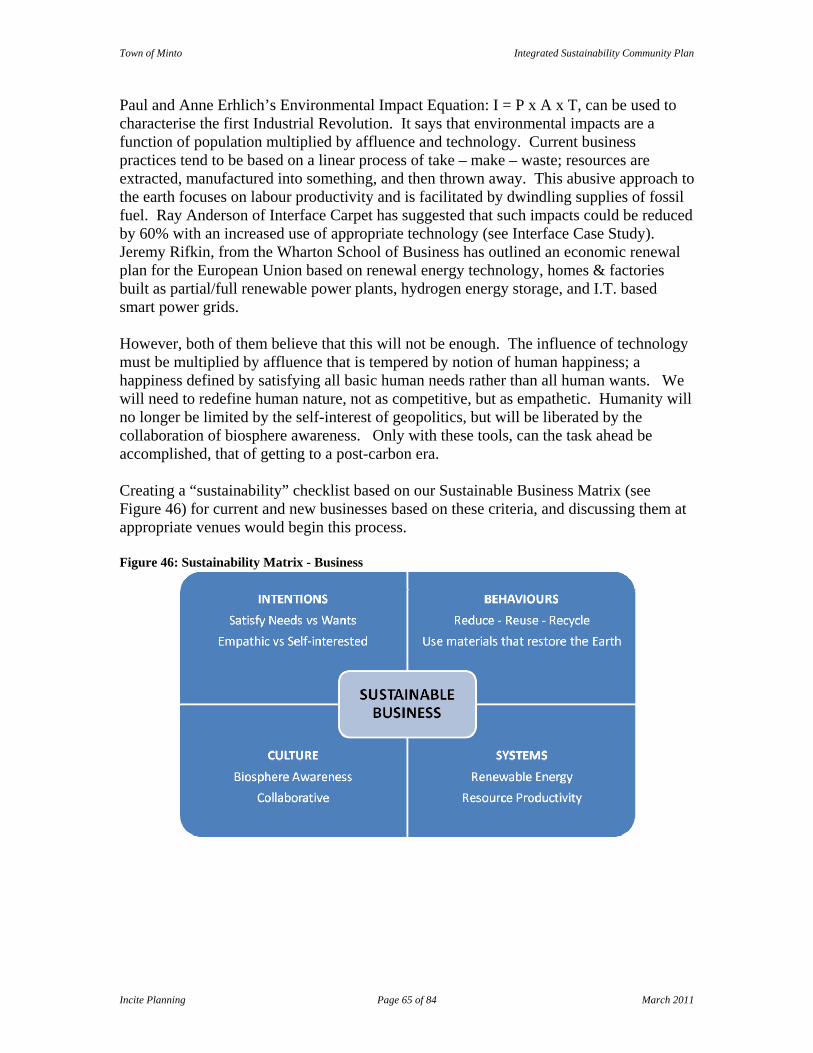
Town of Minto Integrated Sustainability Community Plan
Incite Planning Page 65 of 84 March 2011
Paul and Anne Erhlich’s Environmental Impact Equation: I = P x A x T, can be used to characterise the first Industrial Revolution. It says that environmental impacts are a function of population multiplied by affluence and technology. Current business practices tend to be based on a linear process of take – make – waste; resources are extracted, manufactured into something, and then thrown away. This abusive approach to the earth focuses on labour productivity and is facilitated by dwindling supplies of fossil fuel. Ray Anderson of Interface Carpet has suggested that such impacts could be reduced by 60% with an increased use of appropriate technology (see Interface Case Study). Jeremy Rifkin, from the Wharton School of Business has outlined an economic renewal plan for the European Union based on renewal energy technology, homes & factories built as partial/full renewable power plants, hydrogen energy storage, and I.T. based smart power grids. However, both of them believe that this will not be enough. The influence of technology must be multiplied by affluence that is tempered by notion of human happiness; a happiness defined by satisfying all basic human needs rather than all human wants. We will need to redefine human nature, not as competitive, but as empathetic. Humanity will no longer be limited by the self-interest of geopolitics, but will be liberated by the collaboration of biosphere awareness. Only with these tools, can the task ahead be accomplished, that of getting to a post-carbon era. Creating a “sustainability” checklist based on our Sustainable Business Matrix (see Figure 46) for current and new businesses based on these criteria, and discussing them at appropriate venues would begin this process. Figure 46: Sustainability Matrix - Business
Town of Minto Integrated Sustainability Community Plan
Incite Planning Page 66 of 84 March 2011
Targets Option A - Agricultural diversification through on-farm biofuels
Work with Barry Cleave of the former Centre for Applied Renewable Energy, and Don Knott, a switch grass grower from Clinton, to set up workshop/field day for practical addition of so called “energy” plants into crop rotations. Of the 83 farms growing soybeans, introduce on-farm bio-diesel production and use to 5% (4 farms), 10% (8 farms), or 20% (17 farms). Of the 235 farms growing fodder, introduce switch grass production to 5% (12 farms), 10% (24 farms), or 20% (47 farms).
Option B - Conserve energy & increase efficiency as basis of business survival
Seek out energy auditors to set up shop in Minto, and discuss conducting energy audits with all major employers. Aim for 25% home audits, 50% commercial audits, and100% industry audits.
Option C - Develop renewable energy as the core of business development
Explore the possibility of at least one municipal energy project, one farmer energy co-operative, one community power project, by inviting the Ontario Sustainable Energy Association to give seminars on community-owned power projects.
Option D - Promote business “sustainability” thorough supportive networks
Develop a best practices checklist for a business seminar series. As well, organise trade-show for Minto businesses that highlights environmental and energy innovations.
Each option must be considered in light of the stated sustainability goal:
BUSINESS GOAL
Create and retain enterprises that have low environmental impact and provide
fulfilling jobs for the people of Minto.
Town of Minto Integrated Sustainability Community Plan
Incite Planning Page 67 of 84 March 2011
SOCIAL
The TIP analysis raised concerns regarding the closing of a rink, the other uses that might be made of arena slabs, and what type of model was being used for recreation, an entrepreneurial, welfare, or cultural approach. Were subjective or objective factors being used to determine whether Minto was a healthy community? Could a sustainable community event such as a sustainable career open-house be planned?
Social Profile As indicated in the Population chapter, Minto has a median income $7,821 less than that for the province as a whole ($52,634 vs $60,455). Thirteen percent more people in Minto, over the age of 15, have no certificate, diploma, or degree ( 35% vs 22%). However, both the labour force participation rate (67.8% vs 67.1%) and employment rate (65.3% vs 62.8%) are higher. Minto has more young people (20.3% vs 18.2%) under fifteen and older people (22.4% vs 18.4%) over fifty-nine. Though the health of a population can be tied to such factors, they are not absolute and opportunities for active living are a vital component of wellbeing.
Social Structure In terms of the possible recreational and social activities, Minto has a fair number of opportunities for both youth and adults. The focus is on low-cost, non-competitive programmes. At the introductory level there are 2 minor hockey teams, 3 skating clubs, junior broom-ball, a gymnastic club, a dance academy, Scouts & Girl guides, and 15 churches have organised youth activates. There is a home-town baseball league, T-ball, ball hockey, and grass-roots soccer & girl’s hockey. In summer there are pool & day camps. There is a need for more volunteers to run these programmes, and better marketing to bolster participation. Minor sports often host tournaments to pay for things such as ice time. In the past year, there have been 2 curling bonspiels, 20 hockey, 4 adult broomball, 3 girls fastball, 4-5 slowpitch, and 2 minor ball. For adults, there are two fitness programmes focussing on such activities as Yoga, Cardio-fitness, Tai-chi, and Belly-dancing. There is public skating (adult & tot) and recreational & Sunday league hockey. There is seniors skating and senior’s A & B hockey. As well, there is a senior’s fitness group, a “55 vitality” group, and organised walking through the VON. The 3 senior’s clubs arrange for trips such as Christmas light tours, plays at Stratford, fall colours in Bala, Midland boat cruises, etc.
Sustainability means that the opportunities for
active living are created and maintained.
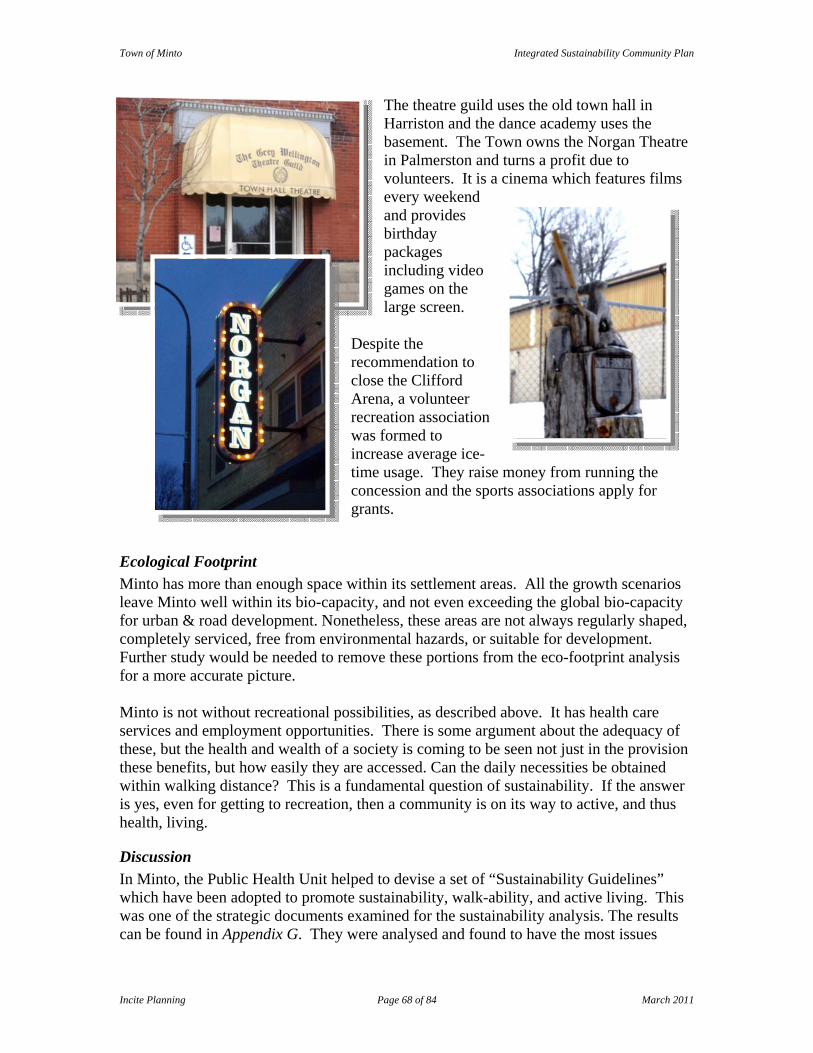
Town of Minto Integrated Sustainability Community Plan
Incite Planning Page 68 of 84 March 2011
The theatre guild uses the old town hall in Harriston and the dance academy uses the basement. The Town owns the Norgan Theatre in Palmerston and turns a profit due to volunteers. It is a cinema which features films every weekend and provides birthday packages including video games on the large screen.
Despite the recommendation to close the Clifford Arena, a volunteer recreation association was formed to increase average ice-time usage. They raise money from running the concession and the sports associations apply for grants.
Ecological Footprint Minto has more than enough space within its settlement areas. All the growth scenarios leave Minto well within its bio-capacity, and not even exceeding the global bio-capacity for urban & road development. Nonetheless, these areas are not always regularly shaped, completely serviced, free from environmental hazards, or suitable for development. Further study would be needed to remove these portions from the eco-footprint analysis for a more accurate picture. Minto is not without recreational possibilities, as described above. It has health care services and employment opportunities. There is some argument about the adequacy of these, but the health and wealth of a society is coming to be seen not just in the provision these benefits, but how easily they are accessed. Can the daily necessities be obtained within walking distance? This is a fundamental question of sustainability. If the answer is yes, even for getting to recreation, then a community is on its way to active, and thus health, living.
Discussion In Minto, the Public Health Unit helped to devise a set of “Sustainability Guidelines” which have been adopted to promote sustainability, walk-ability, and active living. This was one of the strategic documents examined for the sustainability analysis. The results can be found in Appendix G. They were analysed and found to have the most issues
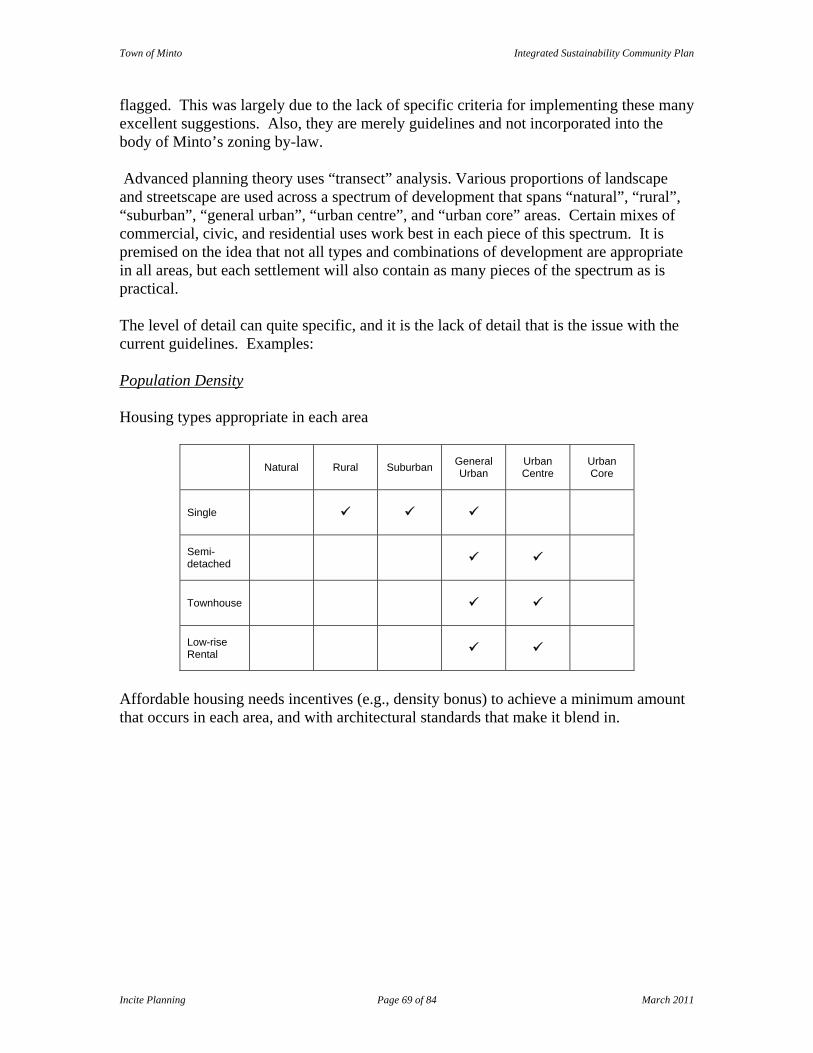
Town of Minto Integrated Sustainability Community Plan
Incite Planning Page 69 of 84 March 2011
flagged. This was largely due to the lack of specific criteria for implementing these many excellent suggestions. Also, they are merely guidelines and not incorporated into the body of Minto’s zoning by-law. Advanced planning theory uses “transect” analysis. Various proportions of landscape and streetscape are used across a spectrum of development that spans “natural”, “rural”, “suburban”, “general urban”, “urban centre”, and “urban core” areas. Certain mixes of commercial, civic, and residential uses work best in each piece of this spectrum. It is premised on the idea that not all types and combinations of development are appropriate in all areas, but each settlement will also contain as many pieces of the spectrum as is practical. The level of detail can quite specific, and it is the lack of detail that is the issue with the current guidelines. Examples: Population Density Housing types appropriate in each area
Affordable housing needs incentives (e.g., density bonus) to achieve a minimum amount that occurs in each area, and with architectural standards that make it blend in.
Natural Rural Suburban General Urban
Urban Centre
Urban Core
Single
Semi-detached
Townhouse
Low-rise Rental
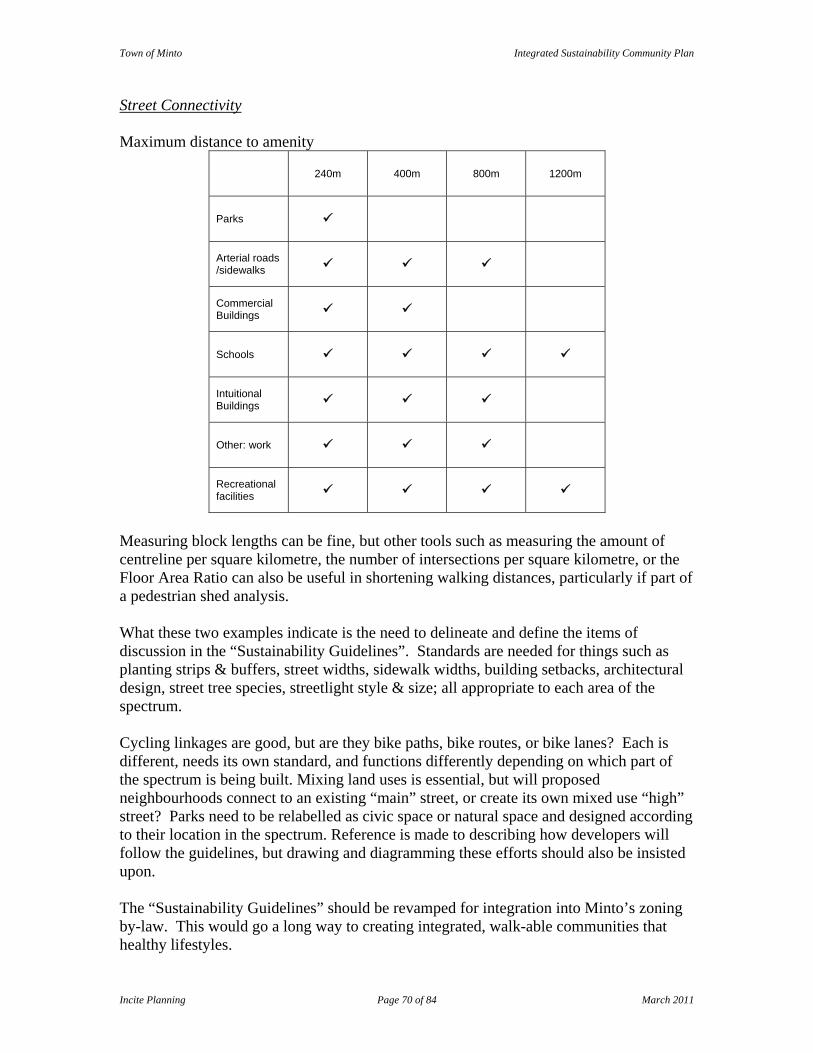
Town of Minto Integrated Sustainability Community Plan
Incite Planning Page 70 of 84 March 2011
Street Connectivity Maximum distance to amenity
Measuring block lengths can be fine, but other tools such as measuring the amount of centreline per square kilometre, the number of intersections per square kilometre, or the Floor Area Ratio can also be useful in shortening walking distances, particularly if part of a pedestrian shed analysis. What these two examples indicate is the need to delineate and define the items of discussion in the “Sustainability Guidelines”. Standards are needed for things such as planting strips & buffers, street widths, sidewalk widths, building setbacks, architectural design, street tree species, streetlight style & size; all appropriate to each area of the spectrum. Cycling linkages are good, but are they bike paths, bike routes, or bike lanes? Each is different, needs its own standard, and functions differently depending on which part of the spectrum is being built. Mixing land uses is essential, but will proposed neighbourhoods connect to an existing “main” street, or create its own mixed use “high” street? Parks need to be relabelled as civic space or natural space and designed according to their location in the spectrum. Reference is made to describing how developers will follow the guidelines, but drawing and diagramming these efforts should also be insisted upon. The “Sustainability Guidelines” should be revamped for integration into Minto’s zoning by-law. This would go a long way to creating integrated, walk-able communities that healthy lifestyles.
240m 400m 800m 1200m
Parks
Arterial roads /sidewalks
Commercial Buildings
Schools
Intuitional Buildings
Other: work
Recreational facilities
Town of Minto Integrated Sustainability Community Plan
Incite Planning Page 71 of 84 March 2011
Targets Option A - Foster active living through the built environment
Upgrade the “Sustainability Guidelines” to a “Sustainability Policy” by creating design criteria such as specific distances & widths, requiring diagrams & drawings, etc. Then these revamp guidelines should be incorporated in Minto’s Zoning By-law.
Each option must be considered in light of the stated sustainability goal:
SOCIAL GOAL
Focus on the health and recreational well-being of the people of Minto.
Town of Minto Integrated Sustainability Community Plan
Incite Planning Page 72 of 84 March 2011
STAGE III: IMPLEMENTING SOLUTIONS This section outlines the Tasks to achieve the targets to fulfil each stated goal. To aim for their accomplishment, it was necessary to assign them to someone along with dates for there completion. This was determined with administrative and political officials from Minto. The worksheets used for this discussion can be found in Appendix Q. Some of the options were chosen, others were rejected, and some were expanded or altered. The results are presented below. Council may want to consider the establishment of an Implementation Committee to oversee the activities outlined in this plan and undertake the monitoring of these activities. Our recommendation would be that such a committee would have a mix of interested politicians, enthusiastic staff, and engaged members of the public.
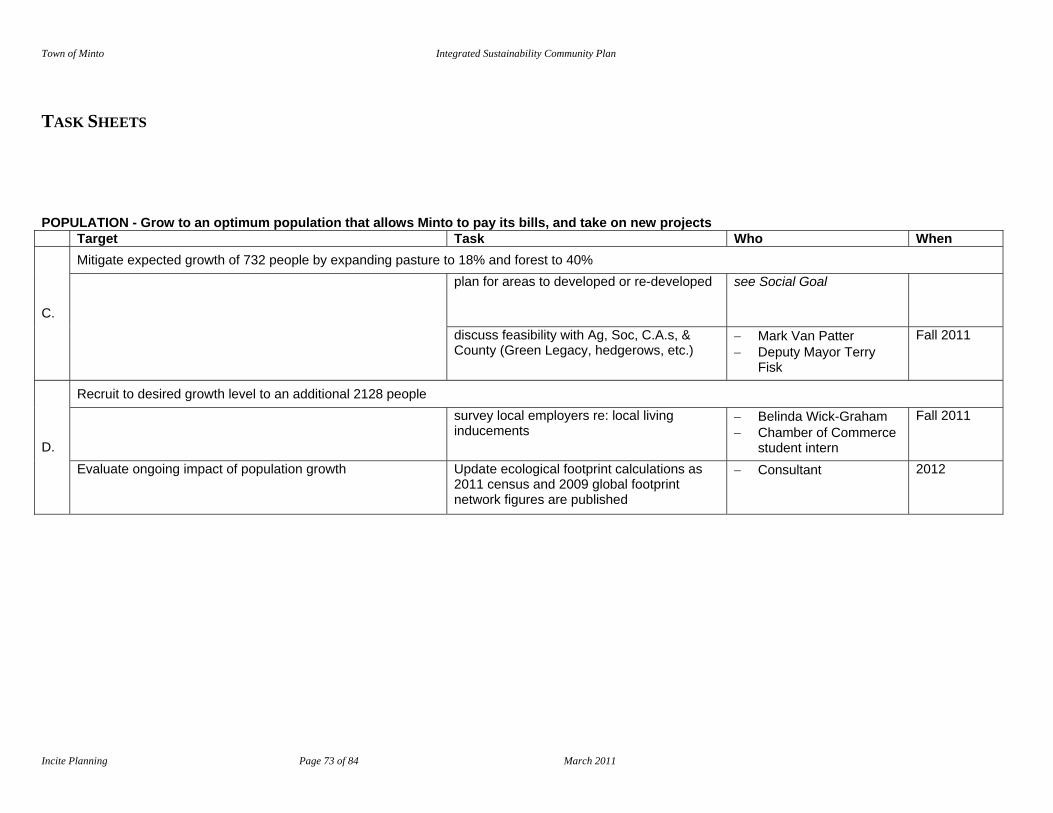
Town of Minto Integrated Sustainability Community Plan
Incite Planning Page 73 of 84 March 2011
TASK SHEETS POPULATION - Grow to an optimum population that allows Minto to pay its bills, and take on new projects Target Task Who When
Mitigate expected growth of 732 people by expanding pasture to 18% and forest to 40% plan for areas to developed or re-developed see Social Goal
C. discuss feasibility with Ag, Soc, C.A.s, & County (Green Legacy, hedgerows, etc.)
− Mark Van Patter − Deputy Mayor Terry
Fisk
Fall 2011
Recruit to desired growth level to an additional 2128 people survey local employers re: local living inducements
− Belinda Wick-Graham − Chamber of Commerce
student intern
Fall 2011
D. Evaluate ongoing impact of population growth Update ecological footprint calculations as
2011 census and 2009 global footprint network figures are published
− Consultant 2012
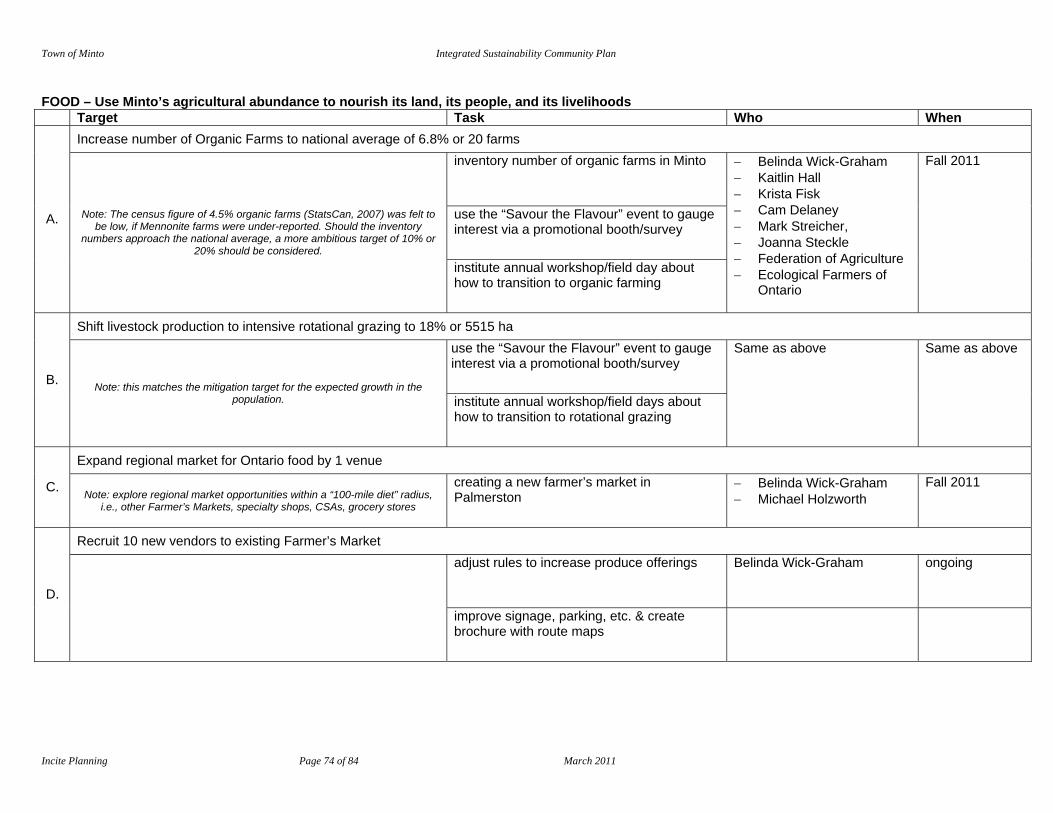
Town of Minto Integrated Sustainability Community Plan
Incite Planning Page 74 of 84 March 2011
FOOD – Use Minto’s agricultural abundance to nourish its land, its people, and its livelihoods Target Task Who When
Increase number of Organic Farms to national average of 6.8% or 20 farms inventory number of organic farms in Minto
use the “Savour the Flavour” event to gauge interest via a promotional booth/survey
A. Note: The census figure of 4.5% organic farms (StatsCan, 2007) was felt to be low, if Mennonite farms were under-reported. Should the inventory
numbers approach the national average, a more ambitious target of 10% or 20% should be considered.
institute annual workshop/field day about how to transition to organic farming
− Belinda Wick-Graham − Kaitlin Hall − Krista Fisk − Cam Delaney − Mark Streicher, − Joanna Steckle − Federation of Agriculture − Ecological Farmers of
Ontario
Fall 2011
Shift livestock production to intensive rotational grazing to 18% or 5515 ha use the “Savour the Flavour” event to gauge interest via a promotional booth/survey
B. Note: this matches the mitigation target for the expected growth in the population. institute annual workshop/field days about
how to transition to rotational grazing
Same as above Same as above
Expand regional market for Ontario food by 1 venue
C. Note: explore regional market opportunities within a “100-mile diet” radius, i.e., other Farmer’s Markets, specialty shops, CSAs, grocery stores
creating a new farmer’s market in Palmerston
− Belinda Wick-Graham − Michael Holzworth
Fall 2011
Recruit 10 new vendors to existing Farmer’s Market adjust rules to increase produce offerings Belinda Wick-Graham ongoing
D. improve signage, parking, etc. & create brochure with route maps
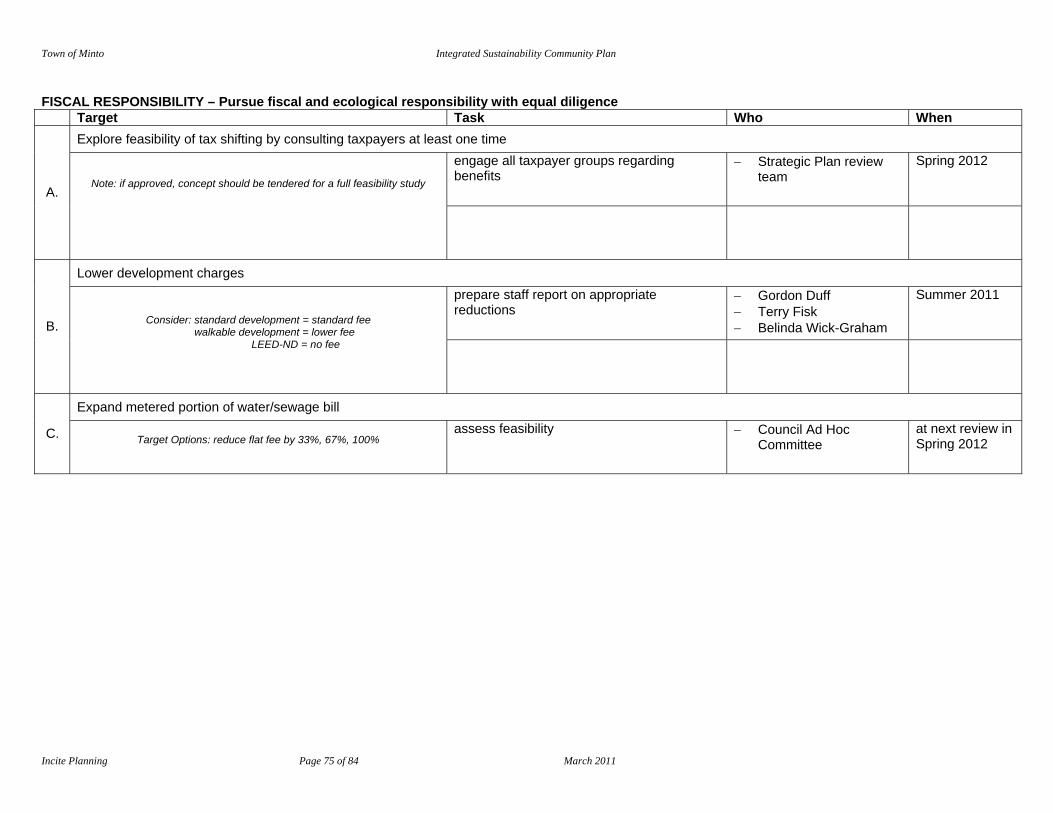
Town of Minto Integrated Sustainability Community Plan
Incite Planning Page 75 of 84 March 2011
FISCAL RESPONSIBILITY – Pursue fiscal and ecological responsibility with equal diligence Target Task Who When
Explore feasibility of tax shifting by consulting taxpayers at least one time engage all taxpayer groups regarding benefits
− Strategic Plan review team
Spring 2012
A.
Note: if approved, concept should be tendered for a full feasibility study
Lower development charges prepare staff report on appropriate reductions
− Gordon Duff − Terry Fisk − Belinda Wick-Graham
Summer 2011
B. Consider: standard development = standard fee walkable development = lower fee
LEED-ND = no fee
Expand metered portion of water/sewage bill
C. Target Options: reduce flat fee by 33%, 67%, 100%
assess feasibility − Council Ad Hoc Committee
at next review in Spring 2012
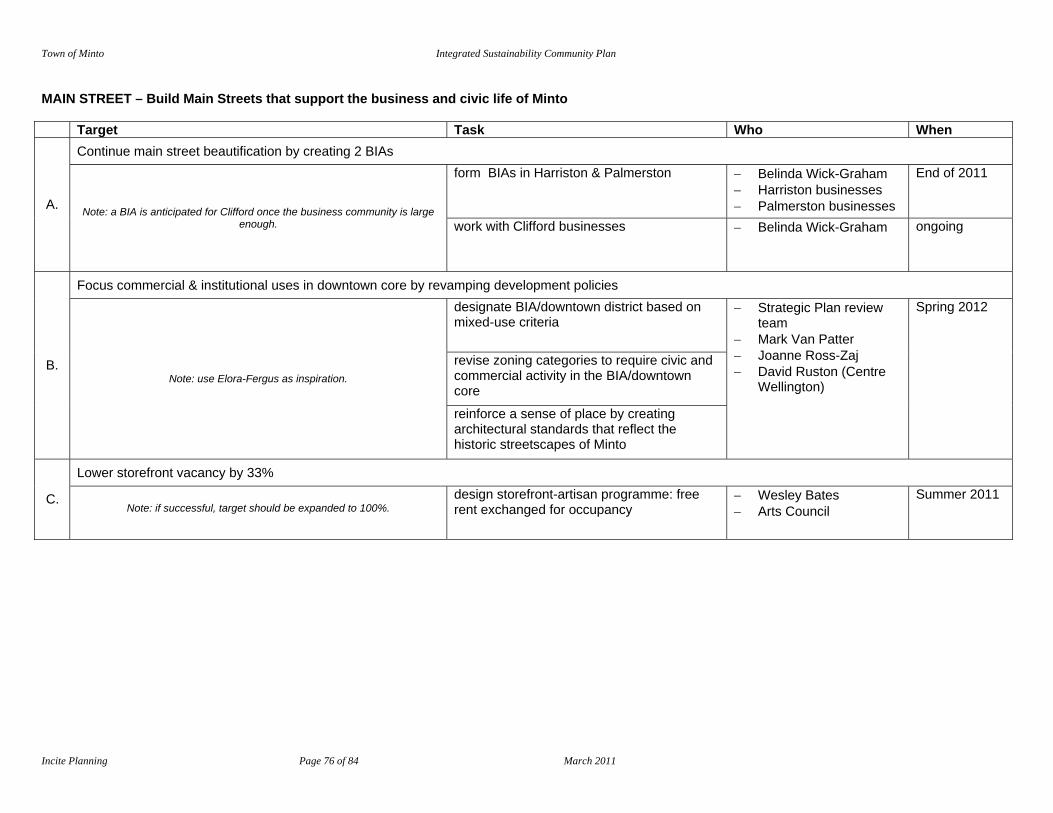
Town of Minto Integrated Sustainability Community Plan
Incite Planning Page 76 of 84 March 2011
MAIN STREET – Build Main Streets that support the business and civic life of Minto Target Task Who When
Continue main street beautification by creating 2 BIAs form BIAs in Harriston & Palmerston − Belinda Wick-Graham
− Harriston businesses − Palmerston businesses
End of 2011
A. Note: a BIA is anticipated for Clifford once the business community is large enough. work with Clifford businesses − Belinda Wick-Graham
ongoing
Focus commercial & institutional uses in downtown core by revamping development policies designate BIA/downtown district based on mixed-use criteria
revise zoning categories to require civic and commercial activity in the BIA/downtown core
B. Note: use Elora-Fergus as inspiration.
reinforce a sense of place by creating architectural standards that reflect the historic streetscapes of Minto
− Strategic Plan review team
− Mark Van Patter − Joanne Ross-Zaj − David Ruston (Centre
Wellington)
Spring 2012
Lower storefront vacancy by 33%
C. Note: if successful, target should be expanded to 100%.
design storefront-artisan programme: free rent exchanged for occupancy
− Wesley Bates − Arts Council
Summer 2011
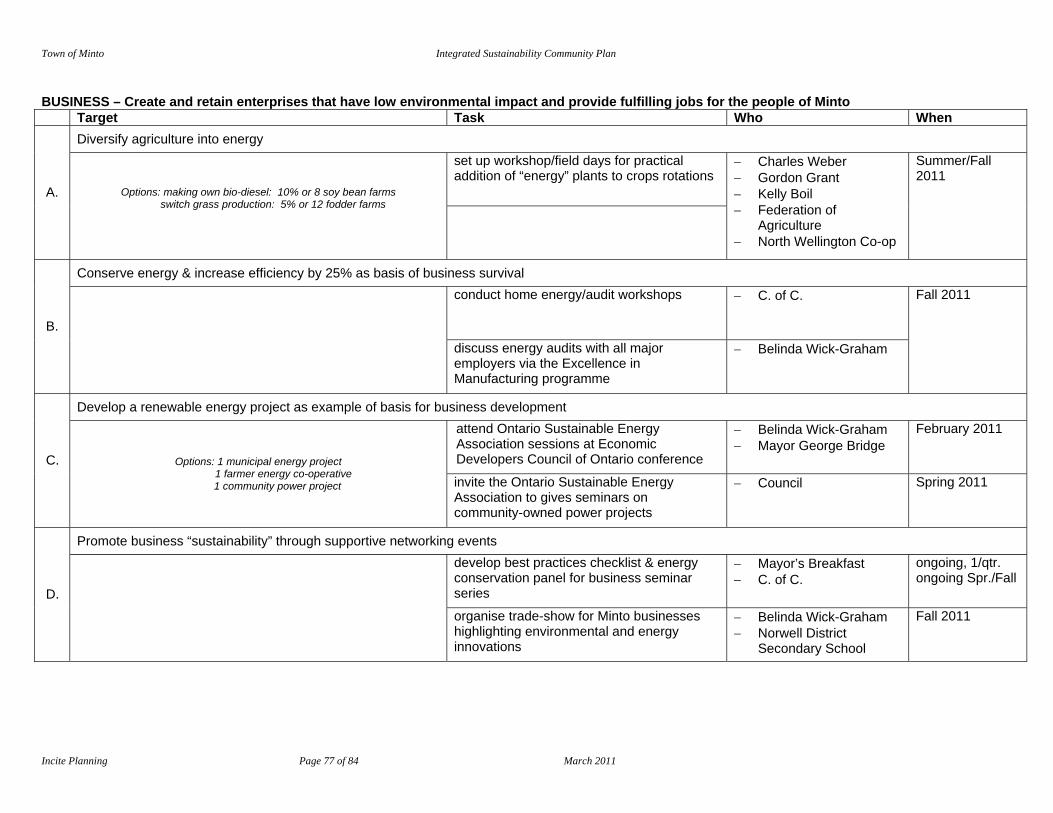
Town of Minto Integrated Sustainability Community Plan
Incite Planning Page 77 of 84 March 2011
BUSINESS – Create and retain enterprises that have low environmental impact and provide fulfilling jobs for the people of Minto Target Task Who When
Diversify agriculture into energy set up workshop/field days for practical addition of “energy” plants to crops rotations
A. Options: making own bio-diesel: 10% or 8 soy bean farms switch grass production: 5% or 12 fodder farms
− Charles Weber − Gordon Grant − Kelly Boil − Federation of
Agriculture − North Wellington Co-op
Summer/Fall 2011
Conserve energy & increase efficiency by 25% as basis of business survival conduct home energy/audit workshops − C. of C.
B. discuss energy audits with all major employers via the Excellence in Manufacturing programme
− Belinda Wick-Graham
Fall 2011
Develop a renewable energy project as example of basis for business development attend Ontario Sustainable Energy Association sessions at Economic Developers Council of Ontario conference
− Belinda Wick-Graham − Mayor George Bridge
February 2011
C. Options: 1 municipal energy project 1 farmer energy co-operative
1 community power project invite the Ontario Sustainable Energy Association to gives seminars on community-owned power projects
− Council Spring 2011
Promote business “sustainability” through supportive networking events develop best practices checklist & energy conservation panel for business seminar series
− Mayor’s Breakfast − C. of C.
ongoing, 1/qtr. ongoing Spr./Fall
D. organise trade-show for Minto businesses highlighting environmental and energy innovations
− Belinda Wick-Graham − Norwell District
Secondary School
Fall 2011
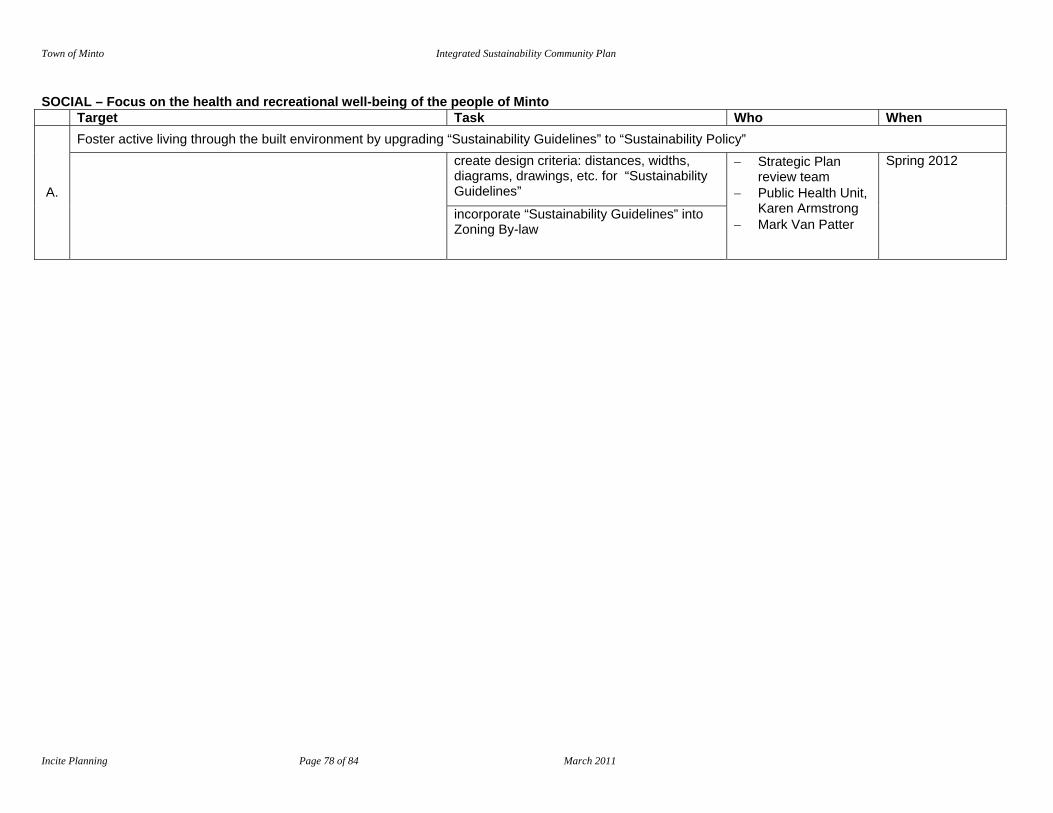
Town of Minto Integrated Sustainability Community Plan
Incite Planning Page 78 of 84 March 2011
SOCIAL – Focus on the health and recreational well-being of the people of Minto Target Task Who When
Foster active living through the built environment by upgrading “Sustainability Guidelines” to “Sustainability Policy” create design criteria: distances, widths, diagrams, drawings, etc. for “Sustainability Guidelines” A.
incorporate “Sustainability Guidelines” into Zoning By-law
− Strategic Plan review team
− Public Health Unit, Karen Armstrong
− Mark Van Patter
Spring 2012
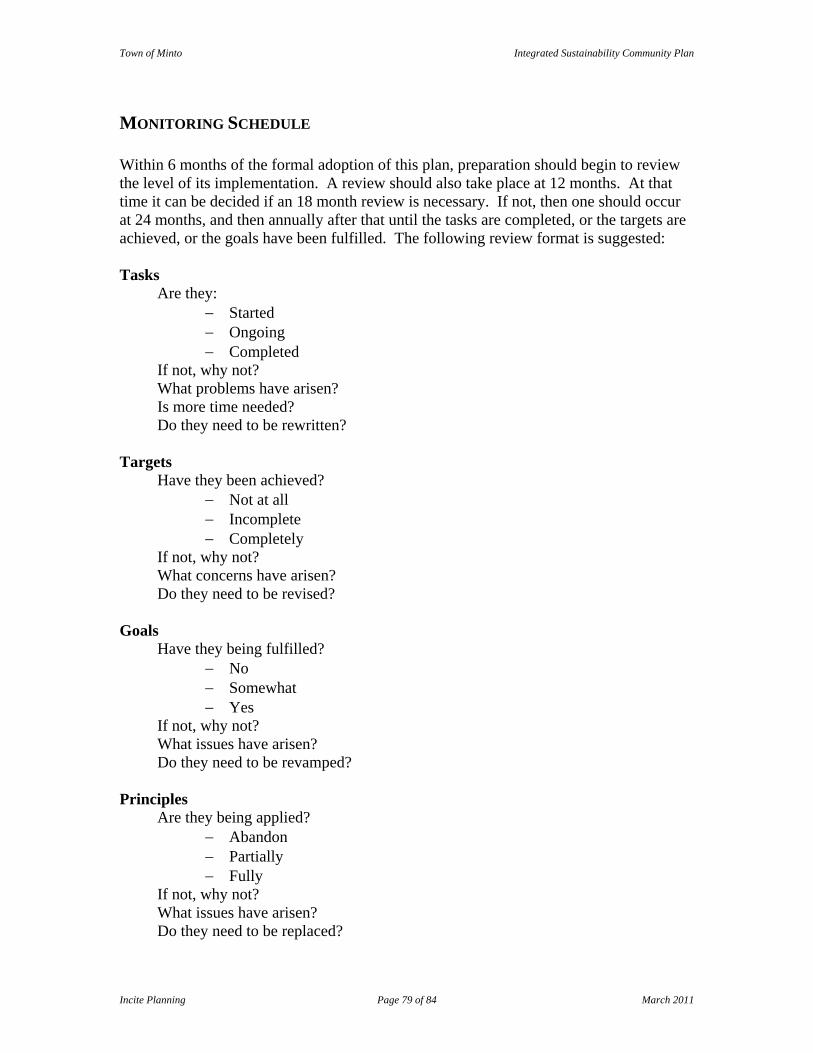
Town of Minto Integrated Sustainability Community Plan
Incite Planning Page 79 of 84 March 2011
MONITORING SCHEDULE Within 6 months of the formal adoption of this plan, preparation should begin to review the level of its implementation. A review should also take place at 12 months. At that time it can be decided if an 18 month review is necessary. If not, then one should occur at 24 months, and then annually after that until the tasks are completed, or the targets are achieved, or the goals have been fulfilled. The following review format is suggested: Tasks
Are they: − Started − Ongoing − Completed
If not, why not? What problems have arisen? Is more time needed? Do they need to be rewritten?
Targets
Have they been achieved? − Not at all − Incomplete − Completely
If not, why not? What concerns have arisen? Do they need to be revised?
Goals
Have they being fulfilled? − No − Somewhat − Yes
If not, why not? What issues have arisen? Do they need to be revamped?
Principles
Are they being applied? − Abandon − Partially − Fully
If not, why not? What issues have arisen? Do they need to be replaced?
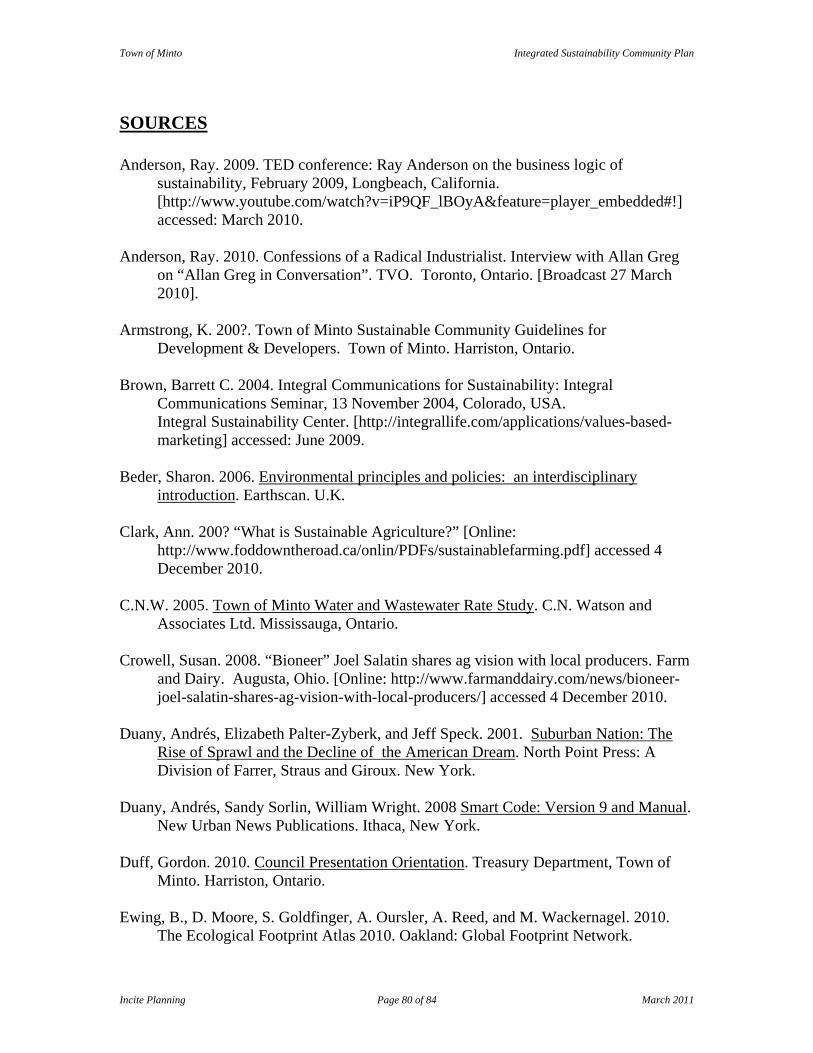
Town of Minto Integrated Sustainability Community Plan
Incite Planning Page 80 of 84 March 2011
SOURCES Anderson, Ray. 2009. TED conference: Ray Anderson on the business logic of
sustainability, February 2009, Longbeach, California. [http://www.youtube.com/watch?v=iP9QF_lBOyA&feature=player_embedded#!] accessed: March 2010.
Anderson, Ray. 2010. Confessions of a Radical Industrialist. Interview with Allan Greg
on “Allan Greg in Conversation”. TVO. Toronto, Ontario. [Broadcast 27 March 2010].
Armstrong, K. 200?. Town of Minto Sustainable Community Guidelines for
Development & Developers. Town of Minto. Harriston, Ontario. Brown, Barrett C. 2004. Integral Communications for Sustainability: Integral
Communications Seminar, 13 November 2004, Colorado, USA. Integral Sustainability Center. [http://integrallife.com/applications/values-based-
marketing] accessed: June 2009. Beder, Sharon. 2006. Environmental principles and policies: an interdisciplinary
introduction. Earthscan. U.K. Clark, Ann. 200? “What is Sustainable Agriculture?” [Online:
http://www.foddowntheroad.ca/onlin/PDFs/sustainablefarming.pdf] accessed 4 December 2010.
C.N.W. 2005. Town of Minto Water and Wastewater Rate Study. C.N. Watson and
Associates Ltd. Mississauga, Ontario. Crowell, Susan. 2008. “Bioneer” Joel Salatin shares ag vision with local producers. Farm
and Dairy. Augusta, Ohio. [Online: http://www.farmanddairy.com/news/bioneer-joel-salatin-shares-ag-vision-with-local-producers/] accessed 4 December 2010.
Duany, Andrés, Elizabeth Palter-Zyberk, and Jeff Speck. 2001. Suburban Nation: The
Rise of Sprawl and the Decline of the American Dream. North Point Press: A Division of Farrer, Straus and Giroux. New York.
Duany, Andrés, Sandy Sorlin, William Wright. 2008 Smart Code: Version 9 and Manual.
New Urban News Publications. Ithaca, New York. Duff, Gordon. 2010. Council Presentation Orientation. Treasury Department, Town of
Minto. Harriston, Ontario. Ewing, B., D. Moore, S. Goldfinger, A. Oursler, A. Reed, and M. Wackernagel. 2010.
The Ecological Footprint Atlas 2010. Oakland: Global Footprint Network.
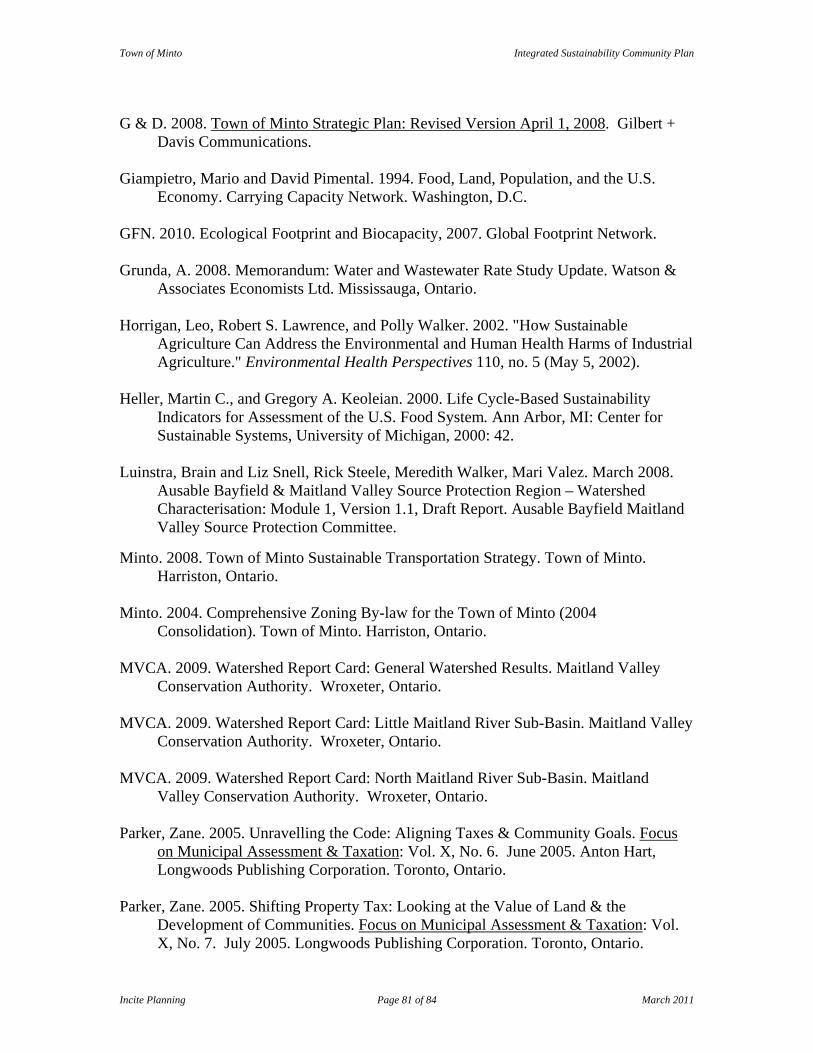
Town of Minto Integrated Sustainability Community Plan
Incite Planning Page 81 of 84 March 2011
G & D. 2008. Town of Minto Strategic Plan: Revised Version April 1, 2008. Gilbert +
Davis Communications. Giampietro, Mario and David Pimental. 1994. Food, Land, Population, and the U.S.
Economy. Carrying Capacity Network. Washington, D.C. GFN. 2010. Ecological Footprint and Biocapacity, 2007. Global Footprint Network. Grunda, A. 2008. Memorandum: Water and Wastewater Rate Study Update. Watson &
Associates Economists Ltd. Mississauga, Ontario. Horrigan, Leo, Robert S. Lawrence, and Polly Walker. 2002. "How Sustainable
Agriculture Can Address the Environmental and Human Health Harms of Industrial Agriculture." Environmental Health Perspectives 110, no. 5 (May 5, 2002).
Heller, Martin C., and Gregory A. Keoleian. 2000. Life Cycle-Based Sustainability
Indicators for Assessment of the U.S. Food System. Ann Arbor, MI: Center for Sustainable Systems, University of Michigan, 2000: 42.
Luinstra, Brain and Liz Snell, Rick Steele, Meredith Walker, Mari Valez. March 2008.
Ausable Bayfield & Maitland Valley Source Protection Region – Watershed Characterisation: Module 1, Version 1.1, Draft Report. Ausable Bayfield Maitland Valley Source Protection Committee.
Minto. 2008. Town of Minto Sustainable Transportation Strategy. Town of Minto.
Harriston, Ontario. Minto. 2004. Comprehensive Zoning By-law for the Town of Minto (2004
Consolidation). Town of Minto. Harriston, Ontario. MVCA. 2009. Watershed Report Card: General Watershed Results. Maitland Valley
Conservation Authority. Wroxeter, Ontario. MVCA. 2009. Watershed Report Card: Little Maitland River Sub-Basin. Maitland Valley
Conservation Authority. Wroxeter, Ontario. MVCA. 2009. Watershed Report Card: North Maitland River Sub-Basin. Maitland
Valley Conservation Authority. Wroxeter, Ontario. Parker, Zane. 2005. Unravelling the Code: Aligning Taxes & Community Goals. Focus
on Municipal Assessment & Taxation: Vol. X, No. 6. June 2005. Anton Hart, Longwoods Publishing Corporation. Toronto, Ontario.
Parker, Zane. 2005. Shifting Property Tax: Looking at the Value of Land & the
Development of Communities. Focus on Municipal Assessment & Taxation: Vol. X, No. 7. July 2005. Longwoods Publishing Corporation. Toronto, Ontario.
Town of Minto Integrated Sustainability Community Plan
Incite Planning Page 82 of 84 March 2011
Pollan, Michael. 2010. Interviewed on “e2”. Public Broadcasting System. Produced by
Tad Fettig & Karena Albers, of kontentreal. New York, New York. [Broadcast Autumn 2010].
PQA. 2010. Energy Audit. Process Quality Associates Inc. London, Ontario. [Online:
http://www.pqa.net/ProdServices/Energy/energy_audit.htm] accessed 23 December 2010.
Reid, Donald G., Margaret Kralt, B. Leigh Golden. 2005. Town of Minto Community
Leisure Study Report. School of Environmental Design and Rural Development, University of Guelph. Guelph, Ontario.
Rifkin, Jeremy. 2009. Jeremy Rifkin at the Rotterdam Global Urban Summit December
2009. [http://www.youtube.com/watch?v=iP9QF_lBOyA&feature=player_embedded#!] accessed: 14 July 2010.
Roberts, Wayne. 2006. Taxshift – Beginning of a Movement? The Ontario Planning
Journal: Vol. 21, No. 1. January/February. Ontario Professional Planners Institute. Toronto, Ontario.
Saugeen Conservation. 2008. South Saugeen River Watershed Report Card. Saugeen
Valley Conservation Authority. Hanover, Ontario. Salatin, Joel. 2010. Interview with Dr. David Suzuki on “The Bottom Line”. Canadian
Broadcasting Corporation. Toronto, Ontario. [Broadcast 18 July 2010]. Schwan, Terry. 2008. Building a Case for Sustainable Management of Private
Woodlands; Case Study: Murray Scott Woodlot. Ontario Ministry of Natural Resources. Guelph, Ontario.
SEDC. Minto Community Profile. Saugeen Economic Development Corporation.
Hanover, Ontario. Accessed on 18 December 2010 at http://www.mintoed.com/content/pdf/communityProfile.pdf.
StatsCan. 2002. Agriculture Community Profiles, Harriston: 2001 Census of Agriculture.
Statistics Canada. Ottawa, Ontario. [Online]. StatsCan. 2002a. Community Profiles - Census Subdivision, Minto: 2001 Census.
Statistics Canada. Ottawa, Ontario. [Online]. StatsCan. 2007. Agriculture Community Profiles, Harriston: 2006 Census of Agriculture.
Statistics Canada. Ottawa, Ontario. [Online].
Town of Minto Integrated Sustainability Community Plan
Incite Planning Page 83 of 84 March 2011
StatsCan. 2007b. Community Profiles - Census Subdivision, Minto: 2006 Census. Statistics Canada. Ottawa, Ontario. [Online].
Wackernagel, Mathis and William E. Rees. 1996. Our Ecological Footprint: Reducing
Human Impact on the Earth. New Society Publishers. Gabriola Island, B.C. Wellington. 2009. Wellington 1996 (2009 amended) Official Plan. County of Wellington.
Guelph, Ontario. Wilber, Ken. 2000. Sex, Ecology, Spirituality. Shambala Publications, Inc. Boston,
Massachusetts Wick, Belinda. 2007. Town of Minto Business Retention and Expansion Project. Town
of Minto; Minto Chamber of Commerce, Saugeen Economic Development Corporation, Waterloo Wellington Training & Adjustment Board. Harriston, Ontario.
WWF. 2002. Living Planet Report 2002. World Wildlife Fund International. Gland,
Switzerland. WWF. 2004. Living Planet Report 2004. World Wildlife Fund International. Gland,
Switzerland. WWF. 2010. Living Planet Report 2010: Biodiversity, biocapacity and development.
World Wildlife Fund for Nature. Gland, Switzerland.
Town of Minto Integrated Sustainability Community Plan
Incite Planning Page 84 of 84 March 2011
APPENDICES