on-time performance for airlines and airports and … · on-time performance for airlines and...
TRANSCRIPT

© 2018 OAG Aviation Worldwide Limited. All rights reserved
On-time performancefor airlines and airports
and Top 20 busiest routes
Based on full year data 2017
Published: January 2018
2018

© 2018 OAG Aviation Worldwide Limited. All rights reserved
OAG Punctuality League – On-time performance results for airlines and airports
2
ContentsQualifying Criteria 2Airlines – Mega 4 – Mainline 5 – LCCs 6 – All 7Airlines by Region – Asia Pacific (including Southwest Pacific) 8 – Europe 9 – Middle East and Africa 9 – Latin America 10 – North America 10 Airports – Small: 2.5 – 5m seats 11 – Medium: 5 –10m seats 12 – Large: 10 – 20m seats 13 – Major: 20 – 30m seats 14 – Mega: 30m+ seats 15Top 20 Busiest Routes – International 16 – Domestic 18
The league is based on 57 million flight records using full-year data from 2017 to create a ranking of the best on-time performance (OTP) for the world’s largest airlines and airports.
NEW for 2018, the Punctuality League includes on-time performance for the world’s Top 20 busiest domestic and international routes, and the airline and airport categories have also been extended. There is now a category for the Top 20 airlines which operate the most flights globally, termed mega airlines and another for mega airports which are those operating more than 30 million departing seats per year.
About the Punctuality League
Qualifying criteriaTo qualify for inclusion in the Punctuality League, the OAG schedules database must have flight status data for at least 80% of all scheduled flights operated by an airline or for an airport.• OAG’s definition of on-time performance (OTP) is flights that arrive or depart within 14 minutes
and 59 seconds (under 15 minutes) of their scheduled arrival/departure times.• Cancellations are also included.• Airports must have a minimum of 2.5m departing seats to be included in the report.
3
• The threshold for airlines is ranked among the Top 250 airlines by annual Available Seat Kilometres (ASKs). Airline OTP is for arrivals only.
• In this report, a ‘record’ is defined as a flight for which we either have a ‘code’, or an actual time of arrival (and departure in the case of airports), and includes cancelled services.
• OTP data is not included for other categories of flights, such as charter or non-passenger operations.
Category definitions
AirportsAs defined by the number of departing scheduled seats in 2017: • Small airports – 2.5-5 million seats • Medium airports – 5-10 million seats• Large airports – 10-20 million seats • Major airports – 20-30 million seats• NEW Mega airports – 30+ million seatsThe new mega airports category delivers important differentiation for those airports with over 30 million seats; it also allows more recognition for airports between 20-30 million seats.
Airlines • All eligible airlines including mainline and low-cost carriers
• Mainline airlines (i.e. excluding low-cost carriers) Mainline airlines must have been ranked among the Top 250 operators globally in terms of Available Seat Kilometres (ASKs) in 2017, and must have operated more than 30,000 scheduled flights in 2017.
• Low-cost carriers Low-cost carriers (LCCs) must have ranked among the Top 250 operators globally in terms of Available Seat Kilometres (ASKs) in 2017 and operated at least 30,000 scheduled flights in 2017. OAG’s LCC list was refreshed in 2017 and is determined by our industry knowledge, supplemented by carrier feedback and consultation with industry partners.
• NEW World’s mega airlines The World’s Top 20 operators globally in terms of scheduled flights in 2017.
• Airlines based in regions There are five regional categories which rank the best airlines: mainline and LCC, operating in groupings of IATA-defined global regions. In each category, airlines must be ranked among the Top 250 operators globally in terms of ASKs and have operated a minimum of 18,000 scheduled flights in 2017 to qualify for inclusion. – Asia Pacific (including Southwest Pacific) – Europe– Middle East and Africa – Latin America– North America
Routes • NEW Top 20 busiest routes
OAG has published the OTP for the Top 20 busiest international and domestic routes. The Top 20 are based on the largest global routes by total number of flights (arriving and departing) for domestic and international routes for jet operations only.
© 2018 OAG Aviation Worldwide Limited. All rights reserved
OAG Punctuality League – On-time performance results for airlines and airports
4
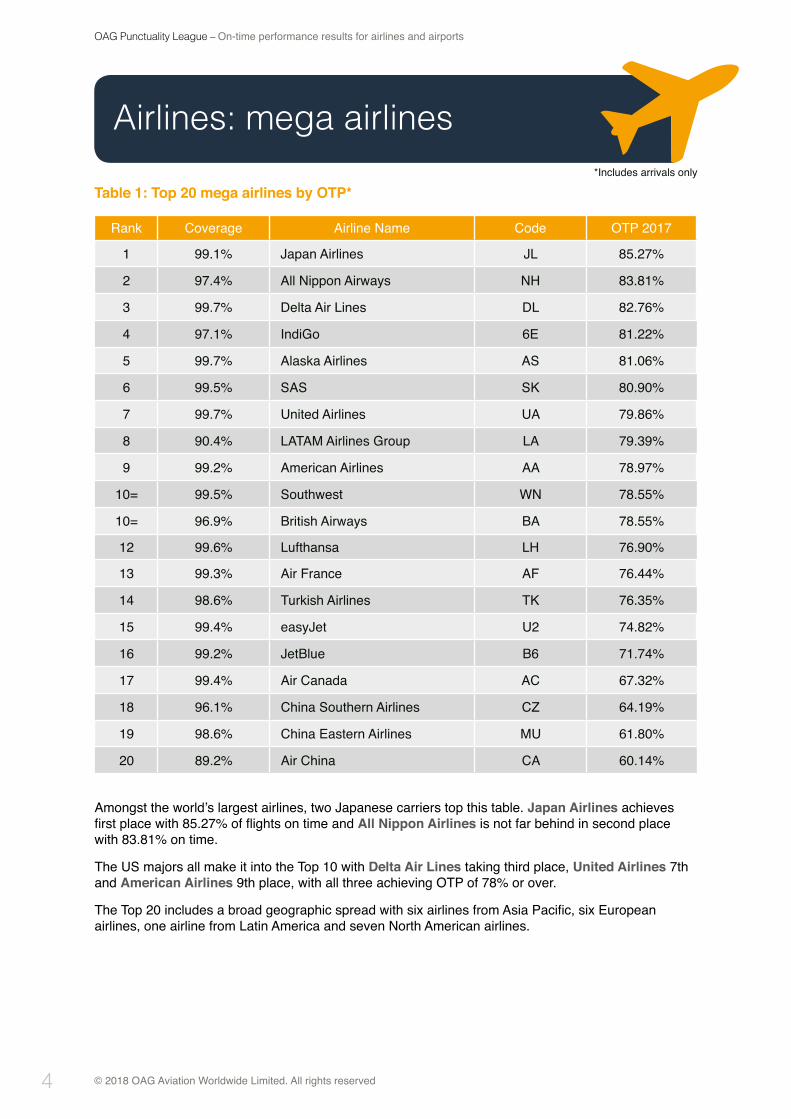
Table 1: Top 20 mega airlines by OTP*
Rank Coverage Airline Name Code OTP 2017
1 99.1% Japan Airlines JL 85.27%
2 97.4% All Nippon Airways NH 83.81%
3 99.7% Delta Air Lines DL 82.76%
4 97.1% IndiGo 6E 81.22%
5 99.7% Alaska Airlines AS 81.06%
6 99.5% SAS SK 80.90%
7 99.7% United Airlines UA 79.86%
8 90.4% LATAM Airlines Group LA 79.39%
9 99.2% American Airlines AA 78.97%
10= 99.5% Southwest WN 78.55%
10= 96.9% British Airways BA 78.55%
12 99.6% Lufthansa LH 76.90%
13 99.3% Air France AF 76.44%
14 98.6% Turkish Airlines TK 76.35%
15 99.4% easyJet U2 74.82%
16 99.2% JetBlue B6 71.74%
17 99.4% Air Canada AC 67.32%
18 96.1% China Southern Airlines CZ 64.19%
19 98.6% China Eastern Airlines MU 61.80%
20 89.2% Air China CA 60.14%
Amongst the world’s largest airlines, two Japanese carriers top this table. Japan Airlines achieves first place with 85.27% of flights on time and All Nippon Airlines is not far behind in second place with 83.81% on time.
The US majors all make it into the Top 10 with Delta Air Lines taking third place, United Airlines 7th and American Airlines 9th place, with all three achieving OTP of 78% or over.
The Top 20 includes a broad geographic spread with six airlines from Asia Pacific, six European airlines, one airline from Latin America and seven North American airlines.
Airlines: mega airlines *Includes arrivals only
5
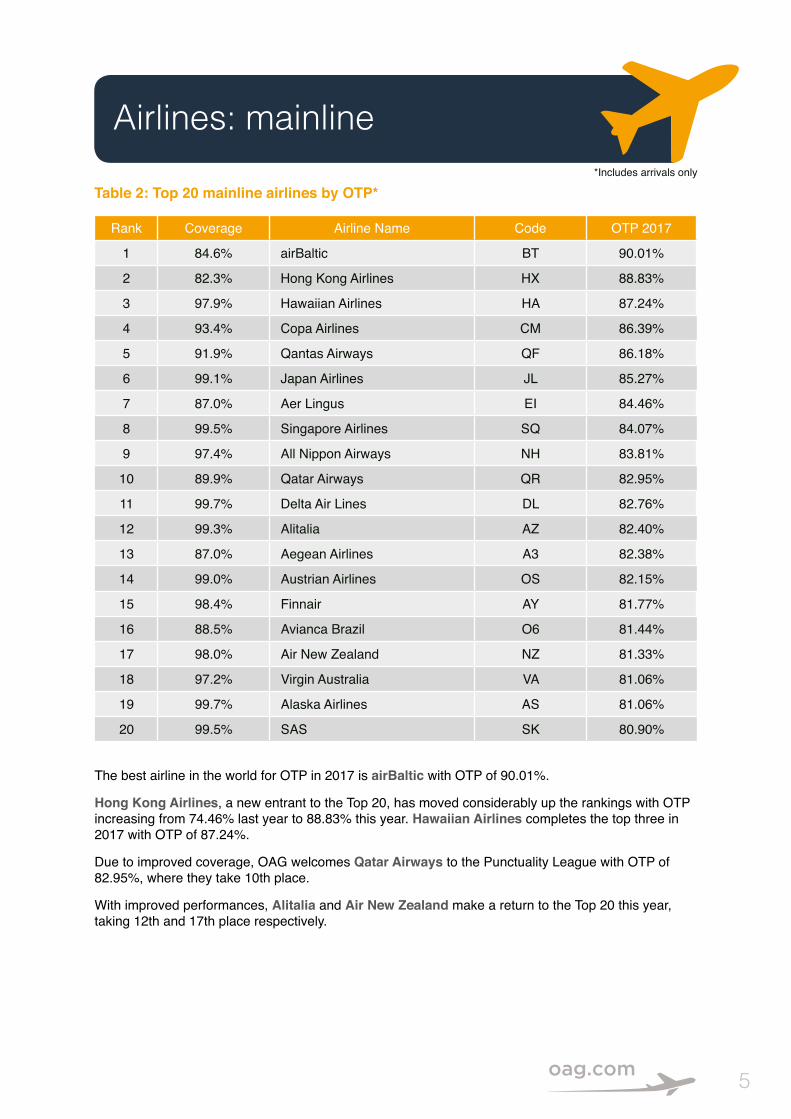
Table 2: Top 20 mainline airlines by OTP*
Rank Coverage Airline Name Code OTP 2017
1 84.6% airBaltic BT 90.01%
2 82.3% Hong Kong Airlines HX 88.83%
3 97.9% Hawaiian Airlines HA 87.24%
4 93.4% Copa Airlines CM 86.39%
5 91.9% Qantas Airways QF 86.18%
6 99.1% Japan Airlines JL 85.27%
7 87.0% Aer Lingus EI 84.46%
8 99.5% Singapore Airlines SQ 84.07%
9 97.4% All Nippon Airways NH 83.81%
10 89.9% Qatar Airways QR 82.95%
11 99.7% Delta Air Lines DL 82.76%
12 99.3% Alitalia AZ 82.40%
13 87.0% Aegean Airlines A3 82.38%
14 99.0% Austrian Airlines OS 82.15%
15 98.4% Finnair AY 81.77%
16 88.5% Avianca Brazil O6 81.44%
17 98.0% Air New Zealand NZ 81.33%
18 97.2% Virgin Australia VA 81.06%
19 99.7% Alaska Airlines AS 81.06%
20 99.5% SAS SK 80.90%
The best airline in the world for OTP in 2017 is airBaltic with OTP of 90.01%.
Hong Kong Airlines, a new entrant to the Top 20, has moved considerably up the rankings with OTP increasing from 74.46% last year to 88.83% this year. Hawaiian Airlines completes the top three in 2017 with OTP of 87.24%.
Due to improved coverage, OAG welcomes Qatar Airways to the Punctuality League with OTP of 82.95%, where they take 10th place.
With improved performances, Alitalia and Air New Zealand make a return to the Top 20 this year, taking 12th and 17th place respectively.
Airlines: mainline*Includes arrivals only

© 2018 OAG Aviation Worldwide Limited. All rights reserved
OAG Punctuality League – On-time performance results for airlines and airports
6
Table 3: Top 20 LCC airlines by OTP*
Rank Coverage Airline Name Code OTP 2017
1 82.2% Vueling Airlines VY 85.25%
2 86.5% Jetstar Asia 3K 85.08%
3 85.4% Skymark Airlines BC 85.00%
4 81.5% Transavia HV 84.25%
5 91.9% Azul AD 84.14%
6 96.7% Volaris Y4 82.13%
7 98.0% Sky Airline H2 81.93%
8 99.2% GOL Linhas Aereas G3 81.73%
9 97.1% IndiGo 6E 81.22%
10 83.4% Eurowings EW 79.39%
11 99.6% Frontier Airlines F9 78.91%
12 85.0% Norwegian Air Shuttle DY 78.62%
13 99.5% Southwest WN 78.55%
14 99.8% Spirit Airlines NK 76.97%
15 99.5% Westjet WS 76.18%
16 96.6% Jetstar Airways JQ 75.99%
17 92.0% Air Asia India I5 74.85%
18 99.4% easyJet U2 74.82%
19 91.7% Thai AirAsia FD 74.48%
20 90.2% SpiceJet SG 73.72% Europe-based Vueling Airlines is ranked first amongst the Top 20 LCCs for on-time performance having achieved OTP of 85.25% in 2017, and the airline is ranked 7th amongst all airlines. Vueling Airlines has made significant improvements in OTP this year, improving performance by over 13 percentage points.
New to the OAG Punctuality League, Jetstar Asia has achieved second place in this category with 85.08% OTP.
Enhanced coverage and an expansion of the criteria means that four other LCCs join the Punctuality League this year. These are Azul, Volaris, Sky Airline and Air Asia India.
Southwest, the largest LCC in the world, is ranked 13th with an OTP of 78.55%.
Airlines: LCCs*Includes arrivals only
7
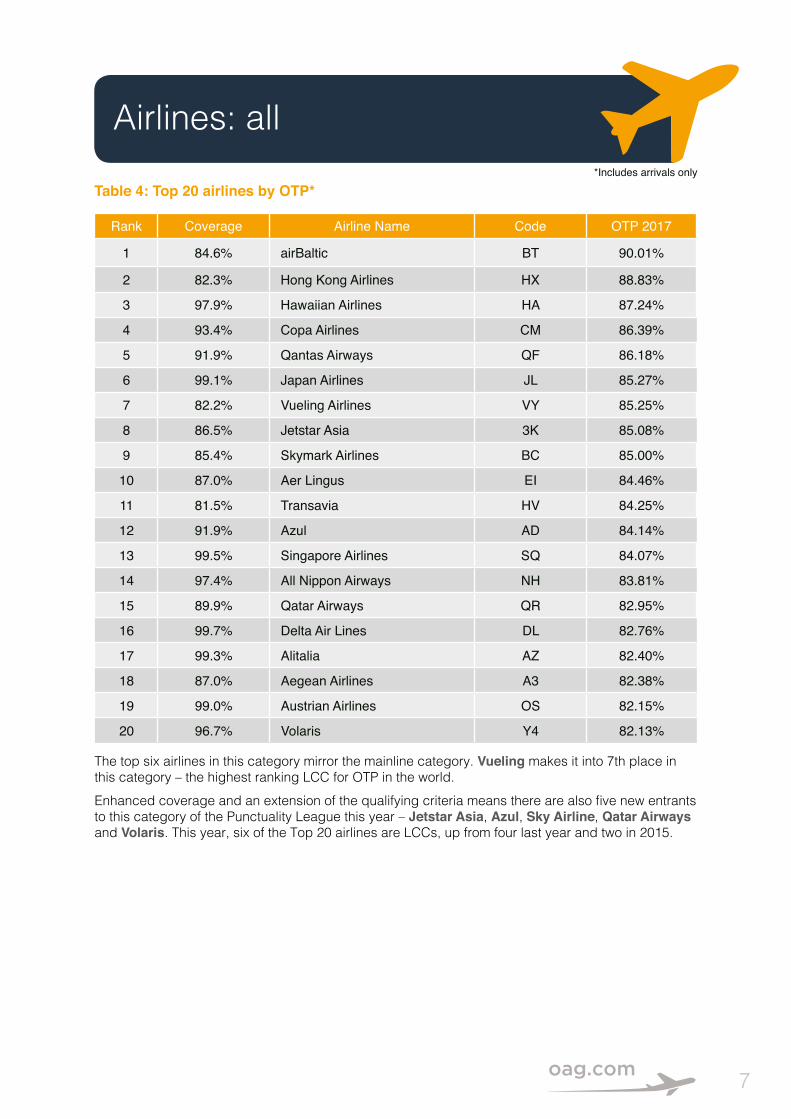
Table 4: Top 20 airlines by OTP*
Rank Coverage Airline Name Code OTP 2017
1 84.6% airBaltic BT 90.01%
2 82.3% Hong Kong Airlines HX 88.83%
3 97.9% Hawaiian Airlines HA 87.24%
4 93.4% Copa Airlines CM 86.39%
5 91.9% Qantas Airways QF 86.18%
6 99.1% Japan Airlines JL 85.27%
7 82.2% Vueling Airlines VY 85.25%
8 86.5% Jetstar Asia 3K 85.08%
9 85.4% Skymark Airlines BC 85.00%
10 87.0% Aer Lingus EI 84.46%
11 81.5% Transavia HV 84.25%
12 91.9% Azul AD 84.14%
13 99.5% Singapore Airlines SQ 84.07%
14 97.4% All Nippon Airways NH 83.81%
15 89.9% Qatar Airways QR 82.95%
16 99.7% Delta Air Lines DL 82.76%
17 99.3% Alitalia AZ 82.40%
18 87.0% Aegean Airlines A3 82.38%
19 99.0% Austrian Airlines OS 82.15%
20 96.7% Volaris Y4 82.13%
The top six airlines in this category mirror the mainline category. Vueling makes it into 7th place in this category – the highest ranking LCC for OTP in the world. Enhanced coverage and an extension of the qualifying criteria means there are also five new entrants to this category of the Punctuality League this year – Jetstar Asia, Azul, Sky Airline, Qatar Airways and Volaris. This year, six of the Top 20 airlines are LCCs, up from four last year and two in 2015.
Airlines: all*Includes arrivals only
© 2018 OAG Aviation Worldwide Limited. All rights reserved
OAG Punctuality League – On-time performance results for airlines and airports
8
Airlines by region
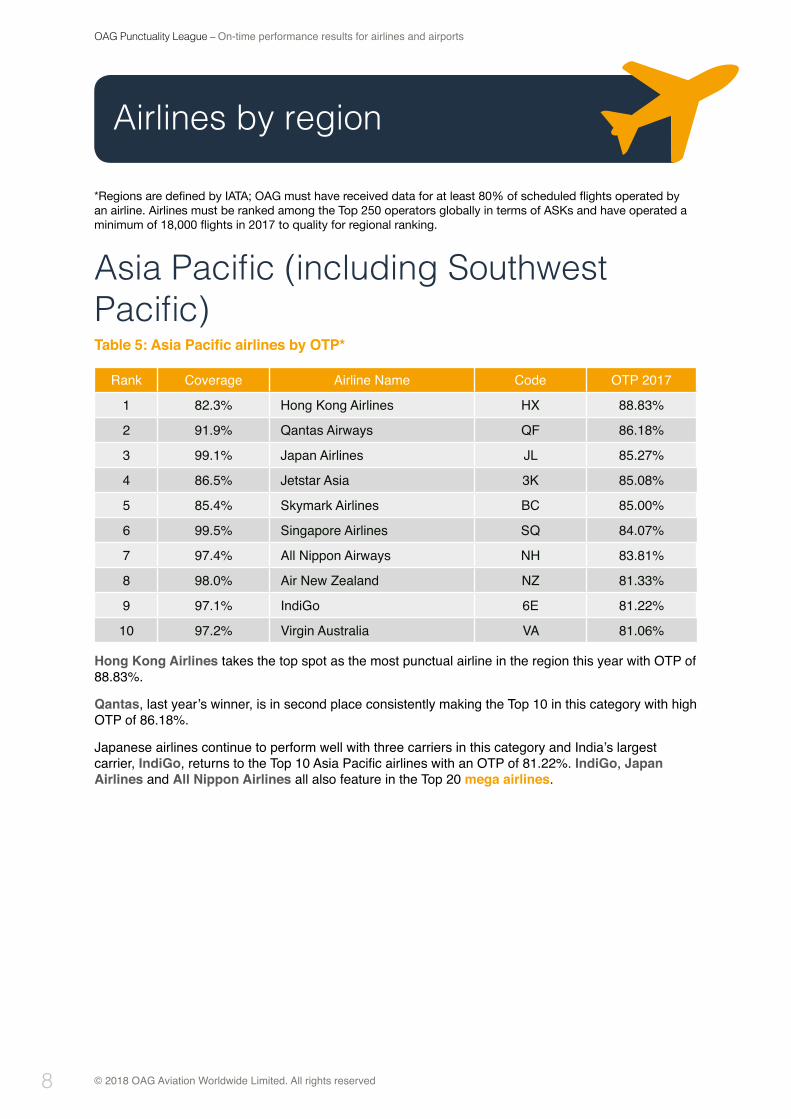
Asia Pacific (including Southwest Pacific)Table 5: Asia Pacific airlines by OTP*
Rank Coverage Airline Name Code OTP 2017
1 82.3% Hong Kong Airlines HX 88.83%
2 91.9% Qantas Airways QF 86.18%
3 99.1% Japan Airlines JL 85.27%
4 86.5% Jetstar Asia 3K 85.08%
5 85.4% Skymark Airlines BC 85.00%
6 99.5% Singapore Airlines SQ 84.07%
7 97.4% All Nippon Airways NH 83.81%
8 98.0% Air New Zealand NZ 81.33%
9 97.1% IndiGo 6E 81.22%
10 97.2% Virgin Australia VA 81.06%
Hong Kong Airlines takes the top spot as the most punctual airline in the region this year with OTP of 88.83%.
Qantas, last year’s winner, is in second place consistently making the Top 10 in this category with high OTP of 86.18%.
Japanese airlines continue to perform well with three carriers in this category and India’s largest carrier, IndiGo, returns to the Top 10 Asia Pacific airlines with an OTP of 81.22%. IndiGo, Japan Airlines and All Nippon Airlines all also feature in the Top 20 mega airlines.
*Regions are defined by IATA; OAG must have received data for at least 80% of scheduled flights operated by an airline. Airlines must be ranked among the Top 250 operators globally in terms of ASKs and have operated a minimum of 18,000 flights in 2017 to quality for regional ranking.
9
*Regions are defined by IATA; OAG must have received data for at least 80% of scheduled flights operated by an airline. Airlines must be ranked among the Top 250 operators globally in terms of ASKs and have operated a minimum of 18,000 flights in 2017 to quality for regional ranking.
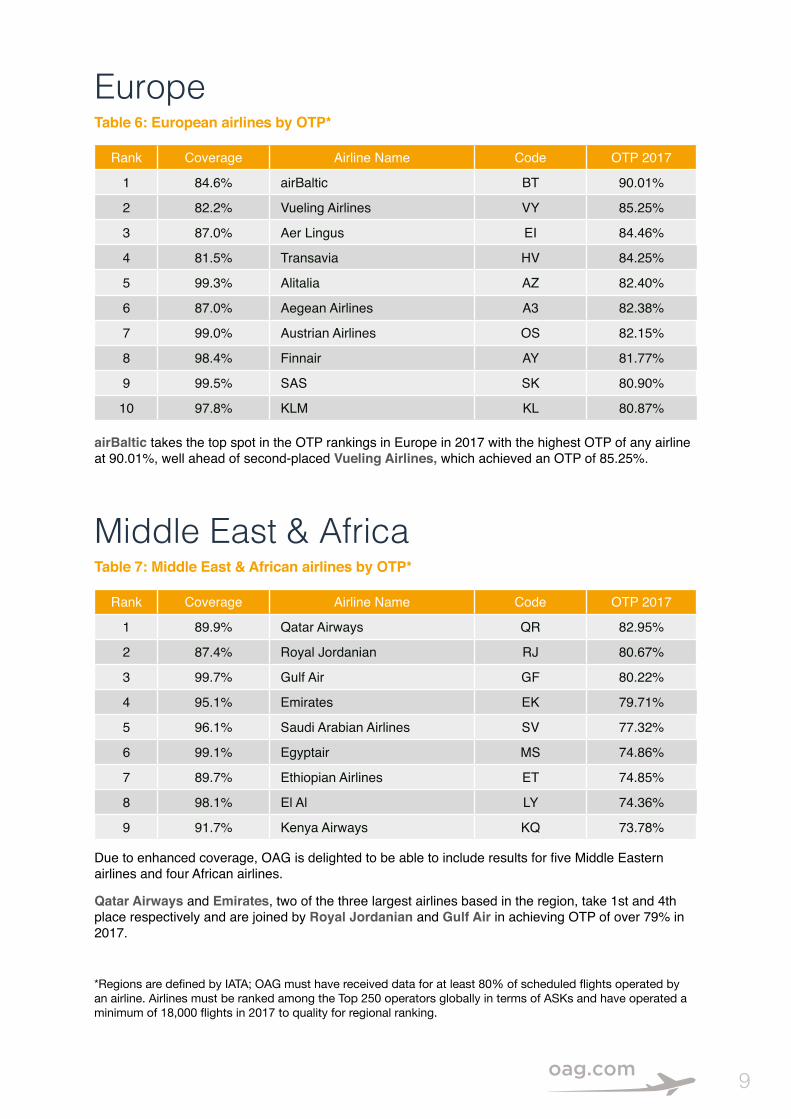
Europe Table 6: European airlines by OTP*
Rank Coverage Airline Name Code OTP 2017
1 84.6% airBaltic BT 90.01%
2 82.2% Vueling Airlines VY 85.25%
3 87.0% Aer Lingus EI 84.46%
4 81.5% Transavia HV 84.25%
5 99.3% Alitalia AZ 82.40%
6 87.0% Aegean Airlines A3 82.38%
7 99.0% Austrian Airlines OS 82.15%
8 98.4% Finnair AY 81.77%
9 99.5% SAS SK 80.90%
10 97.8% KLM KL 80.87%
airBaltic takes the top spot in the OTP rankings in Europe in 2017 with the highest OTP of any airline at 90.01%, well ahead of second-placed Vueling Airlines, which achieved an OTP of 85.25%.
Middle East & Africa Table 7: Middle East & African airlines by OTP*
Rank Coverage Airline Name Code OTP 2017
1 89.9% Qatar Airways QR 82.95%
2 87.4% Royal Jordanian RJ 80.67%
3 99.7% Gulf Air GF 80.22%
4 95.1% Emirates EK 79.71%
5 96.1% Saudi Arabian Airlines SV 77.32%
6 99.1% Egyptair MS 74.86%
7 89.7% Ethiopian Airlines ET 74.85%
8 98.1% El Al LY 74.36%
9 91.7% Kenya Airways KQ 73.78%
Due to enhanced coverage, OAG is delighted to be able to include results for five Middle Eastern airlines and four African airlines.
Qatar Airways and Emirates, two of the three largest airlines based in the region, take 1st and 4th place respectively and are joined by Royal Jordanian and Gulf Air in achieving OTP of over 79% in 2017.

© 2018 OAG Aviation Worldwide Limited. All rights reserved
OAG Punctuality League – On-time performance results for airlines and airports
10
Latin AmericaTable 8: Latin American airlines by OTP*
Rank Coverage Airline Name Code OTP 2017
1 93.4% Copa Airlines CM 86.39%
2 91.9% Azul AD 84.14%
3 96.7% Volaris Y4 82.13%
4 98.0% Sky Airline H2 81.93%
5 99.2% GOL Linhas Aereas G3 81.73%
6 88.5% Avianca Brazil O6 81.44%
7 90.4% LATAM Airlines Group LA 79.39%
8 98.7% Aerolineas Argentinas AR 77.44%
9 99.0% Aeromexico AM 75.64%
10 93.7% Caribbean Airlines BW 74.76%
OAG is pleased to welcome one of Latin America’s largest LCCs, Azul, to the Punctuality League. Azul takes second place in the Latin America category with OTP of 84.14%.A variety of airlines are included in the regional tables and they vary in terms of operational complexity and size. The largest in this region, LATAM Airlines Group, operates the greatest volume of flights in Latin America and is one of the world’s largest airlines, ranking 8th by OTP for the mega airlines category this year (see page 4).
North America Table 9: North American airlines by OTP*
Rank Coverage Airline Name Code OTP 2017
1 97.9% Hawaiian Airlines HA 87.24%
2 99.7% Delta Air Lines DL 82.76%
3 99.7% Alaska Airlines AS 81.06%
4 99.7% United Airlines UA 79.86%
5 99.2% American Airlines AA 78.97%
6 99.6% Frontier Airlines F9 78.91%
7 99.5% Southwest WN 78.55%
8 99.8% Spirit Airlines NK 76.97%
9 99.5% Westjet WS 76.18%
10 97.6% Allegiant Air G4 73.55%
Hawaiian Airlines keeps its place as the most punctual airline in North America for the fourth consecutive year, with 87.24% of flights on time.Delta Air Lines makes it into 2nd place this year, up from 3rd last year with OTP of 82.76%. The top four carriers have all seen a slight drop in OTP from last year but the achievement of three of the largest carriers in the world, Delta Air Lines, United Airlines and American Airlines, to secure a place in the Top 10 given their global size and scale, should not be underestimated. The US majors also all make it into the Top 20 mega airlines category.
Half of the Top 10 North American carriers are LCCs, with Frontier Airlines the leading North American LCC in terms of OTP.
11
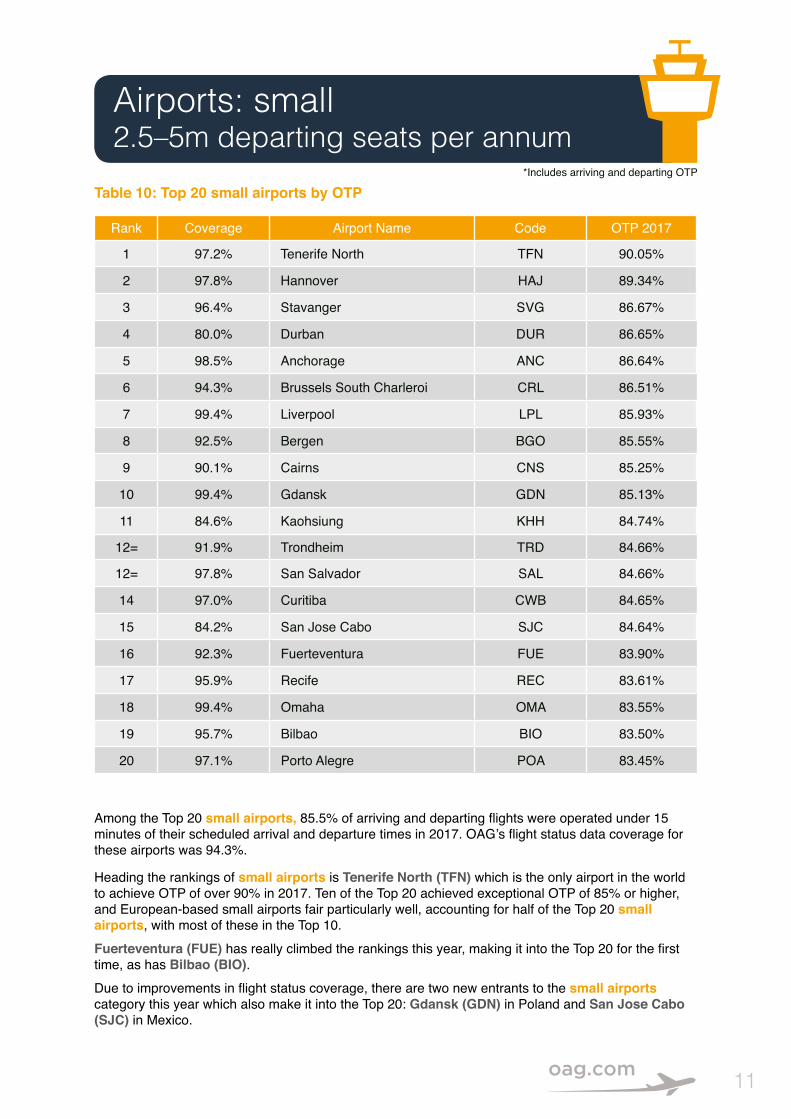
Table 10: Top 20 small airports by OTP
Rank Coverage Airport Name Code OTP 2017
1 97.2% Tenerife North TFN 90.05%
2 97.8% Hannover HAJ 89.34%
3 96.4% Stavanger SVG 86.67%
4 80.0% Durban DUR 86.65%
5 98.5% Anchorage ANC 86.64%
6 94.3% Brussels South Charleroi CRL 86.51%
7 99.4% Liverpool LPL 85.93%
8 92.5% Bergen BGO 85.55%
9 90.1% Cairns CNS 85.25%
10 99.4% Gdansk GDN 85.13%
11 84.6% Kaohsiung KHH 84.74%
12= 91.9% Trondheim TRD 84.66%
12= 97.8% San Salvador SAL 84.66%
14 97.0% Curitiba CWB 84.65%
15 84.2% San Jose Cabo SJC 84.64%
16 92.3% Fuerteventura FUE 83.90%
17 95.9% Recife REC 83.61%
18 99.4% Omaha OMA 83.55%
19 95.7% Bilbao BIO 83.50%
20 97.1% Porto Alegre POA 83.45%
Airports: small 2.5–5m departing seats per annum
Among the Top 20 small airports, 85.5% of arriving and departing flights were operated under 15 minutes of their scheduled arrival and departure times in 2017. OAG’s flight status data coverage for these airports was 94.3%.
Heading the rankings of small airports is Tenerife North (TFN) which is the only airport in the world to achieve OTP of over 90% in 2017. Ten of the Top 20 achieved exceptional OTP of 85% or higher, and European-based small airports fair particularly well, accounting for half of the Top 20 small airports, with most of these in the Top 10. Fuerteventura (FUE) has really climbed the rankings this year, making it into the Top 20 for the first time, as has Bilbao (BIO). Due to improvements in flight status coverage, there are two new entrants to the small airports category this year which also make it into the Top 20: Gdansk (GDN) in Poland and San Jose Cabo (SJC) in Mexico.
*Includes arriving and departing OTP
© 2018 OAG Aviation Worldwide Limited. All rights reserved
OAG Punctuality League – On-time performance results for airlines and airports
12
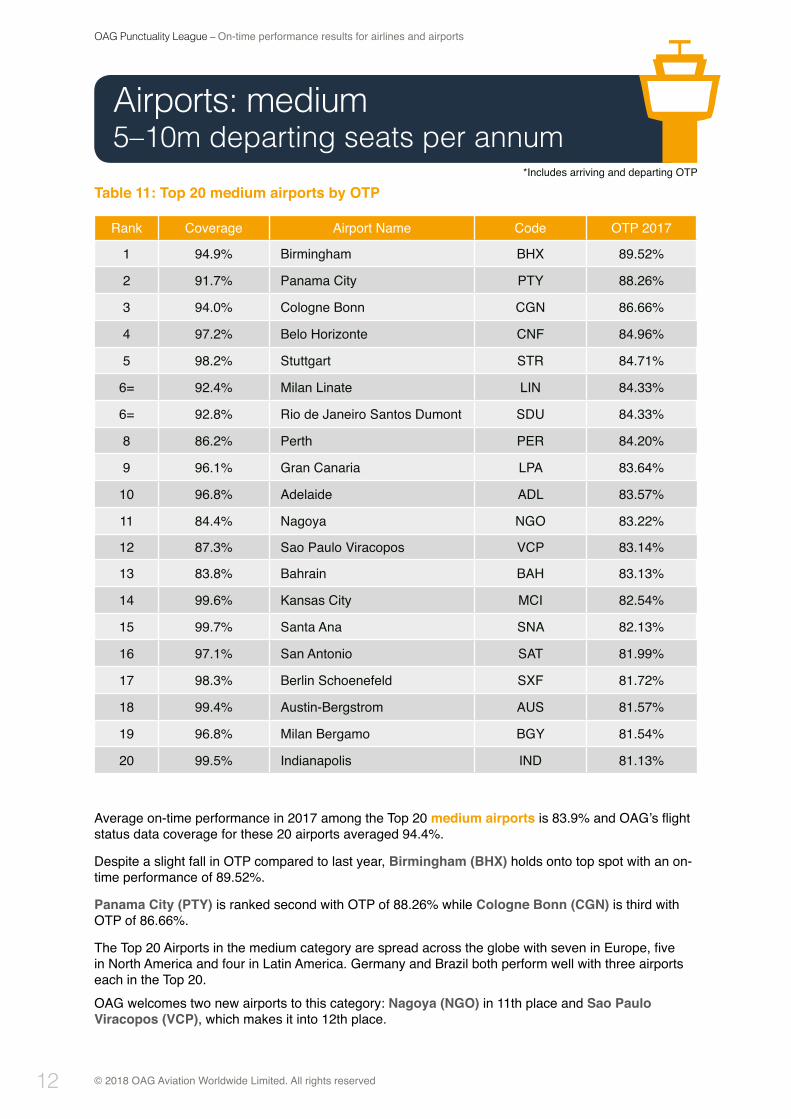
Average on-time performance in 2017 among the Top 20 medium airports is 83.9% and OAG’s flight status data coverage for these 20 airports averaged 94.4%.
Despite a slight fall in OTP compared to last year, Birmingham (BHX) holds onto top spot with an on-time performance of 89.52%.
Panama City (PTY) is ranked second with OTP of 88.26% while Cologne Bonn (CGN) is third with OTP of 86.66%.
The Top 20 Airports in the medium category are spread across the globe with seven in Europe, five in North America and four in Latin America. Germany and Brazil both perform well with three airports each in the Top 20.OAG welcomes two new airports to this category: Nagoya (NGO) in 11th place and Sao Paulo Viracopos (VCP), which makes it into 12th place.
Table 11: Top 20 medium airports by OTP
Rank Coverage Airport Name Code OTP 2017
1 94.9% Birmingham BHX 89.52%
2 91.7% Panama City PTY 88.26%
3 94.0% Cologne Bonn CGN 86.66%
4 97.2% Belo Horizonte CNF 84.96%
5 98.2% Stuttgart STR 84.71%
6= 92.4% Milan Linate LIN 84.33%
6= 92.8% Rio de Janeiro Santos Dumont SDU 84.33%
8 86.2% Perth PER 84.20%
9 96.1% Gran Canaria LPA 83.64%
10 96.8% Adelaide ADL 83.57%
11 84.4% Nagoya NGO 83.22%
12 87.3% Sao Paulo Viracopos VCP 83.14%
13 83.8% Bahrain BAH 83.13%
14 99.6% Kansas City MCI 82.54%
15 99.7% Santa Ana SNA 82.13%
16 97.1% San Antonio SAT 81.99%
17 98.3% Berlin Schoenefeld SXF 81.72%
18 99.4% Austin-Bergstrom AUS 81.57%
19 96.8% Milan Bergamo BGY 81.54%
20 99.5% Indianapolis IND 81.13%
Airports: medium 5–10m departing seats per annum
*Includes arriving and departing OTP
13
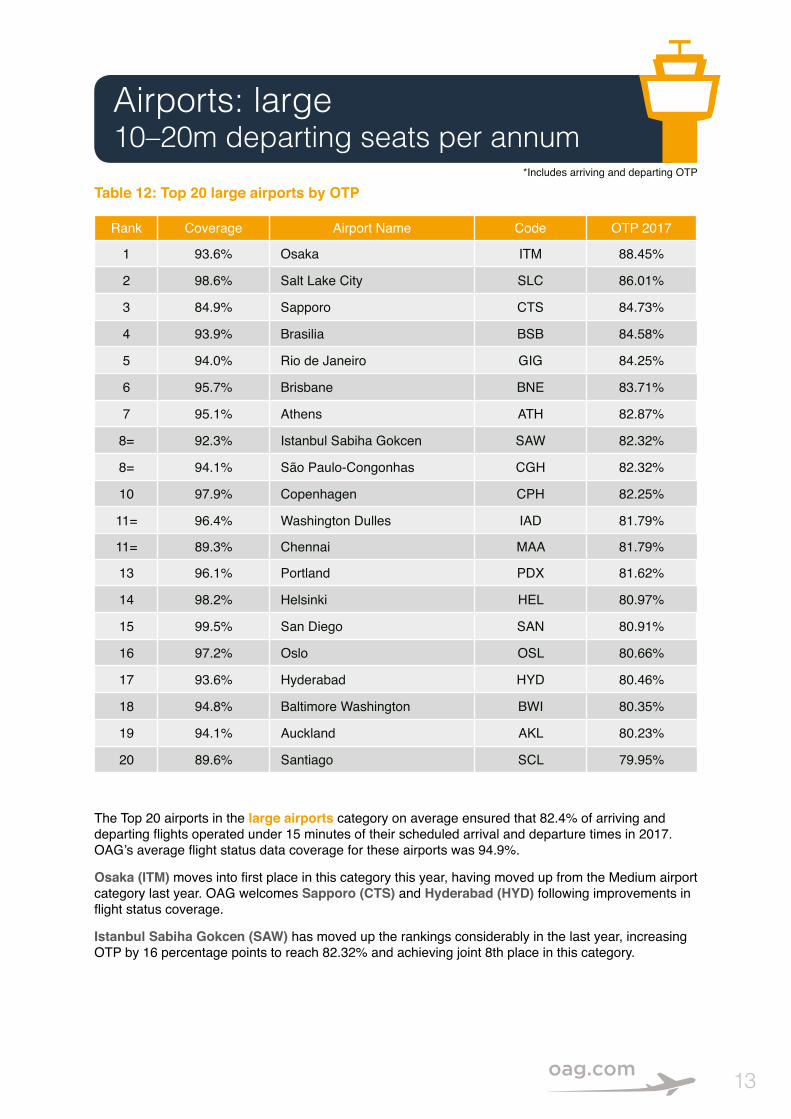
Table 12: Top 20 large airports by OTP
Rank Coverage Airport Name Code OTP 2017
1 93.6% Osaka ITM 88.45%
2 98.6% Salt Lake City SLC 86.01%
3 84.9% Sapporo CTS 84.73%
4 93.9% Brasilia BSB 84.58%
5 94.0% Rio de Janeiro GIG 84.25%
6 95.7% Brisbane BNE 83.71%
7 95.1% Athens ATH 82.87%
8= 92.3% Istanbul Sabiha Gokcen SAW 82.32%
8= 94.1% São Paulo-Congonhas CGH 82.32%
10 97.9% Copenhagen CPH 82.25%
11= 96.4% Washington Dulles IAD 81.79%
11= 89.3% Chennai MAA 81.79%
13 96.1% Portland PDX 81.62%
14 98.2% Helsinki HEL 80.97%
15 99.5% San Diego SAN 80.91%
16 97.2% Oslo OSL 80.66%
17 93.6% Hyderabad HYD 80.46%
18 94.8% Baltimore Washington BWI 80.35%
19 94.1% Auckland AKL 80.23%
20 89.6% Santiago SCL 79.95%
Airports: large 10–20m departing seats per annum
The Top 20 airports in the large airports category on average ensured that 82.4% of arriving and departing flights operated under 15 minutes of their scheduled arrival and departure times in 2017. OAG’s average flight status data coverage for these airports was 94.9%.
Osaka (ITM) moves into first place in this category this year, having moved up from the Medium airport category last year. OAG welcomes Sapporo (CTS) and Hyderabad (HYD) following improvements in flight status coverage.
Istanbul Sabiha Gokcen (SAW) has moved up the rankings considerably in the last year, increasing OTP by 16 percentage points to reach 82.32% and achieving joint 8th place in this category.
*Includes arriving and departing OTP
© 2018 OAG Aviation Worldwide Limited. All rights reserved
OAG Punctuality League – On-time performance results for airlines and airports
14
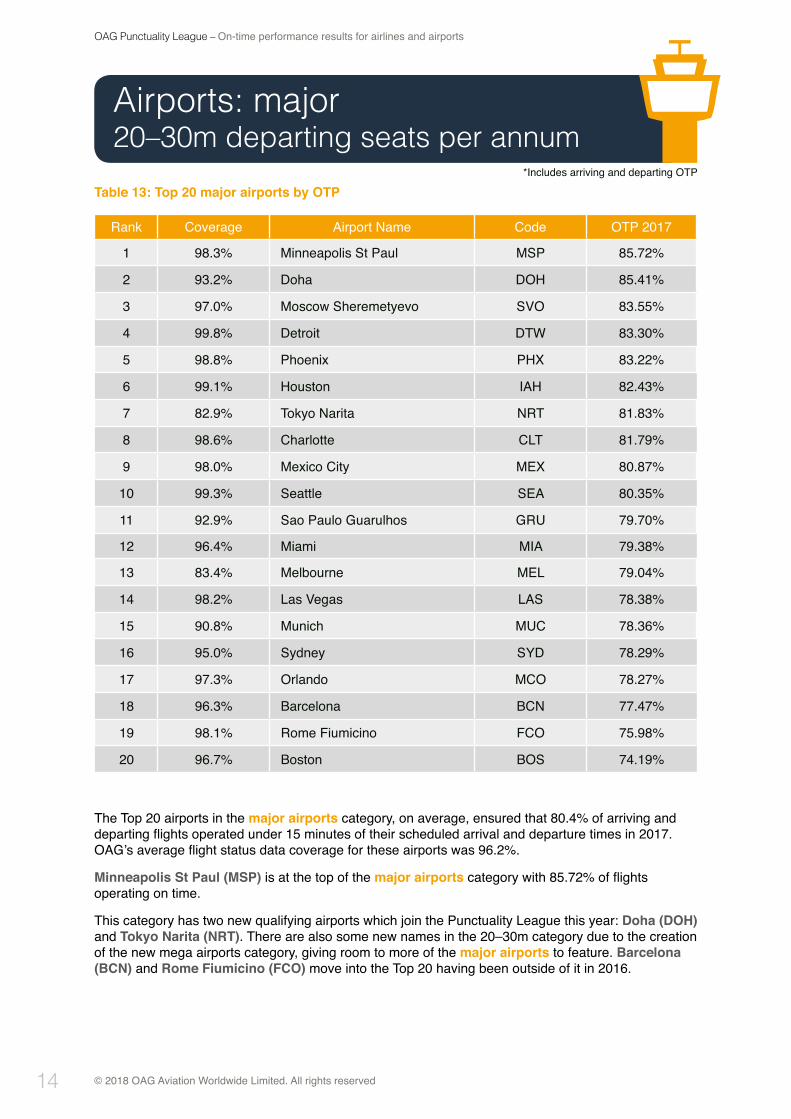
The Top 20 airports in the major airports category, on average, ensured that 80.4% of arriving and departing flights operated under 15 minutes of their scheduled arrival and departure times in 2017. OAG’s average flight status data coverage for these airports was 96.2%.
Minneapolis St Paul (MSP) is at the top of the major airports category with 85.72% of flights operating on time.
This category has two new qualifying airports which join the Punctuality League this year: Doha (DOH) and Tokyo Narita (NRT). There are also some new names in the 20–30m category due to the creation of the new mega airports category, giving room to more of the major airports to feature. Barcelona (BCN) and Rome Fiumicino (FCO) move into the Top 20 having been outside of it in 2016.
Airports: major 20–30m departing seats per annum
Table 13: Top 20 major airports by OTP
Rank Coverage Airport Name Code OTP 2017
1 98.3% Minneapolis St Paul MSP 85.72%
2 93.2% Doha DOH 85.41%
3 97.0% Moscow Sheremetyevo SVO 83.55%
4 99.8% Detroit DTW 83.30%
5 98.8% Phoenix PHX 83.22%
6 99.1% Houston IAH 82.43%
7 82.9% Tokyo Narita NRT 81.83%
8 98.6% Charlotte CLT 81.79%
9 98.0% Mexico City MEX 80.87%
10 99.3% Seattle SEA 80.35%
11 92.9% Sao Paulo Guarulhos GRU 79.70%
12 96.4% Miami MIA 79.38%
13 83.4% Melbourne MEL 79.04%
14 98.2% Las Vegas LAS 78.38%
15 90.8% Munich MUC 78.36%
16 95.0% Sydney SYD 78.29%
17 97.3% Orlando MCO 78.27%
18 96.3% Barcelona BCN 77.47%
19 98.1% Rome Fiumicino FCO 75.98%
20 96.7% Boston BOS 74.19%
*Includes arriving and departing OTP
15
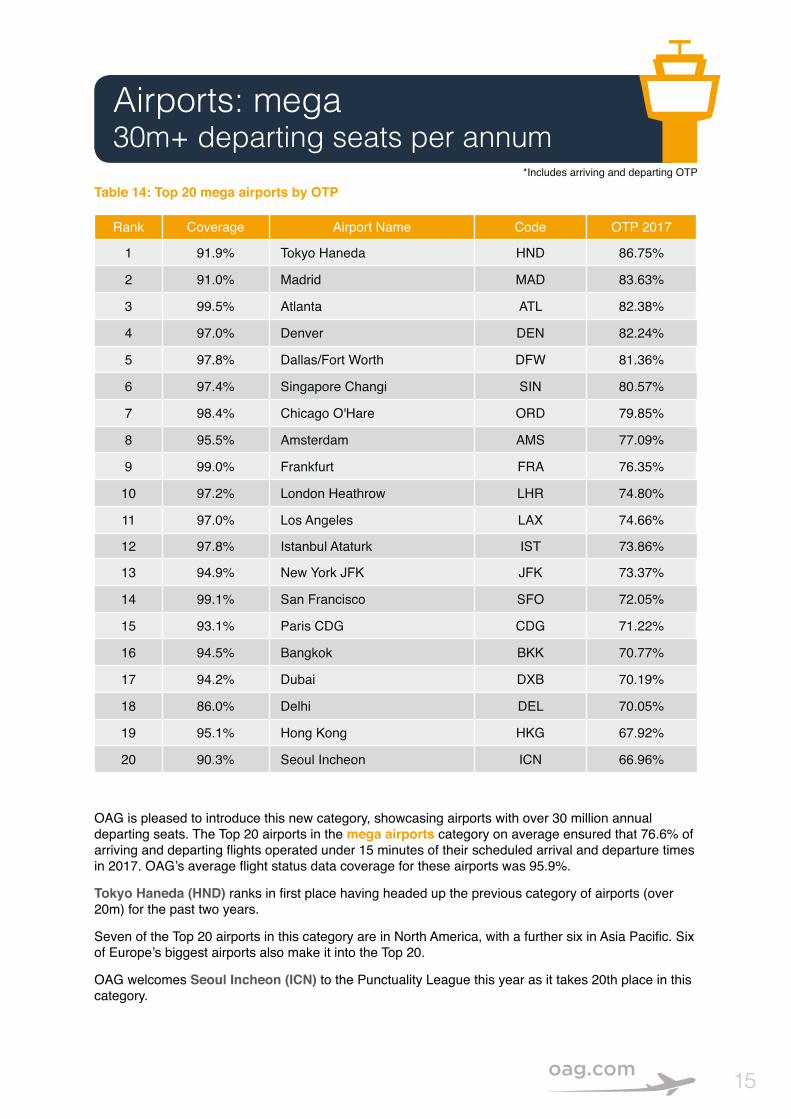
Airports: mega 30m+ departing seats per annum
Table 14: Top 20 mega airports by OTP
Rank Coverage Airport Name Code OTP 2017
1 91.9% Tokyo Haneda HND 86.75%
2 91.0% Madrid MAD 83.63%
3 99.5% Atlanta ATL 82.38%
4 97.0% Denver DEN 82.24%
5 97.8% Dallas/Fort Worth DFW 81.36%
6 97.4% Singapore Changi SIN 80.57%
7 98.4% Chicago O'Hare ORD 79.85%
8 95.5% Amsterdam AMS 77.09%
9 99.0% Frankfurt FRA 76.35%
10 97.2% London Heathrow LHR 74.80%
11 97.0% Los Angeles LAX 74.66%
12 97.8% Istanbul Ataturk IST 73.86%
13 94.9% New York JFK JFK 73.37%
14 99.1% San Francisco SFO 72.05%
15 93.1% Paris CDG CDG 71.22%
16 94.5% Bangkok BKK 70.77%
17 94.2% Dubai DXB 70.19%
18 86.0% Delhi DEL 70.05%
19 95.1% Hong Kong HKG 67.92%
20 90.3% Seoul Incheon ICN 66.96%
OAG is pleased to introduce this new category, showcasing airports with over 30 million annual departing seats. The Top 20 airports in the mega airports category on average ensured that 76.6% of arriving and departing flights operated under 15 minutes of their scheduled arrival and departure times in 2017. OAG’s average flight status data coverage for these airports was 95.9%.
Tokyo Haneda (HND) ranks in first place having headed up the previous category of airports (over 20m) for the past two years.
Seven of the Top 20 airports in this category are in North America, with a further six in Asia Pacific. Six of Europe’s biggest airports also make it into the Top 20.
OAG welcomes Seoul Incheon (ICN) to the Punctuality League this year as it takes 20th place in this category.
*Includes arriving and departing OTP

© 2018 OAG Aviation Worldwide Limited. All rights reserved
OAG Punctuality League – On-time performance results for airlines and airports
16
Top 20 busiest international routes
9 Frequency
14,556Average OTP
82.56%DUBDublin London Heathrow
LHRAer Lingus
86.4%British Airways
78.7%
6 Frequency
17,116Average OTP
54.24%LGANew York La Guardia Toronto
YYZAir Canada
51.7%Westjet51.5%
American Airlines59.6%
8 Frequency
14,592Average OTP
63.43%PEKBeijing Hong Kong
HKGAir China42.9%
China Southern Airlines54.8%
Hong Kong Airlines85.3%
Cathay Dragon61.2%
Cathay Pacific Airways62.7%
1 Frequency
29,494Average OTP
70.92%HKGHong Kong Taipei
TPEChina Airlines
52.4%Cathay Dragon
77.6%EVA Airways
55.9%Cathay Pacific Airways
79.9%Hong Kong Airlines
88.9%
5 Frequency
20,818Average OTP
57.79%HKGHong Kong Shanghai
PVGChina Eastern Airlines
39.5%Spring Airlines
69.2%Hong Kong Airlines
84.9%Juneyao Airlines
43.5%Cathay Dragon
53.3%Cathay Pacific
49.1%
2 Frequency
29,383Average OTP
78.52%KULKuala Lumpur Singapore
SINMalaysia Airlines
63.1%Singapore Airlines
83.5%SilkAir82.9%
Jetstar Asia86.7%
Air Asia66.9%
Malindo Airways73.9%
Scoot90.5%
3 Frequency
26,872Average OTP
77.38%CGKJakarta Singapore
SINSingapore Airlines
83.6%Jetstar Asia
83.6%Lion Air70.4%
Batik Air90.3%
Garuda69.6%
Indonesia AirAsia59.6%
Scoot84.6%
4 Frequency
20,890Average OTP
64.84%CGKJakarta Kuala Lumpur
KULAirAsia59.3%
Garuda64.4%
Batik Air68.9%
Indonesia AirAsia50.2%
Lion Air57.1%
Malaysia Airlines65.4%
Malindo Airways65.5%
KLM84.0%
7 Frequency
16,366Average OTP
65.14%HKGHong Kong Seoul Incheon
ICNKorean Air
67.6%Jeju Airlines
47.8%Air India60.2%
Eastar Jet66.5%
Asiana Airlines55.5%
Jin Air56.9%
Cathay Pacific 72.5%
HK Express 62.1%
Hong Kong Airlines92.0%
Airlines operating on these routes with data for at least 80% of scheduled flights operated

17
17 Frequency
13,220Average OTP
74.47%AMSAmsterdam London Heathrow
LHRKLM
76.9%British Airways
72.1%
14 Frequency
13,595Average OTP
65.96%ORDChicago O’Hare Toronto
YYZAir Canada
57.5%United Airlines
73.4%American Airlines
67.0%
18 Frequency
13,208Average OTP
72.67%FRAFrankfurt London Heathrow
LHRLufthansa
68.9% British Airways
76.5%
11 Frequency
14,406Average OTP
72.40%BKKBangkok Hong Kong
HKGEmirates67.5%
Hong Kong Airlines90.1%
Royal Jordanian74.2%
Cathay Pacific Airways67.0%
Thai Airways70.3%
10 Frequency
14,455Average OTP
77.87%BKKBangkok Singapore
SINScoot89.2%
Cathay Pacific Airways69.4%
Thai Airways60.7%
Singapore Airlines87.1%
Jetstar Asia83.0%
19 Frequency
12,896Average OTP
67.36%CAICairo Jeddah
JEDEgyptair73.9%
Flynas68.3%
Saudi Arabian Airlines59.9%
20 Frequency
12,804Average OTP
79.76%ARNStockholm Arlanda Oslo
OSLSAS
78.6%Norwegian Air Shuttle
83.5%
12 Frequency
14,218Average OTP
76.42%LHRLondon Heathrow New York JFK
JFKBritish Airways
74.0%Delta Air Lines
77.8%American Airlines
78.9% Virgin Atlantic
75.1%
16 Frequency
13,270Average OTP
66.42%HKGHong Kong Manila
MNLCebu Pacific Air
54.5%Philippine AirAsia
75.5%Cathay Pacific Airways
71.6%Philippine Airlines
64.1%
15 Frequency
13,297Average OTP
83.55%DXBDubai Kuwait
KWIFlydubai87.1%
Jazeera Airways88.6%
Emirates78.7%
Kuwait Airways79.8%
13 Frequency
14,162Average OTP
70.41%HKGHong Kong Singapore
SINCathay Pacific Airways
69.5%Singapore Airlines
74.5% Jetstar Asia
56.4% Scoot80.6%
© 2018 OAG Aviation Worldwide Limited. All rights reserved
OAG Punctuality League – On-time performance results for airlines and airports
18
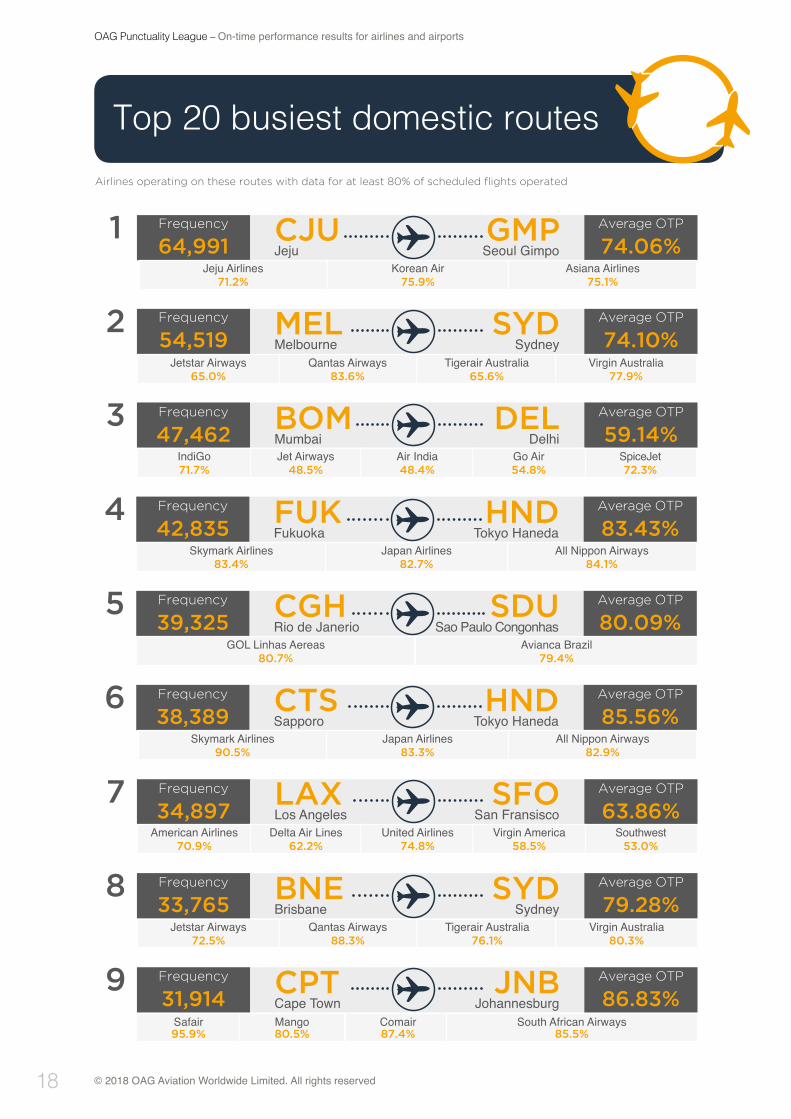
1 Frequency
64,991Average OTP
74.06%CJUJeju Seoul Gimpo
GMPKorean Air
75.9%Asiana Airlines
75.1%Jeju Airlines
71.2%
4 Frequency
42,835Average OTP
83.43%FUKFukuoka Tokyo Haneda
HNDJapan Airlines
82.7%All Nippon Airways
84.1%Skymark Airlines
83.4%
5 Frequency
39,325Average OTP
80.09%CGHRio de Janerio Sao Paulo Congonhas
SDUAvianca Brazil
79.4%GOL Linhas Aereas
80.7%
6 Frequency
38,389Average OTP
85.56%CTSSapporo Tokyo Haneda
HNDJapan Airlines
83.3%All Nippon Airways
82.9% Skymark Airlines
90.5%
2 Frequency
54,519Average OTP
74.10%MELMelbourne Sydney
SYDQantas Airways
83.6%Tigerair Australia
65.6% Jetstar Airways
65.0% Virgin Australia
77.9%
3 Frequency
47,462Average OTP
59.14%BOMMumbai Delhi
DELJet Airways
48.5%SpiceJet72.3%
Air India48.4%
IndiGo71.7%
Go Air54.8%
7 Frequency
34,897Average OTP
63.86%LAXLos Angeles San Fransisco
SFODelta Air Lines
62.2%Southwest
53.0%United Airlines
74.8% American Airlines
70.9%Virgin America
58.5%
9 Frequency
31,914Average OTP
86.83%CPTCape Town Johannesburg
JNBSafair95.9%
Mango80.5%
Comair87.4%
South African Airways85.5%
8 Frequency
33,765Average OTP
79.28%BNEBrisbane Sydney
SYDQantas Airways
88.3%Tigerair Australia
76.1%Jetstar Airways
72.5% Virgin Australia
80.3%
Top 20 busiest domestic routesAirlines operating on these routes with data for at least 80% of scheduled flights operated
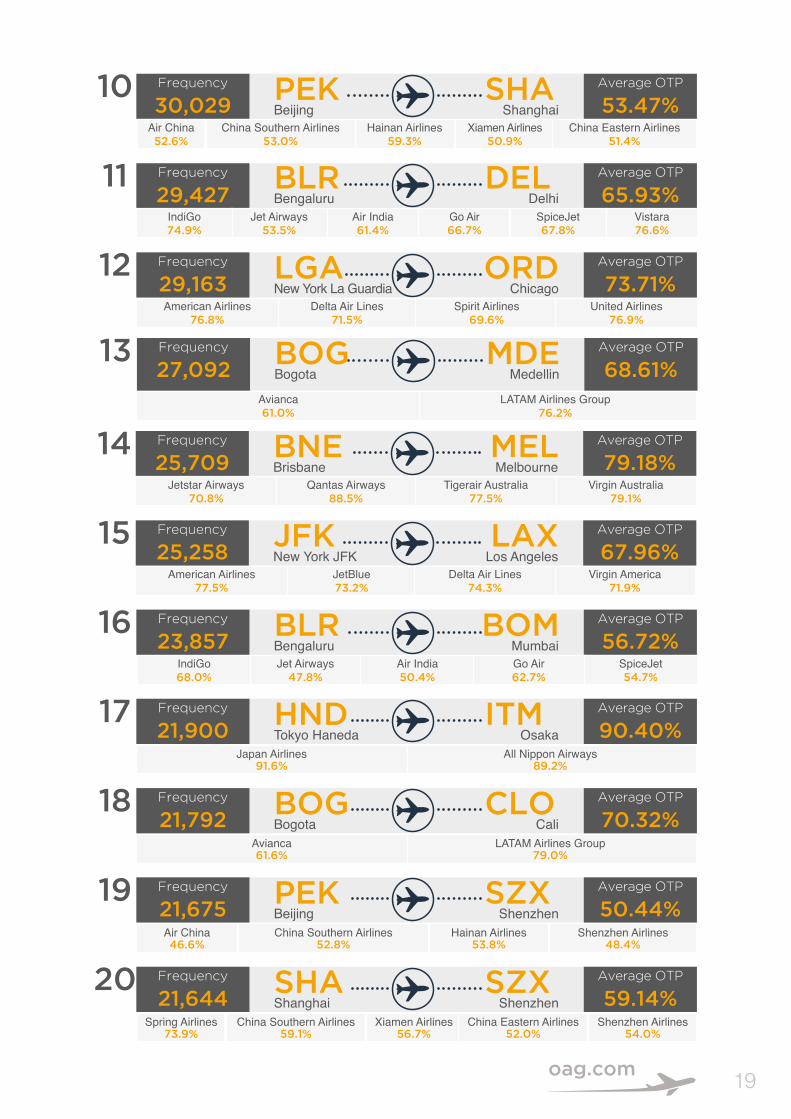
19
13 Frequency
27,092Average OTP
68.61%BOGBogota Medellin
MDELATAM Airlines Group
76.2%Avianca61.0%
20 Frequency
21,644Average OTP
59.14%SHAShanghai Shenzhen
SZXChina Southern Airlines
59.1%Shenzhen Airlines
54.0%Xiamen Airlines
56.7%China Eastern Airlines
52.0%Spring Airlines
73.9%
19 Frequency
21,675Average OTP
50.44%PEKBeijing Shenzhen
SZXChina Southern Airlines
52.8%Shenzhen Airlines
48.4%Air China46.6%
Hainan Airlines53.8%
18 Frequency
21,792Average OTP
70.32%BOGBogota Cali
CLOLATAM Airlines Group
79.0%Avianca61.6%
17 Frequency
21,900Average OTP
90.40%HNDTokyo Haneda Osaka
ITMAll Nippon Airways
89.2%Japan Airlines
91.6%
14 Frequency
25,709Average OTP
79.18%BNEBrisbane Melbourne
MELQantas Airways
88.5% Virgin Australia
79.1%Jetstar Airways
70.8%Tigerair Australia
77.5%
16 Frequency
23,857Average OTP
56.72%BLRBengaluru Mumbai
BOMJet Airways
47.8%Go Air62.7%
SpiceJet54.7%
IndiGo68.0%
Air India50.4%
10 Frequency
30,029Average OTP
53.47%PEKBeijing Shanghai
SHAAir China52.6%
Xiamen Airlines50.9%
Hainan Airlines59.3%
China Eastern Airlines51.4%
China Southern Airlines53.0%
12 Frequency
29,163Average OTP
73.71%LGANew York La Guardia Chicago
ORDDelta Air Lines
71.5%Spirit Airlines
69.6% American Airlines
76.8% United Airlines
76.9%
11 Frequency
29,427Average OTP
65.93%BLRBengaluru Delhi
DELJet Airways
53.5%Go Air66.7%
Air India61.4%
IndiGo74.9%
SpiceJet67.8%
Vistara76.6%
15 Frequency
25,258Average OTP
67.96%JFKNew York JFK Los Angeles
LAXJetBlue73.2%
Virgin America71.9%
Delta Air Lines74.3%
American Airlines77.5%
For more information, visit www.oag.com or email us on [email protected]
For media enquiries email [email protected]
© 2018 OAG Aviation Worldwide Limited.All rights reserved
Usage and attribution This information can be reproduced either in whole or in part, online or in print, for non-commercial purposes only but must include attribution to OAG and a link to www.oag.com.
Disclaimer The intended recipient (“The Customer”) acknowledges that all data provided by or available through OAG is owned either by OAG Aviation Worldwide Ltd or by a third party provider (“The Owners”) and that the customer shall not acquire any ownership or interest in such data.
OAG data is solely for the benefit and purposes of the intended recipient and may not be disclosed to, used by or copied by anyone other than the intended recipient. OAG Aviation Worldwide Ltd has used reasonable efforts in collecting and preparing data in the report but cannot and does not warrant that the information contained in this report is complete or accurate. OAG Aviation Worldwide Ltd hereby disclaims liability to any person for any loss or damage caused by errors or omissions in this report.