on the paused warming controversy …aerapa.conference.ubbcluj.ro/2014/pdf/03-mika.pdfon the paused...
TRANSCRIPT
ON THE PAUSED WARMING CONTROVERSY BASED ON IPCC AR5 AND BEYOND
MIKA J. 1
ABSTRACT. On the paused warming controversy based on IPCC AR5 and beyond. The paused warming since ca. 2002 (maybe, 1998) is not satisfactorily reflected by the IPCC WGI (2013) Report. The aim of the present study is to collect, present and discuss the key arguments of the issue, selected strictly from this valuable Report. Our study tackles three aspects: (i) Symptoms of pausing, including atmospheric changes, near-surface oceans, cryosphere and geographical differences. (ii) Possible reasons of the paused warming, including external forcing factors, playing rather minor role, and the enhanced ocean heat uptake. Though missing warming is 0.2 K/decade compared to the model expectations, the whole climate system integrates continuously increasing amount of heat, 95 % of which is locked in the oceans. (iii) Consequences of the pausing for the three main branches of the IPCC activity. For climate science, correct simulation of the enhanced heat uptake is a challenge. Since characteristic time scale of most adaptation measures is 1-2 decades, or shorter, near-term projections may not drive adaptation until climate models become able meet this challenge. On the other hand, pausing warming does not question the need for mitigation, since it is physically unlikely, that oceans can uptake endless amount of heat. Vertical temperature gradients of the upper ocean layers already show stagnation. Keywords: IPCC, geographical features, ocean heat uptake, adaptation, mitigation
1. INTRODUCTION
The media reflected only one statement by the recent IPCC WGI Report (2013): „It is extremely likely that more than half of the observed increase in global average surface temperature from 1951 to 2010 was caused by the anthropogenic increase in greenhouse gas concentrations and other anthropogenic forcings together.” On the other hand, strong discussions took place behind the scenes, since no increase of surface air temperature is seen since ca. 2002 or 1998 (a strong El-Nino year).
Our study tackles the aspects of the issue in three groups, based on the full Report. Symptoms of the paused warming are presented in Section 2, including atmospheric changes, near-surface oceans, cryosphere and the geographical differences. Possible reasons of the paused warming are discussed in Section 3, including external forcing factors, and the enhanced ocean heat uptake, as internal process. Consequences of the paused warming concerning the three main branches
1 Eszterhazy Karoly College, Faculty of Natural Science, Departament of Geography, Eger, Hungary e-mail: [email protected]
16

of IPCC, i.e. climate science, adaptation and mitigation are presented in Section 4. All these branches are seriously challenged by the lack of warming, responsibility of mankind, and, hence the need for long-term mitigation should not be questioned.
2. SYMPTOMS OF PAUSED WARMING 2.1 Pausing trends at the surface and in the atmosphere
Let us start with parallel estimates of the near-surface air temperatures
(Fig. 1). It is clearly seen that in the last 10-15 years the steep warming does not continue. Duration of this paused period is also questionable, since year 1998 was a strong El Nino year, but the following years were cooler, still reminding the steeper trend of previous decades. (Note that references are fully listed only in the IPCC Report.)
Still in Fig. 1 (lower panel) one can see the statistical operation to make this pausing invisible. Based on these decadal averages, continuous warming is seen. Unfortunately, not only the near-surface temperature, but also lower troposphere and lower stratosphere (Fig. 2) exhibit unequivocal signs of paused changes, though in the lower stratosphere, obviously, it means paused cooling.
Fig. 1. Observed annual and decadal global
mean surface temperature anomalies relative to 1961-1990 from different global data sets
1850 to 2012 (IPCC WGI, 2013: Fig. SPM.1)
Fig. 2. Global annual temperature anomalies
of the lower stratosphere (a) and lower troposphere (b), relative to climatology of
1981–2010, from different data sets. (IPCC WGI, 2013: Fig. 2.24)
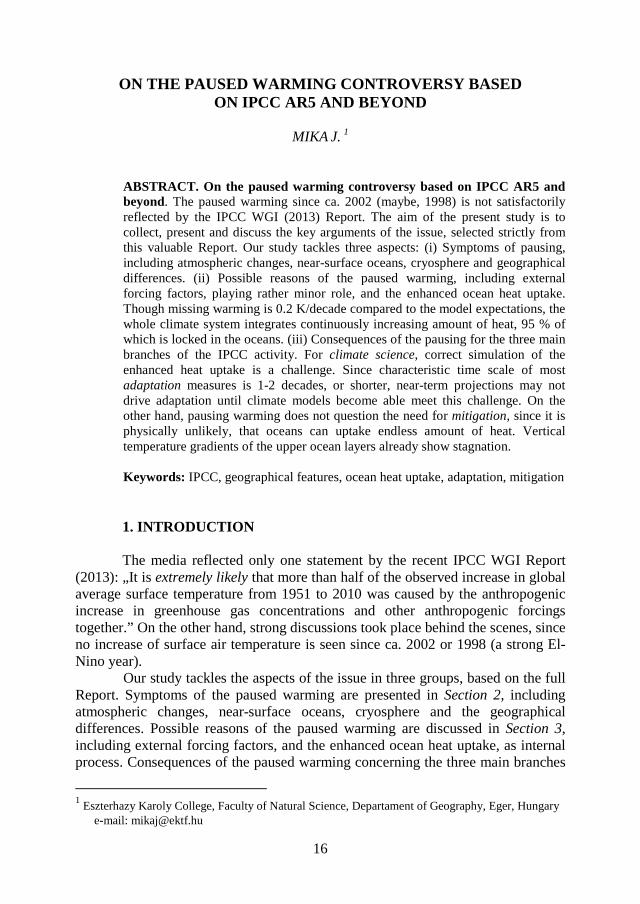
Atmospheric humidity is driven by thermal conditions. Evapotranspiration
and the maximum vapour content, both strongly depend on temperature. As Fig. 3 indicates, stagnation of specific humidity is unequivocal in the recent 1-1.5 decade.
Finally, an exception from the paused warming is seen in Fig. 4, indicating behaviour of land-based averages of highest temperature of a given year. This value does not show any pausing in the monotonic increase. Either the land-based
17
feature or the extremity (occurring in bright summer weather) can make behaviour of this temperature characteristic different from the averages.
Fig. 3. Global annual average anomalies in
land surface specific humidity from four different sources (see the Report).
Anomalies are relative to the 1979–2003 climatology. (IPCC WGI, 2013: Fig. 2.30b)
Fig. 4. Globally averaged annual warmest day
anomalies from the two given data sets. Anomalies are calculated using grid boxes only where both data sets have data and where 90% of data are available. (IPCC WGI, 2013: Box 2.4, Fig. 1c)
2.2 Near-surface changes in the oceans and cryosphere
How do the other near-surface indicators of thermal conditions behave in
the recent 1-1.5 decades? Fig. 5 presents us some answers. In its upper left panel one can see that both sea-surface temperature and near-surface marine air temperature clearly stopped warming in the critical period! On the other hand, melting of solid water does not exhibit pausing in the Northern Polar latitudes, either in the snow cover extent or in the sea-ice extent (lower left and upper right parts of Fig. 5). This may mean that lack of warming, established in global averages, has regional differences.
This is supported by the right lower panel of Fig. 5, showing the surprising fact that sea-ice is increasing around the Antarctic for much longer time than the recent 10-15 years, as it was expressed by the earlier IPCC Reports, too. Observed Arctic sea-ice trends are well simulated, but this is not true in the Antarctic.
2.3 Geographical differences
Differences in success of temperature reproduction by the climate models between the various parts and domains of the Earths are presented in Fig. 6. The fluctuating upper black lines are always the observations, to be compared with the upper smooth lines of simulations based on all known natural and anthropogenic factors. The upper shaded bands represent the uncertainty of the various modes runs. (The lower band indication simulations by natural forcing factors are out of our interest.)
18

Fig. 5. (Upper left panel) Global annual average sea surface temperature (SST) and Night Marine
Air Temperature (NMAT) relative to 1961–1990 from various data sets (IPCC WGI, 2013: Fig. 2.16). (Lower left panel) March–April NH snow cover extent over the period of available data, filtered with a 13-term smoother and with shading indicating the 95% confidence interval; and
June SCE (from satellite data). The anomalies are compared to the 1971–2000 mean. (IPCC WGI, 2013: Fig. 4.19). (Right panels) September sea ice extent for Arctic (top) and Antarctic (bottom)
from the observations (thick black lines) and various simulations (thin grey lines). Climate models simulating sea ice in agreement with observations were only considered. There are 24 ensemble members from 11 models for the Arctic, and 21 members from 6 models for the Antarctic plot.
(IPCC WGI, 2013: Fig. 10.16)
The observations and simulations differ strongly in the Global and Global ocean comparisons, where the expected changes are above the observations by ca. 0.15 and 0.20o C by the end of the decade, respectively. Considering smaller scale simulations, observed decadal mean air temperature lags behind the simulation by ca. 0.4 over continents of South America and Australasia. These characteristics indicate that the lack of temperature behind the considered physical reasoning, i.e. model simulations is the strongest over and near the Southern Oceans. Over the northern continents, however no lack behind the simulations can be established.
3. LIKELY REASONS 3.1 External forcing factors
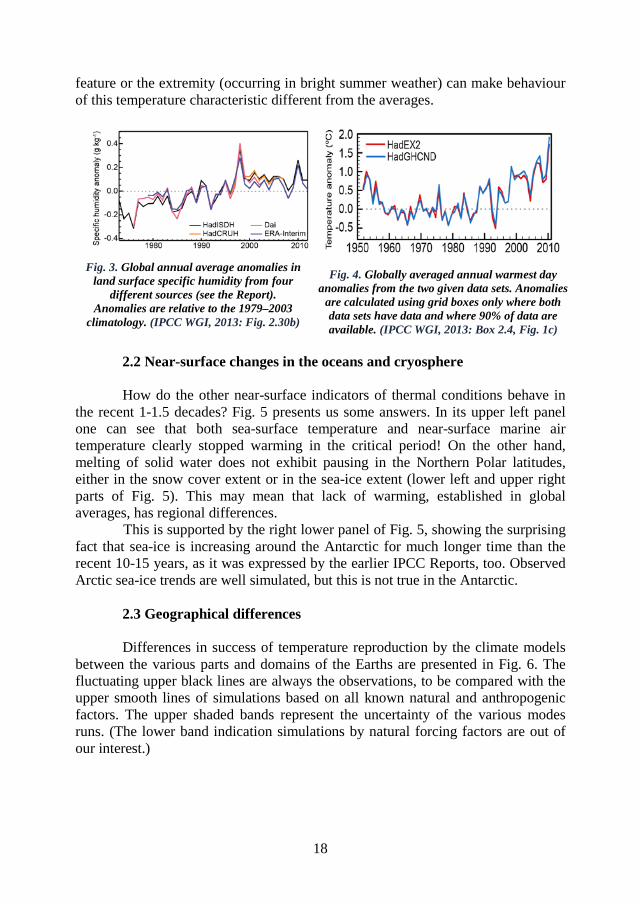
The first obvious attempt to explain the paused warming in the last 1-1.5
decade is to find weakening in the natural or anthropogenic forcing factors. But, as it is seen in Fig. 7, this is not the case. Only slight cooling can be attributed to fluctuations in the solar irradiation or transparency of the atmosphere due to the volcanic activity.
Putting together all natural and anthropogenic factors in Fig. 8, one can establish that the increasing anthropogenic factor should have caused warming in the given period, since decrease of natural component was much below the surplus
19

from the greenhouse components. Moreover, natural forcing was stagnating during the last decade, whereas the greenhouse effect was further increasing.
Fig. 6. Global, land, ocean and
continental annual mean temperatures for CMIP5 historical and historicalNat simulations (multi-model means shown
as thick lines with 5 to 95% ranges) and for Hadley Centre/Climatic Research Unit gridded surface
temperature data set (HadCRUT4, black). Mean temperatures are shown
for Antarctica and six continental regions formed by combining the sub-
continental scale regions. Temperatures are shown with respect to 1880–1919 for all regions except Antarctica where temperatures are
compared to 1950–2010. (IPCC WGI, 2013: Fig. 10.7)
Fig. 7. (Left panel) Annual total solar irradiance: Data by Active Cavity Radiometer Irradiance Monitor (ACRIM), Physikalisch-Meteorologisches Observatorium Davos (PMOD) and Royal
Meteorological Institute of Belgium (RMIB).The composites are standardized to the mean (2003–2012) Total Irradiance Monitor (TIM) measurements, also shown (IPCC WGI, 2013: Fig. 8.10)
(Right panel) Global mean aerosol optical depth (at 550 nm) of volcanic origin according to various estimations. Gao and Crowley are from ice core data; Sato includes data from surface and
satellite observations. (IPCC WGI, 2013: Fig. 8.12)
3.2 Ocean heat uptake
Analysing Fig. 6, above we established that Oceans of the Southern Hemisphere might be the key region in the paused warming phenomena since the difference between observations and simulations of temperature changes are maximal here.
20
Observed warming in the various sections of the oceans (Fig. 9) supports this statement. Deep ocean layers warmed almost at its every depth in 1992-2005, according to the upper left panel, but warming of the Southern oceans were even stronger. Lower panel shows which parts of oceans exhibit strongest warming.
Right panel of this Fig. is probably one of the most important drawing of the whole IPCC WGI (2013) Report, indicating that even during the paused warming period, the heat content of the climate system have been increasing. The 95 % of this warming took place in the upper and deep oceans.
Fig. 8. (Left panel) Time evolution of forcing for anthropogenic and natural forcing mechanisms.
The total anthropogenic forcing was 0.57 Wm–2 in 1950, 1.25 Wm–2 in 1980 and 2.29 Wm–2 in 2011. (IPCC WGI, 2013: Fig. 8.18) (Right panel) Linear trend in computed anthropogenic, natural
and total forcing for the indicated years, with their uncertainty ranges (90% confidence range). (IPCC WGI, 2013: Fig. 8.19)
Fig. 9. (Left panel) (a) Areal mean warming rates (ºC per decade, thick lines) at the various depths with 5 to 95% confidence limits (shading), both globally and south of the Sub-Antarctic Front, in
1992–2005. (b) Mean warming rates (ºC/decade) below 4000 m (bar) estimated for deep ocean basins (thin black), also in 1992–2005. Positions of the Sub-Antarctic Front and the oceanographic
transects, from which the warming rates are estimated (thick black) are also shown. (IPCC WGI, 2013: Fig. 3.3) (Right panel) Plot of energy accumulation in ZJ (1 ZJ = 1021 J) within all
components of the Earth’s climate system in 1971─2010 unless otherwise indicated. Ocean warming dominates within the upper ocean (above 700 m) contributing more to the warming than the deep ocean (below 700 m; including below 2000 m estimates after 1992). Ice melt (glaciers, ice
caps, Greenland and Antarctic ice sheets start from 1992; Arctic sea ice estimates are available from). Warming of continents and atmosphere (starting from 1979) makes small contributions.
Ocean estimates also dominate the total uncertainty. Thin lines represent 90% confidence band of total heat content. (IPCC WGI, 2013: Box 3.1, Fig. 1)
21
4. CONSEQUENCES 4.1 Climate science
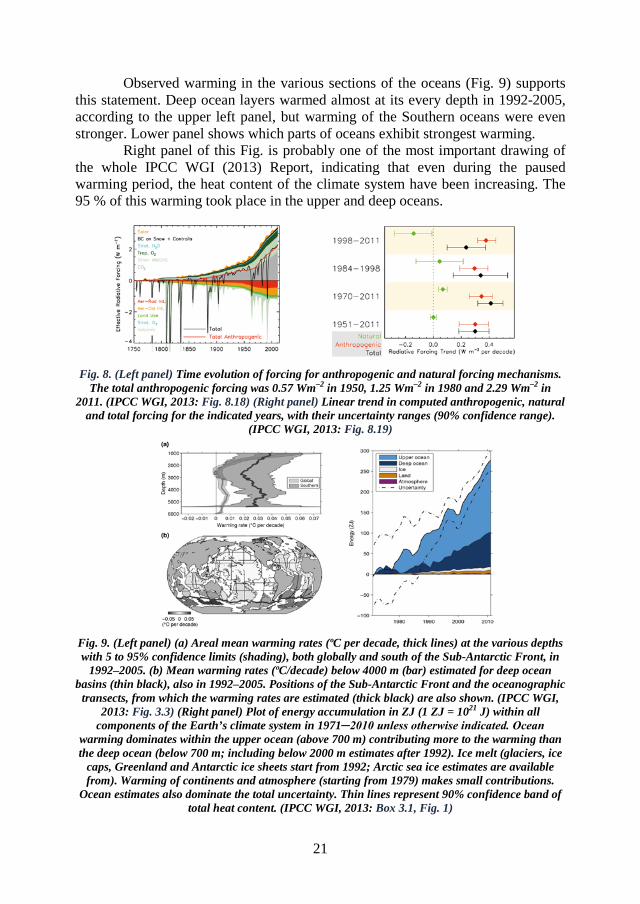
Intensified heat uptake of the Southern Oceans and its cooling effect on
adjacent atmospheric layers and contribution of this process to the paused warming even in global average is a challenge for climate science. As left panels of Fig. 10 indicate, all models strongly overestimate the temperature changes of the last 1.5 decades, whereas in average they correctly estimate shift of the radiation forcing during the same period.
At the same time, right panel of the Fig. 10 demonstrates the effect of missing heat uptake in majority of the ten years’ long simulations in the recent decade after 2001, leading to strong overestimation of global sea-surface temperature. At the same time, simulations performed for the other decades fit the observations fairly well. Hence, lack of model performance is quite a new problem.
Fig. 10. (Upper left panel) Observed and simulated GMST trends in °C/ decade, over the periods 1998–2012. For the observations, 100 realizations of the Hadley Centre/Climatic Research Unit
surface temperature data ensemble are shown (hatched). For the models, all 114 available CMIP5 historical realizations are shown, extended with the RCP4.5 scenario from 2005 to 2012 (grey).
(Lower left panel) Trends in effective radiative forcing (W m–2/decade) over the periods 1998–2011. The figure shows AR5 best-estimate trends (hatched) and CMIP5 (grey). Each histogram is
normalized so that its area sums up to one. (IPCC WGI, 2013: Box TS.3, Fig. 1) (Right panel) Time series of global mean sea surface temperature in the 60o S – 60o N non-polar latitudes from
the anomalies of the CMIP5 multi-model initialized hindcasts. Results for each forecast system are plotted. Results for the start dates 1961 … 2001 are shown, while the model and observed
climatologies to obtain the anomalies have been estimated using data from start dates every 5 years. The reference data (ERSST) is drawn in thick black. (IPCC WGI, 2013: Fig. 11.2)
4.2 Impact and adaptation
Until we do not understand this recently enhanced ocean heat uptake, i.e.
climate models are unable to simulate the paused warming adequately, our all near-time climate projections may be wrong. This is illustrated by Fig. 11, where climate
22

projections starting from 2005 exhibit strong overestimation of the global mean temperature following any Representative Climate Projection (RCP) scenario, bearing in their abbreviations the expected radiative forcing in 2100 (in Wm-2).
Since even the longest adaptation processes need only 10-20 years to be performed, adaptation as societal response becomes rather difficult due to present inability of the models to perform scientifically correct near-time projections.
Fig. 11. Synthesis of near-term projections of global mean surface air temperature (GMST). Projections of annual mean GMST 1986–2050 (anomalies relative to 1986–2005) under all RCPs from CMIP5 models (grey and coloured lines, one ensemble member per model), with four observational estimates for the period 1986–2012 (black lines). (IPCC WGI, 2013: Fig. TS.14)
4.3 Mitigation
Finally, one should establish, that even if the not yet understood heat
uptake timely disrupts all near-term climate forecast, it does not mean that either human influence on climate should be questioned (see above related to Fig. 9), or that the long-term warming expectations should be strongly revised. Apparently, ocean heat uptake may not be endless, since the ocean heat reservoirs become saturated at a point.
As Fig. 12 demonstrates, this saturation may not be too far, since the vertical temperature gradient between the sea surface and 200 m below became stagnating or even decreasing after 1998. However, without correct modelling of the enhanced heat uptake, unfortunately one cannot state how many years or decades the paused warming may continue in the future!
Fig. 12. Globally averaged temperature difference between the ocean surface and 200 m depth (black line: annual values, lighter line: 5-year running mean). (IPCC WGI, 2013: Fig. 3.1)
REFERENCES
1. IPCC WGI, 2013: Climate Change 2013: The Physical Science Basis. Contribution of Working Group I to the Fifth Assessment Report of the Intergovernmental Panel on Climate Change [Stocker, T.F., D. Qin, G.-K. Plattner, M. Tignor, S.K. Allen, J. Boschung, A. Nauels, Y. Xia, V. Bex and P.M. Midgley (eds.)]. Cambridge University Press, Cambridge, United Kingdom and New York, NY, USA, 1535 pp.
23