on the cutting edge of strategic sourcing - boston...
TRANSCRIPT
Boston Logistics GroupBoston Logistics Group
Copyright © 2004 by Boston Logistics Group. All rights reserved. Reproduction prohibited without prior written permission of the author.
April 2004
On the Cutting Edge of Strategic Sourcing
How Industry Leaders Are Planning to Transform Supply Relationships over
the Next Four Years
© 2 0 0 3 B o s t o n L o g i s t i c s G r o u p 2 0 D o n i z e t t i S t r e e t • W e l l e s l e y , M A 0 2 4 8 2
P h o n e : ( 7 8 1 ) 2 8 3 - 5 7 8 8 F a x : ( 7 8 1 ) 7 7 2 - 1 6 7 0 E - m a i l : i n f o @ b o s t o n l o g i s t i c s . c o m
2
Boston Logistics Group helps companies develop, plan, and implement supply chain programs that result in market leadership and maximum shareholder value. We deliver sourcing savings, leading-edge supply chain strategies, and measurable operations improvement through consulting. Service areas include:
• Strategic sourcing and process design – competitive bidding, outsourcing, centralized purchasing, benchmarking, negotiation, and supplier management.
• Supply chain strategy – network design, strategy development, performance measurement, demand planning, and inventory management.
• Operations improvement – business process design, transportation and fleet management, routing, scheduling, cross-docking, and logistics systems selection.
David Jacoby, President of Boston Logistics Group, coordinated this research project. He has consulted worldwide on strategic sourcing, logistics, and transportation management for over 15 years. Previously he was with A.T. Kearney, where he was instrumental in developing several practice areas, including Strategic Sourcing, Logistics, and Transportation. Before joining A.T. Kearney, David analyzed mergers, acquisitions, and trade flows in the Maritime and International Trade Group at TBS and consulted for the World Bank in Tunisia. He has lived in France, Brazil, and China, and speaks French and Portuguese. David received an MBA from the Wharton School and a Masters in International Business from the Lauder Institute, and is Certified in Purchasing (CPM), Production and Inventory Management (CPIM), and Logistics (CTL). He is the Immediate Past President of the Council of Logistics Management’s (CLM) New England Roundtable, is the Executive Vice President on the Board of Boston APICS, and is a member of the Institute for Supply Management (ISM). He has written numerous articles on purchasing, transportation, and logistics. He can be reached at [email protected].
© 2 0 0 3 B o s t o n L o g i s t i c s G r o u p 2 0 D o n i z e t t i S t r e e t • W e l l e s l e y , M A 0 2 4 8 2
P h o n e : ( 7 8 1 ) 2 8 3 - 5 7 8 8 F a x : ( 7 8 1 ) 7 7 2 - 1 6 7 0 E - m a i l : i n f o @ b o s t o n l o g i s t i c s . c o m
3
TABLE OF CONTENTS 1 Abstract.......................................................................................................... 4
2 Study Approach............................................................................................. 5
3 Profile of Respondents ................................................................................. 8
4 Executive Highlights ................................................................................... 13 4.1 30% More............................................................................................... 13 4.2 Maximizing the Benefits of Scale ........................................................... 16 4.3 Integrating with Strategic Suppliers........................................................ 17 4.4 Leveraging Global Sources.................................................................... 18 4.5 Developing Skills for the Era of Mega-Sourcing..................................... 19
5 Scale-Based Tools....................................................................................... 21 5.1 Centralized Spend Management: Purchasing Councils at Work ............ 22 5.2 Rationalization: Continuing to Compress the Supply Base .................... 24 5.3 Group Purchasing Organizations: Finding Their Place .......................... 25
6 Integration-Based Tools ............................................................................. 28 6.1 E-Procurement: On Everyone’s Mind..................................................... 29 6.2 Long-Term Agreements: Supporting a More Intimate Supplier Base...... 32 6.3 Supply Chain Integration: In Pursuit of Logistics and Inventory Benefits 34 6.4 Purchasing Cards: More Trouble than They’re Worth? .......................... 36 6.5 Portals: Private vs. Public, Order Management vs. Web Buying............ 37
7 Competition-Based Tools ........................................................................... 39 7.1 Global Sourcing: A Way of Life............................................................... 39 7.2 Payment Terms: New Financial Tools on the Market.............................. 41 7.3 RFx: Not Your Father’s RFQ .................................................................. 42 7.4 Auctions: A Hard Sell.............................................................................. 42
8 Value-Based Tools....................................................................................... 44 8.1 Value-Engineering Services: Getting Control of the Services Spend ..... 45 8.2 Standardization: Making a Dent in Indirect Expenses ............................ 46 8.3 Spec Simplification: Rationalizing Complex Products ............................ 46
9 Company Size Differences ......................................................................... 48 9.1 Large Companies................................................................................... 48 9.2 Mid-Sized Companies ............................................................................ 50 9.3 Small Companies................................................................................... 53
10 Developing Skills for the Era of Mega-Sourcing................................... 56
11 Self-Assessment...................................................................................... 58
12 For Further Information........................................................................... 62
© 2 0 0 3 B o s t o n L o g i s t i c s G r o u p 2 0 D o n i z e t t i S t r e e t • W e l l e s l e y , M A 0 2 4 8 2
P h o n e : ( 7 8 1 ) 2 8 3 - 5 7 8 8 F a x : ( 7 8 1 ) 7 7 2 - 1 6 7 0 E - m a i l : i n f o @ b o s t o n l o g i s t i c s . c o m
4
1 ABSTRACT Throughout the 1980s and early 1990s, companies increasingly applied strategic sourcing techniques such as global sourcing, group buying, long-term contracting, and supplier process integration. Then the technology boom that peaked in 1999-2000 brought new ways to identify suppliers and negotiate with them, including portals, auctions, and exchanges. Now that that bubble has burst and the dust has settled, where have companies decided to focus their strategic sourcing efforts? Which tools and techniques will you be emphasizing moving forward? Boston Logistics Group launched an executive survey to find out. The study received over 100 responses, of which over 20% were from Global 1000 companies. Over 60% of the respondents hold Vice President Procurement or Director-level procurement positions, and more than half of these are corporate Officers. The average company has $4 billion in annual sales, and companies of all sizes were represented, from those with more than $20 billion to those under $50 million. Over 90% operate in the U.S. The study uncovered five important trends:
1. Senior executives will place 30% more emphasis on implementing strategic sourcing over the next four years, as supply chain partners pressure each other for total cost reductions, and as procurement continues to become more strategic and less tactical.
2. Companies will use scale to drive more production and distribution economies by centralizing strategic procurement, forming purchasing councils, and rationalizing the supplier base. In some cases this is to digest recent mergers and acquisitions; in others it is to leverage shrinking spend with fewer, partner, suppliers.
3. With fewer suppliers, there will be more emphasis on integrating processes and systems through e-procurement, long-term agreements, and supply chain programs. The use of e-procurement is directly linked to company size – large companies are implementing expensive purchased solutions, while others are deploying second-tier or home-grown applications.
4. Global sourcing is becoming a way of life due to the increased availability of skilled and inexpensive offshore labor, especially in China, and to technologies that facilitate those relationships. Those who will be relying heavily on global sourcing will also be emphasizing partnering and long-term agreements.
5. Companies need to hire and develop a new breed of procurement professional with a strategic perspective and top management potential to keep up with these trends.
© 2 0 0 3 B o s t o n L o g i s t i c s G r o u p 2 0 D o n i z e t t i S t r e e t • W e l l e s l e y , M A 0 2 4 8 2
P h o n e : ( 7 8 1 ) 2 8 3 - 5 7 8 8 F a x : ( 7 8 1 ) 7 7 2 - 1 6 7 0 E - m a i l : i n f o @ b o s t o n l o g i s t i c s . c o m
5
2 STUDY APPROACH Boston Logistics Group prepared a survey asking how much emphasis procurement executives have – over the last four years – and will – over the next four years – place on each of 13 strategic sourcing tools. A five-point scoring system was used to rank the importance or emphasis being placed on each tool. A score of 1 indicated no emphasis, whereas a score of 5 indicated dominant emphasis.1 We interviewed a third of the respondents. The interview candidates were selected to assure that a variety of segments were represented, for example Chief Purchasing Officers (CPOs), manufacturing companies, service buyers, retail companies, MRO buyers, and small companies. Each interview was designed to answer questions that arose during the initial data analysis phase.
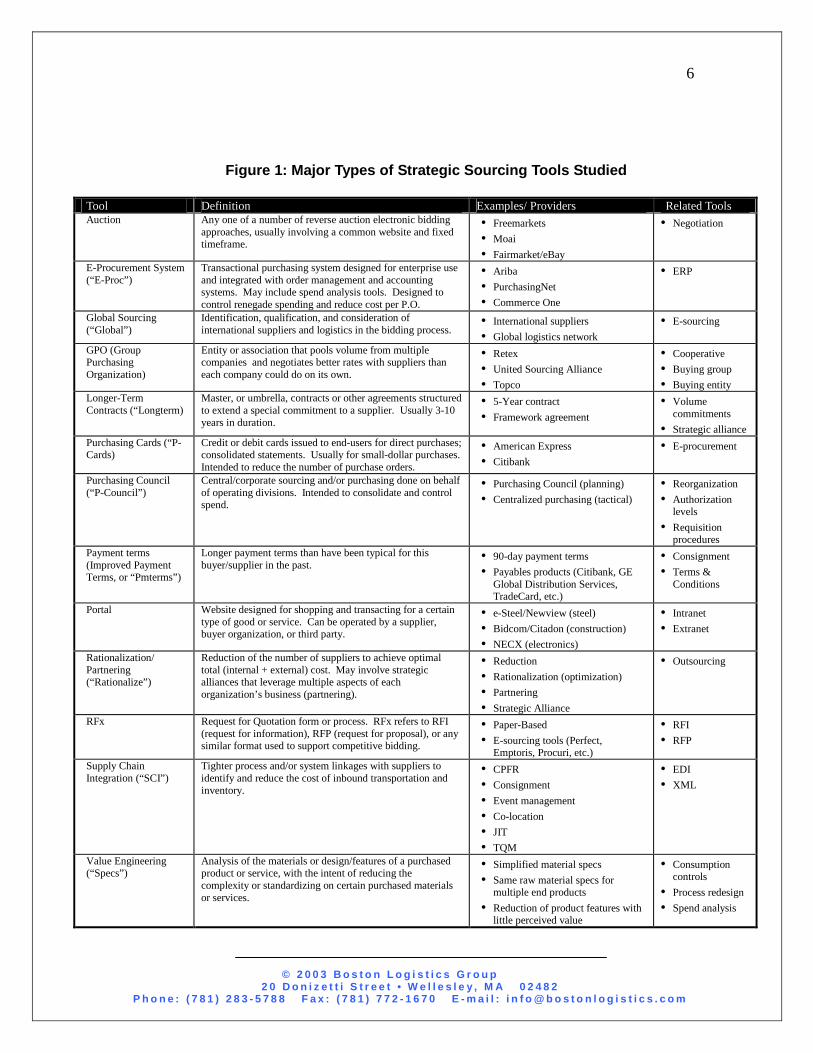
The 13 types of strategic sourcing tools that were used in the survey are described in Figure 1.
1 Although the degree of emphasis may not correspond exactly to the importance or the value of the tools, it indicates where resources will be allocated, and this is the main purpose of the study.
© 2 0 0 3 B o s t o n L o g i s t i c s G r o u p 2 0 D o n i z e t t i S t r e e t • W e l l e s l e y , M A 0 2 4 8 2
P h o n e : ( 7 8 1 ) 2 8 3 - 5 7 8 8 F a x : ( 7 8 1 ) 7 7 2 - 1 6 7 0 E - m a i l : i n f o @ b o s t o n l o g i s t i c s . c o m
6
Figure 1: Major Types of Strategic Sourcing Tools Studied
Tool Definition Examples/ Providers Related Tools Auction Any one of a number of reverse auction electronic bidding
approaches, usually involving a common website and fixed timeframe.
• Freemarkets • Moai • Fairmarket/eBay
• Negotiation
E-Procurement System (“E-Proc”)
Transactional purchasing system designed for enterprise use and integrated with order management and accounting systems. May include spend analysis tools. Designed to control renegade spending and reduce cost per P.O.
• Ariba • PurchasingNet • Commerce One
• ERP
Global Sourcing (“Global”)
Identification, qualification, and consideration of international suppliers and logistics in the bidding process.
• International suppliers • Global logistics network
• E-sourcing
GPO (Group Purchasing Organization)
Entity or association that pools volume from multiple companies and negotiates better rates with suppliers than each company could do on its own.
• Retex • United Sourcing Alliance • Topco
• Cooperative • Buying group • Buying entity
Longer-Term Contracts (“Longterm)
Master, or umbrella, contracts or other agreements structured to extend a special commitment to a supplier. Usually 3-10 years in duration.
• 5-Year contract • Framework agreement
• Volume commitments
• Strategic alliance Purchasing Cards (“P-Cards)
Credit or debit cards issued to end-users for direct purchases; consolidated statements. Usually for small-dollar purchases. Intended to reduce the number of purchase orders.
• American Express • Citibank
• E-procurement
Purchasing Council (“P-Council”)
Central/corporate sourcing and/or purchasing done on behalf of operating divisions. Intended to consolidate and control spend.
• Purchasing Council (planning) • Centralized purchasing (tactical)
• Reorganization • Authorization
levels • Requisition
procedures Payment terms (Improved Payment Terms, or “Pmterms”)
Longer payment terms than have been typical for this buyer/supplier in the past.
• 90-day payment terms • Payables products (Citibank, GE
Global Distribution Services, TradeCard, etc.)
• Consignment • Terms &
Conditions
Portal Website designed for shopping and transacting for a certain type of good or service. Can be operated by a supplier, buyer organization, or third party.
• e-Steel/Newview (steel) • Bidcom/Citadon (construction) • NECX (electronics)
• Intranet • Extranet
Rationalization/ Partnering (“Rationalize”)
Reduction of the number of suppliers to achieve optimal total (internal + external) cost. May involve strategic alliances that leverage multiple aspects of each organization’s business (partnering).
• Reduction • Rationalization (optimization) • Partnering • Strategic Alliance
• Outsourcing
RFx Request for Quotation form or process. RFx refers to RFI (request for information), RFP (request for proposal), or any similar format used to support competitive bidding.
• Paper-Based • E-sourcing tools (Perfect,
Emptoris, Procuri, etc.)
• RFI • RFP
Supply Chain Integration (“SCI”)
Tighter process and/or system linkages with suppliers to identify and reduce the cost of inbound transportation and inventory.
• CPFR • Consignment • Event management • Co-location • JIT • TQM
• EDI • XML
Value Engineering (“Specs”)
Analysis of the materials or design/features of a purchased product or service, with the intent of reducing the complexity or standardizing on certain purchased materials or services.
• Simplified material specs • Same raw material specs for
multiple end products • Reduction of product features with
little perceived value
• Consumption controls
• Process redesign • Spend analysis
© 2 0 0 3 B o s t o n L o g i s t i c s G r o u p 2 0 D o n i z e t t i S t r e e t • W e l l e s l e y , M A 0 2 4 8 2
P h o n e : ( 7 8 1 ) 2 8 3 - 5 7 8 8 F a x : ( 7 8 1 ) 7 7 2 - 1 6 7 0 E - m a i l : i n f o @ b o s t o n l o g i s t i c s . c o m
7
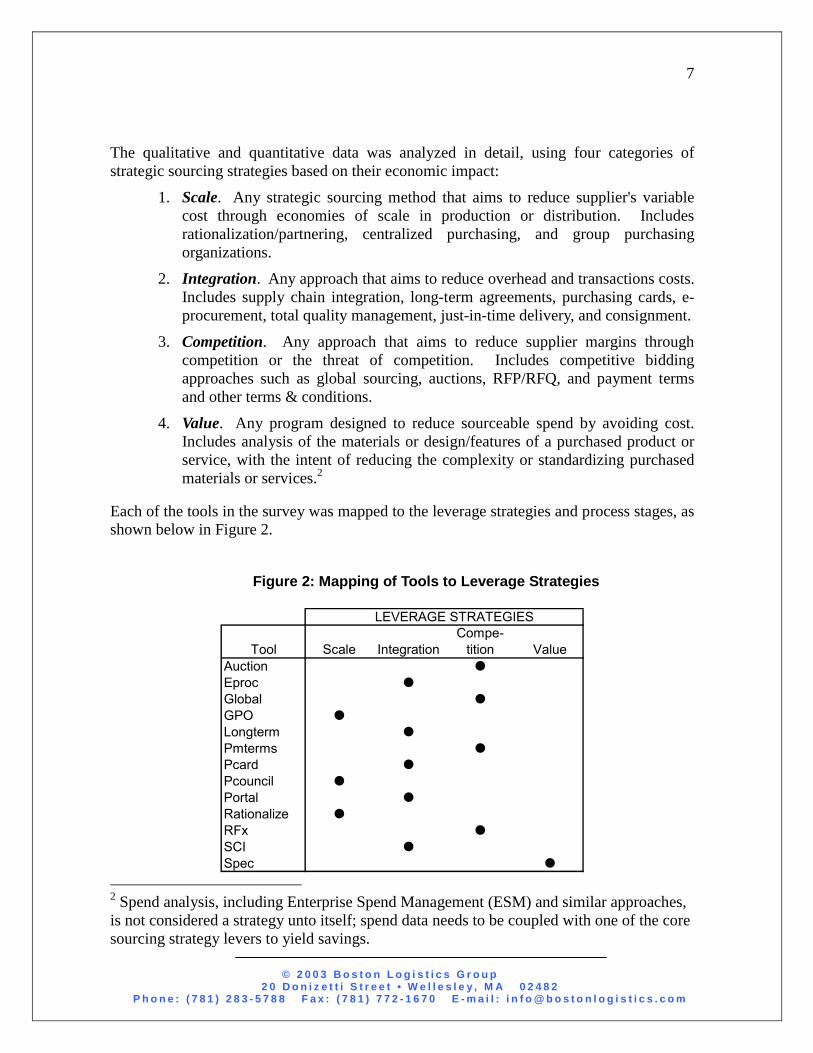
The qualitative and quantitative data was analyzed in detail, using four categories of strategic sourcing strategies based on their economic impact:
1. Scale. Any strategic sourcing method that aims to reduce supplier's variable cost through economies of scale in production or distribution. Includes rationalization/partnering, centralized purchasing, and group purchasing organizations.
2. Integration. Any approach that aims to reduce overhead and transactions costs. Includes supply chain integration, long-term agreements, purchasing cards, e-procurement, total quality management, just-in-time delivery, and consignment.
3. Competition. Any approach that aims to reduce supplier margins through competition or the threat of competition. Includes competitive bidding approaches such as global sourcing, auctions, RFP/RFQ, and payment terms and other terms & conditions.
4. Value. Any program designed to reduce sourceable spend by avoiding cost. Includes analysis of the materials or design/features of a purchased product or service, with the intent of reducing the complexity or standardizing purchased materials or services.2
Each of the tools in the survey was mapped to the leverage strategies and process stages, as shown below in Figure 2.
Figure 2: Mapping of Tools to Leverage Strategies
LEVERAGE STRATEGIES
Tool Scale IntegrationCompe-
tition ValueAuction �
Eproc �
Global �
GPO �
Longterm �
Pmterms �
Pcard �
Pcouncil �
Portal �
Rationalize �
RFx �
SCI �
Spec � 2 Spend analysis, including Enterprise Spend Management (ESM) and similar approaches, is not considered a strategy unto itself; spend data needs to be coupled with one of the core sourcing strategy levers to yield savings.
© 2 0 0 3 B o s t o n L o g i s t i c s G r o u p 2 0 D o n i z e t t i S t r e e t • W e l l e s l e y , M A 0 2 4 8 2
P h o n e : ( 7 8 1 ) 2 8 3 - 5 7 8 8 F a x : ( 7 8 1 ) 7 7 2 - 1 6 7 0 E - m a i l : i n f o @ b o s t o n l o g i s t i c s . c o m
8
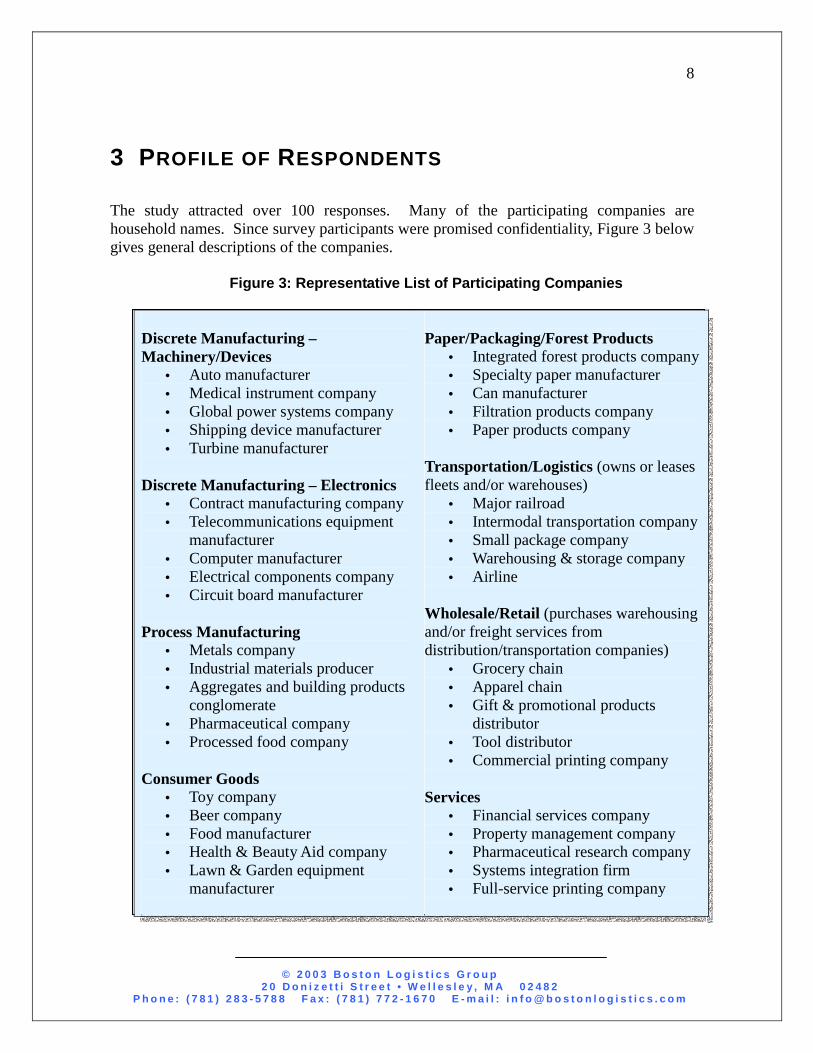
3 PROFILE OF RESPONDENTS The study attracted over 100 responses. Many of the participating companies are household names. Since survey participants were promised confidentiality, Figure 3 below gives general descriptions of the companies.
Figure 3: Representative List of Participating Companies
Discrete Manufacturing – Machinery/Devices
• Auto manufacturer • Medical instrument company • Global power systems company • Shipping device manufacturer • Turbine manufacturer
Discrete Manufacturing – Electronics
• Contract manufacturing company • Telecommunications equipment
manufacturer • Computer manufacturer • Electrical components company • Circuit board manufacturer
Process Manufacturing
• Metals company • Industrial materials producer • Aggregates and building products
conglomerate • Pharmaceutical company • Processed food company
Consumer Goods
• Toy company • Beer company • Food manufacturer • Health & Beauty Aid company • Lawn & Garden equipment
manufacturer
Paper/Packaging/Forest Products
• Integrated forest products company • Specialty paper manufacturer • Can manufacturer • Filtration products company • Paper products company
Transportation/Logistics (owns or leases fleets and/or warehouses)
• Major railroad • Intermodal transportation company • Small package company • Warehousing & storage company • Airline
Wholesale/Retail (purchases warehousing and/or freight services from distribution/transportation companies)
• Grocery chain • Apparel chain • Gift & promotional products
distributor • Tool distributor • Commercial printing company
Services
• Financial services company • Property management company • Pharmaceutical research company • Systems integration firm • Full-service printing company
© 2 0 0 3 B o s t o n L o g i s t i c s G r o u p 2 0 D o n i z e t t i S t r e e t • W e l l e s l e y , M A 0 2 4 8 2
P h o n e : ( 7 8 1 ) 2 8 3 - 5 7 8 8 F a x : ( 7 8 1 ) 7 7 2 - 1 6 7 0 E - m a i l : i n f o @ b o s t o n l o g i s t i c s . c o m
9
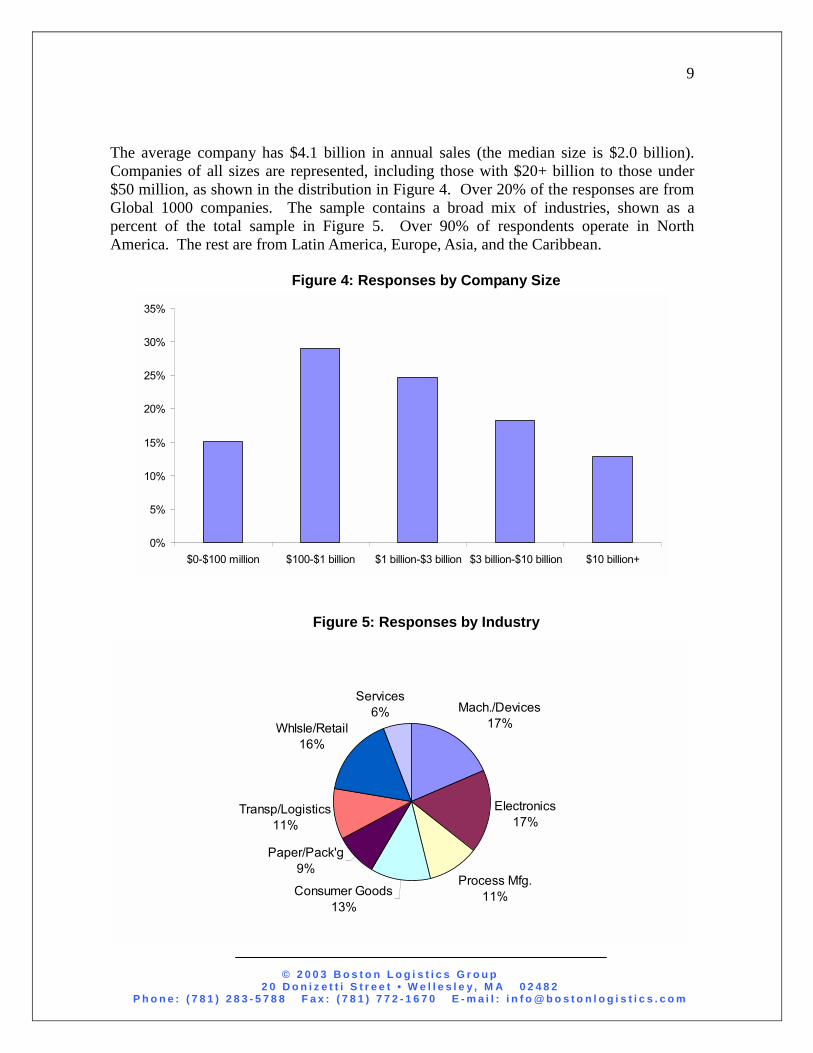
The average company has $4.1 billion in annual sales (the median size is $2.0 billion). Companies of all sizes are represented, including those with $20+ billion to those under $50 million, as shown in the distribution in Figure 4. Over 20% of the responses are from Global 1000 companies. The sample contains a broad mix of industries, shown as a percent of the total sample in Figure 5. Over 90% of respondents operate in North America. The rest are from Latin America, Europe, Asia, and the Caribbean.
Figure 4: Responses by Company Size
0%
5%
10%
15%
20%
25%
30%
35%
$0-$100 million $100-$1 billion $1 billion-$3 billion $3 billion-$10 billion $10 billion+
Figure 5: Responses by Industry
Mach./Devices17%
Electronics17%
Process Mfg.11%Consumer Goods
13%
Paper/Pack'g9%
Transp/Logistics11%
Whlsle/Retail16%
Services6%
© 2 0 0 3 B o s t o n L o g i s t i c s G r o u p 2 0 D o n i z e t t i S t r e e t • W e l l e s l e y , M A 0 2 4 8 2
P h o n e : ( 7 8 1 ) 2 8 3 - 5 7 8 8 F a x : ( 7 8 1 ) 7 7 2 - 1 6 7 0 E - m a i l : i n f o @ b o s t o n l o g i s t i c s . c o m
10
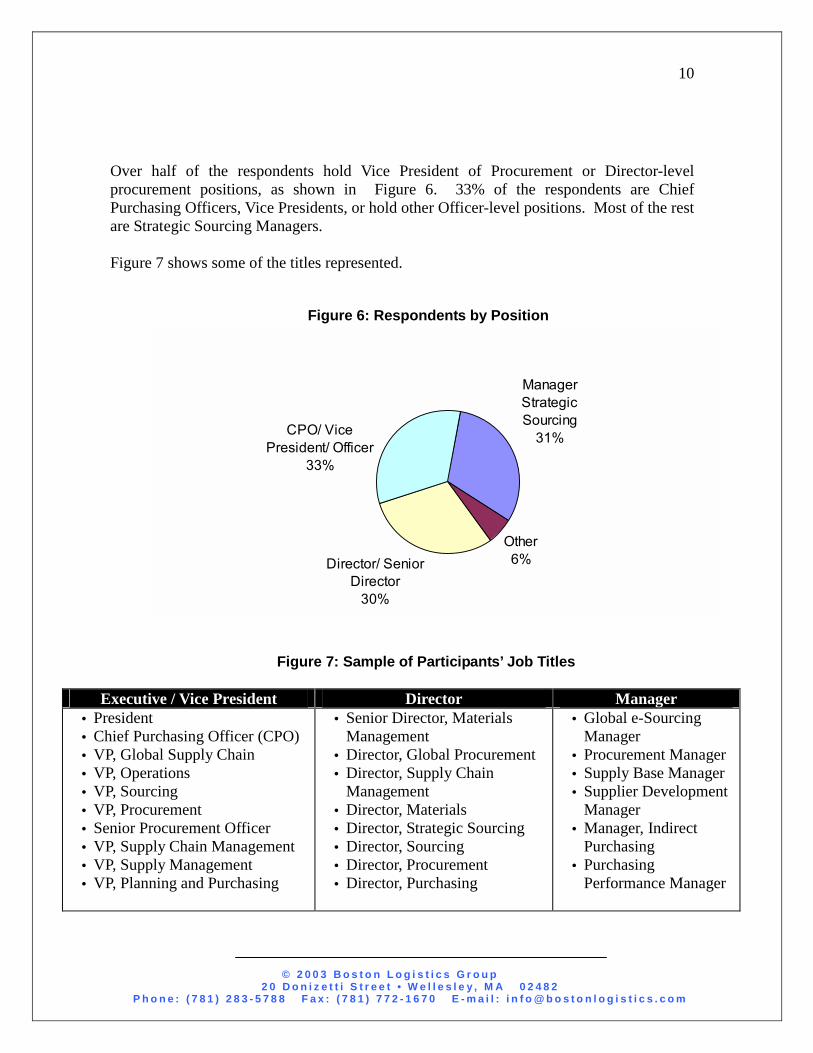
Over half of the respondents hold Vice President of Procurement or Director-level procurement positions, as shown in Figure 6. 33% of the respondents are Chief Purchasing Officers, Vice Presidents, or hold other Officer-level positions. Most of the rest are Strategic Sourcing Managers. Figure 7 shows some of the titles represented.
Figure 6: Respondents by Position
Figure 7: Sample of Participants’ Job Titles
Executive / Vice President Director Manager • President • Chief Purchasing Officer (CPO) • VP, Global Supply Chain • VP, Operations • VP, Sourcing • VP, Procurement • Senior Procurement Officer • VP, Supply Chain Management • VP, Supply Management • VP, Planning and Purchasing
• Senior Director, Materials Management
• Director, Global Procurement • Director, Supply Chain
Management • Director, Materials • Director, Strategic Sourcing • Director, Sourcing • Director, Procurement • Director, Purchasing
• Global e-Sourcing Manager
• Procurement Manager • Supply Base Manager • Supplier Development
Manager • Manager, Indirect
Purchasing • Purchasing
Performance Manager
86 Responses
Other6%Director/ Senior
Director 30%
CPO/ Vice President/ Officer
33%
Manager Strategic Sourcing
31%
© 2 0 0 3 B o s t o n L o g i s t i c s G r o u p 2 0 D o n i z e t t i S t r e e t • W e l l e s l e y , M A 0 2 4 8 2
P h o n e : ( 7 8 1 ) 2 8 3 - 5 7 8 8 F a x : ( 7 8 1 ) 7 7 2 - 1 6 7 0 E - m a i l : i n f o @ b o s t o n l o g i s t i c s . c o m
11
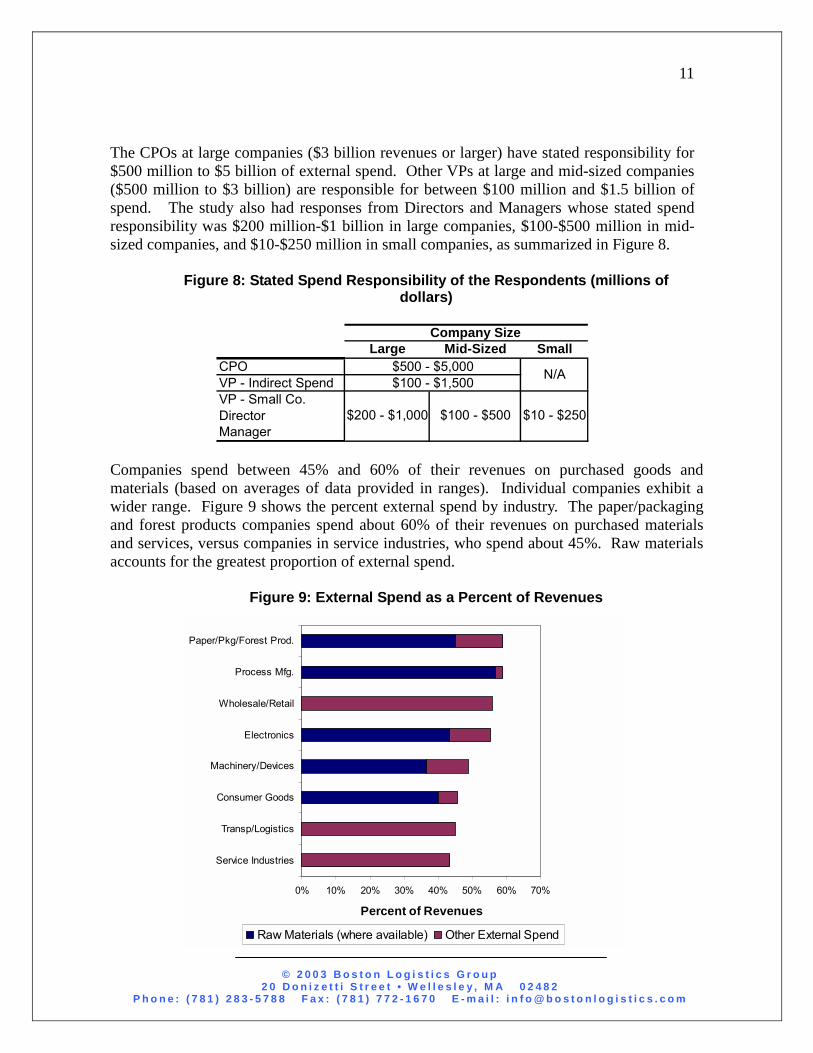
The CPOs at large companies ($3 billion revenues or larger) have stated responsibility for $500 million to $5 billion of external spend. Other VPs at large and mid-sized companies ($500 million to $3 billion) are responsible for between $100 million and $1.5 billion of spend. The study also had responses from Directors and Managers whose stated spend responsibility was $200 million-$1 billion in large companies, $100-$500 million in mid-sized companies, and $10-$250 million in small companies, as summarized in Figure 8.
Figure 8: Stated Spend Responsibility of the Respondents (millions of dollars)
Company Size
Large Mid-Sized SmallCPOVP - Indirect SpendVP - Small Co.DirectorManager
$10 - $250$100 - $500$200 - $1,000
N/A$500 - $5,000$100 - $1,500
Companies spend between 45% and 60% of their revenues on purchased goods and materials (based on averages of data provided in ranges). Individual companies exhibit a wider range. Figure 9 shows the percent external spend by industry. The paper/packaging and forest products companies spend about 60% of their revenues on purchased materials and services, versus companies in service industries, who spend about 45%. Raw materials accounts for the greatest proportion of external spend.
Figure 9: External Spend as a Percent of Revenues
0% 10% 20% 30% 40% 50% 60% 70%
Service Industries
Transp/Logistics
Consumer Goods
Machinery/Devices
Electronics
Wholesale/Retail
Process Mfg.
Paper/Pkg/Forest Prod.
Percent of Revenues
Raw Materials (where available) Other External Spend

© 2 0 0 3 B o s t o n L o g i s t i c s G r o u p 2 0 D o n i z e t t i S t r e e t • W e l l e s l e y , M A 0 2 4 8 2
P h o n e : ( 7 8 1 ) 2 8 3 - 5 7 8 8 F a x : ( 7 8 1 ) 7 7 2 - 1 6 7 0 E - m a i l : i n f o @ b o s t o n l o g i s t i c s . c o m
12
About a third of the respondents buy primarily raw materials, as shown in Figure 10. 22% buy primarily services, including contract manufacturing. Electronic components is the next most common sourced category.
• Raw materials purchases include steel, plastics, chemicals, wood, castings, gas, and anything else that is a direct input to their production process and is re-sold.
• Services include marketing and advertising services, building and grounds maintenance services, security services, temporary labor, transportation, information technology, event and meeting services, and professional services such as legal and consulting. Contract manufacturing is a subset of Services.
• Electronic components include active and passive components: integrated circuits, printed circuit board assemblies, isolators, electrical components, etc.
• MRO includes maintenance, repair and operating supplies and services. We also included indirect spend purchases such as building maintenance, in MRO. Several indirect spend purchases, such as advertising or consulting, were not considered part of MRO, however, but were captured in other segments such as “Services.” Hardware (hardware, fasteners, and industrial supplies) and Office Supplies are subsets of MRO.
• Paper/packaging consists mostly of paper, paperboard, and packaging materials.
Figure 10: Percent of Respondents by Principal Commodity Bought
0 10 20 30 40 50
Other
Hardware
Contract Mfg
Paper/Pkg
Office Supplies
Other MRO
Electronic Components
Services
Other Raw Materials
Percent
% of Respondents
% of Spend
© 2 0 0 3 B o s t o n L o g i s t i c s G r o u p 2 0 D o n i z e t t i S t r e e t • W e l l e s l e y , M A 0 2 4 8 2
P h o n e : ( 7 8 1 ) 2 8 3 - 5 7 8 8 F a x : ( 7 8 1 ) 7 7 2 - 1 6 7 0 E - m a i l : i n f o @ b o s t o n l o g i s t i c s . c o m
13
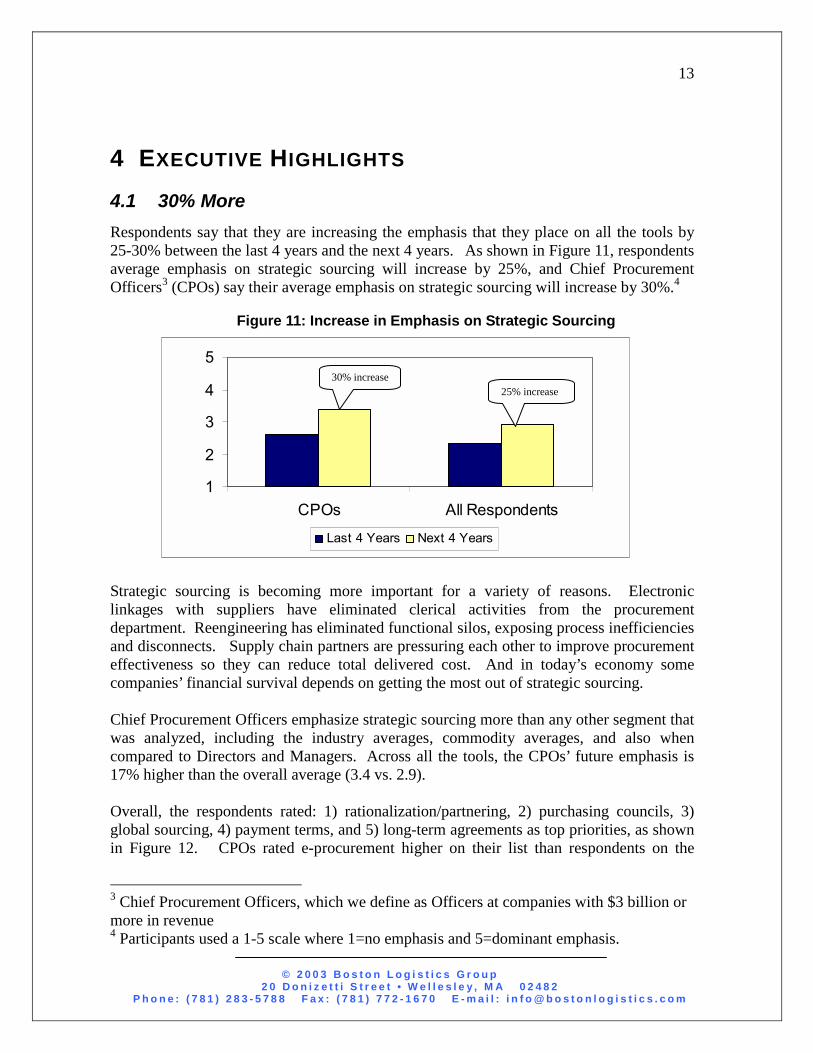
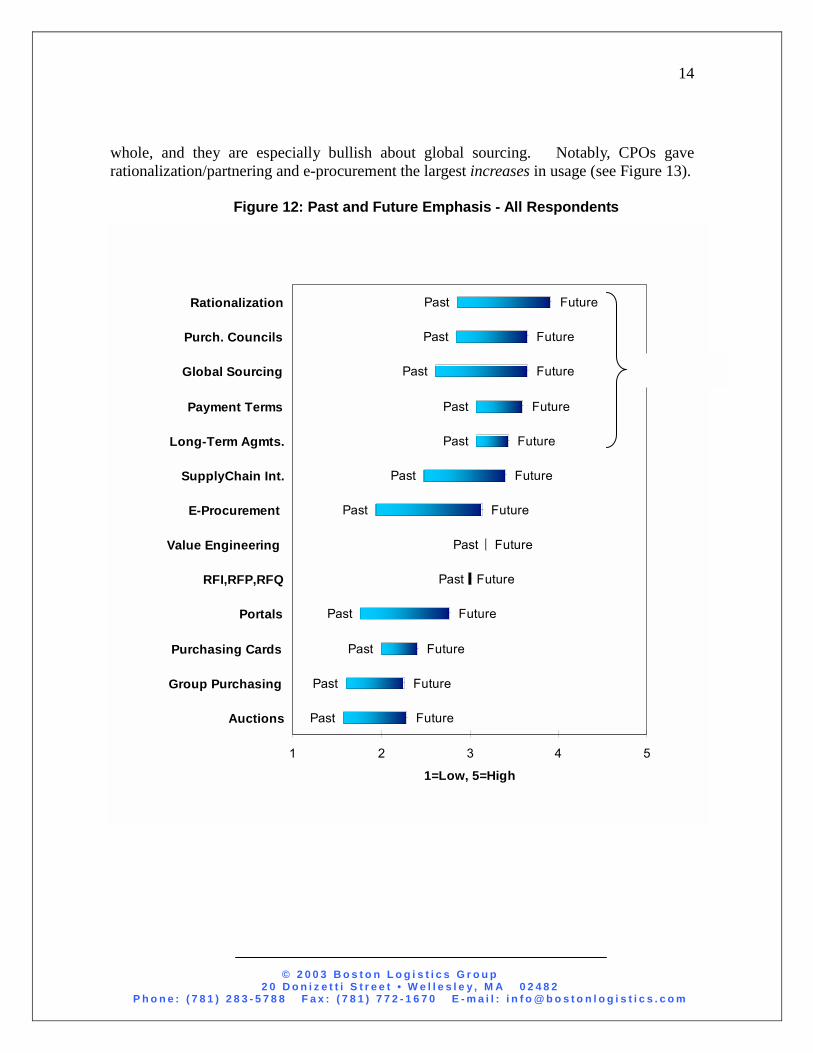
4 EXECUTIVE HIGHLIGHTS 4.1 30% More Respondents say that they are increasing the emphasis that they place on all the tools by 25-30% between the last 4 years and the next 4 years. As shown in Figure 11, respondents average emphasis on strategic sourcing will increase by 25%, and Chief Procurement Officers3 (CPOs) say their average emphasis on strategic sourcing will increase by 30%.4
Figure 11: Increase in Emphasis on Strategic Sourcing
Strategic sourcing is becoming more important for a variety of reasons. Electronic linkages with suppliers have eliminated clerical activities from the procurement department. Reengineering has eliminated functional silos, exposing process inefficiencies and disconnects. Supply chain partners are pressuring each other to improve procurement effectiveness so they can reduce total delivered cost. And in today’s economy some companies’ financial survival depends on getting the most out of strategic sourcing. Chief Procurement Officers emphasize strategic sourcing more than any other segment that was analyzed, including the industry averages, commodity averages, and also when compared to Directors and Managers. Across all the tools, the CPOs’ future emphasis is 17% higher than the overall average (3.4 vs. 2.9). Overall, the respondents rated: 1) rationalization/partnering, 2) purchasing councils, 3) global sourcing, 4) payment terms, and 5) long-term agreements as top priorities, as shown in Figure 12. CPOs rated e-procurement higher on their list than respondents on the
3 Chief Procurement Officers, which we define as Officers at companies with $3 billion or more in revenue 4 Participants used a 1-5 scale where 1=no emphasis and 5=dominant emphasis.
1
2
3
4
5
CPOs All Respondents
Last 4 Years Next 4 Years
30% increase25% increase
© 2 0 0 3 B o s t o n L o g i s t i c s G r o u p 2 0 D o n i z e t t i S t r e e t • W e l l e s l e y , M A 0 2 4 8 2
P h o n e : ( 7 8 1 ) 2 8 3 - 5 7 8 8 F a x : ( 7 8 1 ) 7 7 2 - 1 6 7 0 E - m a i l : i n f o @ b o s t o n l o g i s t i c s . c o m
14
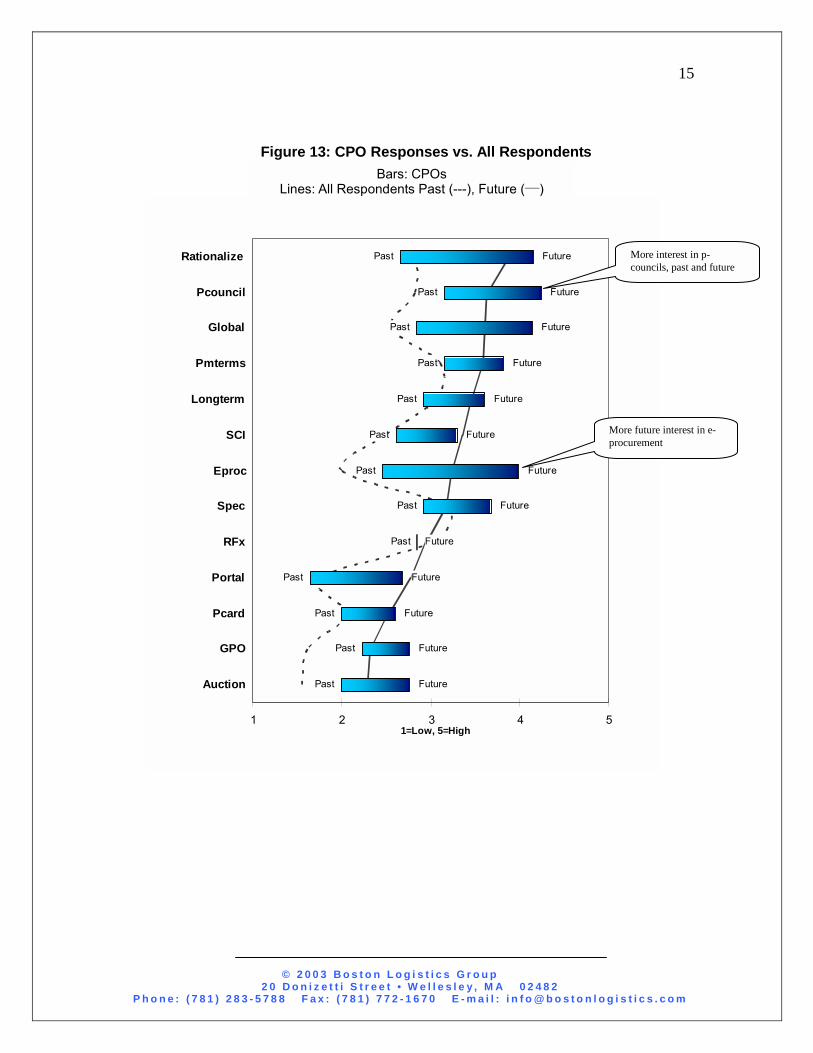
whole, and they are especially bullish about global sourcing. Notably, CPOs gave rationalization/partnering and e-procurement the largest increases in usage (see Figure 13).
Figure 12: Past and Future Emphasis - All Respondents
Past
Past
Past
Past
Past
Past
Past
Past
Past
Past
Past
Past
Past
Future
Future
Future
Future
Future
Future
Future
Future
Future
Future
Future
Future
Future
1 2 3 4 5
Auctions
Group Purchasing
Purchasing Cards
Portals
RFI,RFP,RFQ
Value Engineering
E-Procurement
SupplyChain Int.
Long-Term Agmts.
Payment Terms
Global Sourcing
Purch. Councils
Rationalization
1=Low, 5=High
© 2 0 0 3 B o s t o n L o g i s t i c s G r o u p 2 0 D o n i z e t t i S t r e e t • W e l l e s l e y , M A 0 2 4 8 2
P h o n e : ( 7 8 1 ) 2 8 3 - 5 7 8 8 F a x : ( 7 8 1 ) 7 7 2 - 1 6 7 0 E - m a i l : i n f o @ b o s t o n l o g i s t i c s . c o m
15
Figure 13: CPO Responses vs. All Respondents
Bars: CPOs Lines: All Respondents Past (---), Future (___)
Past
Past
Past
Past
Past
Past
Past
Past
Past
Past
Past
Past
Past
Future
Future
Future
Future
Future
Future
Future
Future
Future
Future
Future
Future
Future
1 2 3 4 5
Rationalize
Pcouncil
Global
Pmterms
Longterm
SCI
Eproc
Spec
RFx
Portal
Pcard
GPO
Auction
1=Low, 5=High
More interest in p-councils, past and future
More future interest in e-procurement
© 2 0 0 3 B o s t o n L o g i s t i c s G r o u p 2 0 D o n i z e t t i S t r e e t • W e l l e s l e y , M A 0 2 4 8 2
P h o n e : ( 7 8 1 ) 2 8 3 - 5 7 8 8 F a x : ( 7 8 1 ) 7 7 2 - 1 6 7 0 E - m a i l : i n f o @ b o s t o n l o g i s t i c s . c o m
16
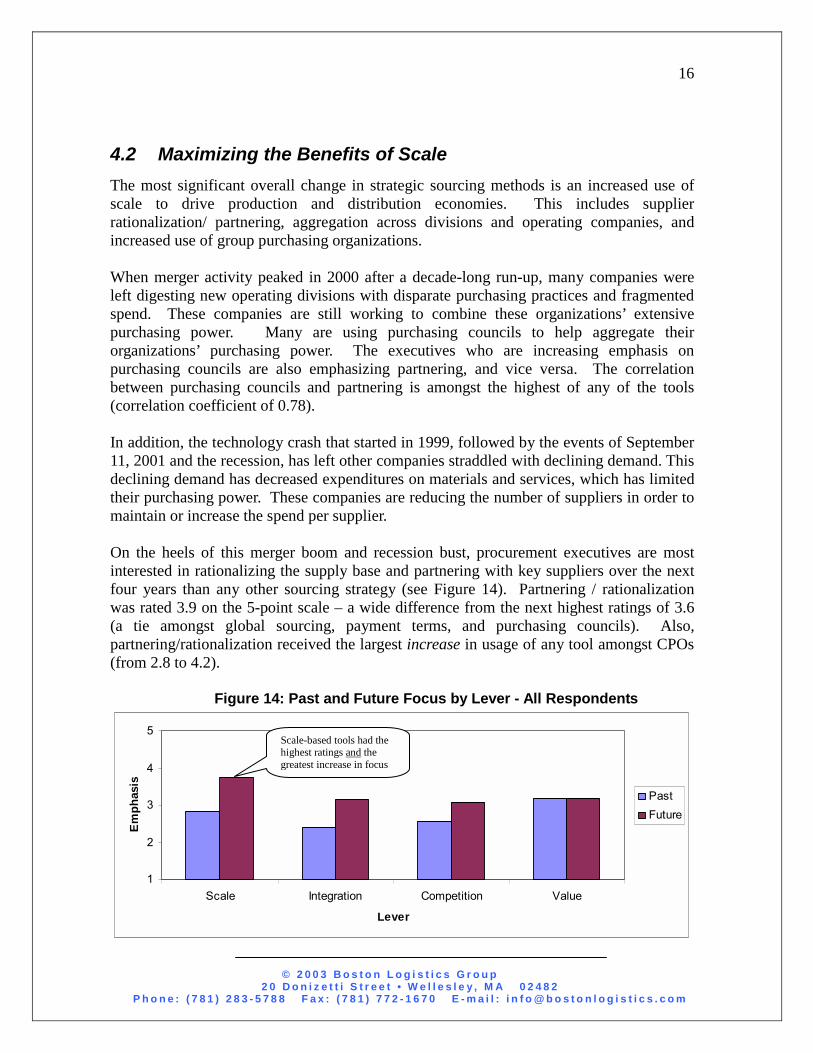
4.2 Maximizing the Benefits of Scale The most significant overall change in strategic sourcing methods is an increased use of scale to drive production and distribution economies. This includes supplier rationalization/ partnering, aggregation across divisions and operating companies, and increased use of group purchasing organizations. When merger activity peaked in 2000 after a decade-long run-up, many companies were left digesting new operating divisions with disparate purchasing practices and fragmented spend. These companies are still working to combine these organizations’ extensive purchasing power. Many are using purchasing councils to help aggregate their organizations’ purchasing power. The executives who are increasing emphasis on purchasing councils are also emphasizing partnering, and vice versa. The correlation between purchasing councils and partnering is amongst the highest of any of the tools (correlation coefficient of 0.78). In addition, the technology crash that started in 1999, followed by the events of September 11, 2001 and the recession, has left other companies straddled with declining demand. This declining demand has decreased expenditures on materials and services, which has limited their purchasing power. These companies are reducing the number of suppliers in order to maintain or increase the spend per supplier. On the heels of this merger boom and recession bust, procurement executives are most interested in rationalizing the supply base and partnering with key suppliers over the next four years than any other sourcing strategy (see Figure 14). Partnering / rationalization was rated 3.9 on the 5-point scale – a wide difference from the next highest ratings of 3.6 (a tie amongst global sourcing, payment terms, and purchasing councils). Also, partnering/rationalization received the largest increase in usage of any tool amongst CPOs (from 2.8 to 4.2).
Figure 14: Past and Future Focus by Lever - All Respondents
1
2
3
4
5
Scale Integration Competition Value
Lever
Em
phas
is
PastFuture
Scale-based tools had the highest ratings and the greatest increase in focus
© 2 0 0 3 B o s t o n L o g i s t i c s G r o u p 2 0 D o n i z e t t i S t r e e t • W e l l e s l e y , M A 0 2 4 8 2
P h o n e : ( 7 8 1 ) 2 8 3 - 5 7 8 8 F a x : ( 7 8 1 ) 7 7 2 - 1 6 7 0 E - m a i l : i n f o @ b o s t o n l o g i s t i c s . c o m
17
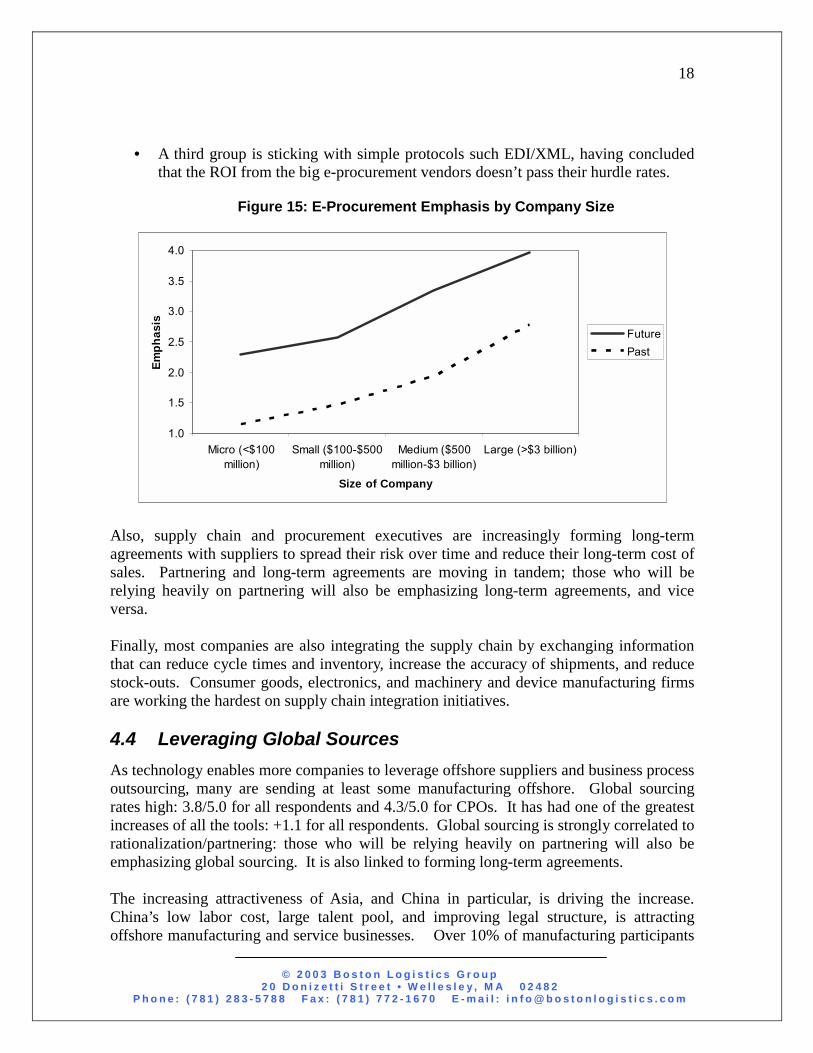
Most companies feel that partnering and rationalization are inseparable, and that both help to achieve scale and reduce the supplier’s long-term marketing and sales cost. However, there is a minority that favors shorter-term agreements. These respondents believe that competition and frequent re-bidding achieves greater cost reductions than collaboration/partnership with the suppliers. 4.3 Integrating with Strategic Suppliers Now, with fewer but larger supplier relationships, it is becoming more economical to focus on process and system integrations with these key suppliers. This contrasts with past practice, which was to place more emphasis on spend control and spend visibility because of the large number of suppliers. Companies are counting on technology to streamline processes and identify procurement savings. In fact, technology will be even more important than other strategic sourcing tools, according to the quantitative results. The three technology-related tools – auctions, portals, and e-procurement – increased by an average of 1.0, compared to an overall average increase of 0.6. E-Procurement is driving the increase.5 While used to about the same degree as other tools in the past, e-procurement will dominate the future. Our CPO group rated its importance at 3.9, compared to the average of 3.4. Our respondents rate e-procurement as extremely important. In fact, those who are increasing emphasis on partnering are also emphasizing e-procurement, and vice versa (correlation coefficient of 0.77). Small6 and micro-sized7 companies generally feel that they lack the capital investment and skills base that is required to implement e-procurement systems. The use of e-procurement is directly linked to company size – large companies are almost twice as likely to be implementing e-procurement systems in the future than small companies. However, even within the large companies, there are three different e-procurement stances:
• Some are implementing ambitious e-procurement systems such as Ariba, Rightworks, and PurchasingNet.
• Others are using or developing simpler, second-tier applications for the same purpose. These companies, many of which are mid-sized,8 are often analyzing the return on investment (ROI) from the investment in a system.
5 We defined e-procurement as a transactional purchasing system designed for enterprise use and integrated with order management and accounting systems. 6 Under $500 million of annual revenues 7 Under $100 million of annual revenues 8 Between $500 million and $3 billion of annual revenues
© 2 0 0 3 B o s t o n L o g i s t i c s G r o u p 2 0 D o n i z e t t i S t r e e t • W e l l e s l e y , M A 0 2 4 8 2
P h o n e : ( 7 8 1 ) 2 8 3 - 5 7 8 8 F a x : ( 7 8 1 ) 7 7 2 - 1 6 7 0 E - m a i l : i n f o @ b o s t o n l o g i s t i c s . c o m
18
• A third group is sticking with simple protocols such EDI/XML, having concluded that the ROI from the big e-procurement vendors doesn’t pass their hurdle rates.
Figure 15: E-Procurement Emphasis by Company Size
Also, supply chain and procurement executives are increasingly forming long-term agreements with suppliers to spread their risk over time and reduce their long-term cost of sales. Partnering and long-term agreements are moving in tandem; those who will be relying heavily on partnering will also be emphasizing long-term agreements, and vice versa. Finally, most companies are also integrating the supply chain by exchanging information that can reduce cycle times and inventory, increase the accuracy of shipments, and reduce stock-outs. Consumer goods, electronics, and machinery and device manufacturing firms are working the hardest on supply chain integration initiatives. 4.4 Leveraging Global Sources As technology enables more companies to leverage offshore suppliers and business process outsourcing, many are sending at least some manufacturing offshore. Global sourcing rates high: 3.8/5.0 for all respondents and 4.3/5.0 for CPOs. It has had one of the greatest increases of all the tools: +1.1 for all respondents. Global sourcing is strongly correlated to rationalization/partnering: those who will be relying heavily on partnering will also be emphasizing global sourcing. It is also linked to forming long-term agreements. The increasing attractiveness of Asia, and China in particular, is driving the increase. China’s low labor cost, large talent pool, and improving legal structure, is attracting offshore manufacturing and service businesses. Over 10% of manufacturing participants
1.0
1.5
2.0
2.5
3.0
3.5
4.0
Micro (<$100million)
Small ($100-$500million)
Medium ($500million-$3 billion)
Large (>$3 billion)
Size of Company
Emph
asis
FuturePast
© 2 0 0 3 B o s t o n L o g i s t i c s G r o u p 2 0 D o n i z e t t i S t r e e t • W e l l e s l e y , M A 0 2 4 8 2
P h o n e : ( 7 8 1 ) 2 8 3 - 5 7 8 8 F a x : ( 7 8 1 ) 7 7 2 - 1 6 7 0 E - m a i l : i n f o @ b o s t o n l o g i s t i c s . c o m
19
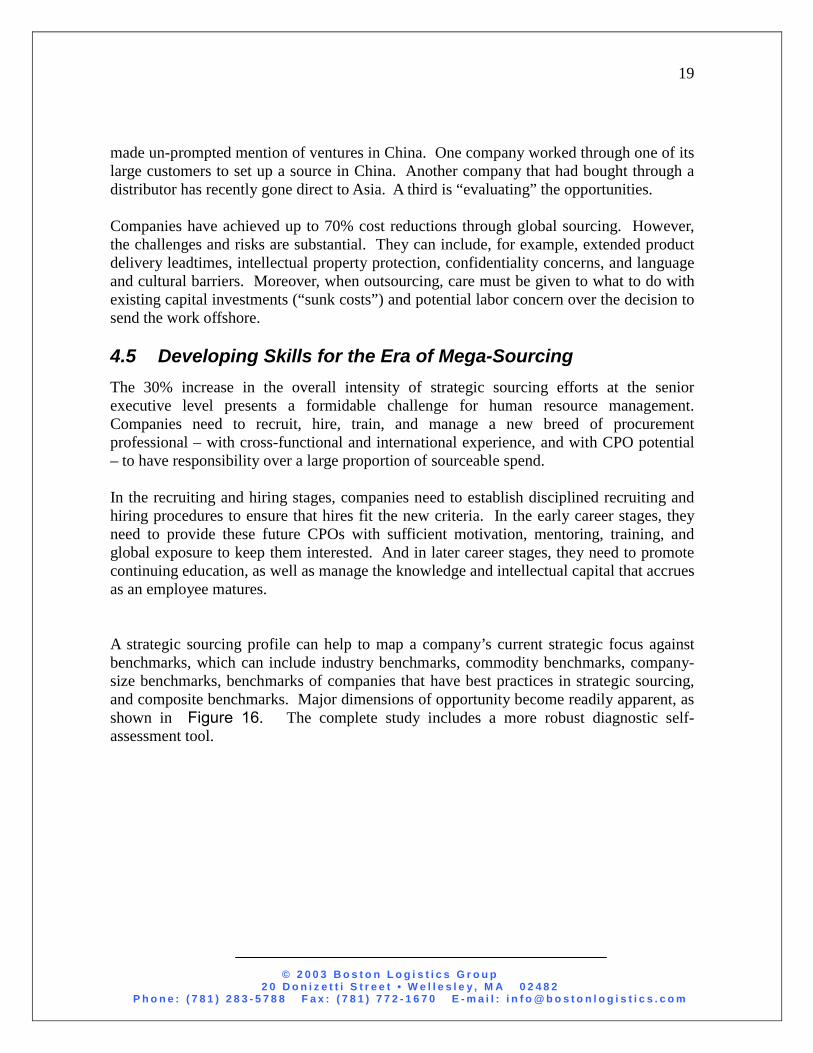
made un-prompted mention of ventures in China. One company worked through one of its large customers to set up a source in China. Another company that had bought through a distributor has recently gone direct to Asia. A third is “evaluating” the opportunities. Companies have achieved up to 70% cost reductions through global sourcing. However, the challenges and risks are substantial. They can include, for example, extended product delivery leadtimes, intellectual property protection, confidentiality concerns, and language and cultural barriers. Moreover, when outsourcing, care must be given to what to do with existing capital investments (“sunk costs”) and potential labor concern over the decision to send the work offshore. 4.5 Developing Skills for the Era of Mega-Sourcing The 30% increase in the overall intensity of strategic sourcing efforts at the senior executive level presents a formidable challenge for human resource management. Companies need to recruit, hire, train, and manage a new breed of procurement professional – with cross-functional and international experience, and with CPO potential – to have responsibility over a large proportion of sourceable spend. In the recruiting and hiring stages, companies need to establish disciplined recruiting and hiring procedures to ensure that hires fit the new criteria. In the early career stages, they need to provide these future CPOs with sufficient motivation, mentoring, training, and global exposure to keep them interested. And in later career stages, they need to promote continuing education, as well as manage the knowledge and intellectual capital that accrues as an employee matures. A strategic sourcing profile can help to map a company’s current strategic focus against benchmarks, which can include industry benchmarks, commodity benchmarks, company-size benchmarks, benchmarks of companies that have best practices in strategic sourcing, and composite benchmarks. Major dimensions of opportunity become readily apparent, as shown in Figure 16. The complete study includes a more robust diagnostic self-assessment tool.
© 2 0 0 3 B o s t o n L o g i s t i c s G r o u p 2 0 D o n i z e t t i S t r e e t • W e l l e s l e y , M A 0 2 4 8 2
P h o n e : ( 7 8 1 ) 2 8 3 - 5 7 8 8 F a x : ( 7 8 1 ) 7 7 2 - 1 6 7 0 E - m a i l : i n f o @ b o s t o n l o g i s t i c s . c o m
20
Figure 16: Strategic Sourcing Profile
012345
Value
Competition
Scale
Integration
You Benchmark
© 2 0 0 3 B o s t o n L o g i s t i c s G r o u p 2 0 D o n i z e t t i S t r e e t • W e l l e s l e y , M A 0 2 4 8 2
P h o n e : ( 7 8 1 ) 2 8 3 - 5 7 8 8 F a x : ( 7 8 1 ) 7 7 2 - 1 6 7 0 E - m a i l : i n f o @ b o s t o n l o g i s t i c s . c o m
21
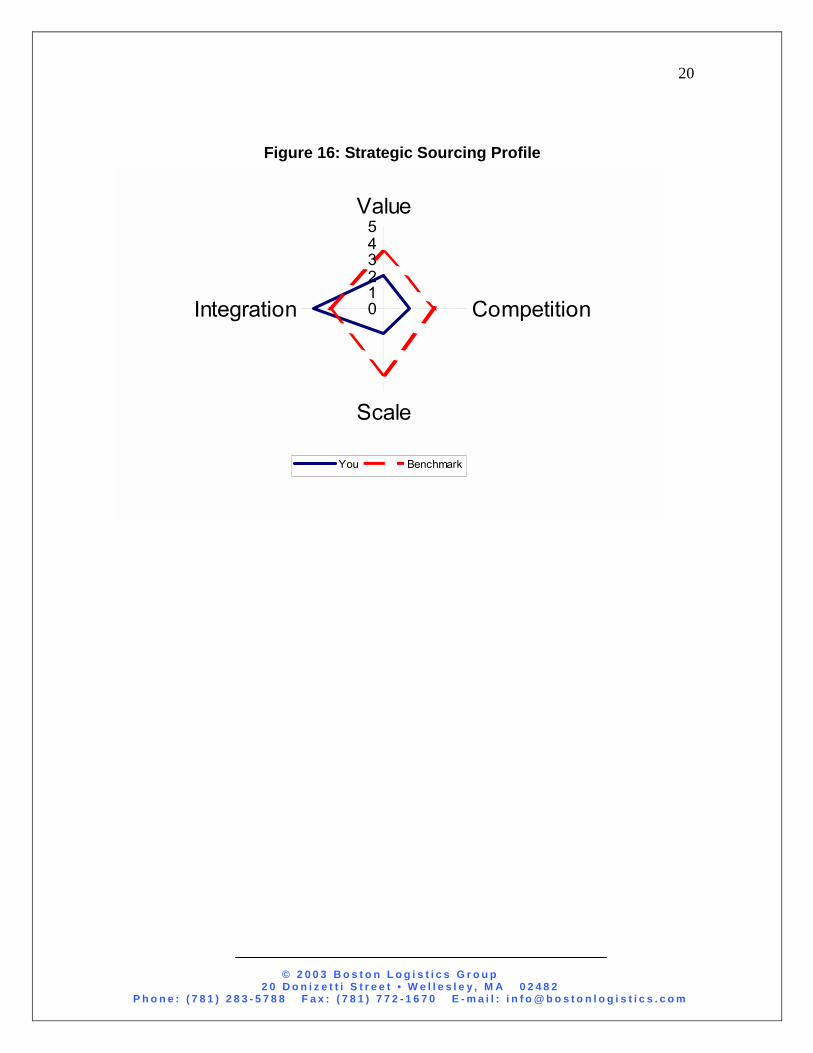
5 SCALE-BASED TOOLS The scale-based tools that were considered in the survey include: rationalization/partnering, purchasing councils, and group purchasing organizations. The two tools that respondents will be emphasizing most in the future are scale-based tools. Overall, the respondents rated rationalization/partnering and purchasing councils at the top of the list. Figure 17 shows the spread between past emphasis and future emphasis for these and other tools.
Figure 17: Past and Future Emphasis - All Respondents
Past
Past
Past
Past
Past
Past
Past
Past
Past
Past
Past
Future
Future
Future
Future
Future
Future
Future
Future
Future
Future
Future
Future
Future
1 2 3 4 5
Auction
GPO
Pcard
Portal
RFx
Spec
Eproc
SCI
Longterm
Pmterms
Global
Pcouncil
Rationalize
1=Low, 5=High
Top 2 tools focus on scale
© 2 0 0 3 B o s t o n L o g i s t i c s G r o u p 2 0 D o n i z e t t i S t r e e t • W e l l e s l e y , M A 0 2 4 8 2
P h o n e : ( 7 8 1 ) 2 8 3 - 5 7 8 8 F a x : ( 7 8 1 ) 7 7 2 - 1 6 7 0 E - m a i l : i n f o @ b o s t o n l o g i s t i c s . c o m
22
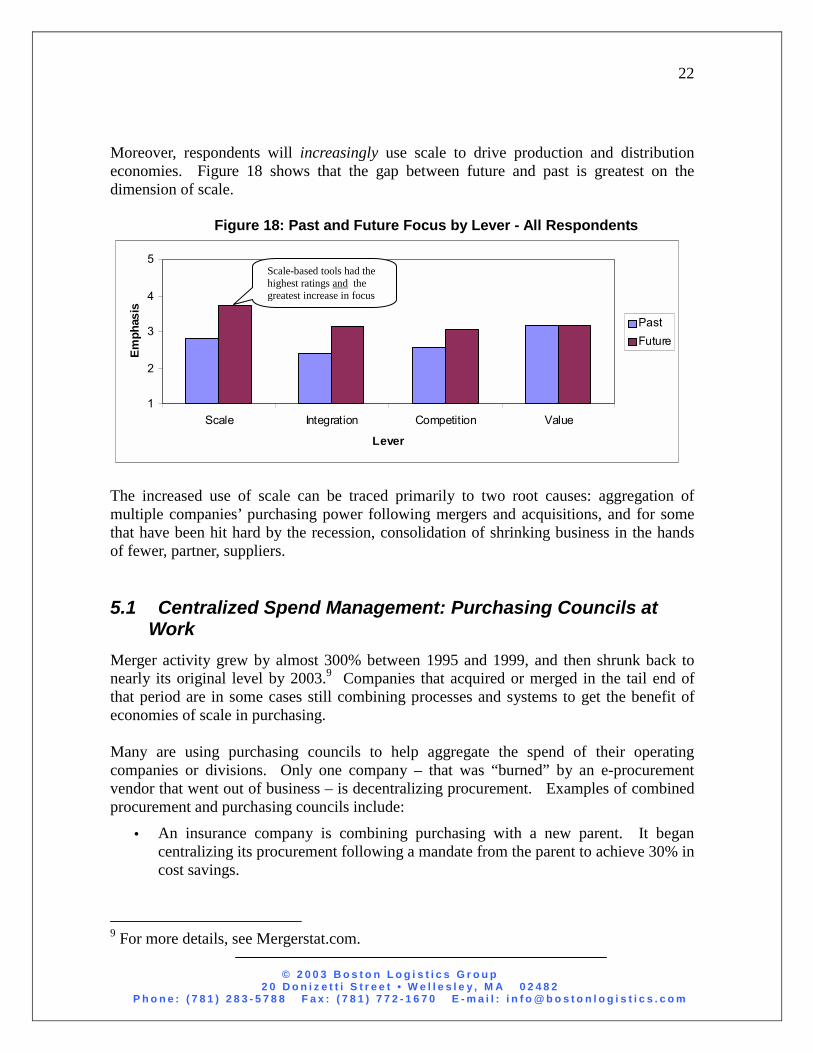
Moreover, respondents will increasingly use scale to drive production and distribution economies. Figure 18 shows that the gap between future and past is greatest on the dimension of scale.
Figure 18: Past and Future Focus by Lever - All Respondents
The increased use of scale can be traced primarily to two root causes: aggregation of multiple companies’ purchasing power following mergers and acquisitions, and for some that have been hit hard by the recession, consolidation of shrinking business in the hands of fewer, partner, suppliers. 5.1 Centralized Spend Management: Purchasing Councils at
Work Merger activity grew by almost 300% between 1995 and 1999, and then shrunk back to nearly its original level by 2003.9 Companies that acquired or merged in the tail end of that period are in some cases still combining processes and systems to get the benefit of economies of scale in purchasing. Many are using purchasing councils to help aggregate the spend of their operating companies or divisions. Only one company – that was “burned” by an e-procurement vendor that went out of business – is decentralizing procurement. Examples of combined procurement and purchasing councils include:
• An insurance company is combining purchasing with a new parent. It began centralizing its procurement following a mandate from the parent to achieve 30% in cost savings.
9 For more details, see Mergerstat.com.
1
2
3
4
5
Scale Integration Competition Value
Lever
Emph
asis
PastFuture
Scale-based tools had the highest ratings and the greatest increase in focus
© 2 0 0 3 B o s t o n L o g i s t i c s G r o u p 2 0 D o n i z e t t i S t r e e t • W e l l e s l e y , M A 0 2 4 8 2
P h o n e : ( 7 8 1 ) 2 8 3 - 5 7 8 8 F a x : ( 7 8 1 ) 7 7 2 - 1 6 7 0 E - m a i l : i n f o @ b o s t o n l o g i s t i c s . c o m
23
• A grocery chain is working with its new parent on consolidated procurement. For the last year, it has been centralizing indirect procurement.
• A utility is consolidating purchasing across its recently acquired operating companies. It has established a centralized strategic sourcing staff and aggressive targets that are pivotal to its multi-year overall cost reduction goals.
• A recently-formed financial services company is working with its parent organizations to leverage their purchasing power. As a first step, it is working on improving accessibility to the parent’s procurement information system.
Other companies are facing decreasing revenues, and expenses, due to the collapse of the technology bubble and the recession. These companies are centralizing strategic procurement in order to maintain leverage over their suppliers despite decreasing total spend. For example:
• A manufacturer of electrical products is centralizing strategic procurement, but leaving planning and order release to the plants, a pattern common to many of the respondents.
• A furniture manufacturer has “totally centralized” strategic and transactional purchasing.
• An electronics company is using commodity teams and preferred corporate supplier lists to winnow down the number of suppliers.
• A packaging company selected preferred suppliers after conducting a thorough sourcing program. It is now partnering with those suppliers to jointly pursue supply chain integration opportunities.
• A multimedia company has created a new position oriented around supply base consolidation.
• A packaging manufacturer is using a consulting and software solutions firm to catalog the MRO commodities it buys. The vendor creates the catalog, pre-qualifies the suppliers, and negotiates rates with them. The manufacturer orders through the vendor via the web.
Service companies have been, and will continue to, use purchasing councils more than the other companies. Purchasing councils are usually being used to get visibility of decentralized spend and initiate competitive bidding. Some companies, such as those in the financial services industry, have been through a variety of acquisitions in recent years, leaving large opportunities for savings through centralized purchasing. Having been through mergers, some of the services companies are now involved in a two to three year effort to consolidate purchasing spend, suppliers, processes, and information systems.
© 2 0 0 3 B o s t o n L o g i s t i c s G r o u p 2 0 D o n i z e t t i S t r e e t • W e l l e s l e y , M A 0 2 4 8 2
P h o n e : ( 7 8 1 ) 2 8 3 - 5 7 8 8 F a x : ( 7 8 1 ) 7 7 2 - 1 6 7 0 E - m a i l : i n f o @ b o s t o n l o g i s t i c s . c o m
24
The executives who are increasing emphasis on partnering are also emphasizing purchasing councils, and vice versa. The correlation between partnering and purchasing councils is amongst the highest of any of the tools (correlation coefficient of 0.78).
5.2 Rationalization: Continuing to Compress the Supply Base Companies that saw a sharp decline in revenues, and hence expenditures, in the last two years are consolidating their supplier base in order to maintain an equivalent spend per supplier as they had during the boom period. Over the next four years, procurement executives will rationalize the supply base and partner with key suppliers more than any other sourcing strategy. Rationalization / partnering was rated 3.9 on the 5-point scale – a wide difference from the next highest ratings of 3.6 (a tie amongst global sourcing, payment terms, and purchasing councils). Also, partnering/rationalization received the largest increase in usage of any tool (from 2.8 to 4.2, for CPOs). Most companies felt that partnering and rationalization were inseparable and worked toward the same end – reducing the supplier’s long-term marketing and sales cost, reducing inspections of inbound product, consolidating shipments of multiple products, etc. For example, buyers of industrial hardware of the classic MRO variety are partnering about 20% more than other segments. Here, the trend is toward single sourcing and integrated supply, both of which are leading toward a reduction of total cost. Based on this survey’s results, this trend looks like it will continue for the next four years.
© 2 0 0 3 B o s t o n L o g i s t i c s G r o u p 2 0 D o n i z e t t i S t r e e t • W e l l e s l e y , M A 0 2 4 8 2
P h o n e : ( 7 8 1 ) 2 8 3 - 5 7 8 8 F a x : ( 7 8 1 ) 7 7 2 - 1 6 7 0 E - m a i l : i n f o @ b o s t o n l o g i s t i c s . c o m
25
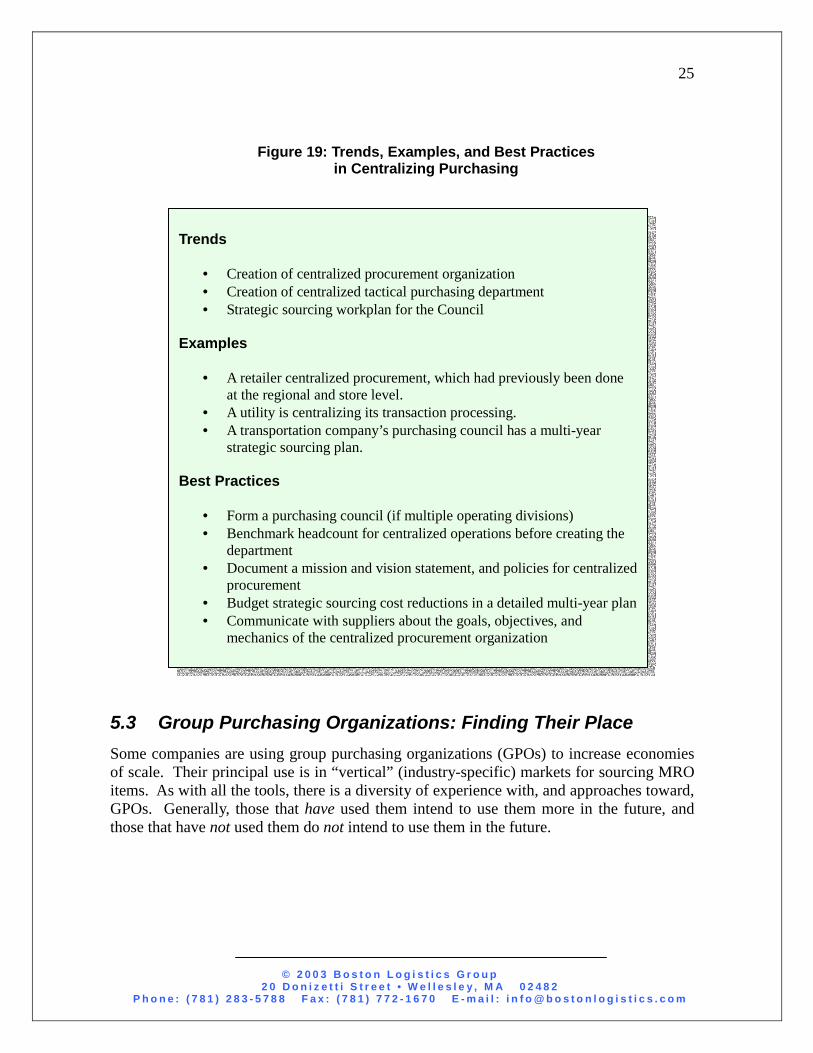
Figure 19: Trends, Examples, and Best Practices in Centralizing Purchasing
5.3 Group Purchasing Organizations: Finding Their Place Some companies are using group purchasing organizations (GPOs) to increase economies of scale. Their principal use is in “vertical” (industry-specific) markets for sourcing MRO items. As with all the tools, there is a diversity of experience with, and approaches toward, GPOs. Generally, those that have used them intend to use them more in the future, and those that have not used them do not intend to use them in the future.
Trends
• Creation of centralized procurement organization • Creation of centralized tactical purchasing department • Strategic sourcing workplan for the Council
Examples
• A retailer centralized procurement, which had previously been done at the regional and store level.
• A utility is centralizing its transaction processing. • A transportation company’s purchasing council has a multi-year
strategic sourcing plan.
Best Practices
• Form a purchasing council (if multiple operating divisions) • Benchmark headcount for centralized operations before creating the
department • Document a mission and vision statement, and policies for centralized
procurement • Budget strategic sourcing cost reductions in a detailed multi-year plan • Communicate with suppliers about the goals, objectives, and
mechanics of the centralized procurement organization
© 2 0 0 3 B o s t o n L o g i s t i c s G r o u p 2 0 D o n i z e t t i S t r e e t • W e l l e s l e y , M A 0 2 4 8 2
P h o n e : ( 7 8 1 ) 2 8 3 - 5 7 8 8 F a x : ( 7 8 1 ) 7 7 2 - 1 6 7 0 E - m a i l : i n f o @ b o s t o n l o g i s t i c s . c o m
26
Transportation and logistics companies have made more progress in using group purchasing organizations than other segments, and their use of GPOs is increasing faster than at other companies. The greatest application of group buying appears to be in consumables (MRO, maintenance supplies, etc.). “Vertical” (industry-specific) purchasing consortia are operating in a number of modes. Also, some carriers belong to horizontal consortia for indirect spend items.
Consumer goods companies are going to use group purchasing organizations (GPOs) 24% more than other companies over the next four years. This is a marked change from the past four years, where they were 7% less likely to use GPOs than other companies. The change is the most accentuated of any of the tools except value analysis. One company has used a demand aggregator for racks, shelves, displays, refrigeration equipment, and the like. GPOs success in this industry is partly due to the economics of promotions, and also to their ability to pre-qualify from a wide number of suppliers and in this sense behave like an agent or distributor.
Wholesalers are also using GPOs about 20-30% more than before, and they intend to use them more than the average of companies in the study.
Raw materials buyers placed slightly more emphasis (13%, or 0.9 more) on GPOs than respondents as a whole. They also rated Purchasing Councils 11% higher than the average. The ability to “skip” a level in the supply chain – for example, buying directly from the mill instead of from a converter intermediary – can sometimes reduce unit cost. GPOs and purchasing councils (for multi-divisional companies) can help amass the volume needed to back up in the supply chain.
Machinery and device manufacturers intend to use GPOs more in the future than in the past – and they are increasing their usage of GPOs at a faster rate than the other tools. Since the dot-com boom, many customers and third parties have attempted to “dis-intermediate,” or go around, distributors. While they have not totally succeeded in doing that, some are seeing if GPOs are a reasonable alternative sourcing strategy.
© 2 0 0 3 B o s t o n L o g i s t i c s G r o u p 2 0 D o n i z e t t i S t r e e t • W e l l e s l e y , M A 0 2 4 8 2
P h o n e : ( 7 8 1 ) 2 8 3 - 5 7 8 8 F a x : ( 7 8 1 ) 7 7 2 - 1 6 7 0 E - m a i l : i n f o @ b o s t o n l o g i s t i c s . c o m
27
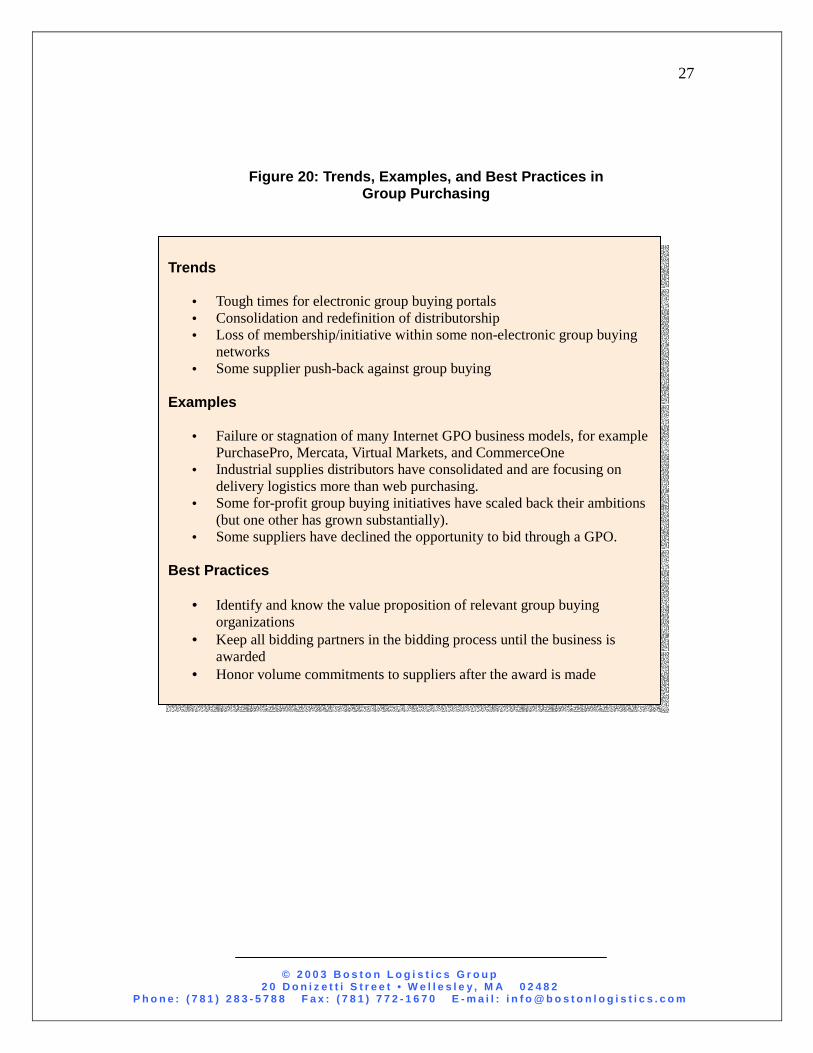
Figure 20: Trends, Examples, and Best Practices in
Group Purchasing
Trends
• Tough times for electronic group buying portals • Consolidation and redefinition of distributorship • Loss of membership/initiative within some non-electronic group buying
networks • Some supplier push-back against group buying
Examples
• Failure or stagnation of many Internet GPO business models, for example PurchasePro, Mercata, Virtual Markets, and CommerceOne
• Industrial supplies distributors have consolidated and are focusing on delivery logistics more than web purchasing.
• Some for-profit group buying initiatives have scaled back their ambitions (but one other has grown substantially).
• Some suppliers have declined the opportunity to bid through a GPO.
Best Practices
• Identify and know the value proposition of relevant group buying organizations
• Keep all bidding partners in the bidding process until the business is awarded
• Honor volume commitments to suppliers after the award is made
© 2 0 0 3 B o s t o n L o g i s t i c s G r o u p 2 0 D o n i z e t t i S t r e e t • W e l l e s l e y , M A 0 2 4 8 2
P h o n e : ( 7 8 1 ) 2 8 3 - 5 7 8 8 F a x : ( 7 8 1 ) 7 7 2 - 1 6 7 0 E - m a i l : i n f o @ b o s t o n l o g i s t i c s . c o m
28
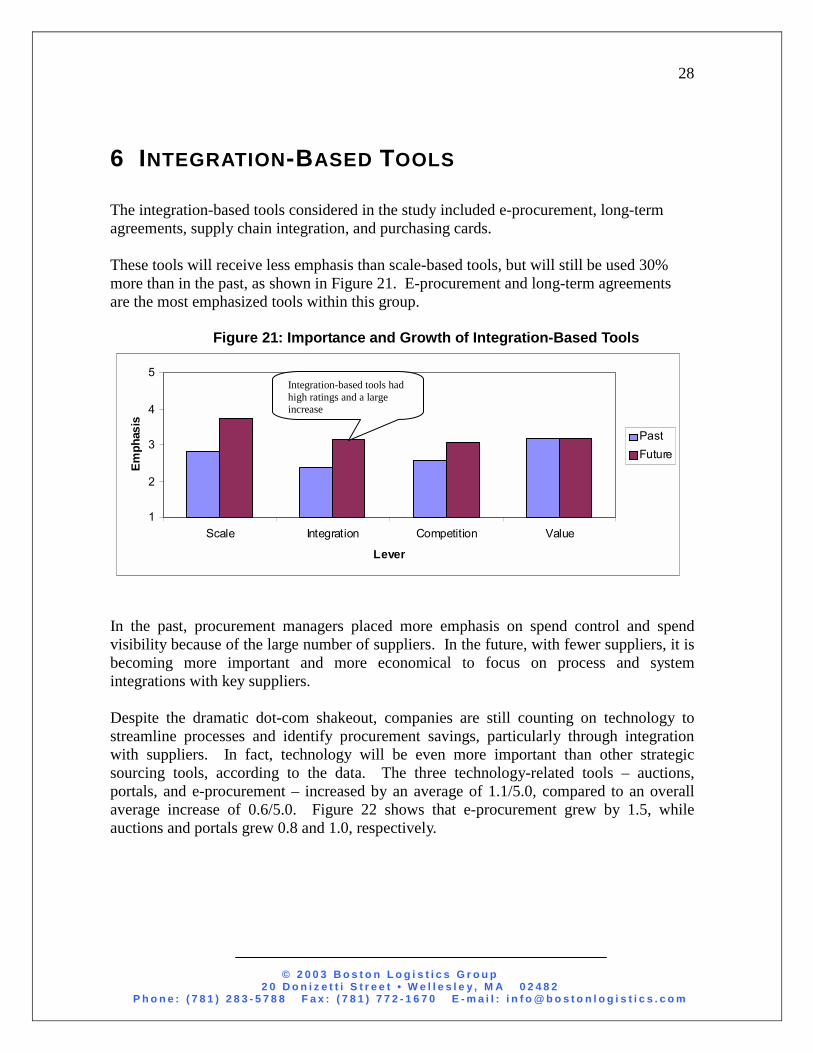
6 INTEGRATION-BASED TOOLS The integration-based tools considered in the study included e-procurement, long-term agreements, supply chain integration, and purchasing cards. These tools will receive less emphasis than scale-based tools, but will still be used 30% more than in the past, as shown in Figure 21. E-procurement and long-term agreements are the most emphasized tools within this group.
Figure 21: Importance and Growth of Integration-Based Tools
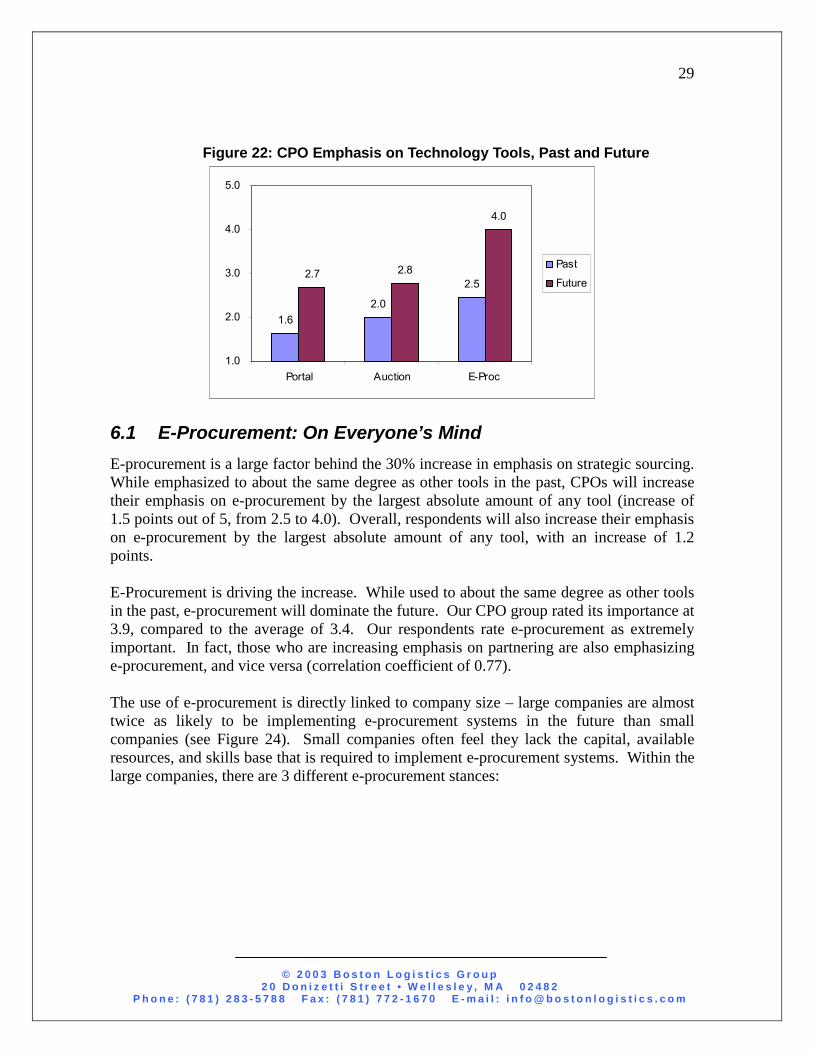
In the past, procurement managers placed more emphasis on spend control and spend visibility because of the large number of suppliers. In the future, with fewer suppliers, it is becoming more important and more economical to focus on process and system integrations with key suppliers. Despite the dramatic dot-com shakeout, companies are still counting on technology to streamline processes and identify procurement savings, particularly through integration with suppliers. In fact, technology will be even more important than other strategic sourcing tools, according to the data. The three technology-related tools – auctions, portals, and e-procurement – increased by an average of 1.1/5.0, compared to an overall average increase of 0.6/5.0. Figure 22 shows that e-procurement grew by 1.5, while auctions and portals grew 0.8 and 1.0, respectively.
1
2
3
4
5
Scale Integration Competition Value
Lever
Emph
asis
PastFuture
Integration-based tools had high ratings and a large increase
© 2 0 0 3 B o s t o n L o g i s t i c s G r o u p 2 0 D o n i z e t t i S t r e e t • W e l l e s l e y , M A 0 2 4 8 2
P h o n e : ( 7 8 1 ) 2 8 3 - 5 7 8 8 F a x : ( 7 8 1 ) 7 7 2 - 1 6 7 0 E - m a i l : i n f o @ b o s t o n l o g i s t i c s . c o m
29
Figure 22: CPO Emphasis on Technology Tools, Past and Future
1.62.0
2.52.7 2.8
4.0
1.0
2.0
3.0
4.0
5.0
Portal Auction E-Proc
Past
Future
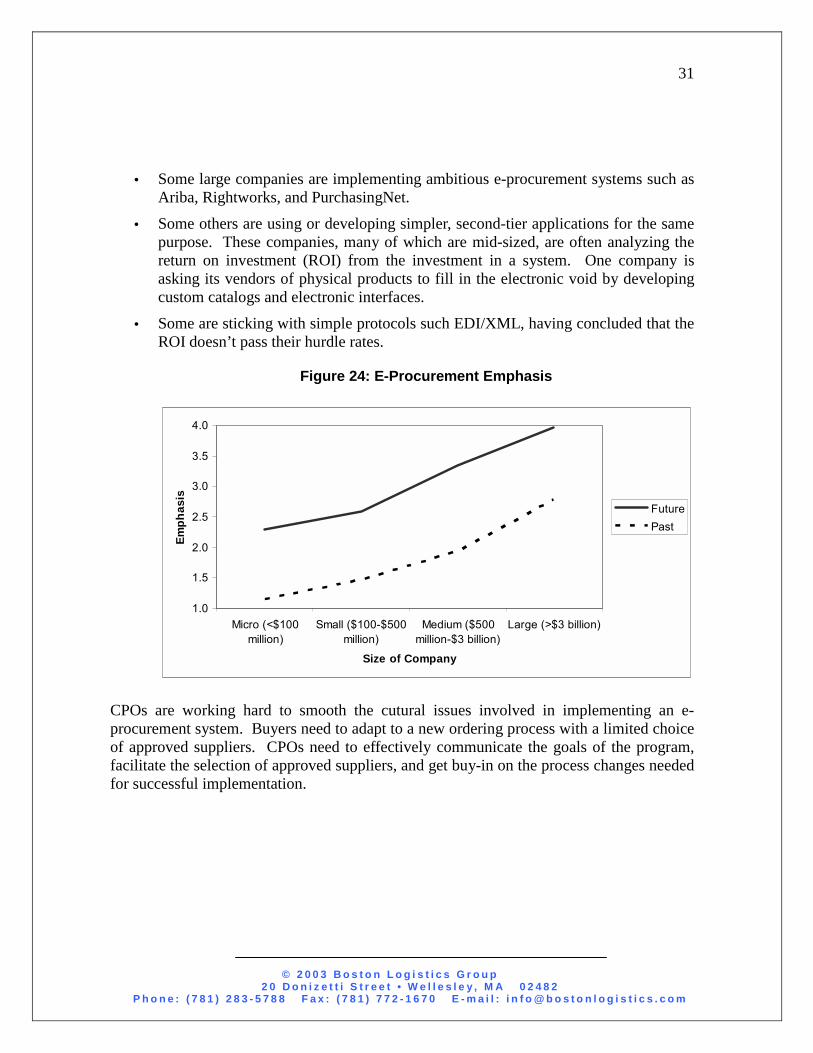
6.1 E-Procurement: On Everyone’s Mind E-procurement is a large factor behind the 30% increase in emphasis on strategic sourcing. While emphasized to about the same degree as other tools in the past, CPOs will increase their emphasis on e-procurement by the largest absolute amount of any tool (increase of 1.5 points out of 5, from 2.5 to 4.0). Overall, respondents will also increase their emphasis on e-procurement by the largest absolute amount of any tool, with an increase of 1.2 points. E-Procurement is driving the increase. While used to about the same degree as other tools in the past, e-procurement will dominate the future. Our CPO group rated its importance at 3.9, compared to the average of 3.4. Our respondents rate e-procurement as extremely important. In fact, those who are increasing emphasis on partnering are also emphasizing e-procurement, and vice versa (correlation coefficient of 0.77). The use of e-procurement is directly linked to company size – large companies are almost twice as likely to be implementing e-procurement systems in the future than small companies (see Figure 24). Small companies often feel they lack the capital, available resources, and skills base that is required to implement e-procurement systems. Within the large companies, there are 3 different e-procurement stances:
© 2 0 0 3 B o s t o n L o g i s t i c s G r o u p 2 0 D o n i z e t t i S t r e e t • W e l l e s l e y , M A 0 2 4 8 2
P h o n e : ( 7 8 1 ) 2 8 3 - 5 7 8 8 F a x : ( 7 8 1 ) 7 7 2 - 1 6 7 0 E - m a i l : i n f o @ b o s t o n l o g i s t i c s . c o m
30
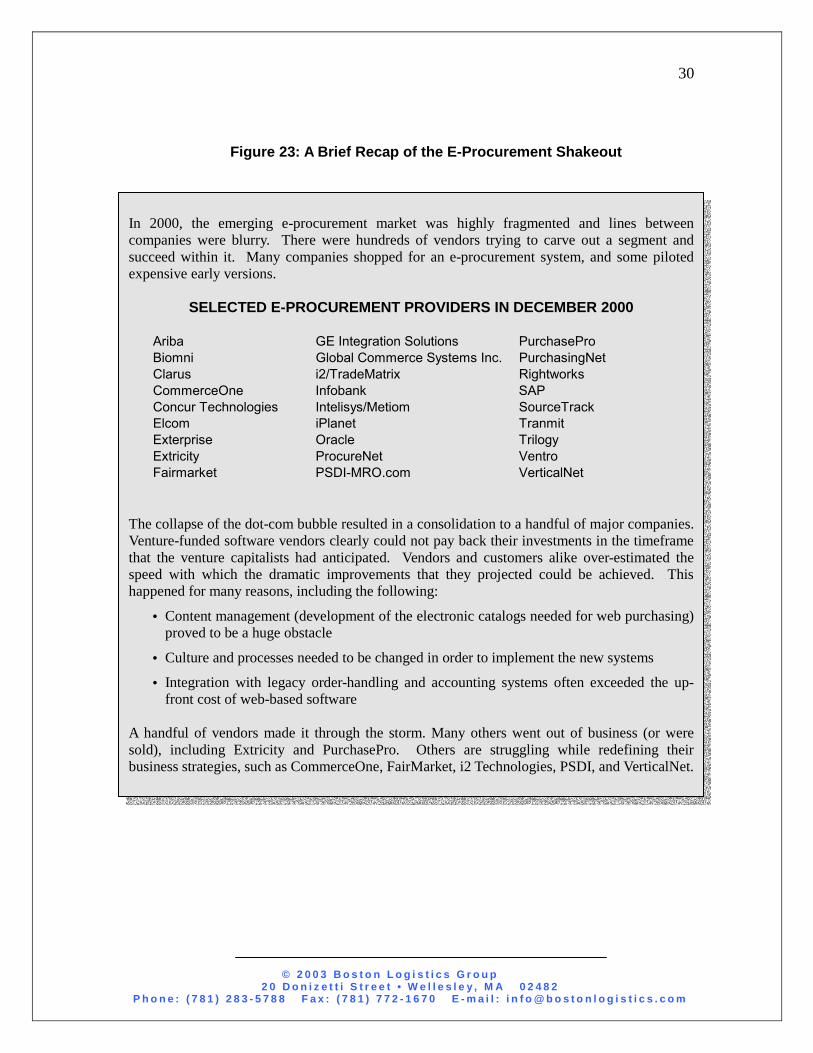
Figure 23: A Brief Recap of the E-Procurement Shakeout
In 2000, the emerging e-procurement market was highly fragmented and lines between companies were blurry. There were hundreds of vendors trying to carve out a segment and succeed within it. Many companies shopped for an e-procurement system, and some piloted expensive early versions.
SELECTED E-PROCUREMENT PROVIDERS IN DECEMBER 2000
Ariba GE Integration Solutions PurchasePro Biomni Global Commerce Systems Inc. PurchasingNet Clarus i2/TradeMatrix Rightworks CommerceOne Infobank SAP Concur Technologies Intelisys/Metiom SourceTrack Elcom iPlanet Tranmit Exterprise Oracle Trilogy Extricity ProcureNet Ventro Fairmarket PSDI-MRO.com VerticalNet
The collapse of the dot-com bubble resulted in a consolidation to a handful of major companies. Venture-funded software vendors clearly could not pay back their investments in the timeframe that the venture capitalists had anticipated. Vendors and customers alike over-estimated the speed with which the dramatic improvements that they projected could be achieved. This happened for many reasons, including the following:
• Content management (development of the electronic catalogs needed for web purchasing) proved to be a huge obstacle
• Culture and processes needed to be changed in order to implement the new systems
• Integration with legacy order-handling and accounting systems often exceeded the up-front cost of web-based software
A handful of vendors made it through the storm. Many others went out of business (or were sold), including Extricity and PurchasePro. Others are struggling while redefining their business strategies, such as CommerceOne, FairMarket, i2 Technologies, PSDI, and VerticalNet.
© 2 0 0 3 B o s t o n L o g i s t i c s G r o u p 2 0 D o n i z e t t i S t r e e t • W e l l e s l e y , M A 0 2 4 8 2
P h o n e : ( 7 8 1 ) 2 8 3 - 5 7 8 8 F a x : ( 7 8 1 ) 7 7 2 - 1 6 7 0 E - m a i l : i n f o @ b o s t o n l o g i s t i c s . c o m
31
• Some large companies are implementing ambitious e-procurement systems such as Ariba, Rightworks, and PurchasingNet.
• Some others are using or developing simpler, second-tier applications for the same purpose. These companies, many of which are mid-sized, are often analyzing the return on investment (ROI) from the investment in a system. One company is asking its vendors of physical products to fill in the electronic void by developing custom catalogs and electronic interfaces.
• Some are sticking with simple protocols such EDI/XML, having concluded that the ROI doesn’t pass their hurdle rates.
Figure 24: E-Procurement Emphasis
CPOs are working hard to smooth the cutural issues involved in implementing an e-procurement system. Buyers need to adapt to a new ordering process with a limited choice of approved suppliers. CPOs need to effectively communicate the goals of the program, facilitate the selection of approved suppliers, and get buy-in on the process changes needed for successful implementation.
1.0
1.5
2.0
2.5
3.0
3.5
4.0
Micro (<$100million)
Small ($100-$500million)
Medium ($500million-$3 billion)
Large (>$3 billion)
Size of Company
Emph
asis
FuturePast
© 2 0 0 3 B o s t o n L o g i s t i c s G r o u p 2 0 D o n i z e t t i S t r e e t • W e l l e s l e y , M A 0 2 4 8 2
P h o n e : ( 7 8 1 ) 2 8 3 - 5 7 8 8 F a x : ( 7 8 1 ) 7 7 2 - 1 6 7 0 E - m a i l : i n f o @ b o s t o n l o g i s t i c s . c o m
32
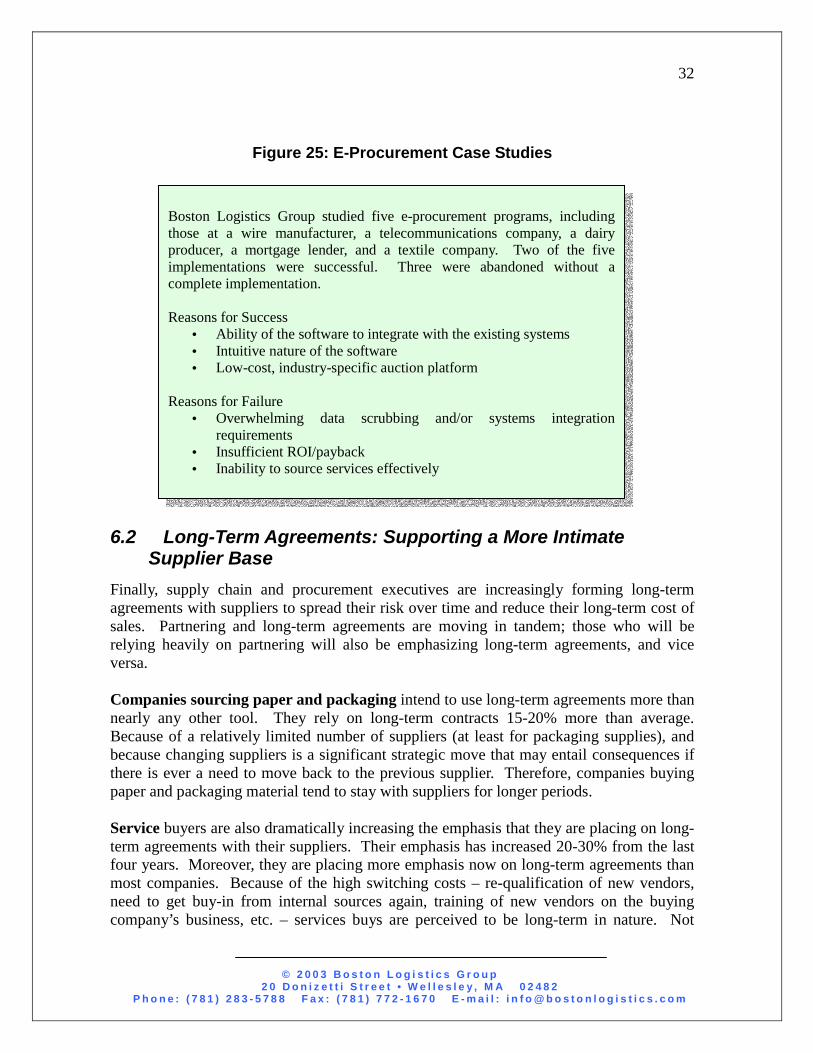
Figure 25: E-Procurement Case Studies
6.2 Long-Term Agreements: Supporting a More Intimate Supplier Base
Finally, supply chain and procurement executives are increasingly forming long-term agreements with suppliers to spread their risk over time and reduce their long-term cost of sales. Partnering and long-term agreements are moving in tandem; those who will be relying heavily on partnering will also be emphasizing long-term agreements, and vice versa. Companies sourcing paper and packaging intend to use long-term agreements more than nearly any other tool. They rely on long-term contracts 15-20% more than average. Because of a relatively limited number of suppliers (at least for packaging supplies), and because changing suppliers is a significant strategic move that may entail consequences if there is ever a need to move back to the previous supplier. Therefore, companies buying paper and packaging material tend to stay with suppliers for longer periods. Service buyers are also dramatically increasing the emphasis that they are placing on long-term agreements with their suppliers. Their emphasis has increased 20-30% from the last four years. Moreover, they are placing more emphasis now on long-term agreements than most companies. Because of the high switching costs – re-qualification of new vendors, need to get buy-in from internal sources again, training of new vendors on the buying company’s business, etc. – services buys are perceived to be long-term in nature. Not
Boston Logistics Group studied five e-procurement programs, including those at a wire manufacturer, a telecommunications company, a dairy producer, a mortgage lender, and a textile company. Two of the five implementations were successful. Three were abandoned without a complete implementation. Reasons for Success
• Ability of the software to integrate with the existing systems • Intuitive nature of the software • Low-cost, industry-specific auction platform
Reasons for Failure
• Overwhelming data scrubbing and/or systems integration requirements
• Insufficient ROI/payback • Inability to source services effectively
© 2 0 0 3 B o s t o n L o g i s t i c s G r o u p 2 0 D o n i z e t t i S t r e e t • W e l l e s l e y , M A 0 2 4 8 2
P h o n e : ( 7 8 1 ) 2 8 3 - 5 7 8 8 F a x : ( 7 8 1 ) 7 7 2 - 1 6 7 0 E - m a i l : i n f o @ b o s t o n l o g i s t i c s . c o m
33
surprisingly, therefore, these respondents also ranked Partnering as a very high priority for the next four years. It is worth noting, however, that some respondents (a minority) favor shorter-term agreements. These companies believe that competition and frequent re-bidding achieve greater unit cost reductions than collaboration/partnership with the suppliers.
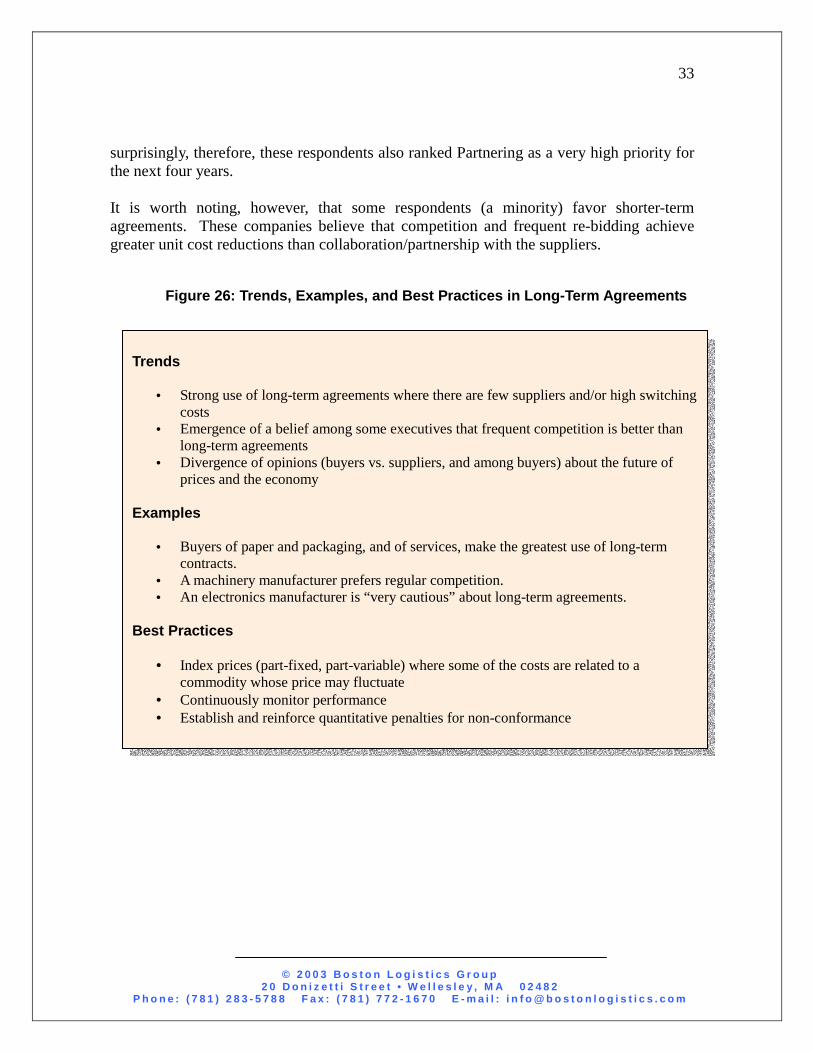
Figure 26: Trends, Examples, and Best Practices in Long-Term Agreements
Trends
• Strong use of long-term agreements where there are few suppliers and/or high switching costs
• Emergence of a belief among some executives that frequent competition is better than long-term agreements
• Divergence of opinions (buyers vs. suppliers, and among buyers) about the future of prices and the economy
Examples
• Buyers of paper and packaging, and of services, make the greatest use of long-term contracts.
• A machinery manufacturer prefers regular competition. • An electronics manufacturer is “very cautious” about long-term agreements.
Best Practices
• Index prices (part-fixed, part-variable) where some of the costs are related to a
commodity whose price may fluctuate • Continuously monitor performance • Establish and reinforce quantitative penalties for non-conformance
© 2 0 0 3 B o s t o n L o g i s t i c s G r o u p 2 0 D o n i z e t t i S t r e e t • W e l l e s l e y , M A 0 2 4 8 2
P h o n e : ( 7 8 1 ) 2 8 3 - 5 7 8 8 F a x : ( 7 8 1 ) 7 7 2 - 1 6 7 0 E - m a i l : i n f o @ b o s t o n l o g i s t i c s . c o m
34
6.3 Supply Chain Integration: In Pursuit of Logistics and
Inventory Benefits Supply chain integration tools can play a large role in a company’s ability to reduce total delivered cost. Note that supply chain integration, as it is used here, relates specifically to strategic sourcing – focusing on methods of reducing the transportation and stocking cost of inbound materials by enabling better communication between buyers and suppliers – more than on “internal supply chain” (purchasing-materials integration), or logistics (transportation, warehousing , distribution) management. Companies are implementing consignment, event management, co-location, just-in-time delivery (JIT), “dealer-direct” shipments, and collaborative planning, forecasting, and replenishment (CPFR). Companies in the consumer goods, electronics, as well as machinery and device manufacturing industries are working the hardest on supply chain integration initiatives. Due to the high-volume and/or high-value nature of the businesses, their programs are aimed at reducing cycle times and inventory, increasing the accuracy of shipments, and reducing stock-outs. For example:
• One consumer products company is working with its suppliers to improve visibility of imported products as part of a supply chain security initiative.
• An electronics company set up a portal to enhance order management and visibility with its suppliers, and another co-located a third-party logistics company adjacent to its production plant in order to assure just-in-time delivery. Through a combination of sole sourcing and portals, this and other electronics companies are bringing their suppliers further upstream into their product development process, and production process and technology decisions. The goal is shorter leadtimes and more flexible supply.
• An electrical supplies manufacturer is developing a strategic alliance with a value-added distributor.
Raw materials buyers have been, and will continue work on, SCI about 15% more than buyers of other intermediate components, finished goods, or services. SCI is pivotal to a variety of cross-functional initiatives such as TQM, JIT, and Six Sigma, which critically impact direct materials and component buyers. Recent supply chain integration efforts have succeeded at reducing raw materials and work-in-process inventory at many companies.
• A furniture manufacturer has a development program in place for its steel suppliers; it focuses on logistical integration.
© 2 0 0 3 B o s t o n L o g i s t i c s G r o u p 2 0 D o n i z e t t i S t r e e t • W e l l e s l e y , M A 0 2 4 8 2
P h o n e : ( 7 8 1 ) 2 8 3 - 5 7 8 8 F a x : ( 7 8 1 ) 7 7 2 - 1 6 7 0 E - m a i l : i n f o @ b o s t o n l o g i s t i c s . c o m
35
• A manufacturer of aerospace and industrial products considers logistics costs to be its biggest challenge in buying its raw materials, and rated supply chain integration 5.0/5.0 in importance.
• A stationery products company considers its main challenge in buying paper buy to be supply chain costs, and rated supply chain integration 4.0/5.0.
Buyers of paper and packaging products have sharply increased their use of supply chain integration techniques such as event management (monitoring the passage of orders through key stages in the production/delivery process and calling attention to exceptions), consignment, and collaborative planning. For example a packaging producer is carefully comparing the option of buying less expensive paper and stocking inventory against the option of buying more expensive paper on demand. Also, a brewery buying packaging materials rated SCI 5.0/5.0.
© 2 0 0 3 B o s t o n L o g i s t i c s G r o u p 2 0 D o n i z e t t i S t r e e t • W e l l e s l e y , M A 0 2 4 8 2
P h o n e : ( 7 8 1 ) 2 8 3 - 5 7 8 8 F a x : ( 7 8 1 ) 7 7 2 - 1 6 7 0 E - m a i l : i n f o @ b o s t o n l o g i s t i c s . c o m
36
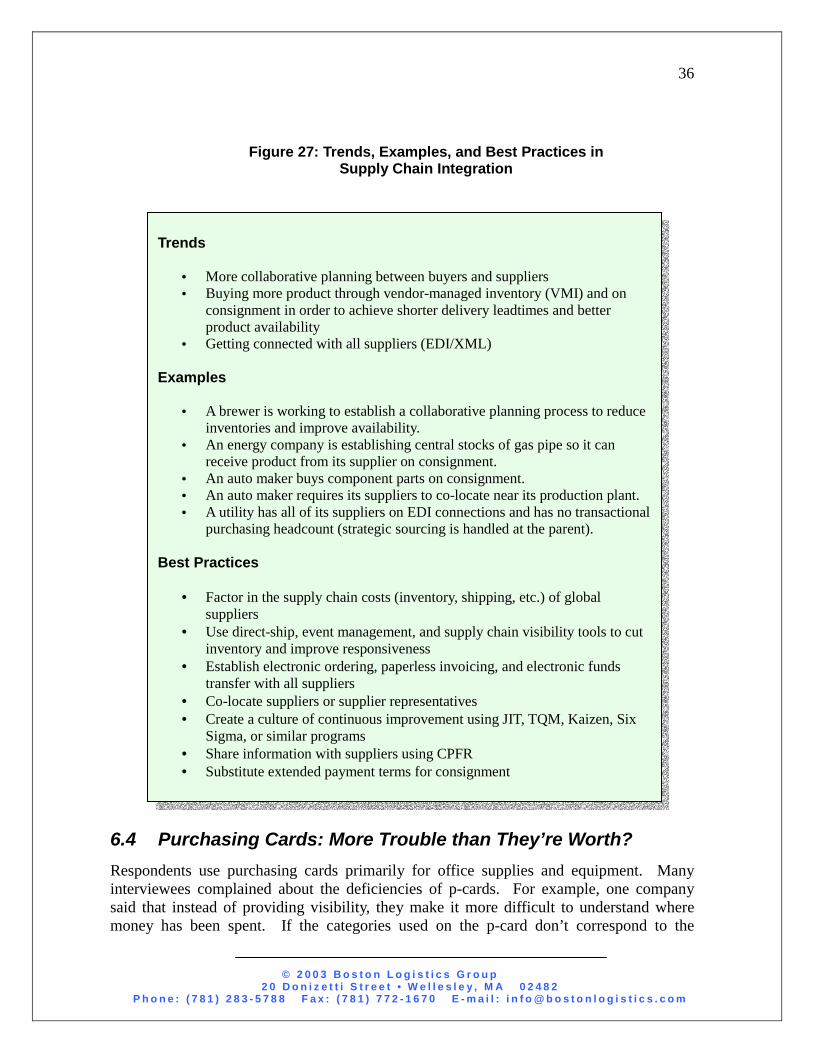
Figure 27: Trends, Examples, and Best Practices in Supply Chain Integration
6.4 Purchasing Cards: More Trouble than They’re Worth? Respondents use purchasing cards primarily for office supplies and equipment. Many interviewees complained about the deficiencies of p-cards. For example, one company said that instead of providing visibility, they make it more difficult to understand where money has been spent. If the categories used on the p-card don’t correspond to the
Trends
• More collaborative planning between buyers and suppliers • Buying more product through vendor-managed inventory (VMI) and on
consignment in order to achieve shorter delivery leadtimes and better product availability
• Getting connected with all suppliers (EDI/XML) Examples
• A brewer is working to establish a collaborative planning process to reduce inventories and improve availability.
• An energy company is establishing central stocks of gas pipe so it can receive product from its supplier on consignment.
• An auto maker buys component parts on consignment. • An auto maker requires its suppliers to co-locate near its production plant. • A utility has all of its suppliers on EDI connections and has no transactional
purchasing headcount (strategic sourcing is handled at the parent). Best Practices
• Factor in the supply chain costs (inventory, shipping, etc.) of global
suppliers • Use direct-ship, event management, and supply chain visibility tools to cut
inventory and improve responsiveness • Establish electronic ordering, paperless invoicing, and electronic funds
transfer with all suppliers • Co-locate suppliers or supplier representatives • Create a culture of continuous improvement using JIT, TQM, Kaizen, Six
Sigma, or similar programs • Share information with suppliers using CPFR • Substitute extended payment terms for consignment
© 2 0 0 3 B o s t o n L o g i s t i c s G r o u p 2 0 D o n i z e t t i S t r e e t • W e l l e s l e y , M A 0 2 4 8 2
P h o n e : ( 7 8 1 ) 2 8 3 - 5 7 8 8 F a x : ( 7 8 1 ) 7 7 2 - 1 6 7 0 E - m a i l : i n f o @ b o s t o n l o g i s t i c s . c o m
37
financial budget codes, many divisional and corporate staff find it difficult to review the p-card expenditures, and given a lack of resources they may not review them at all. Another company said that its users regularly abuse p-card privileges by ignoring guidelines on permissible charges. This company has a problem with users overstepping boundaries on standard product specifications, interpreting the guidelines too liberally, and mis-representing the purchases that they make. 6.5 Portals: Private vs. Public, Order Management vs. Web
Buying The responses show a divergence of opinion on the emphasis that should be placed on portals. CPOs consider them the least important tool; however, portals are more popular among Managers than Directors or Officers. Managers have used, and expect to continue to use, portals over 15% more than the survey average. Portals have “a long way to go,” according to one executive, especially for sourcing services. A real estate company that tried using portals to source services will only place an emphasis of 2.0/5.0 on portals in the future. The most prevalent use of portals for services has been for gathering information on potential suppliers. Once a potential supplier has been pre-qualified, many procurement executives feel that portals are not helpful in establishing the familiarity and comfort level that may be needed to change suppliers. However, portals are used differently today than during the technology frenzy. As opposed to transactional purchasing (horizontal and vertical-market portals to help identify suppliers, screen them, and transact purchases), more portals are being used today as private extranets to forecast, plan, and track orders placed with strategic suppliers. Handling ordering activities on a common web-based platform can help speed the order cycle in contract electronics manufacturing, where multiple subcomponents must all be made to specifications by different companies and then assembled. By forming a private supply chain network, these portals are shortening order leadtime and simplifying engineering changes. When implementing portals:
• One electronics company noted that buyers and suppliers must decide who owns the data and who is responsible for updating it.
• Another company buying electronic components uses a web-based portal to place and confirm orders. It did not buy software, however – the system is home-grown.
• A contract manufacturer is partnering with its suppliers to develop a portal that will integrate all supply chain partners in a complex manufacturing process. It expects that this will increase manufacturing flexibility.
© 2 0 0 3 B o s t o n L o g i s t i c s G r o u p 2 0 D o n i z e t t i S t r e e t • W e l l e s l e y , M A 0 2 4 8 2
P h o n e : ( 7 8 1 ) 2 8 3 - 5 7 8 8 F a x : ( 7 8 1 ) 7 7 2 - 1 6 7 0 E - m a i l : i n f o @ b o s t o n l o g i s t i c s . c o m
38
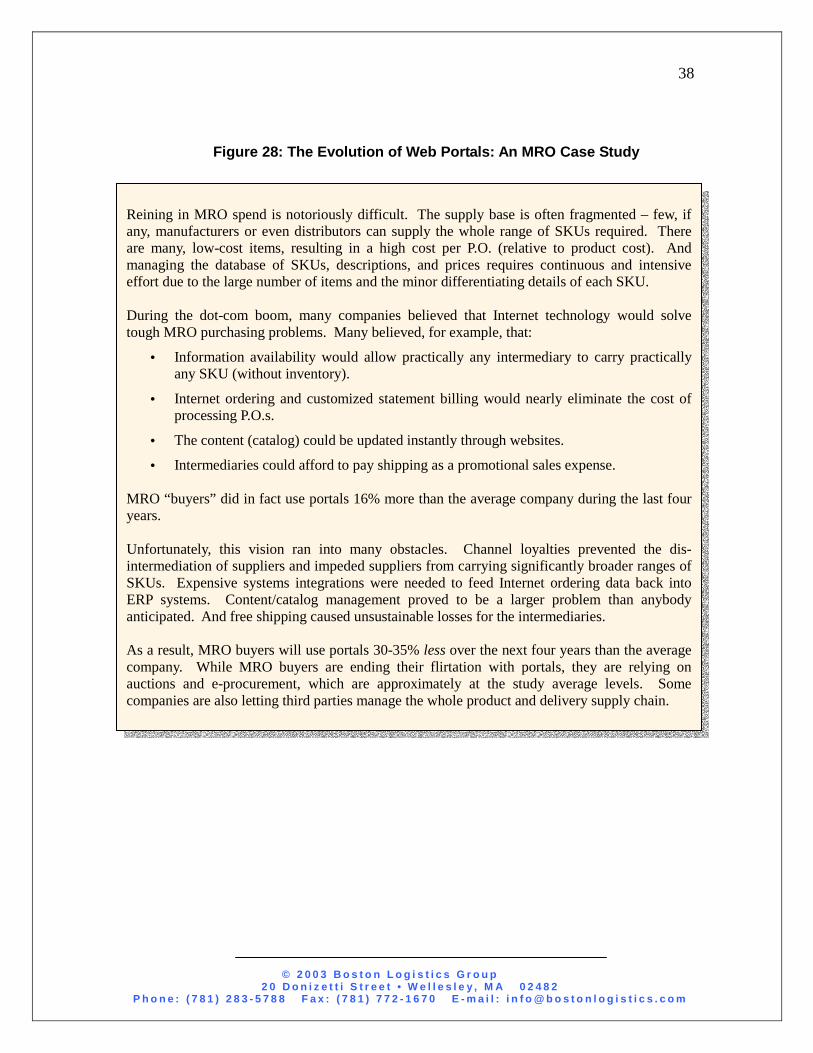
Figure 28: The Evolution of Web Portals: An MRO Case Study
Reining in MRO spend is notoriously difficult. The supply base is often fragmented – few, if any, manufacturers or even distributors can supply the whole range of SKUs required. There are many, low-cost items, resulting in a high cost per P.O. (relative to product cost). And managing the database of SKUs, descriptions, and prices requires continuous and intensive effort due to the large number of items and the minor differentiating details of each SKU. During the dot-com boom, many companies believed that Internet technology would solve tough MRO purchasing problems. Many believed, for example, that:
• Information availability would allow practically any intermediary to carry practicallyany SKU (without inventory).
• Internet ordering and customized statement billing would nearly eliminate the cost of processing P.O.s.
• The content (catalog) could be updated instantly through websites.
• Intermediaries could afford to pay shipping as a promotional sales expense. MRO “buyers” did in fact use portals 16% more than the average company during the last four years. Unfortunately, this vision ran into many obstacles. Channel loyalties prevented the dis-intermediation of suppliers and impeded suppliers from carrying significantly broader ranges of SKUs. Expensive systems integrations were needed to feed Internet ordering data back into ERP systems. Content/catalog management proved to be a larger problem than anybody anticipated. And free shipping caused unsustainable losses for the intermediaries. As a result, MRO buyers will use portals 30-35% less over the next four years than the average company. While MRO buyers are ending their flirtation with portals, they are relying on auctions and e-procurement, which are approximately at the study average levels. Some companies are also letting third parties manage the whole product and delivery supply chain.
© 2 0 0 3 B o s t o n L o g i s t i c s G r o u p 2 0 D o n i z e t t i S t r e e t • W e l l e s l e y , M A 0 2 4 8 2
P h o n e : ( 7 8 1 ) 2 8 3 - 5 7 8 8 F a x : ( 7 8 1 ) 7 7 2 - 1 6 7 0 E - m a i l : i n f o @ b o s t o n l o g i s t i c s . c o m
39
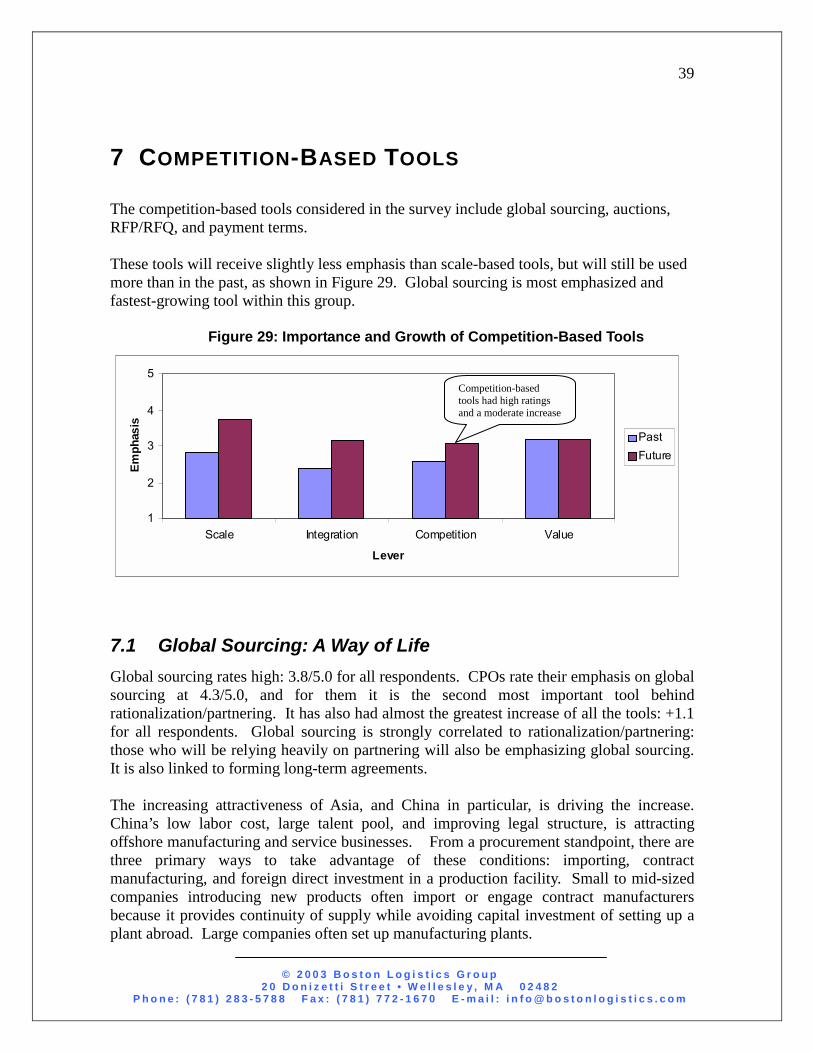
7 COMPETITION-BASED TOOLS The competition-based tools considered in the survey include global sourcing, auctions, RFP/RFQ, and payment terms. These tools will receive slightly less emphasis than scale-based tools, but will still be used more than in the past, as shown in Figure 29. Global sourcing is most emphasized and fastest-growing tool within this group.
Figure 29: Importance and Growth of Competition-Based Tools
7.1 Global Sourcing: A Way of Life Global sourcing rates high: 3.8/5.0 for all respondents. CPOs rate their emphasis on global sourcing at 4.3/5.0, and for them it is the second most important tool behind rationalization/partnering. It has also had almost the greatest increase of all the tools: +1.1 for all respondents. Global sourcing is strongly correlated to rationalization/partnering: those who will be relying heavily on partnering will also be emphasizing global sourcing. It is also linked to forming long-term agreements. The increasing attractiveness of Asia, and China in particular, is driving the increase. China’s low labor cost, large talent pool, and improving legal structure, is attracting offshore manufacturing and service businesses. From a procurement standpoint, there are three primary ways to take advantage of these conditions: importing, contract manufacturing, and foreign direct investment in a production facility. Small to mid-sized companies introducing new products often import or engage contract manufacturers because it provides continuity of supply while avoiding capital investment of setting up a plant abroad. Large companies often set up manufacturing plants.
1
2
3
4
5
Scale Integration Competition Value
Lever
Emph
asis
PastFuture
Competition-based tools had high ratings and a moderate increase
© 2 0 0 3 B o s t o n L o g i s t i c s G r o u p 2 0 D o n i z e t t i S t r e e t • W e l l e s l e y , M A 0 2 4 8 2
P h o n e : ( 7 8 1 ) 2 8 3 - 5 7 8 8 F a x : ( 7 8 1 ) 7 7 2 - 1 6 7 0 E - m a i l : i n f o @ b o s t o n l o g i s t i c s . c o m
40
Over 10% of manufacturing participants made un-prompted mention of ventures in China. One company worked through one of its large customers to set up a source in China. Another company that had bought through a distributor has recently gone direct to Asia. A third is “evaluating” the opportunities. By contrast, however, the paper industry rates global sourcing very low, which according to one participant may be explained by a high cost of transportation relative to product cost. Companies have achieved up to 70% cost reductions through global sourcing. However, the challenges and risks can be substantial. They include, for example, extended product delivery leadtimes, country/political risk (e.g., Korea), currency risk, intellectual property protection, confidentiality concerns, and language and cultural barriers. Plus, when outsourcing, care must be given to what to do with existing capital investments and potential labor concern over the decision to send the work offshore. Global sourcing is the biggest change in purchasing practices for contract manufacturing. In the past, buyers of contract manufacturing rated global sourcing 1.8 (less than the average); in the future it is 4.0 (more than the average). A similar but less pronounced trend can be seen with rationalization/partnering. Companies in the consumer goods sector plan on using global sourcing 15% more than other companies. This represents a 25-35% change from past practice. Asia and particularly China are mentioned as sources of supply. Three large consumer products companies in the study were purchased by foreign holding companies in the last several years, and are now leveraging their parent companies’ global supplier base. The transportation companies in our study will use global sourcing 18% more than the average. In the past, global sourcing was a lesser-used tool. The increased emphasis on global sourcing reflects a growth in these companies’ transportation networks as well as a change in attitudes toward global sourcing. Several of the carriers have substantial and growing international operations. One company is expanding into Europe, and looking globally for suppliers to support the new operations.

© 2 0 0 3 B o s t o n L o g i s t i c s G r o u p 2 0 D o n i z e t t i S t r e e t • W e l l e s l e y , M A 0 2 4 8 2
P h o n e : ( 7 8 1 ) 2 8 3 - 5 7 8 8 F a x : ( 7 8 1 ) 7 7 2 - 1 6 7 0 E - m a i l : i n f o @ b o s t o n l o g i s t i c s . c o m
41
Figure 30: Trends, Examples and Best Practices in Global Sourcing
7.2 Payment Terms: New Financial Tools on the Market Payment terms is considered as a competition-based tool in this study because it is often applied in the negotiating stages before a final supplier selection has been made, and usually reduces the supplier’s margin as do other competition-based tools. Leveraging payment terms is one of the top priorities of the respondents. Moreover, there is an increasing emphasis on payment terms versus the past, despite a historically low cost of money. Some companies have been mandating 90-day payment terms, often during competitive bidding or at contract renewal time. In response, vendors have introduced a new suite of settlement and payables tools to help the suppliers smooth their cash flow and reduce their cost of capital, the risk of non-payment, and the variability of days outstanding. Citibank, GE Global Distribution Services, TradeCard, UPS Capital and others offer specialized products in this area.
Trends
• Focus on Pacific Rim suppliers, especially in China • Increasing share of production overseas • Outsourcing
Examples
• Many respondents who are involved in global sourcing are focusing on Asia in general, and China in particular.
• A consumer products company is sending more of its supply line to China. • An airline systematically outsourced non-core activities, and regularly
considered foreign suppliers in its bidding process.
Best Practices
• Communicate with stakeholders about the objectives of going overseas • Make sure there is at least one international supplier for every 3-4 domestic
suppliers in competitive bids. Tap consultants and large customers for recommendations on high-quality global suppliers.
• Have backup suppliers domestically for demand peaks, production problems, and shipping delays (related to security, longshore strikes, etc.)
• Hedge currency risk with futures contracts
© 2 0 0 3 B o s t o n L o g i s t i c s G r o u p 2 0 D o n i z e t t i S t r e e t • W e l l e s l e y , M A 0 2 4 8 2
P h o n e : ( 7 8 1 ) 2 8 3 - 5 7 8 8 F a x : ( 7 8 1 ) 7 7 2 - 1 6 7 0 E - m a i l : i n f o @ b o s t o n l o g i s t i c s . c o m
42
7.3 RFx: Not Your Father’s RFQ Companies are replacing paper RFx and multiple decentralized purchasing decisions with a more centralized, comprehensive, and accurate e-RFx process that focuses more on RFIs and quote data analysis and archiving than on actual price quotes received through RFQs. There are many different electronic approaches to issuing and receiving RFIs, RFPs, and RFQs. Some are simply e-mailing the old documents. Others have electronic systems that integrate information gathered during negotiations with customs, contract compliance, rate retention, benchmarking, and performance tracking. In the electronic industry, traditional RFQs are losing ground (3.1/5.0 in the future versus 3.3/5.0 in the past), but some electronics companies are evaluating more advanced RFx software tools that can replace them. One company is working with a provider of advanced RFI, RFP, and RFQ software. The software not only issues and collects RFx bids, but also handles data analysis steps that would otherwise require an analyst. This is cost-effective for commodity categories that involve a large number of SKUs, or permutations on a core design, and/or large bids where bundling strategies can change the sourcing decision. In the transportation and logistics industry, companies use competitive bidding via RFx tools more than the rest of the companies in the study. Moreover, their use of them is increasing in absolute terms and relative to the other respondents’ increases. For example, one airline is working with a vendor of advanced electronic RFI/RFP software in order to improve the efficiency and effectiveness of this process. A trucking company is working with combinatorial bidding software (not a pure auction, but not a simple RFQ either) to balance loads and optimize pricing and yields. RFx are often preferable to auctions for these companies because services such as engineering, maintenance, and construction are complex buys, supplier reliability is critical (a service or quality failure can cause a ripple effect in the network), and capital items (infrequent buys) don’t always justify the setup required to automate the process. 7.4 Auctions: A Hard Sell Although auctions will become a more important tool in the future than in the past, their use will increase only moderately. Auctions were ranked last of all the 13 tools listed in the survey by the respondents as a whole. Procurement executives intend to use them almost exclusively for indirect purchases; only two participants actively talked about using auctions for direct materials. Many respondents have expressed concern over potential degradation of the relationship with the supplier, the need to account for non-price purchasing criteria, and the fact that many types of goods and services are hard to compare and contrast with one another quantitatively. While some organizations have had very high savings with auctions, most
© 2 0 0 3 B o s t o n L o g i s t i c s G r o u p 2 0 D o n i z e t t i S t r e e t • W e l l e s l e y , M A 0 2 4 8 2
P h o n e : ( 7 8 1 ) 2 8 3 - 5 7 8 8 F a x : ( 7 8 1 ) 7 7 2 - 1 6 7 0 E - m a i l : i n f o @ b o s t o n l o g i s t i c s . c o m
43
users of auctions tools believe that their application is limited to certain commodity groups.
• Transportation and logistics companies will place 45% less emphasis on auctions compared to the last four years.
• One paper company cited the fear of “being auctioned” on the sales side as one reason to resist auctions on the procurement side. If suppliers are also customers, the results can be potentially devastating.
• Machinery and device manufacturers are sharply decreasing their emphasis relative to other companies. During the boom, many auction solution vendors were targeting companies in this sector, resulting in hype and experimentation. But as it became clear that auctions were not always the best method to use to source complex manufactured parts, some of these vendors changed their business strategy and focused on qualifying vendors instead of driving price down. Others went out of business or sold to larger ERP or CRM companies.
• Buyers of hardware, fasteners, and industrial supplies are de-emphasizing auctions (21% below the average) because of the large number of SKUs involved and the desire to reduce overhead administrative, and lifecyle (“total”) cost.
In contrast, retailers will be using auctions 20% more than the average in the future, a change which is being driven by indirect procurement. Auctions are common for indirect procurement, and expected to become even more common. One retailer currently uses auctions for office supplies (office equipment, toner cartridges, etc.).
Industry and commodity differences aside, companies seem to fall into two camps: those that have used auctions in the past and have experience with their strengths and weaknesses do not intend to increase usage much in the future. Those that have not used them do want to use them substantially in the future.
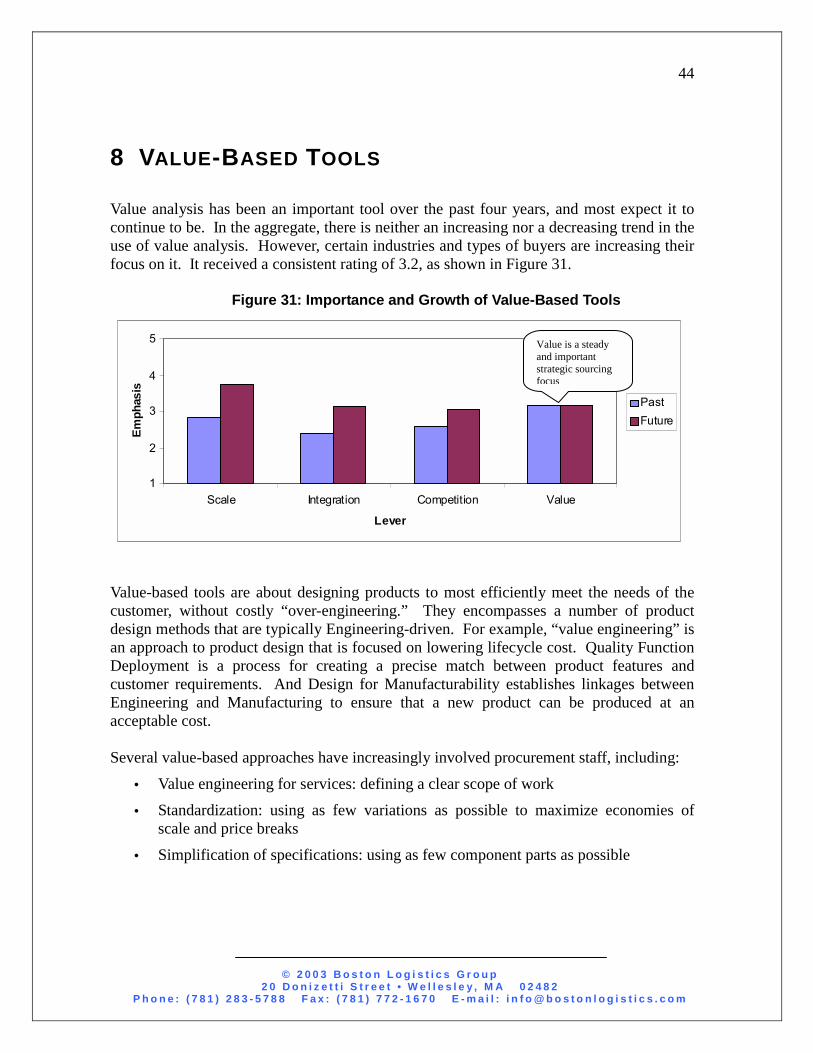
© 2 0 0 3 B o s t o n L o g i s t i c s G r o u p 2 0 D o n i z e t t i S t r e e t • W e l l e s l e y , M A 0 2 4 8 2
P h o n e : ( 7 8 1 ) 2 8 3 - 5 7 8 8 F a x : ( 7 8 1 ) 7 7 2 - 1 6 7 0 E - m a i l : i n f o @ b o s t o n l o g i s t i c s . c o m
44
8 VALUE-BASED TOOLS Value analysis has been an important tool over the past four years, and most expect it to continue to be. In the aggregate, there is neither an increasing nor a decreasing trend in the use of value analysis. However, certain industries and types of buyers are increasing their focus on it. It received a consistent rating of 3.2, as shown in Figure 31.
Figure 31: Importance and Growth of Value-Based Tools
Value-based tools are about designing products to most efficiently meet the needs of the customer, without costly “over-engineering.” They encompasses a number of product design methods that are typically Engineering-driven. For example, “value engineering” is an approach to product design that is focused on lowering lifecycle cost. Quality Function Deployment is a process for creating a precise match between product features and customer requirements. And Design for Manufacturability establishes linkages between Engineering and Manufacturing to ensure that a new product can be produced at an acceptable cost. Several value-based approaches have increasingly involved procurement staff, including:
• Value engineering for services: defining a clear scope of work
• Standardization: using as few variations as possible to maximize economies of scale and price breaks
• Simplification of specifications: using as few component parts as possible
1
2
3
4
5
Scale Integration Competition Value
Lever
Emph
asis
PastFuture
Value is a steady and important strategic sourcing focus
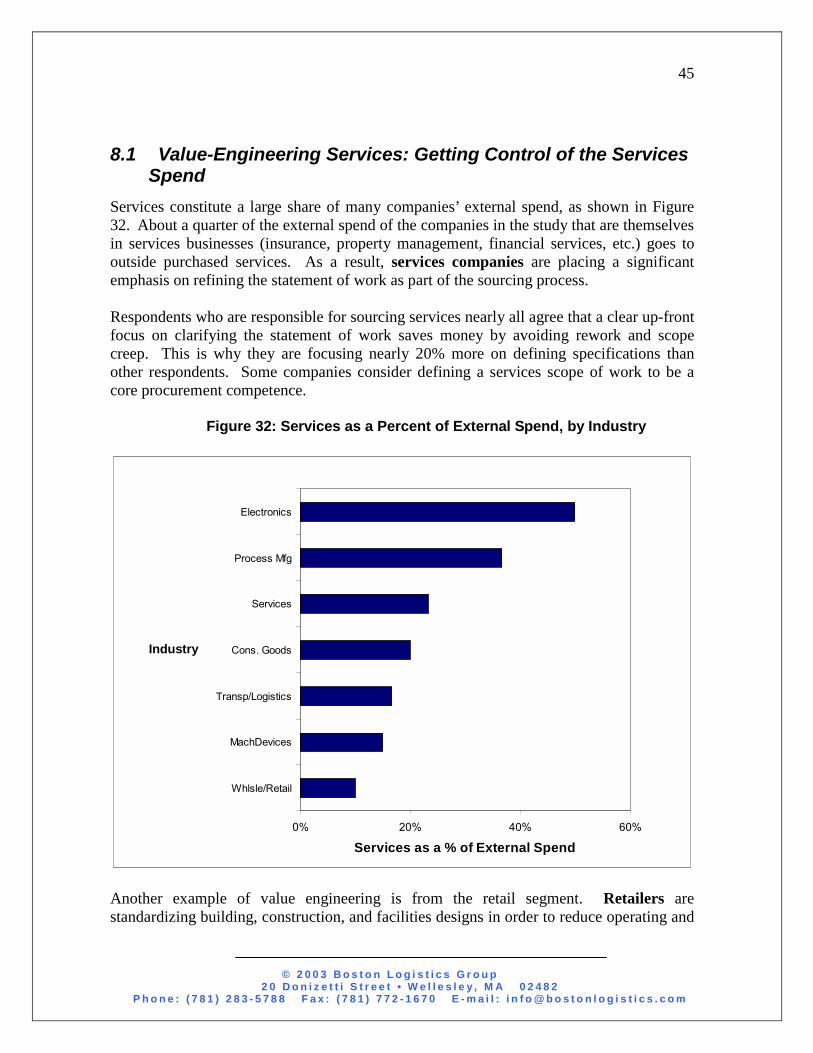
© 2 0 0 3 B o s t o n L o g i s t i c s G r o u p 2 0 D o n i z e t t i S t r e e t • W e l l e s l e y , M A 0 2 4 8 2
P h o n e : ( 7 8 1 ) 2 8 3 - 5 7 8 8 F a x : ( 7 8 1 ) 7 7 2 - 1 6 7 0 E - m a i l : i n f o @ b o s t o n l o g i s t i c s . c o m
45
8.1 Value-Engineering Services: Getting Control of the Services Spend
Services constitute a large share of many companies’ external spend, as shown in Figure 32. About a quarter of the external spend of the companies in the study that are themselves in services businesses (insurance, property management, financial services, etc.) goes to outside purchased services. As a result, services companies are placing a significant emphasis on refining the statement of work as part of the sourcing process. Respondents who are responsible for sourcing services nearly all agree that a clear up-front focus on clarifying the statement of work saves money by avoiding rework and scope creep. This is why they are focusing nearly 20% more on defining specifications than other respondents. Some companies consider defining a services scope of work to be a core procurement competence.
Figure 32: Services as a Percent of External Spend, by Industry
0% 20% 40% 60%
Whlsle/Retail
MachDevices
Transp/Logistics
Cons. Goods
Services
Process Mfg
Electronics
Industry
Services as a % of External Spend
Another example of value engineering is from the retail segment. Retailers are standardizing building, construction, and facilities designs in order to reduce operating and
© 2 0 0 3 B o s t o n L o g i s t i c s G r o u p 2 0 D o n i z e t t i S t r e e t • W e l l e s l e y , M A 0 2 4 8 2
P h o n e : ( 7 8 1 ) 2 8 3 - 5 7 8 8 F a x : ( 7 8 1 ) 7 7 2 - 1 6 7 0 E - m a i l : i n f o @ b o s t o n l o g i s t i c s . c o m
46
capital expenditures. One retailer embedded value engineering into a strategic sourcing program for its capitalized store construction and maintenance expenditures. 8.2 Standardization: Making a Dent in Indirect Expenses Consumer goods companies plan on using value-based strategies 12% more than others, and that they are placing 45% more emphasis on this than in the past. These respondents are sourcing indirect spend items such as promotional displays, newsprint/advertising, packaging, and MRO items. Two consumer products companies are working with third party logistics providers and dedicated packaging firms to “modularize” promotional displays and packaging in order to extend their use, reduce transportation cost, and minimize the complexity of reverse logistics.
MRO buyers are using standardization more as well. One major MRO buyer recently devoted a major project to standardizing its pipes, valves and fittings across multiple operating divisions. In combination with a strategic sourcing program, it saved about 25% on these goods, and over a third of the savings was due to standardizing the specifications.
8.3 Spec Simplification: Rationalizing Complex Products Machinery and device manufacturers will use value-based strategies 20% more than the survey average, and have rated it 30-40% higher than the average tools. Because of a generally large number of SKUs and complex scheduling, value engineering saves money upstream and downstream. One manufacturer, however, notes the practical difficulties in implementing programs to simplify specifications. They can consume valuable resources, and proposals to change specifications can require extensive political clout to get internal buy-in. Buyers of electronic products – an industry with the highest percent of purchased services of all the industries included in this study, as shown in Figure 32 – and of contract manufacturing place 26% more emphasis on value analysis and standardization of specifications than other companies. Buyers of these services are especially sensitive to reducing new product introduction leadtime, manufacturing miscommunications, and the complexity of design changes. One multinational manufacturer has systematically engaged its key suppliers to work together on simplifying specifications.
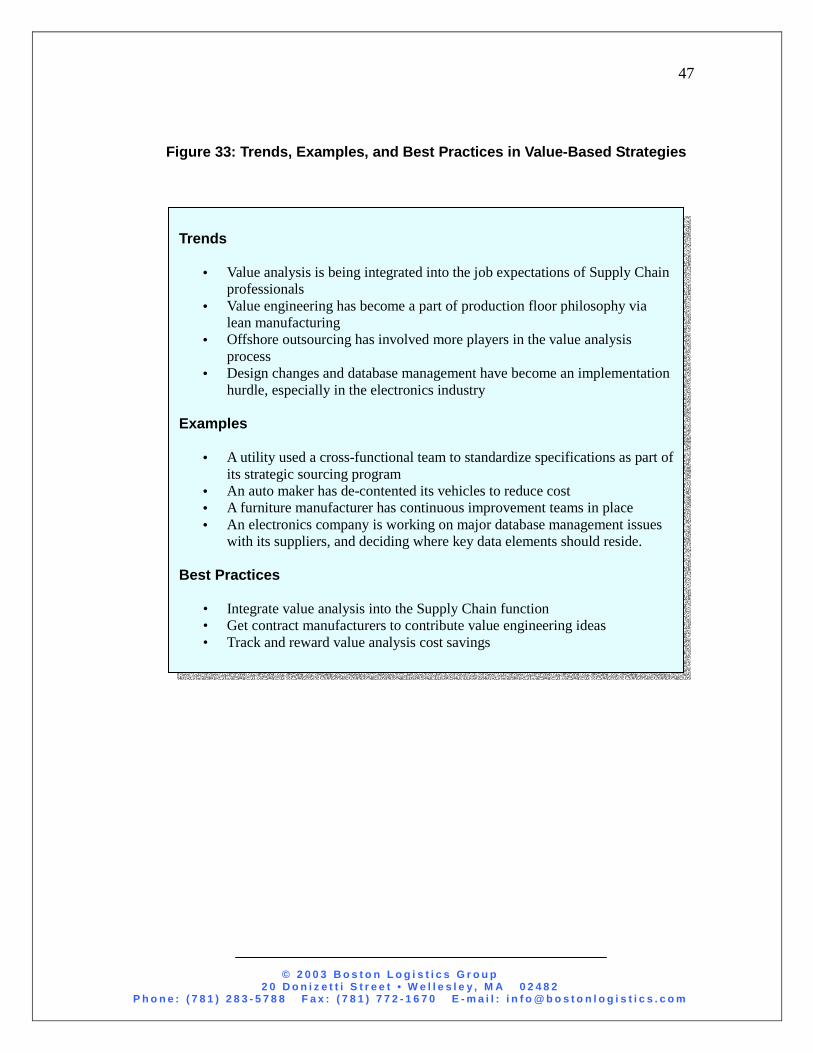
© 2 0 0 3 B o s t o n L o g i s t i c s G r o u p 2 0 D o n i z e t t i S t r e e t • W e l l e s l e y , M A 0 2 4 8 2
P h o n e : ( 7 8 1 ) 2 8 3 - 5 7 8 8 F a x : ( 7 8 1 ) 7 7 2 - 1 6 7 0 E - m a i l : i n f o @ b o s t o n l o g i s t i c s . c o m
47
Figure 33: Trends, Examples, and Best Practices in Value-Based Strategies
Trends
• Value analysis is being integrated into the job expectations of Supply Chain
professionals • Value engineering has become a part of production floor philosophy via
lean manufacturing • Offshore outsourcing has involved more players in the value analysis
process • Design changes and database management have become an implementation
hurdle, especially in the electronics industry Examples
• A utility used a cross-functional team to standardize specifications as part of
its strategic sourcing program • An auto maker has de-contented its vehicles to reduce cost • A furniture manufacturer has continuous improvement teams in place • An electronics company is working on major database management issues
with its suppliers, and deciding where key data elements should reside.
Best Practices
• Integrate value analysis into the Supply Chain function • Get contract manufacturers to contribute value engineering ideas • Track and reward value analysis cost savings
© 2 0 0 3 B o s t o n L o g i s t i c s G r o u p 2 0 D o n i z e t t i S t r e e t • W e l l e s l e y , M A 0 2 4 8 2
P h o n e : ( 7 8 1 ) 2 8 3 - 5 7 8 8 F a x : ( 7 8 1 ) 7 7 2 - 1 6 7 0 E - m a i l : i n f o @ b o s t o n l o g i s t i c s . c o m
48
9 COMPANY SIZE DIFFERENCES
9.1 Large Companies The study included over 30 responses from large companies (more than $3 billion of revenues per year). These companies have average annual revenues of $10 billion (and a median of $6.5 billion). They are sometimes leaders in procurement and integrated supply chain thinking. Collectively the respondents are responsible for 20% of the external spend. Large companies typically have professional staff, and ongoing training, best practice processes, and advanced information systems. They have many suppliers, require a wide geographic coverage, and need sophisticated logistics solutions. Furthermore, they have the resources to hire experienced and trained procurement talent. As a result, they work with a large and well-equipped set of strategic sourcing tools. The overall results presented earlier in this report apply to most large companies. In addition, several trends that are unique to the large companies are worth noting here. 9.1.1 Using Multiple Strategic Sourcing Tools at Once
Large companies leverage nearly all of the tools at the same time. They rated higher than average use of 12 of the 13 tools in the survey (compare the bars to the solid line in Figure 34). Because the spend is so large and there are so many materials and services to buy, there are almost always opportunities to use every tool in some way. This requires trained procurement staff and solid project management skills. The use of multiple strategic sourcing tools is not a change from past practice. Large companies were the heaviest users of all the tools in the past, and expect to be in the future, too. The only tool they are not using as much as other segments is decentralized or paper-based RFQs. Most used RFQs less than the average in the past, and expect to use them even less in the future. Large companies are replacing these decentralized, paper-based RFQs with centralized multi-staged RFI and RFP (“RFx”) processes. In many cases this is supported by software. 9.1.2 Implementing E-Procurement and Auctions
Due to the number of buyers and the volume of transactions, large companies have been, and will continue to be, particularly focused on implementing e-procurement systems. There are 3 different e-procurement stances: implementing e-procurement systems such as Ariba; using or developing simpler, second-tier applications for the same purpose; and
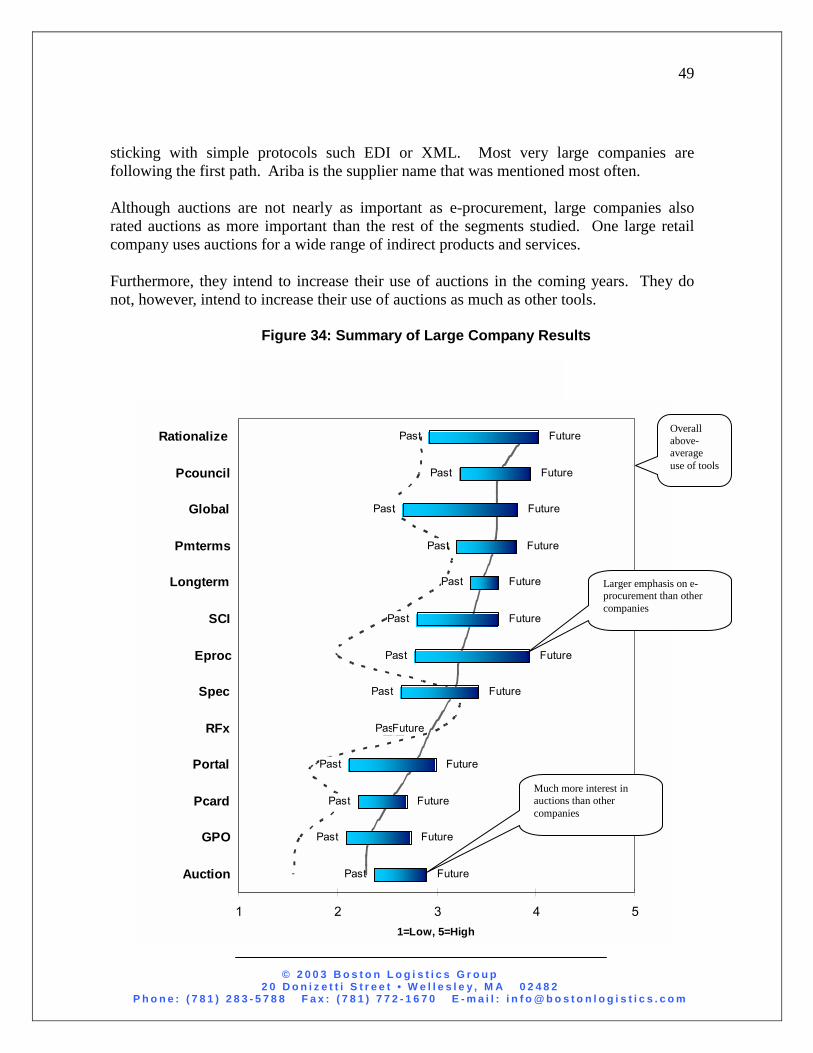
© 2 0 0 3 B o s t o n L o g i s t i c s G r o u p 2 0 D o n i z e t t i S t r e e t • W e l l e s l e y , M A 0 2 4 8 2
P h o n e : ( 7 8 1 ) 2 8 3 - 5 7 8 8 F a x : ( 7 8 1 ) 7 7 2 - 1 6 7 0 E - m a i l : i n f o @ b o s t o n l o g i s t i c s . c o m
49
sticking with simple protocols such EDI or XML. Most very large companies are following the first path. Ariba is the supplier name that was mentioned most often. Although auctions are not nearly as important as e-procurement, large companies also rated auctions as more important than the rest of the segments studied. One large retail company uses auctions for a wide range of indirect products and services. Furthermore, they intend to increase their use of auctions in the coming years. They do not, however, intend to increase their use of auctions as much as other tools.
Figure 34: Summary of Large Company Results
Past
Past
Past
Past
Past
Past
Past
Past
Past
Past
Past
Past
Past Future
Future
Future
Future
Future
Future
Future
Future
Future
Future
Future
Future
Future
1 2 3 4 5
Rationalize
Pcouncil
Global
Pmterms
Longterm
SCI
Eproc
Spec
RFx
Portal
Pcard
GPO
Auction
1=Low, 5=High
Much more interest in auctions than other companies
Larger emphasis on e-procurement than other companies
Overall above-average use of tools
© 2 0 0 3 B o s t o n L o g i s t i c s G r o u p 2 0 D o n i z e t t i S t r e e t • W e l l e s l e y , M A 0 2 4 8 2
P h o n e : ( 7 8 1 ) 2 8 3 - 5 7 8 8 F a x : ( 7 8 1 ) 7 7 2 - 1 6 7 0 E - m a i l : i n f o @ b o s t o n l o g i s t i c s . c o m
50
9.1.3 Scanning the Environment Continuously
Large companies are continually scanning the environment for potential suppliers and comparative costs. They monitor price levels for energy and other raw materials. They gather supply market intelligence, use price indexes, and benchmark cost and performance. 9.1.4 Managing a Portfolio of Suppliers
Because of the number and diversity of suppliers, large companies manage them as a portfolio. Some are high-volume/partners and some are low-volume/backup suppliers. Some are primary and others are secondary. Some supply a broad range of SKUs and others are niche suppliers. Some are global and others are national or regional. A matrix, or portfolio, approach helps to plan the evolution of suppliers and manage relationships and communication with them, especially during negotiations. 9.2 Mid-Sized Companies The study included over 30 responses from mid-sized companies. We defined mid-sized companies as those with revenues of $500 million to $3 billion per year. These companies share several similarities: 1) they usually have procurement departments staffed with experienced professionals; 2) processes and practices are refined and documented in order to deal with the increasing complexity of numerous and diverse orders; and 3) there are varying levels of procurement system functionality and integration. These companies have average annual revenues of $2 billion, although there is a wide range of revenues. Collectively the respondents are responsible for 43% of the external spend. The overall results presented earlier in this report apply to most mid-sized companies. In addition, several trends that are unique to the mid-sized companies are worth noting here. 9.2.1 Continued Supply Base Rationalization
Having already focused on consolidation over the past four years, they are starting with a lean base. And mid-sized companies are not only keeping up with the trend toward supply base rationalization, they are leading it. Mid-sized companies used partnering and supply base rationalization 5-10% more than the sample average.
9.2.2 More Value Analysis
Over the past four years, mid-sized companies used value analysis 31% less than other companies in the study – 17% less than large companies and 25% less than small
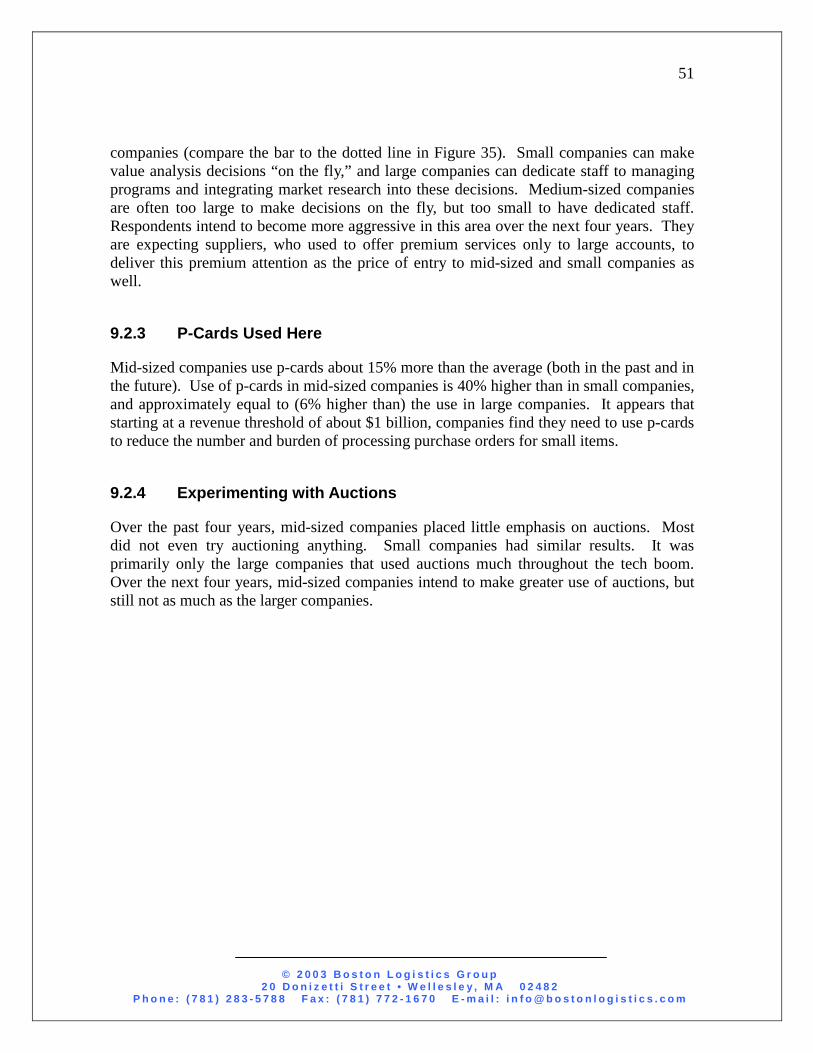
© 2 0 0 3 B o s t o n L o g i s t i c s G r o u p 2 0 D o n i z e t t i S t r e e t • W e l l e s l e y , M A 0 2 4 8 2
P h o n e : ( 7 8 1 ) 2 8 3 - 5 7 8 8 F a x : ( 7 8 1 ) 7 7 2 - 1 6 7 0 E - m a i l : i n f o @ b o s t o n l o g i s t i c s . c o m
51
companies (compare the bar to the dotted line in Figure 35). Small companies can make value analysis decisions “on the fly,” and large companies can dedicate staff to managing programs and integrating market research into these decisions. Medium-sized companies are often too large to make decisions on the fly, but too small to have dedicated staff. Respondents intend to become more aggressive in this area over the next four years. They are expecting suppliers, who used to offer premium services only to large accounts, to deliver this premium attention as the price of entry to mid-sized and small companies as well. 9.2.3 P-Cards Used Here
Mid-sized companies use p-cards about 15% more than the average (both in the past and in the future). Use of p-cards in mid-sized companies is 40% higher than in small companies, and approximately equal to (6% higher than) the use in large companies. It appears that starting at a revenue threshold of about $1 billion, companies find they need to use p-cards to reduce the number and burden of processing purchase orders for small items. 9.2.4 Experimenting with Auctions
Over the past four years, mid-sized companies placed little emphasis on auctions. Most did not even try auctioning anything. Small companies had similar results. It was primarily only the large companies that used auctions much throughout the tech boom. Over the next four years, mid-sized companies intend to make greater use of auctions, but still not as much as the larger companies.
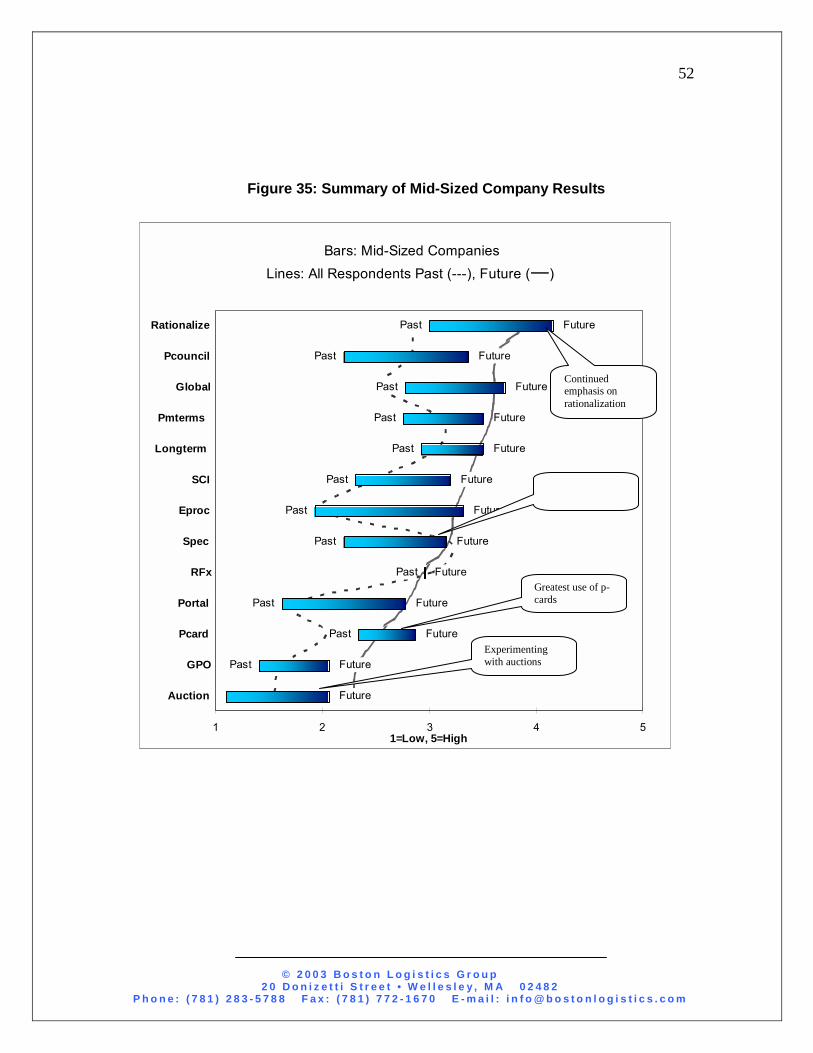
© 2 0 0 3 B o s t o n L o g i s t i c s G r o u p 2 0 D o n i z e t t i S t r e e t • W e l l e s l e y , M A 0 2 4 8 2
P h o n e : ( 7 8 1 ) 2 8 3 - 5 7 8 8 F a x : ( 7 8 1 ) 7 7 2 - 1 6 7 0 E - m a i l : i n f o @ b o s t o n l o g i s t i c s . c o m
52
Figure 35: Summary of Mid-Sized Company Results
Past
Past
Past
Past
Past
Past
Past
Past
Past
Past
Past
Past
Future
Future
Future
Future
Future
Future
Future
Future
Future
Future
Future
Future
Future
1 2 3 4 5
Rationalize
Pcouncil
Global
Pmterms
Longterm
SCI
Eproc
Spec
RFx
Portal
Pcard
GPO
Auction
1=Low, 5=High
Bars: Mid-Sized CompaniesLines: All Respondents Past (---), Future (―)
Continued emphasis on rationalization
Greatest use of p-cards
Experimenting with auctions
© 2 0 0 3 B o s t o n L o g i s t i c s G r o u p 2 0 D o n i z e t t i S t r e e t • W e l l e s l e y , M A 0 2 4 8 2
P h o n e : ( 7 8 1 ) 2 8 3 - 5 7 8 8 F a x : ( 7 8 1 ) 7 7 2 - 1 6 7 0 E - m a i l : i n f o @ b o s t o n l o g i s t i c s . c o m
53
9.3 Small Companies The study included over 30 responses from small companies (under $500 million of revenues per year). The average annual revenues of these companies is $300 million. Collectively the respondents are responsible for 54% of their companies’ external spend. Small companies are generally using fewer strategic sourcing tools than the other segments (compare the bars to the solid line in Figure 36). This is often due to a shortage of relevant skills, less predictable spend, and low overhead budgets. These companies share several similarities: 1) they often have little infrastructure set up for procurement; 2) purchasing is frequently transactional; and 3) an ERP system may have been introduced, but there are usually no major stand-alone procurement systems. The overall results presented earlier in this report apply to most small companies. In addition, several trends that are unique to the small companies are worth noting here. 9.3.1 Shortage of Skills and Information
One of the reasons why small companies have implemented, and expect to implement, fewer tools is human resource limitations. Because of financial uncertainty and constrained pay scales, very small companies often do not hire highly-paid purchasing professionals. Accordingly, sourcing is often handled tactically rather than strategically in these companies. Also, low levels of throughput do not always cover recurring and capital expenses, training, support, and ongoing maintenance that are required to operate advanced information systems. 9.3.2 Competitive Bidding: Changing the Shape of RFx
Although small companies said they expect to use RFx slightly less in the future than in the past, they still plan on relying on it more than any other segment. Competitive bidding with RFIs, RFPs, and RFQs is easy to administer and, if done on paper or through e-mail, has no investment cost. In contrast to many large and mid-sized companies that decreased their emphasis on paper-based RFQs because they automated or centralized the process, small companies do not need to centralize it and do not want to invest in automating it. Therefore, “RFx lite”is a more attractive solution to many sourcing needs for these companies.
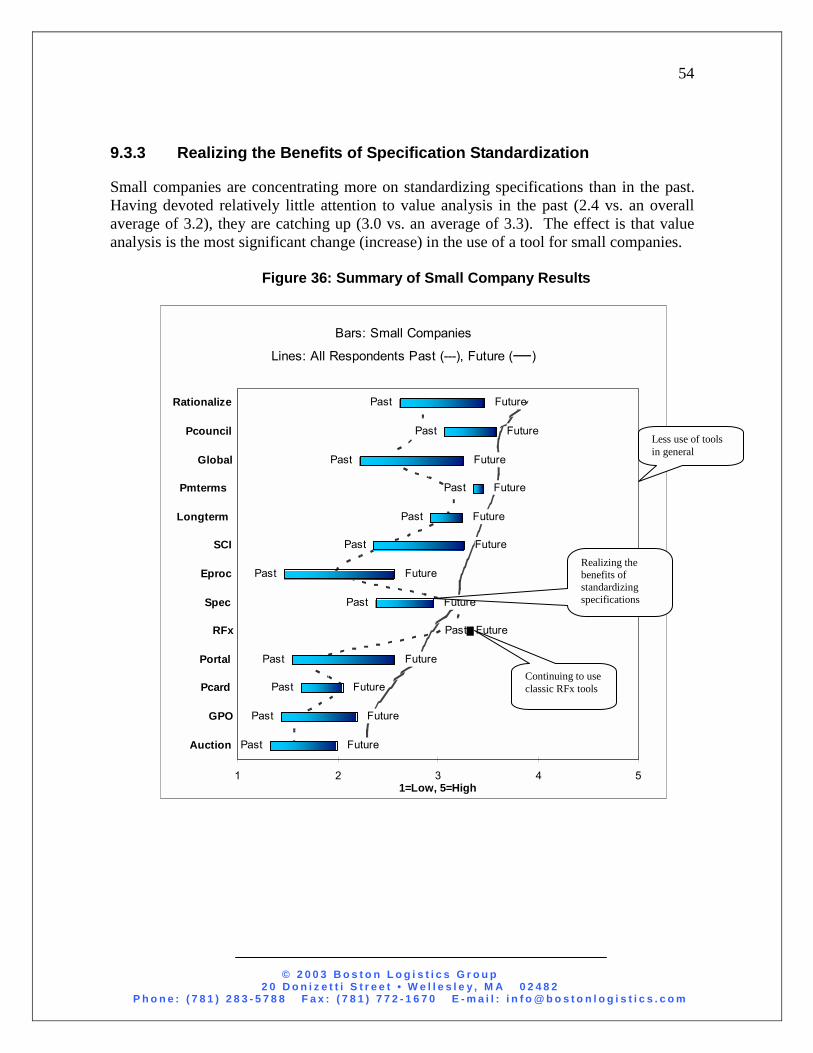
© 2 0 0 3 B o s t o n L o g i s t i c s G r o u p 2 0 D o n i z e t t i S t r e e t • W e l l e s l e y , M A 0 2 4 8 2
P h o n e : ( 7 8 1 ) 2 8 3 - 5 7 8 8 F a x : ( 7 8 1 ) 7 7 2 - 1 6 7 0 E - m a i l : i n f o @ b o s t o n l o g i s t i c s . c o m
54
9.3.3 Realizing the Benefits of Specification Standardization
Small companies are concentrating more on standardizing specifications than in the past. Having devoted relatively little attention to value analysis in the past (2.4 vs. an overall average of 3.2), they are catching up (3.0 vs. an average of 3.3). The effect is that value analysis is the most significant change (increase) in the use of a tool for small companies.
Figure 36: Summary of Small Company Results
Past
Past
Past
Past
Past
Past
Past
Past
Past
Past
Past
Past
Past
Future
Future
Future
Future
Future
Future
Future
Future
Future
Future
Future
Future
Future
1 2 3 4 5
Rationalize
Pcouncil
Global
Pmterms
Longterm
SCI
Eproc
Spec
RFx
Portal
Pcard
GPO
Auction
1=Low, 5=High
Bars: Small Companies
Lines: All Respondents Past (---), Future (―)
Less use of tools in general
Realizing the benefits of standardizing specifications
Continuing to use classic RFx tools
© 2 0 0 3 B o s t o n L o g i s t i c s G r o u p 2 0 D o n i z e t t i S t r e e t • W e l l e s l e y , M A 0 2 4 8 2
P h o n e : ( 7 8 1 ) 2 8 3 - 5 7 8 8 F a x : ( 7 8 1 ) 7 7 2 - 1 6 7 0 E - m a i l : i n f o @ b o s t o n l o g i s t i c s . c o m
55
9.3.4 Unique Sourcing Approaches of Companies Under $100 Million
In the study, there were 16 companies under $100 million in revenues per year. Companies this size often have an unpredictable spend, which complicates negotiation with large suppliers. Also, as one company with under $50 million of revenues noted, they don’t have the volume to pay for training and support for information systems that would support analytically-based sourcing decisions. Therefore, this company is a heavy user of portals and p-cards. 9.3.4.1 INCREASING USE OF PORTALS These companies said they would increase use of portals from 1.2 to 2.4. Smaller companies easily access and use Internet buying portals, including vertical market portals (“vortals”) that sell products to an industry, and horizontal portals that sell a certain type of product. They are often using transactional portals, as opposed to the sort of private ordering and configuration exchange that larger companies and companies with complex order management and assembly operations, such as those in the electronics industry. 9.3.4.2 PARTICIPATION IN GROUP PURCHASING ORGANIZATIONS The nature of small business brings volatile sales and production, and small lot sizes. With limited scale to leverage and no predictability to help suppliers reduce their costs, some small companies depend on group purchasing organizations to achieve scale and cost leverage. 9.3.4.3 SUPPLY CHAIN STREAMLINING Some smaller companies are experimenting with ways to bypass distributors in order to reduce delivery leadtime and middleman margins. Where this had been impossible several years ago, small package carriers and LTL companies are now offering international time-definite transportation and logistics services that can in certain cases allow a small company to bypass a distributor.
© 2 0 0 3 B o s t o n L o g i s t i c s G r o u p 2 0 D o n i z e t t i S t r e e t • W e l l e s l e y , M A 0 2 4 8 2
P h o n e : ( 7 8 1 ) 2 8 3 - 5 7 8 8 F a x : ( 7 8 1 ) 7 7 2 - 1 6 7 0 E - m a i l : i n f o @ b o s t o n l o g i s t i c s . c o m
56
10 DEVELOPING SKILLS FOR THE ERA OF MEGA-
SOURCING The 30% increase in the overall intensity of strategic sourcing efforts at the senior executive level is a formidable challenge for human resource management. Even at the current activity levels, the skills currently in place are often insufficient after years of de-layering. Plus, sourcing is becoming more strategic as supply chain integration increases, requiring a different and more robust skill set. Therefore, companies need to recruit, hire, train, and manage a new breed of procurement person – with cross-functional and international experience, and with CPO potential – to have responsibility over a large proportion of sourceable spend. In the recruiting and hiring stages, both the organization and the individual benefit from a good fit.
• The right hard skills set the minimum requirement. The price of entry for candidates is the right skills for a specific company and supply chain organization. These will certainly include a mix of traditional “hard” skills (such as math, computer modeling, economics, finance, or engineering), some “semi-soft” process skills (such as negotiation, strategy, or writing), and some “soft” skills (such as interviewing, presenting, and general people skills).
• Reference and background checks make a difference. During the dot-com era when money was loose, the Wall Street Journal was littered with stories of people – including high-powered professionals and politicians – who had mis-represented their backgrounds in order to get a piece of the action.
• Tough interviews work. Silence is an effective tool for learning how a candidate thinks; that way the candidate does the talking up-front.
In their early career stages, future CPOs need motivation, mentoring, training, and global exposure.
• Mentoring programs can make recruiting a competitive advantage, reduce turnover, and build skills for managers. A good mentoring program will give newcomers project opportunities, help them get technical skills, coach them with honest feedback, and offering them career advice.
• Professional certifications (CPM, CPIM, etc.) are a relatively inexpensive form of training, and can offer an immediate payback. Some companies are “anchor” sponsors of these certifications.
• Cross-cultural management opportunities are important for career growth in today’s global supply environment. International experience helps someone in global
© 2 0 0 3 B o s t o n L o g i s t i c s G r o u p 2 0 D o n i z e t t i S t r e e t • W e l l e s l e y , M A 0 2 4 8 2
P h o n e : ( 7 8 1 ) 2 8 3 - 5 7 8 8 F a x : ( 7 8 1 ) 7 7 2 - 1 6 7 0 E - m a i l : i n f o @ b o s t o n l o g i s t i c s . c o m
57
sourcing learn several skills, including modulating the level of personal interaction (“bow, kiss, or shake hands”), adjusting to different work paces (e.g., Latin America vs. Asia), and adapting to different action orientations (United States vs. Africa).
In later career stages, professional development requires continuing education and knowledge management. As with most education, the cost of not getting trained exceeds the cost of getting trained.
• Most professional certification programs involve credits for continuing education. Focused training in areas such as negotiation, terms & conditions, and financial analysis, which are regularly offered by Institute for Supply Management (ISM) or its affiliates, can support periodic skills upgrades.
• A records retention program can protect against information loss due to the eventual departure of an employee.
• Distilling specific knowledge into briefings or training sessions can help to share knowledge around the organization at any stage in an employee’s career.
© 2 0 0 3 B o s t o n L o g i s t i c s G r o u p 2 0 D o n i z e t t i S t r e e t • W e l l e s l e y , M A 0 2 4 8 2
P h o n e : ( 7 8 1 ) 2 8 3 - 5 7 8 8 F a x : ( 7 8 1 ) 7 7 2 - 1 6 7 0 E - m a i l : i n f o @ b o s t o n l o g i s t i c s . c o m
58
11 SELF-ASSESSMENT A generation ago, manual processes required large headcounts that obfuscated process inefficiencies. Functional silos sheltered procurement personnel from corporate view. Performance measurements were not precise enough to accurately measure the effectiveness of the procurement department accurately. And profit margins were sufficient to allow for significant overhead expenses, such as in the purchasing department.
Today, electronic connections with suppliers have eliminated clerical activities from the procurement department. Reengineering has eliminated functional silos, exposing process inefficiencies and disconnects. Benchmarks and ERP systems’ overhead costing capabilities track procurement efficiency. And profit margins are so tight that many companies have resorted to mandated cost reductions without a clear method for reducing the workload.
Even if procurement results are good today, supply chain partners may exert pressure to further improve procurement effectiveness because they need to reduce their costs. And due to the accelerating pace of change, it will be much harder to catch up later if a competitive gap forms. Therefore, every organization needs to assure it has implemented all the necessary strategic sourcing tools and initiatives.
One way to evaluate your strategic sourcing program is to measure how fully you leverage each of the major economic strategies: scale, integration, competition, and value. For example, Figure 37 and Figure 38 show the profiles of two study participants – one with a disproportionate emphasis on one strategic sourcing strategy, and another with a rounded, but weaker, program. Similar benchmarks are available by industry, commodity, and company size.
Another way is to use a “checklist” format. The attached Strategic Sourcing Self-Assessment sheet is a starting point for evaluating your organization’s opportunities. Total up the points corresponding to the numerical responses for all your answers, and interpret your score according to Figure 39.
A more comprehensive assessment can be completed with the help of an experienced Boston Logistics Group consultant. Please contact us if you would like to discuss your strategic sourcing opportunities.
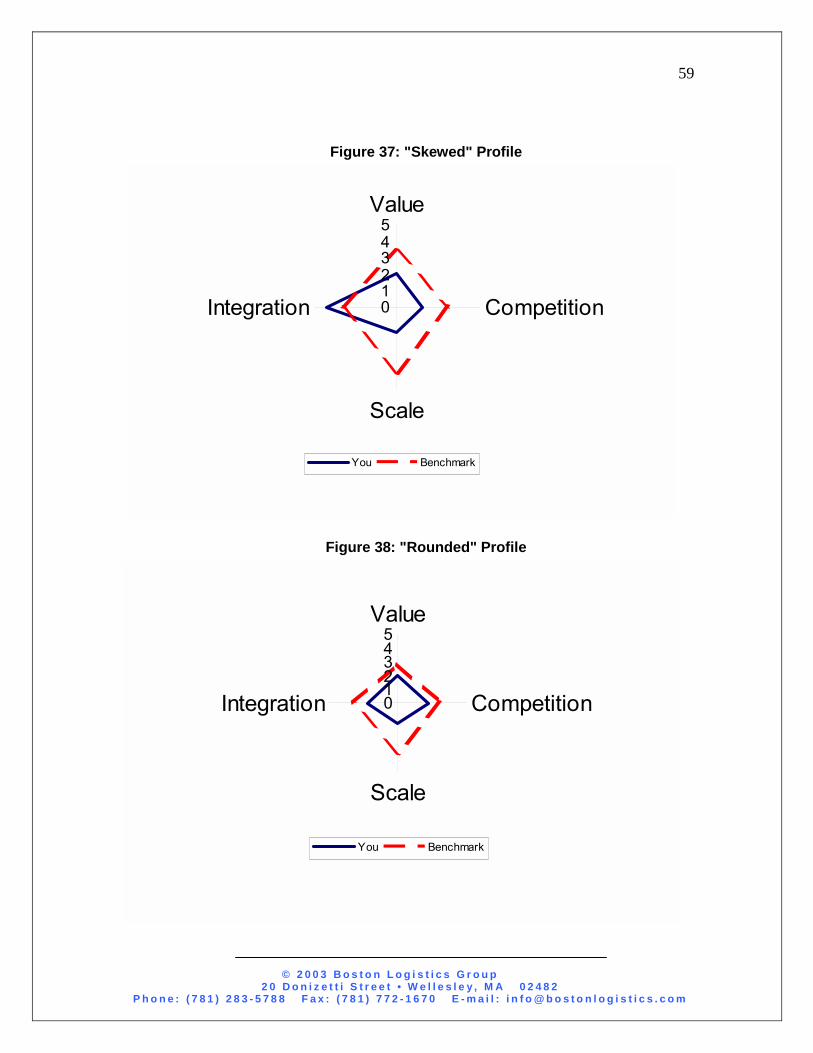
© 2 0 0 3 B o s t o n L o g i s t i c s G r o u p 2 0 D o n i z e t t i S t r e e t • W e l l e s l e y , M A 0 2 4 8 2
P h o n e : ( 7 8 1 ) 2 8 3 - 5 7 8 8 F a x : ( 7 8 1 ) 7 7 2 - 1 6 7 0 E - m a i l : i n f o @ b o s t o n l o g i s t i c s . c o m
59
Figure 37: "Skewed" Profile
012345
Value
Competition
Scale
Integration
You Benchmark
Figure 38: "Rounded" Profile
012345
Value
Competition
Scale
Integration
You Benchmark
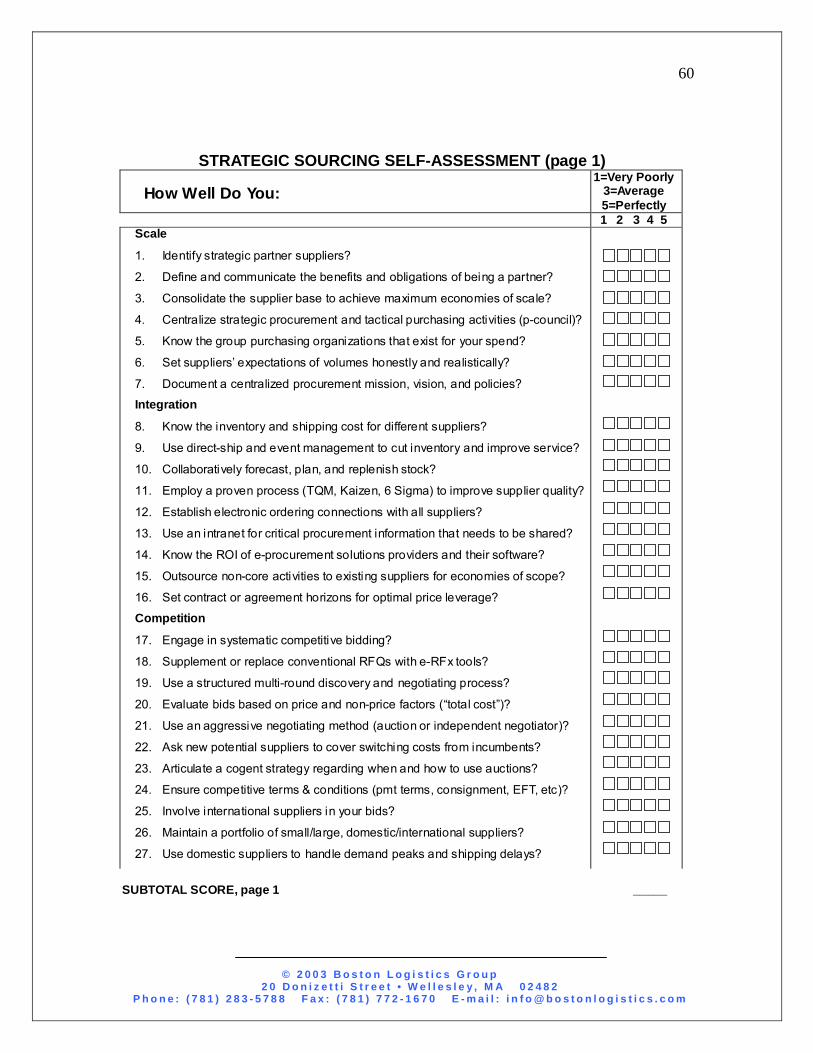
© 2 0 0 3 B o s t o n L o g i s t i c s G r o u p 2 0 D o n i z e t t i S t r e e t • W e l l e s l e y , M A 0 2 4 8 2
P h o n e : ( 7 8 1 ) 2 8 3 - 5 7 8 8 F a x : ( 7 8 1 ) 7 7 2 - 1 6 7 0 E - m a i l : i n f o @ b o s t o n l o g i s t i c s . c o m
60
STRATEGIC SOURCING SELF-ASSESSMENT (page 1)
SUBTOTAL SCORE, page 1 _____
How Well Do You:
1=Very Poorly 3=Average 5=Perfectly
1 2 3 4 5 Scale
1. Identify strategic partner suppliers?
2. Define and communicate the benefits and obligations of being a partner?
3. Consolidate the supplier base to achieve maximum economies of scale?
4. Centralize strategic procurement and tactical purchasing activities (p-council)?
5. Know the group purchasing organizations that exist for your spend?
6. Set suppliers’ expectations of volumes honestly and realistically?
7. Document a centralized procurement mission, vision, and policies?
Integration
8. Know the inventory and shipping cost for different suppliers?
9. Use direct-ship and event management to cut inventory and improve service?
10. Collaboratively forecast, plan, and replenish stock?
11. Employ a proven process (TQM, Kaizen, 6 Sigma) to improve supplier quality?
12. Establish electronic ordering connections with all suppliers?
13. Use an intranet for critical procurement information that needs to be shared?
14. Know the ROI of e-procurement solutions providers and their software?
15. Outsource non-core activities to existing suppliers for economies of scope?
16. Set contract or agreement horizons for optimal price leverage?
Competition
17. Engage in systematic competitive bidding?
18. Supplement or replace conventional RFQs with e-RFx tools?
19. Use a structured multi-round discovery and negotiating process?
20. Evaluate bids based on price and non-price factors (“total cost”)?
21. Use an aggressive negotiating method (auction or independent negotiator)?
22. Ask new potential suppliers to cover switching costs from incumbents?
23. Articulate a cogent strategy regarding when and how to use auctions?
24. Ensure competitive terms & conditions (pmt terms, consignment, EFT, etc)?
25. Involve international suppliers in your bids?
26. Maintain a portfolio of small/large, domestic/international suppliers?
27. Use domestic suppliers to handle demand peaks and shipping delays?
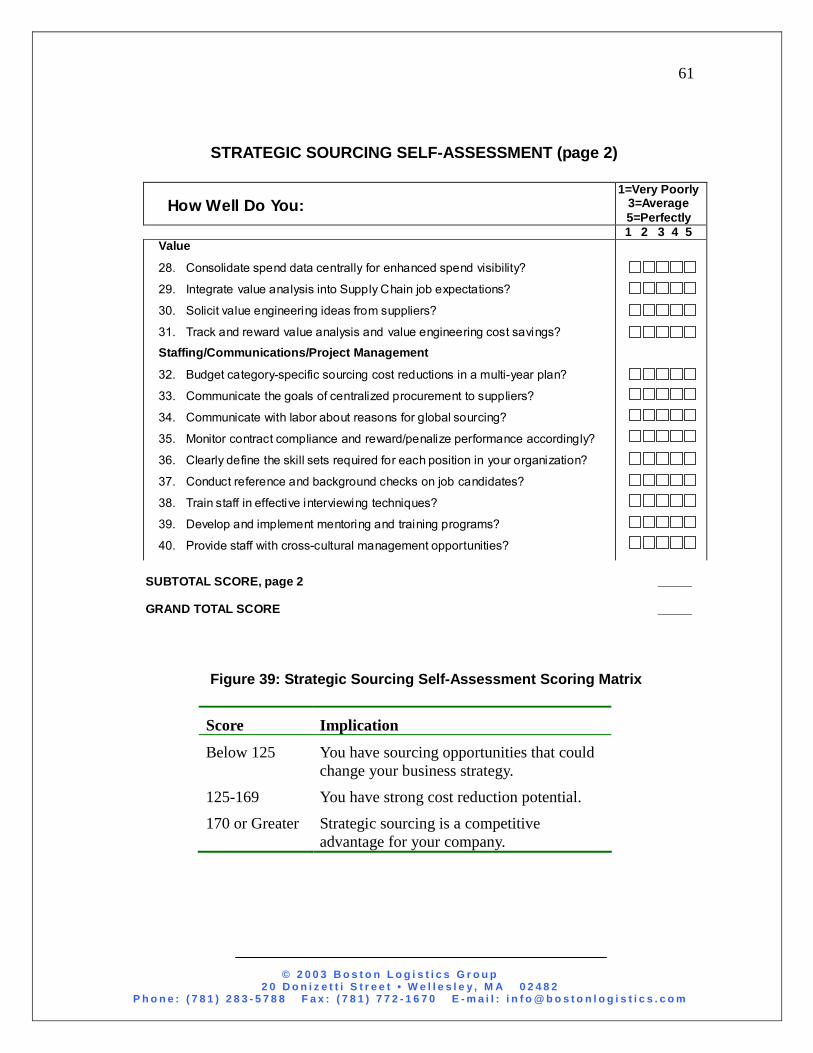
© 2 0 0 3 B o s t o n L o g i s t i c s G r o u p 2 0 D o n i z e t t i S t r e e t • W e l l e s l e y , M A 0 2 4 8 2
P h o n e : ( 7 8 1 ) 2 8 3 - 5 7 8 8 F a x : ( 7 8 1 ) 7 7 2 - 1 6 7 0 E - m a i l : i n f o @ b o s t o n l o g i s t i c s . c o m
61
STRATEGIC SOURCING SELF-ASSESSMENT (page 2)
Figure 39: Strategic Sourcing Self-Assessment Scoring Matrix
Score Implication
Below 125 You have sourcing opportunities that could change your business strategy.
125-169 You have strong cost reduction potential.
170 or Greater Strategic sourcing is a competitive advantage for your company.
SUBTOTAL SCORE, page 2 _____ GRAND TOTAL SCORE _____
How Well Do You:
1=Very Poorly 3=Average 5=Perfectly
1 2 3 4 5 Value
28. Consolidate spend data centrally for enhanced spend visibility?
29. Integrate value analysis into Supply Chain job expectations?
30. Solicit value engineering ideas from suppliers?
31. Track and reward value analysis and value engineering cost savings?
Staffing/Communications/Project Management
32. Budget category-specific sourcing cost reductions in a multi-year plan?
33. Communicate the goals of centralized procurement to suppliers?
34. Communicate with labor about reasons for global sourcing?
35. Monitor contract compliance and reward/penalize performance accordingly?
36. Clearly define the skill sets required for each position in your organization?
37. Conduct reference and background checks on job candidates?
38. Train staff in effective interviewing techniques?
39. Develop and implement mentoring and training programs?
40. Provide staff with cross-cultural management opportunities?
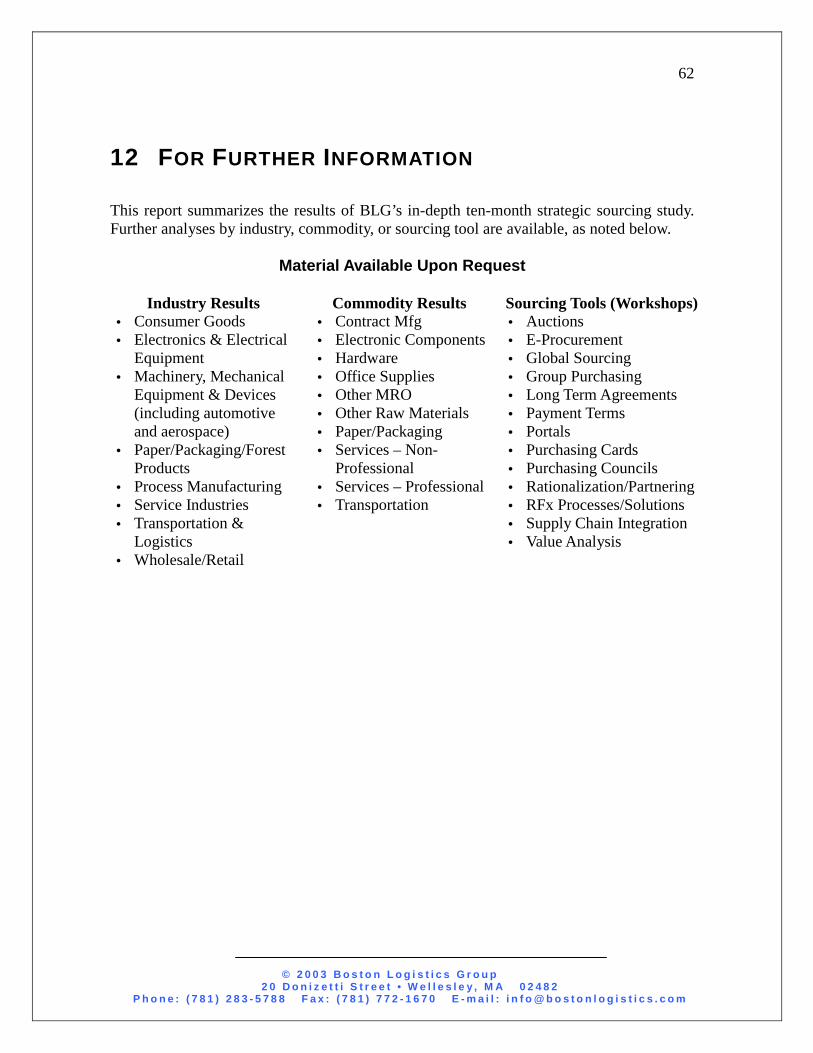
© 2 0 0 3 B o s t o n L o g i s t i c s G r o u p 2 0 D o n i z e t t i S t r e e t • W e l l e s l e y , M A 0 2 4 8 2
P h o n e : ( 7 8 1 ) 2 8 3 - 5 7 8 8 F a x : ( 7 8 1 ) 7 7 2 - 1 6 7 0 E - m a i l : i n f o @ b o s t o n l o g i s t i c s . c o m
62
12 FOR FURTHER INFORMATION This report summarizes the results of BLG’s in-depth ten-month strategic sourcing study. Further analyses by industry, commodity, or sourcing tool are available, as noted below.
Material Available Upon Request
Industry Results Commodity Results Sourcing Tools (Workshops) • Consumer Goods • Electronics & Electrical
Equipment • Machinery, Mechanical
Equipment & Devices (including automotive and aerospace)
• Paper/Packaging/Forest Products
• Process Manufacturing • Service Industries • Transportation &
Logistics • Wholesale/Retail
• Contract Mfg • Electronic Components • Hardware • Office Supplies • Other MRO • Other Raw Materials • Paper/Packaging • Services – Non-
Professional • Services – Professional • Transportation
• Auctions • E-Procurement • Global Sourcing • Group Purchasing • Long Term Agreements • Payment Terms • Portals • Purchasing Cards • Purchasing Councils • Rationalization/Partnering • RFx Processes/Solutions • Supply Chain Integration • Value Analysis