on ranch!, gumla & lohardaga jharkhand
TRANSCRIPT

REPORT ON
FOR OFRCIAL USE ONLY
FOREST RESOURCES OF
RANCH!, GUMLA & LOHARDAGA DISTRICTS OF
JHARKHAND
FOREST SURVEY OF INDIA EASTERN ZONE
KOLKATA 2001

~'OR OFFICIAL liSE ONLY
~==[w1illlXl'!l =zrum ~
=

The present Inventory of the forest resources In Ranchl,Gumla and lohardaga dlstnds were carried out dunng the year 1994-95 and 1995·96 With the objechveofevaluatmg the present status of forest resources With details of methodology, crop comp05lbon, extent of degradation of forest It also analyse the status of regeneraton, grazing inCidence and fire IflCIdence ThiS district was also surveyed under the name of Pre-Investment Survey of Forest Resources, Eastern Zone during the penod 1979-80 and 1980-81 The findings of tho present Inventory has been compared With the past Inventory of 1979-81
The recorded forest area of the undiVided Ranchldlstnd IS 3368.62 sq km. which IS 1844% of the geographical area. However, the green wash area as marked on the toposhoot has been taken as the forest area of the dlstndaccountlng332312sq km.
The survey revealed a total growing stock of 14.99 million m3 With an average volume of 46 74 m3 per ha The number of stemslha for Sat and Miscellaneous stratum has been estimated as 232991 and 159808 respec~vely The total number of stems IS 67 25 million IfI the district.
Officers and staff members of Eastern Zone of FOfest Survey of Indl8 who were entrusted With carrylllQ out the If wen tory and bringing out the report In the present fOfm deserve appreCiabon. The co<operation and help extended by the State Forest Department of 61har is thankfully acknowledged
It IS hoped that the report.WlIl help the State Government IfI planmng and proVide mpuls and faCilitate forest resource management In the State
Dr. J.K.Rawat) Director

FOREST SURVEY OF INDIA EASTERN ZONE
KOLKATA
Thlsorganlzahon IselClremely thankful and expresses its gralitudeto the
lorest Officers and field staff members of State Forest Department of Bihar who
rendered aU possible cooperation-to lhe field parties of our organization during
the survey penod Without which It would not have been possible 10 complete the
survey worll in SCheduled bme Sincere thanks are also conveyed 10 the Oy
CommiSSioner of Ranchl and other offiCials of Bihar administration who extended
all possible help to our field parties. Sincere thanks IS also elClended to the
Deputy Dire(;\ors of Forest Survey of India, Eastern Zone. Kolkata who WQrked In
the field area and also helped In final checking and publication of the report. My
thanks are alSQ expressed 10 an Officers and Staff merrbers of Eastern Zone of
Forest Survey of India who were entrusted With carrying out the forest inventory
and bnnglng out the report m Ihe present form
(MadhawaTrivedy) Regional Director

PART - •
(MAIN REPORT WITH MAPS,
CHARTS & DIAGRAMS)


., , ,

MAP OF INDIA showing project area In Ranchi Gvmla and lohardagadistrlCts
MAP OF BIHAR showing project area.
INVENTORY DESIGN
MAP OF RANCHI, GUMLA AND lOHARDAGA districts showing distribution of grids by stratum
MAP OF RANCHI. GUMLA AND lOHARDAGA districts shOWIng distribution of grids by importanl land use classes.

9:!AlliB.J BACKGROUND INFORMATION
11 INTRODUCTION .
Human eXistence IS inseparabty related to the forest as ptants protect and improve the environment In which man lives. The forest is not merely an aggregallon of trees but IS a biological unit having a socral organization of IIVlng communities at work. If there IS any disturbance In any species of plants, Its reperCUSSIOns are felt all the way through the whole kingdom of nature To the ques~on who can protect the trees, the answer would be those the tree protects. ltisthepeoplewhoshouldstepforwardfor the welfare of the forests To keep a healthy enVlfonment, people should take proper care of forest resources. FOf thiS purpose, a thorough assessment of the forest resources of an area IS an essential pre-requiSite. Keeping this in View, Forest Survey of India ( E Zone) has undertaken the current study on forest resources of undivided Ranchi dlstnct in the state of Bihar during the year 1994-95
1 2 LOCATION AND BOUNDARY :
The preseni InveotOf)' pertains to the forest resources of the erstwhile Ranchi dlstnci of the Bihar State which has now been split into three separate dlstncts VIZ Ranchl, Gumta and lohardaga The location 01 these three dlstncts are shown In the map attached The results and findln9S are, however. worked out on undiVided Ranchl district because of Similar forest composition and vegetallonstatus Therefore, we Will focus our attention into the undiVided Rancht district while elaboratmg the tit-bitS of Inventory area The undiVIded Ranchl district was the largest In the state Total geographical area of the district was 18266 sq.kms. It was bounded on the north by Hazaribag and small portion of Chatra distriCt. on the east by the district of Purulia in West Bengal and part of Pascl1im Singhbhum. on the south by the distnct of Paschim Smghbhum and on the west by Palamou district and the district of Ralgarh In Madhya PradeSh. The district lay between 22°20' to 23Q425'northlatiludeand between 84"O'to 85' 55' east longitude.
13 PHYSICAL FEATURES
ThestateolBlharlsphysicaHycharact9fIZedbyahugepJateau region which IS full of highlands, hills, valleys and waterfalls The district of Ranchl IS an ideal representahon of such type of features Basically, Ihe district consists of three broad nalural divisions, VIZ North-western pat region, lower Cholonagpur plateau and Ranchl plateau proper.

In the north-western part of Ranchi i.e. in the south of Palamou district there are a number of lofty flat topped hills, locally called as Pats wllich are capped by great mas5eS of laterite. The pal area has an altitude 012,500 to 3,000 ft. above the sea level. The highest areas in this region are Netarhal Pat, Samiti Pat and Galgal Pat. The crest of the Nelarhat pat is an undulating table and which is about 6 kms. long and 4 kms. broad. The lower Ranchi plateau has an average elevation 01500 to 1.000 ft. above the sea level. This region comprises a small area in the north eastern part 01 the Ranchidistrict.
The rest portion of the district, which is generally called as Ranchi plateau, has an average elevation of 2,000 II. above Ihe sea level. The highest part of this plateau region is comprised ola ridge lying about 16kms south west of Ranchi city. The Subarnarekha and the South Koet rivers originate from this ridge. The highest summits are found in the range of hills in the extreme western part, streching from Birpokhar. On the northern border, the prominent hills are Oria. Bardag. Hutar and Bulbul. The highest point in the district is Saru pahar lying in Bulbul.
In the central plateau region. some isolaled hills are found Notable among them are Marang Buru, the sacred hill 01 the Mundas and Ranchi hitl.
1.4 SOIL STRUCTURE:
The soil structure of a ptace is very much significant in forest composition investigations. It has a pmminent impact on forest type and vegetation cover. According to the broad dassilication 01 soils adopled by the Indian Agricultural Research Institute. the Ranchi district is covered by red soil. in general, except lor a small portion in the south eastern part which consists 01 mixed red and black soil. Again, according to a more detailed dassification done by the DirectOfate of Agriculture, Gov!. of Bihar, the soil of Ihis district have been divided into three categories, almost the entire eastern part 01 the district is comprised of red yellow light grey catenary soil, the western part is covered by upland grey yellow, grey heavy soil and a few portions of the north western part of the district is covered by hills and forest soils.
The principal rivers of Ranchi district are the Subarnarekha, thesauth Koel and the Sankh. The Subarnarekha emanates near Ratu in Ranchi plateau. It flows towards the eastern part allhe district unlil it descends from the Hundru plateau. Here the plateau ends abruptly giving rise to a 300 I\. long marvellous fall. the Hundu lall which is a great attraction for tourists. The south Koel river originates near Mandar in Ranchi plateau and floVis towards north-western part of tile district lor some distance. Afterwards, it turns towards the south near Lohardaga and then enters inta the Singhbhum district. The Sankh river rises in the nonh-western part 01 the district near the Rajadera plateau. II flows towards south along the western portion of the

district Another flYer North Koel rises at Tendar and flows towards north entering thereafter the Palamoudlstrlct
16 CLIMATIC CONDITION '
The district of Ranchl IS well known lor itS healthy aimate II has got a pleasant weather 10 companson to other parts of the state !Is high elevation gives It a uniformly lower range of temperature throughQut the year_ The temperature varies from 39 7G C to 6.3°C illS only dunng Ihe months of April and Maytllatthe temperaturenses to a great -height But since the nights are pleasant and the weather IS dry. the heat IS not so oppressive. The wmter season starts from the beginnmg of November The coldest months are Oecember and January. A strong cold wind blows throughout the month of January when the temperature reaches Its -minimum The mean annual temperaturem Ranchl is recorded to be 236GC.
The monsoon breaks up usually at the end 01 June. During the month of July and August. the ramfall is the heaviest Normal rainfall in the distnct is foond to be 1482.6 mm The humidity vanes between 66% and 54% during the year The rainfall In September averages over 228 mm and is significant from agricultural pomt of view Agam In the month of December and January the dlslnct receives some WInter rains which gives a chill weather dunng lhese days
1.7 FLORA AND FAUNA:
The district is endowed With a good llora and fauna. A considerable portion of Ihe dlslnct (23%) IS covered by forests. The forests are mostly found to be scattered throughout the district. The main type of forest is dry peninsular Sal With patches of mixed forest towards the north west and south west portions of the dislncts Sal trees are commonly found in this region. The other prominent l1ees are Terminalia lomentosa, Gmelina arborea, Anogeissus lalifolla, Buchanania lanzan. Boswellia serrata. Syzygium cumini etc. , Champion and Sethllas grouped the forests of thiS distnct mto 3blc (82a) Northern tropical fOOIsl deciduous forests and 4bJc2 northern tropical drydeaduous forests . The Madhuca latifolia trees are also widely found in thedislnct.butthesearemainlyconfinedtothehillarea.
Carnivorous animals are rarely found in the dishict. Tiger and Leopards are found al limes. generally coming from thedellser fore sIs ill Ihe adjoining dlStflctS of Palarnou and Singhbhum. Besides, the Bears. Sambhar. Chltal. Kotra. Nilgal and Hares are also commonly found Peafowls, Patndges and Quails are also available In the distHct Among the Reptiles. both poisonous and non·poisonous snakes are fovnd throughout ihedlstncl

1.8 MINES AND MINERAlS:
The district is weI! recognized for ils mineral resources. In Ihe north _ weslern parts ofllie districl. laler~e Is widely found. Basically. it is derived from the ancient lava of which the region was believed to be composed. In thesouthempartsOfthedistrict.archaeanlavasandbasicigneousrocksare found Besides. archaean schists including irOrl-Ofe series and also Kolhan series lie in the southern part of Ranchi district along these archaean lavas and basic igneous intrusive roelIs. The rest portion of the district is covered by gneisses and agranistes. These are supposed to be the oldest roells formed from the solidifica~on of the original crus!. The important minerals found in the district are Bauxite in the region of lohardaga, limestone in Babhane. Hoyar and Khelari. and China clay to the south of Raj Barkakana section of the Eastern Railway. Besides these, a considerable amount of coal. asbestos. berytes. stealile. ornamental stones and mineral pigmenls are also found In this district but they are of low economic value.
1.9 IRRIGATION FACILITIES:
The irrigation facility of the district is not adequate and well developed for a good agricultural crop throughout the year. The cultivators of this district generally depend on a good rainfall for their crop. Inthepre·independence days. the Irrigation received some attention at the hands of the erstwhile Zarnindars. But aftelWards, \he Brmsll government paid very little attention for overall development of irrigational facilites in this district. Theslreamsofthe district remain almost dry throughoot the year excep~ng the rainy season. As a result. they could not offer as much scope for irrigation as the perennial rivllffl do In the hilly area. That is why artificial irrigation is the only way of irrigation practised throughout the district. But the facilities under such irrigation is not found to ' be adequate enough in Ihis district. The only Iraditional sources of irrigation adopted here are wells. springs and ahars.
In the post Independence days, the government took some endeavour to implement several schemes of irrigation facilities. The important schemes executed by the Government so far are Aradih, Resa, Kita Nandani. Buchaop-a, Randli etc. But still the district· urgenUy requires even more facilities of irrigation through the implementation of major, medium and minor irrigation schemes to assure a regular source of water supply for a good paddy crop and other agricultural producls
1.10 DEMOGRAPHIC PICTURE:
Demographic pictUre of the inventory area is reflected by the data provided by 1991 Census. The poputation figures for the concerned three districts viz. Gumla. Lohardaga and Ranchi according 10 199' Census is presented here :

District Gumla Lohardaa Ranchi
Rura l 11 ,01687 257,125
14,83393
Urban 52,289 31761
7,30,655
Thus, 'the total population of undivided Ranchi district accounts to 36,56,910. Of these, 18,80,017 persons are males and 17,76,893 persons are females. Total rural population of the inventory area is 28,42.205 comprising 14,43.201 males and 13,99,004 females. On the contrary. total urban population 01 the concerned area is 8,14.705 comprising 4,36,816 males and 3,77,889 females.
The distribution 01 Scheduled castes and Scheduled tribes population in the individual three dislricts are as follows '
District Gumla Lohardaa Ranchi
The decennial growth rate of pop uta lion of these districts in relalion 10 the state between the period 1981 and 1991 is presented
Total 23.49 13.40 25.59 20.93
Rural 22.51 12.80 24.42 18.50
Urban 30.39 27.44 35.97 26.16
Literacy rate 01 age 7 years and above for the district of Gumla. Lohardaga and Ranchi is 39.67, 40.79 and 51 .52 respectively. Total number oftiterate persons of age 7 years and abova residing in the inventoried ar ea accounts to 13.69.313. Amon9them, male literacy percentage is 66.18 and female literacy percentage is 33,62.
The main languages spoken in these areas are Hindi, Bengali and Urdu. The religfon practised by the people iue mainly Hinduisll'\. Muslim, Christian, Sikh, Buddhism. Jainism etc. Of these, the proportion 01 Hindu population in the inventory area is highest (51.90%). The Christians (15.71%) and Muslims (8.35%) correspond comparatively less proportion of populalion inihese areas.

1.11 ECONOMIC PURVIEW'
The econolTllc purview of a place rellects the features of well. being of gen9fa1 people and the vanous modes of development through agncultureandlndustry In fact, Ihe economy of Ranchl dlstncl is supported by both agncolture and InduStsy. A large portion of land has been brought undercolbvabonWith lhegradualdeforestabonmthedlstncl. Thecullivable
' Iand In the district is diVided Into two classes., VIZ Don and ta~r. The don land are the terraced low lands on which mainly nee is grown and the tanr are the uplands useful to produce a course form of rice, millets, pulses and all-seeds Rice IS the main crop of the district Practically, It covers a considerable porbon of the sown area. Wheat, on the other hand, covers only a meagre porbon of the total gross area sown Among the non-food crops, Oil-seedS are grown Widely throughout the district From industrial side, the dlstnct IS well-developed because of Its nch mmeral wealth. In the post Independence period, Ihere has been eKtenSlve Induslnal and mining actlVlbes III Ranchi dlstnct The most Important among them is Heavy Englneenng Corporabon ( H E C.l , Hatia. The rapid development of the Ranchl city bears ample tes\lmony to the powetful mdustrial revolution commg III the wake of explOitation of Lhe distm;ts vast mineral resources. PreVIOUsly, the only industries In thiS district were the collection and manufacture of lac and the manufacture of lea. Besides, a few cottage mdustnes were carried on by the vi llage artisans. But now a number of smaJi scale Industnes have also been set up in the district. Candles, bidi, soap, metallic pots, steel matenals, etc are manufaclured here In rural as well as urban areas. nee mills are established which produce rice in good quantity Poultsy farms have boon opened at a number of places In the district Concerted efforts are being made to Improve the breed of the poultry in the dlslnct Among the large industnal establishments III thiS distnct, the notable ones are Heavy Engln-e9nng Corporation In Hatla, AsSOCiated Cement Co Ltd, Helban Cement Works in Khelan, Indian Alumlfllum Co. Ltd. Mur; Alumina Works In Mun, Govt, VaCCIne Institute In Ranchl, High TenSIOn Insulation Factory In Namkum, ElectriC Equipment Factory in Tatisllvai, USha Martin Industnes ltd In Tatisitval, etc. TOUrism has also become a profitable Industry In the dlslrlct at pl'esent beCause of ItS picturesque surrounding ptaces The chief centres ol lfade in Ihe district are Ranchl, Palkot, Gumla, Slmdega. lohardaga. Gobindpur and Bundu. The chief articles ofelCport are nce, vegetables, mahua, kusum,oilseeds.lac,hideand SkillS, tea, bones etc The prlnClpallterns of Import are sugar, sail , kerosene oil,coal,wheat, tobacco etc

1,12 TRANSPORT AND COMMUNICATION
'The dlstnct IS well served by a network of good roads. The dislrict has a good number of metalled roads and all the bl(l(;k headquarlers are connected by roads Two chief roads under Nabonal Highway 33 originates from Ranchl City, VIZ. Ranchl Bundu Tamar Chandil Jamshedpur and Ranchi Ramgarh Hazanbagh The other main roads emanating from the Ranchl City are Ranclll Chalbasa Jamshedpur, Ranchl-Netarhat, Randll OallO!lgallJ and Ranchl Gumla Smldega Rourkela. The other important roads maintained by the P W Dare Ranchr Hazanbagh, Ranchl Chaibasa, Ranchl Purulia, Ranchi B,rmllrapur, Gumta Chalnpur, Gu~a S,sal, Khunli Tamar, S,mdega Kardeg. Silh Mun etc Besides, the municipal roads are maintained by Ihe Municipal Corporabon al Ranchl and the municipalities at Lohardaga and Gumla ConSiderable length of village roads has also been constructed thrO\lgh Gram Panchyats The forest department has also been taken some endeavour to construct a few forest roads
The dlstnct IS well connected by a good ra ilway network. Ranch, ,s dlrecUyconnected by trains from lhe Stale Capital of Patna, In fact. the opening of Puruha Ranchl branch of the Soulh Eastern Ra,lway brought ra ilway to Ihe dlstncl The Gomoh Balkakana Oaltonganj section of the Eastern Railway which was slarted In lhe year 1927 runs for 26 kms. through Ranchld,stnct ,I t has a rail head at Ranch, road, siluated about 51 kms hom Ranch, c,ty, wilh Ihe opening of the Chandrapura Main $ecilon In
South Eastern Railway. Besides, allihese broad gauge lines, a lew narrow gauge Imes run from Ranch, 10 l ohardaga over a distance of 67 kms. The city of Ranch, 's also connected by train with Ihe Rourkello disllicl of Olissa.
Regarding airways connection. there 's an aerodrome al Hlnoo, near Ranch, CIty . RaJlchI IS COflnected with airways WIth several Important cities of India and thCfe are regular fl'ghts from Ranchl to Calcutta. Patna and Delh,

~
DESIGN AND METHODOLOGY
2.1 GENERAL :
The present sludy is concerned with a large spectrum of inforrnation on forest resources of the inventoried area. For this, statistical data on different categories of parameters are collected during the study. To collect the necessary informatioo on forest data, an approved manual of instructions for field inventory provided by the Forest Survey of India, Dehradun has been stricHy followed for carrying out the survey
2.2 INVENTORY AREA :
The area selected for the inventory should obviously be a declared forest area. Following areas are treatoo as lorest areas lorlhe purpose 01 the present inventory :
Area shown in greed wash on the Survey of tndia toposheels Alt such areas in which words such as thick jungle, open forests. bamboos etc. are printed
iii) All those areas indicated bydotled tine or spolted line ora pillar line as forest areas.
iv) Any other area reported to be forest area by local forest department.
MAP SELECTION :
The Survey of India mapsheets are generally considered for the inventory. The following toposheets were used during the inventory of forest resources in the undivided Ranchi district :
Scale
1:50,000

GAMPLING DESIGN
The design is syslemalic wUh a grid SIze of2,5'x 2_S' of latitude and longitude with two sample plots, each of 0_1 ha_area, selected from each grid one at random and Ihe other linked 10 the finot in the OPPOsite directIOn at an equal distance from the grid centre. These plols form the basIc sampling Units. Thus, 72 plots are laid out in a 10posheelWith 36 grids on 1: 50,000 sca!e. Hence one sample plot of 0.1 ha. represents about 10 sq_km. on the ground and the Intensity of samphng IS 0.01%. The length of each side of the square shaped sample plot IS 31,62 meters on the ground and 0.6324 mm (say 0.6 mm) on the toposheet of scale 1.50,000
Precision and accuracv 01 the survey
The result 01 the survey would al life p<eClsion level 01 95% probablhty with error hmit of:!:, 10% at the stale level
Marking of pia! oonter '
The method of marking of lhe plot centers 01 these two sample plots on the map In each grid of 2 5' x 2_5' IS as follows.
1) first, the length and Width of each gnd are measured to Ihesmallest convenient scale.
2) Ihe length oflhe side of the plot on the mapoorresponding to aO.l ha. square plot on the ground is calculated. Let X and Y be the length and width ofthegnd and S Ihe side of the plot
3) substract side S from bolh Sides i.e. find (X-S) and (Y -5) Let these numbers be X'and Y'
4) two random numbers. one In the range of 0 to X' and the other in the range of 0 to Y' are selected. These numbers are called x and yrespectlvety
5) half of the slCle of the plot (5(2)each are added to find x + 512 and y+SJ2

611< +S12 and y +Sl2wdl be the coordlnales 01 the center 01 Ihe firsl plotlOlh"fIJ;rI ...... "~ ... I,.,""I]II .... I,.,nh''''o1honOln .. ol'''''(So' '\h-W(!~t corner) of the gull asll ,ou,i!J", ut UIQaxm:
7Jthecenlerof theseeond ptot is located by joining the cenler of the first plot with the gfid center and eJdending th,s hne in the opposite d,rect,on
8)a poml al an equal distance from the grid center 10 the OPPosite d.roctlonismarked This W1t1 bethecenterol thesecoodpto!.
Lavlnaoutoltheplot ·
The plot center is the intersection 01 diagonals 01 the 0.1 ha plot. Diagonals are ahgned NW-SE and NE-SW measurmg 44.72 m each After having approached the plot center with the help 01 toposheet and reference pOint, corners of the ptot are fixed With respect to the plot center by measuring 22.36 m. In each 01 the directions viz. North-West. South-East. North-East and Soulh-West directions Irom the plot center. The North. East. South and Western extremibes 01 the plot are fixed by measuring 15.81 m from plot center In eacll 01 these direcllon
RegeneratlonSurvey .
In each plot. a 4 mt x 4 lOt square plot was chose" Cale was taken so thai the cen1er and diagooals of this plot coinCided with the center anddlagonalsoltheonglnalplot RegenerallonofdornlOantandcodominant species was counted and noted 10 the following ca tegories'
No.of seedllOgs 80rmore - Adequaleregeneratlon No. seedlings less lhan8 - Inadequate regeneration No of seedlings 0 - Absent
DATA COLLECTION
Dala from the field is coflected by an invenlory crew headed by a crew leader To IIlsll a plot. a prominent reference pOint IS selected in the VICInity of the plot center. The reference polnt.is a clearly viSible pOint both on the map as well as on the ground e.g a nalajunction or a idenlifrable naturat feature on the spot It IS marked by a peg with appropriate markings. For collecIJon 01 codified mformatlon from each sample plot. the lotlowmg forms are used

Plot ilUUloa'.:h 101111 : It yives all m .... oulll 01 deloil:, leY.llllill!J the approach to Ihe plot All tlie del;1ils from camp slle 10 the plol cClllcr are recorded A promment reference pomt alo09 wilh bearings is recorded whidl sef\les as an aid to leadlthe plot al a fulure dale
Plot descnpllon form The descnpbon or several parameters such as topography. sorl,land use ctass, foresltype, regcoeration, crop data etc are collected and recorded in this form for an area of2 ha. around the plot
Plot enumeration form ThiS form IS filled op for eadl plot. The detallsreCOl'ded are the name 01 the speCies, Its code and diameter Trees less than 10 em d b.h. and uMity less than 70% are usually flat recorded Border trees are counted "tN" when they touch NW-NE and NW_SW boundanes and conSidered 'our when they touch NE-SE and SW-SE boundarylmes
Sample tree form Data for trees With diameter 10 em. al1d above at breast height are collected from tile North-West quadrallt 01 the plot In this lorm, additional data e.g. tree height, bmkthickness, leng lhof clear bole, shape of the tree etc. are recorded
Ban*loo enumeration form : This form is designed for enumeration of ban*loo culms per clump Age and soundness of cullllS and clump Size are the parameters conSidered. Separate forms are used for clump formrng and flon-dump formmg bamboo
Bamboo weight form . To determine the green weight and dry weight of bamboo, thiS lorm IS malntailloo. For each speCies, mature bamboo are selected from each diameter class 30 em. loog pieces from the bottom, middle and top are selected and lherr green weighls recorded. These pleoas are properly documented and kept III IIle base camp and weighed every 30 days till a constant (air dry) IS Obtained
Since bamboo did no! occur Widely ( over large areas or with conspiCUOus presence ) In thiS distncl, data on Bamboo collected there has not been elaborately tabut<lled

~
DATA PROCESSING AND COMPILATION
3.0 GENERAL:
Data processing was carned out In the following three phases
I ManualproceSSIng II Input on computer and III Processing on computer
MANUAL PROCESSING
It Involves the follOWing steps
oj Proper documentation of the field information received bJ Codification of the Information In the field forms which has not
already been Incorporated. cJ Manual checking of the IflformatJon filled In the forms dJ Reconollabon of the discrepancies WIth the help of the field officerll
3.2 INPUT FOR THE COMPUTER
After manual checking. the mformatlon of the rleld forms was fed mto the computer The followmg data IS stored In the hard disk for onward processmg
1 Plot"descnptJondata 2 Plot enumeration data 3 Sample tree data

PROCESSING ON COMPUTER·
Processmg on computer mdudes the following steps
1) Venficabonofdata for the creation of dean fiteand lhetransferenl:e of the same to hardl1loppy disk
2) Conslstern:y I:heckmg of the data on compu ter 3) Correction of the data to remove discrepancies noticed dUring
oonslstencychecklng 4) TabulabOfl of plot-Wise stem dlstnbution and for the district as a
whole 5jPreparationoftabiesof volumedistribuilon
CONSTRUCTION OF VOLUME EQUATIONSrrABLES
No trees were felled dunng the sUNey for the district. It was decided that the volume equallons/tables which were used m the earlier sUNey and prepared by Forest SUNey of India. Eastern Zone should be used for the present Inventory
Following Volume equations were used 10 I:8ll:ulate the total volumes startrng from 10cm 0.8 H_(O 8) and above for !he standmg trees·
3.4.1 GENERAL VOLUME EQUATIONS.
Following equallons were developed earlier for the followmg species:
+0.0057489ID H
+000781171D H
Where, V=underbark volume of trees(ml jupto a limit of 5l:m.over bark
diameter O=overbark diameter ( m meter)al breast hlgh1 H:Helghtoflhetree(m)
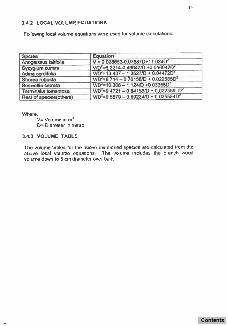
3.4.2 LOCAL VOLUME EQUATIONS:
FollOWIng local volume equations were used for volume calculations:
Where, V= Volume in m3
D= Diameter In metre
The volume tables for the above menhoned species are calculated from the above local volume equa~ons. The volume mcludes the branch wood volume dOWfl to 5 em diameter over bark

3 5 TREE VOLUME:
Volume of each enumerated tree was esllmated Wlth the help of volume tables I equabons and was used lor generation of stock tables by speCles and dlameterciasses
3.6 PLOT VOLUME.
Volume of each enumerated tree In a ptot when added up prOVIded lhe plol volume. These plol volume figures were the baSIS fOf esllmabonofsal"Tllllngerror.
3 7 ANALYSIS OF GROWING STOCK _
AnalySIS of grOWIng slock was earned 01.11 from plot dala and per hectare figures worked out for each stratum by species and diameter classes FOIiOWIng were Ihe Important tables generated for each stratum
1 Stemslha. for indiVIdual specres and ItS dlstnbuhon into diameter classes as 10-19 em. , 20-29 cm .. 30-39 em. etc
2 Total stems by species and diameter classes 3 Corresponding volume I ha by species and diameter classes. 4 Total volume by speCIes and diameter classes
3.8 ERROR
Staltslteal Inference IS Incol"Tlllete Without information on associated errors and the user of lI1e results wants to have some conlfol over Its magnitude
For estimation of sampll~ error some assumption was taken Into conslderahon. The sample was conSidered as a systematic cluster sample haVing two sample plots In each cluster. Whrle estlmatmg the sampling ermr Ihe sall1'le was conSidered to be of unequal Sizes and ratiO method of estimate was used smce In many gnds only one plot was enumerated.
Standard errors have been esltmated over the growing stock Tn each stratum and over the entrre protect area irrespectrve of the stratum

CHAPTER IV
RESULTS OF INVENTORY
4 0 GENERAL
Important and relevant findings from the present Inventory were generated and presented In this chapter Data has been analysed With a View to highlight the compo81bon and dlstnbutlon of trees In the distnct
OBJECTIVES' The main objectiVes of the inventory are as follows
1) Ptot data analysis has been carned out on vanous parameters like topography. aspect, grazlrlg IrlCldence , fire Incldence.regenefalion status etc. with the distnbution oflhe forest area
2) GrOWIng stock of the district IS also estlmaled on thedistnct level and separately for each stratum on the baSIS of COmpoSition and dlslnbubon of the lIee vegelabon In the area
42 FOREST COVER AS PER STATE OF FOREST REPORT '
The Invenlory relates 10 the forest resources of Ranchi. Lohardaga and Gumla dlstnc;1 of Bihar State.Thegeographical area and the e)((ent of forest cover oflhe above dlstnctsare given below :
~r~rap~~31 Ranchi 18266 Souree Stal.oI Fo .... IReport, ' 997, FSlpubhc3110n Di$tric!"; se breaku Isnol ava labk!
4 .2.1 RECORDED FOREST AREA'
FOfeslcover{!lII kml
Distritt wise and legal status wise forest area of reserved. protected forest and unclassed forest of the 3 districts IS summanzed below '
Pmlecle<t Unc las, e<t Forn i h~ Fo ... 1
141361 6 179454 l1 B717 130835 15960 26573
283295 16 336662 _"" , ... . _ .. u _tCl kI ,.n .. '
Perce ntaBe
53 27
" "

Area shown m green wash 0fI the Survey of India toposheets IS Ireated as forest area. Thelotal forest area of the distllct was calculated l.ISing 'dot grid' method which comes to 332312 ha. or 3323 12 Sq km. Henceforth, the mventoned forest area as calculated by 'dOl grid' method would be taken as the total form;t area of the dlstnct I e 3323.12sq. km
4.3 STRATIFICATION'
Stratification was based on proportional distribution of forested plots as per forest col1llOSlllon and land use dasses Two distinct strata have been formed In the dlslnct. Out of total 340 plots surveyed In undivided Ranchl district (now sptlt mto Ihree districts as Ranchl. lohardaga and Gumla) 224 plots were fouod to be Sal forest and 101 plots under mlscet!aneous
forest wtlefeas 2 plots are III Satal forest and 1 plot In bamboo forest which are merged with mlscetlaneous lorests. Thus. thetolal no. of ptotsfat!ing 'n ITlIscetlaneous become 104. FOfested plots which ale used as habitation. agncultural land and blank I.e. lorested plots but non forestry use Is 12 III number The abstracl of lhe same IS as under
SllatlflC;a\lon ,. Mise
Noo-Iorest use Total
No 01 Io~
'" "" " "" 340 ptots have been distnbuted over 332312 ha. forest area. One plot
reprasenls977.3882haForestarea. Forest area covered by 12 plols had been e.cluded while calculating the net forest area for glOWing stock esllmallon as those plots he In forest land but are under habitation and agncultural plols bul under non forestry use. The netlOiest area for gfowing stock estlmahon and Its distribution among the Sal and MISC. stratum is as under
"No ,

4.4 ANALYSIS OF PLOT DESCRIPTION DATA:
The plot descnp\lon dala was analysed on various paramelers of plot eg topography. aspect. sOil conSIstency. fi re inCidence. regenerabon. grazing InCidence etc. and the reqUIred Informabon were generated. The resul ts of the same With dlstnbul!on of the forest area IS summarized In the forlh coming paragraphs. Though the previous Ranchl district presentty spti ted mto throodlstricts as mentioned m paragraph 4_3 the plotdescnptloo dat aas wellasstemlha and volume dlstnbutlOO have been analysed coosidenng the undiVIded Ranchl district because of similar forest composilion of the three dlsltlcts
4.4.1 DISTRIBUTION OF FOReST AREA BY LAND USE CLAsses.
Oescnpuon
Open tree lorest
Shiftill9cu11ivatioo Areas under current as
"'!,""~;:"""'~tivatOon
NODI plolS

The above table reveals thai 46.76% of thp- forest Area arR moderAtely dense followed by open tree fOfest whi!;h accounts 42.36% of the forest area The peroontage of dense Iree forest is 1.76% only.
4.4.2 DtSTRIBUTION OF FOREST AREA BY TOPOGRAPHY:
Number of plots and distribution of forest area by topography with peroontage is furnished below '
No. 01 plom Forn i Percenlage a reaha.
3 2932 0.86 104 101649 30.59 230 224 799 67.65
3 2932 0.88
,",0 332312 100.00
Most of the forest area is under hi lly forest area . whiet1 constitute 67.65% whereas gentty rolting fOfest area constilule 30.59% oflheforesl area. Flat area Is only 0.88% and practically absent.
DISTRIBUTION OF FOREST AREA BY ASPECT:
The distribution of foresl area by variolls aspecl classes is given below
NO. 01 10m Foresl are .. ha Percenll a 19 18570 5.59 53 51602 15.59 24 23457 7.06 56 547,", 16,47 28 27367 8.23 47 45937 13.62 38 37141 11 .18 75 73304 22.06
Unrecorded Total: '"'0 332312 100,00

The above table reveals that forest area cove,s all types of aspect The foresl ofthedistrict have 22.06% of area having norttJ..-western aspect followed by south-eastern. north-eastern arid south-western aspect which constitute 16.47%.15.59% and 13.82% respectively.
4.4.4 DISTRIBUTION OF FOREST AREA BY ROCKINESS:
The pe«:entage offoreslby rockiness classes is as under:
No. of ploUl fo_tatea Percentage
" Hi h . 3910 1.18 Medium 59 57666 17.35 L~ 129 126083 37.94
146 144653 43.53 Unrecorded Total: 332312 100.00
The abova table reveals that medium to low rocklnp.ss is 55.29% whereas 43.53% forest area is under no rock zone.
4.4.5 DISTRIBUTION OF FOREST AREA BY SOIL CONSISTENCY:
Code 1 2 3 . 5
The distribution of forest area by soil consisterlCY classes is givenbetow :
Sollcon.tslenc No.olloUl Friable 41 SI' htl co oct 29' Com act 5 Cemerlled No soil Unrecorded Total : 340 332312
Soil consistency is slightly compact to the extent of 86.47% .in the district. This type of soil consistency which is' prevalent in most of the areas supports good forest aops. Friable and cofTllacl soil oorosU\ule 12.06% arod 1.47% oflhe forest area respectively

44.6 DISTRIBUTION OF FOREST AREA BY SOIL TEXTURE
Following table shows thedlstnbution Of soil texture.
No.of lots
10. 195 41
340
Forest area (
101648 190591 40073
332312
30.59 57.35 12.06
100.00
30.59% of the forest area of the dlstncl IS under clayey toam whereas loamy area 18 57 35% which occupy most of the lorest area. The sandy loam texture occupymg 1206% 01 the lolal area. Thus. the above table Indicates thai In thiS district 900d lexture soil prevail over majonly 01 the area
4.4.7 DISTRIBUTION OF FOREST AREA BY SOIL EROSION
Extent of soil erOSion In Ihlsdistncl is given below
Forestaroalha 11729 52779
255098 11729 977
332312
It IS noticed that 353% 01 the forest area is heaVily eroded In the distnct. Moderalelyeroded areacOflslilute 15.88% whereas. the greater part oflhe dlstncl fa!ts In the ITtIldlyeroded beltsconSlituting 76.77% of Ihe fore st area. Soil conservation measures me 10 be mlopled pmlicu!ouly ill lhe mcx.Iemtely eroded areas

4.4.8 DISTRIBUTION OF FOREST AREA BY lNJURIES TO CROP:
Injuries to CtOp as obsefVed during invenloryis.(lsunder :
Injuries to crop No.olplols
, '" 0.29
'" 310809 93.54
'" 0,29 2932 0.88 , "" 1,47
" 11729 3,53
'" 332312
The invenlory results indicate that the dislrict is subjected to maximum injuries by human agencies in the form of illicit feliing girdlings which constitute 93.54% of the forest area. Natural injuries due 10 wind damage and flood damage constitute negligible portion of tile forest area. Area free from injuries constitutes only 3.53% of the forest area, It is needless to mention that damage caused byinicit felling girdling reduceslhe value of the crop byway of reta rding the growlh of the crop. 1\ is, therefore. necessary that forest areas prone to damage by various ageocies shoutd be given protection as far as possib Ie.
4.4.9 DISTRIBUTION OF FOREST AREA BY FIRE INCIDENCE:
Percentage of forest area affected by fire incidence is given below
Code Item No. of plots Foreslarea Percentage h •.
Heav Moderate 9 8796 2.65
liht 156 152473 45.88 No lire 164 160292 'I~ Unrecorded " ~~~~~~ 3.23 Total : ". 100.00

The inventory resuits indica te no appreciilble incidence of heavy arid moderate fire in the rorests . Light lire occurs ill Ilic ti ishicl hOIn ti",c 10 lillie andconslitute45.88%01Ihearea. Prevenlivemeasures are 10 betaken to reduce fighl fire incidence. Areas free from any fire constilute 48.24%
4.4.10 DISTRIBUTION OF FOREST AREA BY GRAZING INCIDENCE,
Percentage of forest area damaged by grazing incidence is fumished
II is observed Ihat 12.06% foresl area is subjecled to heavy gra.::irog in the district. Moderate to fight grazing OCCUfs tOlhe extent of 82.35% whereas, the areas which is completely free from grazing is only 2,35% of the forest area. Preventive measures are necessary in the moderately gra.::ing belt
DISTRIBUTION OF FOREST AREA BY PLANTATION POTENTIALITY:
Plantationpotentialitylsnoticedfromthefol/OWingtable '
prantallon No . 01 plots lentla lil
FO,,"I ~"'~ tha.) Per<:e nlag"
Plantable 132 129015 36.62 Un lantable 11 10751 3.24 Not. licable 192 167659 56.47 Unrecorded 5 4667 1.47 Tota l: 340 332312 100.00
It is noticed thaI Iheplantable area is 36,62% of the total forest area 01 the district. Itis suggested that theplanlab!e areas shouk! be afforeSted as quickly as possible with choice of suilable species

4.4 12 DISTRIBUTION OF FOREST AREA BY INTENSITY OF REGENERATION'
IntenSity of regeneration IS noticed from the 101l0Wing table
-FOrHtarca - PerC·" '"ge (ha)
16 15638 4.7 1 203 198410 59.71 106 105558 3176
13 12706 3.82 340 332312 100.00
Adequate regenera~on constitute only 4.71 % of the tolal forest area It IS observed that inadequale regeneration IS 59.71 % whereas rt IS absent In 31.76% of forest area Thus, the overall poslllon of regeneralion IS not satisfactory
4.4.13 DISTRIBUTION OF FOREST AREA BY DEGRADATION
Degradation status 01 forest area IS sholWlin Ihelollowing table :

The survey reveals that majority of the areas are heavily or moderately degraded. It constitute 27.65%and 34.12% of the entire forest area of the distrid. A large portion of the fOl"esl area is also affected by mildly degraclation which constitule 35.59% of forest area lakiog into consideration the degradation caused by human agencies and natural calamity Oegradation due to biotic interference, like grazing. illicit felling etc. is 96.76% wflereas degradation due to natural calamity is 0.56% onty.
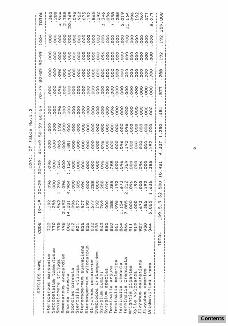
4.5 TREE DENSITY STUDY :
The distribution of stemslha. by species and diameter classes in different stratum have been calculated which are given in Table No. 1.1. to 1.2. (vide part II of this report). The number of stems/ha. by strata are summari~ed below '
SI. No. , Stratum 5,1
Salient features of this straturn are given below:
No.olsterns/ha. 232.991 159.608
i) There are as many as 80 identifiable species in this stratum The number of stems per ha. in this stratum is 232.991
ii) Trees are mostty concentrated in 10-19cm.diameter class accounting for 77.97%, followed by 15.46% and 4.39% in diameter classes 20-29cm.and 30-39cm.respectively.
iii) Stems are found to be present in all the diameter classes up 10 90-99crn.class.
Iv) Important species with sternsfha. and percentage 01 distribution areaslotlows
S ecles Shorearobusta
Buchananialanzan Terminaliacronulata
Dios ros melano Ion Madhucalatifolia
The species which could not be identified constitute 1.43% of the stems in thisstralum.

Salient features of this stratum are given below
i) The number of stems per ha. in this stratum is 159.808
ii) Trees are mostly C(If"lcenlrated in 10-19cm.diameter class accounting for S8.53%, followed by 20.34% and 6.56% in diameter classes2Q.-29cm.and3Q.-39cm.respectively
iii) Stems are found to be present in all the diameter classes up to 90-99 em. class but number of siems above SOcm.dia,class is 1.08%.
iv) Important species with stemsiha. and percentageofdishibulion are as follows '
There are as many as 82 identifiable species in this stratum. The fest of the species wtlich coutd not be idenlifled constilute 5.05% of the siems in thissllatum
4,6 TOTAL STEMS:
Totat number of siems by species and diameter classes in different strala are given in Table NO.2.1 and 2,2 (vide patl II oflhis rcpor l.) These are 5ummari<:edbetow:
Thus, the totat siems in the district is 67.25 mi llion in number.

NO. Of STEMSIMA. UNDER SAL AND MISCEUANEouS
NO. OF STBAlIIHA. FOR THE DOMINANT SPECIES UNDER
lHo. Of BnMSIKA. FOR THE DOMIMANT 8l>E.ClES UNDER) L MISCEUAHEOUS STRATUM I
~ == ,---. I J

--lOl'AlS1lMS..-HOI.JOffMIGPfMlAHTSl'fCIISUNDU
•• '''"'' .... 0 ... ' ......

Ihe (jl)lnin<llit SI)CI.IC~ ,lIId IllIlIilJcl il l :";.11 :;h.lh~11 h hll l li';l~ M J
below
Similady. the dominant speCIes and number In Misce(ianeous slralum lsgivenbelow.
Tolal 000 n05
4.7 VOLUME STUDIES
The distribution 01 volumelt1a by speCies and d.ameter classes in differentstralum has been caiculated and given In table No_3_1 . to 3.2. (vide Part II of this report). The volumelt1a.by stratum and dlstnct IS summarized in the subsequent paragraphs:
4.71 VOLUME STUDIES. STRATUM-SAL
Volume (ml ) l ha 45_958 48.447
The analysIs of the inventory data in Ihis slratumreveals Ihefollowill9 conclUSions
a) The volumelha In this stratum IS 45.958 m3 only. b) Most of the volume IS concentrated In lhe 10-19 cm.dl3meter class
which accounts 33.01% followed by 26.88% and 17.68% In 20·29 em.and 30-39 em_ dl3meler classes respectively .

c) The Volumelha.wilh percentage for some of the species are given below.
VOLUME STUDIES,STRATUM- MISCELLANEOUS
Salient features of this stratum IS given below.
a) The volumelha.isonly 48447 m3 in tillS stratuill b) Distribution of volume IS observed In all the diameter classes
MaXimum volume IS obtained In 20·29cm.dla.class fol!owed by 10-19em and 30-39cm.dla classes which IS 23.39%,20,07% and 18.15% respectively
c) The volumelha.with percentage fOT the volume oontrrbuting speaes IS furnished b elow:
Percenta e 9,09 7.23 4.57
Madhuca latifolla Schlelchera triu a
2,632 2.743 5.495 4.945
5" 566
11.34 10.21
4 8 TOTAL VOLUME
The 10101 volume ,n different stratum by specres and' diameter classes a re given In loble no 4 1 and 4 2 (vide port II of thiS report) These are summarized below
TotaL Volume 000m 3
10062 4924 14986

VOlIJMI:{Ml) IHA. fOR SAL AND MlSCEllANEOlIS STU,JUM
VO!.UMf(Ml)tHJo._ Of ,"f DOMINAfiITSPtCIU UMOfRSAi. .-....
VOUIMI(au) INA. Of nit DOMIN,..,. 5I'fClU UfitDlR MlSCfUAHfOUS SRAJVM
1 , , ,. ---------- -

--- -----.
--~~' ... -... , ..

Thus, the total volume in the district is 14.99 million m1 . The dominant species in Sal stratum witll total contribution is summarized below
Similarly, tile dominant volume contributing species in miscellaneous stratum is given below:
STANDARD ERROR :
Total Volume 000 m3 559 5Q~3 __ _ 448 356 314 279 267 225
Standard error has been calculated by ratio method of estimation for lhe growing stock of both Sal and Miscellaneous stratum separately and for the district as a wIlo/ewhich are furnished below:
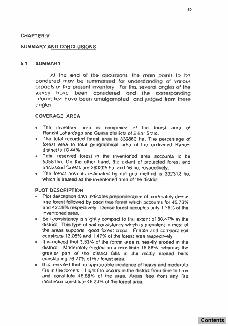
SUMMARY AND CONCLUSIONS
At Ihe end of the dr.;cu~~lOm, the moln pomts to be pondered may be summafl~ed 101 understonding of varIOus ospects of the pl"eseni InventOly f Ol thiS, several angles of the SUfvey hove been conSidered ond the corresponding !rllormallOn have been omalgamated and jUdged from these ongles
COVERAGE AREA
The rnventory area IS comprised 01 the forest area of Ranchi,Lohardaga and Gumla districts of Bihar SI<1te The total reCOl"ded IOfest area is 336862 ha. The percentage 01 forest area to total geographical area of the undiVided Ranchi distnctis1B44% Total reserved forest In the Inventoried area accounts to be 53551ha. On the other hand. Ihe extent 01 protected forest and unclassed forests are 283295 ha. and 16 ha. respeclively. The forest area as estimated by dot 911d method IS 332312 ha. which is treated as the inventoned area olthe district.
PLOT DESCRIPTION Plot descnptron data rndicales preponderanre of moderately dense tree forest fottowed by open tree lorest which accounts lor 46.76% and 42.36% respeclivet~. Delise lorest occupies olll~ 1,76% of the Inventonedarea. Soil consistency IS s.lightl~ compact to tile extent of 86.47% in Ihe district. This type of soil consistency Which IS prevalent III most of the areas supports good forest crops. Fnable am:! compact sOil constitute 12.06% and 1.47%of lheloreslarearespeclively It IS noticed Ihal 3.53% of the forest area IS heavily eroded in Ihe dlstnct . Moderately eroded area constitute 15.8B% whereas the greater part ollhe dislncl fallS in the mrldly eroded belts conshtuting76.77%oflheforestarea It is reveated that no appreciable rnCldence of heavy and moderale firernthelorests.Llghtfireoccurslnthetiistriclfromtililetotime and constitute 45.88% of lhe alea. Ateas free from any fire rncidence constitule 48.24% 01 the foresl area.

It IS observed Ihat 12,06% of fores t area IS subje<:ted to heavy graling in the district. Moderate 10 light grallng occurs to the extent of 82.35% whereas tile areas which is completely free from graling is 2.35% of the fOlest area
Adequate regeneration constllute only 4.71% of Ihe total forest area. It IS observed that Inadequate regeneratIon IS 59.71% wIlereas regeneration IS absent In 31 .76% of forest area. Therefore. the overall position of regeneration is not sallsfact ory
The data reveals that majority of Ihe areas are heavily or moderately degraded which conslitute 27.65% and 34.12% of the entlreforesl areaoithedlSlflct A large POrtlOfl oithe foresl area is also affeo::led by mIld degradatIon which constitute 35.59% forest area laking into conSIdera tIon the degradation caused by human agenCIes and nalural calamity Oegradatlon due to bIotIC interference like graZing, . IlliCIt felling etc. IS 96.78% whereas degradationduetonaturatcalalllltyisO.58%onty.
STEM ANA LYSIS
The number of .stems per heclare under the two recognIzed strata VIZ Sal and Miscellaneous In the coverage area are 232991 and 159.808 respectIvely
The stems under both tile strata are moslly concentrated In tower diameter dass Le.1Q..19cmJollowed by 20·29cm.and 30·39cm accordingly
Total number of stems as estImated in Ihe invenloried area IS 67 mllion In Ihe district. The two stratum Sal and MIscellaneous conslitutes5 1 million and 16mitlion nUIlIberoftrees separately
VOLUME STUDIES
Volume studIes reOeo::ts that per hectare volume in the coverage area under Ihe two strata Sal and MIscellaneous IS 45.958 ml and 48.447m3 respechVely.
The lotal volurne of hees In Ihe inventoried area Iseslimated as 15 millon m3. The volume of trees under the two sl rata is found to be 10062 ITIIllion and 4.925 million m3 accordingly

5.2 COMPARISON WITH THE PAST INVENTORY :
Earlier survey was carried out in undivided Ranchi district in 1979-80 and 1980·61. Findings of the previous inventory were compared with the present inventory 01 1994·95aOO 1995·96 so lar as the stemslila with respect to Sat and Miscettaneous stratum
a) Number 01 stemslha.by diameter ctass
OIamel9t' clan
In em
Ho.ol "ternslh •. SI.alum-Sal Area surveyed In
10-1!} 153,1184 181.652 ~--367&i- - -36,G21--_
Total : 204.76~ 23~,991_
No.of.temtJh".Stralum·Mi"c. A",a . urveyed ln
_2Q_5,750
The corfllara tive picture of the change in terms 01 stemsfha.duling Ihe course alone and half decade has indicated a substantial increases in Sal stratum to the extent of 13.78% whereas it surprisingly decre;BSes in Miscettaneous stratum to Ihe extent 0122.32%. It is also observed that increase or decrease 01 sterns occtJr particularly in 1G-19cm.diameter class only but when other diameter classes are considered the stemslha. remains more or less same

b) Volume I ha. by diameter class:
OlamMe. class
In em.
Volllmelm)lha.St,atllm.Sat A'ea BllfYeyedtn
Vorumetml/l>a.SI,alU~ A .... aurveyedln
1979-80&1910-811994·95&19"95.961979.80&1980-811994.95&1995·96
100+ 1.338
~~--48.~~45.958 --
There is no significant change in volumelha. in both the slfatum. The volumelha. slightly deaeases in Sal stralum doe 10 absence of siems in 100+ diameter d ass. The marginal increase in volumelha. in miscellaneous slratum Ihan 1979-81 is obviously due to presence 01 trees in 100+ diameter class which conlribute a substantial augmentation in this stratum. However the picture is very gloomy particulerty in 1Q-19cm.diameler class where there is e sharp dedine in respectofvolumelha. isconcetned. It isexpecled that achievement and effort taken by Ihe Bihar Government under various schemes integrated wilh sound silvicultural management would boost up the growing stock position in tower diameter dasses and Should be renected in Ihe distribution of trees in all the diameter classes in miscellaneous stratum within a short period.

1 D'StIlCt Cellsus Halldbook, Ranchi DIstrict, Senes _ 4, Bihar,Parts XUI -A & B, VIllage & Town Directory, Village & Town WIse Primary Census Abstract, Census o"ndla, 1981
2, Bihar, Stahstical Handbook 1982, Directorate of Statlslics and Evalualion, Government of BIhar.
3. F,nal PopulatiOIl Totals: Briel Analysis of p,imary Census abstract, SerieS-I , India, Papel"-2 01 1992, Census olll1<1ia, 1991.
4. Annual Administration Report for the year 1989-90 _ 1992-93. Govemment of Bihar. Compiled in the Statisbcal Seclion, Forest Research DIvision, Bihar, Ranchi
S. Fmat PopulatIon Totals, Series - r, Paper-I of 1992, vot. It , Census 01Indl8.1991 .


0' IS '
76']0'
FaRES T SURVEY OF INDIA INVENTORY om
J
."
OIAGRAM-l WMl!i&1 511UWING IDENTIFI(ATiON Of ·GRIDS ON 160000 OR 1:63360 S(ALE TOPO SHEETS.
DIAGRAM SHOWING LAY OUT. OF PLOT

MAP OF BIHAR sc ale:-1·2S~
SHOWI~G PROJECT AREA IN HATCH

~ ~ -
LJ LL.
ZO <tz 0:: 0
Iu..=> o~ a..t/j <t5
. ~ L:J
Z
3 o :x: Vl
I o.ij ...J 4: w Vl
d It A
-----.~ ~
a It
I I
<i
Vl
Vl

0 0
g
I~I 0..
I{-t I I~
4-
~
I 'l
¥1
0 0
1';
~
111,1
0 Ln
,~
~~~
c ::> :i1 ~ ... ;a!;
i , '0 &LIt .... ~
u.~o-
~ ... !l1 ,_

PART - II
(STATISTICAL TABLES)

List of Tables
.Tabl etlO. contents
stefOs/ha.(inno . ) bysp<!ciu aoodiafOnef"c:lasses (1nOll.)
Toul n_s (in no . ) by
species and diametef" <;lasses (;na.)
vollllOl! (in II') perhecu re by species and di_terduses (1nOll.)
Toul volUllle (in "") by species anddiameterclassu (incn.)
1,2,3
4.5,6
7,8 , 9
10,11,12
lJ , U,lS
16,17,18
19,20,21
22,13,24

11!111111111 II •
"'''''''''' .... -.............. ....... ............. : g 8~
:::::::::::::::::::::::::::::Ii :j ~~g~mmgg~~~~~g~~§~gggg~g§ j ~ ~ ~§§~~g~g~~~~~~~~k§~~~~§~§§§g~j~ ~~~~g~~§§§§§§§§§~~§~~~g~g~~~~jl ....................... . . .. .. : g gggggggggggggggggggggggggggggj:
~~~~~~~~~~~~~~~~~~~~~~~~~~~~~!! =& ggll~~~II~~~g!lg~~§§§II~~§§II · il !¥ §~~§~~~~~~§~§§§§§§§§§§§llgg§§ j ~ ~~ §§§§g§g§§§§~§§ §§§§I§§§§§§§§§li
i£~~§~~~~~~~~~ ~~~£~~~~~~*i~~ i ~

~ ~~~~~~~~~~~~~g~~~~~~~~~~~~~~~~
~ ~~~~~~~~~~~~~~~~~~~~~~~~~~~~~~
~ ~~~~~~~~~~~~~~~~~~~~~~~~~~~g~~
~ ~~~~~~~~~~~g~~~~~~~~~~~~~~~~~~
~ ~~~~~~~~~~~~~~~~~g~~~~~~~~~~~~ N
~ ~~~~~~~~~~~~~~~~~~~~~~~~~~~~~~

I ~~~~~~~~~~~~~~~~~~~~~~ ~
~ ~~~~~~~~~~~~~~~~~~~~~~ ~
J g~ ~ ..
l~~ g'i
:d.~
~hm~ ?,~ .~: ~ ~ ~ g~
·::1; ~~q::1: ~ ~';1
1~ 1~~ ~}~~~~~ 19J ~t:!

II I ::::::::::::::::::::::::::::::: ~~ ~ .. . .... . .. . ..... . ..... ...... .. .
~~ ~ ~~~~~~~~~~~~~~~~~~~~~~~~~~~~~~~ ~ ~~~~~~~~~~~*~~~~~~~~~~~~~~~~~~~ ~ ~~~~~~~~~~~~~~~~~~~~~~~~~~~~~~~
~ ~ ~~~~~~~~~~~~~~~~~~~~~~~~~~~~~~~
i~ ~ ~~~~~~~~~~~~~~~~~~~~~~~~~~~~~~~ ;: ~ ~~~~~;~g~~~~~:~~m~~~~~~g~~~3~~g
~~ § ~~~~~~~;~~~~~!!~~§~~~~~~~~~~~~~
!
!lllill jlml!l!

~mmmmmmmmmm
:mmmmmmmmmm ~ gggggggggggggggggggg~gg~gggggg
~ gggggmmgggggggmmmm ~ g**ggggggggggggggggg~gg*g*gggg
§ ~~~~~~~~~~6~~~~~~~~~~~~~~~~~~~ ~
!!llil lililill!!l!lllmllill
~ ~~~~~~~~~~~~~~~~~~~~~~ "'N~ _
§ gggggggggggggggggggggg
~ mgmmmmmm ~
~ ~~~~~~~~~~~~~~~~~~~~~~ ~
* ~~~g~~~~~~~~~~~~~g~~~~ ~ f gggggggggggggggggggggg ~ ~ ........ . . . .. . ...... .. .
~ ~~~~~~~~~~~~~~~~~~~~~~ 5 * ~~~~~~~~~~~~~~~~~~~~~~ :
~ ~~~~~~~~~~~~~~~~~~~~~~ : ~ ~re~~;~~~~~~~g~~~~ggS~~ ~
- .; ~

00000000000000 0 ~ 0 0 0 0 0 0 000 0 0 0 0
0000000000000000000000000000:;:
~
o 0 ~O 00 0 ~ 0 0 0 ~ ~ 0 0 00000 00 00 0 00 0 0
000000 0 ~ 0 0 0 0 ~ 0 ~ 0 0 0 0 0 0 00 0 ~OOO ~
00 j 0 0 OOj 0 0 0 O~ 0 ~~ 0 00 0 0 0 0 0 ~ 0 0 0 ~
00 j 0 OO~~O 0 ~ 0 §~~~ 00 00 0 0 0 0 0 0 0 ~ ~

00000 00 ~ 0 0 0 0 0 0 0 0 0 0 0 000 0 0 00 0 0
0000000 0 ~ 0 0 0 00 0 0 0 0 0 00 0 0 0 0 0 0 0
000000 0 ~ 0 0 ~ 0 0 0 0 0 0 0 O~O~O 0 0 0 00
~ ~ ~ ~ 0000000 0 ~ 0 ~ 0 0 0 0 0 0 0 0::: .0 ~ 0 0 00 0 0
~ ~ ~ ~ 000 0 ~O 0 0 0 ~ ~ 0 0 0 0 0 0 ~ O,! 0 0 0 0 000 0
~ ~~ ::: § o ~ 0 0 ~ 00 0 ~ 0 ~ ~ 0 0 0 0 0 ~ ~~O ~ 0 ~ 0 0 ~ 0
i 0 0 0 0 0 O 2 ~ 0 ~ 0 0 ~ 0 0 0 ~ ~ ~ o~ii 0 0 ii

000000 0 ~ 0 0 0 0 0 0 0 0 0 0
~
oo~oo 0000000000 0 OO~O 0 0 0
~
OO~O~
~ ~ ~ ~ ~ ~ i ~ ~ 0 ~~~~~~ ~ ~ ~ ~~E~~ ~£~* ~ ~ ~ ~ ~ ~ ~:

0000000000 0 ~ 0 0 ~ 0 00 0 00000 0 0 0 ~ 0
~ ~ :;: o 0 ~ 0 O;! 00 00 0 ~ 0 0 ~ 0 000 00000 0 0 0:; 0
€ £ ~ ~ ~

o OO~O 0 0 0 0 0 0 0 0 0 0 0000 000 00 0 0 00 0 0 0 0
000 0 ~ 0 0 0 0 0 0 0 0 0000 0000000 0000 0 0 0 0
o 0 ~ 0 0 0 00 00 00 0 0 00 0 0 0 0 0 0 0 0 0 ~o 0 00 0 0
000000000000000000000 0 ~ 0 0:ll 0 0 0 00 0
~ 0:
o OOO~ 00 00 0 0 0 0 0 0 0 0 0 0 0 0 0 ~ 0 0 0 0 0 0 0 0 0
0000000000000000000000 .. 0 0 '(10000 0 0
::: .: ~ ~
00 0 ~ ~ 0 0 0 0 000000 0 0 0 00 0 0 ~ OO~O~OO 0 0
o 0 ~ 0 ~ 0 0 0 ~~ 0 0 ~ 0 ~ 0 0 0 ~ 0 ~ 0 ~ 0 0 ~ 0 0 0 0 ~€
o ~ 0 €~~ 0 O~ 0 ~ 0 0 0 ~ 0 0 0 i 0 ~ 0 ~ 0 0 ~ ~ ~ 0 ~~ 0

000000000 0 O~ 00 00 0 0 0 0 0 0
00 ~ 0 0 0 0 0 0 0 0 0 0 0 0 00 000 0 0
o 0 ~ 0 0 0 0 0 0 0 0 0 0 0 0 0 0 0 0 0 0 0
o 0 ~ 0 0 0 00 0 OOOO~O 00 0 0 0 0 0
o 0 ~ 0 0 0 0 0 0 0 0 0 0 0 0 O~OOO 0 0
o 0 ~ 0i 0 0 0 0 0 0 ~ 0 0 0 ~ ~ 00 00 ~
~ 0 ~ 0 § 0 000 00 ~ 0 ~ 0 ~~ 0 0 ~ 0 ~
~o~~~o~~o~o~~~~~~~~o~~

~ gg~ggg~~gg~g~8~~ggggggggggg~~8
f g8~m8~g8~m~~8ggg88~g88g~~8 ~~ § ~~re~~~~~;~=3~~!!~~~§§~~~~2~E~~
~ ~
!IIIIIII 1111 111111II

~ gg g g ggg g gggg ggg g 8 ggg g g g ggg g g gg gg
~ g g ggg g ~ g ggg ggg ggg ggg ggg ggg m ggg : gggggggggggggggggggggggggggggggg ~ gggggg g ~ g g ggg g g g g g g g g g g g ggggggg g
~ ~~ ~ ~ ~ ~ ~ ~ ~~~~ ~ ~ ~ ~ ~ ~ ~ ~ ~ ~ ~ ~ ~ ~ ~ ~ ~ ~ ~~
~ ~ ~ ~ ~ ~ ~ ~ ~~~ ~ ~ ~ ~ ~ ~ ~ ~ ~ ~ ~ ~ ~ ~ ~ ~ ~ ~ ~ ~ ~ ~
~ gg8ggg;mggmmmmm~m~
f mmmm~m~~~~mmWi'ig~

~ 8 g § 8 ~ ~ ~ ~ § ~ ~~ ~§ ~ ~~ . .......... .. ~ ....
~ ~~~~~~~~~~~~~~~~~~~ ~
~ ~~~~g~~~~~~~~~~~~~~ ~
~ ~~~~~~~~~~~~~~~~~~~ 5 ~ ~~~~~~~~~~~~~~~~~~~ 5
~~~~~~g~~~~~~~~~~~~ ~

~i~~!~~!~~~~~~~~~~~~~~~~~~~~~~~~
g! mmmmmmmmmm ~~ ;igg~ggggggg8gg888g88ggg8ggggggg il iigggg8ggggg8~~~~~~ggggggggggggg n ~ i gg~mmmmmmmmm ~~ ~! ~~~~~~~~~~~~~~~~~~~~~~~~~~~~~~
il::::::::::::::::::::::::::::::
~i~~~~~~~~~~~~~~~~~~~~~~~~~~~~~~ ~ f!~~~~~~~~~~~~~~~~~~~~~~~~~~~~~~ ~i ~i8~~§~;;g8~~~~~~3~~~~~re§8g~E0~8 S~ ~! -< ~
~H ;,! ·~~~.~~mmmE§~~~~:~~mi~i
; . ,i!~ ~ ..
Il!!!llllllllilllllllliil!lllll

~ g g ~ g g g g g gg ggg gg g g m g gg g g g gm g g
~ mmmmmmggggggggmggg
~ ~~~~~~~~~~~~~~~~~~~~~~~~~~~~~~~~ ~ ~~~~~~~~~~~~~~~~~~~~~~~~~~~~~~~~
~ ggggggggggggggggggggg~g8~ggggggg
~ gg~~ggg§gggg8gggggm~mm8m
.. " " I.. "
1!!IIIIIII!llj!!lil!lllmllllil

~ ~~~~~~~~~~~~~~~~g,~g.~~ ~
~ ~~~~g~~~g~~~~~~~~~~~~ 5 ~ ~:~~~~~~~~~~~~~~~~~~~ 5
~ ~~~:~~~~~~~~~~~~~~~~~ ; ~ ~~~5~~~~~~~~~~~~~~~~~ :

000000000000000 :: 00 0 0 0 00 0
~ 000000000000000000000000
00:: 00 0 0 ~ 0 0 0 ~~ 0 0 0 0 0 0 0 0 0 00
~ ~ ~~ 000000 0 ~ 0 0 0 0 ~ 0 ~ 0 0 0 0 0 0 0 00
~ ~ ~
OO~OOOO!OOOO~O~~OOOOOOOO
~ ~ ~;:::;:
00,1, 00 O::le 0 0:ii 0 ~ ~ ~ ~ 0 00 0 0 0 00
~ 31~ ~ ~~~~

00000 '000000 0 ~ 0 0 0 0 00 0 0 0 0 0 0 ~ 0 0 0 0 0 0 0 0 0
0000000", 0 0 0 0 0 0 0 0 0 000 0 0 0 000 000 0 0 0 0 0 0
000 0 ~ 0 0 0 0 000 0 ~ 0 0 0 00 0 0 0 0 0 0 0 0 0 0 0 0 0 0 0 0
0000000000 00 ~ 0 0 ~ 0 0 0 0 0 00 0 ~o I 0 0 0 0 0 0 0 0
00000000000 00 ~ 0 8 0 0 0 0 0000 ~O ~OO 0 0 0 0 0 0
~ N '; ~
gO 0 0 ~ 0 0 0 0 ~ 0 0 0 0 ~ ~ 0 0 0 0 0 0 g o~ 0 0 0 0 0 0 0 0 0 0
aO 0 0 ~O~ 0 0 § 0 0 0 ~O~ aOO 0 0 0 a ~ ~ 0 ~ 0 ~ 0 0 ~ O~ 0
o 0 O~ ~ ~ 00 000 0 ~ ~ 0 lOOl 0 0 0 ~~§ 0 ~~~ 0 0 ~ ~ ~ 0

OOO;:!; 0 0 000 0 0 0 0 00000 0 00 0
~
~ 0 0 g:! 0 0 00 0 0 0:ll0 00 0 0 0 0 0 0 0
~ ~ ~ ~oo OOOOOOOOOOOOO~OOOO
: ~ OOOOOOO~O~§O~~OOOO
J ~ .~ .. . ~ .'l! ~
.~ f. ~ !:~ : § ;~~ ~ .~ ~ , ~ ~ .. ""u ~ ~ ~ ~ , I :~:~:~:~
H !il!~jjj ~t~ ~~ '::::-'::5:

00 .... 0 0 0 0 0 0 0 00 0 0 0 0 0 0 0 0 0 0 0 0
o 0 ~ 0 00 0 0 0 0 0 0 0 000 0 00 0 0 0 0 0
0000000000 0 ~ 0 0 ~ 0 0 0 0 0 000 0
o o~ 0 0 § 0 0 0 0 0 ~OO iOO 0 0 0 0 0 0 0

0000000 0 ~ 0 0 0 0 0 0 0 0 0 0 0 0 0 0 000 0
000000000000000000000000000
~ 0000000 goo 0 0 0 0 0 0 0 0 0 0 0 0 00 0 0 0
~ 000000000000000000000000000
000000000'" 0 0 0 0 0 0 0 0 0 0 000 0 0 0 0
00 0 ~ 0 0 0 0 ~ ~ 0 0 0 00 00 0 0 0 0 0 00 0 0 0
~ § 0 ~ ~ 0 § 0 ~ ~ ~ 0 0 ~ 0 ~O 0 0 ~ 00 0 ~ 0 ~ 0

000000000000000000000 ~ 0 0 0 0 0 0 0 ,0 0 0
00 0 ~ 0 0 00 0 0 0 0 ~ 0 0 0 a 0 00 a a 00 a a a 0 a a a a
i a a ~ a 0 0 000 OO~ 00 0 0 0 0 0 0 0 0 0 0 0 0 0 0 0 0 0
:ll 0 0 0 0 0 0 0 0 0 0 0 ~ 0 0 000 0 0 0 0 o ·~ 00 0 0 0 0 0 0
§ re ~ goo ~ 0 0 0 0 0 0 0 0 J.. 00 0 0 0 0 0 0 0 0 0 a 0 ~ 000 0 0
~ ; ~ E ~ 0 0 ~ 0 ~ 0 0 00 0 o~ 0 ~ 0 0 0 0 0 0 i 0 0 0 ~~ 0 0 0 o~
~ 0 0 ~o 0 0 0 ~ § ~ 0 ~ 0 ~ 0 0 0 0 0 0 ~ 0 ~ 0 ij 0 0 ~ 0 ~
~oo~i~o£~o~o~E~o~~o~o~~~~~~*io~~
:
rl2.~1~
mm