on prudent assumptions for water sales and meeting financial metrics consistent with board policies...
TRANSCRIPT


Financial Review of Fiscal Year 2015 as of June 30, 2015
East Bay Municipal Utility District Oakland, California
Cost Efficiency

Financial Review of Fiscal Year 2015
TABLE OF CONTENTS
Executive Summary Page 3
Basic Financial Statements Page 7
Memorandum on Internal Controls and Required Communication Page 94
Annual Budget Performance
Summary of Budget Performance Page 101
Water System Page 102
Wastewater System Page 107
Grants and Loans Page 112
Financial Indicators
Summary of Financial Indicators Page 114
Water System Page 115
Wastewater System Page 125
Retirement System Page 135
1
Financial Review of Fiscal Year 2015
Executive Summary
2
Financial Review of Fiscal Year 2015
Executive Summary
Introduction
This annual report summarizes the Water and the Wastewater Systems' financial performance for FY15. The scope of this report includes the budgetary performance, financial trends, financial statements, and internal controls review.
In prior years, the various sections of this single report were submitted as individual reports. These reports have been combined into a single report which supports the District’s long-term financial stability strategy of enhancing the usability, clarity and accessibility of District financial information.
Summary
Fiscal challenges related to the extended drought conditions continued to face the District during FY15. Despite these challenges, both the Water and Wastewater Systems' overall financial condition continue to remain sound with a stable revenue base and adequate reserves.
Discussion
Basic Financial Statements The annual financial audit for FY15 has been completed by the District’s external auditors Maze & Associates in accordance with section 11889 of the MUD Act. The annual audited Basic Financial Statements prepared by District staff is attached. Also in accordance with the MUD Act, summary financial statements for the Water and Wastewater Systems are being published in the Oakland Tribune on September 17 and 24, 2015. Once again the District has received an unqualified or “clean” opinion on its financial statements.
The District implemented Government Accounting Standards Board (GASB) No. 68 Accounting and Financial Reporting for Pensions in the fiscal year period ending June 30, 2015. GASB 68 requires all government agencies to report Pension Expense, Net Pension Liability, and Pension Related Deferred Inflows and Outflows in FY15 figures on the district basic audited financial statements.
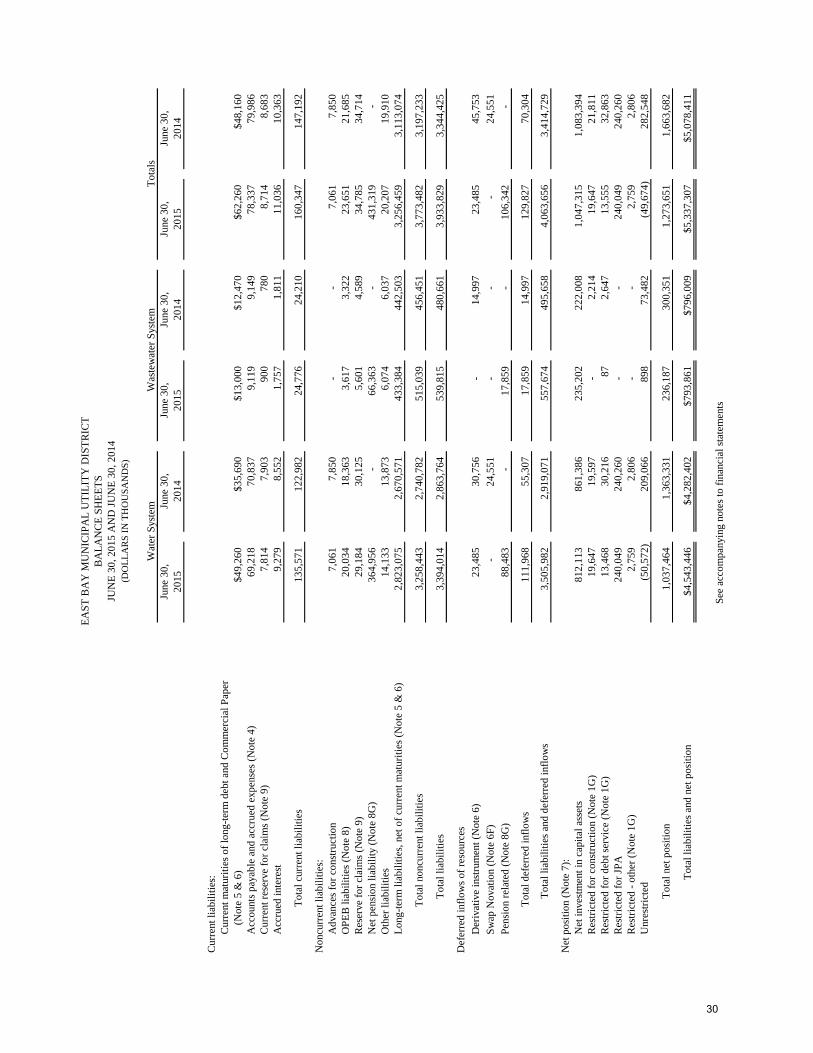
Balance Sheet Water and Wastewater balance sheets remain sound even though the Government Accounting Standards Board (GASB) required all agencies to report the unfunded net pension liability in the liability section for the first time in FY15. To comply with GASB Pronouncement 68, the District reported $431 million in additional outstanding liabilities.
3
Financial Review of Fiscal Year 2015
Net PositionTo establish the new net pension liability on the balance sheet, there is a one-time prior period adjustment of $477 million to net position.
Capital Contributions The District’s capital contribution increased this year compared to last year mainly due to the improving economy and improving housing market.
Operating Indicators The Water and Wastewater indicators reflect a stable customer base, strong collection controls and reasonable rates.
Retirement The District funding percentage improved compared to prior years and in its position to other agencies.
Memorandum on Internal Controls and Required Communication The external auditors found no material weaknesses in District operations, irregularities in reporting or need for significant audit adjustments.
Annual Budget Performance The Water System ended FY15 with a net positive budget variance of $14.9 million. Total Water System revenues were less than budget by ($21.3) million or 4 percent, and operating expenses were less than budget by $36.2 million or 9 percent. Of the net budget variance, $10.0 million was transferred to the rate stabilization fund. Water sales were ($29.1) million less than budget, but were offset by other sources such as SCC revenues which were greater than budget. The fiscal year-end billed water consumption was 148.5 MGD compared to budgeted consumption of 166 MGD.
The Wastewater System ended FY15 with a net positive budget variance of $9.6 million. Total Wastewater System revenues were greater than budget by $4.2 million or 4 percent, and operating expenses were less than budget by $5.4 million or 6 percent. Of the net budget variance, $6.5 million was transferred to the rate stabilization fund.
Financial indicators Water and Wastewater Systems overall financial conditions remain sound. Both systems met or exceeded the target goals of Policy 4.02, Cash Reserves and Debt Management due to actions taken to contain operating costs and refinance debt to lower debt service costs. These proactive actions resulted in additional funds being transferred to the rate stabilization fund to aid the District in future years to meet the financial indicators and minimize the impact on customer rates. All other indicators reflect stable conditions.
4
Financial Review of Fiscal Year 2015
Beyond Fiscal Year 2015
As we enter FY16, the challenges of managing the Stage 4 drought will continue. The adopted FY16-17 budget contains drought-related contingency appropriations and a staged system of drought rates which enables staff to work with the Board to tailor the drought response to future conditions.
The FY16-17 budget provides for the long-term financial stability of the District and is based on prudent assumptions for water sales and meeting financial metrics consistent with Board policies and the District’s credit ratings. Staff will monitor expenses during FY16 and provide the Board with a semi-annual budget report including end of year projections.
5
Financial Review of Fiscal Year 2015
Basic Financial Statements
6
EAST BAY MUNICIPAL UTILITY DISTRICT
BASIC FINANCIAL STATEMENTS
FOR THE YEARS ENDED JUNE 30, 2015 AND 2014
7
EAST BAY MUNICIPAL UTILITY DISTRICT BASIC FINANCIAL STATEMENTS
For the Years Ended June 30, 2015 and 2014
Table of Contents Page
Independent Auditor's Report .................................................................................................................9
Management’s Discussion and Analysis ................................................................................................12
Basic Financial Statements
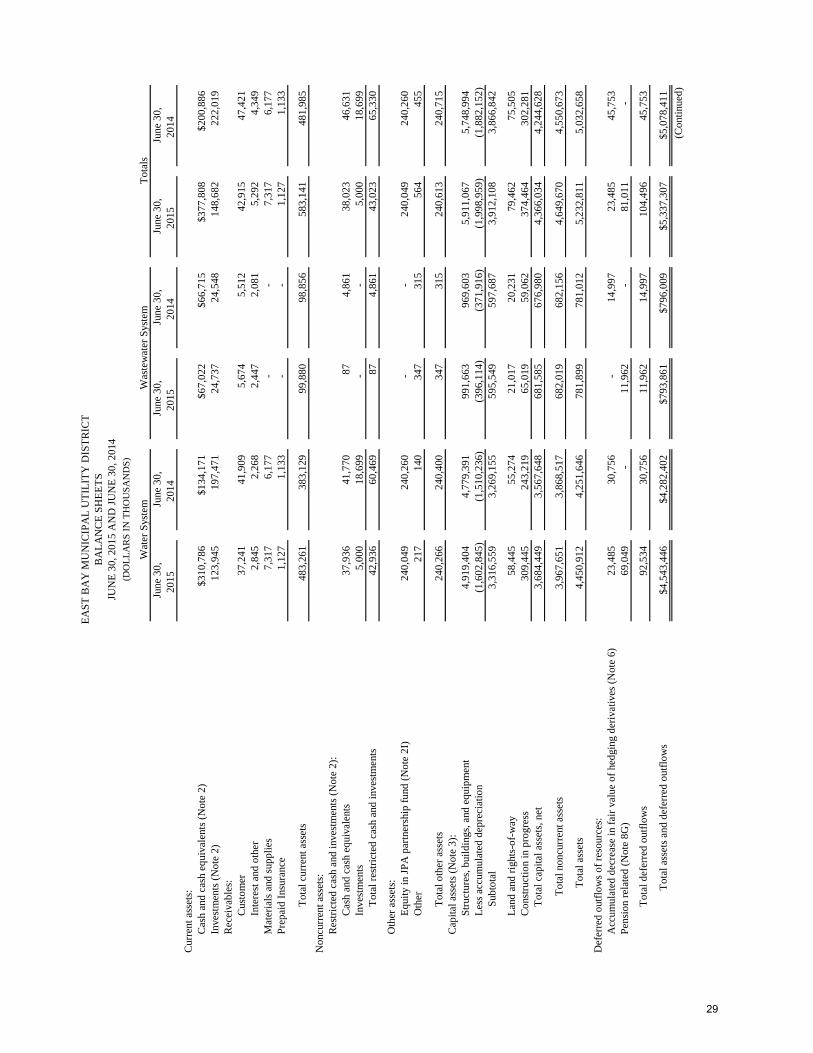
Balance Sheets ..............................................................................................................................29
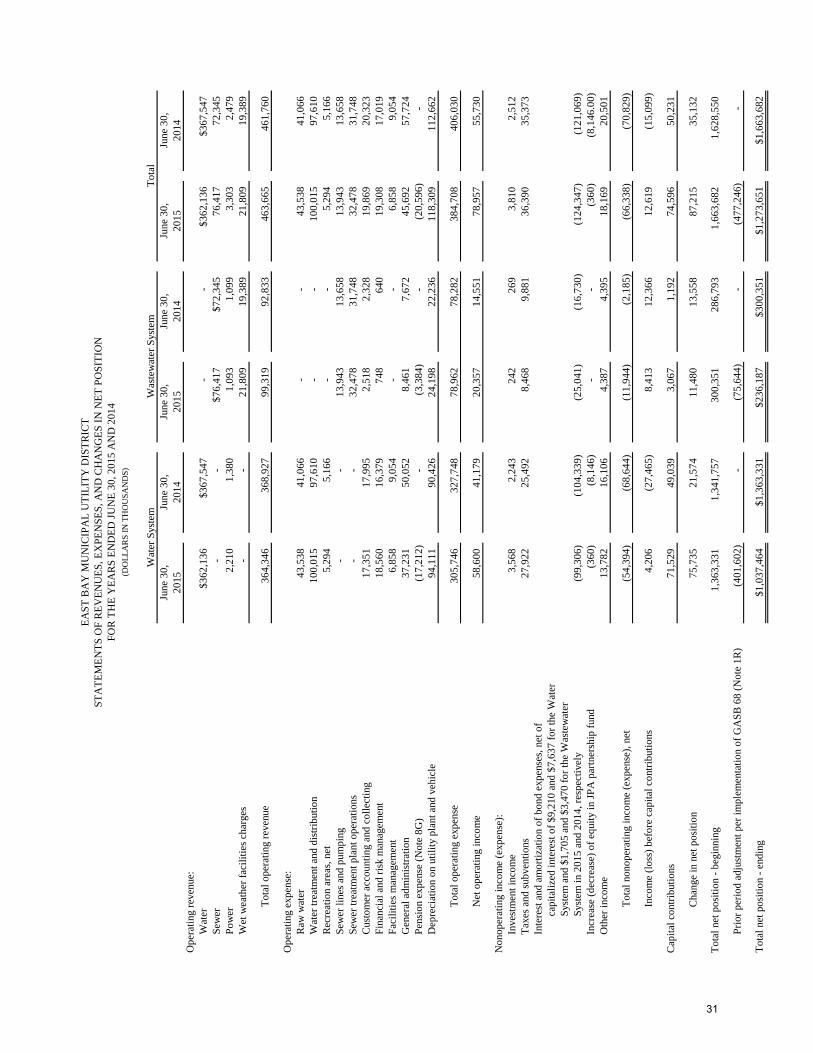
Statements of Revenues, Expenses and Changes in Net Position ...............................................31
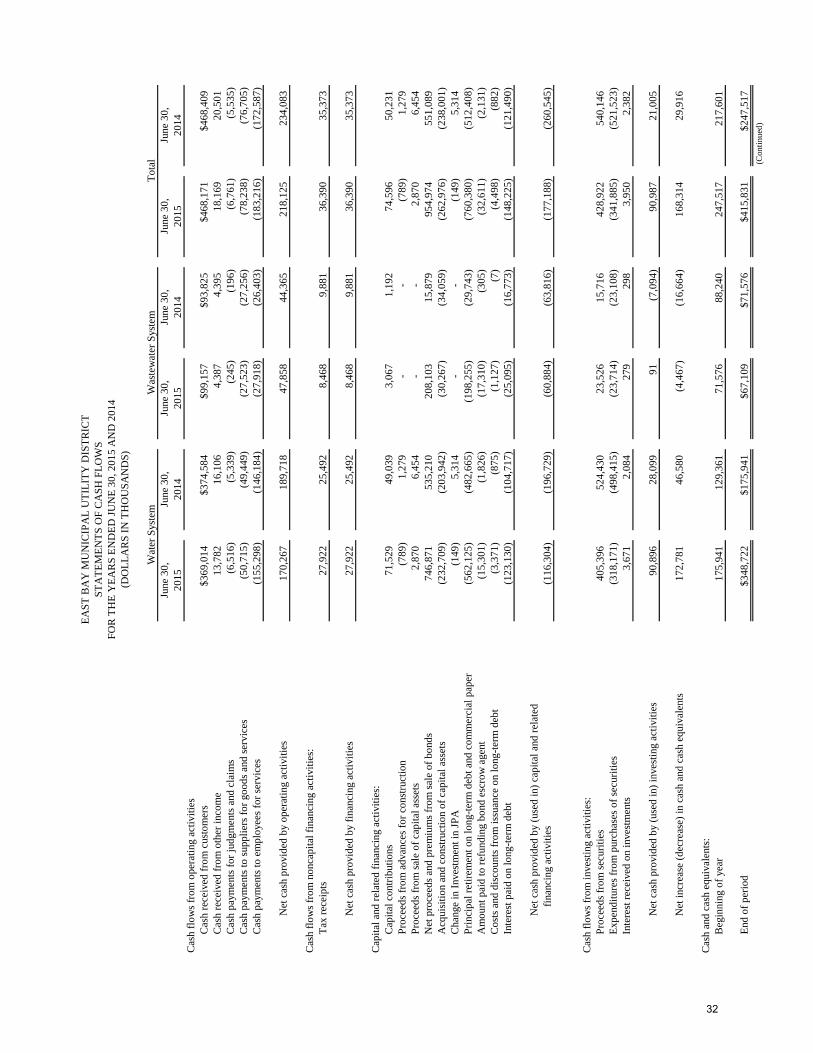
Statements of Cash Flows ............................................................................................................32
Statements of Fiduciary Net Position – Fiduciary Fund – Pension and Other Employee Benefit Trust (Component Unit) ..............34
Statements of Changes in Fiduciary Net Position – Fiduciary Fund – Pension and Other Employee Benefit Trust (Component Unit) ..............35
Notes to Basic Financial Statements ............................................................................................36
Required Supplemental Information
Employees’ Retirement System Trust Fund:
Schedule of Changes in Employer’s Net Pension Liability – Pension Plan ..........................84
Schedule of Employer’s Net Pension Liability – Pension Plan .............................................85
Schedule of Employer’s Contributions – Pension Plan .........................................................85
Schedule of Investment Returns – Pension Plan ....................................................................86
Schedule of Funding Progress for the - Post-Employment Healthcare Plan ......................... 86
Notes to Required Supplementary Information .....................................................................87
Supplemental Information
Employees’ Retirement System Trust Fund:
Combining Balance Sheet .......................................................................................................89
Combining Statement of Changes in Net Position .................................................................90
Independent Auditor's Report on Internal Control over Financial Reporting and on Compliance and Other Matters Based on an Audit of Financial Statements Performed in Accordance with Government Auditing Standards ....................................91
8
INDEPENDENT AUDITOR'S REPORT
Board of Directors East Bay Municipal Utility District Oakland, California
Report on Financial Statements
We have audited the accompanying financial statements of each major fund and the discretely presented component unit, of the East Bay Municipal Utility District as of and for the years ended June 30, 2015 and 2014, and the related notes to the financial statements, which collectively comprise the District’s basic financial statements as listed in the Table of Contents.
Management’s Responsibility for the Financial Statements
Management is responsible for the preparation and fair presentation of these financial statements in accordance with accounting principles generally accepted in the United States of America; this includes the design, implementation, and maintenance of internal control relevant to the preparation and fair presentation of the financial statements that are free from material misstatement, whether due to fraud or error.
Auditor’s Responsibility
Our responsibility is to express opinions on these financial statements based on our audit. We conducted our audits in accordance with auditing standards generally accepted in the United States of America and the standards applicable to financial audits contained in Government Auditing Standards, issued by the Comptroller General of the United States. Those standards require that we plan and perform the audits to obtain reasonable assurance about whether the financial statements are free from material misstatement.
An audit involves performing procedures to obtain audit evidence about the amounts and disclosures in the financial statements. The procedures selected depend on the auditor’s judgment, including the assessment of the risks of material misstatement of the financial statements, whether due to fraud or error. In making those risk assessments, the auditor considers internal control relevant to the District’s preparation and fair presentation of the financial statements in order to design audit procedures that are appropriate in the circumstances, but not for the purpose of expressing an opinion on the effectiveness of the District’s internal control. Accordingly, we express no such opinion. An audit also includes evaluating the appropriateness of accounting policies used and the reasonableness of significant accounting estimates made by management, as well as evaluating the overall presentation of the financial statements.
We believe that the audit evidence we have obtained is sufficient and appropriate to provide a basis for our audit opinions.
9
Opinions
In our opinion, the financial statements referred to above present fairly, in all material respects, the respective financial positions of each major fund and the discretely presented component unit of the East Bay Municipal Utility District as of June 30, 2015 and 2014, and the respective changes in the financial positions and cash flows, where applicable, thereof for the years then ended, in conformity with accounting principles generally accepted in the United States of America.
Emphasis of Matters
Management adopted the provisions of the following Governmental Accounting Standards Board Statements, which became effective during the year ended June 30, 2015 and required the restatement of net position as discussed in Note 1R to the financial statements:
Statement No. 68 – Accounting and Financial Reporting for Pensions
Statement No. 71 – Pension Transition for Contributions Made Subsequent to the Measurement Date
The emphasis of this matter does not constitute modifications to our opinion.
Other Matters
Required Supplementary Information
Accounting principles generally accepted in the United States of America require that Management’s Discussion and certain schedules related to the Pension and Post Employment Healthcare Plans be presented to supplement the basic financial statements. Such information, although not a part of the basic financial statements, is required by the Governmental Accounting Standards Board, who considers it to be an essential part of financial reporting for placing the basic financial statements in an appropriate operational, economic or historical context. We have applied certain limited procedures to this information in accordance with generally accepted auditing standards in the United States of America, which consisted of inquiries of management about the methods of preparing the information and comparing the information for consistency with management’s responses to our inquiries, the basic financial statements, and other knowledge we obtained during our audit of the basic financial statements. We do not express an opinion or provide any assurance on the information because the limited procedures do not provide us with sufficient evidence to express an opinion or provide any assurance.
Other Information
Our audit was conducted for the purpose of forming opinions on the financial statements that collectively comprise the East Bay Municipal Utility District’s basic financial statements as a whole. The Supplemental Information as listed in the Table of Contents are presented for purposes of additional analysis and are not required parts of the basic financial statements.
10
The Supplemental Information is the responsibility of management and was derived from and relates directly to the underlying accounting and other records used to prepare the financial statements. The information has been subjected to the auditing procedures applied in the audit of the financial statements and certain additional procedures, including comparing and reconciling such information directly to the underlying accounting and other records used to prepare the financial statements or to the financial statements themselves, and other additional procedures in accordance with generally accepted auditing standards in the United States of America. In our opinion, the Supplemental Information is fairly stated in all material respects in relation to the basic financial statements as a whole.
Other Reporting Required by Government Auditing Standards
In accordance with Government Auditing Standards, we have also issued our report dated August 27, 2015 on our consideration of the East Bay Municipal Utility District's internal control over financial reporting and on our tests of its compliance with certain provisions of laws, regulations, contracts, and grant agreements and other matters. The purpose of that report is to describe the scope of our testing of internal control over financial reporting and compliance and the results of that testing, and not to provide an opinion on the internal control over financial reporting or on compliance. That report is an integral part of an audit performed in accordance with Government Auditing Standards in considering the District’s internal control over financial reporting and compliance.
Pleasant Hill, California August 27, 2015
11
EAST BAY MUNICIPAL UTILITY DISTRICT
Management’s Discussion and Analysis
June 30, 2015
This section presents management’s analysis of the East Bay Municipal Utility District’s (the District) financial condition and activities as of and for the year ended June 30, 2015. Management’s Discussion and Analysis (MDA) is intended to serve as an introduction to the District’s basic financial statements. This information should be read in conjunction with the audited financial statements that follow this section. The District, as the primary governmental entity, includes within the financial statements, the financial position and activities of the District’s Employees’ Retirement System (Employees’ Retirement System) as a component unit. The Employees’ Retirement System issues its own financial statements and MDA under separate cover. Significant matters pertaining to the Employees’ Retirement System have been included in the notes to the financial statements as deemed appropriate.
The information in this MDA is presented under the following headings:
Organization and Business
Overview of the Basic Financial Statements
Financial Analysis
Capital Assets
Debt Administration
Request for Information
ORGANIZATION AND BUSINESS
The District provides water and wastewater services to industrial, commercial, residential and public authority users. The Water System collects, transmits, treats, and distributes high-quality water to approximately 60% (332 square miles) of the developed area within Alameda and Contra Costa counties of California and serves a population of about 1.4 million. The Wastewater System intercepts and treats wastewater from residences and industries within an 88 square miles service area including the communities of Alameda, Albany, Berkeley, Emeryville, Oakland, Piedmont, and the Stage Sanitary District and serves a population of about 650,000. The District recovers cost of service primarily through user fees.
OVERVIEW OF THE BASIC FINANCIAL STATEMENTS
The District’s basic financial statements are comprised of two components: (1) Fund Financial Statements and (2) Notes to Basic Financial Statements. The report also contains other required supplementary information in addition to the basic financial statements.
Fund Financial Statements. A fund is a grouping of related accounts that is used to maintain control over resources that have been segregated for specific activities or objectives. The District, like other special purpose governments, uses fund accounting to ensure and demonstrate compliance with financial-related legal requirements.
Proprietary Funds. The District’s proprietary funds consist of two enterprise funds, the Water System and the Wastewater System. Enterprise funds are used to account for operations that are financed and operated in a manner similar to private business enterprises – where the intent of the governing body is that the costs (including depreciation) of providing goods or services to the general public on a continuing basis be financed or recovered primarily through user charges.
12
EAST BAY MUNICIPAL UTILITY DISTRICT
Management’s Discussion and Analysis
June 30, 2015
The District’s proprietary fund statements include:
The Balance Sheet presents information on the District’s assets and deferred outflows, and liabilities and deferred inflows, with the difference between the two reported as net position. Over time, increases or decreases in net position may serve as a useful indicator of whether the financial position of the District is improving or deteriorating.
While the Balance Sheet provides information about the nature and amount of resources and obligations at year-end, the Statement of Revenues, Expenses, and Changes in Net Position presents the results of the District’s operations over the course of the fiscal year and information as to how the net position changed during the year. This statement can be used as an indicator of the extent to which the District has successfully recovered its costs through user fees and other charges. All changes in net position are reported during the period in which the underlying event giving rise to the change occurs, regardless of the timing of the related cash flows. Thus, revenues and expenses are reported in this statement for some items that will result in cash flows in future fiscal periods, such as delayed collection of operating revenues and the expense of employee earned but unused vacation leave.
The Statement of Cash Flows presents changes in cash and cash equivalents resulting from operational, capital, noncapital, and investing activities. This statement summarizes the annual flow of cash receipts and cash payments, without consideration of the timing of the event giving rise to the obligation or receipt and excludes noncash accounting measures of depreciation or amortization of assets.
Fiduciary Fund. Fiduciary funds are used to account for resources held for the benefit of parties outside the government. The District’s fiduciary fund consists of the Pension and Other Employee Benefit Trust fund, which is maintained to account for assets held by the Employees’ Retirement System in a trustee capacity for vested and retired employees. The accounting used for fiduciary funds is much like that used for the proprietary funds.
Notes to Basic Financial Statements. The notes provide additional information that is essential to a full understanding of the data provided in the basic financial statements. The notes to basic financial statements can be found on pages 29 to 75 of this report.
Other Information. In addition to the basic financial statements and accompanying notes, this report also presents certain required supplementary information concerning the District’s progress in funding its obligation to provide pension and other post-employment healthcare benefits to its employees. Such required supplementary information can be found on pages 78 to 81 of this report.
13
EAST BAY MUNICIPAL UTILITY DISTRICT
Management’s Discussion and Analysis
June 30, 2015
FINANCIAL ANALYSIS
Financial Highlights
In fiscal year 2015, EBMUD continued to effectively manage its finances and strengthen its financial position by adopting sufficient water and wastewater rates to fund capital infrastructure improvements and to maintain strong financial performance. The District implemented Government Accounting Standards Board (GASB) Statement No. 68 - Accounting and Financial Reporting for Pensions that created a $477 million decrease of prior period adjustment in net position. The following results of operations indicate a continuing strong and stable fiscal position.
The total assets and deferred outflows of the District exceeded the total liabilities and deferred inflows by $1.3 billion (net position).
Net position increased by $87 million or 5% during the fiscal year before $477 million decrease of prior period adjustment in net position per implementation of GASB 68.
Capital assets increased by $121 million or 3% to $4.4 billion.
Operating revenue increased by $2 million or 0.4% to $464 million.
Operating expense decreased by $21 million or 5% to $385 million.
Non-operating net expense decreased by $4 million or 6% to ($66) million.
Capital contributions, consisting of capital facility fees, increased by $24 million or 49% from the prior fiscal year.
Financial Position
In the current year, the District’s total net position increased by $87 million or 5% during the fiscal year before $477 million decrease in prior period adjustment per implementation of GASB 68. Current and other assets increased by $79 million or 10%. Capital assets increased by $121 million or 3%. By far the largest portion of the District’s net position, 82% or $1.0 billion, represents its investment in capital assets necessary to provide services.
• The Water System’s net position increased by $76 million or 6% during the year ended June 30, 2015 before $401 million decrease in prior period adjustment per implementation of GASB 68.
• The Wastewater System’s net position increased by $11 million or 4% during the year ended June 30, 2015 before $76 million decrease in prior period adjustment per implementation of GASB 68.
In the previous fiscal year, the District’s total net position increased by $35 million or 2%. Current and other assets decreased by $13 million or 2%. Capital assets increased by $93 million or 2%. By far the largest portion of the District’s net position, 65% or $1.0 billion, represents its investment in capital assets necessary to provide services.
14
EAST BAY MUNICIPAL UTILITY DISTRICT
Management’s Discussion and Analysis
June 30, 2015
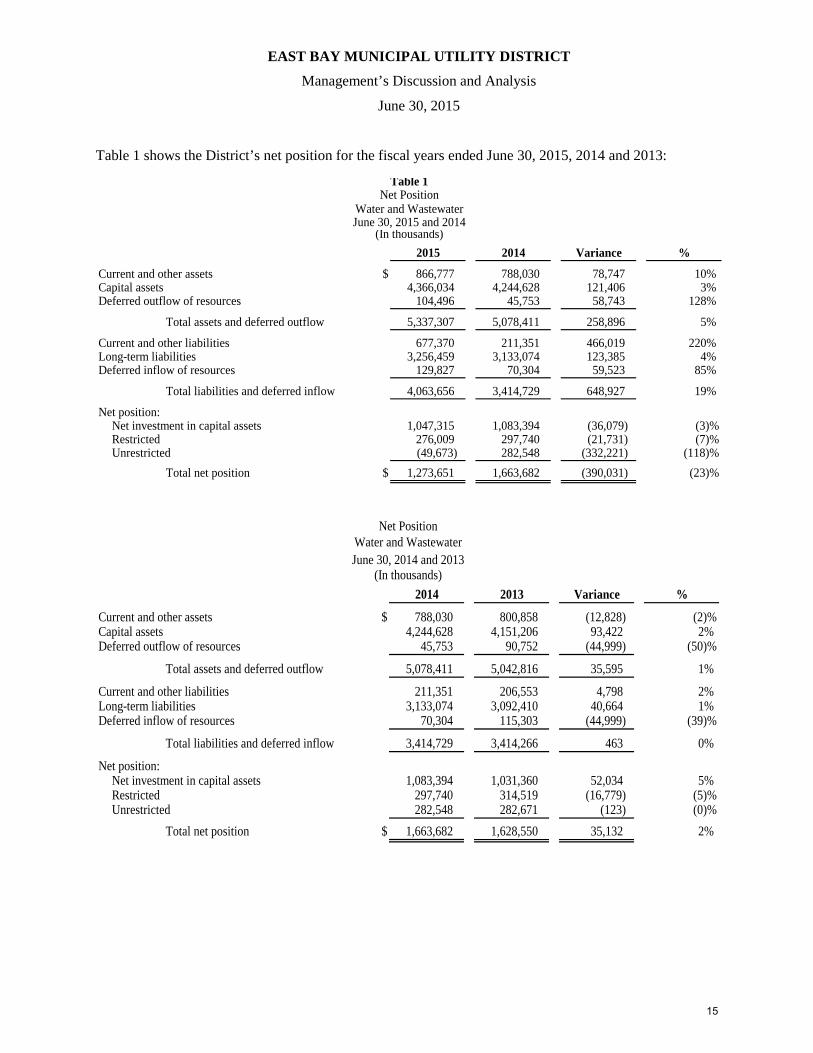
Table 1 shows the District’s net position for the fiscal years ended June 30, 2015, 2014 and 2013:
2015 2014 Variance %
Current and other assets $ 866,777 788,030 78,747 10% Capital assets 4,366,034 4,244,628 121,406 3% Deferred outflow of resources 104,496 45,753 58,743 128%
Total assets and deferred outflow 5,337,307 5,078,411 258,896 5%
Current and other liabilities 677,370 211,351 466,019 220% Long-term liabilities 3,256,459 3,133,074 123,385 4% Deferred inflow of resources 129,827 70,304 59,523 85%
Total liabilities and deferred inflow 4,063,656 3,414,729 648,927 19%
Net position:Net investment in capital assets 1,047,315 1,083,394 (36,079) (3)%Restricted 276,009 297,740 (21,731) (7)%Unrestricted (49,673) 282,548 (332,221) (118)%
Total net position $ 1,273,651 1,663,682 (390,031) (23)%
Table 1
(In thousands)
Net PositionWater and WastewaterJune 30, 2015 and 2014
2014 2013 Variance %
Current and other assets $ 788,030 800,858 (12,828) (2)%Capital assets 4,244,628 4,151,206 93,422 2% Deferred outflow of resources 45,753 90,752 (44,999) (50)%
Total assets and deferred outflow 5,078,411 5,042,816 35,595 1%
Current and other liabilities 211,351 206,553 4,798 2% Long-term liabilities 3,133,074 3,092,410 40,664 1% Deferred inflow of resources 70,304 115,303 (44,999) (39)%
Total liabilities and deferred inflow 3,414,729 3,414,266 463 0%
Net position:Net investment in capital assets 1,083,394 1,031,360 52,034 5% Restricted 297,740 314,519 (16,779) (5)%Unrestricted 282,548 282,671 (123) (0)%
Total net position $ 1,663,682 1,628,550 35,132 2%
(In thousands)
Net PositionWater and WastewaterJune 30, 2014 and 2013
15
EAST BAY MUNICIPAL UTILITY DISTRICT
Management’s Discussion and Analysis
June 30, 2015
Results of Operations
In the current fiscal year, the District’s total operating revenue of $464 million for the year increased by $2 million and total operating expense of $385 million for the year decreased by $21 million. The change in net position (including capital contributions) increased from $35 million in the previous fiscal year to $87 million in the current fiscal year. The District’s total net position decreased from $1,664 million to $1,274 million during the current fiscal year after $477 million prior period adjustment per implementation of GASB 68.
The major components of the District’s results of operations in the current fiscal year were:
• Water revenues decreased by $5 million, mainly reflecting an 11.4% decrease in billed waterconsumption offset by a 9.5% water rate increase in the current fiscal year.
• Wastewater revenues increased by $4 million, mainly reflecting an 8.5% rate increase in the currentfiscal year.
• Operating expense decreased by $21 million, primarily as a result of negative $21 million pensionexpense per implementation of GASB 68 in fiscal year 2015. Due to the current drought raw waterexpenses increased by of $2 million and water treatment and distribution expenses increased by $2million as a result of purchase of supplement water supply and additional expenses incurred to treatlocal reservoir water. General administration expenses decreased by $12 million primarily as a result ofa $5 million decrease in amortization expenses and additional $10 million capitalized administrationexpenses.
• Non-operating net expense decreased by $4 million primarily due to the $3 million increase in bondinterest expense paid for advance refunding offset by the $8 million reclassification of the change ofequity in JPA partnership fund from amortization expense to non-operating expense in the prior fiscalyear.
• Capital contributions increased by $24 million primarily reflecting an increase of $11 million in systemcapacity charges and $12 million in earned contributions on constructions received in current fiscal yearcompared to the prior year. Page 16 contains additional capital contributions information.
16
EAST BAY MUNICIPAL UTILITY DISTRICT
Management’s Discussion and Analysis
June 30, 2015
In the previous fiscal year, the District’s total operating revenue of $462 million for the year increased by $35 million and total operating expense of $406 million for the year increased by $21 million. The District’s change in net position (including capital contributions) decreased from $37 million in fiscal year 2013 to $35 million fiscal year 2014. The District’s total net position increased from $1,629 million to $1,664 million during fiscal year 2014.
The major components of the District’s results of operations in fiscal year 2014 were:
• Water revenues increased by $31 million, mainly reflecting a 9.75% water rate increase in fiscal year2014.
• Wastewater revenues increased by $4 million, mainly reflecting a 9% rate increase in fiscal year 2014.
• Power revenues decreased by $2 million over fiscal year 2013 due to lower precipitation and run-off forpower generation in fiscal year 2014 as compared to the previous fiscal year.
• Operating expense increased by $21 million, primarily as a result of an increase in raw water expensesof $6 million from the purchase of additional drought water supply, and water treatment anddistribution expenses increased by approximately $8 million as a result of $5 million increase in themaintenance of distribution mains and $4 million increase in sewer lines and pumps expenses andsewer treatment plant operation expenses.
• Non-operating net expense increased by $8 million primarily due to the reclassification of the change ofequity in JPA partnership fund from amortization expense to non-operating expense.
• Capital contributions decreased by $7 million primarily reflecting a decrease of $7 million in grantreceived in fiscal year 2014 compared to the prior year. Page 16 contains additional capitalcontributions information.
17
EAST BAY MUNICIPAL UTILITY DISTRICT
Management’s Discussion and Analysis
June 30, 2015
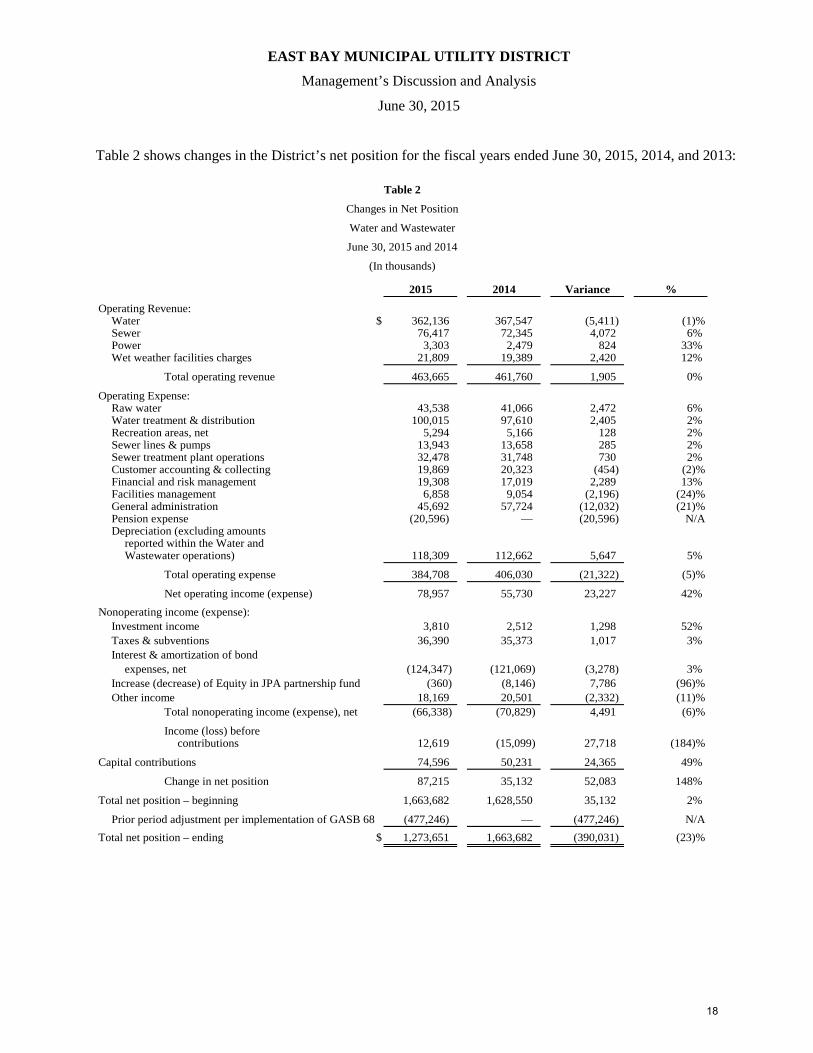
Table 2 shows changes in the District’s net position for the fiscal years ended June 30, 2015, 2014, and 2013:
Table 2
Changes in Net Position
Water and Wastewater
June 30, 2015 and 2014
(In thousands)
2015 2014 Variance %
Operating Revenue:Water $ 362,136 367,547 (5,411) (1)%Sewer 76,417 72,345 4,072 6% Power 3,303 2,479 824 33% Wet weather facilities charges 21,809 19,389 2,420 12%
Total operating revenue 463,665 461,760 1,905 0%
Operating Expense:Raw water 43,538 41,066 2,472 6% Water treatment & distribution 100,015 97,610 2,405 2% Recreation areas, net 5,294 5,166 128 2% Sewer lines & pumps 13,943 13,658 285 2% Sewer treatment plant operations 32,478 31,748 730 2% Customer accounting & collecting 19,869 20,323 (454) (2)%Financial and risk management 19,308 17,019 2,289 13% Facilities management 6,858 9,054 (2,196) (24)%General administration 45,692 57,724 (12,032) (21)%Pension expense (20,596) — (20,596) N/ADepreciation (excluding amounts
reported within the Water andWastewater operations) 118,309 112,662 5,647 5%
Total operating expense 384,708 406,030 (21,322) (5)%
Net operating income (expense) 78,957 55,730 23,227 42% Nonoperating income (expense):
Investment income 3,810 2,512 1,298 52% Taxes & subventions 36,390 35,373 1,017 3% Interest & amortization of bond
expenses, net (124,347) (121,069) (3,278) 3% Increase (decrease) of Equity in JPA partnership fund (360) (8,146) 7,786 (96)%Other income 18,169 20,501 (2,332) (11)%
Total nonoperating income (expense), net (66,338) (70,829) 4,491 (6)%
Income (loss) beforecontributions 12,619 (15,099) 27,718 (184)%
Capital contributions 74,596 50,231 24,365 49%
Change in net position 87,215 35,132 52,083 148%
Total net position – beginning 1,663,682 1,628,550 35,132 2%
Prior period adjustment per implementation of GASB 68 (477,246) — (477,246) N/ATotal net position – ending $ 1,273,651 1,663,682 (390,031) (23)%
18
EAST BAY MUNICIPAL UTILITY DISTRICT
Management’s Discussion and Analysis
June 30, 2015
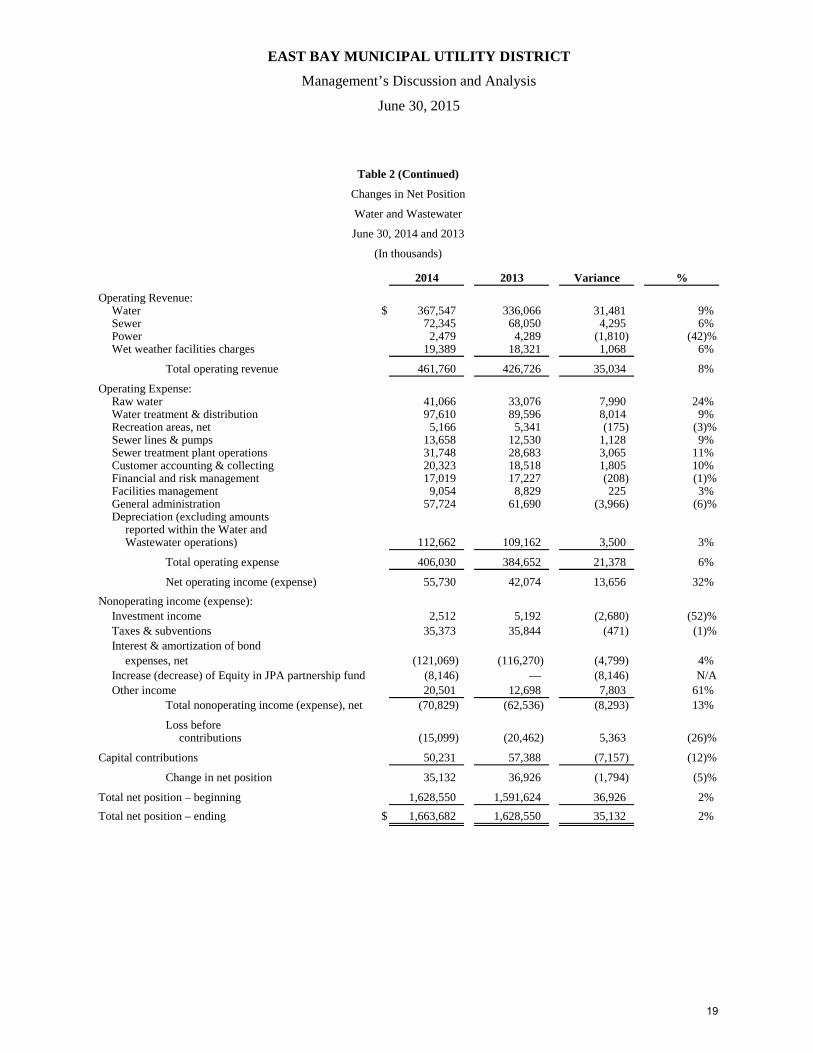
Table 2 (Continued)
Changes in Net Position
Water and Wastewater
June 30, 2014 and 2013
(In thousands)
2014 2013 Variance %
Operating Revenue:Water $ 367,547 336,066 31,481 9% Sewer 72,345 68,050 4,295 6% Power 2,479 4,289 (1,810) (42)%Wet weather facilities charges 19,389 18,321 1,068 6%
Total operating revenue 461,760 426,726 35,034 8%
Operating Expense:Raw water 41,066 33,076 7,990 24% Water treatment & distribution 97,610 89,596 8,014 9% Recreation areas, net 5,166 5,341 (175) (3)%Sewer lines & pumps 13,658 12,530 1,128 9% Sewer treatment plant operations 31,748 28,683 3,065 11% Customer accounting & collecting 20,323 18,518 1,805 10% Financial and risk management 17,019 17,227 (208) (1)%Facilities management 9,054 8,829 225 3% General administration 57,724 61,690 (3,966) (6)%Depreciation (excluding amounts
reported within the Water andWastewater operations) 112,662 109,162 3,500 3%
Total operating expense 406,030 384,652 21,378 6%
Net operating income (expense) 55,730 42,074 13,656 32% Nonoperating income (expense):
Investment income 2,512 5,192 (2,680) (52)%Taxes & subventions 35,373 35,844 (471) (1)%Interest & amortization of bond
expenses, net (121,069) (116,270) (4,799) 4% Increase (decrease) of Equity in JPA partnership fund (8,146) — (8,146) N/AOther income 20,501 12,698 7,803 61%
Total nonoperating income (expense), net (70,829) (62,536) (8,293) 13%
Loss beforecontributions (15,099) (20,462) 5,363 (26)%
Capital contributions 50,231 57,388 (7,157) (12)%
Change in net position 35,132 36,926 (1,794) (5)%
Total net position – beginning 1,628,550 1,591,624 36,926 2% Total net position – ending $ 1,663,682 1,628,550 35,132 2%
19
EAST BAY MUNICIPAL UTILITY DISTRICT
Management’s Discussion and Analysis
June 30, 2015
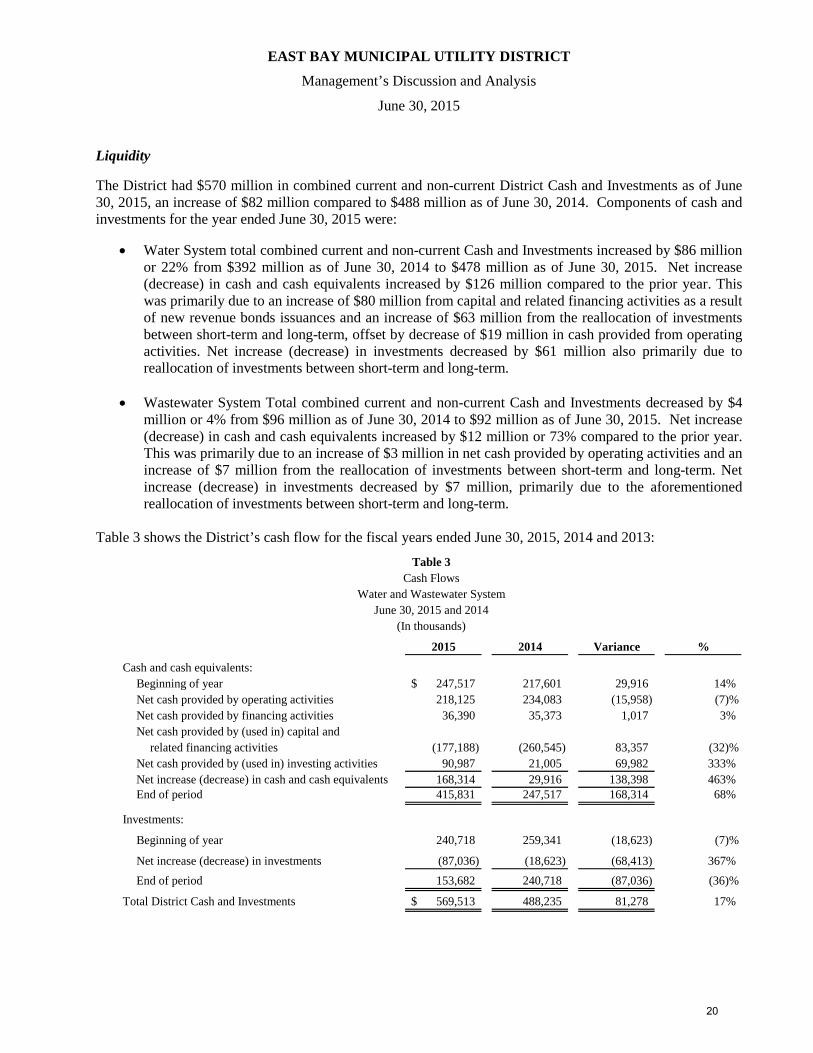
Liquidity
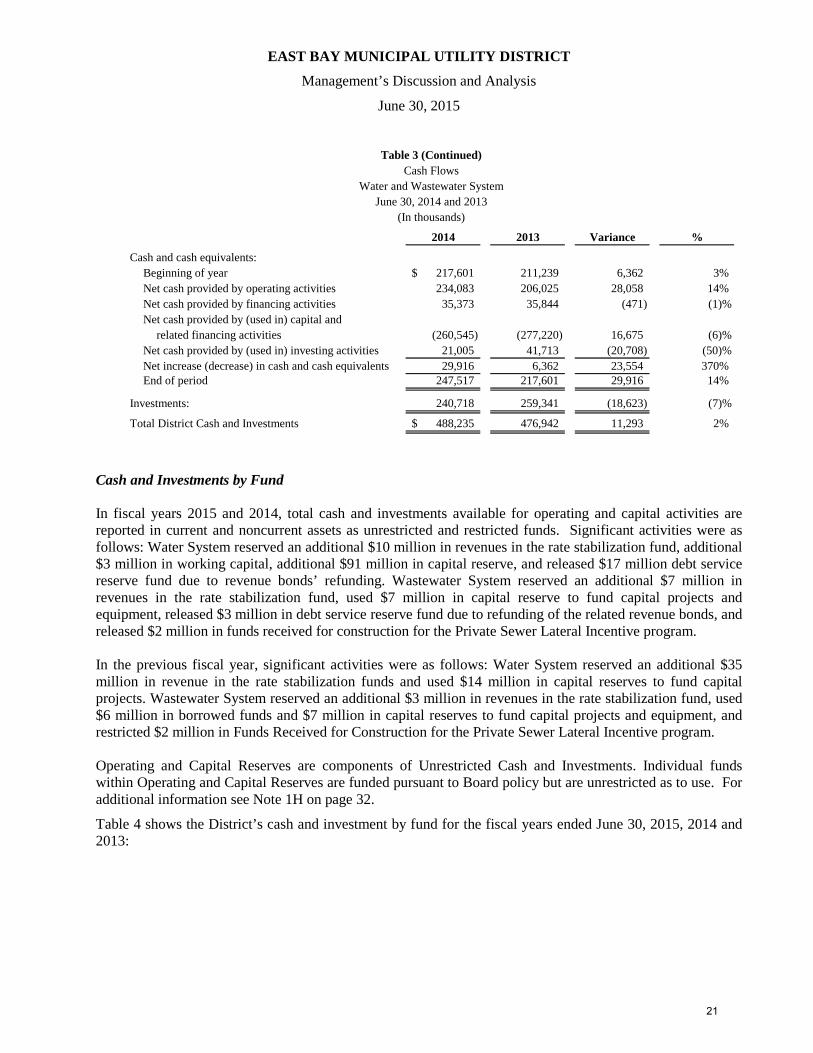
The District had $570 million in combined current and non-current District Cash and Investments as of June 30, 2015, an increase of $82 million compared to $488 million as of June 30, 2014. Components of cash and investments for the year ended June 30, 2015 were:
• Water System total combined current and non-current Cash and Investments increased by $86 million or 22% from $392 million as of June 30, 2014 to $478 million as of June 30, 2015. Net increase (decrease) in cash and cash equivalents increased by $126 million compared to the prior year. This was primarily due to an increase of $80 million from capital and related financing activities as a result of new revenue bonds issuances and an increase of $63 million from the reallocation of investments between short-term and long-term, offset by decrease of $19 million in cash provided from operating activities. Net increase (decrease) in investments decreased by $61 million also primarily due to reallocation of investments between short-term and long-term.
• Wastewater System Total combined current and non-current Cash and Investments decreased by $4 million or 4% from $96 million as of June 30, 2014 to $92 million as of June 30, 2015. Net increase (decrease) in cash and cash equivalents increased by $12 million or 73% compared to the prior year. This was primarily due to an increase of $3 million in net cash provided by operating activities and an increase of $7 million from the reallocation of investments between short-term and long-term. Net increase (decrease) in investments decreased by $7 million, primarily due to the aforementioned reallocation of investments between short-term and long-term.
Table 3 shows the District’s cash flow for the fiscal years ended June 30, 2015, 2014 and 2013:
2015 2014 Variance %
Cash and cash equivalents:Beginning of year 247,517$ 217,601 29,916 14% Net cash provided by operating activities 218,125 234,083 (15,958) (7)%Net cash provided by financing activities 36,390 35,373 1,017 3% Net cash provided by (used in) capital and
related financing activities (177,188) (260,545) 83,357 (32)%Net cash provided by (used in) investing activities 90,987 21,005 69,982 333% Net increase (decrease) in cash and cash equivalents 168,314 29,916 138,398 463% End of period 415,831 247,517 168,314 68%
Investments:
Beginning of year 240,718 259,341 (18,623) (7)%
Net increase (decrease) in investments (87,036) (18,623) (68,413) 367% End of period 153,682 240,718 (87,036) (36)%
Total District Cash and Investments 569,513$ 488,235 81,278 17%
(In thousands)
Table 3Cash Flows
Water and Wastewater SystemJune 30, 2015 and 2014
20
EAST BAY MUNICIPAL UTILITY DISTRICT
Management’s Discussion and Analysis
June 30, 2015
2014 2013 Variance %
Cash and cash equivalents:Beginning of year 217,601$ 211,239 6,362 3% Net cash provided by operating activities 234,083 206,025 28,058 14% Net cash provided by financing activities 35,373 35,844 (471) (1)%Net cash provided by (used in) capital and
related financing activities (260,545) (277,220) 16,675 (6)%Net cash provided by (used in) investing activities 21,005 41,713 (20,708) (50)%Net increase (decrease) in cash and cash equivalents 29,916 6,362 23,554 370% End of period 247,517 217,601 29,916 14%
Investments: 240,718 259,341 (18,623) (7)%
Total District Cash and Investments 488,235$ 476,942 11,293 2%
(In thousands)
Cash FlowsWater and Wastewater System
June 30, 2014 and 2013
Table 3 (Continued)
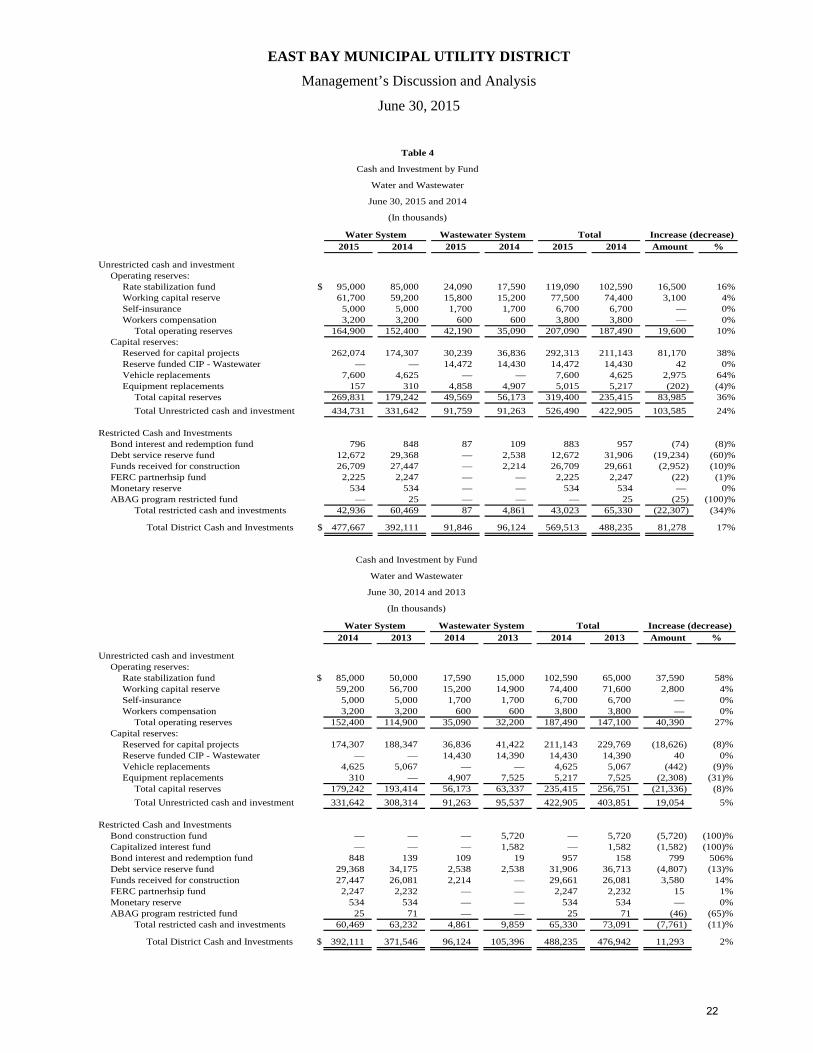
Cash and Investments by Fund In fiscal years 2015 and 2014, total cash and investments available for operating and capital activities are reported in current and noncurrent assets as unrestricted and restricted funds. Significant activities were as follows: Water System reserved an additional $10 million in revenues in the rate stabilization fund, additional $3 million in working capital, additional $91 million in capital reserve, and released $17 million debt service reserve fund due to revenue bonds’ refunding. Wastewater System reserved an additional $7 million in revenues in the rate stabilization fund, used $7 million in capital reserve to fund capital projects and equipment, released $3 million in debt service reserve fund due to refunding of the related revenue bonds, and released $2 million in funds received for construction for the Private Sewer Lateral Incentive program. In the previous fiscal year, significant activities were as follows: Water System reserved an additional $35 million in revenue in the rate stabilization funds and used $14 million in capital reserves to fund capital projects. Wastewater System reserved an additional $3 million in revenues in the rate stabilization fund, used $6 million in borrowed funds and $7 million in capital reserves to fund capital projects and equipment, and restricted $2 million in Funds Received for Construction for the Private Sewer Lateral Incentive program. Operating and Capital Reserves are components of Unrestricted Cash and Investments. Individual funds within Operating and Capital Reserves are funded pursuant to Board policy but are unrestricted as to use. For additional information see Note 1H on page 32.
Table 4 shows the District’s cash and investment by fund for the fiscal years ended June 30, 2015, 2014 and 2013:
21
EAST BAY MUNICIPAL UTILITY DISTRICT
Management’s Discussion and Analysis
June 30, 2015
Table 4
Cash and Investment by Fund
Water and Wastewater
June 30, 2015 and 2014
(In thousands)
Water System Wastewater System Total Increase (decrease)2015 2014 2015 2014 2015 2014 Amount %
Unrestricted cash and investmentOperating reserves:
Rate stabilization fund $ 95,000 85,000 24,090 17,590 119,090 102,590 16,500 16%Working capital reserve 61,700 59,200 15,800 15,200 77,500 74,400 3,100 4%Self-insurance 5,000 5,000 1,700 1,700 6,700 6,700 — 0%Workers compensation 3,200 3,200 600 600 3,800 3,800 — 0%
Total operating reserves 164,900 152,400 42,190 35,090 207,090 187,490 19,600 10%Capital reserves:
Reserved for capital projects 262,074 174,307 30,239 36,836 292,313 211,143 81,170 38%Reserve funded CIP - Wastewater — — 14,472 14,430 14,472 14,430 42 0%Vehicle replacements 7,600 4,625 — — 7,600 4,625 2,975 64%Equipment replacements 157 310 4,858 4,907 5,015 5,217 (202) (4)%
Total capital reserves 269,831 179,242 49,569 56,173 319,400 235,415 83,985 36%Total Unrestricted cash and investment 434,731 331,642 91,759 91,263 526,490 422,905 103,585 24%
Restricted Cash and InvestmentsBond interest and redemption fund 796 848 87 109 883 957 (74) (8)%Debt service reserve fund 12,672 29,368 — 2,538 12,672 31,906 (19,234) (60)%Funds received for construction 26,709 27,447 — 2,214 26,709 29,661 (2,952) (10)%FERC partnerhsip fund 2,225 2,247 — — 2,225 2,247 (22) (1)%Monetary reserve 534 534 — — 534 534 — 0%ABAG program restricted fund — 25 — — — 25 (25) (100)%
Total restricted cash and investments 42,936 60,469 87 4,861 43,023 65,330 (22,307) (34)%
Total District Cash and Investments $ 477,667 392,111 91,846 96,124 569,513 488,235 81,278 17%
Cash and Investment by Fund
Water and Wastewater
June 30, 2014 and 2013
(In thousands)
Water System Wastewater System Total Increase (decrease)2014 2013 2014 2013 2014 2013 Amount %
Unrestricted cash and investmentOperating reserves:
Rate stabilization fund $ 85,000 50,000 17,590 15,000 102,590 65,000 37,590 58%Working capital reserve 59,200 56,700 15,200 14,900 74,400 71,600 2,800 4%Self-insurance 5,000 5,000 1,700 1,700 6,700 6,700 — 0%Workers compensation 3,200 3,200 600 600 3,800 3,800 — 0%
Total operating reserves 152,400 114,900 35,090 32,200 187,490 147,100 40,390 27%Capital reserves:
Reserved for capital projects 174,307 188,347 36,836 41,422 211,143 229,769 (18,626) (8)%Reserve funded CIP - Wastewater — — 14,430 14,390 14,430 14,390 40 0%Vehicle replacements 4,625 5,067 — — 4,625 5,067 (442) (9)%Equipment replacements 310 — 4,907 7,525 5,217 7,525 (2,308) (31)%
Total capital reserves 179,242 193,414 56,173 63,337 235,415 256,751 (21,336) (8)%Total Unrestricted cash and investment 331,642 308,314 91,263 95,537 422,905 403,851 19,054 5%
Restricted Cash and InvestmentsBond construction fund — — — 5,720 — 5,720 (5,720) (100)%Capitalized interest fund — — — 1,582 — 1,582 (1,582) (100)%Bond interest and redemption fund 848 139 109 19 957 158 799 506%Debt service reserve fund 29,368 34,175 2,538 2,538 31,906 36,713 (4,807) (13)%Funds received for construction 27,447 26,081 2,214 — 29,661 26,081 3,580 14%FERC partnerhsip fund 2,247 2,232 — — 2,247 2,232 15 1%Monetary reserve 534 534 — — 534 534 — 0%ABAG program restricted fund 25 71 — — 25 71 (46) (65)%
Total restricted cash and investments 60,469 63,232 4,861 9,859 65,330 73,091 (7,761) (11)%
Total District Cash and Investments $ 392,111 371,546 96,124 105,396 488,235 476,942 11,293 2%
22
EAST BAY MUNICIPAL UTILITY DISTRICT
Management’s Discussion and Analysis
June 30, 2015
Capital Contributions
Capital contributions primarily consist of System Capacity Charges (SCC) and Seismic Improvement Program (SIP) surcharges. Additionally, the District receives contributions when the District’s facilities need to be relocated during construction projects. The District also receives state and federal grants to fund capital projects. The Water System’s SCC consists of charges collected from all applicants who request a new water service connection or a larger water meter size, and varies depending on geographic region. The SCC pays for the applicant's share of the capital facilities, including those that serve the entire water system such as the aqueducts and raw water facilities, regional facilities such as treatment plants and distribution facilities, and future water supply upgrades needed to meet long-term increases in water demand created by new customers. The portion of the SCC that pays for the future water supply is restricted and the remainder is unrestricted. The Wastewater System’s Capacity Fee is treated as unrestricted funds and pays for the share of Wastewater facilities attributed to new customers.
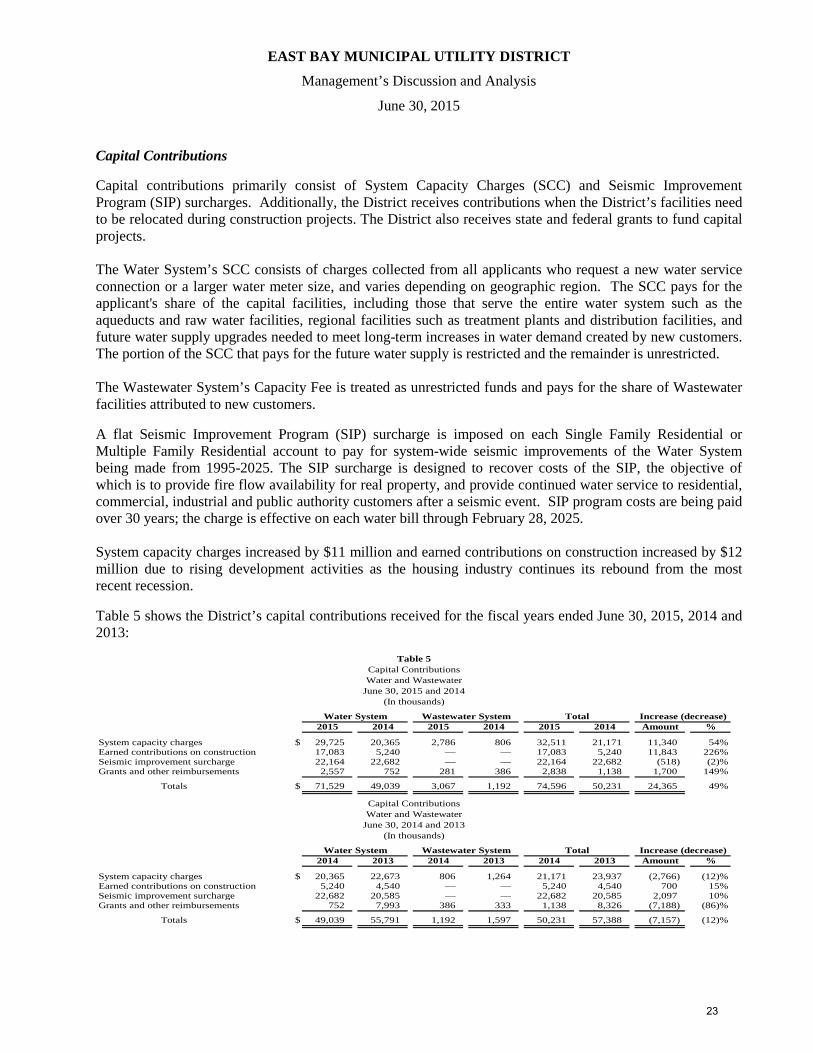
A flat Seismic Improvement Program (SIP) surcharge is imposed on each Single Family Residential or Multiple Family Residential account to pay for system-wide seismic improvements of the Water System being made from 1995-2025. The SIP surcharge is designed to recover costs of the SIP, the objective of which is to provide fire flow availability for real property, and provide continued water service to residential, commercial, industrial and public authority customers after a seismic event. SIP program costs are being paid over 30 years; the charge is effective on each water bill through February 28, 2025. System capacity charges increased by $11 million and earned contributions on construction increased by $12 million due to rising development activities as the housing industry continues its rebound from the most recent recession.
Table 5 shows the District’s capital contributions received for the fiscal years ended June 30, 2015, 2014 and 2013:
Table 5Capital ContributionsWater and Wastewater
June 30, 2015 and 2014(In thousands)
Water System Wastewater System Total Increase (decrease)2015 2014 2015 2014 2015 2014 Amount %
System capacity charges $ 29,725 20,365 2,786 806 32,511 21,171 11,340 54%Earned contributions on construction 17,083 5,240 — — 17,083 5,240 11,843 226%Seismic improvement surcharge 22,164 22,682 — — 22,164 22,682 (518) (2)%Grants and other reimbursements 2,557 752 281 386 2,838 1,138 1,700 149%
Totals $ 71,529 49,039 3,067 1,192 74,596 50,231 24,365 49%
Capital ContributionsWater and Wastewater
June 30, 2014 and 2013(In thousands)
Water System Wastewater System Total Increase (decrease)2014 2013 2014 2013 2014 2013 Amount %
System capacity charges $ 20,365 22,673 806 1,264 21,171 23,937 (2,766) (12)%Earned contributions on construction 5,240 4,540 — — 5,240 4,540 700 15%Seismic improvement surcharge 22,682 20,585 — — 22,682 20,585 2,097 10%Grants and other reimbursements 752 7,993 386 333 1,138 8,326 (7,188) (86)%
Totals $ 49,039 55,791 1,192 1,597 50,231 57,388 (7,157) (12)%
23
EAST BAY MUNICIPAL UTILITY DISTRICT
Management’s Discussion and Analysis
June 30, 2015
CAPITAL ASSETS
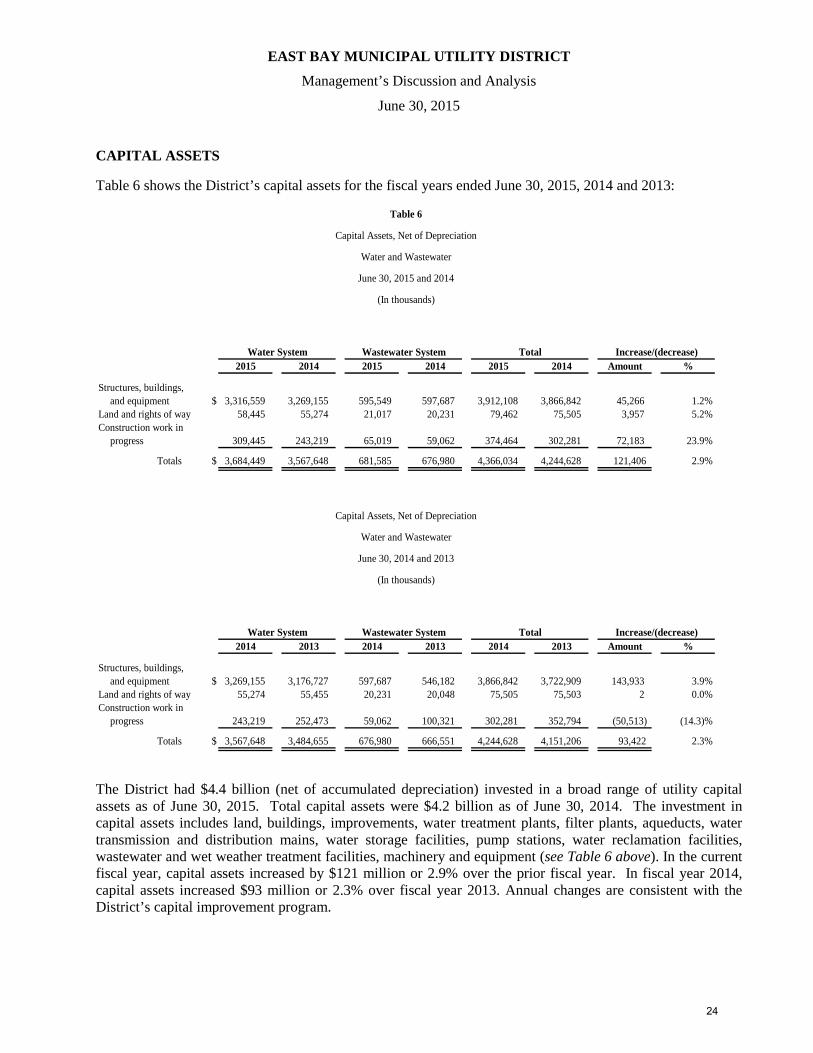
Table 6 shows the District’s capital assets for the fiscal years ended June 30, 2015, 2014 and 2013:
Table 6
Capital Assets, Net of Depreciation
Water and Wastewater
June 30, 2015 and 2014
(In thousands)
Water System Wastewater System Total Increase/(decrease)2015 2014 2015 2014 2015 2014 Amount %
Structures, buildings,and equipment $ 3,316,559 3,269,155 595,549 597,687 3,912,108 3,866,842 45,266 1.2%
Land and rights of way 58,445 55,274 21,017 20,231 79,462 75,505 3,957 5.2%Construction work in
progress 309,445 243,219 65,019 59,062 374,464 302,281 72,183 23.9%
Totals $ 3,684,449 3,567,648 681,585 676,980 4,366,034 4,244,628 121,406 2.9%
Capital Assets, Net of Depreciation
Water and Wastewater
June 30, 2014 and 2013
(In thousands)
Water System Wastewater System Total Increase/(decrease)2014 2013 2014 2013 2014 2013 Amount %
Structures, buildings,and equipment $ 3,269,155 3,176,727 597,687 546,182 3,866,842 3,722,909 143,933 3.9%
Land and rights of way 55,274 55,455 20,231 20,048 75,505 75,503 2 0.0%Construction work in
progress 243,219 252,473 59,062 100,321 302,281 352,794 (50,513) (14.3)%
Totals $ 3,567,648 3,484,655 676,980 666,551 4,244,628 4,151,206 93,422 2.3%
The District had $4.4 billion (net of accumulated depreciation) invested in a broad range of utility capital assets as of June 30, 2015. Total capital assets were $4.2 billion as of June 30, 2014. The investment in capital assets includes land, buildings, improvements, water treatment plants, filter plants, aqueducts, water transmission and distribution mains, water storage facilities, pump stations, water reclamation facilities, wastewater and wet weather treatment facilities, machinery and equipment (see Table 6 above). In the current fiscal year, capital assets increased by $121 million or 2.9% over the prior fiscal year. In fiscal year 2014, capital assets increased $93 million or 2.3% over fiscal year 2013. Annual changes are consistent with the District’s capital improvement program.
24
EAST BAY MUNICIPAL UTILITY DISTRICT
Management’s Discussion and Analysis
June 30, 2015
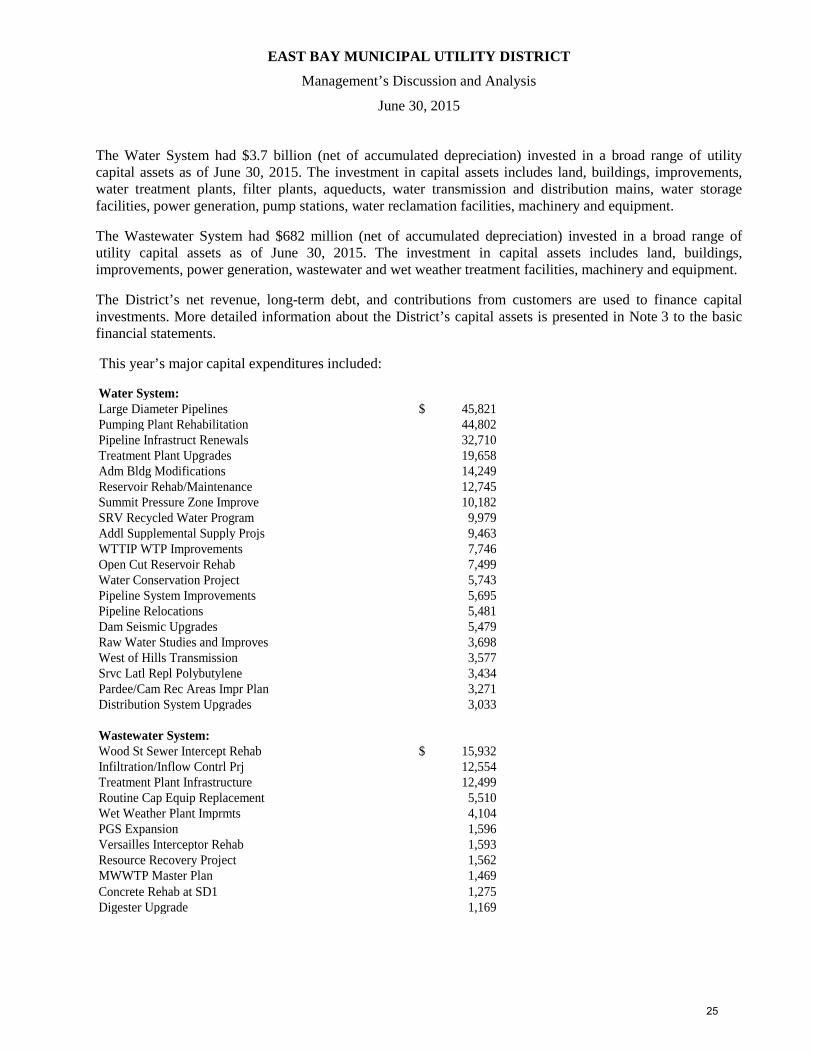
The Water System had $3.7 billion (net of accumulated depreciation) invested in a broad range of utility capital assets as of June 30, 2015. The investment in capital assets includes land, buildings, improvements, water treatment plants, filter plants, aqueducts, water transmission and distribution mains, water storage facilities, power generation, pump stations, water reclamation facilities, machinery and equipment.
The Wastewater System had $682 million (net of accumulated depreciation) invested in a broad range of utility capital assets as of June 30, 2015. The investment in capital assets includes land, buildings, improvements, power generation, wastewater and wet weather treatment facilities, machinery and equipment.
The District’s net revenue, long-term debt, and contributions from customers are used to finance capital investments. More detailed information about the District’s capital assets is presented in Note 3 to the basic financial statements.
This year’s major capital expenditures included:
Water System:Large Diameter Pipelines 45,821$ Pumping Plant Rehabilitation 44,802 Pipeline Infrastruct Renewals 32,710 Treatment Plant Upgrades 19,658 Adm Bldg Modifications 14,249 Reservoir Rehab/Maintenance 12,745 Summit Pressure Zone Improve 10,182 SRV Recycled Water Program 9,979 Addl Supplemental Supply Projs 9,463 WTTIP WTP Improvements 7,746 Open Cut Reservoir Rehab 7,499 Water Conservation Project 5,743 Pipeline System Improvements 5,695 Pipeline Relocations 5,481 Dam Seismic Upgrades 5,479 Raw Water Studies and Improves 3,698 West of Hills Transmission 3,577 Srvc Latl Repl Polybutylene 3,434 Pardee/Cam Rec Areas Impr Plan 3,271 Distribution System Upgrades 3,033
Wastewater System:Wood St Sewer Intercept Rehab 15,932$ Infiltration/Inflow Contrl Prj 12,554 Treatment Plant Infrastructure 12,499 Routine Cap Equip Replacement 5,510 Wet Weather Plant Imprmts 4,104 PGS Expansion 1,596 Versailles Interceptor Rehab 1,593 Resource Recovery Project 1,562 MWWTP Master Plan 1,469 Concrete Rehab at SD1 1,275 Digester Upgrade 1,169
25
EAST BAY MUNICIPAL UTILITY DISTRICT
Management’s Discussion and Analysis
June 30, 2015
DEBT ADMINISTRATION
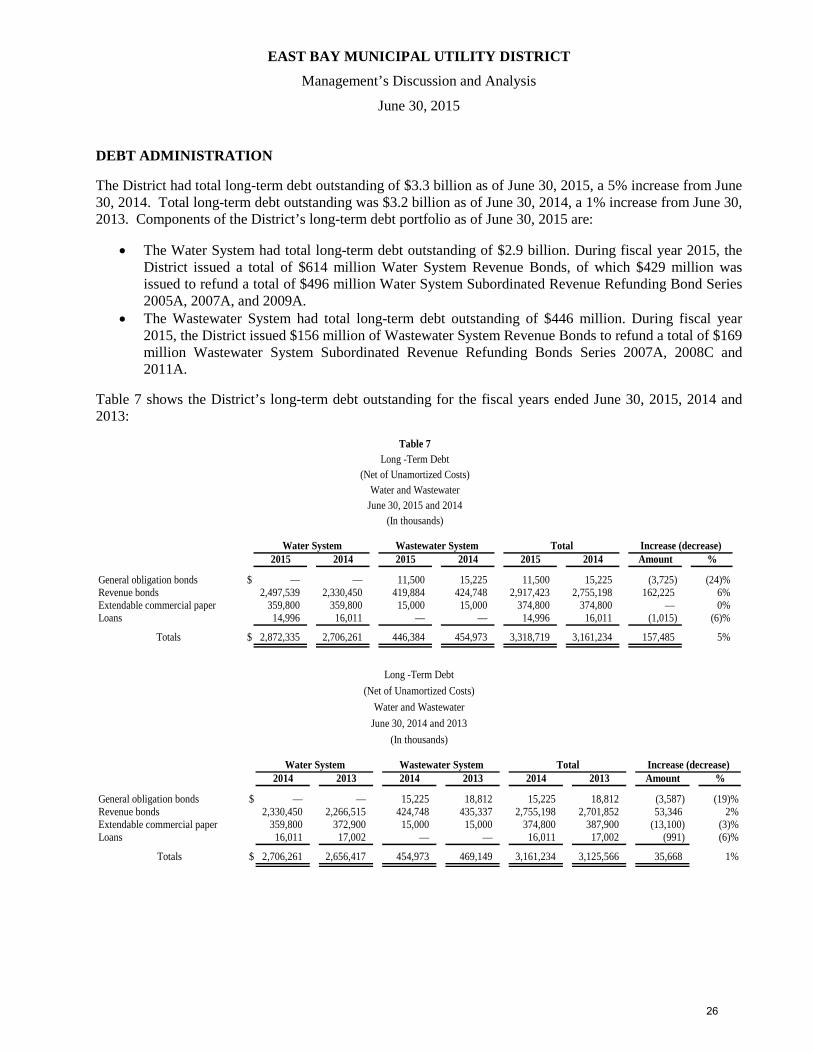
The District had total long-term debt outstanding of $3.3 billion as of June 30, 2015, a 5% increase from June 30, 2014. Total long-term debt outstanding was $3.2 billion as of June 30, 2014, a 1% increase from June 30, 2013. Components of the District’s long-term debt portfolio as of June 30, 2015 are:
• The Water System had total long-term debt outstanding of $2.9 billion. During fiscal year 2015, the District issued a total of $614 million Water System Revenue Bonds, of which $429 million was issued to refund a total of $496 million Water System Subordinated Revenue Refunding Bond Series 2005A, 2007A, and 2009A.
• The Wastewater System had total long-term debt outstanding of $446 million. During fiscal year 2015, the District issued $156 million of Wastewater System Revenue Bonds to refund a total of $169 million Wastewater System Subordinated Revenue Refunding Bonds Series 2007A, 2008C and 2011A.
Table 7 shows the District’s long-term debt outstanding for the fiscal years ended June 30, 2015, 2014 and 2013:
Table 7Long -Term Debt
(Net of Unamortized Costs)Water and Wastewater
June 30, 2015 and 2014(In thousands)
Water System Wastewater System Total Increase (decrease)2015 2014 2015 2014 2015 2014 Amount %
General obligation bonds $ — — 11,500 15,225 11,500 15,225 (3,725) (24)%Revenue bonds 2,497,539 2,330,450 419,884 424,748 2,917,423 2,755,198 162,225 6%Extendable commercial paper 359,800 359,800 15,000 15,000 374,800 374,800 — 0%Loans 14,996 16,011 — — 14,996 16,011 (1,015) (6)%
Totals $ 2,872,335 2,706,261 446,384 454,973 3,318,719 3,161,234 157,485 5%
Long -Term Debt(Net of Unamortized Costs)
Water and WastewaterJune 30, 2014 and 2013
(In thousands)
Water System Wastewater System Total Increase (decrease)2014 2013 2014 2013 2014 2013 Amount %
General obligation bonds $ — — 15,225 18,812 15,225 18,812 (3,587) (19)%Revenue bonds 2,330,450 2,266,515 424,748 435,337 2,755,198 2,701,852 53,346 2%Extendable commercial paper 359,800 372,900 15,000 15,000 374,800 387,900 (13,100) (3)%Loans 16,011 17,002 — — 16,011 17,002 (991) (6)%
Totals $ 2,706,261 2,656,417 454,973 469,149 3,161,234 3,125,566 35,668 1%
26
EAST BAY MUNICIPAL UTILITY DISTRICT
Management’s Discussion and Analysis
June 30, 2015
It is the policy of the District to maintain a reasonable balance between debt and current revenue financing of capital projects. The following targets provide the framework for financing capital projects:
Debt Service Coverage Ratio: Maintain an annual revenue bond debt coverage ratio of at least 1.6 times coverage. As of 6/30/2015, the coverage ratio for Water was 1.66 and for Wastewater was 1.75; the overall District’s ratio was 1.68.
Debt-Funded Capital Spending: Limit debt-funded capital to no more than 65% of the total capital program over each five-year planning period. As of 6/30/2015, the percentage of debt-funded capital spending for Water was 59% and for Wastewater was 74%; the overall District’s percentage was 62%.
Extended Commercial Paper and Un-hedged Variable Rate Debt: Limit to 25% of outstanding long-term debt. As of 6/30/2015, the percentage of extended commercial paper and un-hedged variable rate debt compared to total outstanding long-term debt for Water was 13% and for Wastewater was 4%; the overall District’s percentage was 12%.
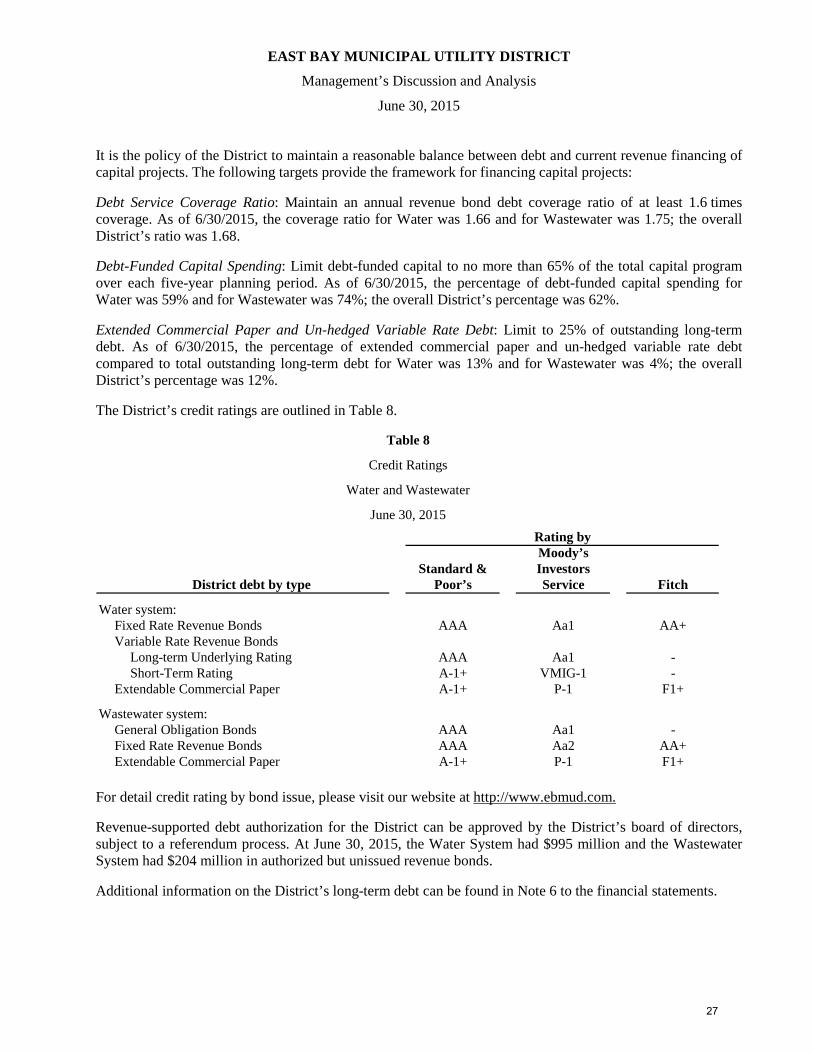
The District’s credit ratings are outlined in Table 8.
Moody’sStandard & Investors
District debt by type Poor’s Service Fitch
Water system:Fixed Rate Revenue Bonds AAA Aa1 AA+Variable Rate Revenue Bonds
Long-term Underlying Rating AAA Aa1 -Short-Term Rating A-1+ VMIG-1 -
Extendable Commercial Paper A-1+ P-1 F1+
Wastewater system:General Obligation Bonds AAA Aa1 -Fixed Rate Revenue Bonds AAA Aa2 AA+Extendable Commercial Paper A-1+ P-1 F1+
Table 8
Rating byJune 30, 2015
Water and Wastewater
Credit Ratings
For detail credit rating by bond issue, please visit our website at http://www.ebmud.com.
Revenue-supported debt authorization for the District can be approved by the District’s board of directors, subject to a referendum process. At June 30, 2015, the Water System had $995 million and the Wastewater System had $204 million in authorized but unissued revenue bonds.
Additional information on the District’s long-term debt can be found in Note 6 to the financial statements.
27
EAST BAY MUNICIPAL UTILITY DISTRICT
Management’s Discussion and Analysis
June 30, 2015
REQUEST FOR INFORMATION
This financial report is designed to provide ratepayers and creditors with a general overview of the District’s finances and demonstrate the District’s accountability for the monies it receives. If you have any questions about this report or need additional information, please contact: the Controller, Accounting Division, P.O. Box 24055, Oakland, CA 94623-1055 or visit our website at http://www.ebmud.com.
28
BA
LAN
CE
SHEE
TSJU
NE
30, 2
015
AN
D JU
NE
30, 2
014
(DO
LLA
RS
IN T
HO
USA
ND
S)
Wat
er S
yste
mW
aste
wat
er S
yste
mTo
tals
June
30,
June
30,
June
30,
June
30,
June
30,
June
30,
2015
2014
2015
2014
2015
2014
Cur
rent
ass
ets:
Cas
h an
d ca
sh e
quiv
alen
ts (N
ote
2)$3
10,7
86$1
34,1
71$6
7,02
2$6
6,71
5$3
77,8
08$2
00,8
86In
vest
men
ts (N
ote
2)12
3,94
519
7,47
124
,737
24,5
48
14
8,68
222
2,01
9R
ecei
vabl
es:
Cus
tom
er37
,241
41,9
095,
674
5,
512
42
,915
47,4
21In
tere
st a
nd o
ther
2,84
52,
268
2,44
7
2,08
1
5,29
24,
349
Mat
eria
ls a
nd su
pplie
s7,
317
6,17
7-
- 7,
317
6,17
7Pr
epai
d In
sura
nce
1,12
71,
133
- -
1,12
71,
133
Tota
l cur
rent
ass
ets
483,
261
383,
129
99,8
8098
,856
583,
141
481,
985
Non
curr
ent a
sset
s:R
estri
cted
cas
h an
d in
vest
men
ts (N
ote
2):
Cas
h an
d ca
sh e
quiv
alen
ts37
,936
41,7
70
87
4,86
1
38,0
2346
,631
Inve
stm
ents
5,00
0
18,6
99
-
- 5,
000
18,6
99To
tal r
estri
cted
cas
h an
d in
vest
men
ts42
,936
60,4
6987
4,86
143
,023
65,3
30
Oth
er a
sset
s:Eq
uity
in JP
A p
artn
ersh
ip fu
nd (N
ote
2I)
240,
049
24
0,26
0
- -
240,
049
240,
260
O
ther
217
14
0
347
315
564
455
Tota
l oth
er a
sset
s24
0,26
624
0,40
034
731
524
0,61
324
0,71
5C
apita
l ass
ets (
Not
e 3)
: St
ruct
ures
, bui
ldin
gs, a
nd e
quip
men
t4,
919,
404
4,77
9,39
1
99
1,66
396
9,60
35,
911,
067
5,74
8,99
4Le
ss a
ccum
ulat
ed d
epre
ciat
ion
(1,6
02,8
45)
(1
,510
,236
)
(396
,114
)(3
71,9
16)
(1,9
98,9
59)
(1,8
82,1
52)
Subt
otal
3,31
6,55
93,
269,
155
595,
549
597,
687
3,91
2,10
83,
866,
842
Land
and
righ
ts-o
f-way
58,4
45
55
,274
21,0
1720
,231
79,4
6275
,505
Con
stru
ctio
n in
pro
gres
s30
9,44
5
243,
219
65
,019
59,0
6237
4,46
430
2,28
1To
tal c
apita
l ass
ets,
net
3,68
4,44
93,
567,
648
681,
585
676,
980
4,36
6,03
44,
244,
628
T
otal
non
curr
ent a
sset
s3,
967,
651
3,86
8,51
768
2,01
968
2,15
64,
649,
670
4,55
0,67
3
Tot
al a
sset
s4,
450,
912
4,25
1,64
678
1,89
978
1,01
25,
232,
811
5,03
2,65
8
Def
erre
d ou
tflow
s of r
esou
rces
:A
ccum
ulat
ed d
ecre
ase
in fa
ir va
lue
of h
edgi
ng d
eriv
ativ
es (N
ote
6)23
,485
30,7
56-
14,9
9723
,485
45,7
53
Pe
nsio
n re
late
d (N
ote
8G)
69,0
49-
11,9
62-
81,0
11-
Tota
l def
erre
d ou
tflow
s92
,534
30,7
5611
,962
14,9
9710
4,49
645
,753
Tota
l ass
ets a
nd d
efer
red
outfl
ows
$4,5
43,4
46$4
,282
,402
$793
,861
$796
,009
$5,3
37,3
07$5
,078
,411
(Con
tinue
d)
EAST
BA
Y M
UN
ICIP
AL
UTI
LITY
DIS
TRIC
T
29
EAST
BA
Y M
UN
ICIP
AL
UTI
LITY
DIS
TRIC
TB
ALA
NC
E SH
EETS
JUN
E 30
, 201
5 A
ND
JUN
E 30
, 201
4(D
OLL
AR
S IN
TH
OU
SAN
DS)
Wat
er S
yste
mW
aste
wat
er S
yste
mTo
tals
June
30,
June
30,
June
30,
June
30,
June
30,
June
30,
2015
2014
2015
2014
2015
2014
Cur
rent
liab
ilitie
s:C
urre
nt m
atur
ities
of l
ong-
term
deb
t and
Com
mer
cial
Pap
er(N
ote
5 &
6)
$49,
260
$35,
690
$13,
000
$12,
470
$62,
260
$48,
160
Acc
ount
s pay
able
and
acc
rued
exp
ense
s (N
ote
4)69
,218
70,8
379,
119
9,14
978
,337
79,9
86C
urre
nt re
serv
e fo
r cla
ims (
Not
e 9)
7,81
47,
903
900
780
8,71
48,
683
Acc
rued
inte
rest
9,27
98,
552
1,75
71,
811
11,0
3610
,363
Tota
l cur
rent
liab
ilitie
s13
5,57
112
2,98
224
,776
24,2
1016
0,34
714
7,19
2
Non
curr
ent l
iabi
litie
s:A
dvan
ces f
or c
onst
ruct
ion
7,06
17,
850
- -
7,06
17,
850
OPE
B li
abili
ties (
Not
e 8)
20,0
3418
,363
3,61
7
3,32
2
23,6
5121
,685
Res
erve
for c
laim
s (N
ote
9)29
,184
30,1
255,
601
4,
589
34
,785
34,7
14N
et p
ensi
on li
abili
ty (N
ote
8G)
364,
956
- 66
,363
- 43
1,31
9-
Oth
er li
abili
ties
14,1
3313
,873
6,07
46,
037
20,2
0719
,910
Long
-term
liab
ilitie
s, ne
t of c
urre
nt m
atur
ities
(Not
e 5
& 6
) 2,
823,
075
2,67
0,57
143
3,38
444
2,50
33,
256,
459
3,11
3,07
4
Tota
l non
curr
ent l
iabi
litie
s3,
258,
443
2,74
0,78
251
5,03
945
6,45
13,
773,
482
3,19
7,23
3
To
tal l
iabi
litie
s3,
394,
014
2,86
3,76
453
9,81
548
0,66
13,
933,
829
3,34
4,42
5
Def
erre
d in
flow
s of r
esou
rces
Der
ivat
ive
inst
rum
ent (
Not
e 6)
23,4
8530
,756
- 14
,997
23,4
8545
,753
Swap
Nov
atio
n (N
ote
6F)
- 24
,551
- -
- 24
,551
Pens
ion
rela
ted
(Not
e 8G
)88
,483
- 17
,859
- 10
6,34
2-
Tota
l def
erre
d in
flow
s11
1,96
855
,307
17,8
5914
,997
129,
827
70,3
04
To
tal l
iabi
litie
s and
def
erre
d in
flow
s3,
505,
982
2,91
9,07
155
7,67
449
5,65
84,
063,
656
3,41
4,72
9
Net
pos
ition
(Not
e 7)
:N
et in
vest
men
t in
capi
tal a
sset
s81
2,11
386
1,38
623
5,20
222
2,00
81,
047,
315
1,08
3,39
4R
estri
cted
for c
onst
ruct
ion
(Not
e 1G
)19
,647
19,5
97-
2,21
4
19,6
4721
,811
Res
trict
ed fo
r deb
t ser
vice
(Not
e 1G
)13
,468
30,2
1687
2,64
713
,555
32,8
63R
estri
cted
for J
PA24
0,04
924
0,26
0-
- 24
0,04
924
0,26
0R
estri
cted
- ot
her (
Not
e 1G
)2,
759
2,80
6-
- 2,
759
2,80
6U
nres
trict
ed
(50,
572)
209,
066
898
73,4
82(4
9,67
4)28
2,54
8
To
tal n
et p
ositi
on1,
037,
464
1,36
3,33
123
6,18
730
0,35
11,
273,
651
1,66
3,68
2
T
otal
liab
ilitie
s and
net
pos
ition
$4,5
43,4
46$4
,282
,402
$793
,861
$796
,009
$5,3
37,3
07$5
,078
,411
See
acco
mpa
nyin
g no
tes t
o fin
anci
al st
atem
ents
30
EAST
BA
Y M
UN
ICIP
AL
UTI
LITY
DIS
TRIC
TST
ATE
MEN
TS O
F R
EVEN
UES
, EX
PEN
SES,
AN
D C
HA
NG
ES IN
NET
PO
SITI
ON
FOR
TH
E Y
EAR
S EN
DED
JUN
E 30
, 201
5 A
ND
201
4
Wat
er S
yste
mW
aste
wat
er S
yste
mTo
tal
June
30,
June
30,
June
30,
June
30,
June
30,
June
30,
2015
2014
2015
2014
2015
2014
Ope
ratin
g re
venu
e:W
ater
$362
,136
$367
,547
- -
$362
,136
$367
,547
Sew
er-
- $7
6,41
7$7
2,34
576
,417
72,3
45Po
wer
2,21
01,
380
1,09
3
1,09
9
3,30
32,
479
Wet
wea
ther
faci
litie
s cha
rges
- -
21,8
0919
,389
21,8
0919
,389
Tota
l ope
ratin
g re
venu
e36
4,34
636
8,92
799
,319
92,8
3346
3,66
546
1,76
0
Ope
ratin
g ex
pens
e:R
aw w
ater
43,5
3841
,066
- -
43,5
3841
,066
Wat
er tr
eatm
ent a
nd d
istri
butio
n10
0,01
597
,610
- -
100,
015
97,6
10R
ecre
atio
n ar
eas,
net
5,29
45,
166
- -
5,29
45,
166
Sew
er li
nes a
nd p
umpi
ng-
- 13
,943
13,6
5813
,943
13,6
58Se
wer
trea
tmen
t pla
nt o
pera
tions
- -
32,4
7831
,748
32,4
7831
,748
Cus
tom
er a
ccou
ntin
g an
d co
llect
ing
17,3
5117
,995
2,51
82,
328
19,8
6920
,323
Fina
ncia
l and
risk
man
agem
ent
18,5
6016
,379
748
640
19,3
0817
,019
Faci
litie
s man
agem
ent
6,85
89,
054
- -
6,85
89,
054
Gen
eral
adm
inis
tratio
n37
,231
50,0
52*
8,46
1*
7,67
245
,692
57,7
24Pe
nsio
n ex
pens
e (N
ote
8G)
(17,
212)
- (3
,384
)-
(20,
596)
- D
epre
ciat
ion
on u
tility
pla
nt a
nd v
ehic
le94
,111
90,4
2624
,198
22,2
3611
8,30
911
2,66
2
Tota
l ope
ratin
g ex
pens
e30
5,74
632
7,74
878
,962
78,2
8238
4,70
840
6,03
0
Net
ope
ratin
g in
com
e 58
,600
41,1
7920
,357
14,5
5178
,957
55,7
30
Non
oper
atin
g in
com
e (e
xpen
se):
Inve
stm
ent i
ncom
e3,
568
2,24
324
226
93,
810
2,51
2Ta
xes a
nd su
bven
tions
27,9
2225
,492
8,46
89,
881
36,3
9035
,373
Inte
rest
and
am
ortiz
atio
n of
bon
d ex
pens
es, n
et o
f ca
pita
lized
inte
rest
of $
9,21
0 an
d $7
,637
for t
he W
ater
Syst
em a
nd $
1,70
5 an
d $3
,470
for t
he W
aste
wat
erSy
stem
in 2
015
and
2014
, res
pect
ivel
y(9
9,30
6)(1
04,3
39)
(25,
041)
(16,
730)
(124
,347
)(1
21,0
69)
Incr
ease
(dec
reas
e) o
f equ
ity in
JPA
par
tner
ship
fund
(360
)(8
,146
)-
- (3
60)
(8,1
46.0
0)
O
ther
inco
me
13,7
8216
,106
4,38
74,
395
18,1
6920
,501
Tota
l non
oper
atin
g in
com
e (e
xpen
se),
net
(54,
394)
(68,
644)
(11,
944)
(2,1
85)
(66,
338)
(70,
829)
Inco
me
(loss
) bef
ore
capi
tal c
ontri
butio
ns4,
206
(27,
465)
8,41
312
,366
12,6
19(1
5,09
9)
Cap
ital c
ontri
butio
ns71
,529
49,0
393,
067
1,19
274
,596
50,2
31
Cha
nge
in n
et p
ositi
on75
,735
21,5
7411
,480
13,5
5887
,215
35,1
32
Tota
l net
pos
ition
- be
ginn
ing
1,36
3,33
11,
341,
757
300,
351
286,
793
1,66
3,68
21,
628,
550
Prio
r per
iod
adju
stm
ent p
er im
plem
enta
tion
of G
ASB
68
(Not
e 1R
)(4
01,6
02)
- (7
5,64
4)-
(477
,246
)-
Tota
l net
pos
ition
- en
ding
$1,0
37,4
64$1
,363
,331
$236
,187
$300
,351
$1,2
73,6
51$1
,663
,682
(DO
LLA
RS
IN T
HO
USA
ND
S)
31
Wat
er S
yste
mW
aste
wat
er S
yste
mTo
tal
June
30,
June
30,
June
30,
June
30,
June
30,
June
30,
2015
2014
2015
2014
2015
2014
Cas
h flo
ws f
rom
ope
ratin
g ac
tiviti
esC
ash
rece
ived
from
cus
tom
ers
$369
,014
$374
,584
$99,
157
$93,
825
$468
,171
$468
,409
Cas
h re
ceiv
ed fr
om o
ther
inco
me
13,7
82
16
,106
4,38
74,
395
18,1
6920
,501
Cas
h pa
ymen
ts fo
r jud
gmen
ts a
nd c
laim
s(6
,516
)
(5,3
39)
(2
45)
(196
)(6
,761
)(5
,535
)C
ash
paym
ents
to su
pplie
rs fo
r goo
ds a
nd se
rvic
es(5
0,71
5)
(49,
449)
(2
7,52
3)
(27,
256)
(7
8,23
8)(7
6,70
5)C
ash
paym
ents
to e
mpl
oyee
s for
serv
ices
(155
,298
)
(1
46,1
84)
(27,
918)
(26,
403)
(183
,216
)(1
72,5
87)
Net
cas
h pr
ovid
ed b
y op
erat
ing
activ
ities
170,
267
18
9,71
8
47,8
58
44
,365
218,
125
23
4,08
3
Cas
h flo
ws f
rom
non
capi
tal f
inan
cing
act
iviti
es:
Tax
rece
ipts
27,9
22
25
,492
8,46
89,
881
36,3
90
35
,373
Net
cas
h pr
ovid
ed b
y fin
anci
ng a
ctiv
ities
27,9
22
25
,492
8,46
8
9,88
1
36,3
90
35
,373
Cap
ital a
nd re
late
d fin
anci
ng a
ctiv
ities
:C
apita
l con
tribu
tions
71,5
29
49
,039
3,06
71,
192
74,5
9650
,231
Proc
eeds
from
adv
ance
s for
con
stru
ctio
n(7
89)
1,
279
-
- (7
89)
1,27
9Pr
ocee
ds fr
om sa
le o
f cap
ital a
sset
s2,
870
6,
454
-
- 2,
870
6,45
4N
et p
roce
eds a
nd p
rem
ium
s fro
m sa
le o
f bon
ds74
6,87
1
535,
210
20
8,10
3
15,8
79
95
4,97
455
1,08
9A
cqui
sitio
n an
d co
nstru
ctio
n of
cap
ital a
sset
s(2
32,7
09)
(203
,942
)
(3
0,26
7)(3
4,05
9)(2
62,9
76)
(238
,001
)C
hang
e in
Inve
stm
ent i
n JP
A(1
49)
5,
314
-
- (1
49)
5,31
4
Prin
cipa
l ret
irem
ent o
n lo
ng-te
rm d
ebt a
nd c
omm
erci
al p
aper
(562
,125
)
(4
82,6
65)
(198
,255
)
(2
9,74
3)
(760
,380
)(5
12,4
08)
Am
ount
pai
d to
refu
ndin
g bo
nd e
scro
w a
gent
(15,
301)
(1
,826
)
(17,
310)
(3
05)
(3
2,61
1)(2
,131
)C
osts
and
dis
coun
ts fr
om is
suan
ce o
n lo
ng-te
rm d
ebt
(3,3
71)
(8
75)
(1
,127
)
(7)
(4
,498
)(8
82)
Inte
rest
pai
d on
long
-term
deb
t(1
23,1
30)
(104
,717
)
(2
5,09
5)
(16,
773)
(1
48,2
25)
(121
,490
)
Net
cas
h pr
ovid
ed b
y (u
sed
in) c
apita
l and
rela
ted
finan
cing
act
iviti
es(1
16,3
04)
(196
,729
)
(6
0,88
4)
(63,
816)
(1
77,1
88)
(260
,545
)
Cas
h flo
ws f
rom
inve
stin
g ac
tiviti
es:
Proc
eeds
from
secu
ritie
s40
5,39
6
524,
430
23
,526
15,7
1642
8,92
254
0,14
6Ex
pend
iture
s fro
m p
urch
ases
of s
ecur
ities
(318
,171
)
(4
98,4
15)
(23,
714)
(2
3,10
8)
(341
,885
)(5
21,5
23)
Inte
rest
rece
ived
on
inve
stm
ents
3,67
1
2,08
4
279
298
3,95
02,
382
Net
cas
h pr
ovid
ed b
y (u
sed
in) i
nves
ting
activ
ities
90,8
96
28
,099
91 (7
,094
)
90,9
8721
,005
Net
incr
ease
(dec
reas
e) in
cas
h an
d ca
sh e
quiv
alen
ts17
2,78
1
46,5
80
(4
,467
)
(16,
664)
16
8,31
429
,916
Cas
h an
d ca
sh e
quiv
alen
ts:
Beg
inni
ng o
f yea
r17
5,94
1
129,
361
71
,576
88,2
4024
7,51
721
7,60
1
End
of p
erio
d$3
48,7
22$1
75,9
41$6
7,10
9$7
1,57
6$4
15,8
31$2
47,5
17(C
ontin
ued)
(DO
LLA
RS
IN T
HO
USA
ND
S)
EAST
BA
Y M
UN
ICIP
AL
UTI
LITY
DIS
TRIC
TST
ATE
MEN
TS O
F C
ASH
FLO
WS
FOR
TH
E Y
EAR
S EN
DED
JUN
E 30
, 201
5 A
ND
201
4
32
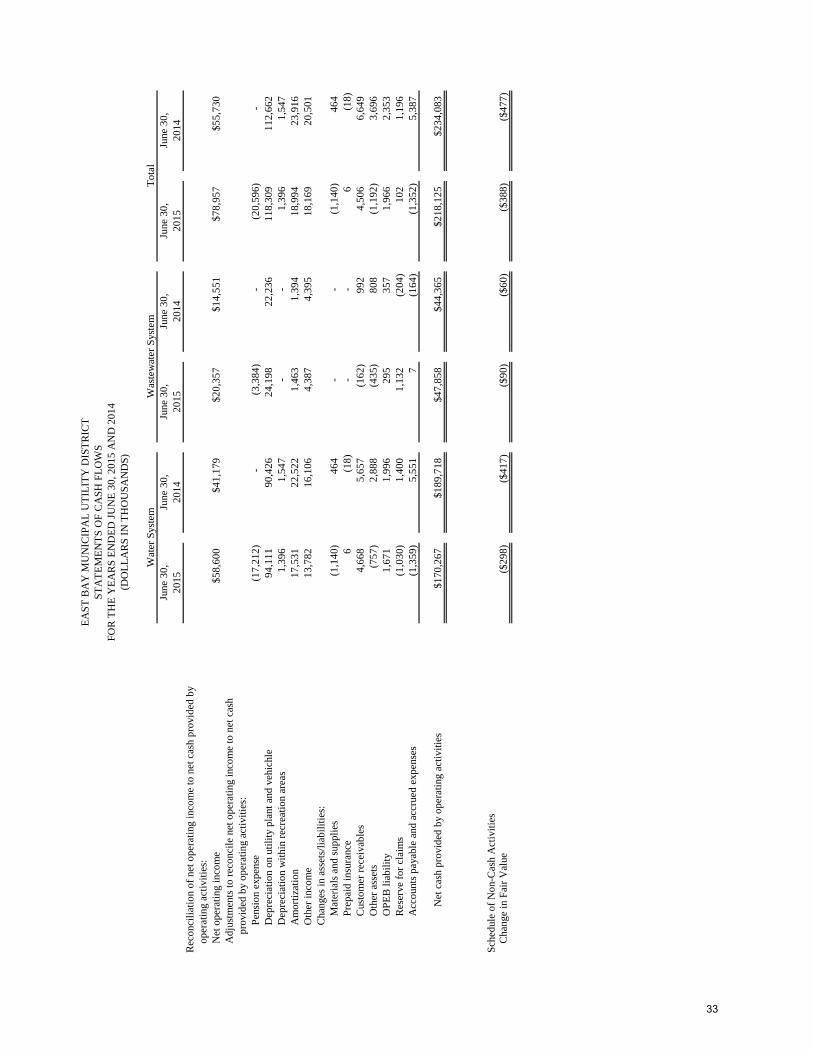
Wat
er S
yste
mW
aste
wat
er S
y ste
mTo
tal
June
30,
June
30,
June
30,
June
30,
June
30,
June
30,
2015
2014
2015
2014
2015
2014
Rec
onci
liatio
n of
net
ope
ratin
g in
com
e to
net
cas
h pr
ovid
ed b
yop
erat
ing
activ
ities
:N
et o
pera
ting
inco
me
$58,
600
$41,
179
$20,
357
$14,
551
$78,
957
$55,
730
Adj
ustm
ents
to re
conc
ile n
et o
pera
ting
inco
me
to n
et c
ash
prov
ided
by
oper
atin
g ac
tiviti
es:
Pens
ion
expe
nse
(17,
212)
-
(3,3
84)
- (2
0,59
6)-
Dep
reci
atio
n on
util
ity p
lant
and
veh
ichl
e94
,111
90,4
26
24
,198
22,2
3611
8,30
911
2,66
2D
epre
ciat
ion
with
in re
crea
tion
area
s1,
396
1,
547
-
- 1,
396
1,54
7A
mor
tizat
ion
17,5
31
22
,522
1,46
31,
394
18,9
9423
,916
Oth
er in
com
e13
,782
16,1
06
4,
387
4,39
518
,169
20,5
01C
hang
es in
ass
ets/
liabi
litie
s:M
ater
ials
and
supp
lies
(1,1
40)
46
4
- -
(1,1
40)
464
Prep
aid
insu
ranc
e6
(18)
-
- 6
(18)
Cus
tom
er re
ceiv
able
s4,
668
5,
657
(1
62)
992
4,50
66,
649
Oth
er a
sset
s(7
57)
2,
888
(4
35)
808
(1,1
92)
3,69
6O
PEB
liab
ility
1,67
1
1,99
6
295
357
1,96
62,
353
Res
erve
for c
laim
s(1
,030
)
1,40
0
1,13
2(2
04)
102
1,19
6A
ccou
nts p
ayab
le a
nd a
ccru
ed e
xpen
ses
(1,3
59)
5,
551
7
(164
)
(1,3
52)
5,38
7
Net
cas
h pr
ovid
ed b
y op
erat
ing
activ
ities
$170
,267
$189
,718
$47,
858
$44,
365
$218
,125
$234
,083
Sche
dule
of N
on-C
ash
Act
iviti
esC
hang
e in
Fai
r Val
ue($
298)
($41
7)($
90)
($60
)($
388)
($47
7)
EAST
BA
Y M
UN
ICIP
AL
UTI
LITY
DIS
TRIC
TST
ATE
MEN
TS O
F C
ASH
FLO
WS
FOR
TH
E Y
EAR
S EN
DED
JUN
E 30
, 201
5 A
ND
201
4(D
OLL
AR
S IN
TH
OU
SAN
DS)
33
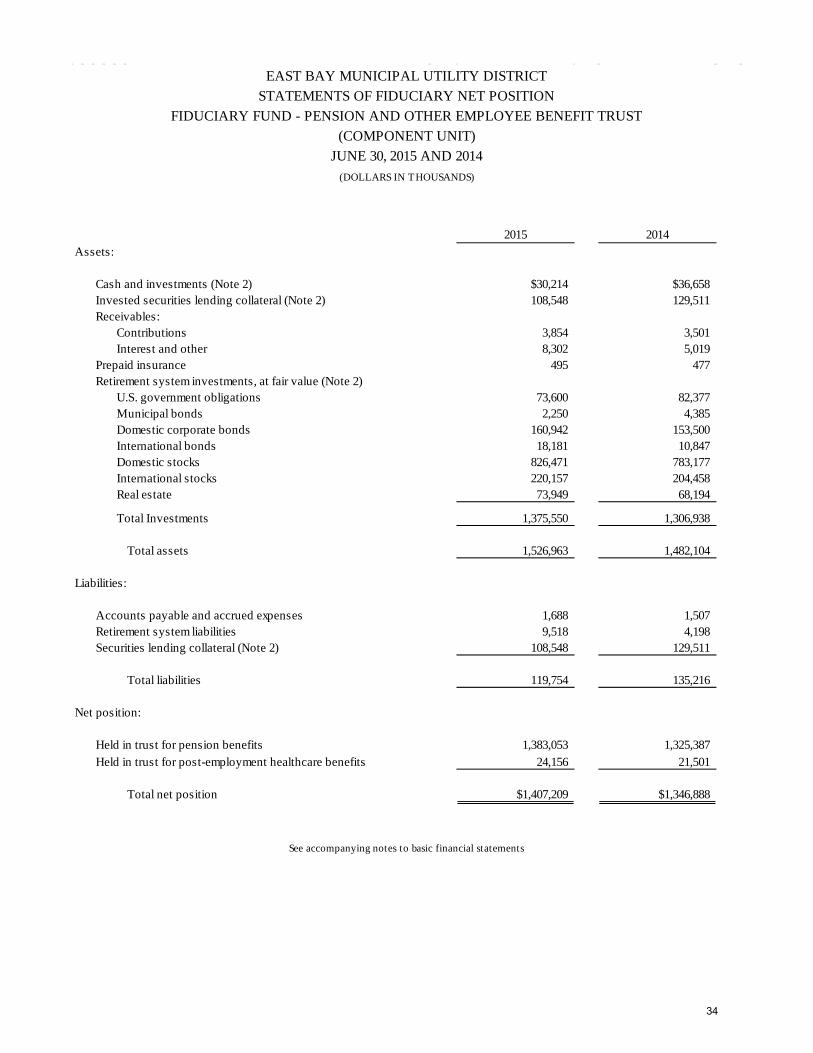
EAST BAY MUNICIPAL UTILITY DISTRICTSTATEMENTS OF FIDUCIARY NET POSITION
FIDUCIARY FUND - PENSION AND OTHER EMPLOYEE BENEFIT TRUST(COMPONENT UNIT)
JUNE 30, 2015 AND 2014
2015 2014Assets:
Cash and investments (Note 2) $30,214 $36,658Invested securities lending collateral (Note 2) 108,548 129,511Receivables:
Contributions 3,854 3,501Interest and other 8,302 5,019
Prepaid insurance 495 477Retirement system investments, at fair value (Note 2)
U.S. government obligations 73,600 82,377Municipal bonds 2,250 4,385Domestic corporate bonds 160,942 153,500International bonds 18,181 10,847Domestic stocks 826,471 783,177International stocks 220,157 204,458Real estate 73,949 68,194
Total Investments 1,375,550 1,306,938
Total assets 1,526,963 1,482,104
Liabilities:
Accounts payable and accrued expenses 1,688 1,507Retirement system liabilities 9,518 4,198Securities lending collateral (Note 2) 108,548 129,511
Total liabilities 119,754 135,216
Net position:
Held in trust for pension benefits 1,383,053 1,325,387Held in trust for post-employment healthcare benefits 24,156 21,501
Total net position $1,407,209 $1,346,888
See accompanying notes to basic financial statements
(DOLLARS IN THOUSANDS)
34
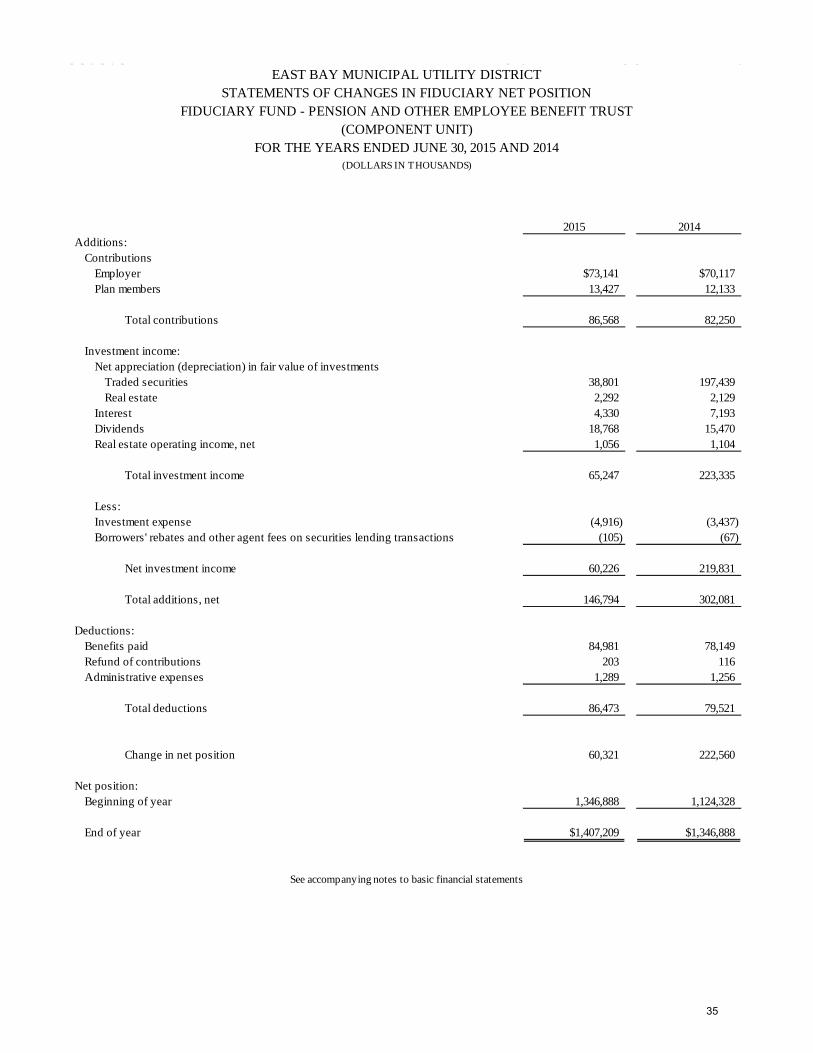
EAST BAY MUNICIPAL UTILITY DISTRICTSTATEMENTS OF CHANGES IN FIDUCIARY NET POSITION
FIDUCIARY FUND - PENSION AND OTHER EMPLOYEE BENEFIT TRUST(COMPONENT UNIT)
FOR THE YEARS ENDED JUNE 30, 2015 AND 2014(DOLLARS IN THOUSANDS)
2015 2014Additions:
ContributionsEmployer $73,141 $70,117Plan members 13,427 12,133
Total contributions 86,568 82,250
Investment income:Net appreciation (depreciation) in fair value of investments
Traded securities 38,801 197,439Real estate 2,292 2,129
Interest 4,330 7,193Dividends 18,768 15,470Real estate operating income, net 1,056 1,104
Total investment income 65,247 223,335
Less:Investment expense (4,916) (3,437)Borrowers' rebates and other agent fees on securities lending transactions (105) (67)
Net investment income 60,226 219,831
Total additions, net 146,794 302,081
Deductions:Benefits paid 84,981 78,149Refund of contributions 203 116Administrative expenses 1,289 1,256
Total deductions 86,473 79,521
Change in net position 60,321 222,560
Net position:Beginning of year 1,346,888 1,124,328
End of year $1,407,209 $1,346,888
See accompanying notes to basic financial statements
35
EAST BAY MUNICIPAL UTILITY DISTRICT NOTES TO BASIC FINANCIAL STATEMENTS
FOR THE YEARS ENDED JUNE 30, 2015 AND 2014 (Dollars in Thousands)
NOTE 1 - SUMMARY OF SIGNIFICANT ACCOUNTING POLICIES
A. Description of the Primary Government
The East Bay Municipal Utility District (the District) was formed in May 1923 under the provisions of the Municipal Utility District Act of 1921, as amended in 1941. The District is comprised of two financially independent entities: the Water System and the Wastewater System. These two entities are governed by the same elected seven-member board of directors which determines such matters as rates and charges for services, approval of contracts, and District policies. The Water System provides administrative and other support services to the Wastewater System. These costs are charged to the Wastewater System.
B. Description of the Component Unit
The District’s Employees’ Retirement System (the Employees’ Retirement System or the Plan) has been reported as a Pension and Other Employee Benefit Trust fund (a fiduciary fund) in the accompanying basic financial statements and is discretely presented. The System provides retirement, disability, survivorship, and post-employment health insurance benefits for eligible directors, officers, and employees of the District. The System is administered by a Retirement Board composed of three members appointed by the board of directors of the District, two members elected by and from the active membership, and one (nonvoting) member elected by and from the retired membership of the System. Retirement Ordinance No. 40 (Ordinance) assigns the authority to establish Plan benefit provisions to the District’s board of directors.
Copies of the audited financial statements of the Employees’ Retirement System may be obtained by writing to the Controller, P.O. Box 24055, Oakland, CA 94623 or visit our website at http://www.ebmud.com.
C. Basis of Presentation
The accounts of the District are organized and operated on a fund basis. The operations of each fund are accounted for with a separate set of self-balancing accounts that comprise its assets, deferred outflows, liabilities, deferred inflows, net position, revenues, and expenses.
The basic financial statements include prior year comparative information. A complete presentation of the prior year information can be found in the District’s financial statements for the year ended June 30, 2014.
The District reports the following major proprietary (enterprise) funds:
The Water System is engaged in the collection, transmission, and distribution of water to communities within Alameda and Contra Costa counties of California.
The Wastewater System is engaged in the interception and treatment of wastewater from residences and industries in the California communities of Alameda, Albany, Berkeley, Emeryville, Oakland, Piedmont, and the Stege Sanitary District.
Additionally, the District reports the following fiduciary fund:
36
EAST BAY MUNICIPAL UTILITY DISTRICT NOTES TO BASIC FINANCIAL STATEMENTS
FOR THE YEARS ENDED JUNE 30, 2015 AND 2014 (Dollars in Thousands)
NOTE 1 - SUMMARY OF SIGNIFICANT ACCOUNTING POLICIES (Continued)
The Pension and Other Employee Benefit Trust is used to account for the resources held by the Employees’ Retirement System which provides retirement, disability, and survivorship benefits for eligible directors, officers, and employees of the District.
Enterprise funds are used to account for operations that are financed and operated in a manner similar to private business enterprises – where the intent of the governing body is that the costs (expenses, including depreciation) of providing goods or services to the general public on a continuing basis be financed or recovered primarily through user charges. The Pension and Other Employee Benefit Trust fund is maintained to account for assets held by the Employees’ Retirement System in a trustee capacity.
D. Basis of Accounting
Proprietary funds and the Pension and Other Employee Benefit Trust fund are accounted for on a flow of economic resources measurement focus, using the accrual basis of accounting. Under this method, all assets, deferred outflows, liabilities and deferred inflows associated with operations are included on the balance sheet, and revenues are recorded when earned and expenses are recorded at the time liabilities are incurred.
Proprietary funds distinguish operating revenues and expenses from non-operating items. Operating revenues and expenses generally result from providing services and producing and delivering goods in connection with a proprietary fund’s principal ongoing operations. The principal operating revenues of the District are charges to customers for sales and services. The District also recognizes wet weather facilities charges as operating revenue. Operating expenses for enterprise funds include the cost of sales and services, administrative expenses, and depreciation on capital assets. All revenues and expenses not meeting this definition are reported as non-operating revenues and expenses.
When both restricted and unrestricted resources are available for use, it is the District’s policy to use restricted resources first, then unrestricted resources as they are needed.
In addition, the accounting policies of the District conform to accounting policies generally accepted in the United States of America for water utilities. The accounts are maintained substantially in accordance with the Uniform System of Accounts for Water Utilities followed by investor-owned and major municipally owned water utilities.
Balance Sheet – The balance sheet is designed to display the financial position of the District. The District’s fund equity is reported as net position, which is broken down into three categories defined as follows:
• Net investment in capital assets – This component of net position consists of capital assets, net ofaccumulated depreciation and reduced by the outstanding balances of any bonds, notes, or otherborrowings that are attributable to the acquisition, construction, or improvement of those assetsand related deferred inflows and outflows.
• Restricted – This component of net position consists of constraints placed on net position usethrough external constraints imposed by creditors (such as through debt covenants), grantors,contributors, or law or regulations of other governments. It also pertains to constraints imposedby law or constitutional provisions or enabling legislation.
37
EAST BAY MUNICIPAL UTILITY DISTRICT NOTES TO BASIC FINANCIAL STATEMENTS
FOR THE YEARS ENDED JUNE 30, 2015 AND 2014 (Dollars in Thousands)
NOTE 1 - SUMMARY OF SIGNIFICANT ACCOUNTING POLICIES (Continued)
• Unrestricted – This component of net position consists of net assets that do not meet thedefinition of “restricted” or “net investment in capital assets.”
Statement of Revenues, Expenses, and Changes in Net Position – The statement of revenues, expenses, and changes in net position is the operating statement for proprietary funds. Revenues are reported by major source. This statement distinguishes between operating and non-operating revenues and expenses and presents a separate subtotal for operating revenues, operating expenses, and other income.
E. Use of Estimates and Assumptions
The preparation of financial statements in conformity with accounting principles generally accepted in the United States of America requires management to make estimates and assumptions that affect the reported amounts of assets and liabilities and disclosure of contingent assets and liabilities at the date of the financial statements and the reported amounts of revenues and expenses during the reporting period. Actual results could differ from those estimates.
F. Capital Assets
Utility Plant – at Original Cost
The cost of additions to utility plant and replacement of retired units of property are capitalized. Cost includes material, direct labor and fringe benefits, transportation, and such indirect items as engineering, supervision, and interest on borrowed funds during construction, net of interest earned on unspent construction proceeds. Repairs, maintenance, and minor purchases of equipment are charged to expenses as incurred.
The depreciated cost of capital assets, plus removal costs, less salvage, is charged to expense upon retirement.
Water Supply Management Program
Costs incurred in this program are debt funded and capitalized in construction in progress. These costs are transferred to utility plant upon completion of the project and depreciated over their useful life. Debt service costs on the debt used to finance the program are recovered in future through connection fees and rates and charges for service to those benefiting from the program.
Preliminary Survey and Investigation Costs
The District capitalizes initial costs incurred to study and evaluate certain potential long-term capital projects. These costs are transferred to property, plant and equipment upon completion of the project and are depreciated over the life of the asset. In the event the project is abandoned, these costs are expensed.
38
EAST BAY MUNICIPAL UTILITY DISTRICT NOTES TO BASIC FINANCIAL STATEMENTS
FOR THE YEARS ENDED JUNE 30, 2015 AND 2014 (Dollars in Thousands)
NOTE 1 - SUMMARY OF SIGNIFICANT ACCOUNTING POLICIES (Continued)
Contract Water Rights The District has contracted with the U.S. Bureau of Reclamation for water deliveries from the Central Valley Project (CVP) through February 2046 (Long Term Renewal Contract), with the anticipation of subsequent renewals of 40 year terms. Payments under the contract include reimbursement based on the amounts of water delivered to EBMUD of capital costs for CVP storage and conveyance facilities (EBMUD’s current allocation is $4,373) and the Operation & Maintenance Deficit (EBMUD’s current balance is $6,781). The Water Enterprise Fund capitalized the two components.
G. Depreciation Depreciation of capital assets is computed on a straight-line basis using the estimated service lives of the
related assets (5 to 100 years). H. Restricted Assets
The District segregates cash and investments into funds that are “Restricted” and “Unrestricted.” Funds are “restricted” when limitations on use of the resources are imposed by creditors, grantors, contributors, laws or regulations of other governments, or imposed by law through constitutional provision or by enabling legislation. “Unrestricted” resources are committed by the Board of Directors through the passage of a resolution, or constrained for a specific purpose by committees or officials with authority delegated by the Board. The exception is the Reserve for Capital Projects which is anticipated but not committed or constrained to be used for the District’s capital improvement program. Unrestricted cash and investments are further categorized into Operating and Capital Reserves:
Operating Reserves:
• Rate Stabilization Fund (RSF) reserve is established by Policy 4.02, as adopted by the Board of Directors in the bi-annual budget, to maintain at least 20% of projected annual water volume revenues for Water and at least 5% of annual operating and maintenance expenses for Wastewater. Funding of the RSF is consistent with the District’s Bond indentures. In fiscal year 2014, the District combined the Rate Stabilization Fund referenced in the Bond indentures and the Contingency and Rate Stabilization Reserve referenced in Policy 4.02 into a single Rate Stabilization Fund reserve to enhance transparency.
• Working Capital reserve is established by Policy 4.02, as adopted by the Board of Directors in the bi-annual budget, to maintain at least three times the District’s monthly net operating and maintenance expenses.
• Self-insurance reserve is established by Policy 4.02, as adopted by the Board of Directors in the bi-annual budget, to maintain 1.25 times the expected annual costs.
• Workers' compensation reserve is established by Policy 4.02, as adopted by the Board of Directors in the bi-annual budget, to maintain a level equal to the estimated future liability for workers’ compensation claims.
39
EAST BAY MUNICIPAL UTILITY DISTRICT NOTES TO BASIC FINANCIAL STATEMENTS
FOR THE YEARS ENDED JUNE 30, 2015 AND 2014 (Dollars in Thousands)
NOTE 1 - SUMMARY OF SIGNIFICANT ACCOUNTING POLICIES (Continued)
Capital Reserves:
• Reserve for Capital Projects comprises the resources available for cash funding of theDistrict’s capital improvement program as projected in conjunction with the bi-annualbudget.
• Reserve Funded CIP (Wastewater) balance is a specific designation [Board Motion 029-94]used to fund wet and dry weather eligible construction projects.
• Vehicle Replacement Fund [Board Motion 94-030] is financed by deposits based on internaluser rate charges, and used to reimburse operational expenditures and vehicle replacementpurchases.
• Equipment Replacement Fund was established by the District with the implementation of theWastewater Capacity Fees effective July 1, 1984. The balance in this account representsfunds set aside for future wastewater department equipment replacements.
Restricted funds include the following:
• Debt funded construction funds are the proceeds of bond or commercial paper issues that arerestricted for use on eligible projects in the District’s capital program. The current yearbalance is $0 for Water and Wastewater.
• Capitalized Interest fund is restricted by the District’s bond indenture for the purpose ofdefraying that bond issue’s debt service payments for a specified period. The current yearbalance is $0 for Water and Wastewater.
• Bond Interest and Redemption fund is required, under the District’s bond indentures, in orderfor the District to transfer funds to the Trustee for the payment of principal and interest on theoutstanding bonds one business day prior to the date such payment is due. The District usesthe Bond Interest and Redemption Fund to segregate funds accumulated for such payments.In addition, under certain of the interest rate swap agreements related to the District’soutstanding bonds, the District is required to post collateral to the swap counterparty to theextent that the District’s total exposure for termination payments under the swap agreementexceeds the threshold amount specified in the applicable swap agreement. The District alsouses the Bond Interest and Redemption Fund to segregate District funds held by theapplicable custodian to satisfy this collateral posting obligation. As of June 30, 2015 and2014, respectively, the balances were $796 and $848 for Water, and $87 and $109 forWastewater.
40
EAST BAY MUNICIPAL UTILITY DISTRICT NOTES TO BASIC FINANCIAL STATEMENTS
FOR THE YEARS ENDED JUNE 30, 2015 AND 2014 (Dollars in Thousands)
NOTE 1 - SUMMARY OF SIGNIFICANT ACCOUNTING POLICIES (Continued)
• Debt Service Reserve fund is created and required to be maintained at a specified level inconnection with certain series of the District’s outstanding bonds. Amounts in a BondReserve Fund may only be used (a) for the payment of principal of and interest on the relatedseries of bonds in the event the District fails to transfer the required payment from the relatedsystem Revenue Fund (the respective designated part of the General Fund) (b) for thepayment of redemption of all of the related series of bonds then outstanding or (c) for thepayment of the final principal and interest payments on the related series of bonds. As of June30, 2015 and 2014, respectively, the balances were $12,672 and $29,368 for Water, and $0and $2,538 for Wastewater.
• Funds received for construction reflect advances received from applicants for work to beperformed by the District and the unspent future water supply component of system capacitycharges. This fund is used for the construction of major facilities, applicant requestedservices, and the design and construction of water supply improvement program projects. Thebalance as of June 30, 2015 was $26,709 for Water ($19,087 for Future Water Supplyprojects, $7,622 for Applicant Work) and $0 for Wastewater. The balance as of June 30, 2014was $27,447 for Water ($19,037 for Future Water Supply projects, $8,410 for ApplicantWork) and $2,214 for Wastewater (Private Lateral Sewer incentive Program).
• FERC partnership fund of $2 million was established January 11, 1999, in compliance withFederal Energy Regulatory Commission (FERC) order which brought resolution to itsMokelumne River Proceeding. The District manages the fund and income derived frominvesting the funds provides operating support to Joint Settlement Agreement with US Fishand Wildlife and California Fish and Game to protect the Mokelumne River Ecosystem fromPardee Reservoir to the Delta. The principal and any unused earnings shall remain theproperty of the District and will revert to the District upon expiration of the agreement inMarch 2031 or upon withdrawal of any party to the agreement. As of June 30, 2015 and2014, respectively, the balances were $2,225 and $2,247 for Water.
• Monetary Reserve represents money on deposit in the name of the District with theAutomated Power Exchange Inc. (APX) in accordance with the terms and conditions of theAutomated Power Exchange Inc. California Master Service Agreement of July 15, 1999,entered between the District and APX for the sale and purchase of electric power. The fundsheld on deposit shall be withdrawn by the Depository and Clearing Agent in the event thatsufficient funds are not deposit in the District settlement account to cover power exchangetransactions. As of June 30, 2015 and June 30, 2014, respectively, the balances were $534and $534 for Water.
• ABAG (Association of Bay Area Governments) Restricted Fund was established as aninterest bearing account for Regional General Permit effort by 7 local water agencies inOctober 2013. The agreement between the District and ABAG, approved by Board motion029-12 on March 13, 2012, requires the District to collect deposits and pay invoices inaccordance with a cost allocation agreed among the water agencies. As of June 30, 2015 and2014, respectively, the balances were $0 and $25 for Water.
41
EAST BAY MUNICIPAL UTILITY DISTRICT NOTES TO BASIC FINANCIAL STATEMENTS
FOR THE YEARS ENDED JUNE 30, 2015 AND 2014 (Dollars in Thousands)
NOTE 1 - SUMMARY OF SIGNIFICANT ACCOUNTING POLICIES (Continued)
I. Deferred Amount on Bond Refundings
Gains and losses incurred in connection with debt refunding transactions are deferred and amortized over the shorter of the life of the refunded debt or the new debt.
J. Cash and Cash Equivalents
For purposes of the statement of cash flows, the District considers all highly liquid investments with original maturities of three months or less at the date of purchase to be cash equivalents.
K. District Investments
Investments are stated at fair value. Included in investment income (loss) is the net change in the fair value of investments, which consists of the realized gains or losses and the unrealized appreciation (depreciation) of those investments.
Measurement of the fair value of investments is based upon quoted market prices, if available. The estimated fair value of investments that have no quoted market price is determined based on equivalent yields for such securities or for securities of comparable maturity, quality, and type as obtained from market makers.
Each of the financial instruments invested in by the District represents a potential concentration of credit risk. However, as the portfolio and the components of the various instruments are diversified, and issuers of securities are dispersed throughout many industries and geographic locations, the concentrations of credit risk are limited.
L. Retirement System Investments
Investments are reported at fair value. Securities and bonds traded on a national or international exchange are valued at the last reported sales price at current exchange rates. Investments that have no quoted market price are reported at estimated fair value, which is determined based on yields equivalent for such securities or for securities of comparable maturity, quality, and type as obtained from market makers. Measurement of the fair value of real estate investments is estimated by the investment managers and reflects both internal and independent appraisals of real estate properties.
The System presents in the Statements of Changes in Plan Net Position the net change in the fair value of its investments, which consists of the realized gains or losses and the unrealized appreciation (depreciation) on those investments. Purchases and sales of securities are recorded on a trade-date basis. Interest income is recorded on the accrual basis. Dividends are recorded on the ex-dividend date.
Each of the financial instruments invested in by the System represents a potential concentration of credit risk. However, as the portfolio and the components of the various instruments are diversified and issuers of securities are dispersed throughout many industries and geographical locations, the concentrations of credit risk are limited.
42
EAST BAY MUNICIPAL UTILITY DISTRICT NOTES TO BASIC FINANCIAL STATEMENTS
FOR THE YEARS ENDED JUNE 30, 2015 AND 2014 (Dollars in Thousands)
NOTE 1 - SUMMARY OF SIGNIFICANT ACCOUNTING POLICIES (Continued)
Retirement Board policies permit the Employees’ Retirement System to use investments of the pension plan to enter into securities lending transactions, which are loans of securities to broker-dealers and other entities for collateral with a simultaneous agreement to return collateral for the same securities in the future. The System’s securities custodian is an agent in lending the Plan’s securities for cash collateral, U.S. government securities, and irrevocable letters of credit of 102% for domestic securities lent and 105% for international securities lent. As of June 30, 2015, the Employees’ Retirement System had no credit risk exposure to borrowers because the amounts the Employees’ Retirement System owes the borrowers exceed the amounts the borrowers owe the Employees’ Retirement System.
Contracts with the lending agent require them to indemnify the Employees’ Retirement System under certain circumstances if the borrowers fail to return the securities (and if the collateral is inadequate to replace the securities lent) or fail to pay the System for income distributions by the securities issuers while the securities are on loan. The risk of any loss of collateral or investment of cash collateral (including a loss of income or principal, or loss of market value thereon) lies with the System, except for losses resulting from negligence or intentional misconduct of the agent in performing the duties allocated under the securities lending agreement with respect to collateral. During the year ended June 30, 2015, there were no violations of legal or contractual provisions, and no borrower or lending agent default losses known to the securities lending agent.
In lending securities, cash collateral is invested in the lending agent’s short-term investment pool, which as of June 30, 2015, had a weighted average maturity of 26 days. The relationship between the maturities of the investment pool and the System’s loans is affected by the maturities of the securities loans made by other entities that use the agent’s pool, which the System cannot determine. Cash collateral may also be invested separately in term loans, in which case the maturity of the collateral investment generally matches the term of the loan. Noncash collateral cannot be pledged or sold unless the borrower defaults. All securities loans can be terminated on demand by either the lender or the borrower, although the average term of overall loans for the System was approximately 110 days. There are no dividends or coupon payments owing on the securities lent. Cash received as collateral on securities lending transactions is reported as an asset of the System with a corresponding liability.
As of June 30, 2015, the fair value of securities on loan, which was comprised of Global Equities, US Corporate Fixed Equities, US Equities, and US Government Fixed Equities, was $108,548. The total cash collateral held by the System’s custodian to secure these securities on loan was valued at $106,202.
M. Material and Supplies
Material and supplies inventories are valued at cost, which approximates market, using the average-cost method.
43
EAST BAY MUNICIPAL UTILITY DISTRICT NOTES TO BASIC FINANCIAL STATEMENTS
FOR THE YEARS ENDED JUNE 30, 2015 AND 2014 (Dollars in Thousands)
NOTE 1 - SUMMARY OF SIGNIFICANT ACCOUNTING POLICIES (Continued)
N. Compensated Absences
Compensated absences as of June 30, 2015, are included on the balance sheet in accounts payable and accrued expenses. In previous years, trends have shown that the District employees utilize the accruals annually, therefore, amounts payable are accrued and reported as a current liability on the financial statements.
The changes in compensated absences were as follows:
Water System Wastewater System TotalJune 30, 2015 June 30, 2014 June 30, 2015 June 30, 2014 June 30, 2015 June 30, 2014
Beginning Balance $25,625 $23,452 $4,232 $4,066 $29,857 $27,518Additions 25,938 26,360 4,536 4,527 30,474 30,887Payments (25,139) (24,187) (4,590) (4,361) (29,729) (28,548)
Ending Balance $26,424 $25,625 $4,178 $4,232 $30,602 $29,857
O. Revenue
Water billings include charges for water flow, elevation, and a monthly meter charge. Customer water meters are read on a cyclical basis throughout a monthly or bimonthly period. Bills are rendered and revenue is recognized in the period that meters are read.
Wastewater treatment billings are a combination of flow, strength charges, and a monthly service charge. Customer bills are rendered on a cyclical basis throughout a monthly or bimonthly period, and revenue is recognized in the period in which bills are rendered.
Wet weather facilities charges are designed to finance the operating and capital costs related to wet weather sewage flows and are billed annually on the property tax bill.
P. Interest Rate Swap
The District enters into interest rate swap agreements to modify interest rates on some outstanding debt. The net interest is recorded in the financial statements annually.
In June 2008, GASB issued Statement No. 53, Accounting and Financial Reporting for Derivative Instruments (GASB 53). The statement specifically requires governments to measure and report most derivative instruments at fair value in their financial statements that are prepared using the economic resources measurement focus and the accrual basis of accounting. The requirement of reporting the derivative instruments at fair value on the face of the basic financial statements gives the users of those statements a clearer look into the risks their governments are sometimes exposed to when they enter into these transactions and how those risks are managed. The statement also addresses hedge accounting requirements and improves disclosures, providing a summary of the government’s derivative instrument activity, its objectives for entering into derivative instruments, and their significant terms and risks. The District implemented GASB 53 in fiscal 2010.
44
EAST BAY MUNICIPAL UTILITY DISTRICT NOTES TO BASIC FINANCIAL STATEMENTS
FOR THE YEARS ENDED JUNE 30, 2015 AND 2014 (Dollars in Thousands)
NOTE 1 - SUMMARY OF SIGNIFICANT ACCOUNTING POLICIES (Continued)
Q. Deferred Outflows/Inflows of Resources
In addition to assets, the statement of financial position or balance sheet will sometimes report a separate section for deferred outflows of resources. This separate financial statement element, deferred outflows of resources, represents a consumption of net position or fund balance that applies to a future period(s) and so will not be recognized as an outflow of resources (expense/expenditure) until then.
In addition to liabilities, the statement of financial position or balance sheet will sometimes report a separate section for deferred inflows of resources. This separate financial statement element, deferred inflows of resources, represents an acquisition of net position or fund balance that applies to a future period(s) and so will not be recognized as an inflow of resources (revenue) until that time.
R. Implementation of Governmental Accounting Standards Board (GASB) Pronouncements
GASB Statement No. 68 – In June 2012, the GASB issued Statement No. 68, Accounting and Financial Reporting for Pensions—an amendment of GASB Statement No. 27. The requirements of this Statement will improve the decision-usefulness of information in employer and governmental nonemployer contributing entity financial reports and will enhance its value for assessing accountability and interperiod equity by requiring recognition of the entire net pension liability and a more comprehensive measure of pension expense. The provisions of this Statement are effective for financial statements for periods beginning after June 15, 2014, therefore, the District implemented this Statement in fiscal year ending June 30, 2015, which required a restatement to the District’s financial statements. The financial statements for fiscal year ended June 30, 2014 could not be restated as the information required to do so was not readily available. See Note 8 for additional information.
GASB Statement No. 70 – In 2013, the GASB issued Statement No. 70, Accounting and Financial Reporting for Nonexchange Finance Guarantees. This Statement requires a government that extends a nonexchange financial guarantee to recognize a liability when qualitative factors and historical data, if any, indicate that it is more than likely than not the government will be required to make a payment on that guarantee. The provisions of this Statement are effective for reporting periods beginning after June 15, 2013, therefore, the District implemented this statement for fiscal year ended June 30, 2015, and had no impact on the financial statements.
GASB Statement No. 71 – In 2014, the GASB issued Statement No. 71, Pension Transition for Contributions Made Subsequent to the Measurement Date—an amendment of GASB Statement No. 68. The requirements of this Statement will eliminate the source of a potential significantunderstatement of restated beginning net position and expense in the first year of implementation of Statement 68 in the accrual-basis financial statements of employers and non-employer contributing entities. This benefit will be achieved without the imposition of significant additional costs. The provisions of this Statement are effective for financial statements for periods beginning after June 15, 2014, therefore, the District implemented this Statement in fiscal year ending June 30, 2015, along with GASB 68 as discussed above.
45
EAST BAY MUNICIPAL UTILITY DISTRICT NOTES TO BASIC FINANCIAL STATEMENTS
FOR THE YEARS ENDED JUNE 30, 2015 AND 2014 (Dollars in Thousands)
NOTE 2 - CASH AND INVESTMENTS
A. Classification
Reconciliations of cash and investments reported on the financial statements as of June 30, 2015, are as follows:
Water WastewaterDistrict Enterprise Funds: System System TotalCash and investments included in current assets $434,731 $91,759 $526,490Cash and investments included in restricted investments 42,936 87 43,023
Total District cash and investments 477,667 91,846 569,513 Less investments (128,945) (24,737) (153,682)
Cash and cash equivalents $348,722 $67,109 $415,831
System Pension Trust Funds:Cash and cash equivalents $29,713 $501 $30,214Invested securities lending collateral 106,749 1,799 108,548 Retirement system investments 1,352,757 22,793 1,375,550
Total System cash and investments $1,489,219 $25,093 $1,514,312
B. District Enterprise Fund Investments Authorized by the California Government Code and the District’s Investment Policy
The District’s Investment Policy and the California Government Code allow the District to invest in the following, provided the credit ratings of the issuers are acceptable to the District; and approved percentages and maturities are not exceeded. The table below also identifies certain provisions of the California Government Code, or the District’s Investment Policy where the District’s Investment Policy is more restrictive and provides information as to the limitations as they relate to interest rate risk, credit risk and concentration risk.
46
EAST BAY MUNICIPAL UTILITY DISTRICT NOTES TO BASIC FINANCIAL STATEMENTS
FOR THE YEARS ENDED JUNE 30, 2015 AND 2014 (Dollars in Thousands)
NOTE 2 - CASH AND INVESTMENTS (Continued)
Minimum Maximum MaximumMaximum Credit in InvestmentMaturity Quality Portfolio In One Issuer
270 Days N/A 20% 10%$50,000
Investment Fund (LAIF Pool) Upon Demand N/A per account N/AU. S. Treasury Bonds, Notes and Bills 5 Years N/A 0 to 100% N/AU.S. Government Agency and
U.S. Government-Sponsored 40% in eachEnterprise Obligations 5 Years N/A 0 to 100% Agency
Bankers' Acceptances 180 Days N/A 40% 10%Commercial Paper 270 Days A1, P1 or F1 25% 10%Negotiable Certificates of Deposit 5 Years AA 30% 10%Time Certificates of Deposit – Banks
or Savings and Loans 5 Years N/A 30% 10%Medium Term Corporate Notes 5 Years AA 30% 10%Money Market Mutual Funds N/A AAA 40% 10%Municipal Bonds 5 Years AA 40% 10%Calif Asset Management Pgm (CAMP) Upon Demand Highest
Rating10% 10%
Authorized Investment Type
Repurchase AgreementsState of California Local Agency
The District does not enter into reverse repurchase agreements.
C. District Enterprise Fund Investments Authorized by Debt Agreements
The District must maintain required amounts of cash and investments with trustees or fiscal agents under the terms of certain debt issues. These funds are unexpended bond proceeds or are pledged reserves to be used if the District fails to meet its obligations under these debt issues. The California Government Code requires these funds to be invested in accordance with District resolutions, bond indentures or State statutes. The table below identifies the investment types that are authorized for investments held by fiscal agents. The table also identifies certain provisions of these debt agreements:
Minimum Credit Quality
Repurchase Agreements Top Four Short term Rating CategoryU.S. Treasury Bonds, Notes and Bills N/AU.S. Government Agency and
U.S. Government-SponsoredEnterprise Obligation N/A
State Obligations Not lower than District's bond ratingCommercial Paper Top Rating CategoryNegotiable Certificates of Deposit FDIC insured or collateralised Time Certificates of Deposits - Banks
or Savings and Loans FDIC insured or collateralised Corporate Notes and Bonds Not lower than District's bond ratingVariable Rate Obligations Not lower than District's bond ratingCash Swap Agreements Top Rating CategoryGuaranteed Investement Contract Not lower than District's bond ratingShares of Beneficial Interest Top Rating Category
Authorized Investment Type
47
EAST BAY MUNICIPAL UTILITY DISTRICT NOTES TO BASIC FINANCIAL STATEMENTS
FOR THE YEARS ENDED JUNE 30, 2015 AND 2014 (Dollars in Thousands)
NOTE 2 - CASH AND INVESTMENTS (Continued)
D. Employees Retirement System Authorized Investment Strategy
The System’s investment policies authorize the System to invest in financial instruments in three broad investment categories: equity, fixed income, and real estate. These financial instruments can include, but are not limited to, corporate bonds, commercial paper, U.S. government securities, common and preferred stock, real estate investment trusts, and mutual funds. Fixed income investments may include futures and options contracts in order to provide added flexibility in managing the fixed income portfolio. The following is a summary of the System investment policy adopted by the System with Resolution No. 6807.
The Retirement Board is authorized to designate multiple investment managers to manage the assets under their supervision subject to the laws of the State of California and the Investment Guidelines established by the Retirement Board. Allocation of assets to the investment managers shall be determined by the Retirement Board to accommodate changing conditions and laws. The long-range asset allocation goal is as follows:
Core Fixed Income 10% Non-Core Fixed Income 10% Domestic Equity 40% Covered Calls 20% International Equity 15% Real Estate 5% Allocation to Cash 0%
The composite asset allocation goal will be pursued by the Retirement System on a long-term basis and be revised if significant changes occur within the economic and/or capital market environment. Progress toward the goal will be reviewed at least annually.
The Director of Finance is authorized to transfer assets from any asset class which exceeds the long-term asset allocation goal by more than 3% at the end of two or more consecutive quarters, allocating the excess assets to a manager or group of managers with the exception of real estate managers. The Director of Finance is further authorized to withdraw assets from assigned managers as necessary to efficiently meet operating needs.
The equity and fixed income asset allocations may vary by up to ± 5% from the long-range asset allocation goals.
The core fixed income target allocation (10% of the total portfolio) will primarily consist of U.S. denominated fixed income securities. Individual managers may invest up to 20% of their assets in international fixed income securities.
The non-core fixed income target allocation (10% of the total portfolio) will primarily consist of U.S. denominated fixed income securities. Individual managers may invest up to 35% of their assets in international fixed income securities. It is expected that this allocation may have a material allocation to below investment grade securities.
48
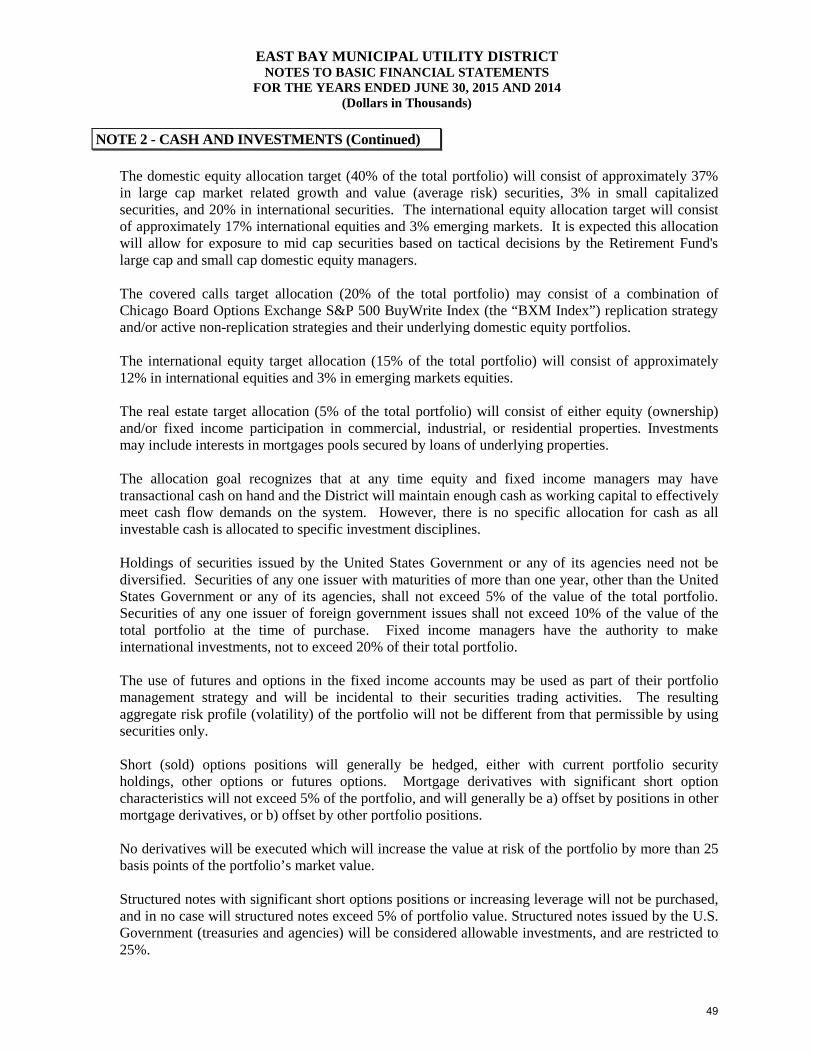
EAST BAY MUNICIPAL UTILITY DISTRICT NOTES TO BASIC FINANCIAL STATEMENTS
FOR THE YEARS ENDED JUNE 30, 2015 AND 2014 (Dollars in Thousands)
NOTE 2 - CASH AND INVESTMENTS (Continued)
The domestic equity allocation target (40% of the total portfolio) will consist of approximately 37% in large cap market related growth and value (average risk) securities, 3% in small capitalized securities, and 20% in international securities. The international equity allocation target will consist of approximately 17% international equities and 3% emerging markets. It is expected this allocation will allow for exposure to mid cap securities based on tactical decisions by the Retirement Fund's large cap and small cap domestic equity managers.
The covered calls target allocation (20% of the total portfolio) may consist of a combination of Chicago Board Options Exchange S&P 500 BuyWrite Index (the “BXM Index”) replication strategy and/or active non-replication strategies and their underlying domestic equity portfolios.
The international equity target allocation (15% of the total portfolio) will consist of approximately 12% in international equities and 3% in emerging markets equities.
The real estate target allocation (5% of the total portfolio) will consist of either equity (ownership) and/or fixed income participation in commercial, industrial, or residential properties. Investments may include interests in mortgages pools secured by loans of underlying properties.
The allocation goal recognizes that at any time equity and fixed income managers may have transactional cash on hand and the District will maintain enough cash as working capital to effectively meet cash flow demands on the system. However, there is no specific allocation for cash as all investable cash is allocated to specific investment disciplines.
Holdings of securities issued by the United States Government or any of its agencies need not be diversified. Securities of any one issuer with maturities of more than one year, other than the United States Government or any of its agencies, shall not exceed 5% of the value of the total portfolio. Securities of any one issuer of foreign government issues shall not exceed 10% of the value of the total portfolio at the time of purchase. Fixed income managers have the authority to make international investments, not to exceed 20% of their total portfolio.
The use of futures and options in the fixed income accounts may be used as part of their portfolio management strategy and will be incidental to their securities trading activities. The resulting aggregate risk profile (volatility) of the portfolio will not be different from that permissible by using securities only.
Short (sold) options positions will generally be hedged, either with current portfolio security holdings, other options or futures options. Mortgage derivatives with significant short option characteristics will not exceed 5% of the portfolio, and will generally be a) offset by positions in other mortgage derivatives, or b) offset by other portfolio positions.
No derivatives will be executed which will increase the value at risk of the portfolio by more than 25 basis points of the portfolio’s market value.
Structured notes with significant short options positions or increasing leverage will not be purchased, and in no case will structured notes exceed 5% of portfolio value. Structured notes issued by the U.S. Government (treasuries and agencies) will be considered allowable investments, and are restricted to 25%.
49
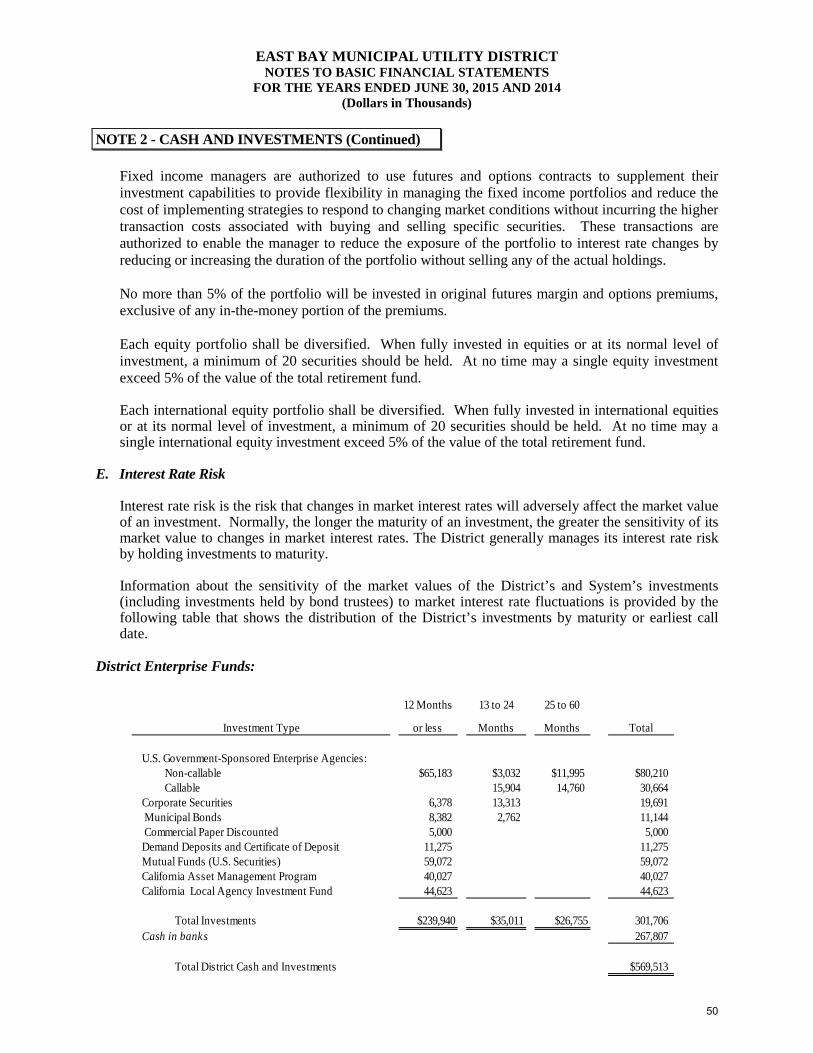
EAST BAY MUNICIPAL UTILITY DISTRICT NOTES TO BASIC FINANCIAL STATEMENTS
FOR THE YEARS ENDED JUNE 30, 2015 AND 2014 (Dollars in Thousands)
NOTE 2 - CASH AND INVESTMENTS (Continued)
Fixed income managers are authorized to use futures and options contracts to supplement their investment capabilities to provide flexibility in managing the fixed income portfolios and reduce the cost of implementing strategies to respond to changing market conditions without incurring the higher transaction costs associated with buying and selling specific securities. These transactions are authorized to enable the manager to reduce the exposure of the portfolio to interest rate changes by reducing or increasing the duration of the portfolio without selling any of the actual holdings.
No more than 5% of the portfolio will be invested in original futures margin and options premiums, exclusive of any in-the-money portion of the premiums.
Each equity portfolio shall be diversified. When fully invested in equities or at its normal level of investment, a minimum of 20 securities should be held. At no time may a single equity investment exceed 5% of the value of the total retirement fund.
Each international equity portfolio shall be diversified. When fully invested in international equities or at its normal level of investment, a minimum of 20 securities should be held. At no time may a single international equity investment exceed 5% of the value of the total retirement fund.
E. Interest Rate Risk
Interest rate risk is the risk that changes in market interest rates will adversely affect the market value of an investment. Normally, the longer the maturity of an investment, the greater the sensitivity of its market value to changes in market interest rates. The District generally manages its interest rate risk by holding investments to maturity.
Information about the sensitivity of the market values of the District’s and System’s investments (including investments held by bond trustees) to market interest rate fluctuations is provided by the following table that shows the distribution of the District’s investments by maturity or earliest call date.
District Enterprise Funds:
12 Months 13 to 24 25 to 60
Investment Type or less Months Months Total
U.S. Government-Sponsored Enterprise Agencies:Non-callable $65,183 $3,032 $11,995 $80,210Callable 15,904 14,760 30,664
Corporate Securities 6,378 13,313 19,691Municipal Bonds 8,382 2,762 11,144Commercial Paper Discounted 5,000 5,000
Demand Deposits and Certificate of Deposit 11,275 11,275 Mutual Funds (U.S. Securities) 59,072 59,072 California Asset Management Program 40,027 40,027 California Local Agency Investment Fund 44,623 44,623
Total Investments $239,940 $35,011 $26,755 301,706 Cash in banks 267,807
Total District Cash and Investments $569,513
50
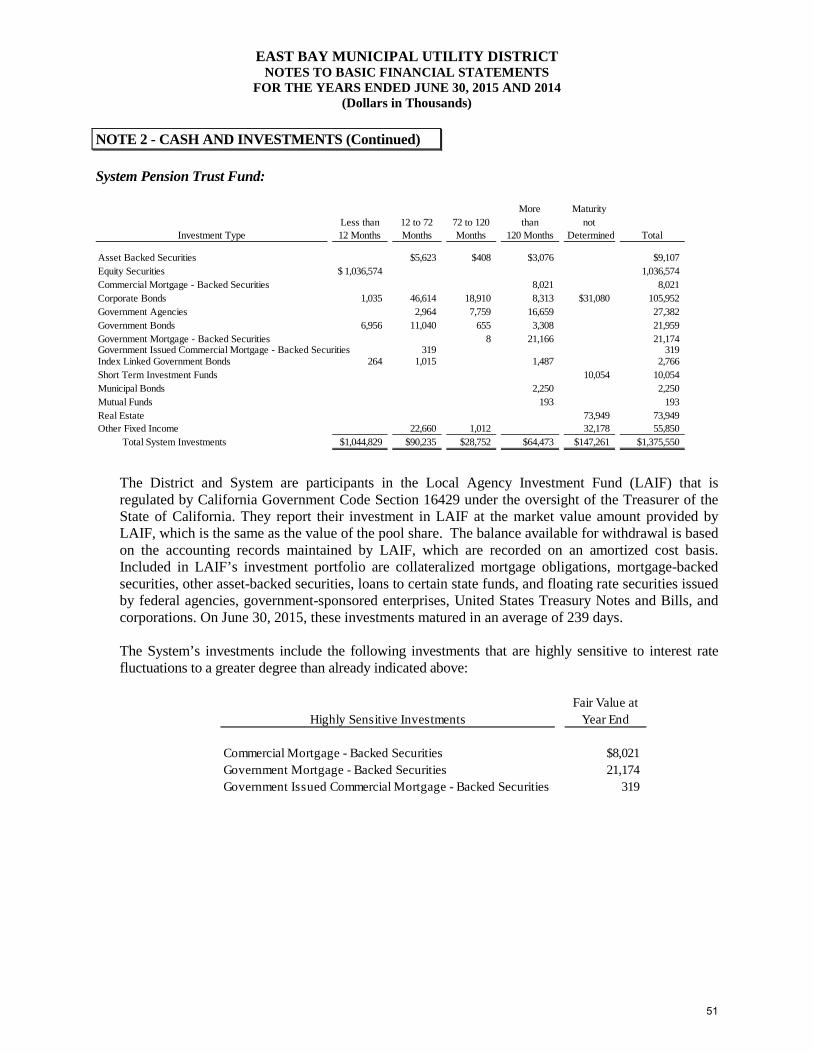
EAST BAY MUNICIPAL UTILITY DISTRICT NOTES TO BASIC FINANCIAL STATEMENTS
FOR THE YEARS ENDED JUNE 30, 2015 AND 2014 (Dollars in Thousands)
NOTE 2 - CASH AND INVESTMENTS (Continued)
System Pension Trust Fund:
More MaturityLess than 12 to 72 72 to 120 than not
Investment Type 12 Months Months Months 120 Months Determined Total
Asset Backed Securities $5,623 $408 $3,076 $9,107Equity Securities 1,036,574$ 1,036,574Commercial Mortgage - Backed Securities 8,021 8,021Corporate Bonds 1,035 46,614 18,910 8,313 $31,080 105,952Government Agencies 2,964 7,759 16,659 27,382Government Bonds 6,956 11,040 655 3,308 21,959Government Mortgage - Backed Securities 8 21,166 21,174Government Issued Commercial Mortgage - Backed Securities 319 319Index Linked Government Bonds 264 1,015 1,487 2,766Short Term Investment Funds 10,054 10,054Municipal Bonds 2,250 2,250Mutual Funds 193 193Real Estate 73,949 73,949Other Fixed Income 22,660 1,012 32,178 55,850
Total System Investments $1,044,829 $90,235 $28,752 $64,473 $147,261 $1,375,550
The District and System are participants in the Local Agency Investment Fund (LAIF) that is regulated by California Government Code Section 16429 under the oversight of the Treasurer of the State of California. They report their investment in LAIF at the market value amount provided by LAIF, which is the same as the value of the pool share. The balance available for withdrawal is based on the accounting records maintained by LAIF, which are recorded on an amortized cost basis. Included in LAIF’s investment portfolio are collateralized mortgage obligations, mortgage-backed securities, other asset-backed securities, loans to certain state funds, and floating rate securities issued by federal agencies, government-sponsored enterprises, United States Treasury Notes and Bills, and corporations. On June 30, 2015, these investments matured in an average of 239 days.
The System’s investments include the following investments that are highly sensitive to interest rate fluctuations to a greater degree than already indicated above:
Fair Value atHighly Sensitive Investments Year End
Commercial Mortgage - Backed Securities $8,021Government Mortgage - Backed Securities 21,174Government Issued Commercial Mortgage - Backed Securities 319
51
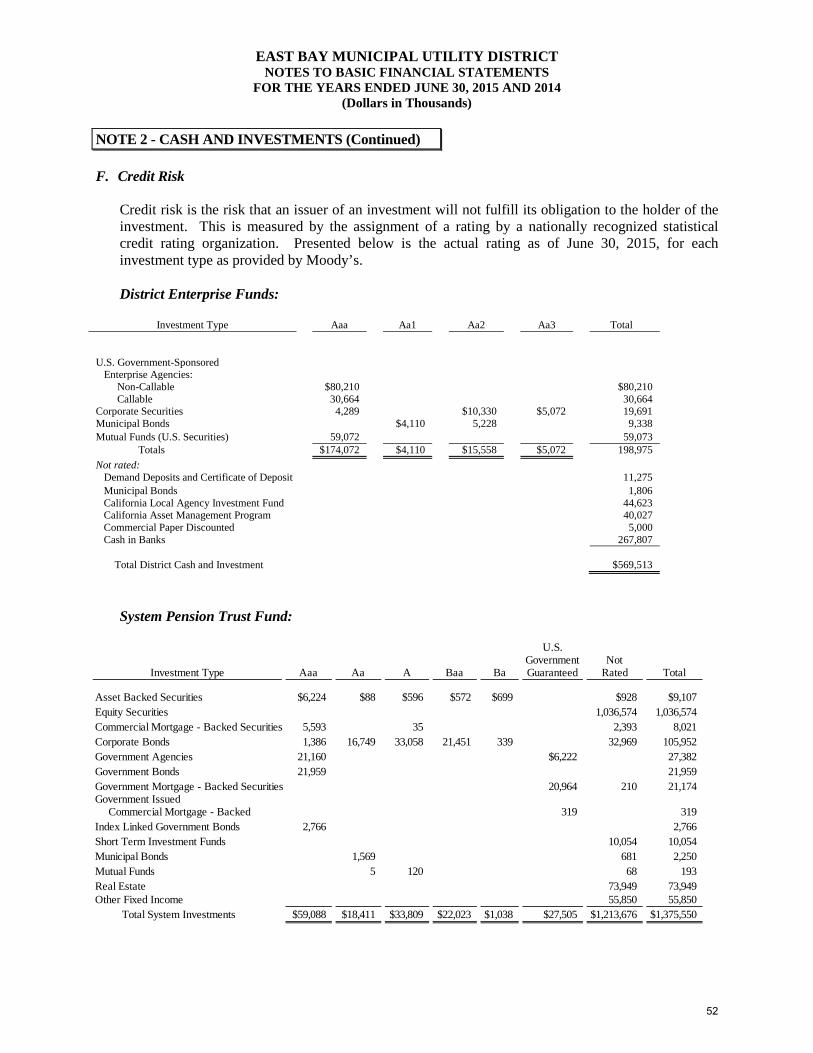
EAST BAY MUNICIPAL UTILITY DISTRICT NOTES TO BASIC FINANCIAL STATEMENTS
FOR THE YEARS ENDED JUNE 30, 2015 AND 2014 (Dollars in Thousands)
NOTE 2 - CASH AND INVESTMENTS (Continued)
F. Credit Risk
Credit risk is the risk that an issuer of an investment will not fulfill its obligation to the holder of the investment. This is measured by the assignment of a rating by a nationally recognized statistical credit rating organization. Presented below is the actual rating as of June 30, 2015, for each investment type as provided by Moody’s.
District Enterprise Funds:
Investment Type Aaa Aa1 Aa2 Aa3 Total
U.S. Government-Sponsored Enterprise Agencies:
Non-Callable $80,210 $80,210 Callable 30,664 30,664 Corporate Securities 4,289 $10,330 $5,072 19,691 Municipal Bonds $4,110 5,228 9,338 Mutual Funds (U.S. Securities) 59,072 59,073
Totals $174,072 $4,110 $15,558 $5,072 198,975 Not rated: Demand Deposits and Certificate of Deposit 11,275 Municipal Bonds 1,806 California Local Agency Investment Fund 44,623 California Asset Management Program 40,027 Commercial Paper Discounted 5,000 Cash in Banks 267,807
Total District Cash and Investment $569,513
System Pension Trust Fund:
U.S.Government Not
Investment Type Aaa Aa A Baa Ba Guaranteed Rated Total
Asset Backed Securities $6,224 $88 $596 $572 $699 $928 $9,107Equity Securities 1,036,574 1,036,574Commercial Mortgage - Backed Securities 5,593 35 2,393 8,021Corporate Bonds 1,386 16,749 33,058 21,451 339 32,969 105,952Government Agencies 21,160 $6,222 27,382Government Bonds 21,959 21,959Government Mortgage - Backed Securities 20,964 210 21,174Government Issued
Commercial Mortgage - Backed 319 319Index Linked Government Bonds 2,766 2,766Short Term Investment Funds 10,054 10,054Municipal Bonds 1,569 681 2,250Mutual Funds 5 120 68 193Real Estate 73,949 73,949Other Fixed Income 55,850 55,850
Total System Investments $59,088 $18,411 $33,809 $22,023 $1,038 $27,505 $1,213,676 $1,375,550
52
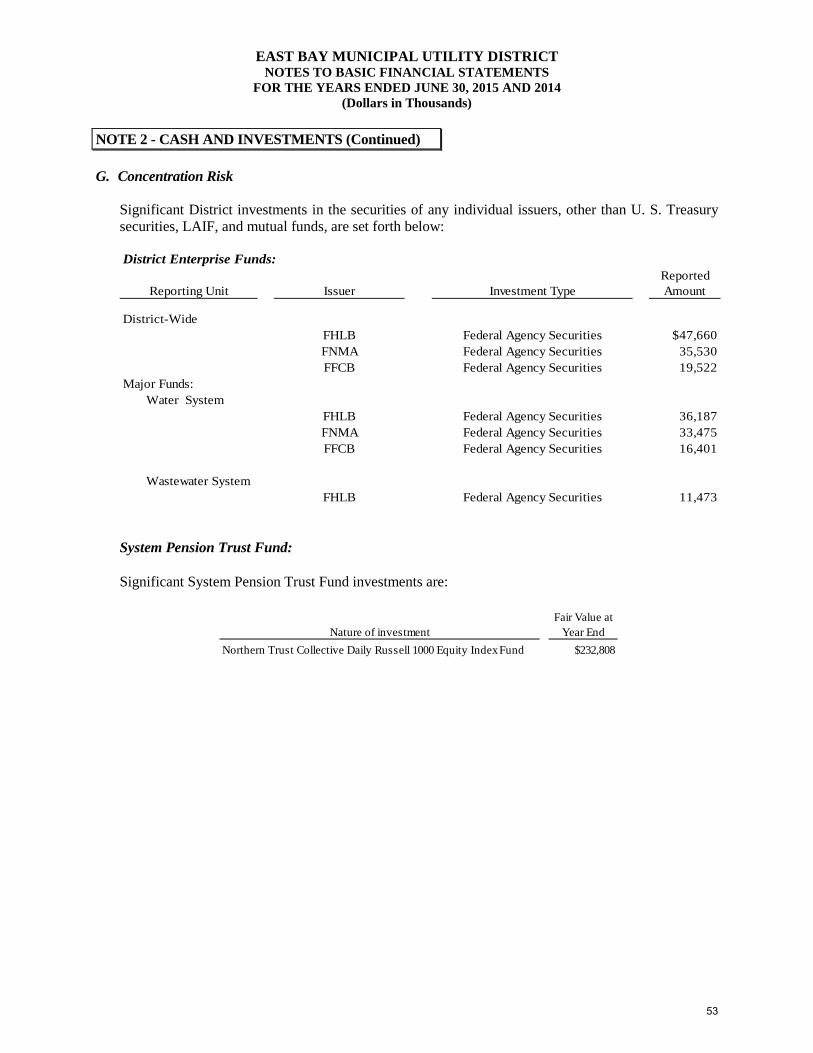
EAST BAY MUNICIPAL UTILITY DISTRICT NOTES TO BASIC FINANCIAL STATEMENTS
FOR THE YEARS ENDED JUNE 30, 2015 AND 2014 (Dollars in Thousands)
NOTE 2 - CASH AND INVESTMENTS (Continued)
G. Concentration Risk
Significant District investments in the securities of any individual issuers, other than U. S. Treasury securities, LAIF, and mutual funds, are set forth below:
District Enterprise Funds:Reported
Reporting Unit Issuer Investment Type Amount
District-WideFHLB Federal Agency Securities $47,660FNMA Federal Agency Securities 35,530FFCB Federal Agency Securities 19,522
Major Funds:Water System
FHLB Federal Agency Securities 36,187FNMA Federal Agency Securities 33,475FFCB Federal Agency Securities 16,401
Wastewater SystemFHLB Federal Agency Securities 11,473
System Pension Trust Fund:
Significant System Pension Trust Fund investments are:
Fair Value atNature of investment Year End
Northern Trust Collective Daily Russell 1000 Equity Index Fund $232,808
53
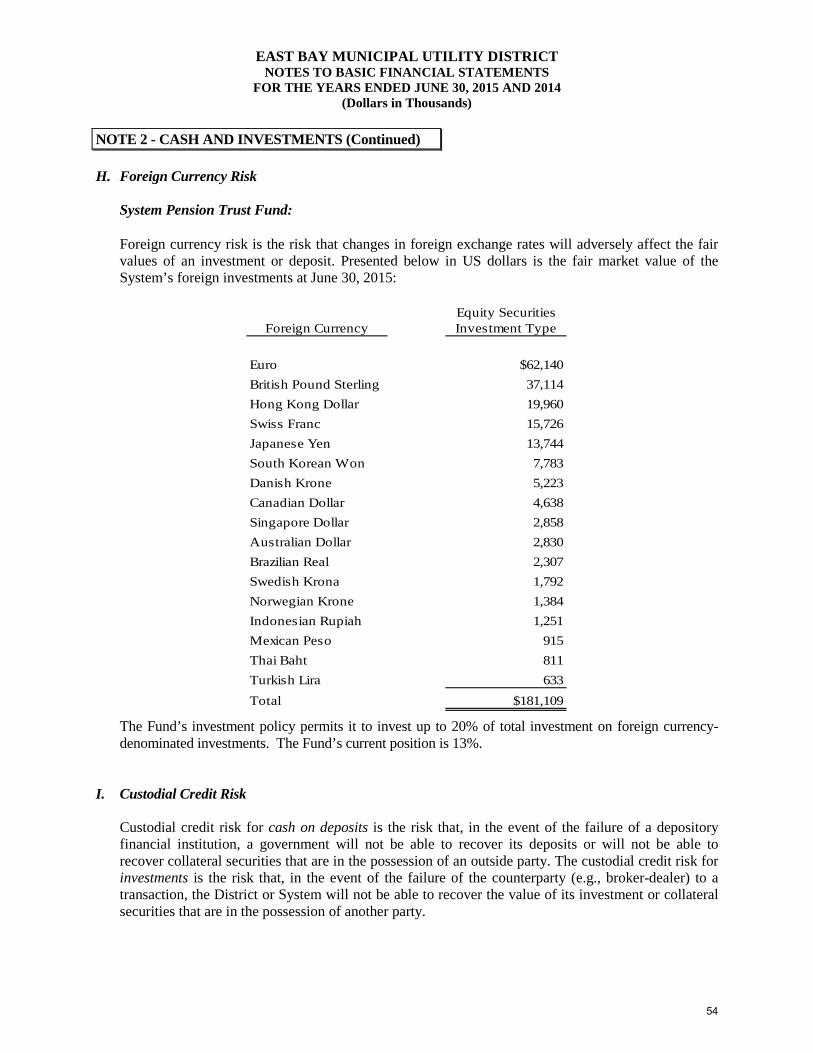
EAST BAY MUNICIPAL UTILITY DISTRICT NOTES TO BASIC FINANCIAL STATEMENTS
FOR THE YEARS ENDED JUNE 30, 2015 AND 2014 (Dollars in Thousands)
NOTE 2 - CASH AND INVESTMENTS (Continued)
H. Foreign Currency Risk
System Pension Trust Fund:
Foreign currency risk is the risk that changes in foreign exchange rates will adversely affect the fair values of an investment or deposit. Presented below in US dollars is the fair market value of the System’s foreign investments at June 30, 2015:
Equity SecuritiesForeign Currency Investment Type
Euro $62,140 British Pound Sterling 37,114Hong Kong Dollar 19,960Swiss Franc 15,726Japanese Yen 13,744South Korean Won 7,783Danish Krone 5,223Canadian Dollar 4,638Singapore Dollar 2,858Australian Dollar 2,830Brazilian Real 2,307Swedish Krona 1,792Norwegian Krone 1,384Indonesian Rupiah 1,251Mexican Peso 915Thai Baht 811Turkish Lira 633Total $181,109
The Fund’s investment policy permits it to invest up to 20% of total investment on foreign currency-denominated investments. The Fund’s current position is 13%.
I. Custodial Credit Risk
Custodial credit risk for cash on deposits is the risk that, in the event of the failure of a depository financial institution, a government will not be able to recover its deposits or will not be able to recover collateral securities that are in the possession of an outside party. The custodial credit risk for investments is the risk that, in the event of the failure of the counterparty (e.g., broker-dealer) to a transaction, the District or System will not be able to recover the value of its investment or collateral securities that are in the possession of another party.
54
EAST BAY MUNICIPAL UTILITY DISTRICT NOTES TO BASIC FINANCIAL STATEMENTS
FOR THE YEARS ENDED JUNE 30, 2015 AND 2014 (Dollars in Thousands)
NOTE 2 - CASH AND INVESTMENTS (Continued)
California Law requires banks and savings and loan institutions to pledge government securities with a market value of 110% of the District’s cash on deposit, or first trust deed mortgage notes with a market value of 150% of the deposit, as collateral for these deposits. Under California Law this collateral is held in a separate investment pool by another institution in the District’s name and places the District ahead of general creditors of the institution.
The District and System invest in individual investments and in investment pools. Individual investments are evidenced by specific identifiable securities instruments, or by an electronic entry registering the owner in the records of the institution issuing the security, called the book entry system. In order to increase security, the District and System employ the Trust Department of a bank or trustee as the custodian of certain District and System managed investments, regardless of their form.
As of June 30, 2015 and 2014, the System’s brokers/dealers held $294 and $77, respectively, in cash and US government bonds exposed to custodial credit risk.
J. Joint Powers Authority
DSRSD/EBMUD Regional Water Authority - On June 28, 1995, the Dublin San Ramon Service District (DSRSD) and East Bay Municipal Utility District (District) entered into a Joint Powers Agreement (JPA) and established the DSRSD/EBMUD Recycled Water Authority (DERWA) with the purpose of creating a recycle water program in the San Ramon and Livermore-Amador Valleys. The JPA governing body is not substantially the same at the District and its independent Board consists of two directors from the DSRSD and District. The JPA books and records are being maintained separately from DSRSD and the District. The DSRSD and District make member contribution to fund the JPA start-up and capital projects at the request of the JPA on an as needed basis. Although DERWA has a significant relationship with the District, DERWA does not provide services solely to the District, and therefore, is not considered a component unit of the District.
Freeport Regional Water Authority - The Freeport Regional Water Project (FRWP) is a regional water supply project undertaken by the District in partnership with the Sacramento County Water Agency (SCWA). In February 2002, with the support of the United States Bureau of Reclamation, the District and SCWA formed the Freeport Regional Water Authority (FRWA) under a joint powers agreement to develop the FRWP. The FRWP provides the permanent infrastructure to allow the District to receive water deliveries pursuant to the Long-Term Renewal Central Valley Project Contract at a new point of diversion along the Sacramento River. In addition to providing the District up to 100 MGD of supplemental water in dry years as described above, the FRWP can provide up to 85 MGD to SCWA in all years. The District’s share of the facilities is recorded as Investment in JPA and is presented on the balance sheet. To increase the District’s reserve of water supply due to the recent drought, the District activated the pumping of water from the Sacramento River via the Freeport facility during Fiscal Year 2015.
55
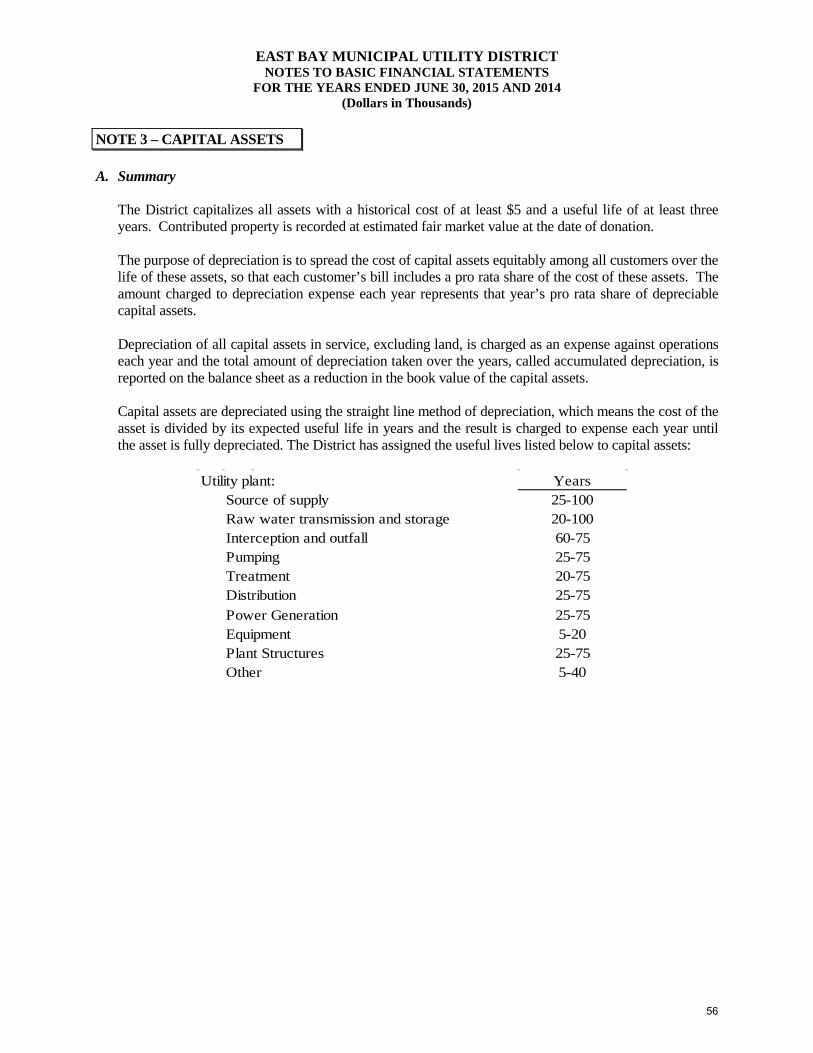
EAST BAY MUNICIPAL UTILITY DISTRICT NOTES TO BASIC FINANCIAL STATEMENTS
FOR THE YEARS ENDED JUNE 30, 2015 AND 2014 (Dollars in Thousands)
NOTE 3 – CAPITAL ASSETS
A. Summary
The District capitalizes all assets with a historical cost of at least $5 and a useful life of at least three years. Contributed property is recorded at estimated fair market value at the date of donation.
The purpose of depreciation is to spread the cost of capital assets equitably among all customers over the life of these assets, so that each customer’s bill includes a pro rata share of the cost of these assets. The amount charged to depreciation expense each year represents that year’s pro rata share of depreciable capital assets.
Depreciation of all capital assets in service, excluding land, is charged as an expense against operations each year and the total amount of depreciation taken over the years, called accumulated depreciation, is reported on the balance sheet as a reduction in the book value of the capital assets.
Capital assets are depreciated using the straight line method of depreciation, which means the cost of the asset is divided by its expected useful life in years and the result is charged to expense each year until the asset is fully depreciated. The District has assigned the useful lives listed below to capital assets:
Utility plant: YearsSource of supply 25-100Raw water transmission and storage 20-100Interception and outfall 60-75Pumping 25-75Treatment 20-75Distribution 25-75Power Generation 25-75Equipment 5-20Plant Structures 25-75Other 5-40
56
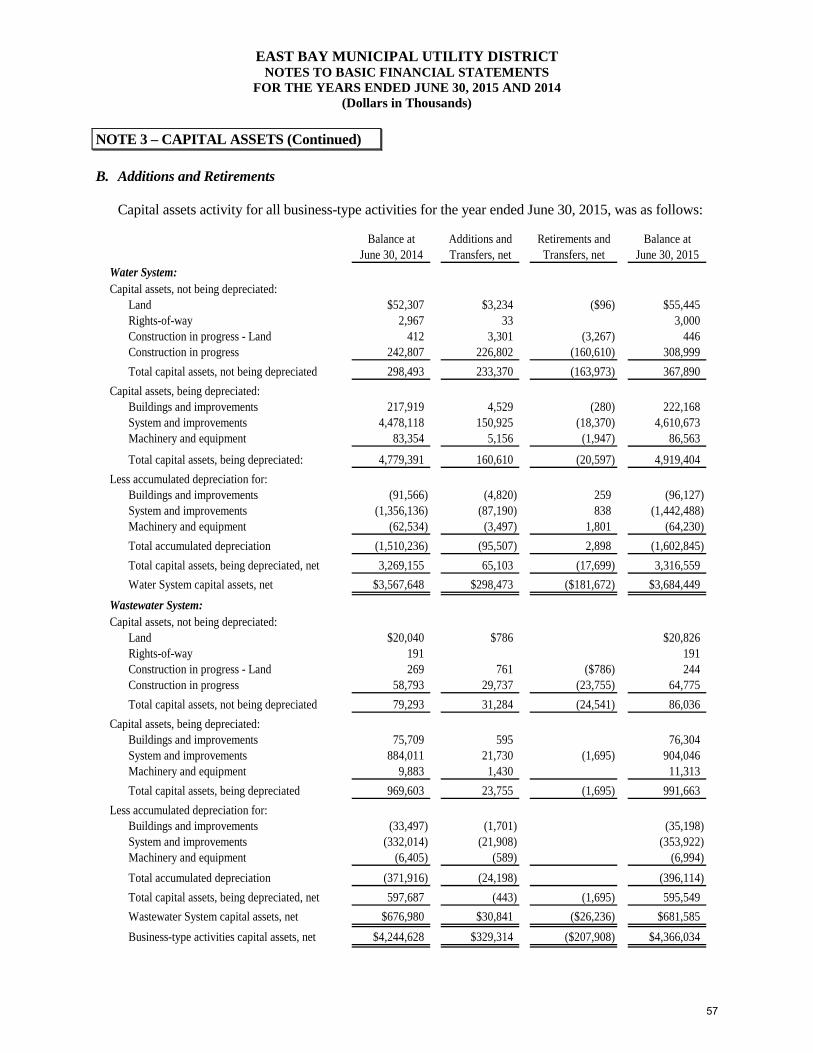
EAST BAY MUNICIPAL UTILITY DISTRICT NOTES TO BASIC FINANCIAL STATEMENTS
FOR THE YEARS ENDED JUNE 30, 2015 AND 2014 (Dollars in Thousands)
NOTE 3 – CAPITAL ASSETS (Continued)
B. Additions and Retirements
Capital assets activity for all business-type activities for the year ended June 30, 2015, was as follows:
Balance at Additions and Retirements and Balance atJune 30, 2014 Transfers, net Transfers, net June 30, 2015
Water System:Capital assets, not being depreciated:
Land $52,307 $3,234 ($96) $55,445Rights-of-way 2,967 33 3,000Construction in progress - Land 412 3,301 (3,267) 446Construction in progress 242,807 226,802 (160,610) 308,999Total capital assets, not being depreciated 298,493 233,370 (163,973) 367,890
Capital assets, being depreciated:Buildings and improvements 217,919 4,529 (280) 222,168System and improvements 4,478,118 150,925 (18,370) 4,610,673Machinery and equipment 83,354 5,156 (1,947) 86,563
Total capital assets, being depreciated: 4,779,391 160,610 (20,597) 4,919,404Less accumulated depreciation for:
Buildings and improvements (91,566) (4,820) 259 (96,127)System and improvements (1,356,136) (87,190) 838 (1,442,488)Machinery and equipment (62,534) (3,497) 1,801 (64,230)Total accumulated depreciation (1,510,236) (95,507) 2,898 (1,602,845)Total capital assets, being depreciated, net 3,269,155 65,103 (17,699) 3,316,559Water System capital assets, net $3,567,648 $298,473 ($181,672) $3,684,449
Wastewater System:Capital assets, not being depreciated:
Land $20,040 $786 $20,826Rights-of-way 191 191Construction in progress - Land 269 761 ($786) 244Construction in progress 58,793 29,737 (23,755) 64,775Total capital assets, not being depreciated 79,293 31,284 (24,541) 86,036
Capital assets, being depreciated:Buildings and improvements 75,709 595 76,304System and improvements 884,011 21,730 (1,695) 904,046Machinery and equipment 9,883 1,430 11,313Total capital assets, being depreciated 969,603 23,755 (1,695) 991,663
Less accumulated depreciation for:Buildings and improvements (33,497) (1,701) (35,198)System and improvements (332,014) (21,908) (353,922)Machinery and equipment (6,405) (589) (6,994)Total accumulated depreciation (371,916) (24,198) (396,114)Total capital assets, being depreciated, net 597,687 (443) (1,695) 595,549Wastewater System capital assets, net $676,980 $30,841 ($26,236) $681,585Business-type activities capital assets, net $4,244,628 $329,314 ($207,908) $4,366,034
57
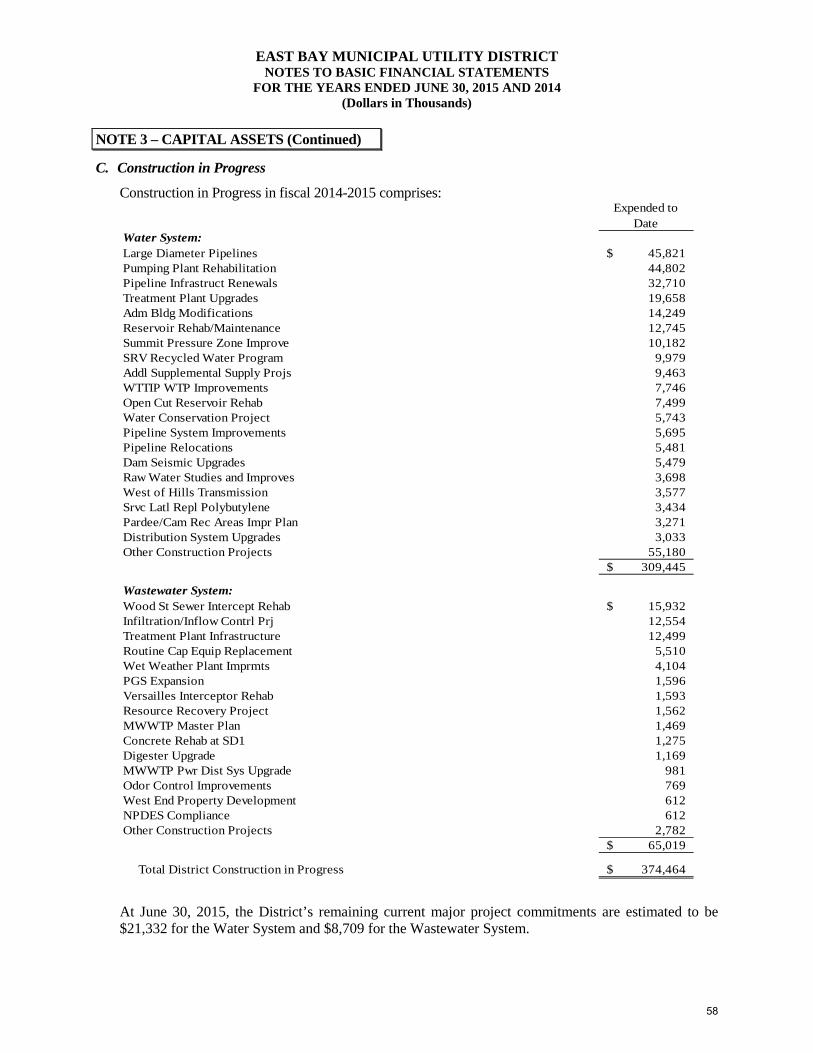
EAST BAY MUNICIPAL UTILITY DISTRICT NOTES TO BASIC FINANCIAL STATEMENTS
FOR THE YEARS ENDED JUNE 30, 2015 AND 2014 (Dollars in Thousands)
NOTE 3 – CAPITAL ASSETS (Continued)
C. Construction in Progress
Construction in Progress in fiscal 2014-2015 comprises: Expended to
DateWater System:Large Diameter Pipelines 45,821$ Pumping Plant Rehabilitation 44,802 Pipeline Infrastruct Renewals 32,710 Treatment Plant Upgrades 19,658 Adm Bldg Modifications 14,249 Reservoir Rehab/Maintenance 12,745 Summit Pressure Zone Improve 10,182 SRV Recycled Water Program 9,979 Addl Supplemental Supply Projs 9,463 WTTIP WTP Improvements 7,746 Open Cut Reservoir Rehab 7,499 Water Conservation Project 5,743 Pipeline System Improvements 5,695 Pipeline Relocations 5,481 Dam Seismic Upgrades 5,479 Raw Water Studies and Improves 3,698 West of Hills Transmission 3,577 Srvc Latl Repl Polybutylene 3,434 Pardee/Cam Rec Areas Impr Plan 3,271 Distribution System Upgrades 3,033 Other Construction Projects 55,180
309,445$
Wastewater System:Wood St Sewer Intercept Rehab 15,932$ Infiltration/Inflow Contrl Prj 12,554 Treatment Plant Infrastructure 12,499 Routine Cap Equip Replacement 5,510 Wet Weather Plant Imprmts 4,104 PGS Expansion 1,596 Versailles Interceptor Rehab 1,593 Resource Recovery Project 1,562 MWWTP Master Plan 1,469 Concrete Rehab at SD1 1,275 Digester Upgrade 1,169 MWWTP Pwr Dist Sys Upgrade 981 Odor Control Improvements 769 West End Property Development 612 NPDES Compliance 612 Other Construction Projects 2,782
65,019$
Total District Construction in Progress 374,464$
At June 30, 2015, the District’s remaining current major project commitments are estimated to be $21,332 for the Water System and $8,709 for the Wastewater System.
58
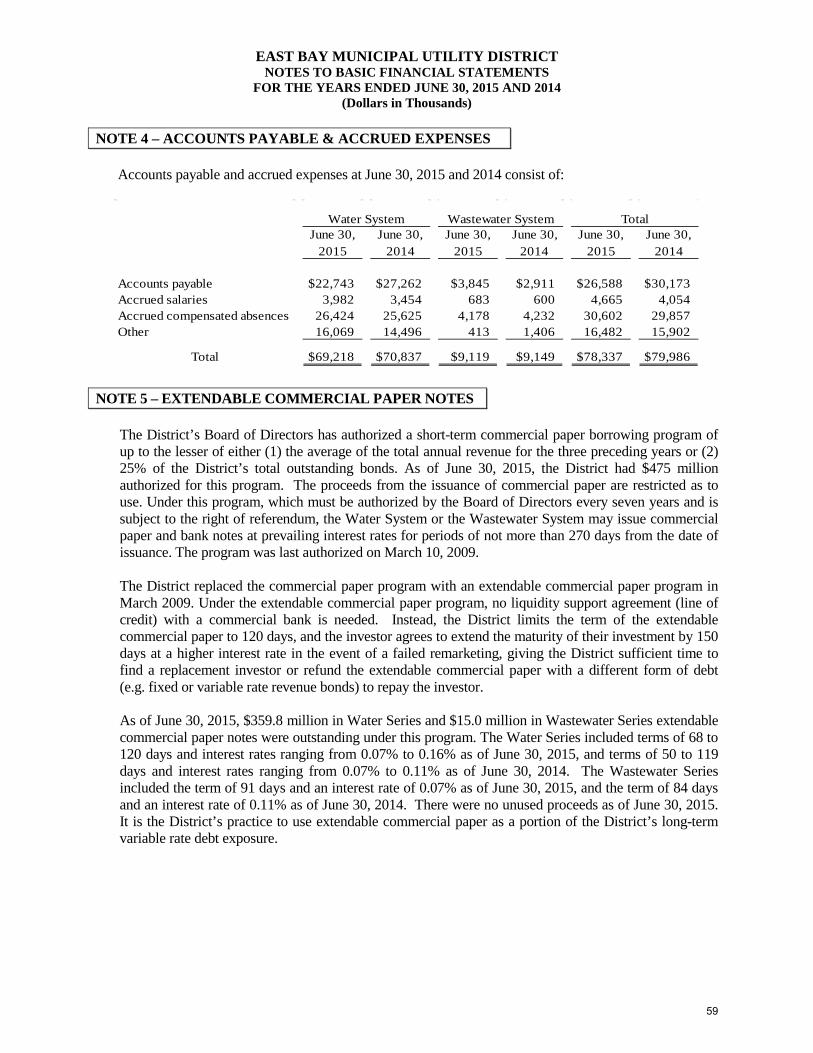
EAST BAY MUNICIPAL UTILITY DISTRICT NOTES TO BASIC FINANCIAL STATEMENTS
FOR THE YEARS ENDED JUNE 30, 2015 AND 2014 (Dollars in Thousands)
NOTE 4 – ACCOUNTS PAYABLE & ACCRUED EXPENSES
Accounts payable and accrued expenses at June 30, 2015 and 2014 consist of:
June 30, June 30, June 30, June 30, June 30, June 30,2015 2014 2015 2014 2015 2014
Accounts payable $22,743 $27,262 $3,845 $2,911 $26,588 $30,173Accrued salaries 3,982 3,454 683 600 4,665 4,054Accrued compensated absences 26,424 25,625 4,178 4,232 30,602 29,857Other 16,069 14,496 413 1,406 16,482 15,902
Total $69,218 $70,837 $9,119 $9,149 $78,337 $79,986
Water System Wastewater System Total
NOTE 5 – EXTENDABLE COMMERCIAL PAPER NOTES
The District’s Board of Directors has authorized a short-term commercial paper borrowing program of up to the lesser of either (1) the average of the total annual revenue for the three preceding years or (2) 25% of the District’s total outstanding bonds. As of June 30, 2015, the District had $475 million authorized for this program. The proceeds from the issuance of commercial paper are restricted as to use. Under this program, which must be authorized by the Board of Directors every seven years and is subject to the right of referendum, the Water System or the Wastewater System may issue commercial paper and bank notes at prevailing interest rates for periods of not more than 270 days from the date of issuance. The program was last authorized on March 10, 2009.
The District replaced the commercial paper program with an extendable commercial paper program in March 2009. Under the extendable commercial paper program, no liquidity support agreement (line of credit) with a commercial bank is needed. Instead, the District limits the term of the extendable commercial paper to 120 days, and the investor agrees to extend the maturity of their investment by 150 days at a higher interest rate in the event of a failed remarketing, giving the District sufficient time to find a replacement investor or refund the extendable commercial paper with a different form of debt (e.g. fixed or variable rate revenue bonds) to repay the investor.
As of June 30, 2015, $359.8 million in Water Series and $15.0 million in Wastewater Series extendable commercial paper notes were outstanding under this program. The Water Series included terms of 68 to 120 days and interest rates ranging from 0.07% to 0.16% as of June 30, 2015, and terms of 50 to 119 days and interest rates ranging from 0.07% to 0.11% as of June 30, 2014. The Wastewater Series included the term of 91 days and an interest rate of 0.07% as of June 30, 2015, and the term of 84 days and an interest rate of 0.11% as of June 30, 2014. There were no unused proceeds as of June 30, 2015. It is the District’s practice to use extendable commercial paper as a portion of the District’s long-term variable rate debt exposure.
59
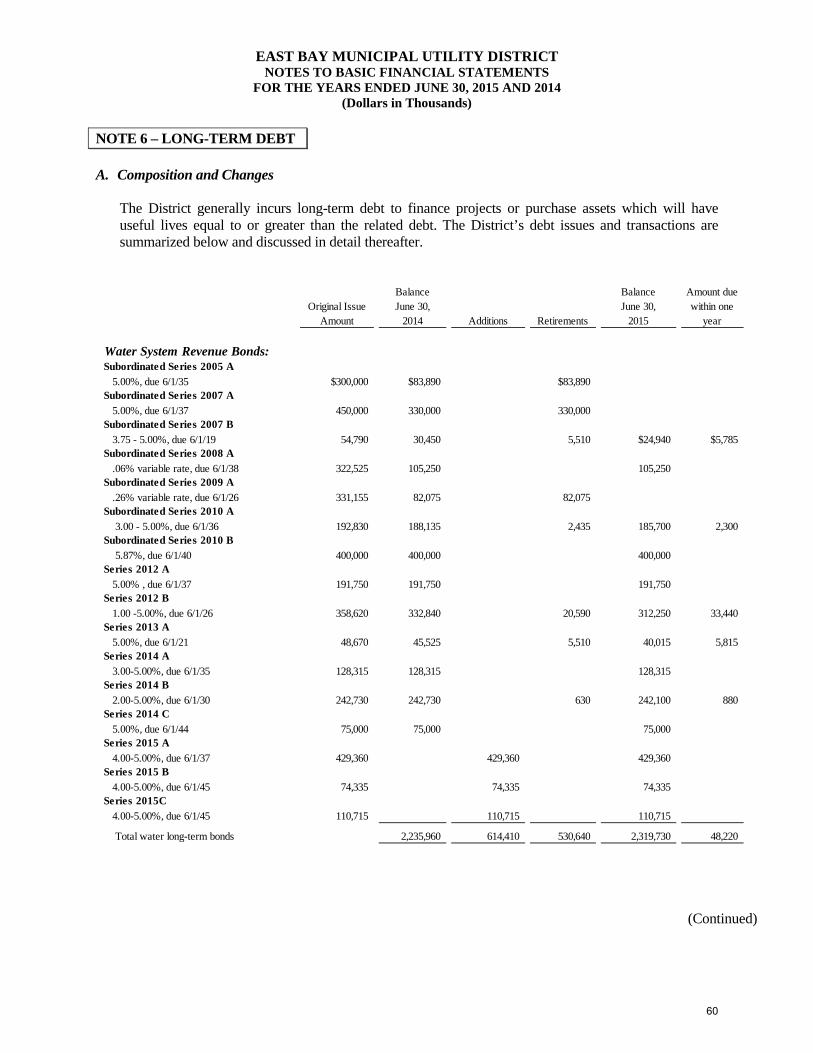
EAST BAY MUNICIPAL UTILITY DISTRICT NOTES TO BASIC FINANCIAL STATEMENTS
FOR THE YEARS ENDED JUNE 30, 2015 AND 2014 (Dollars in Thousands)
NOTE 6 – LONG-TERM DEBT
A. Composition and Changes
The District generally incurs long-term debt to finance projects or purchase assets which will have useful lives equal to or greater than the related debt. The District’s debt issues and transactions are summarized below and discussed in detail thereafter.
Original Issue Amount
BalanceJune 30,
2014 Additions Retirements
BalanceJune 30,
2015
Amount due within one
year
Water System Revenue Bonds:Subordinated Series 2005 A 5.00%, due 6/1/35 $300,000 $83,890 $83,890Subordinated Series 2007 A 5.00%, due 6/1/37 450,000 330,000 330,000Subordinated Series 2007 B 3.75 - 5.00%, due 6/1/19 54,790 30,450 5,510 $24,940 $5,785Subordinated Series 2008 A .06% variable rate, due 6/1/38 322,525 105,250 105,250Subordinated Series 2009 A .26% variable rate, due 6/1/26 331,155 82,075 82,075Subordinated Series 2010 A 3.00 - 5.00%, due 6/1/36 192,830 188,135 2,435 185,700 2,300Subordinated Series 2010 B 5.87%, due 6/1/40 400,000 400,000 400,000Series 2012 A 5.00% , due 6/1/37 191,750 191,750 191,750Series 2012 B 1.00 -5.00%, due 6/1/26 358,620 332,840 20,590 312,250 33,440Series 2013 A 5.00%, due 6/1/21 48,670 45,525 5,510 40,015 5,815Series 2014 A 3.00-5.00%, due 6/1/35 128,315 128,315 128,315Series 2014 B 2.00-5.00%, due 6/1/30 242,730 242,730 630 242,100 880Series 2014 C 5.00%, due 6/1/44 75,000 75,000 75,000Series 2015 A 4.00-5.00%, due 6/1/37 429,360 429,360 429,360Series 2015 B 4.00-5.00%, due 6/1/45 74,335 74,335 74,335Series 2015C 4.00-5.00%, due 6/1/45 110,715 110,715 110,715
Total water long-term bonds 2,235,960 614,410 530,640 2,319,730 48,220
(Continued)
60
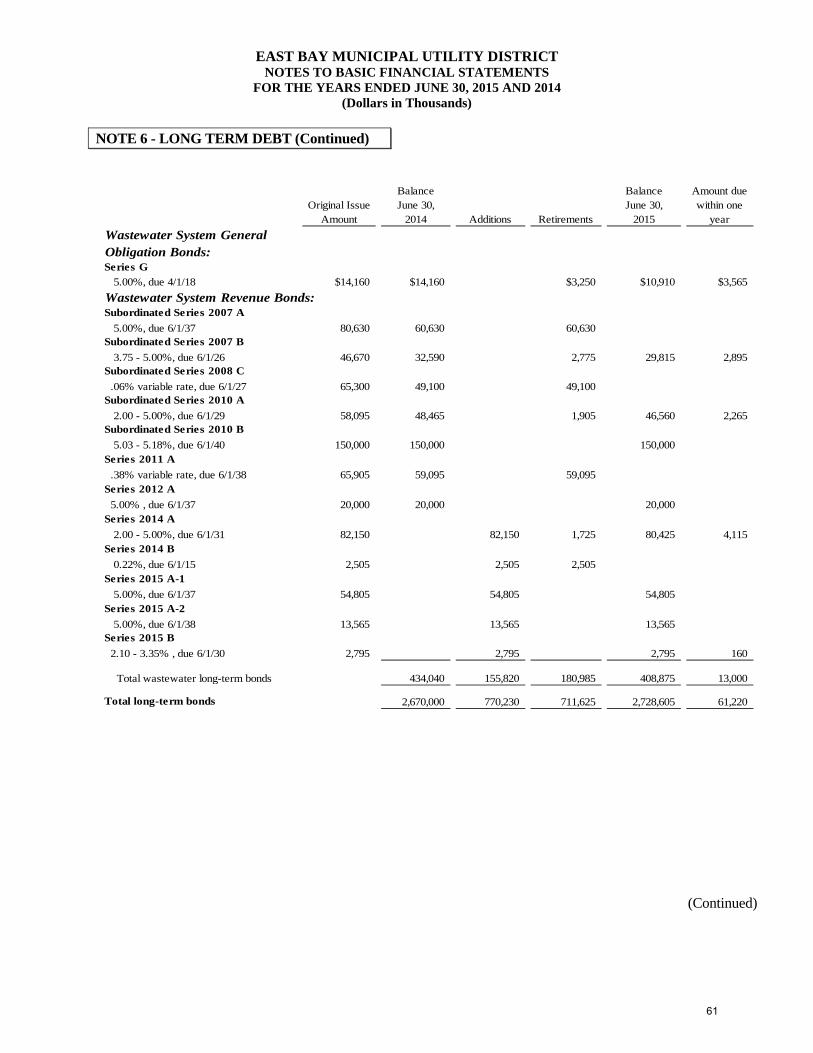
EAST BAY MUNICIPAL UTILITY DISTRICT NOTES TO BASIC FINANCIAL STATEMENTS
FOR THE YEARS ENDED JUNE 30, 2015 AND 2014 (Dollars in Thousands)
NOTE 6 - LONG TERM DEBT (Continued)
Original Issue Amount
BalanceJune 30,
2014 Additions Retirements
BalanceJune 30,
2015
Amount due within one
yearWastewater System GeneralObligation Bonds:Series G 5.00%, due 4/1/18 $14,160 $14,160 $3,250 $10,910 $3,565Wastewater System Revenue Bonds:Subordinated Series 2007 A 5.00%, due 6/1/37 80,630 60,630 60,630Subordinated Series 2007 B 3.75 - 5.00%, due 6/1/26 46,670 32,590 2,775 29,815 2,895Subordinated Series 2008 C .06% variable rate, due 6/1/27 65,300 49,100 49,100Subordinated Series 2010 A 2.00 - 5.00%, due 6/1/29 58,095 48,465 1,905 46,560 2,265Subordinated Series 2010 B 5.03 - 5.18%, due 6/1/40 150,000 150,000 150,000Series 2011 A .38% variable rate, due 6/1/38 65,905 59,095 59,095Series 2012 A 5.00% , due 6/1/37 20,000 20,000 20,000Series 2014 A 2.00 - 5.00%, due 6/1/31 82,150 82,150 1,725 80,425 4,115Series 2014 B 0.22%, due 6/1/15 2,505 2,505 2,505Series 2015 A-1 5.00%, due 6/1/37 54,805 54,805 54,805Series 2015 A-2 5.00%, due 6/1/38 13,565 13,565 13,565Series 2015 B 2.10 - 3.35% , due 6/1/30 2,795 2,795 2,795 160
Total wastewater long-term bonds 434,040 155,820 180,985 408,875 13,000
Total long-term bonds 2,670,000 770,230 711,625 2,728,605 61,220
(Continued)
61
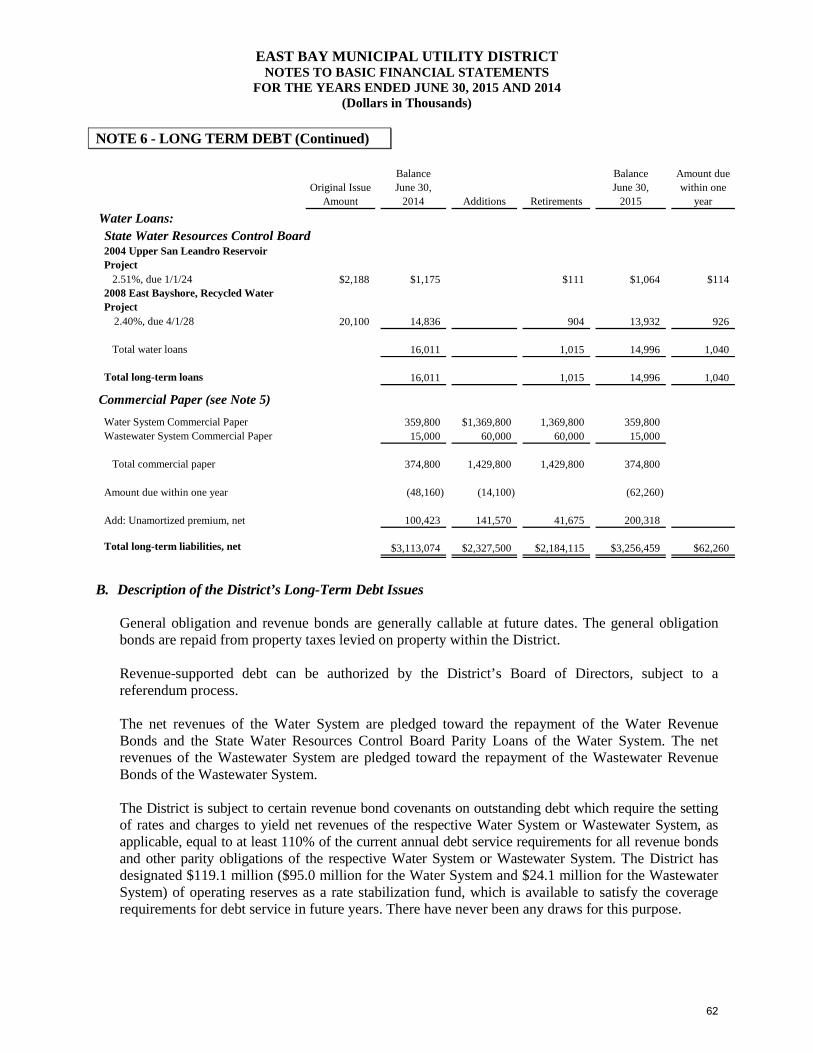
EAST BAY MUNICIPAL UTILITY DISTRICT NOTES TO BASIC FINANCIAL STATEMENTS
FOR THE YEARS ENDED JUNE 30, 2015 AND 2014 (Dollars in Thousands)
NOTE 6 - LONG TERM DEBT (Continued)
Original Issue Amount
BalanceJune 30,
2014 Additions Retirements
BalanceJune 30,
2015
Amount due within one
yearWater Loans:State Water Resources Control Board2004 Upper San Leandro Reservoir Project 2.51%, due 1/1/24 $2,188 $1,175 $111 $1,064 $1142008 East Bayshore, Recycled Water Project
2.40%, due 4/1/28 20,100 14,836 904 13,932 926
Total water loans 16,011 1,015 14,996 1,040
Total long-term loans 16,011 1,015 14,996 1,040
Commercial Paper (see Note 5)Water System Commercial Paper 359,800 $1,369,800 1,369,800 359,800Wastewater System Commercial Paper 15,000 60,000 60,000 15,000
Total commercial paper 374,800 1,429,800 1,429,800 374,800
Amount due within one year (48,160) (14,100) (62,260)
Add: Unamortized premium, net 100,423 141,570 41,675 200,318
Total long-term liabilities, net $3,113,074 $2,327,500 $2,184,115 $3,256,459 $62,260
B. Description of the District’s Long-Term Debt Issues
General obligation and revenue bonds are generally callable at future dates. The general obligation bonds are repaid from property taxes levied on property within the District.
Revenue-supported debt can be authorized by the District’s Board of Directors, subject to a referendum process.
The net revenues of the Water System are pledged toward the repayment of the Water Revenue Bonds and the State Water Resources Control Board Parity Loans of the Water System. The net revenues of the Wastewater System are pledged toward the repayment of the Wastewater Revenue Bonds of the Wastewater System.
The District is subject to certain revenue bond covenants on outstanding debt which require the setting of rates and charges to yield net revenues of the respective Water System or Wastewater System, as applicable, equal to at least 110% of the current annual debt service requirements for all revenue bonds and other parity obligations of the respective Water System or Wastewater System. The District has designated $119.1 million ($95.0 million for the Water System and $24.1 million for the Wastewater System) of operating reserves as a rate stabilization fund, which is available to satisfy the coverage requirements for debt service in future years. There have never been any draws for this purpose.
62
EAST BAY MUNICIPAL UTILITY DISTRICT NOTES TO BASIC FINANCIAL STATEMENTS
FOR THE YEARS ENDED JUNE 30, 2015 AND 2014 (Dollars in Thousands)
NOTE 6 - LONG TERM DEBT (Continued)
Water Issuance During the Year
2015 Water System Revenue Refunding Bonds, Series 2015A – The District issued $429.4 million principal amount of Series 2015A Bonds on March 3, 2015, to provide funds, together with certain other available monies, to refund $83.9 million principal amount of the District’s Water System Subordinated Revenue Bonds Series 2005A, $330 million principal amount of the District’s Water System Subordinated Revenue Bonds Series 2007A and $82.1 million principal amount of the District’s Water System Variable Rate Revenue Refunding Bonds Series 2009A, to fund the costs of terminating certain interest rate swap agreements relating to the District’s outstanding variable rate Water System Revenue Bonds to be refunded, and to pay the costs of issuance in connection with the Series 2015A Bonds. The Series 2015A Bonds are special obligations of the District and are payable solely from and secured by a pledge of Subordinated Water Revenues. Principal payments commence on June 1, 2023 and are payable annually on June 1 thereafter. Interest payments are payable on June 1st and December 1st of each year, commencing June 1, 2015.
The refunding of Water System Revenue Bonds, Series 2015A created an economic gain of $65.4 million.
2015 Water System Revenue Bonds, Series 2015B (Green Bonds) – The District issued $74.3 million principal amount of Series 2015B Bonds on June 17, 2015, to provide additional monies to finance improvements to the Water System of the District and pay the costs of issuance in connection with the Series 2015B Bonds. The Series 2015B Bonds are special obligations of the District and are payable solely from and secured by a pledge of Subordinated Water Revenues. Principal payments commence on June 1, 2023 and are payable annually on June 1 thereafter. Interest payments are payable on June 1st and December 1st of each year, commencing December 1, 2015.
2015 Water System Revenue Bonds, Series 2015C – The District issued $110.7 million principal amount of Series 2015C Bonds on June 17, 2015, to provide additional monies to finance improvements to the Water System of the District and pay the costs of issuance in connection with the 2015C Bonds. The Series 2015C Bonds are special obligations of the District and are payable solely from and secured by a pledge of Subordinated Water Revenues. Principal payments commence on June 1, 2024 and are payable annually on June 1 thereafter. Interest payments are payable on June 1st and December 1st of each year, commencing December 1, 2015.
Wastewater Issuance During the Year
2014 Wastewater System Revenue Refunding Bonds, Series 2014A and Series 2014B – The District issued $82.2 million principal amount of Series 2014A Bonds and $2.5 million principal amount of Series 2014B Bonds on August 28, 2014, to provide funds, together with certain other available monies, to refund $49.1 million principal amount of the District’s Wastewater System Subordinated Revenue Refunding Bonds variable rate Series 2008C and $42.7 million principal amount of the District’s Wastewater System’s Revenue Refunding Bonds variable rate Series 2011A, to fund the costs of terminating certain interest rate swap agreements related to the Wastewater System Revenue Bonds to be refunded, and to pay the costs of issuance of the Bonds. The Series 2014 Bonds are special obligations of the District and are payable solely from and secured by a pledge of Subordinated Wastewater Revenues. Principal payments commence on June 1, 2015 and are payable annually on June 1 thereafter. Interest payments are payable on June 1st and December 1st of each year, commencing December 1, 2014.
63
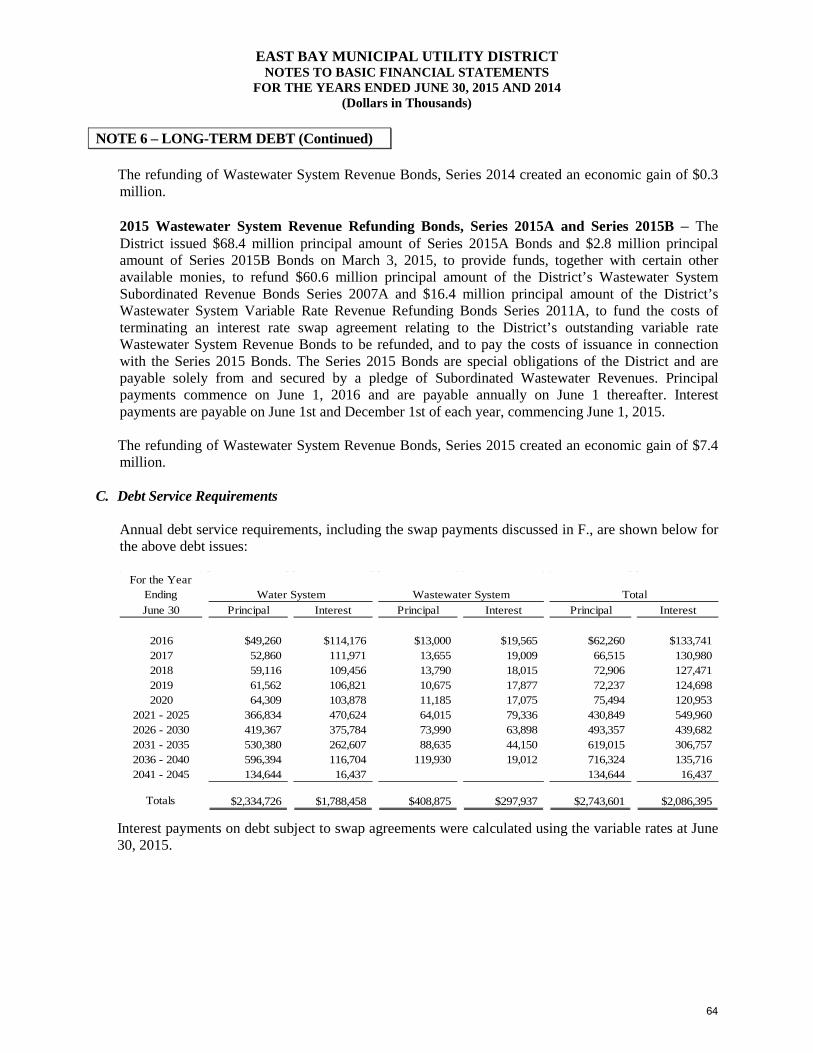
EAST BAY MUNICIPAL UTILITY DISTRICT NOTES TO BASIC FINANCIAL STATEMENTS
FOR THE YEARS ENDED JUNE 30, 2015 AND 2014 (Dollars in Thousands)
NOTE 6 – LONG-TERM DEBT (Continued)
The refunding of Wastewater System Revenue Bonds, Series 2014 created an economic gain of $0.3 million.
2015 Wastewater System Revenue Refunding Bonds, Series 2015A and Series 2015B – The District issued $68.4 million principal amount of Series 2015A Bonds and $2.8 million principal amount of Series 2015B Bonds on March 3, 2015, to provide funds, together with certain other available monies, to refund $60.6 million principal amount of the District’s Wastewater System Subordinated Revenue Bonds Series 2007A and $16.4 million principal amount of the District’s Wastewater System Variable Rate Revenue Refunding Bonds Series 2011A, to fund the costs of terminating an interest rate swap agreement relating to the District’s outstanding variable rate Wastewater System Revenue Bonds to be refunded, and to pay the costs of issuance in connection with the Series 2015 Bonds. The Series 2015 Bonds are special obligations of the District and are payable solely from and secured by a pledge of Subordinated Wastewater Revenues. Principal payments commence on June 1, 2016 and are payable annually on June 1 thereafter. Interest payments are payable on June 1st and December 1st of each year, commencing June 1, 2015.
The refunding of Wastewater System Revenue Bonds, Series 2015 created an economic gain of $7.4 million.
C. Debt Service Requirements
Annual debt service requirements, including the swap payments discussed in F., are shown below for the above debt issues:
For the Year Ending Water System Wastewater System TotalJune 30 Principal Interest Principal Interest Principal Interest
2016 $49,260 $114,176 $13,000 $19,565 $62,260 $133,7412017 52,860 111,971 13,655 19,009 66,515 130,9802018 59,116 109,456 13,790 18,015 72,906 127,4712019 61,562 106,821 10,675 17,877 72,237 124,6982020 64,309 103,878 11,185 17,075 75,494 120,953
2021 - 2025 366,834 470,624 64,015 79,336 430,849 549,9602026 - 2030 419,367 375,784 73,990 63,898 493,357 439,6822031 - 2035 530,380 262,607 88,635 44,150 619,015 306,7572036 - 2040 596,394 116,704 119,930 19,012 716,324 135,7162041 - 2045 134,644 16,437 134,644 16,437
Totals $2,334,726 $1,788,458 $408,875 $297,937 $2,743,601 $2,086,395
Interest payments on debt subject to swap agreements were calculated using the variable rates at June 30, 2015.
64
EAST BAY MUNICIPAL UTILITY DISTRICT NOTES TO BASIC FINANCIAL STATEMENTS
FOR THE YEARS ENDED JUNE 30, 2015 AND 2014 (Dollars in Thousands)
NOTE 6 - LONG TERM DEBT (Continued)
D. Prior-Year Defeasances
In prior years, the District defeased certain debt issues by placing proceeds of new bonds in an irrevocable trust to provide for all future debt service payments on the refunded bonds. Accordingly, the trust account assets and the liability for the defeased debt are not included in the District's financial statements. On June 30, 2015, $391 million of the bonds outstanding are considered defeased.
E. Variable Rate Debt
The District has a number of bond issues with variable interest rates. The Water Series 2008A Bonds are subject to purchase on the demand of the holder with seven days prior notice at a price equal to the principal plus accrued interest. The remarketing agent is authorized to use its best efforts to sell the repurchased bonds at a price equal to 100 percent of the principal amount by adjusting the interest rate. In the event that they not sold, under Standby Bond Purchase Agreements (SBPAs) issued by banks for the above variable rate debt issues, the trustee or the remarketing agent is entitled to draw an amount sufficient to pay the purchase price of delivered bonds. The District is required to pay an annual commitment fee to the banks issuing SBPAs. Expiration dates of these SBPAs are presented below by debt issue. In addition, the remarketing agent receives an annual fee of seven basis points of the outstanding principal amount of the bonds.
Expiration Interest Rate SwapDate Rate Swap Rate
Water System RevenueSubordinated Bonds:
Series 2008A-1 12/9/2016 Reset Weekly See belowSeries 2008A-2 7/2/2018 Reset Weekly See belowSeries 2008A-3 7/2/2018 Reset Weekly See belowSeries 2008A-4 12/9/2016 Reset Weekly See below
Standby Purchase Agreement Terms
Issue
F. Interest Rate Swap Agreements
The District has entered into a number of matched interest rate swap contracts with providers in which the District contracted to pay a fixed rate on the nominal amount of outstanding bonds, in exchange for a floating rate payment, set monthly on the first day of each calendar month for its LIBOR based swaps. The combination of variable rate bonds and a floating-rate swap creates synthetic fixed-rate debt for the District. The synthetic fixed rate on the bonds protects the District against increases in short-term interest rates. The terms, fair value, and credit risk of each of the swap agreements are discussed below.
Term and credit risks. The terms and credit ratings of the outstanding swaps, as of June 30, 2015, are included below. The District’s swap agreements contain scheduled reductions to outstanding notional amounts that are expected to follow scheduled reductions in the associated bonds.
65
EAST BAY MUNICIPAL UTILITY DISTRICT NOTES TO BASIC FINANCIAL STATEMENTS
FOR THE YEARS ENDED JUNE 30, 2015 AND 2014 (Dollars in Thousands)
NOTE 6 – LONG-TERM DEBT (Continued)
Related Bond IssueNotional Amount
Effective Date Counterparty
Counterparty Credit Ratings
(Moody's/ S&P)Issuer Pays
Issuer Receives
Maturity/ Termination
Date
2008A Water System Refunding $37,240 6/2/2005
JP Morgan Chase & Co. Aa3/A+ 3.115%
62.3% of 30-day LIBOR 6/1/2038
2008A Water System Refunding Bonds 37,240 6/1/2011
Bank of America National Assoc. A1/A 3.115%
62.3% of 30-day LIBOR 6/1/2038
2008A Water System Refunding 16,195 6/1/2012
Merrill Lynch Capital Services Baa1/A- 3.115%
62.3% of 30-day LIBOR 6/1/2038
2008A Water System Refunding 14,575 9/25/2008
The Bank of New York Mellon Aa2/AA- 3.115%
62.3% of 30-day LIBOR 6/1/2038
The effect of these transactions is structured to result in the approximate equivalent of the District paying a fixed rate on the bonds, since the inflow of payments from the LIBOR based swaps are anticipated to approximate the outflow of payments on the variable rate bonds. Only the net difference in interest payments to the swap providers is made under the swap contracts.
Fair value. The fair value of the swaps takes into consideration the prevailing interest rate environment, the specific terms and conditions of a given transaction and any upfront payments that may have been received. The fair value was estimated using the zero-coupon discounting method. This method calculates the future payments required by the swap, assuming that the current forward rates implied by the LIBOR swap yield curve are the market’s best estimate of future spot interest rates. These payments are then discounted using the spot rates implied by the current yield curve for a hypothetical zero-coupon rate bond due on the date of each future net settlement on the swaps. The fair values of each swap at June 30, 2015, are included below:
2015 2014Water 2008A Water System Refunding Bonds ($23,485) ($19,543) 2009A Water System Refunding Bonds - (11,213)
Total Water (23,485) (30,756)Wastewater 2011A Wastewater System Refunding Bonds - (8,131) 2008C Wastewater System Refunding Bonds - (6,866)
Total Wastewater - (14,997)
Totals ($23,485) ($45,753)
Related Bond Issuance Fair Value
Credit risk. As of June 30, 2015, the District was not exposed to credit risk on its outstanding swaps because the swaps had a negative fair value of $23 million. The District faces a maximum possible loss equivalent to the swaps’ fair value. However, if interest rates increase and the fair value of the swaps were to become positive, the District would be exposed to credit risk.
66
EAST BAY MUNICIPAL UTILITY DISTRICT NOTES TO BASIC FINANCIAL STATEMENTS
FOR THE YEARS ENDED JUNE 30, 2015 AND 2014 (Dollars in Thousands)
NOTE 6 – LONG-TERM DEBT (Continued)
The District will be exposed to interest rate risk only if the counterparty to the swap defaults or if the swap is terminated. The swap agreements contain provisions that determine if and when the District or the counterparty must provide collateral. The agreements require full collateralization of the fair value of the swap should the counterparty’s credit rating fall below a certain threshold. As of June 30, 2015, the District was not required to provide collateral to any SWAP counterparty.
Basis risk. Basis risk is the risk that the interest rate paid by the District on underlying variable rate bonds to bondholders temporarily differs from the variable swap rate received from the applicable counterparty. The District is exposed to basis risk as the District receives payments based on LIBOR rates to offset the actual variable interest rate the District pays on its bonds. The District is exposed to basis risk should the floating rate that it receives on a swap be less than the actual variable rate the District pays on the bonds. Depending on the magnitude and duration of any basis risk shortfall, the expected cost of the basis risk may vary. As of June 30, 2015, the District has a basis difference on its swaps of a positive 7 basis points (the District receives more from its swap floating rate payment than it pays out on its variable rate debt).
Termination risk. The District or the counterparty may terminate if the other party fails to perform under the terms of the SWAP contract. The District will be exposed to variable rates if the providers to the swap contracts default or if the swap contracts are terminated as it will lose the hedge provided by the SWAP. A termination of the swap contracts may also result in the District’s making or receiving a termination payment based on market interest rates at the time of the termination. If at the time of termination the swap has a negative fair value, the District would be liable to the counterparty for a payment equal to the swap’s fair value.
Swap payments and associated debt. Using rates as of June 30, 2015, debt service requirements of the District’s outstanding variable-rate debt and net swap payments are as follows. As rates vary, variable-rate bond interest payments and net swap payments will vary. These payments below are included in the Debt Service Requirements at C. above:
For the Year Ending Variable-Rate Bonds
Interest Rate Swaps, Net
June 30 Principal Interest Interest Total
2016 - $59 $3,154 $3,2132017 - 59 3,154 3,2132018 - 59 3,154 3,2132019 - 59 3,154 3,2132020 - 59 3,154 3,213
2021 - 2025 - 295 15,770 16,0652026 - 2030 - 295 15,770 16,0652031 - 2035 $62,450 190 10,279 10,4692036 - 2038 42,800 24 1,311 1,335
Totals $105,250 $1,099 $58,900 $59,999
67
EAST BAY MUNICIPAL UTILITY DISTRICT NOTES TO BASIC FINANCIAL STATEMENTS
FOR THE YEARS ENDED JUNE 30, 2015 AND 2014 (Dollars in Thousands)
NOTE 7 – NET POSITION
Net Position is the excess of all the District’s assets and deferred outflows over all its liabilities and deferred inflows, regardless of fund. Net Position is divided into three captions. These captions apply only to Net Position and are described below:
Net Investment in Capital Assets describes the portion of Net Position which is represented by the current net book value of the District’s capital assets, less the outstanding balance of any debt issued to finance these assets and any related deferred outflows and inflows.
Restricted describes the portion of Net Position which is restricted as to use by the terms and conditions of agreements with outside parties, governmental regulations, laws, or other restrictions which the District cannot unilaterally alter. These principally include developer fees received for use on capital projects, debt service requirements, and fees charged for the provision of future water resources.
Unrestricted describes the portion of Net Position which is not restricted to use.
NOTE 8 – EMPLOYEES’ RETIREMENT PLAN
A. Description
The Employees’ Retirement System is a single-employer, contributory, defined benefit pension plan (the Plan) which provides retirement, disability, survivorship, and post-employment healthcare benefits for eligible directors, officers, and employees of the District. The Plan is administered by a Retirement Board composed of three members appointed by the District’s Board of Directors and two members elected by and from the active membership of the Plan, and a nonvoting member elected by the retirees of the Plan. Retirement Ordinance No. 40 assigns the authority to establish Plan benefit provisions to the District’s Board of Directors. A stand-alone financial report of the Employees’ Retirement System is available. Please send request to the Controller, Accounting Division, P.O. Box 24055, Oakland, CA 94623-1055 or visit the District website at http://www.ebmud.com.
All regular full-time employees of the District are members of the Plan. In accordance with the ordinance governing the Plan, eligible employees become members on the first day they are physically on the job. District-defined benefits vest in part with members after completion of five years of continuous, full-time employment.
The Plan is funded by contributions from its members and from the District. District contribution percentages are recommended by the Retirement Board; employee contribution rates are established by the Board of Directors pursuant to the Ordinance, giving consideration to actuarial recommendations and prospective changes in factors which affect funding.
B. Retirement Benefits and Allowances
There are two tiers in effect currently, the 1980 Plan and the 2013 Plan. Employees who became Members of the retirement system prior to January 1, 2013, or who have reciprocal Membership are in the 1980 Plan, Employees who became Members on or after January 1, 2013 are in the 2013 Plan.
68
EAST BAY MUNICIPAL UTILITY DISTRICT NOTES TO BASIC FINANCIAL STATEMENTS
FOR THE YEARS ENDED JUNE 30, 2015 AND 2014 (Dollars in Thousands)
NOTE 8 – EMPLOYEES’ RETIREMENT PLAN (Continued)
1980 Plan Members may elect voluntary reduced service retirement upon attaining the age of 54 and completing 5 years of continuous full-time employment. Members may elect voluntary unreduced service retirement upon attaining the age of 62 and completing 5 years of continuous full-time employment or age 65 without restriction. Members who continue to work upon attaining the normal retirement age of 65 continue to contribute to the Plan, and at the time they retire, computation of their retirement allowance is based upon their compensation and length of service as of the date of retirement. Service retirement allowances are computed by formulas specified in the Ordinance and are based on date of employment, length of employment, age at date of retirement, and compensation earned during employment.
2013 Plan Members may elect voluntary reduced service upon attaining the age of 52 and completing 5 years of continuous full-time employment. Members may elect voluntary unreduced service retirement upon attaining the age of 67, and completing 5 years of continuous full-time employment. Members who continue to work upon attaining the normal retirement age of 67 continue to contribute to the Plan, and at the time they retire, computation of their allowance is based upon their compensation and length of service as of the date of retirement. Service retirement allowances are computed by formulas specified in the Ordinance and are based on length of service, age at retirement, and compensation earned during employment.
C. Post-employment Healthcare Cost
In addition to retirement benefits, the District provides post-employment health benefits assistance (administered by the Employees’ Retirement System) for employees who retire from the District or their surviving spouses. As of June 30, 2015, there were 1,433 participants receiving these health care benefits.
Effective July 1, 1996, a 20-year vesting schedule for full benefits was implemented for all new participants. Effective January 1, 1999, retired members who had separated from the District prior to their retirement and who had at least 10 years of service also became eligible for the post-employment health benefits based on the same sliding scale. The scale provides for 25% of healthcare benefits for service from 5 through 10 years, 50% of healthcare benefits for service from 10 through 15 years, 75% of healthcare benefits for service from 15 through 20 years, and 100% of healthcare benefits for service of 20 years or more. Effective July 1, 2003, the District reimbursed up to $450 per month ($550 per month effective July 1, 2004, for membership of a spouse or registered domestic partner) for any health, dental, or long-term care insurance premiums paid by the retiree for themselves, current spouse, or domestic partner, or any health, dental, or long-term care insurance premiums paid by the eligible surviving spouse of a retiree. These benefits are paid from a separate post-employment healthcare benefits fund which up until June 17, 2002, was advance funded entirely by the District on an actuarially determined basis. Cash reimbursement of these benefits totaled $7,394 in the year ended June 30, 2015. Effective June 18, 2002, a portion of the post-employment healthcare benefit costs is recovered through employee contributions.
69
EAST BAY MUNICIPAL UTILITY DISTRICT NOTES TO BASIC FINANCIAL STATEMENTS
FOR THE YEARS ENDED JUNE 30, 2015 AND 2014 (Dollars in Thousands)
NOTE 8 – EMPLOYEES’ RETIREMENT PLAN (Continued)
Through June 30, 1999, the medical premium subsidy was not a vested benefit and the District reserved the right to modify or terminate the benefit at any time. If the medical subsidy were terminated, assets accumulated from contributions made for the subsidy would be used to provide other pension benefits. Effective July 1, 1999, the medical premium subsidy became a vested benefit to a maximum of $200 per month, was changed effective October 1, 2000, to a maximum of $250 per month, and was changed effective July 1, 2002, to a maximum of $400 per month, and was changed effective July 1, 2003, to a maximum of $450 per month, and was changed again effective July 1, 2004, to a maximum of $450 per month for a single retiree or survivor and $550 per month for retiree and a spouse or a registered domestic partner.
D. Actuarial Assumptions and Funding Policy
The Plan’s funding policy provides for periodic District contributions at actuarially determined amounts sufficient to accumulate the necessary assets to pay benefits when due as specified by ordinance. The individual entry age normal method is used to determine the normal cost for other post-employment benefits (OPEB) and service cost for pension, and the OPEB unfunded actuarial accrued liability (past service liability) is amortized as a level percentage of future payroll over 30 years open period.
District contributions for the year ended June 30, 2015 are as follows:
1980 Plan: Pension plan:
Employer service cost 15.02% Toward unfunded pension liability 23.59%
Other post-employment benefits: Employer normal cost 1.21% Unfunded actuarial accrued liability 4.24%
2013 Plan: Pension plan:
Employer service cost 8.65% Toward unfunded pension liability 23.59%
Other post-employment benefits: Employer normal cost 0.87% Unfunded actuarial accrued liability 4.24%
70
EAST BAY MUNICIPAL UTILITY DISTRICT NOTES TO BASIC FINANCIAL STATEMENTS
FOR THE YEARS ENDED JUNE 30, 2015 AND 2014 (Dollars in Thousands)
NOTE 8 – EMPLOYEES’ RETIREMENT PLAN (Continued)
Effective June 30, 2015, contributions for fiscal year 2015/2016 are as follows:
1980 Plan: Pension plan:
Employer service cost 14.86% Toward unfunded pension liability 22.85%
Other post-employment benefits: Employer normal cost 1.22% Unfunded actuarial accrued liability 4.29%
2013 Plan: Pension plan:
Employer service cost 8.07% Toward unfunded pension liability 22.85%
Other post-employment benefits: Employer normal cost 0.77% Unfunded actuarial accrued liability 4.29%
Actuarial calculations reflect a long-term perspective and actuarial valuations involve estimates of the value of reported amounts and assumptions about the probability of events far into the future. Calculations are based on the benefits provided under the terms of the substantive plan in effect at the time of each valuation and on the pattern of sharing the costs between the employer and plan members to that point.
71
EAST BAY MUNICIPAL UTILITY DISTRICT NOTES TO BASIC FINANCIAL STATEMENTS
FOR THE YEARS ENDED JUNE 30, 2015 AND 2014 (Dollars in Thousands)
NOTE 8 – EMPLOYEES’ RETIREMENT PLAN (Continued)
Significant assumptions used to compute contribution requirements from the latest unaudited actuarial are as follows:
All assumptions are the same for the post-employment health care benefits except for the discount rate, assumed at a rate of 7% for the funded and unfunded portions.
Valuation date June 30, 2014Actuarial cost method Entry Age Normal Cost MethodAmortization method Level percent of payrollRemaining amortization period Plan changes are amortized over separate decreasing 15-year
periods; assumptions changes are amortized over separatedecreasing 25-year periods; experience gains/losses are amortized over separate decreasing 20-year periods.
Assets valuation method Market value of assets less unrecognized returns in each of the last five years.Unrecognized return is equal to the differencebetween the actual market return and theexpected return on the market value, and isrecognized over a five year period, furtheradjusted, if necessary, to be within 30% of themarket value.
Actuarial assumptions:Investment rate of return 7.50% Average projected salary increases* Ranges from 4.00% to 9.50% based on years of service*Inflation rate 3.00% Cost-of-living adjustments 3.00% Mortality Healthy: RP-2000 Combinded Healthy Mortality Table projected
with scale AA to 2016, set back one year for males and set back two years for females
Annual healthcare costs trend rates 6.875% reduced by increments to a rate of 5% after 10 years
72
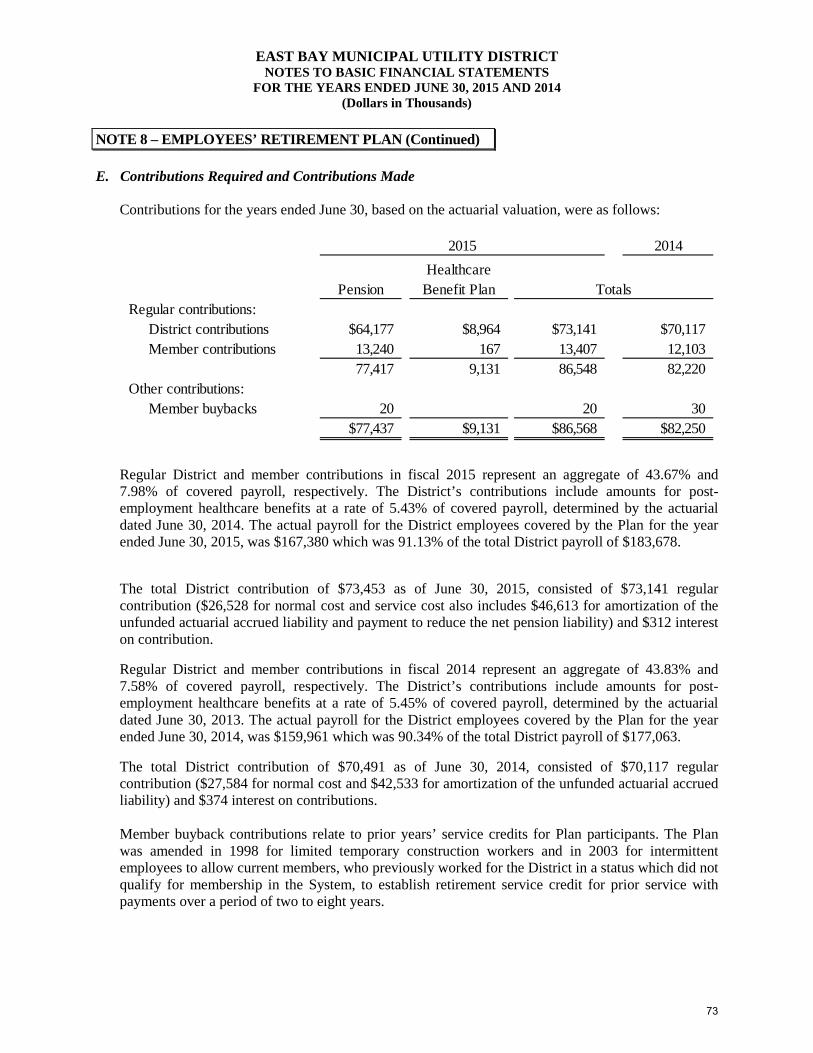
EAST BAY MUNICIPAL UTILITY DISTRICT NOTES TO BASIC FINANCIAL STATEMENTS
FOR THE YEARS ENDED JUNE 30, 2015 AND 2014 (Dollars in Thousands)
NOTE 8 – EMPLOYEES’ RETIREMENT PLAN (Continued)
E. Contributions Required and Contributions Made
Contributions for the years ended June 30, based on the actuarial valuation, were as follows:
Regular District and member contributions in fiscal 2015 represent an aggregate of 43.67% and 7.98% of covered payroll, respectively. The District’s contributions include amounts for post-employment healthcare benefits at a rate of 5.43% of covered payroll, determined by the actuarial dated June 30, 2014. The actual payroll for the District employees covered by the Plan for the year ended June 30, 2015, was $167,380 which was 91.13% of the total District payroll of $183,678.
The total District contribution of $73,453 as of June 30, 2015, consisted of $73,141 regular contribution ($26,528 for normal cost and service cost also includes $46,613 for amortization of the unfunded actuarial accrued liability and payment to reduce the net pension liability) and $312 interest on contribution.
Regular District and member contributions in fiscal 2014 represent an aggregate of 43.83% and 7.58% of covered payroll, respectively. The District’s contributions include amounts for post-employment healthcare benefits at a rate of 5.45% of covered payroll, determined by the actuarial dated June 30, 2013. The actual payroll for the District employees covered by the Plan for the year ended June 30, 2014, was $159,961 which was 90.34% of the total District payroll of $177,063.
The total District contribution of $70,491 as of June 30, 2014, consisted of $70,117 regular contribution ($27,584 for normal cost and $42,533 for amortization of the unfunded actuarial accrued liability) and $374 interest on contributions.
Member buyback contributions relate to prior years’ service credits for Plan participants. The Plan was amended in 1998 for limited temporary construction workers and in 2003 for intermittent employees to allow current members, who previously worked for the District in a status which did not qualify for membership in the System, to establish retirement service credit for prior service with payments over a period of two to eight years.
2014
PensionHealthcare
Benefit Plan TotalsRegular contributions: District contributions $64,177 $8,964 $73,141 $70,117 Member contributions 13,240 167 13,407 12,103
77,417 9,131 86,548 82,220Other contributions: Member buybacks 20 20 30
$77,437 $9,131 $86,568 $82,250
2015
73
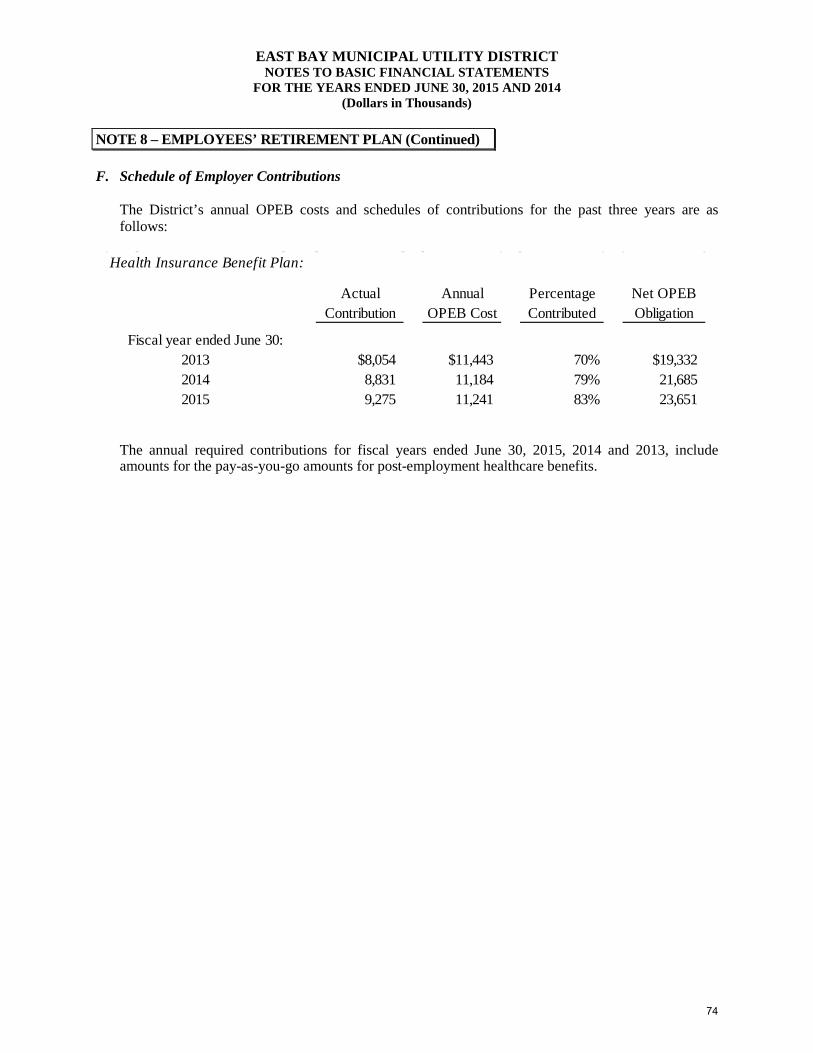
EAST BAY MUNICIPAL UTILITY DISTRICT NOTES TO BASIC FINANCIAL STATEMENTS
FOR THE YEARS ENDED JUNE 30, 2015 AND 2014 (Dollars in Thousands)
NOTE 8 – EMPLOYEES’ RETIREMENT PLAN (Continued)
F. Schedule of Employer Contributions
The District’s annual OPEB costs and schedules of contributions for the past three years are as follows:
The annual required contributions for fiscal years ended June 30, 2015, 2014 and 2013, include amounts for the pay-as-you-go amounts for post-employment healthcare benefits.
Actual Annual Percentage Net OPEBContribution OPEB Cost Contributed Obligation
Fiscal year ended June 30:$8,054 $11,443 70% $19,3328,831 11,184 79% 21,6859,275 11,241 83% 23,6512015
Health Insurance Benefit Plan:
20132014
74
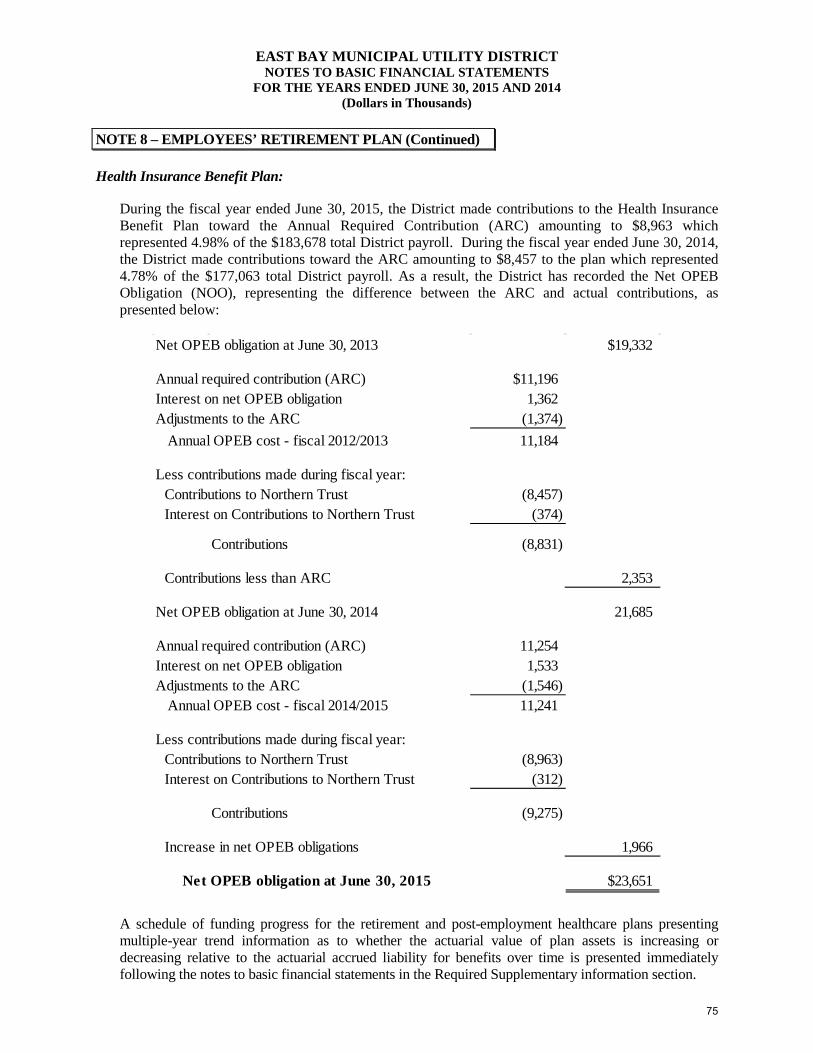
EAST BAY MUNICIPAL UTILITY DISTRICT NOTES TO BASIC FINANCIAL STATEMENTS
FOR THE YEARS ENDED JUNE 30, 2015 AND 2014 (Dollars in Thousands)
NOTE 8 – EMPLOYEES’ RETIREMENT PLAN (Continued)
Health Insurance Benefit Plan:
During the fiscal year ended June 30, 2015, the District made contributions to the Health Insurance Benefit Plan toward the Annual Required Contribution (ARC) amounting to $8,963 which represented 4.98% of the $183,678 total District payroll. During the fiscal year ended June 30, 2014, the District made contributions toward the ARC amounting to $8,457 to the plan which represented 4.78% of the $177,063 total District payroll. As a result, the District has recorded the Net OPEB Obligation (NOO), representing the difference between the ARC and actual contributions, as presented below:
A schedule of funding progress for the retirement and post-employment healthcare plans presenting multiple-year trend information as to whether the actuarial value of plan assets is increasing or decreasing relative to the actuarial accrued liability for benefits over time is presented immediately following the notes to basic financial statements in the Required Supplementary information section.
Net OPEB obligation at June 30, 2013 $19,332
Annual required contribution (ARC) $11,196Interest on net OPEB obligation 1,362 Adjustments to the ARC (1,374) Annual OPEB cost - fiscal 2012/2013 11,184
Less contributions made during fiscal year:Contributions to Northern Trust (8,457) Interest on Contributions to Northern Trust (374)
Contributions (8,831)
Contributions less than ARC 2,353
Net OPEB obligation at June 30, 2014 21,685
Annual required contribution (ARC) 11,254 Interest on net OPEB obligation 1,533 Adjustments to the ARC (1,546) Annual OPEB cost - fiscal 2014/2015 11,241
Less contributions made during fiscal year:Contributions to Northern Trust (8,963) Interest on Contributions to Northern Trust (312)
Contributions (9,275)
Increase in net OPEB obligations 1,966
Net OPEB obligation at June 30, 2015 $23,651
75
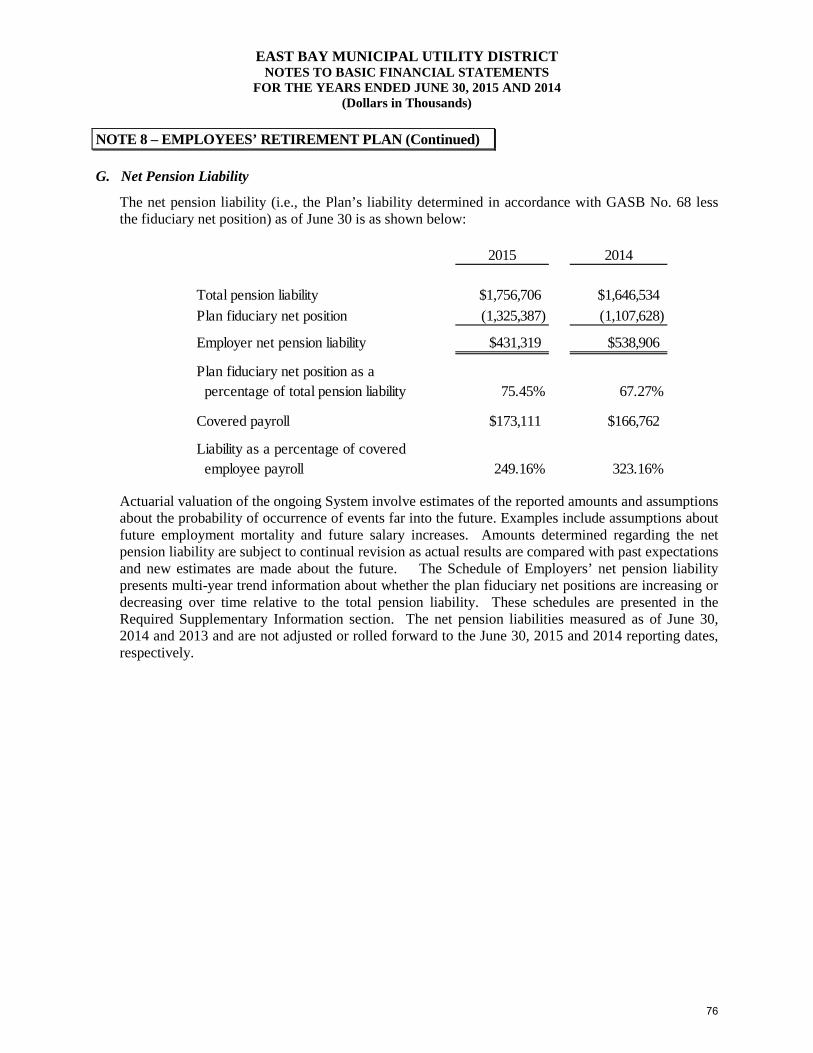
EAST BAY MUNICIPAL UTILITY DISTRICT NOTES TO BASIC FINANCIAL STATEMENTS
FOR THE YEARS ENDED JUNE 30, 2015 AND 2014 (Dollars in Thousands)
NOTE 8 – EMPLOYEES’ RETIREMENT PLAN (Continued)
G. Net Pension Liability
The net pension liability (i.e., the Plan’s liability determined in accordance with GASB No. 68 less the fiduciary net position) as of June 30 is as shown below:
2015 2014
Total pension liability $1,756,706 $1,646,534Plan fiduciary net position (1,325,387) (1,107,628)
Employer net pension liability $431,319 $538,906
Plan fiduciary net position as a percentage of total pension liability 75.45% 67.27%
Covered payroll $173,111 $166,762
Liability as a percentage of covered employee payroll 249.16% 323.16%
Actuarial valuation of the ongoing System involve estimates of the reported amounts and assumptions about the probability of occurrence of events far into the future. Examples include assumptions about future employment mortality and future salary increases. Amounts determined regarding the net pension liability are subject to continual revision as actual results are compared with past expectations and new estimates are made about the future. The Schedule of Employers’ net pension liability presents multi-year trend information about whether the plan fiduciary net positions are increasing or decreasing over time relative to the total pension liability. These schedules are presented in the Required Supplementary Information section. The net pension liabilities measured as of June 30, 2014 and 2013 and are not adjusted or rolled forward to the June 30, 2015 and 2014 reporting dates, respectively.
76
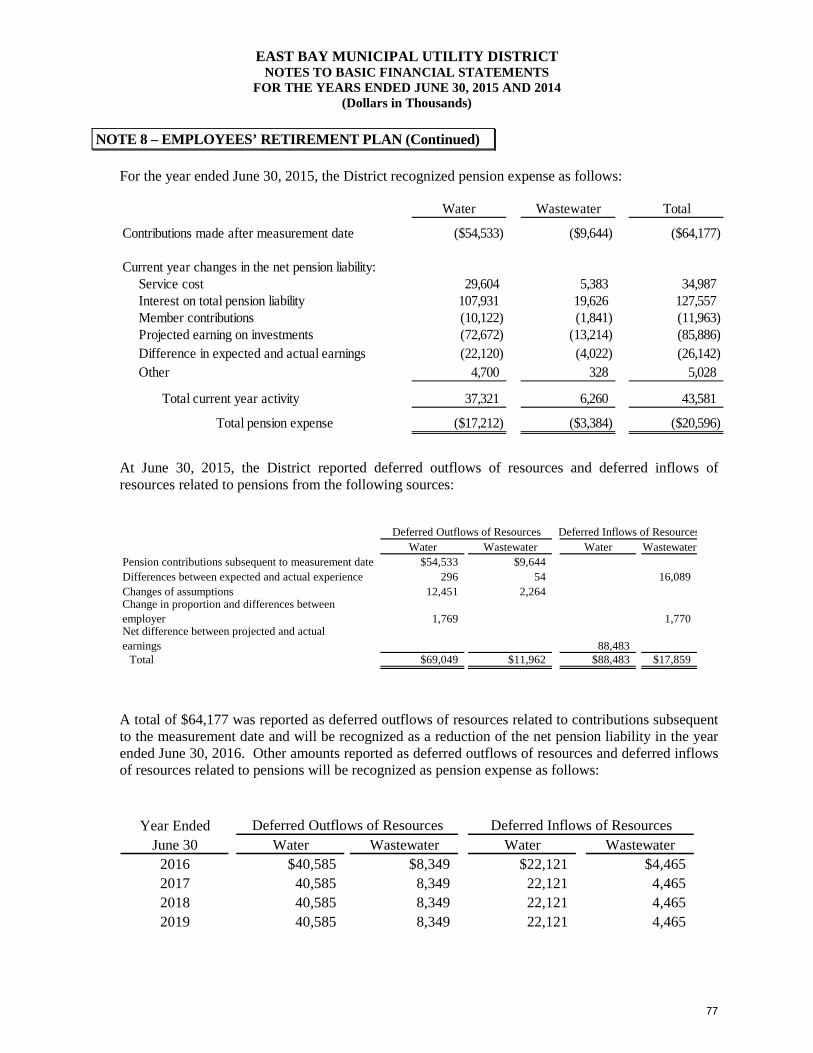
EAST BAY MUNICIPAL UTILITY DISTRICT NOTES TO BASIC FINANCIAL STATEMENTS
FOR THE YEARS ENDED JUNE 30, 2015 AND 2014 (Dollars in Thousands)
NOTE 8 – EMPLOYEES’ RETIREMENT PLAN (Continued)
For the year ended June 30, 2015, the District recognized pension expense as follows:
Water Wastewater Total
Contributions made after measurement date ($54,533) ($9,644) ($64,177)
Current year changes in the net pension liability:Service cost 29,604 5,383 34,987 Interest on total pension liability 107,931 19,626 127,557 Member contributions (10,122) (1,841) (11,963) Projected earning on investments (72,672) (13,214) (85,886) Difference in expected and actual earnings (22,120) (4,022) (26,142) Other 4,700 328 5,028
Total current year activity 37,321 6,260 43,581
Total pension expense ($17,212) ($3,384) ($20,596)
At June 30, 2015, the District reported deferred outflows of resources and deferred inflows of resources related to pensions from the following sources:
Water Wastewater Water WastewaterPension contributions subsequent to measurement date $54,533 $9,644Differences between expected and actual experience 296 54 16,089Changes of assumptions 12,451 2,264Change in proportion and differences between employer 1,769 1,770Net difference between projected and actual earnings 88,483
Total $69,049 $11,962 $88,483 $17,859
Deferred Inflows of ResourcesDeferred Outflows of Resources
A total of $64,177 was reported as deferred outflows of resources related to contributions subsequent to the measurement date and will be recognized as a reduction of the net pension liability in the year ended June 30, 2016. Other amounts reported as deferred outflows of resources and deferred inflows of resources related to pensions will be recognized as pension expense as follows:
Year EndedJune 30 Water Wastewater Water Wastewater
2016 $40,585 $8,349 $22,121 $4,4652017 40,585 8,349 22,121 4,465 2018 40,585 8,349 22,121 4,465 2019 40,585 8,349 22,121 4,465
Deferred Outflows of Resources Deferred Inflows of Resources
77
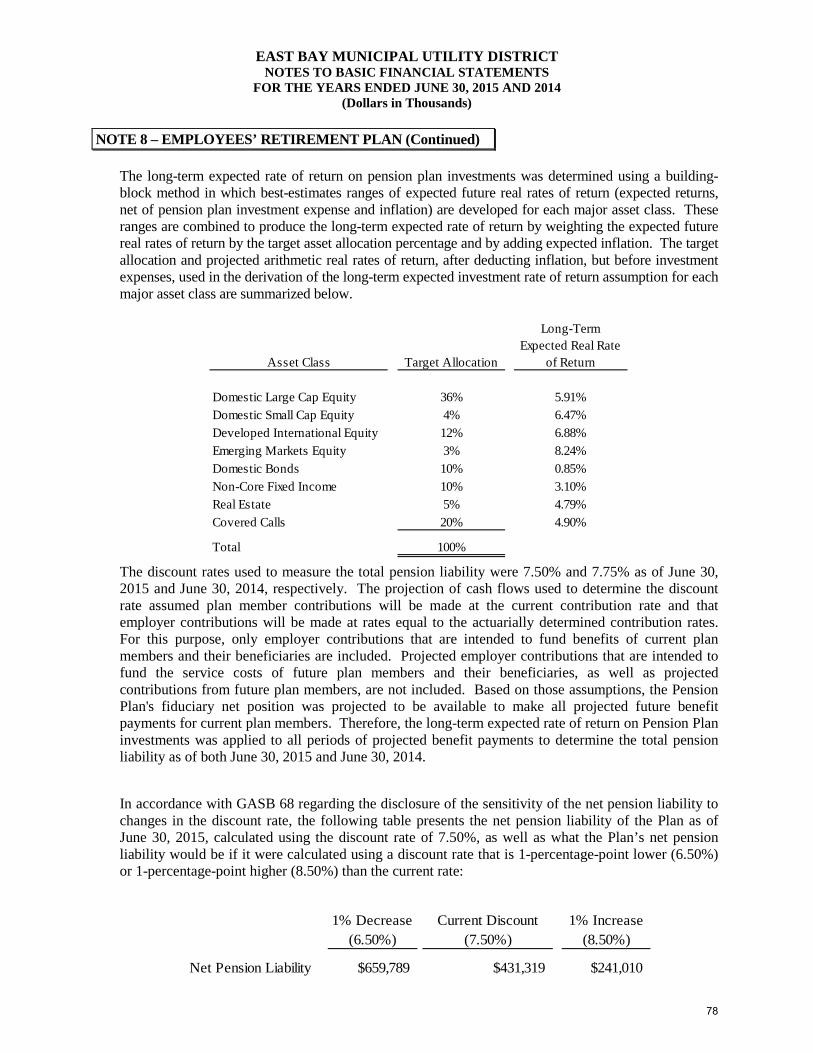
EAST BAY MUNICIPAL UTILITY DISTRICT NOTES TO BASIC FINANCIAL STATEMENTS
FOR THE YEARS ENDED JUNE 30, 2015 AND 2014 (Dollars in Thousands)
NOTE 8 – EMPLOYEES’ RETIREMENT PLAN (Continued)
The long-term expected rate of return on pension plan investments was determined using a building-block method in which best-estimates ranges of expected future real rates of return (expected returns, net of pension plan investment expense and inflation) are developed for each major asset class. These ranges are combined to produce the long-term expected rate of return by weighting the expected future real rates of return by the target asset allocation percentage and by adding expected inflation. The target allocation and projected arithmetic real rates of return, after deducting inflation, but before investment expenses, used in the derivation of the long-term expected investment rate of return assumption for each major asset class are summarized below.
Asset Class Target Allocation
Long-Term Expected Real Rate
of Return
Domestic Large Cap Equity 36% 5.91%Domestic Small Cap Equity 4% 6.47%Developed International Equity 12% 6.88%Emerging Markets Equity 3% 8.24%Domestic Bonds 10% 0.85%Non-Core Fixed Income 10% 3.10%Real Estate 5% 4.79%Covered Calls 20% 4.90%
Total 100%
The discount rates used to measure the total pension liability were 7.50% and 7.75% as of June 30, 2015 and June 30, 2014, respectively. The projection of cash flows used to determine the discount rate assumed plan member contributions will be made at the current contribution rate and that employer contributions will be made at rates equal to the actuarially determined contribution rates. For this purpose, only employer contributions that are intended to fund benefits of current plan members and their beneficiaries are included. Projected employer contributions that are intended to fund the service costs of future plan members and their beneficiaries, as well as projected contributions from future plan members, are not included. Based on those assumptions, the Pension Plan's fiduciary net position was projected to be available to make all projected future benefit payments for current plan members. Therefore, the long-term expected rate of return on Pension Plan investments was applied to all periods of projected benefit payments to determine the total pension liability as of both June 30, 2015 and June 30, 2014.
In accordance with GASB 68 regarding the disclosure of the sensitivity of the net pension liability to changes in the discount rate, the following table presents the net pension liability of the Plan as of June 30, 2015, calculated using the discount rate of 7.50%, as well as what the Plan’s net pension liability would be if it were calculated using a discount rate that is 1-percentage-point lower (6.50%) or 1-percentage-point higher (8.50%) than the current rate:
1% Decrease (6.50%)
Current Discount (7.50%)
1% Increase (8.50%)
Net Pension Liability $659,789 $431,319 $241,010
78
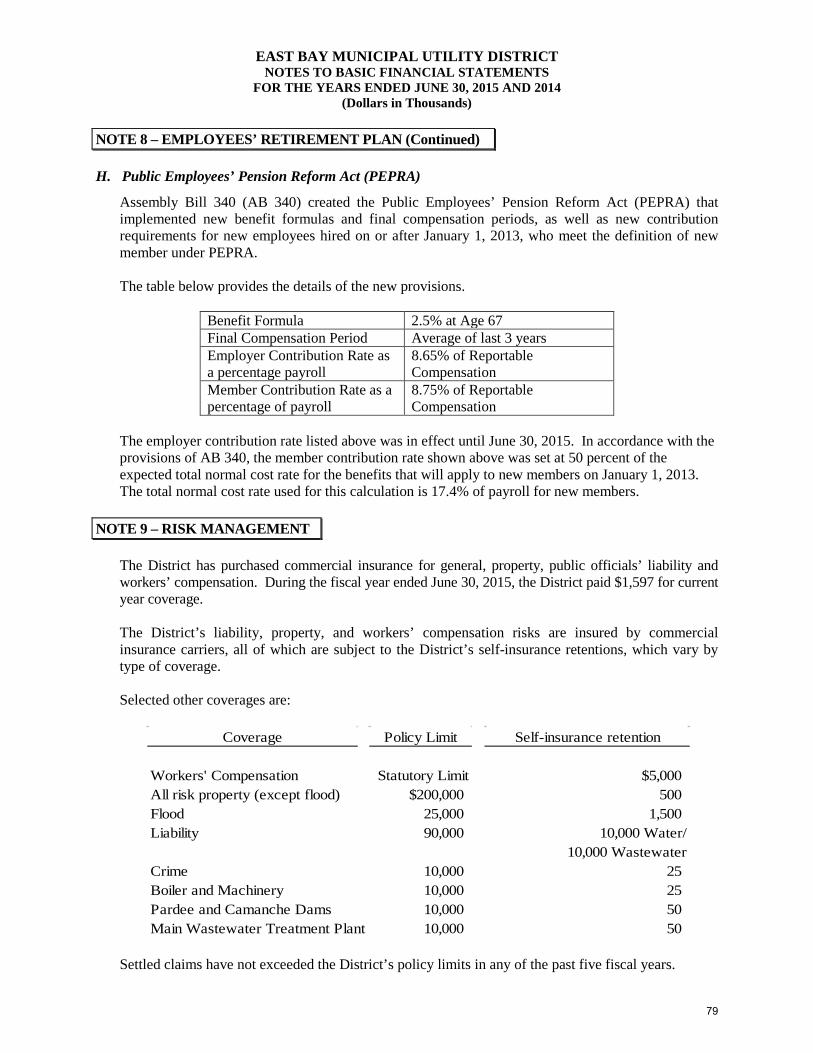
EAST BAY MUNICIPAL UTILITY DISTRICT NOTES TO BASIC FINANCIAL STATEMENTS
FOR THE YEARS ENDED JUNE 30, 2015 AND 2014 (Dollars in Thousands)
NOTE 8 – EMPLOYEES’ RETIREMENT PLAN (Continued)
H. Public Employees’ Pension Reform Act (PEPRA)
Assembly Bill 340 (AB 340) created the Public Employees’ Pension Reform Act (PEPRA) that implemented new benefit formulas and final compensation periods, as well as new contribution requirements for new employees hired on or after January 1, 2013, who meet the definition of new member under PEPRA.
The table below provides the details of the new provisions.
Benefit Formula 2.5% at Age 67 Final Compensation Period Average of last 3 years Employer Contribution Rate as a percentage payroll
8.65% of Reportable Compensation
Member Contribution Rate as a percentage of payroll
8.75% of Reportable Compensation
The employer contribution rate listed above was in effect until June 30, 2015. In accordance with the provisions of AB 340, the member contribution rate shown above was set at 50 percent of the expected total normal cost rate for the benefits that will apply to new members on January 1, 2013. The total normal cost rate used for this calculation is 17.4% of payroll for new members.
NOTE 9 – RISK MANAGEMENT
The District has purchased commercial insurance for general, property, public officials’ liability and workers’ compensation. During the fiscal year ended June 30, 2015, the District paid $1,597 for current year coverage.
The District’s liability, property, and workers’ compensation risks are insured by commercial insurance carriers, all of which are subject to the District’s self-insurance retentions, which vary by type of coverage.
Selected other coverages are:
Coverage Policy Limit Self-insurance retention
Workers' Compensation Statutory Limit $5,000All risk property (except flood) $200,000 500 Flood 25,000 1,500 Liability 90,000 10,000 Water/
10,000 WastewaterCrime 10,000 25 Boiler and Machinery 10,000 25 Pardee and Camanche Dams 10,000 50 Main Wastewater Treatment Plant 10,000 50
Settled claims have not exceeded the District’s policy limits in any of the past five fiscal years.
79
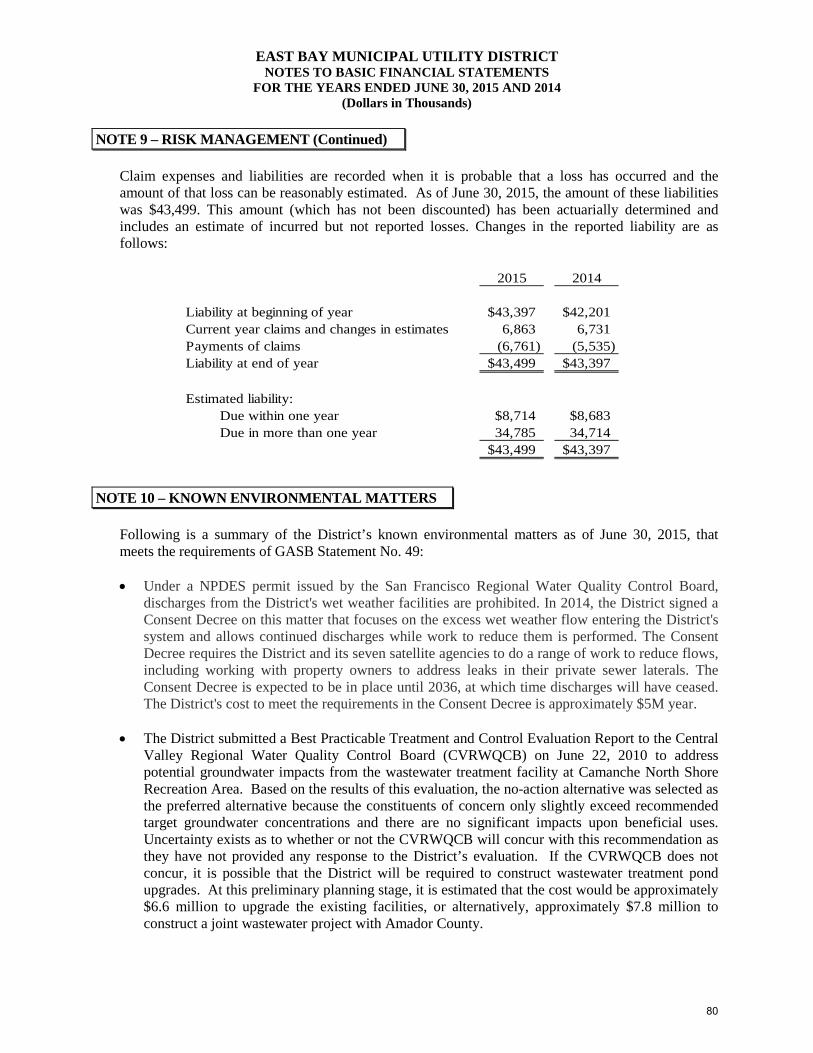
EAST BAY MUNICIPAL UTILITY DISTRICT NOTES TO BASIC FINANCIAL STATEMENTS
FOR THE YEARS ENDED JUNE 30, 2015 AND 2014 (Dollars in Thousands)
NOTE 9 – RISK MANAGEMENT (Continued)
Claim expenses and liabilities are recorded when it is probable that a loss has occurred and the amount of that loss can be reasonably estimated. As of June 30, 2015, the amount of these liabilities was $43,499. This amount (which has not been discounted) has been actuarially determined and includes an estimate of incurred but not reported losses. Changes in the reported liability are as follows:
2015 2014
Liability at beginning of year $43,397 $42,201Current year claims and changes in estimates 6,863 6,731 Payments of claims (6,761) (5,535) Liability at end of year $43,499 $43,397
Estimated liability:Due within one year $8,714 $8,683Due in more than one year 34,785 34,714
$43,499 $43,397
NOTE 10 – KNOWN ENVIRONMENTAL MATTERS
Following is a summary of the District’s known environmental matters as of June 30, 2015, that meets the requirements of GASB Statement No. 49:
• Under a NPDES permit issued by the San Francisco Regional Water Quality Control Board,discharges from the District's wet weather facilities are prohibited. In 2014, the District signed aConsent Decree on this matter that focuses on the excess wet weather flow entering the District'ssystem and allows continued discharges while work to reduce them is performed. The ConsentDecree requires the District and its seven satellite agencies to do a range of work to reduce flows,including working with property owners to address leaks in their private sewer laterals. TheConsent Decree is expected to be in place until 2036, at which time discharges will have ceased.The District's cost to meet the requirements in the Consent Decree is approximately $5M year.
• The District submitted a Best Practicable Treatment and Control Evaluation Report to the CentralValley Regional Water Quality Control Board (CVRWQCB) on June 22, 2010 to addresspotential groundwater impacts from the wastewater treatment facility at Camanche North ShoreRecreation Area. Based on the results of this evaluation, the no-action alternative was selected asthe preferred alternative because the constituents of concern only slightly exceed recommendedtarget groundwater concentrations and there are no significant impacts upon beneficial uses.Uncertainty exists as to whether or not the CVRWQCB will concur with this recommendation asthey have not provided any response to the District’s evaluation. If the CVRWQCB does notconcur, it is possible that the District will be required to construct wastewater treatment pondupgrades. At this preliminary planning stage, it is estimated that the cost would be approximately$6.6 million to upgrade the existing facilities, or alternatively, approximately $7.8 million toconstruct a joint wastewater project with Amador County.
80
EAST BAY MUNICIPAL UTILITY DISTRICT NOTES TO BASIC FINANCIAL STATEMENTS
FOR THE YEARS ENDED JUNE 30, 2015 AND 2014 (Dollars in Thousands)
NOTE 10 – KNOWN ENVIRONMENTAL LIABILITIES (Continued)
• The CVRWQCB has requested that the District and U.S. Bureau of Land Management (BLM)address three_ abandoned ponds near Camanche Reservoir that contain mine wastes. The Districtand BLM have both been named as Potential Responsible Parties and are jointly completing thissite investigation/remediation project. An Engineering Evaluation/Cost Analysis was completedin 2013 to present remediation alternatives and a Value Engineering (VE) study was completed in2014 to analyze life-cycle costs of the recommended alternative consistent with requiredperformance, reliability, quality, safety, and achievement of mission priorities. Subsequent to theVE study, BLM risk assessors audited the site to make recommendations for further financialsavings. At this time the District is awaiting a final proposal from BLM that incorporates thefindings of their risk assessor. The final site remedy and cost allocations between the District andBLM have yet to be determined.
• The CVRWQCB has requested that the District address elevated concentrations of petroleumhydrocarbons in soil and groundwater associated with former underground storage tanks (USTs)at the District's Bixler facility. The District has completed significant site investigation work,including groundwater and soil gas monitoring and requested closure of the site from theCVRWQCB. In early 2015 the CVRWQCB requested one more round of ground watermonitoring at the site before they can consider closure. The additional monitoring is scheduledfor summer 2015.
• The Alameda County Environmental Health Agency requested that the District conductadditional site investigations at the Adeline Maintenance Center Shops to further define the extentof petroleum hydrocarbons in soil and groundwater associated with former USTs. The Districtcompleted additional site investigations in accordance with an approved work plan. The resultsindicate that elevated concentrations of petroleum hydrocarbons still remain in onsite soil andgroundwater in localized areas near the former USTs. The scope of any additional workremaining at this site is unknown and the next step will be to meet with the County to agree uponfinal actions necessary to obtain regulatory closure of the site.
• On April 8, 2015, approximately 170 cubic yards of cellular concrete being used at a Districtconstruction site was accidentally released into a storm drain in Oakland, CA. The incidentoccurred when cellular concrete was being added to a 1,500 foot segment of an abandoned 24-inch water main line. The cellular concrete flowed through enclosed storm drain pipes and opencreek channels following the release. District staff immediately initiated emergency response andan incident command structure to commence cleanup of the creek; the cleanup tookapproximately 4 weeks. The cleanup phase has transitioned into a long term restoration phasewhich is projected to run into early 2016. It is unknown whether or not enforcement action will betaken by regulatory agencies for this incident.
• The District operates many facilities throughout Northern California that have NPDES permits,waste discharge requirements, and air permits. The total estimated liability for all knownviolations is less than $350 thousand.
81
EAST BAY MUNICIPAL UTILITY DISTRICT NOTES TO BASIC FINANCIAL STATEMENTS
FOR THE YEARS ENDED JUNE 30, 2015 AND 2014 (Dollars in Thousands)
NOTE 11 - CONTINGENT LIABILITIES
The District is a defendant in a number of lawsuits which have arisen in the normal course of business including challenges over certain rates and charges. The ultimate outcome of these matters is not presently determinable. In the opinion of the District, these actions when finally adjudicated will not have a material adverse effect on the financial position of the District.
NOTE 12 – COMMITMENTS AND CONTINGENCIES
Central Valley Project
In December 1970, the District entered into a contract with the US Bureau of Reclamation for access to up to 150,000 acre feet per year of Central Valley Project (CVP) water from a diversion point on the American River. The successor contract, the Long Term Renewal Contract, was executed in in April 2006 with a 40 year term. The Long Term Renewal Contract provides for delivery of up to 133,000 acre feet per year of CVP water in dry years to supplement the District’s surface water supplies. Deliveries to the District are limited to a 165,000 acre foot total over any three successive dry years. In years in which the District takes delivery of CVP water, the District’s allocated CVP capital cost and the District’s operations and maintenance deficit balance will be paid down commensurately with the quantity of water delivered. For example, if the District had to take delivery of 80,000 acre feet in fiscal year 15, the District’s CVP capital and deficit balances would each be reduced by approximately 20%. The balances must be paid off by 2030.
82
REQUIRED SUPPLEMENTAL INFORMATION
83
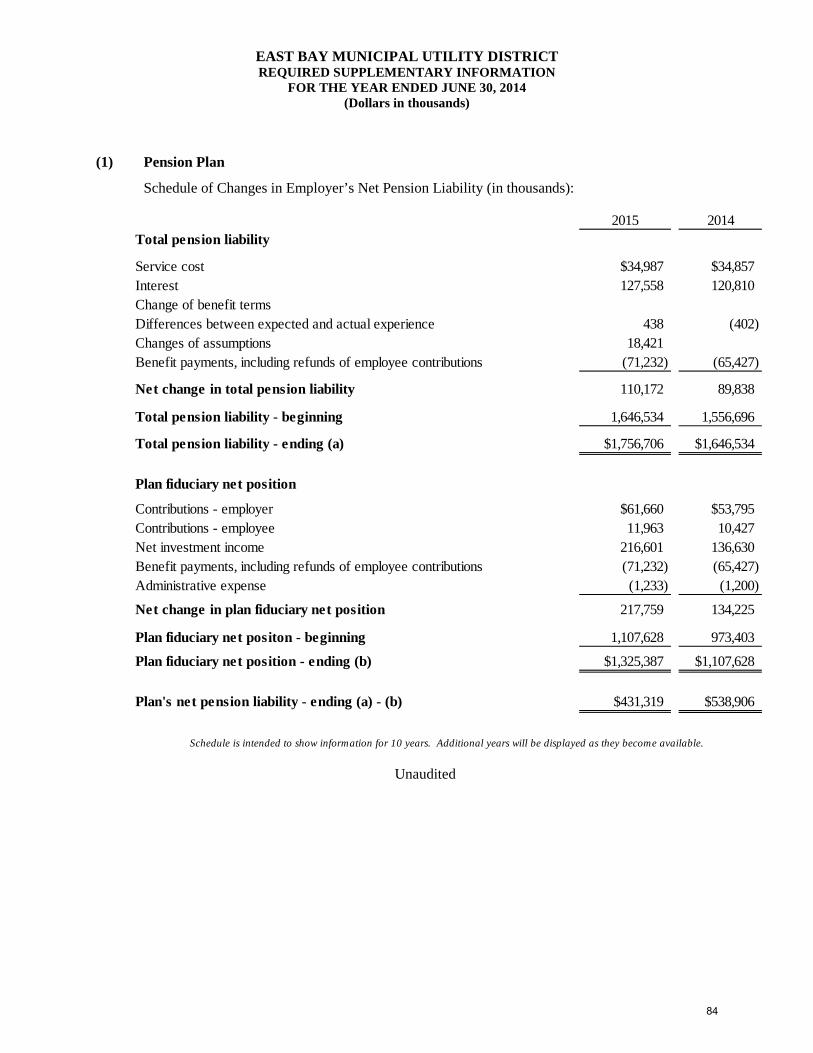
EAST BAY MUNICIPAL UTILITY DISTRICT REQUIRED SUPPLEMENTARY INFORMATION
FOR THE YEAR ENDED JUNE 30, 2014 (Dollars in thousands)
(1) Pension Plan
Schedule of Changes in Employer’s Net Pension Liability (in thousands):
2015 2014Total pension liability
Service cost $34,987 $34,857Interest 127,558 120,810Change of benefit termsDifferences between expected and actual experience 438 (402)Changes of assumptions 18,421Benefit payments, including refunds of employee contributions (71,232) (65,427)
Net change in total pension liability 110,172 89,838
Total pension liability - beginning 1,646,534 1,556,696
Total pension liability - ending (a) $1,756,706 $1,646,534
Plan fiduciary net position
Contributions - employer $61,660 $53,795Contributions - employee 11,963 10,427Net investment income 216,601 136,630Benefit payments, including refunds of employee contributions (71,232) (65,427)Administrative expense (1,233) (1,200)
Net change in plan fiduciary net position 217,759 134,225
Plan fiduciary net positon - beginning 1,107,628 973,403
Plan fiduciary net position - ending (b) $1,325,387 $1,107,628
Plan's net pension liability - ending (a) - (b) $431,319 $538,906
Schedule is intended to show information for 10 years. Additional years will be displayed as they become available.
Unaudited
84
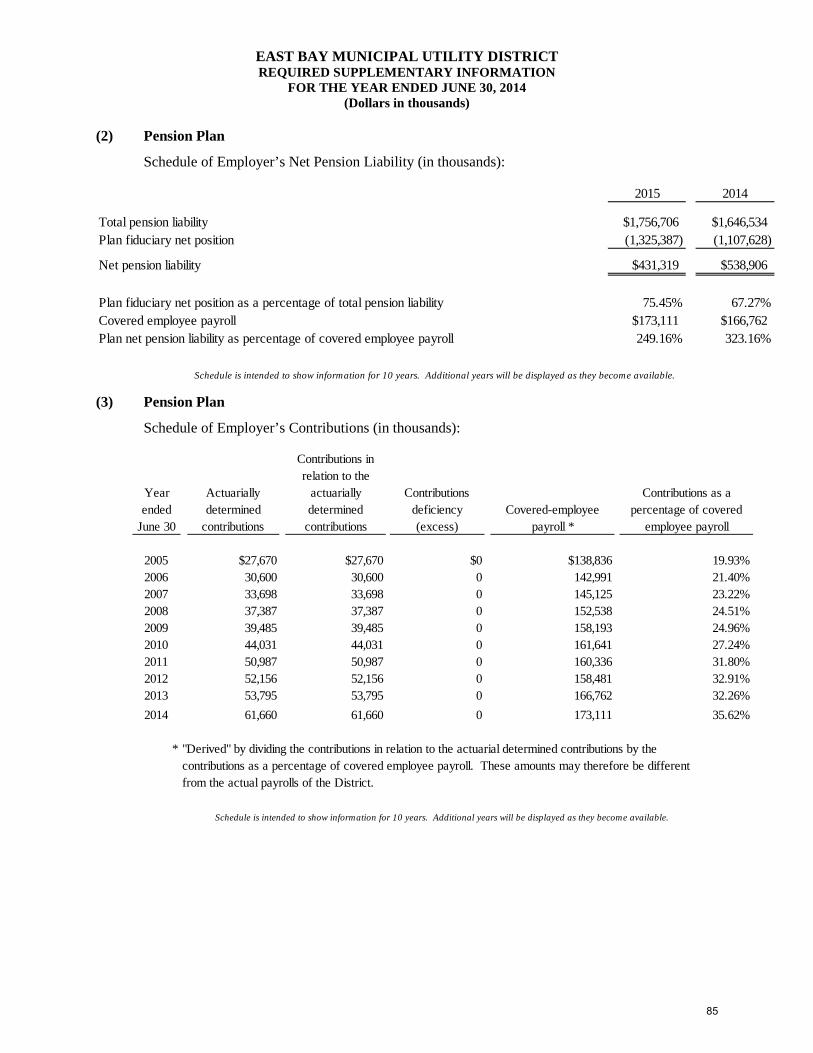
EAST BAY MUNICIPAL UTILITY DISTRICT REQUIRED SUPPLEMENTARY INFORMATION
FOR THE YEAR ENDED JUNE 30, 2014 (Dollars in thousands)
(2) Pension Plan
Schedule of Employer’s Net Pension Liability (in thousands):
2015 2014
Total pension liability $1,756,706 $1,646,534Plan fiduciary net position (1,325,387) (1,107,628)
Net pension liability $431,319 $538,906
Plan fiduciary net position as a percentage of total pension liability 75.45% 67.27%Covered employee payroll $173,111 $166,762Plan net pension liability as percentage of covered employee payroll 249.16% 323.16%
Schedule is intended to show information for 10 years. Additional years will be displayed as they become available.
(3) Pension Plan
Schedule of Employer’s Contributions (in thousands):
Year ended
June 30
Actuarially determined
contributions
Contributions in relation to the
actuarially determined
contributions
Contributions deficiency (excess)
Covered-employee payroll *
Contributions as a percentage of covered
employee payroll
2005 $27,670 $27,670 $0 $138,836 19.93%2006 30,600 30,600 0 142,991 21.40%2007 33,698 33,698 0 145,125 23.22%2008 37,387 37,387 0 152,538 24.51%2009 39,485 39,485 0 158,193 24.96%2010 44,031 44,031 0 161,641 27.24%2011 50,987 50,987 0 160,336 31.80%2012 52,156 52,156 0 158,481 32.91%2013 53,795 53,795 0 166,762 32.26%2014 61,660 61,660 0 173,111 35.62%
* "Derived" by dividing the contributions in relation to the actuarial determined contributions by thecontributions as a percentage of covered employee payroll. These amounts may therefore be differentfrom the actual payrolls of the District.
Schedule is intended to show information for 10 years. Additional years will be displayed as they become available.
85
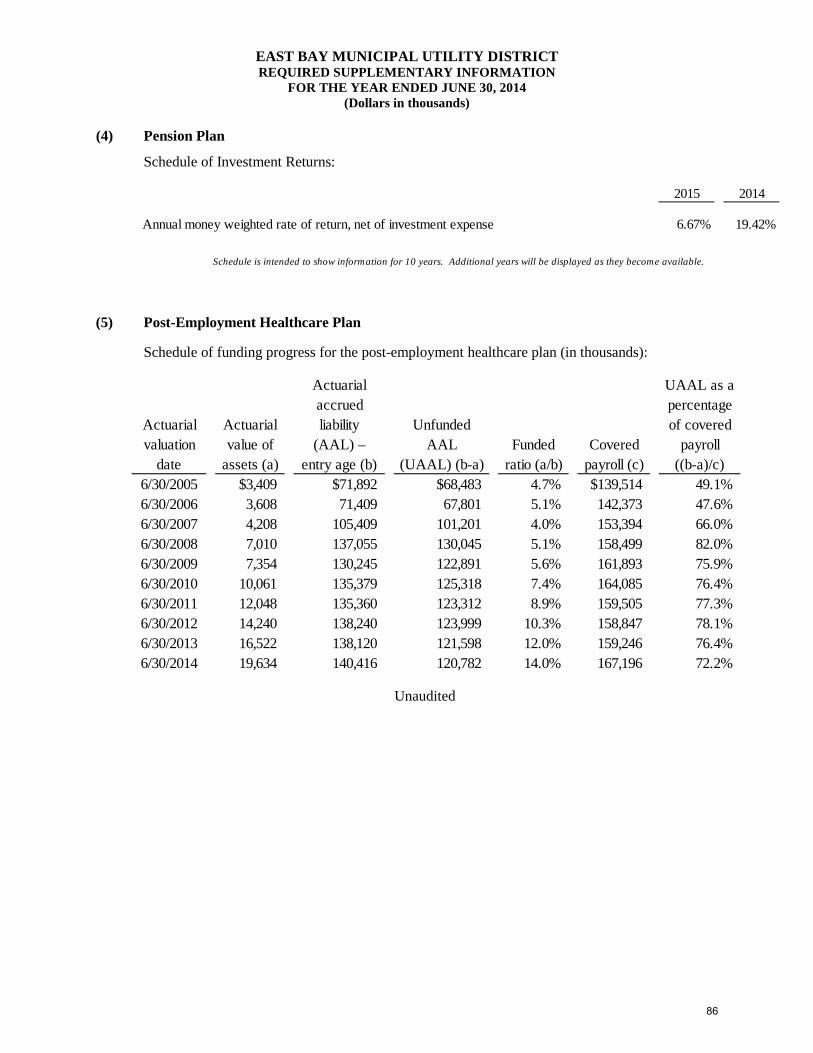
EAST BAY MUNICIPAL UTILITY DISTRICT REQUIRED SUPPLEMENTARY INFORMATION
FOR THE YEAR ENDED JUNE 30, 2014 (Dollars in thousands)
(4) Pension Plan
Schedule of Investment Returns:
2015 2014
Annual money weighted rate of return, net of investment expense 6.67% 19.42%
Schedule is intended to show information for 10 years. Additional years will be displayed as they become available.
(5) Post-Employment Healthcare Plan
Schedule of funding progress for the post-employment healthcare plan (in thousands):
Actuarial UAAL as aaccrued percentage
Actuarial Actuarial liability Unfunded of coveredvaluation value of (AAL) – AAL Funded Covered payroll
date assets (a) entry age (b) (UAAL) (b-a) ratio (a/b) payroll (c) ((b-a)/c)6/30/2005 $3,409 $71,892 $68,483 4.7% $139,514 49.1% 6/30/2006 3,608 71,409 67,801 5.1% 142,373 47.6% 6/30/2007 4,208 105,409 101,201 4.0% 153,394 66.0% 6/30/2008 7,010 137,055 130,045 5.1% 158,499 82.0% 6/30/2009 7,354 130,245 122,891 5.6% 161,893 75.9% 6/30/2010 10,061 135,379 125,318 7.4% 164,085 76.4% 6/30/2011 12,048 135,360 123,312 8.9% 159,505 77.3% 6/30/2012 14,240 138,240 123,999 10.3% 158,847 78.1% 6/30/2013 16,522 138,120 121,598 12.0% 159,246 76.4% 6/30/2014 19,634 140,416 120,782 14.0% 167,196 72.2%
Unaudited
86
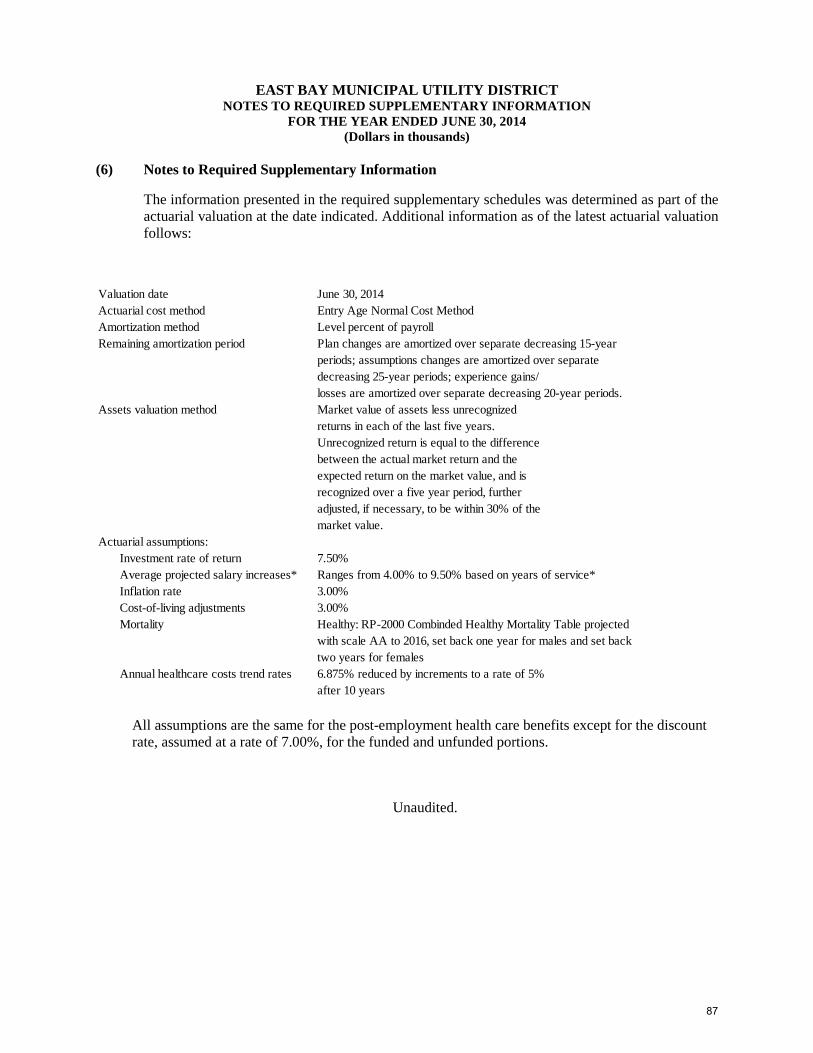
EAST BAY MUNICIPAL UTILITY DISTRICT NOTES TO REQUIRED SUPPLEMENTARY INFORMATION
FOR THE YEAR ENDED JUNE 30, 2014 (Dollars in thousands)
(6) Notes to Required Supplementary Information
The information presented in the required supplementary schedules was determined as part of the actuarial valuation at the date indicated. Additional information as of the latest actuarial valuation follows:
All assumptions are the same for the post-employment health care benefits except for the discount rate, assumed at a rate of 7.00%, for the funded and unfunded portions.
Unaudited.
Valuation date June 30, 2014Actuarial cost method Entry Age Normal Cost MethodAmortization method Level percent of payrollRemaining amortization period Plan changes are amortized over separate decreasing 15-year
periods; assumptions changes are amortized over separatedecreasing 25-year periods; experience gains/losses are amortized over separate decreasing 20-year periods.
Assets valuation method Market value of assets less unrecognized returns in each of the last five years.Unrecognized return is equal to the differencebetween the actual market return and theexpected return on the market value, and isrecognized over a five year period, furtheradjusted, if necessary, to be within 30% of themarket value.
Actuarial assumptions:Investment rate of return 7.50% Average projected salary increases* Ranges from 4.00% to 9.50% based on years of service*Inflation rate 3.00% Cost-of-living adjustments 3.00% Mortality Healthy: RP-2000 Combinded Healthy Mortality Table projected
with scale AA to 2016, set back one year for males and set back two years for females
Annual healthcare costs trend rates 6.875% reduced by increments to a rate of 5% after 10 years
87
SUPPLEMENTAL INFORMATION
88
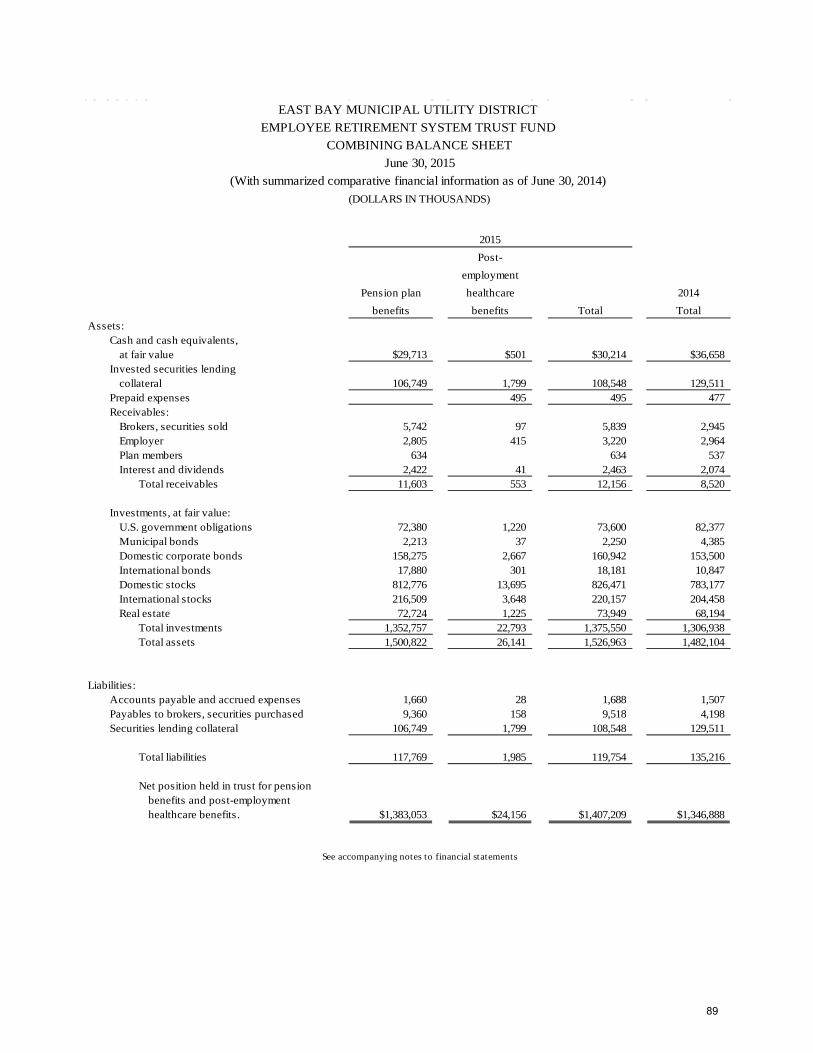
EAST BAY MUNICIPAL UTILITY DISTRICTEMPLOYEE RETIREMENT SYSTEM TRUST FUND
COMBINING BALANCE SHEETJune 30, 2015
(With summarized comparative financial information as of June 30, 2014) (DOLLARS IN THOUSANDS)
2015Post-
employmentPension plan healthcare 2014
benefits benefits Total TotalAssets:
Cash and cash equivalents,at fair value $29,713 $501 $30,214 $36,658
Invested securities lendingcollateral 106,749 1,799 108,548 129,511
Prepaid expenses 495 495 477Receivables:
Brokers, securities sold 5,742 97 5,839 2,945Employer 2,805 415 3,220 2,964Plan members 634 634 537Interest and dividends 2,422 41 2,463 2,074
Total receivables 11,603 553 12,156 8,520
Investments, at fair value:U.S. government obligations 72,380 1,220 73,600 82,377Municipal bonds 2,213 37 2,250 4,385Domestic corporate bonds 158,275 2,667 160,942 153,500International bonds 17,880 301 18,181 10,847Domestic stocks 812,776 13,695 826,471 783,177International stocks 216,509 3,648 220,157 204,458Real estate 72,724 1,225 73,949 68,194
Total investments 1,352,757 22,793 1,375,550 1,306,938Total assets 1,500,822 26,141 1,526,963 1,482,104
Liabilities:Accounts payable and accrued expenses 1,660 28 1,688 1,507Payables to brokers, securities purchased 9,360 158 9,518 4,198Securities lending collateral 106,749 1,799 108,548 129,511
Total liabilities 117,769 1,985 119,754 135,216
Net position held in trust for pension benefits and post-employmenthealthcare benefits. $1,383,053 $24,156 $1,407,209 $1,346,888
See accompanying notes to financial statements
89
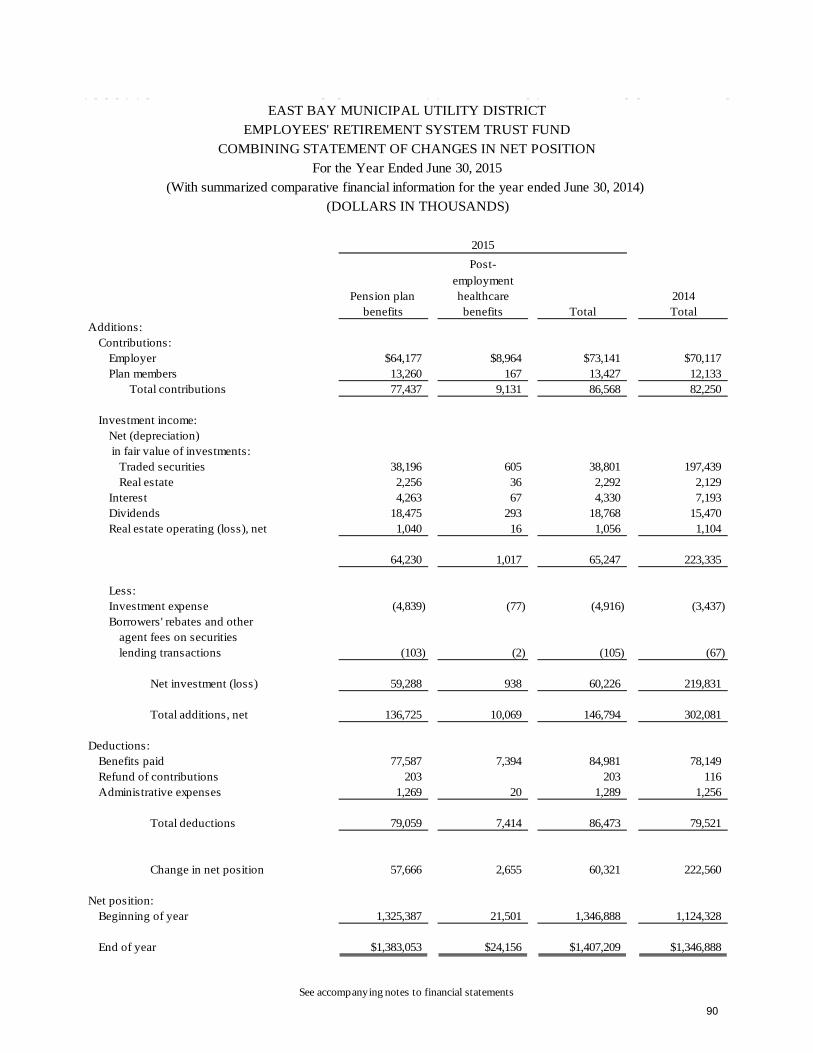
EAST BAY MUNICIPAL UTILITY DISTRICTEMPLOYEES' RETIREMENT SYSTEM TRUST FUND
COMBINING STATEMENT OF CHANGES IN NET POSITIONFor the Year Ended June 30, 2015
(With summarized comparative financial information for the year ended June 30, 2014) (DOLLARS IN THOUSANDS)
2015Post-
employmentPension plan healthcare 2014
benefits benefits Total TotalAdditions:
Contributions:Employer $64,177 $8,964 $73,141 $70,117Plan members 13,260 167 13,427 12,133
Total contributions 77,437 9,131 86,568 82,250
Investment income:Net (depreciation) in fair value of investments:
Traded securities 38,196 605 38,801 197,439Real estate 2,256 36 2,292 2,129
Interest 4,263 67 4,330 7,193Dividends 18,475 293 18,768 15,470Real estate operating (loss), net 1,040 16 1,056 1,104
64,230 1,017 65,247 223,335
Less:Investment expense (4,839) (77) (4,916) (3,437)Borrowers' rebates and other
agent fees on securitieslending transactions (103) (2) (105) (67)
Net investment (loss) 59,288 938 60,226 219,831
Total additions, net 136,725 10,069 146,794 302,081
Deductions:Benefits paid 77,587 7,394 84,981 78,149Refund of contributions 203 203 116Administrative expenses 1,269 20 1,289 1,256
Total deductions 79,059 7,414 86,473 79,521
Change in net position 57,666 2,655 60,321 222,560
Net position:Beginning of year 1,325,387 21,501 1,346,888 1,124,328
End of year $1,383,053 $24,156 $1,407,209 $1,346,888
See accompanying notes to financial statements
90
INDEPENDENT AUDITOR’S REPORT ON INTERNAL CONTROL OVER FINANCIAL REPORTING
AND ON COMPLIANCE AND OTHER MATTERS BASED ON AN AUDIT OF FINANCIAL STATEMENTS PERFORMED IN ACCORDANCE
WITH GOVERNMENT AUDITING STANDARDS
Board of Directors East Bay Municipal Utility District Oakland, California
We have audited, in accordance with the auditing standards generally accepted in the United States of America and the standards applicable to financial audits contained in Government Auditing Standards issued by the Comptroller General of the United States, the basic financial statements of the East Bay Municipal Utility District, as of and for the year ended June 30, 2015 and the related notes to the financial statements, and have issued our report thereon dated August 27, 2015. Our report included an emphasis of a matter paragraph disclosing the implementation of new accounting principles.
Internal Control Over Financial Reporting
In planning and performing our audit of the financial statements, we considered the District's internal control over financial reporting (internal control) to determine the audit procedures that are appropriate in the circumstances for the purpose of expressing our opinions on the financial statements, but not for the purpose of expressing an opinion on the effectiveness of the District's internal control. Accordingly, we do not express an opinion on the effectiveness of the District's internal control.
A deficiency in internal control exists when the design or operation of a control does not allow management or employees, in the normal course of performing their assigned functions, to prevent, or detect and correct, misstatements on a timely basis. A material weakness is a deficiency, or a combination of deficiencies, in internal control, such that there is a reasonable possibility that a material misstatement of the District's financial statements will not be prevented, or detected and corrected on a timely basis. A significant deficiency is a deficiency, or a combination of deficiencies, in internal control that is less severe than a material weakness, yet important enough to merit attention by those charged with governance.
Our consideration of internal control was for the limited purpose described in the first paragraph of this section and was not designed to identify all deficiencies in internal control that might be material weaknesses or significant deficiencies. Given these limitations, during our audit we did not identify any deficiencies in internal control that we consider to be material weaknesses. However, material weaknesses may exist that have not been identified.
91
Compliance and Other Matters
As part of obtaining reasonable assurance about whether the District's financial statements are free from material misstatement, we performed tests of its compliance with certain provisions of laws, regulations, contracts, and grant agreements, noncompliance with which could have a direct and material effect on the determination of financial statement amounts. However, providing an opinion on compliance with those provisions was not an objective of our audit, and accordingly, we do not express such an opinion. The results of our tests disclosed no instances of noncompliance or other matters that are required to be reported under Government Auditing Standards.
We have also issued a separate Memorandum on Internal Control dated August 27, 2015 which is an integral part of our audit and should be read in conjunction with this report.
Purpose of this Report
The purpose of this report is solely to describe the scope of our testing of internal control and compliance and the results of that testing, and not to provide an opinion on the effectiveness of the District's internal control or on compliance. This report is an integral part of an audit performed in accordance with Government Auditing Standards in considering the District's internal control and compliance. Accordingly, this communication is not suitable for any other purpose.
Pleasant Hill, California August 27, 2015
92
Financial Review of Fiscal Year 2015
Memorandum on Internal Controls and
Required Communication
93
EAST BAY MUNICIPAL UTILITY DISTRICT
MEMORANDUM ON INTERNAL CONTROL AND
REQUIRED COMMUNICATIONS
FOR THE YEAR ENDED JUNE 30, 2015
94
EAST BAY MUNICIPAL UTILITY DISTRICT MEMORANDUM ON INTERNAL CONTROL
AND REQUIRED COMMUNICATIONS
For the Year Ended June 30, 2015
Table of Contents
Page
Memorandum on Internal Control ....................................................................................................................96
Required Communications .................................................................................................................................97
Significant Audit Findings:
Accounting Policies ..................................................................................................................................97
Unusual Transactions, Controversial or Emerging Areas ........................................................................97
Estimates ...................................................................................................................................................97
Disclosures ................................................................................................................................................98
Difficulties Encountered in Performing the Audit .................................................................................98
Corrected and Uncorrected Misstatements ..............................................................................................98
Disagreements with Management ............................................................................................................98
Management Representations ...................................................................................................................98
Management Consultations with Other Independent Accountants .........................................................98
Other Audit Findings or Issues .................................................................................................................98
Other Matters:
Other Information Accompanying the Financial Statements ..................................................................99
95
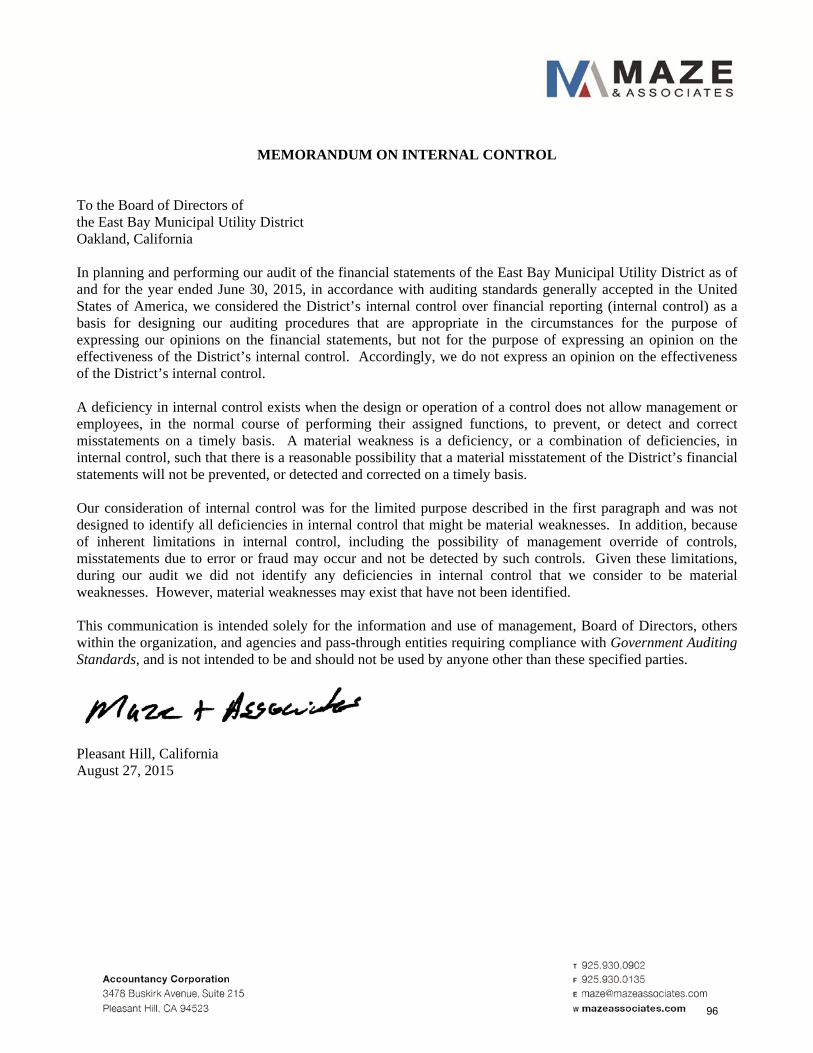
MEMORANDUM ON INTERNAL CONTROL
To the Board of Directors of the East Bay Municipal Utility District Oakland, California
In planning and performing our audit of the financial statements of the East Bay Municipal Utility District as of and for the year ended June 30, 2015, in accordance with auditing standards generally accepted in the United States of America, we considered the District’s internal control over financial reporting (internal control) as a basis for designing our auditing procedures that are appropriate in the circumstances for the purpose of expressing our opinions on the financial statements, but not for the purpose of expressing an opinion on the effectiveness of the District’s internal control. Accordingly, we do not express an opinion on the effectiveness of the District’s internal control.
A deficiency in internal control exists when the design or operation of a control does not allow management or employees, in the normal course of performing their assigned functions, to prevent, or detect and correct misstatements on a timely basis. A material weakness is a deficiency, or a combination of deficiencies, in internal control, such that there is a reasonable possibility that a material misstatement of the District’s financial statements will not be prevented, or detected and corrected on a timely basis.
Our consideration of internal control was for the limited purpose described in the first paragraph and was not designed to identify all deficiencies in internal control that might be material weaknesses. In addition, because of inherent limitations in internal control, including the possibility of management override of controls, misstatements due to error or fraud may occur and not be detected by such controls. Given these limitations, during our audit we did not identify any deficiencies in internal control that we consider to be material weaknesses. However, material weaknesses may exist that have not been identified.
This communication is intended solely for the information and use of management, Board of Directors, others within the organization, and agencies and pass-through entities requiring compliance with Government Auditing Standards, and is not intended to be and should not be used by anyone other than these specified parties.
Pleasant Hill, California August 27, 2015
96
3
REQUIRED COMMUNICATIONS
To the Board of Directors of the East Bay Municipal Utility District Oakland, California
We have audited the basic financial statements of the East Bay Municipal Utility District for the year ended June 30, 2015. Professional standards require that we communicate to you the following information related to our audit under generally accepted auditing standards, and Government Audit Standards.
Significant Audit Findings
Accounting Policies
Management is responsible for the selection and use of appropriate accounting policies. The significant accounting policies used by the District are included in Note 1 to the financial statements. No new accounting policies were adopted and the application of existing policies was not changed during the year, except as follows:
GASB 68 – Accounting and Financial Reporting for Pension, an Amendment of GASB Statement No. 27
GASB 71 – Pension Transition for Contributions Made Subsequent to the Measurement Date, and Amendment of GASB Statement No. 68
These pronouncements became effective, and as disclosed in Note 1R and 8 to the financial statements required a prior period restatement for the cumulative effect on the financial statements.
Unusual Transactions, Controversial or Emerging Areas
We noted no transactions entered into by the District during the year for which there is a lack of authoritative guidance or consensus. All significant transactions have been recognized in the financial statements in the proper period.
Estimates
Accounting estimates are an integral part of the financial statements prepared by management and are based on management’s current judgments. Those judgments are normally based on knowledge and experience about past and current events and assumptions about future events. Certain accounting estimates are particularly sensitive because of their significance to the financial statements and because of the possibility that future events affecting them may differ significantly from those expected. The most sensitive estimates affecting the District’s financial statements are depreciation, claims liability and actuarial estimates for the Employees’ Retirement System.
Management’s estimate of depreciation is based on the estimated useful lives of the capital assets. The claims liability is based on the District Attorney’s estimates of current and potential litigation, as well as actuary studies provided for the District as of June 30, 2015. The value of the assets, liability and assumptions used to determine annual required contributions to the Employees’ Retirement System is determined by an actuary study provided to the District as of June 30, 2015. We evaluated the key factors and assumptions used to develop the depreciation expense, claims liability and reviewed the current actuary study for claims liability and determined that they are reasonable in relation to the basic financial statements taken as a whole.
97
Disclosures
The financial statement disclosures are neutral, consistent, and clear.
Difficulties Encountered in Performing the Audit
We encountered no significant difficulties in dealing with management in performing and completing our audit.
Corrected and Uncorrected Misstatements
Professional standards require us to accumulate all known and likely misstatements identified during the audit, other than those that are clearly trivial, and communicate them to the appropriate level of management. Management has corrected all/certain such misstatements. In addition, none of the misstatements detected as a result of audit procedures and corrected by management were material, either individually or in the aggregate, to each opinion unit's financial statements taken as a whole.
Disagreements with Management
For purposes of this letter, a disagreement with management is a financial accounting, reporting, or auditing matter, whether or not resolved to our satisfaction, that could be significant to the financial statements or the auditor’s report. We are pleased to report that no such disagreements arose during the course of our audit.
Management Representations
We have requested certain representations from management that are included in a management representation letter dated August 27, 2015.
Management Consultations with Other Independent Accountants
In some cases, management may decide to consult with other accountants about auditing and accounting matters, similar to obtaining a "second opinion" on certain situations. If a consultation involves application of an accounting principle to the District's financial statements or a determination of the type of auditor's opinion that may be expressed on those statements, our professional standards require the consulting accountant to check with us to determine that the consultant has all the relevant facts. To our knowledge, there were no such consultations with other accountants.
Other Audit Findings or Issues
We generally discuss a variety of matters, including the application of accounting principles and auditing standards, with management each year prior to retention as the governmental unit's auditors. However, these discussions occurred in the normal course of our professional relationship and our responses were not a condition to our retention.
98
Other Matters
Other Information Accompanying the Financial Statements
With respect to the supplementary information accompanying the financial statements, we made certain inquiries of management and evaluated the form, content, and methods of preparing the information to determine that the information complies with accounting principles generally accepted in the United States of America, the method of preparing it has not changed from the prior period, and the information is appropriate and complete in relation to our audit of the financial statements. We compared and reconciled the supplementary information to the underlying accounting records used to prepare the financial statements or to the financial statements themselves.
With respect to the required supplementary information accompanying the financial statements, we applied certain limited procedures to the required supplementary information in accordance with auditing standards generally accepted in the United States of America, which consisted of inquiries of management about the methods of preparing the information and comparing the information for consistency with management’s responses to our inquiries, the basic financial statements, and other knowledge we obtained during our audit of the basic financial statements. We did not express an opinion nor provide any assurance on the information because the limited procedures do not provide us with sufficient evidence to express an opinion or provide any assurance.
******
This information is intended solely for the use of the Finance Committee, Board of Directors and management and is not intended to be, and should not be, used by anyone other than these specified parties.
Pleasant Hill, California August 27, 2015
99
Financial Review of Fiscal Year 2015
Annual Budget Performance Report
100
Financial Review of Fiscal Year 2015
This report provides a budget analysis for the Water and Wastewater Systems of the East Bay Municipal Utility District for FY15. The objectives of this report are to:
• Provide an analysis of operating revenues and expenditures compared to budget; and
• Provide a summary of major capital project expenditures.
Summary of Budget Performance The summary below reflects the operating budget performance for each enterprise. The Water and the Wastewater enterprises ended FY15 with a net positive operating budget variance.
Water System
• Revenues - $21.3 million
• Expenditures + $36.2 million
• Budget Variance + $14.9 million Wastewater System
• Revenues + $4.2 million
• Expenditures + $5.4 million
• Budget Variance + $9.6 million Please refer to the specific sections within this report for more details on revenue, operating and major capital project expenditures for each enterprise.
101
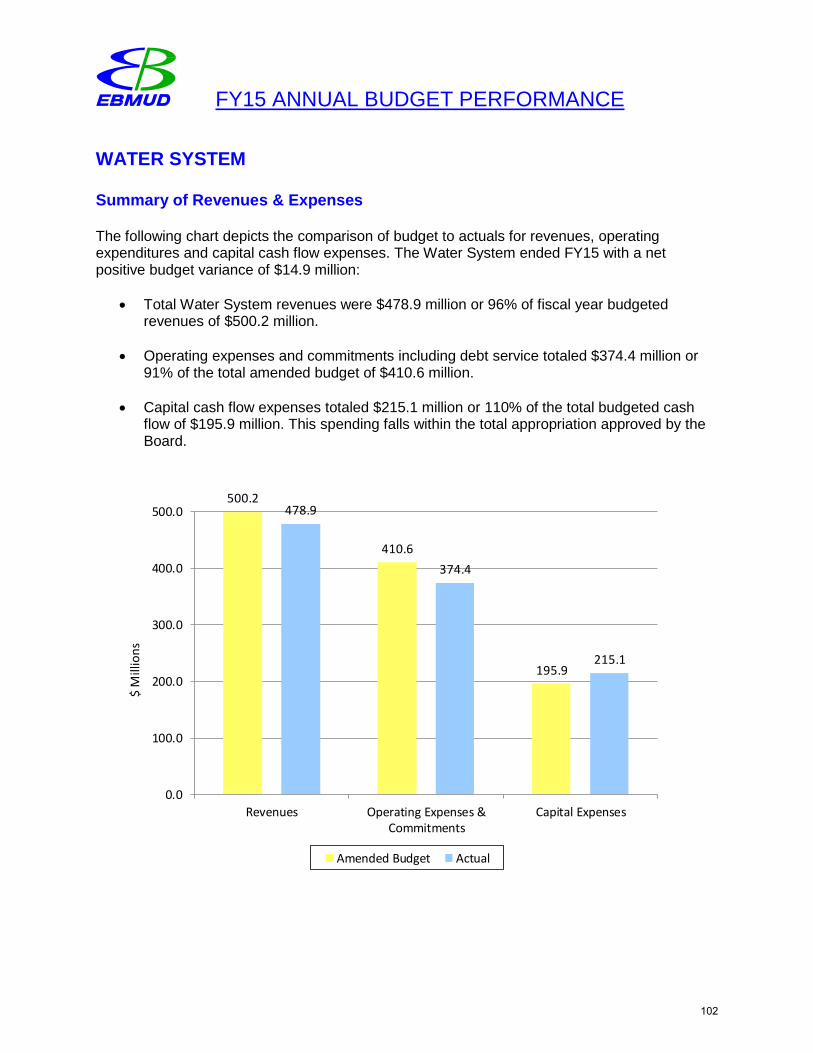
FY15 ANNUAL BUDGET PERFORMANCE
WATER SYSTEM
Summary of Revenues & Expenses
The following chart depicts the comparison of budget to actuals for revenues, operating expenditures and capital cash flow expenses. The Water System ended FY15 with a net positive budget variance of $14.9 million:
• Total Water System revenues were $478.9 million or 96% of fiscal year budgetedrevenues of $500.2 million.
• Operating expenses and commitments including debt service totaled $374.4 million or91% of the total amended budget of $410.6 million.
• Capital cash flow expenses totaled $215.1 million or 110% of the total budgeted cashflow of $195.9 million. This spending falls within the total appropriation approved by theBoard.
500.2
410.6
195.9
478.9
374.4
215.1
0.0
100.0
200.0
300.0
400.0
500.0
Revenues Operating Expenses &Commitments
Capital Expenses
$ M
illio
ns
Amended Budget Actual
102
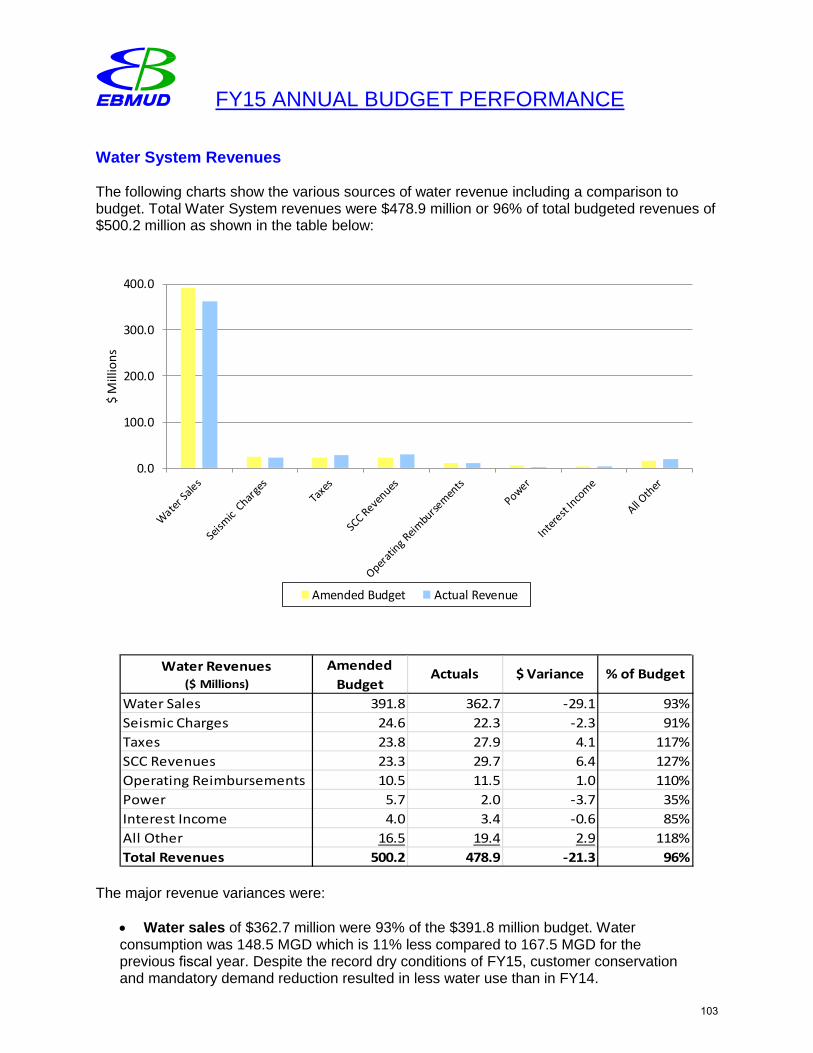
FY15 ANNUAL BUDGET PERFORMANCE
Water System Revenues
The following charts show the various sources of water revenue including a comparison to budget. Total Water System revenues were $478.9 million or 96% of total budgeted revenues of $500.2 million as shown in the table below:
0.0
100.0
200.0
300.0
400.0
$ M
illio
ns
Amended Budget Actual Revenue
Water Sales 391.8 362.7 -29.1 93%Seismic Charges 24.6 22.3 -2.3 91%Taxes 23.8 27.9 4.1 117%SCC Revenues 23.3 29.7 6.4 127%Operating Reimbursements 10.5 11.5 1.0 110%Power 5.7 2.0 -3.7 35%Interest Income 4.0 3.4 -0.6 85%All Other 16.5 19.4 2.9 118%Total Revenues 500.2 478.9 -21.3 96%
Water Revenues ($ Millions)
Amended Budget
% of BudgetActuals $ Variance
The major revenue variances were:
• Water sales of $362.7 million were 93% of the $391.8 million budget. Waterconsumption was 148.5 MGD which is 11% less compared to 167.5 MGD for the previous fiscal year. Despite the record dry conditions of FY15, customer conservation and mandatory demand reduction resulted in less water use than in FY14.
103
FY15 ANNUAL BUDGET PERFORMANCE
• Property tax receipts were 117% of budget due to higher than anticipated tax receiptsresulting from increased property assessment values. • SCC Revenues of $29.7 million were 127% of the $23.3 million budget due to greaterdevelopment activity than anticipated. • Power revenue was 35% of the $5.7 million budget. This decrease is due to less runofffor hydroelectric production as a result of the dry conditions. • Interest income was 85% of the $4.0 million budget. This decrease is due to continuedlow interest rates offset by the profitable sale of a fixed interest rate security formerly held in a debt service reserve fund. • All Other revenue of $19.4 million was 118% of budget primarily due to the unbudgetedsale of the former Oakland business office.
104
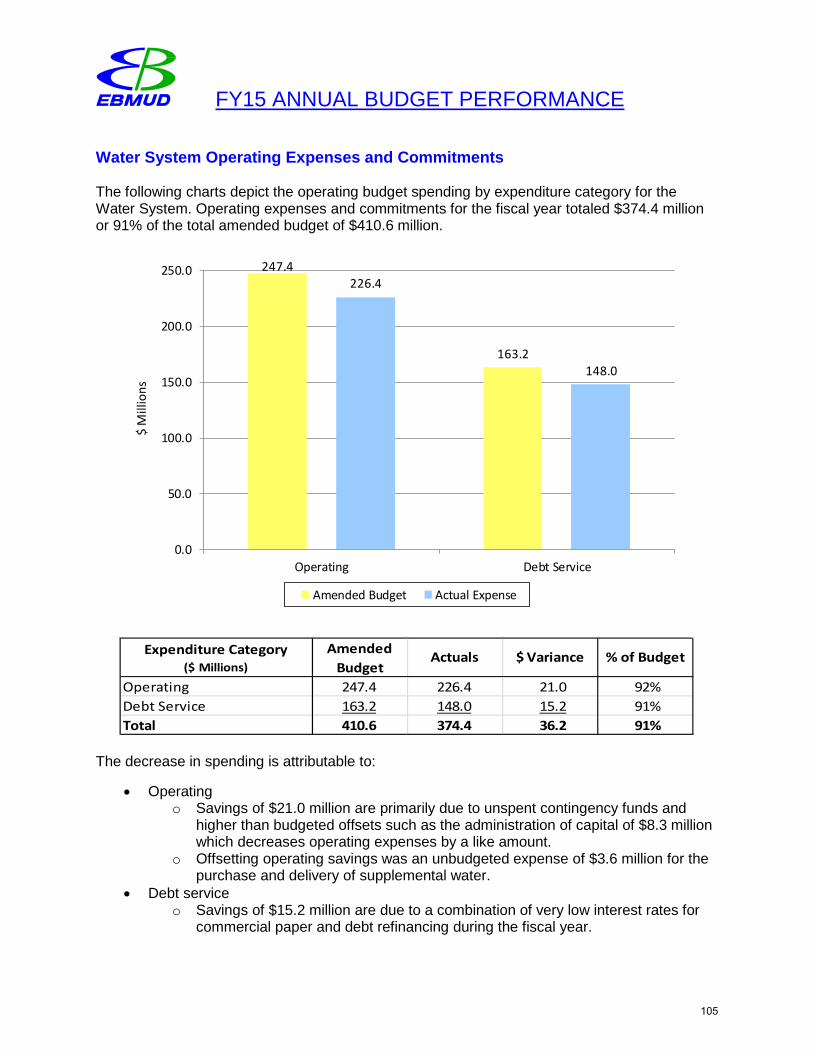
FY15 ANNUAL BUDGET PERFORMANCE
Water System Operating Expenses and Commitments
The following charts depict the operating budget spending by expenditure category for the Water System. Operating expenses and commitments for the fiscal year totaled $374.4 million or 91% of the total amended budget of $410.6 million.
247.4
163.2
226.4
148.0
0.0
50.0
100.0
150.0
200.0
250.0
Operating Debt Service
$ M
illio
ns
Amended Budget Actual Expense
Operating 247.4 226.4 21.0 92%Debt Service 163.2 148.0 15.2 91%Total 410.6 374.4 36.2 91%
% of BudgetExpenditure Category ($ Millions)
Amended Budget
Actuals $ Variance
The decrease in spending is attributable to:
• Operatingo Savings of $21.0 million are primarily due to unspent contingency funds and
higher than budgeted offsets such as the administration of capital of $8.3 millionwhich decreases operating expenses by a like amount.
o Offsetting operating savings was an unbudgeted expense of $3.6 million for thepurchase and delivery of supplemental water.
• Debt serviceo Savings of $15.2 million are due to a combination of very low interest rates for
commercial paper and debt refinancing during the fiscal year.
105
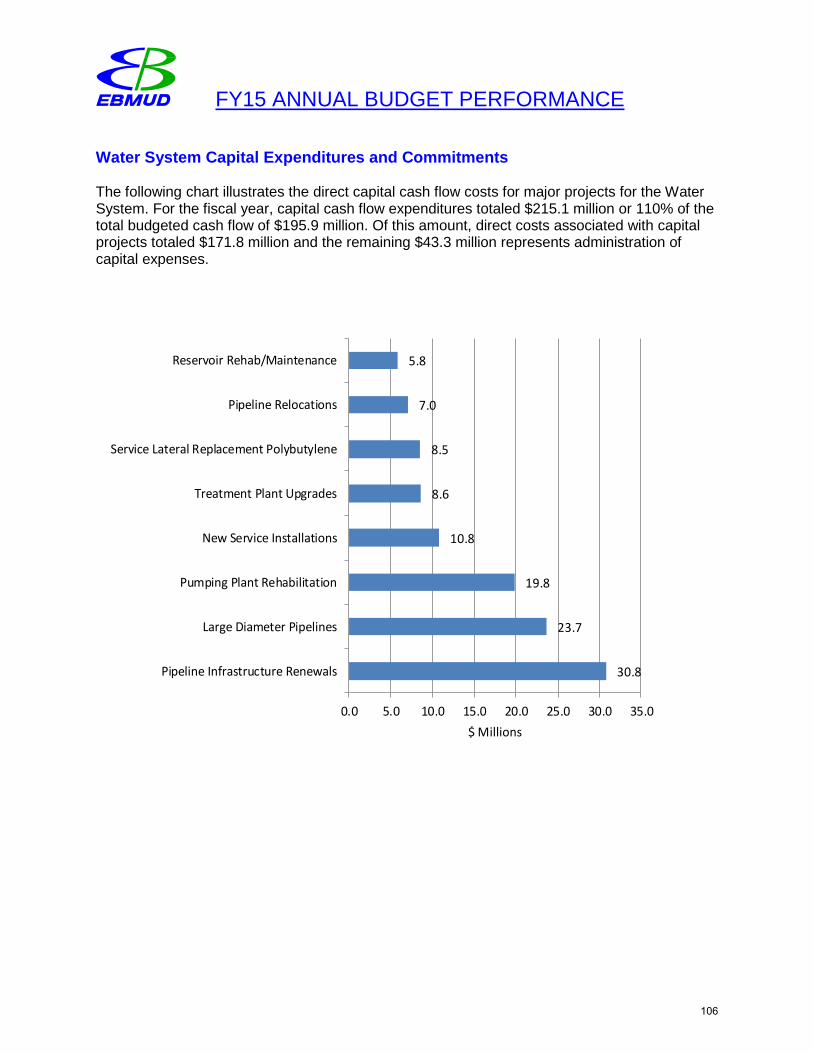
FY15 ANNUAL BUDGET PERFORMANCE
Water System Capital Expenditures and Commitments
The following chart illustrates the direct capital cash flow costs for major projects for the Water System. For the fiscal year, capital cash flow expenditures totaled $215.1 million or 110% of the total budgeted cash flow of $195.9 million. Of this amount, direct costs associated with capital projects totaled $171.8 million and the remaining $43.3 million represents administration of capital expenses.
30.8
23.7
19.8
10.8
8.6
8.5
7.0
5.8
0.0 5.0 10.0 15.0 20.0 25.0 30.0 35.0
Pipeline Infrastructure Renewals
Large Diameter Pipelines
Pumping Plant Rehabilitation
New Service Installations
Treatment Plant Upgrades
Service Lateral Replacement Polybutylene
Pipeline Relocations
Reservoir Rehab/Maintenance
$ Millions
106
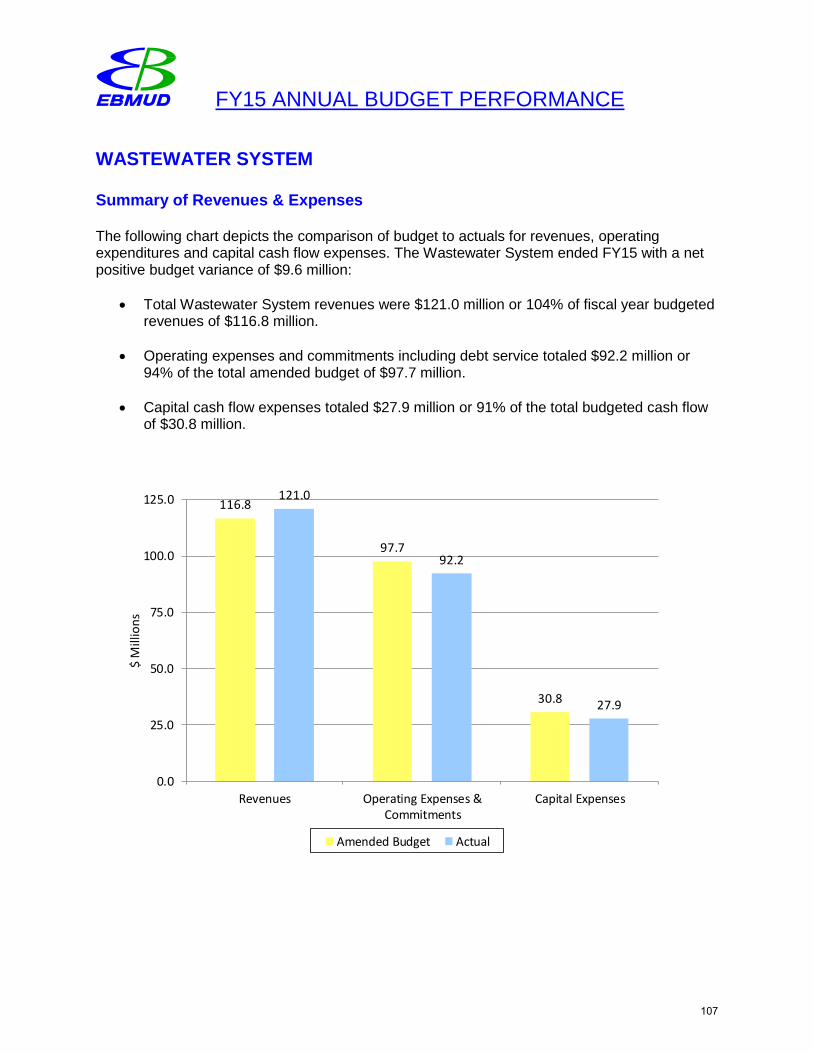
FY15 ANNUAL BUDGET PERFORMANCE
WASTEWATER SYSTEM
Summary of Revenues & Expenses
The following chart depicts the comparison of budget to actuals for revenues, operating expenditures and capital cash flow expenses. The Wastewater System ended FY15 with a net positive budget variance of $9.6 million:
• Total Wastewater System revenues were $121.0 million or 104% of fiscal year budgetedrevenues of $116.8 million.
• Operating expenses and commitments including debt service totaled $92.2 million or94% of the total amended budget of $97.7 million.
• Capital cash flow expenses totaled $27.9 million or 91% of the total budgeted cash flowof $30.8 million.
116.8
97.7
30.8
121.0
92.2
27.9
0.0
25.0
50.0
75.0
100.0
125.0
Revenues Operating Expenses &Commitments
Capital Expenses
$ M
illio
ns
Amended Budget Actual
107
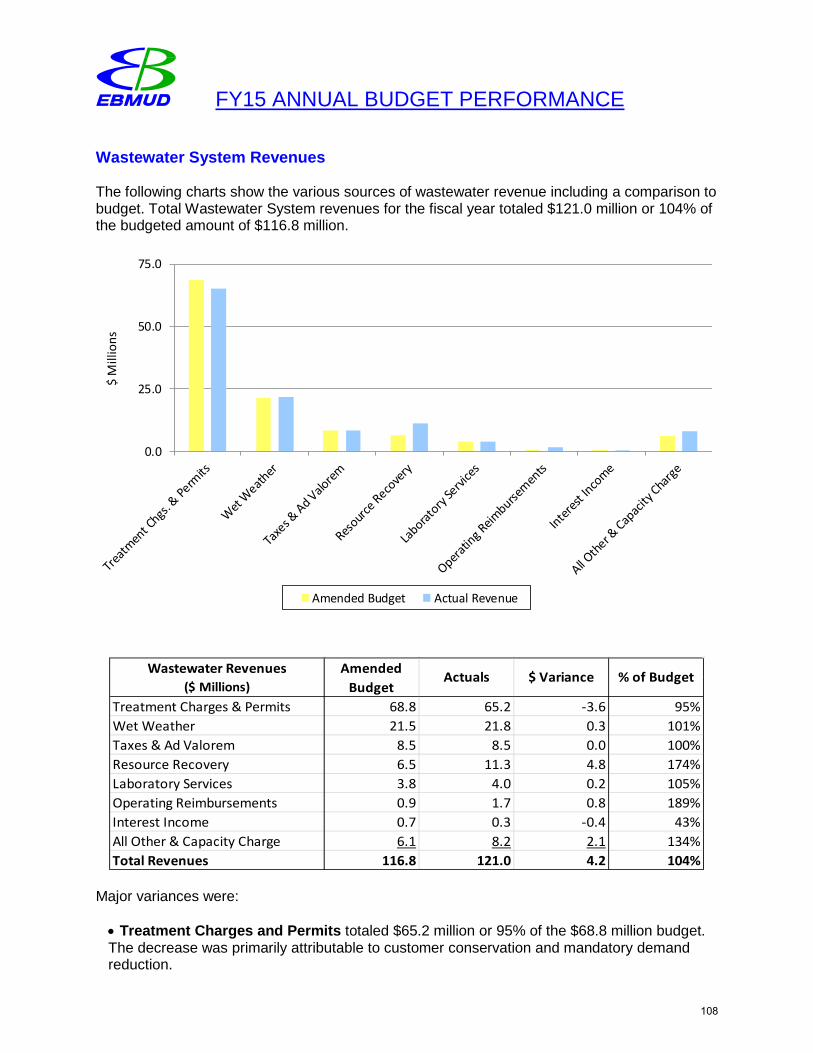
FY15 ANNUAL BUDGET PERFORMANCE
Wastewater System Revenues
The following charts show the various sources of wastewater revenue including a comparison to budget. Total Wastewater System revenues for the fiscal year totaled $121.0 million or 104% of the budgeted amount of $116.8 million.
0.0
25.0
50.0
75.0
$ M
illio
ns
Amended Budget Actual Revenue
Treatment Charges & Permits 68.8 65.2 -3.6 95%Wet Weather 21.5 21.8 0.3 101%Taxes & Ad Valorem 8.5 8.5 0.0 100%Resource Recovery 6.5 11.3 4.8 174%Laboratory Services 3.8 4.0 0.2 105%Operating Reimbursements 0.9 1.7 0.8 189%Interest Income 0.7 0.3 -0.4 43%All Other & Capacity Charge 6.1 8.2 2.1 134%Total Revenues 116.8 121.0 4.2 104%
Wastewater Revenues ($ Millions)
Amended Budget
Actuals $ Variance % of Budget
Major variances were:
• Treatment Charges and Permits totaled $65.2 million or 95% of the $68.8 million budget.The decrease was primarily attributable to customer conservation and mandatory demand reduction.
108
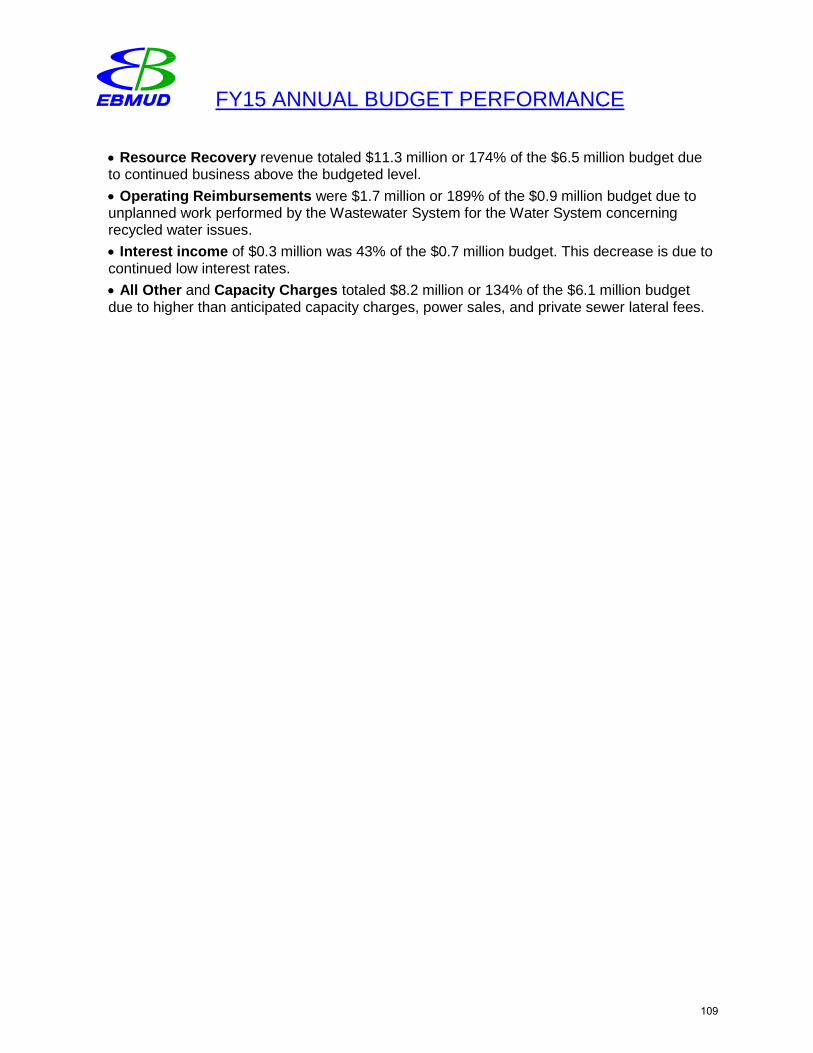
FY15 ANNUAL BUDGET PERFORMANCE
• Resource Recovery revenue totaled $11.3 million or 174% of the $6.5 million budget dueto continued business above the budgeted level. • Operating Reimbursements were $1.7 million or 189% of the $0.9 million budget due tounplanned work performed by the Wastewater System for the Water System concerning recycled water issues. • Interest income of $0.3 million was 43% of the $0.7 million budget. This decrease is due tocontinued low interest rates. • All Other and Capacity Charges totaled $8.2 million or 134% of the $6.1 million budgetdue to higher than anticipated capacity charges, power sales, and private sewer lateral fees.
109
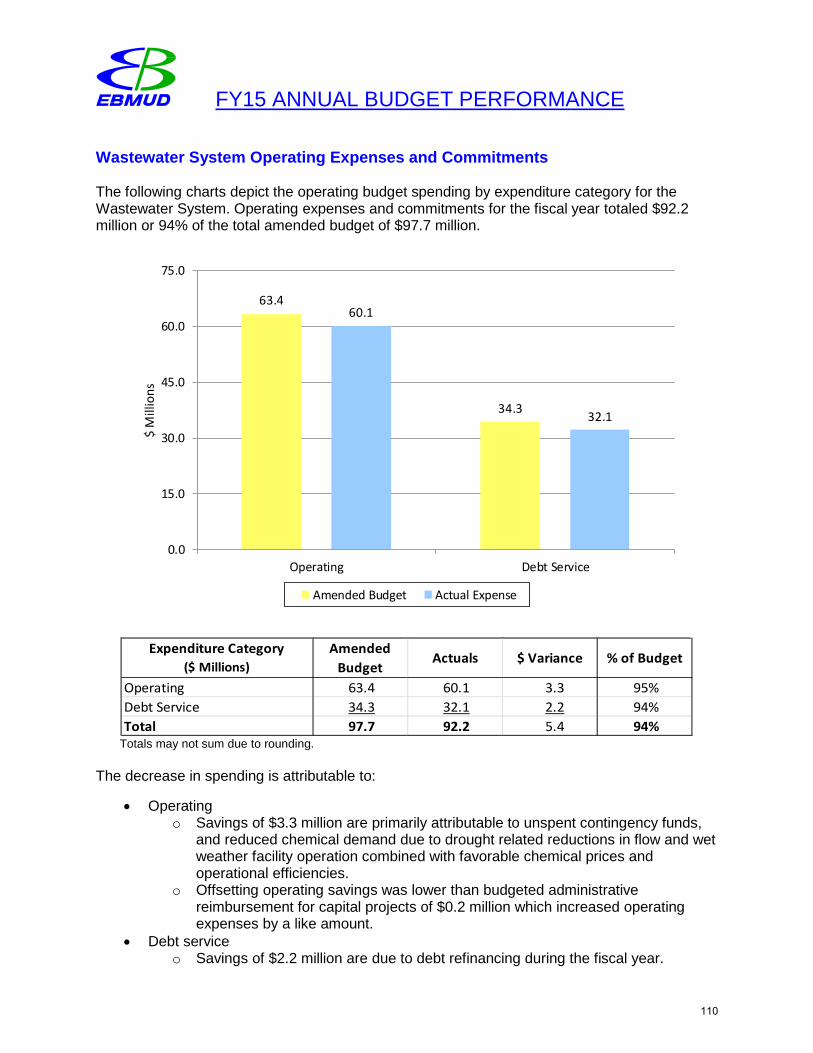
FY15 ANNUAL BUDGET PERFORMANCE
Wastewater System Operating Expenses and Commitments
The following charts depict the operating budget spending by expenditure category for the Wastewater System. Operating expenses and commitments for the fiscal year totaled $92.2 million or 94% of the total amended budget of $97.7 million.
63.4
34.3
60.1
32.1
0.0
15.0
30.0
45.0
60.0
75.0
Operating Debt Service
$ M
illio
ns
Amended Budget Actual Expense
Operating 63.4 60.1 3.3 95%Debt Service 34.3 32.1 2.2 94%Total 97.7 92.2 5.4 94%
% of BudgetExpenditure Category
($ Millions)Amended
BudgetActuals $ Variance
Totals may not sum due to rounding.
The decrease in spending is attributable to:
• Operatingo Savings of $3.3 million are primarily attributable to unspent contingency funds,
and reduced chemical demand due to drought related reductions in flow and wetweather facility operation combined with favorable chemical prices andoperational efficiencies.
o Offsetting operating savings was lower than budgeted administrativereimbursement for capital projects of $0.2 million which increased operatingexpenses by a like amount.
• Debt serviceo Savings of $2.2 million are due to debt refinancing during the fiscal year.
110
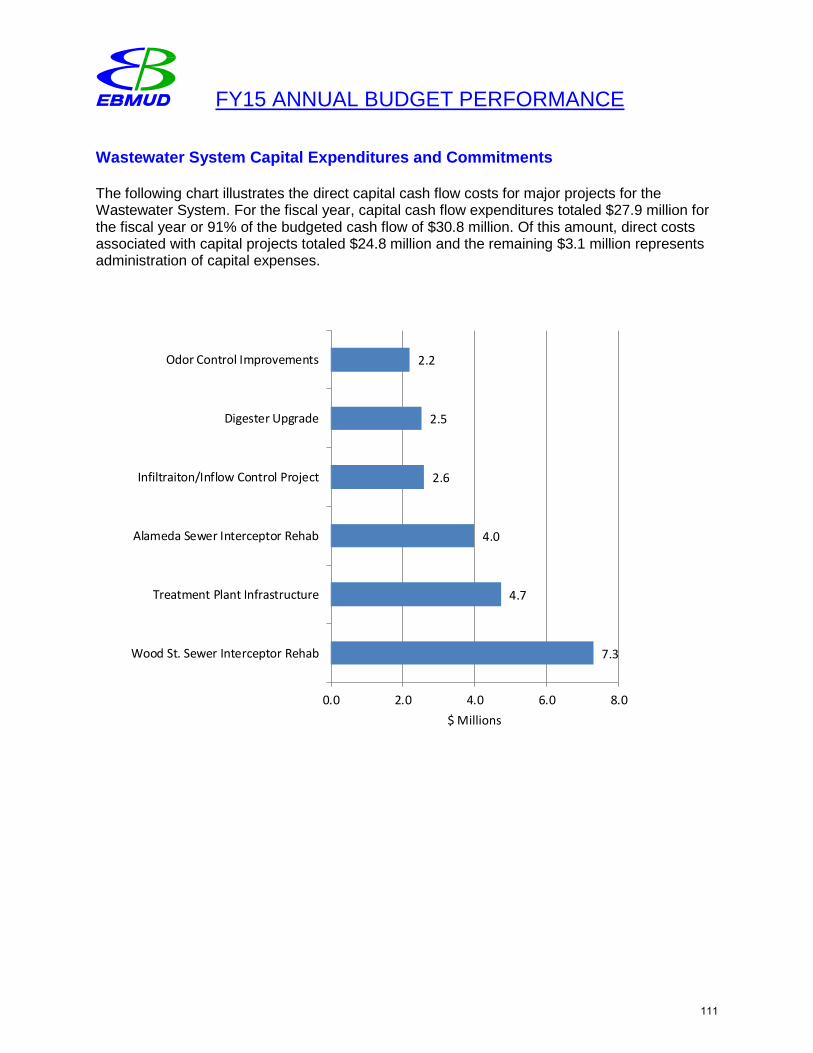
FY15 ANNUAL BUDGET PERFORMANCE
Wastewater System Capital Expenditures and Commitments
The following chart illustrates the direct capital cash flow costs for major projects for the Wastewater System. For the fiscal year, capital cash flow expenditures totaled $27.9 million for the fiscal year or 91% of the budgeted cash flow of $30.8 million. Of this amount, direct costs associated with capital projects totaled $24.8 million and the remaining $3.1 million represents administration of capital expenses.
7.3
4.7
4.0
2.6
2.5
2.2
Wood St. Sewer Interceptor Rehab
Treatment Plant Infrastructure
Alameda Sewer Interceptor Rehab
Infiltraiton/Inflow Control Project
Digester Upgrade
Odor Control Improvements
0.0 2.0 4.0 6.0 8.0$ Millions
111
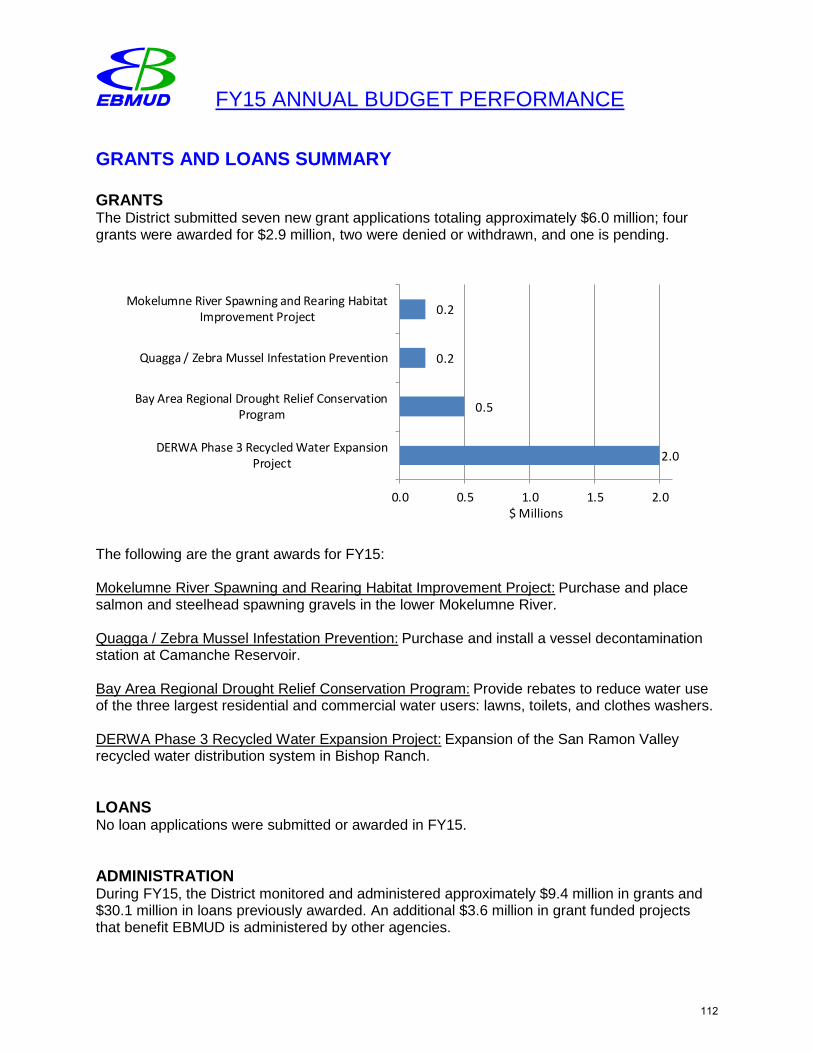
FY15 ANNUAL BUDGET PERFORMANCE
GRANTS AND LOANS SUMMARY
GRANTS The District submitted seven new grant applications totaling approximately $6.0 million; four grants were awarded for $2.9 million, two were denied or withdrawn, and one is pending.
2.0
0.5
0.2
0.2
0.0 0.5 1.0 1.5 2.0
DERWA Phase 3 Recycled Water ExpansionProject
Bay Area Regional Drought Relief ConservationProgram
Quagga / Zebra Mussel Infestation Prevention
Mokelumne River Spawning and Rearing HabitatImprovement Project
$ Millions
The following are the grant awards for FY15:
Mokelumne River Spawning and Rearing Habitat Improvement Project: Purchase and place salmon and steelhead spawning gravels in the lower Mokelumne River.
Quagga / Zebra Mussel Infestation Prevention: Purchase and install a vessel decontamination station at Camanche Reservoir.
Bay Area Regional Drought Relief Conservation Program: Provide rebates to reduce water use of the three largest residential and commercial water users: lawns, toilets, and clothes washers.
DERWA Phase 3 Recycled Water Expansion Project: Expansion of the San Ramon Valley recycled water distribution system in Bishop Ranch.
LOANS No loan applications were submitted or awarded in FY15.
ADMINISTRATION During FY15, the District monitored and administered approximately $9.4 million in grants and $30.1 million in loans previously awarded. An additional $3.6 million in grant funded projects that benefit EBMUD is administered by other agencies.
112
Financial Review of Fiscal Year 2015
Financial Indicators
113
FY15 FINANCIAL INDICATORS This section provides a trend analysis for Water and Wastewater Systems from FY06 to FY15. Water System Overview
• Financial Goals continued to meet or exceed targeted goals of Policy 4.02, Cash Reserves and Debt Management. To improve financial flexibility, $10 million was deposited into the rate stabilization fund.
• Financial Position remained sound with increases in assets and capital
contributions, while liabilities increased due to the implementation of GASB 68.
• Operating Indicators remained strong with a stable customer base, solid collection controls and reasonable rates.
• Retirement System continued to improve its funding percentage and its position
relative to other agencies.
Wastewater System Overview
• Financial Goals continued to meet or exceed targeted goals of Policy 4.02, Cash Reserves and Debt Management. To improve financial flexibility, $6.5 million was deposited into the rate stabilization fund.
• Financial Position remained sound with liabilities increased due to the
implementation of GASB 68.
• Operating Indicators remained strong with a stable customer base, solid collection controls and higher than median rates.
Please refer to the specific within this report for more details.
114
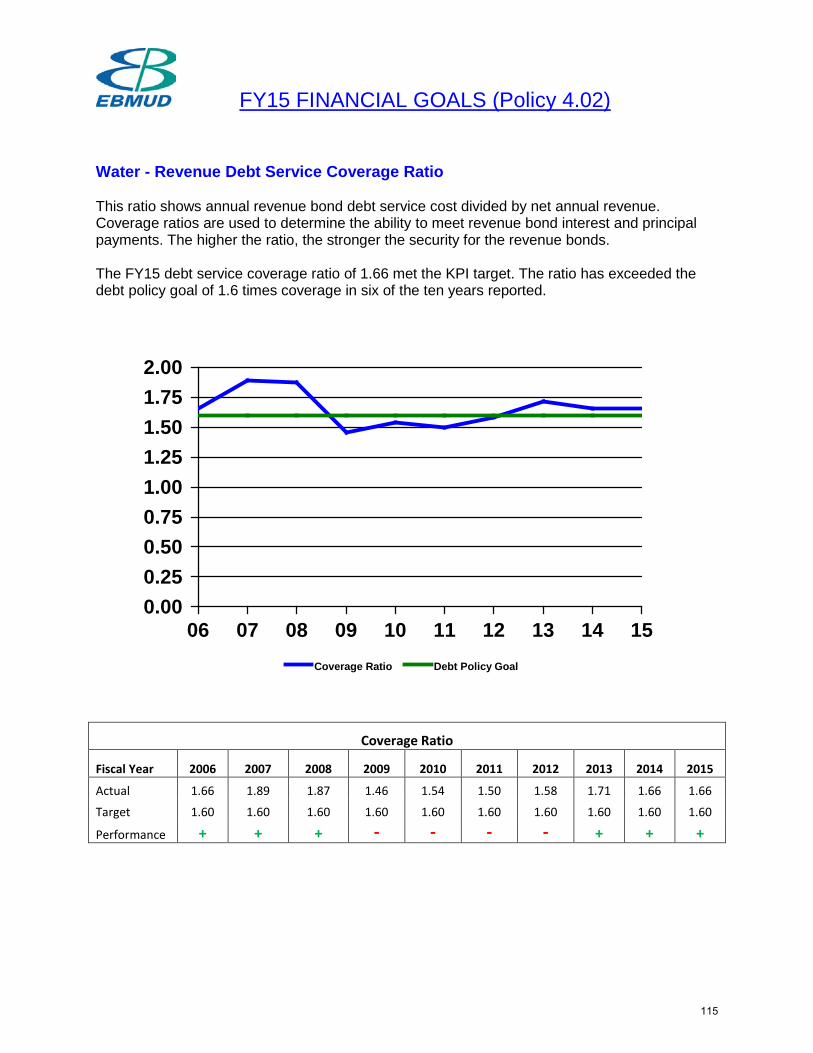
FY15 FINANCIAL GOALS (Policy 4.02) Water - Revenue Debt Service Coverage Ratio This ratio shows annual revenue bond debt service cost divided by net annual revenue. Coverage ratios are used to determine the ability to meet revenue bond interest and principal payments. The higher the ratio, the stronger the security for the revenue bonds. The FY15 debt service coverage ratio of 1.66 met the KPI target. The ratio has exceeded the debt policy goal of 1.6 times coverage in six of the ten years reported.
0.000.250.500.751.001.251.501.752.00
06 07 08 09 10 11 12 13 14 15Coverage Ratio Debt Policy Goal
Coverage Ratio
Fiscal Year 2006 2007 2008 2009 2010 2011 2012 2013 2014 2015
Actual 1.66 1.89 1.87 1.46 1.54 1.50 1.58 1.71 1.66 1.66
Target 1.60 1.60 1.60 1.60 1.60 1.60 1.60 1.60 1.60 1.60
Performance + + + - - - - + + +
115
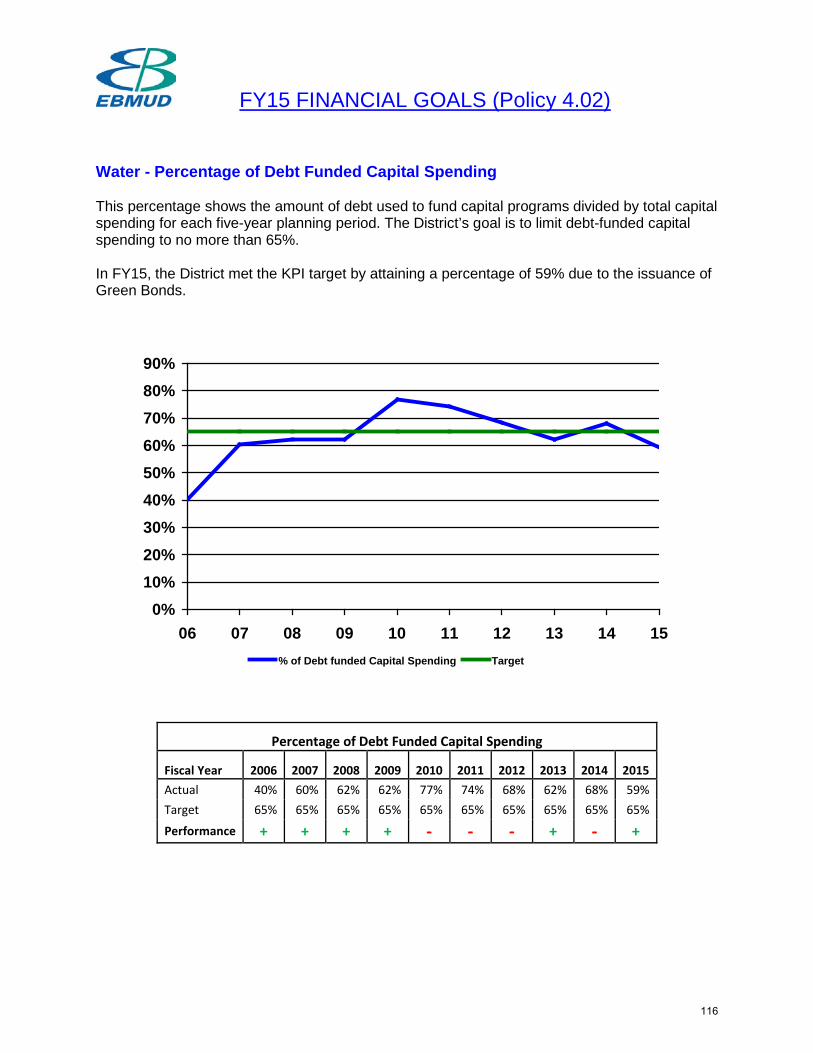
FY15 FINANCIAL GOALS (Policy 4.02) Water - Percentage of Debt Funded Capital Spending This percentage shows the amount of debt used to fund capital programs divided by total capital spending for each five-year planning period. The District’s goal is to limit debt-funded capital spending to no more than 65%. In FY15, the District met the KPI target by attaining a percentage of 59% due to the issuance of Green Bonds.
0%10%20%30%40%50%60%70%80%90%
06 07 08 09 10 11 12 13 14 15% of Debt funded Capital Spending Target
Percentage of Debt Funded Capital Spending
Fiscal Year 2006 2007 2008 2009 2010 2011 2012 2013 2014 2015 Actual 40% 60% 62% 62% 77% 74% 68% 62% 68% 59% Target 65% 65% 65% 65% 65% 65% 65% 65% 65% 65%
Performance + + + + - - - + - +
116
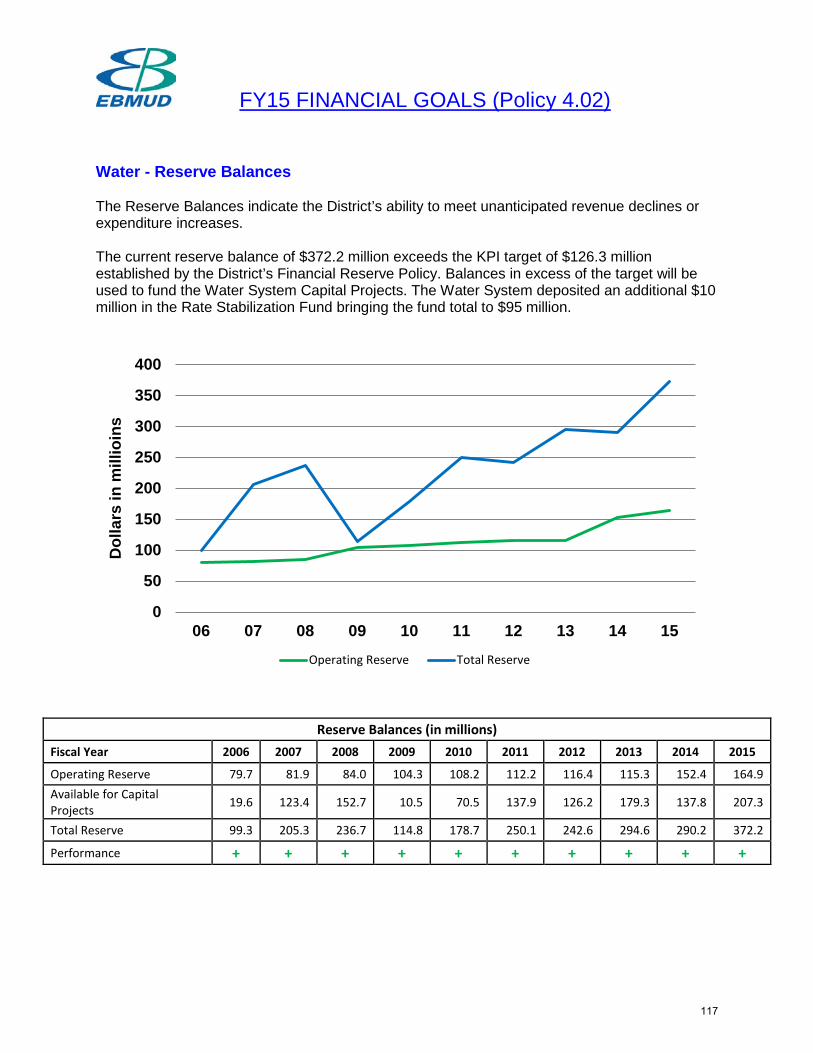
FY15 FINANCIAL GOALS (Policy 4.02) Water - Reserve Balances The Reserve Balances indicate the District’s ability to meet unanticipated revenue declines or expenditure increases. The current reserve balance of $372.2 million exceeds the KPI target of $126.3 million established by the District’s Financial Reserve Policy. Balances in excess of the target will be used to fund the Water System Capital Projects. The Water System deposited an additional $10 million in the Rate Stabilization Fund bringing the fund total to $95 million.
0
50
100
150
200
250
300
350
400
06 07 08 09 10 11 12 13 14 15
Dol
lars
in m
illio
ins
Operating Reserve Total Reserve
Reserve Balances (in millions) Fiscal Year 2006 2007 2008 2009 2010 2011 2012 2013 2014 2015
Operating Reserve 79.7 81.9 84.0 104.3 108.2 112.2 116.4 115.3 152.4 164.9 Available for Capital Projects 19.6 123.4 152.7 10.5 70.5 137.9 126.2 179.3 137.8 207.3
Total Reserve 99.3 205.3 236.7 114.8 178.7 250.1 242.6 294.6 290.2 372.2
Performance + + + + + + + + + +
117
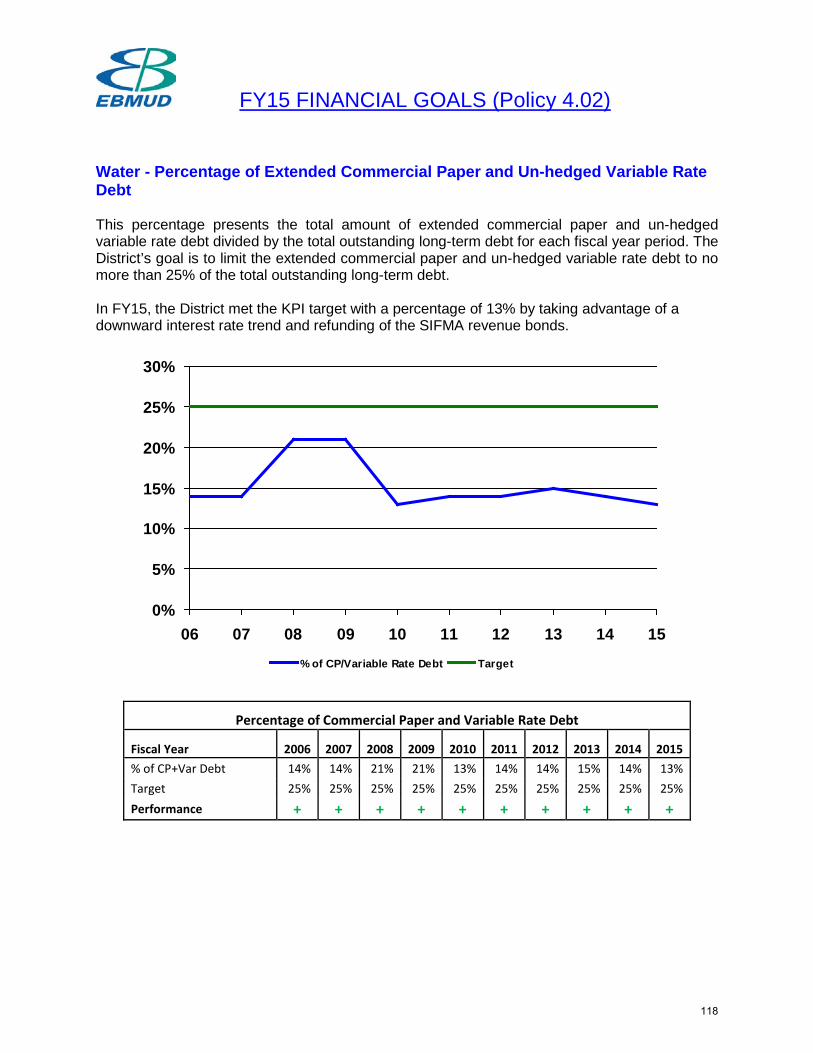
FY15 FINANCIAL GOALS (Policy 4.02) Water - Percentage of Extended Commercial Paper and Un-hedged Variable Rate Debt This percentage presents the total amount of extended commercial paper and un-hedged variable rate debt divided by the total outstanding long-term debt for each fiscal year period. The District’s goal is to limit the extended commercial paper and un-hedged variable rate debt to no more than 25% of the total outstanding long-term debt. In FY15, the District met the KPI target with a percentage of 13% by taking advantage of a downward interest rate trend and refunding of the SIFMA revenue bonds.
Percentage of Commercial Paper and Variable Rate Debt
Fiscal Year 2006 2007 2008 2009 2010 2011 2012 2013 2014 2015 % of CP+Var Debt 14% 14% 21% 21% 13% 14% 14% 15% 14% 13% Target 25% 25% 25% 25% 25% 25% 25% 25% 25% 25% Performance + + + + + + + + + +
0%
5%
10%
15%
20%
25%
30%
06 07 08 09 10 11 12 13 14 15
% of CP/Variable Rate Debt Target
118
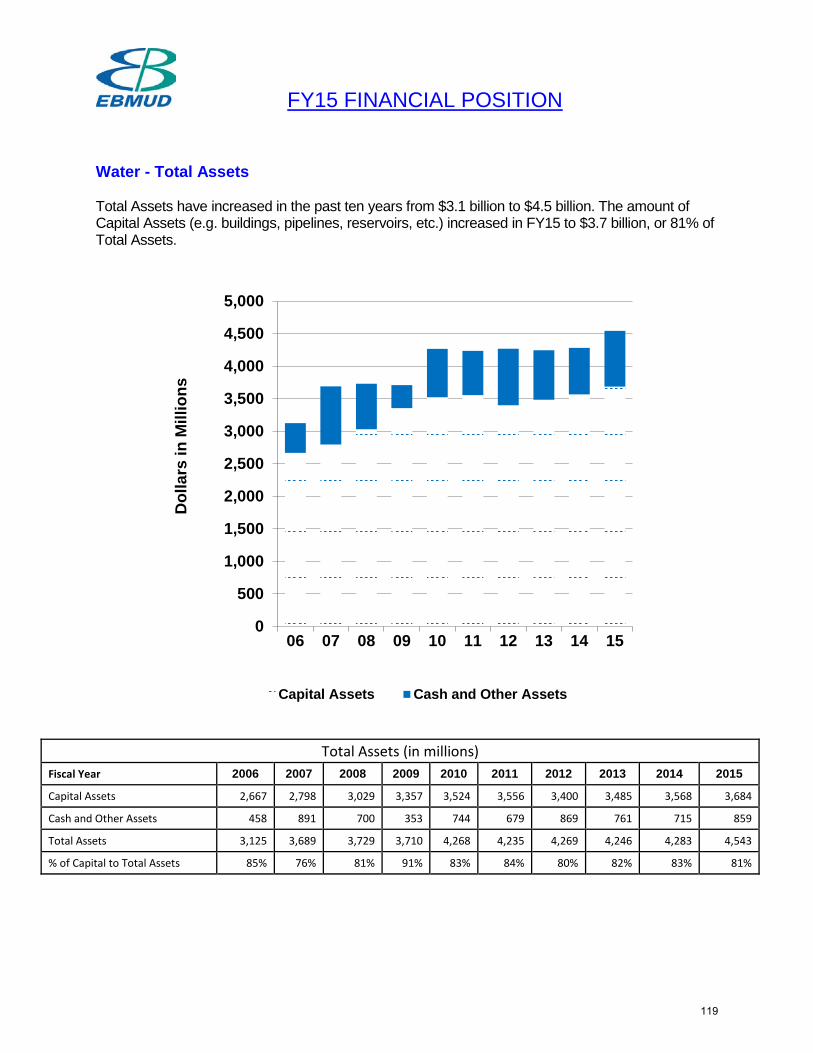
FY15 FINANCIAL POSITION Water - Total Assets Total Assets have increased in the past ten years from $3.1 billion to $4.5 billion. The amount of Capital Assets (e.g. buildings, pipelines, reservoirs, etc.) increased in FY15 to $3.7 billion, or 81% of Total Assets.
Total Assets (in millions) Fiscal Year 2006 2007 2008 2009 2010 2011 2012 2013 2014 2015
Capital Assets 2,667 2,798 3,029 3,357 3,524 3,556 3,400 3,485 3,568 3,684
Cash and Other Assets 458 891 700 353 744 679 869 761 715 859
Total Assets 3,125 3,689 3,729 3,710 4,268 4,235 4,269 4,246 4,283 4,543
% of Capital to Total Assets 85% 76% 81% 91% 83% 84% 80% 82% 83% 81%
0
500
1,000
1,500
2,000
2,500
3,000
3,500
4,000
4,500
5,000
06 07 08 09 10 11 12 13 14 15
Dol
lars
in M
illio
ns
Capital Assets Cash and Other Assets
119
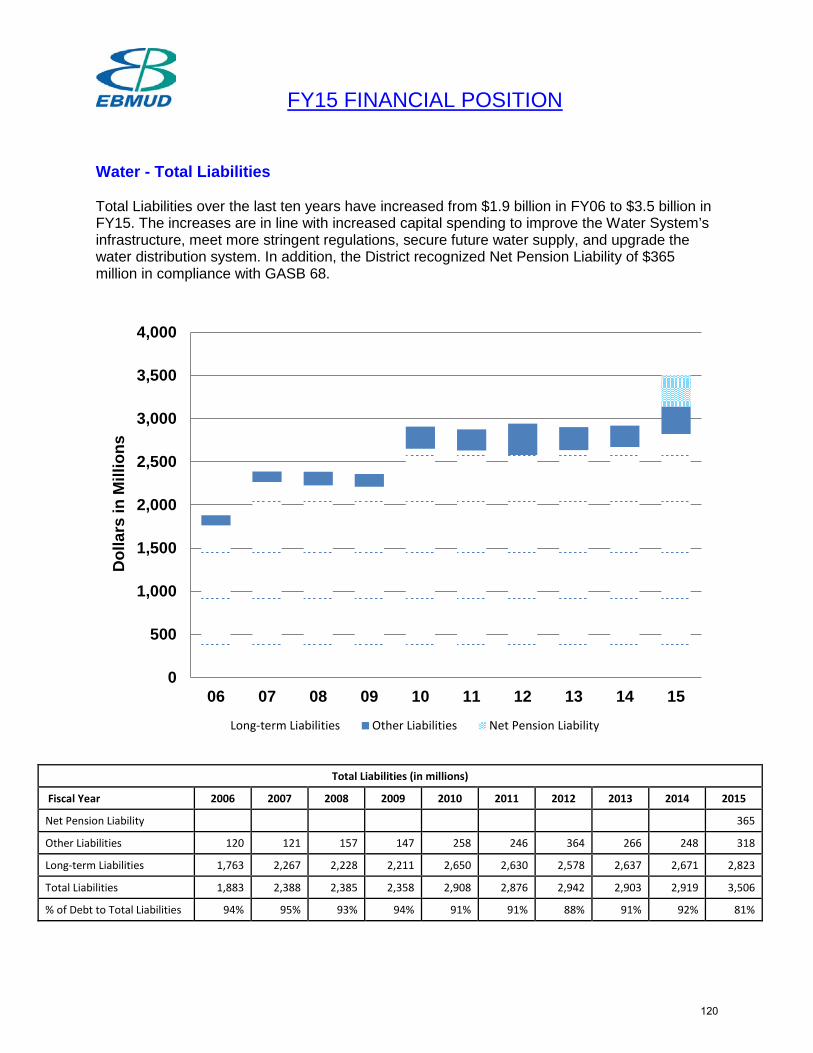
FY15 FINANCIAL POSITION Water - Total Liabilities Total Liabilities over the last ten years have increased from $1.9 billion in FY06 to $3.5 billion in FY15. The increases are in line with increased capital spending to improve the Water System’s infrastructure, meet more stringent regulations, secure future water supply, and upgrade the water distribution system. In addition, the District recognized Net Pension Liability of $365 million in compliance with GASB 68.
Total Liabilities (in millions)
Fiscal Year 2006 2007 2008 2009 2010 2011 2012 2013 2014 2015
Net Pension Liability 365
Other Liabilities 120 121 157 147 258 246 364 266 248 318
Long-term Liabilities 1,763 2,267 2,228 2,211 2,650 2,630 2,578 2,637 2,671 2,823
Total Liabilities 1,883 2,388 2,385 2,358 2,908 2,876 2,942 2,903 2,919 3,506
% of Debt to Total Liabilities 94% 95% 93% 94% 91% 91% 88% 91% 92% 81%
0
500
1,000
1,500
2,000
2,500
3,000
3,500
4,000
06 07 08 09 10 11 12 13 14 15
Dol
lars
in M
illio
ns
Long-term Liabilities Other Liabilities Net Pension Liability
120
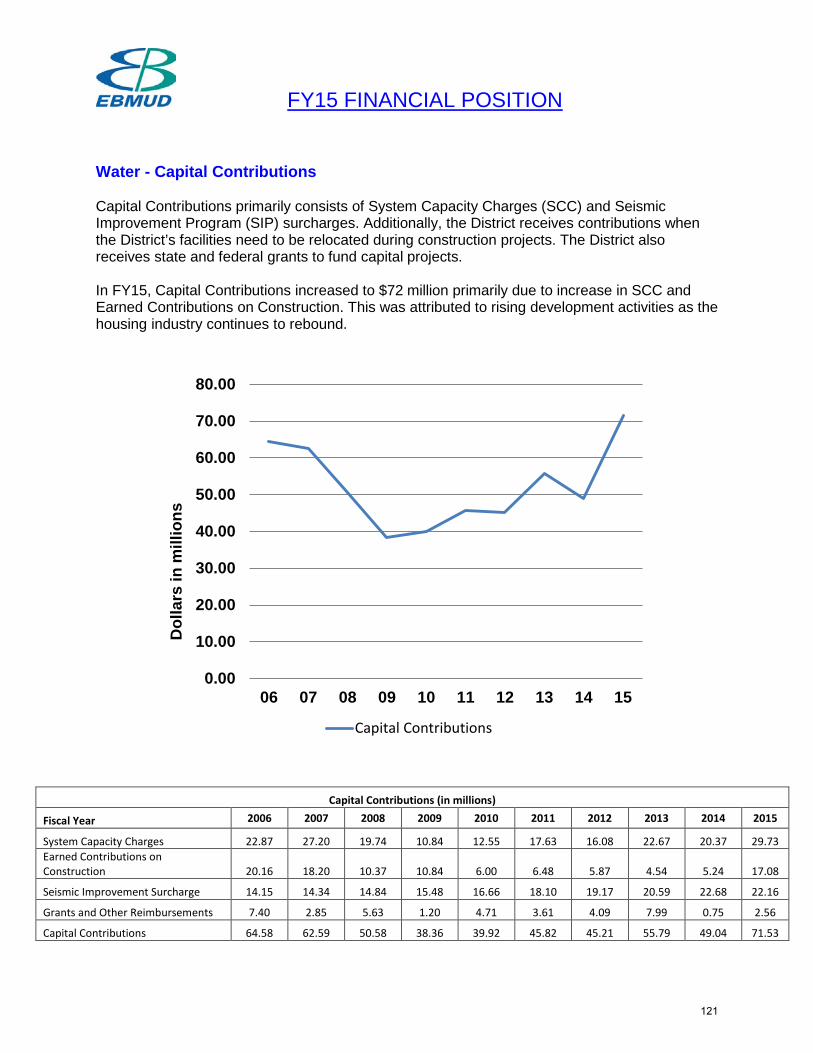
FY15 FINANCIAL POSITION Water - Capital Contributions Capital Contributions primarily consists of System Capacity Charges (SCC) and Seismic Improvement Program (SIP) surcharges. Additionally, the District receives contributions when the District’s facilities need to be relocated during construction projects. The District also receives state and federal grants to fund capital projects. In FY15, Capital Contributions increased to $72 million primarily due to increase in SCC and Earned Contributions on Construction. This was attributed to rising development activities as the housing industry continues to rebound.
Capital Contributions (in millions)
Fiscal Year 2006 2007 2008 2009 2010 2011 2012 2013 2014 2015
System Capacity Charges 22.87 27.20 19.74 10.84 12.55 17.63 16.08 22.67 20.37 29.73 Earned Contributions on Construction 20.16 18.20 10.37 10.84 6.00 6.48 5.87 4.54 5.24 17.08
Seismic Improvement Surcharge 14.15 14.34 14.84 15.48 16.66 18.10 19.17 20.59 22.68 22.16
Grants and Other Reimbursements 7.40 2.85 5.63 1.20 4.71 3.61 4.09 7.99 0.75 2.56
Capital Contributions 64.58 62.59 50.58 38.36 39.92 45.82 45.21 55.79 49.04 71.53
0.00
10.00
20.00
30.00
40.00
50.00
60.00
70.00
80.00
06 07 08 09 10 11 12 13 14 15
Dol
lars
in m
illio
ns
Capital Contributions
121
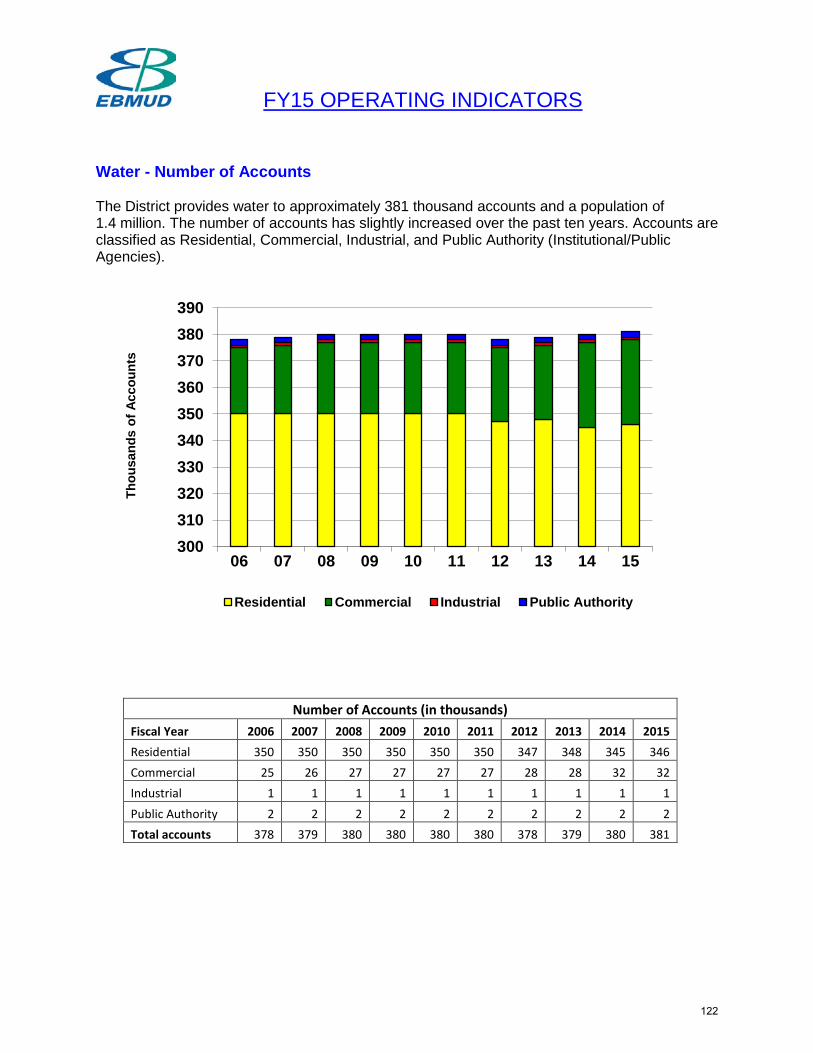
FY15 OPERATING INDICATORS Water - Number of Accounts The District provides water to approximately 381 thousand accounts and a population of 1.4 million. The number of accounts has slightly increased over the past ten years. Accounts are classified as Residential, Commercial, Industrial, and Public Authority (Institutional/Public Agencies).
Number of Accounts (in thousands) Fiscal Year 2006 2007 2008 2009 2010 2011 2012 2013 2014 2015 Residential 350 350 350 350 350 350 347 348 345 346 Commercial 25 26 27 27 27 27 28 28 32 32 Industrial 1 1 1 1 1 1 1 1 1 1 Public Authority 2 2 2 2 2 2 2 2 2 2 Total accounts 378 379 380 380 380 380 378 379 380 381
300310320330340350360370380390
06 07 08 09 10 11 12 13 14 15
Thou
sand
s of
Acc
ount
s
Residential Commercial Industrial Public Authority
122
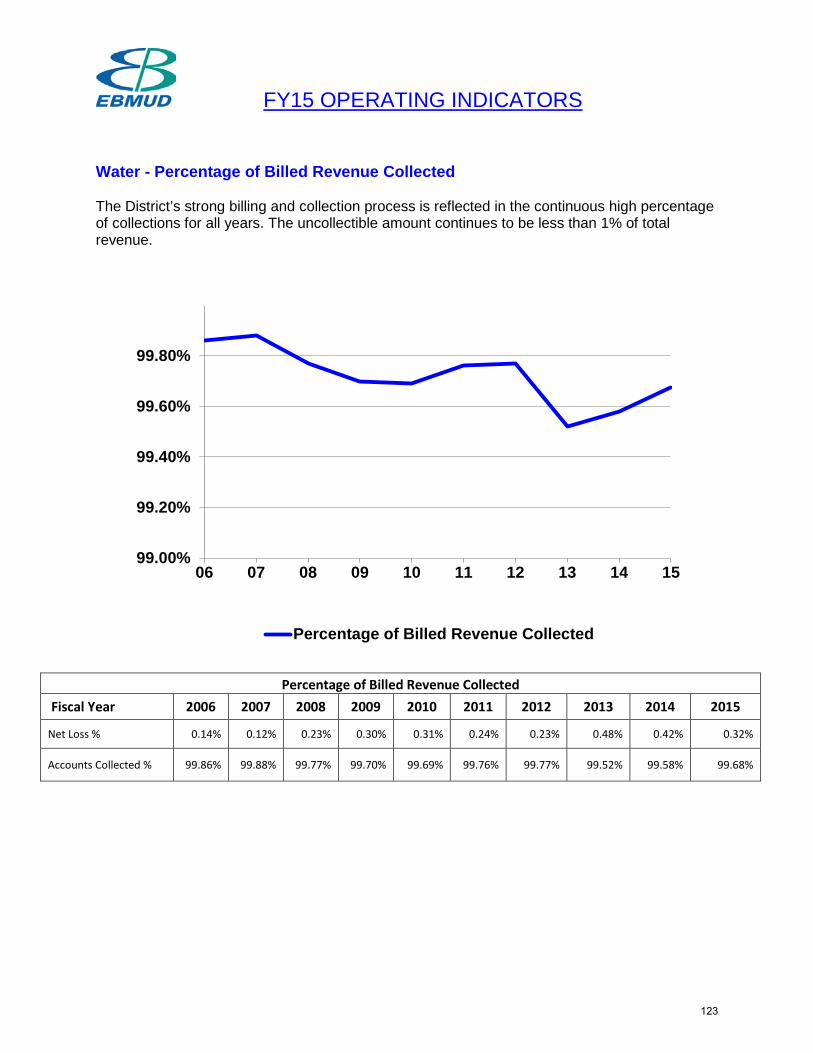
FY15 OPERATING INDICATORS Water - Percentage of Billed Revenue Collected The District’s strong billing and collection process is reflected in the continuous high percentage of collections for all years. The uncollectible amount continues to be less than 1% of total revenue.
Percentage of Billed Revenue Collected Fiscal Year 2006 2007 2008 2009 2010 2011 2012 2013 2014 2015
Net Loss % 0.14% 0.12% 0.23% 0.30% 0.31% 0.24% 0.23% 0.48% 0.42% 0.32%
Accounts Collected % 99.86% 99.88% 99.77% 99.70% 99.69% 99.76% 99.77% 99.52% 99.58% 99.68%
99.00%
99.20%
99.40%
99.60%
99.80%
06 07 08 09 10 11 12 13 14 15
Percentage of Billed Revenue Collected
123
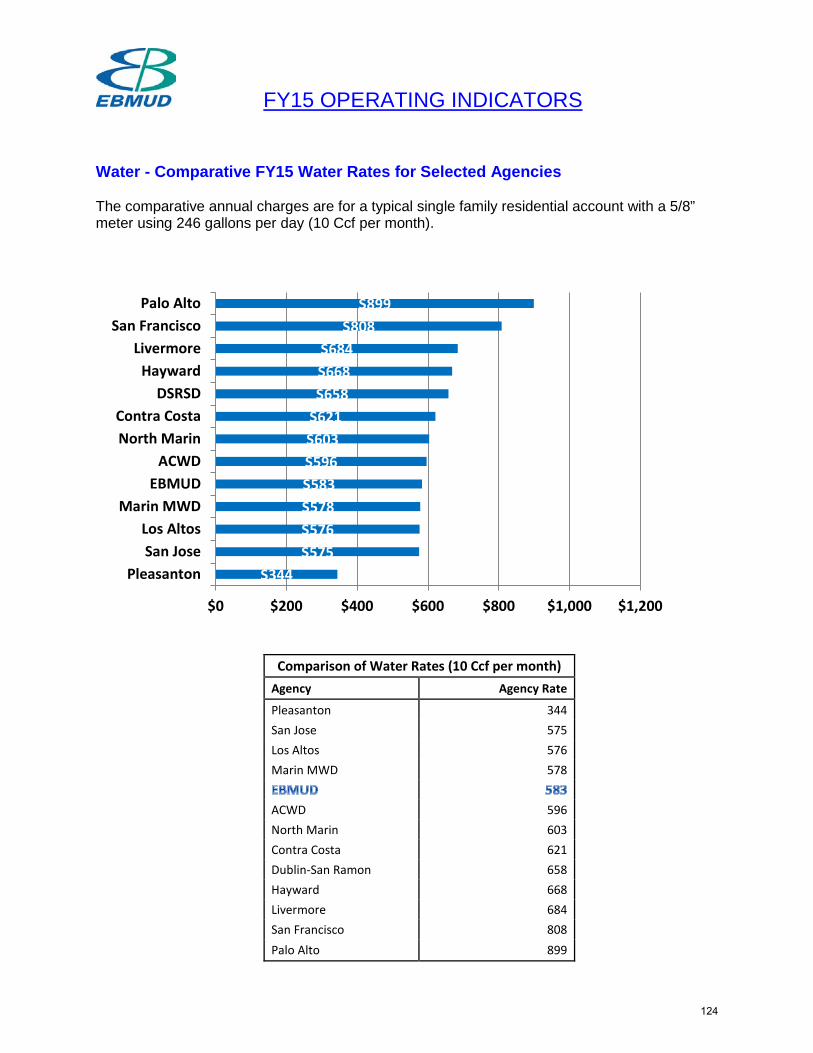
FY15 OPERATING INDICATORS Water - Comparative FY15 Water Rates for Selected Agencies The comparative annual charges are for a typical single family residential account with a 5/8” meter using 246 gallons per day (10 Ccf per month).
Comparison of Water Rates (10 Ccf per month) Agency Agency Rate
Pleasanton 344 San Jose 575 Los Altos 576 Marin MWD 578
ACWD 596 North Marin 603 Contra Costa 621 Dublin-San Ramon 658 Hayward 668 Livermore 684 San Francisco 808 Palo Alto 899
$344 $575 $576 $578 $583 $596 $603 $621 $658 $668 $684
$808 $899
$0 $200 $400 $600 $800 $1,000 $1,200
PleasantonSan JoseLos Altos
Marin MWDEBMUD
ACWDNorth MarinContra Costa
DSRSDHayward
LivermoreSan Francisco
Palo Alto
124
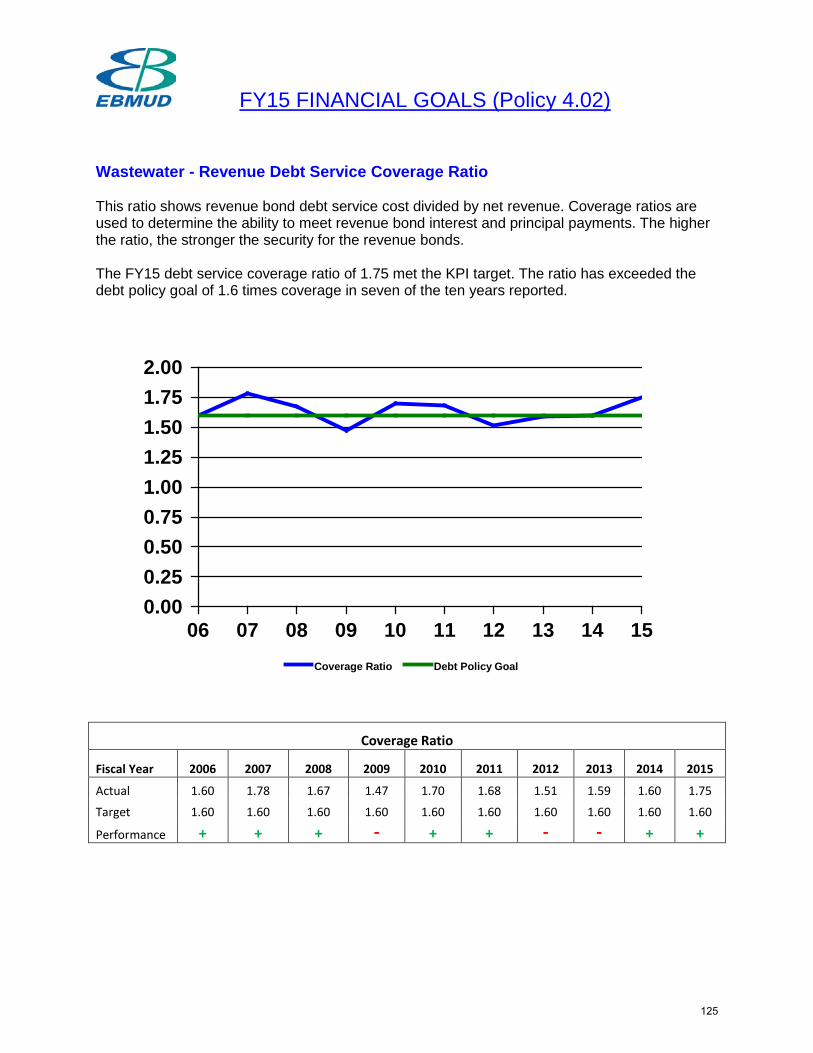
FY15 FINANCIAL GOALS (Policy 4.02) Wastewater - Revenue Debt Service Coverage Ratio This ratio shows revenue bond debt service cost divided by net revenue. Coverage ratios are used to determine the ability to meet revenue bond interest and principal payments. The higher the ratio, the stronger the security for the revenue bonds. The FY15 debt service coverage ratio of 1.75 met the KPI target. The ratio has exceeded the debt policy goal of 1.6 times coverage in seven of the ten years reported.
0.000.250.500.751.001.251.501.752.00
06 07 08 09 10 11 12 13 14 15Coverage Ratio Debt Policy Goal
Coverage Ratio
Fiscal Year 2006 2007 2008 2009 2010 2011 2012 2013 2014 2015
Actual 1.60 1.78 1.67 1.47 1.70 1.68 1.51 1.59 1.60 1.75
Target 1.60 1.60 1.60 1.60 1.60 1.60 1.60 1.60 1.60 1.60
Performance + + + - + + - - + +
125
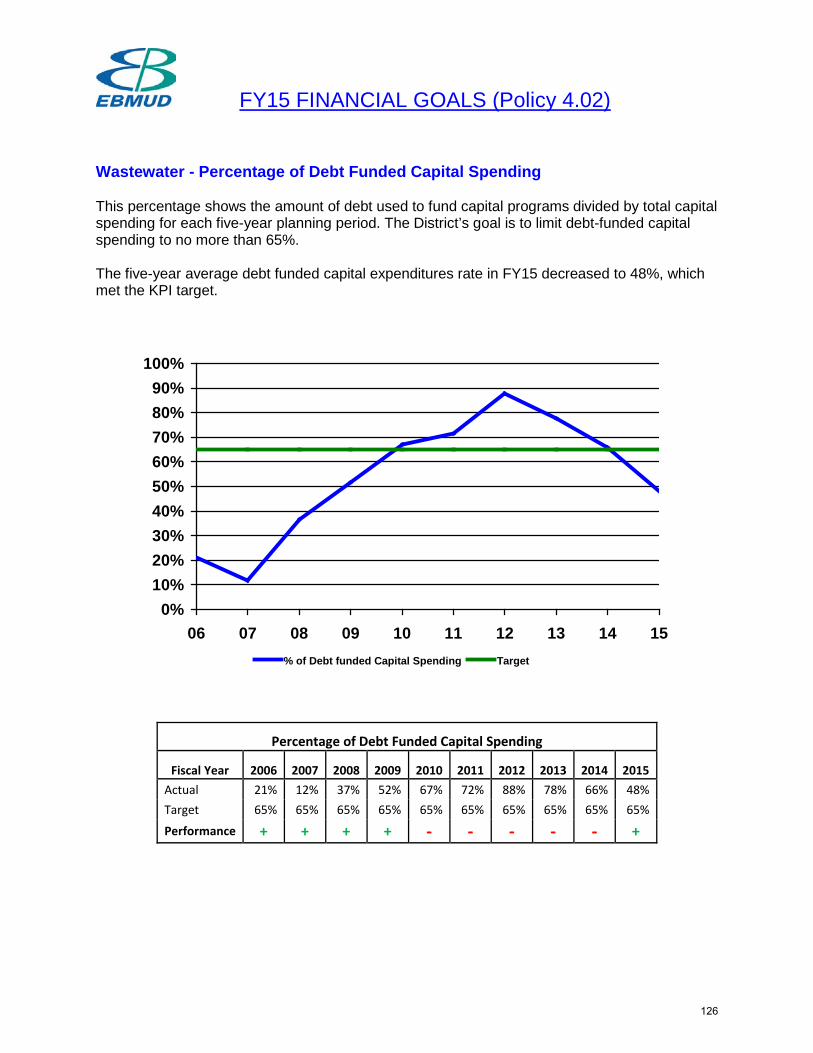
FY15 FINANCIAL GOALS (Policy 4.02) Wastewater - Percentage of Debt Funded Capital Spending This percentage shows the amount of debt used to fund capital programs divided by total capital spending for each five-year planning period. The District’s goal is to limit debt-funded capital spending to no more than 65%. The five-year average debt funded capital expenditures rate in FY15 decreased to 48%, which met the KPI target.
0%10%20%30%40%50%60%70%80%90%
100%
06 07 08 09 10 11 12 13 14 15% of Debt funded Capital Spending Target
Percentage of Debt Funded Capital Spending
Fiscal Year 2006 2007 2008 2009 2010 2011 2012 2013 2014 2015 Actual 21% 12% 37% 52% 67% 72% 88% 78% 66% 48% Target 65% 65% 65% 65% 65% 65% 65% 65% 65% 65%
Performance + + + + - - - - - +
126
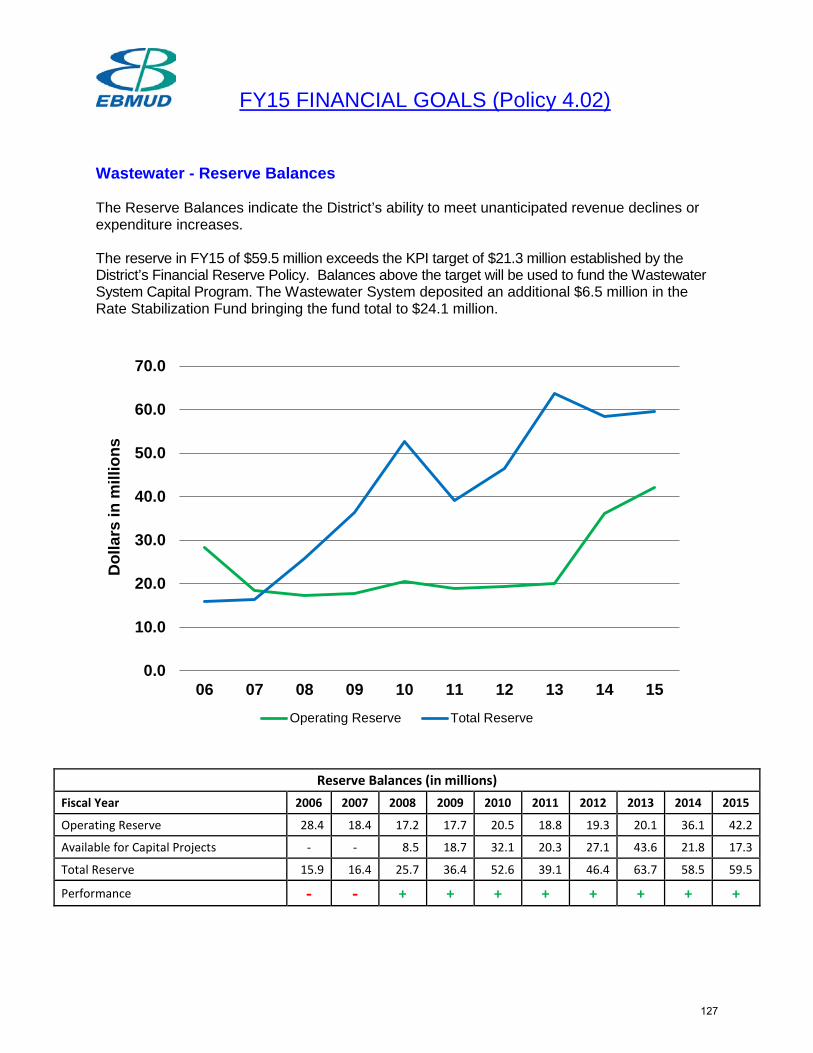
FY15 FINANCIAL GOALS (Policy 4.02) Wastewater - Reserve Balances The Reserve Balances indicate the District’s ability to meet unanticipated revenue declines or expenditure increases. The reserve in FY15 of $59.5 million exceeds the KPI target of $21.3 million established by the District’s Financial Reserve Policy. Balances above the target will be used to fund the Wastewater System Capital Program. The Wastewater System deposited an additional $6.5 million in the Rate Stabilization Fund bringing the fund total to $24.1 million.
0.0
10.0
20.0
30.0
40.0
50.0
60.0
70.0
06 07 08 09 10 11 12 13 14 15
Dol
lars
in m
illio
ns
Operating Reserve Total Reserve
Reserve Balances (in millions) Fiscal Year 2006 2007 2008 2009 2010 2011 2012 2013 2014 2015
Operating Reserve 28.4 18.4 17.2 17.7 20.5 18.8 19.3 20.1 36.1 42.2
Available for Capital Projects - - 8.5 18.7 32.1 20.3 27.1 43.6 21.8 17.3
Total Reserve 15.9 16.4 25.7 36.4 52.6 39.1 46.4 63.7 58.5 59.5
Performance - - + + + + + + + +
127
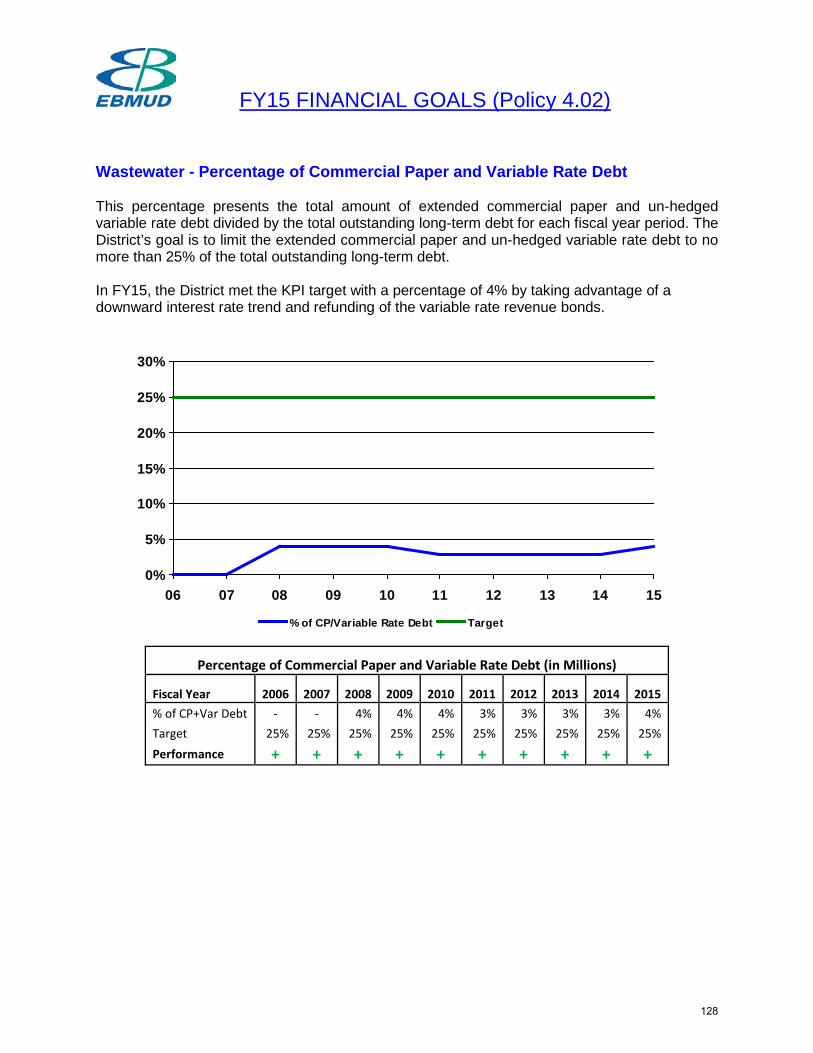
FY15 FINANCIAL GOALS (Policy 4.02) Wastewater - Percentage of Commercial Paper and Variable Rate Debt This percentage presents the total amount of extended commercial paper and un-hedged variable rate debt divided by the total outstanding long-term debt for each fiscal year period. The District’s goal is to limit the extended commercial paper and un-hedged variable rate debt to no more than 25% of the total outstanding long-term debt. In FY15, the District met the KPI target with a percentage of 4% by taking advantage of a downward interest rate trend and refunding of the variable rate revenue bonds.
Percentage of Commercial Paper and Variable Rate Debt (in Millions)
Fiscal Year 2006 2007 2008 2009 2010 2011 2012 2013 2014 2015 % of CP+Var Debt - - 4% 4% 4% 3% 3% 3% 3% 4% Target 25% 25% 25% 25% 25% 25% 25% 25% 25% 25% Performance + + + + + + + + + +
0%
5%
10%
15%
20%
25%
30%
06 07 08 09 10 11 12 13 14 15
% of CP/Variable Rate Debt Target
128
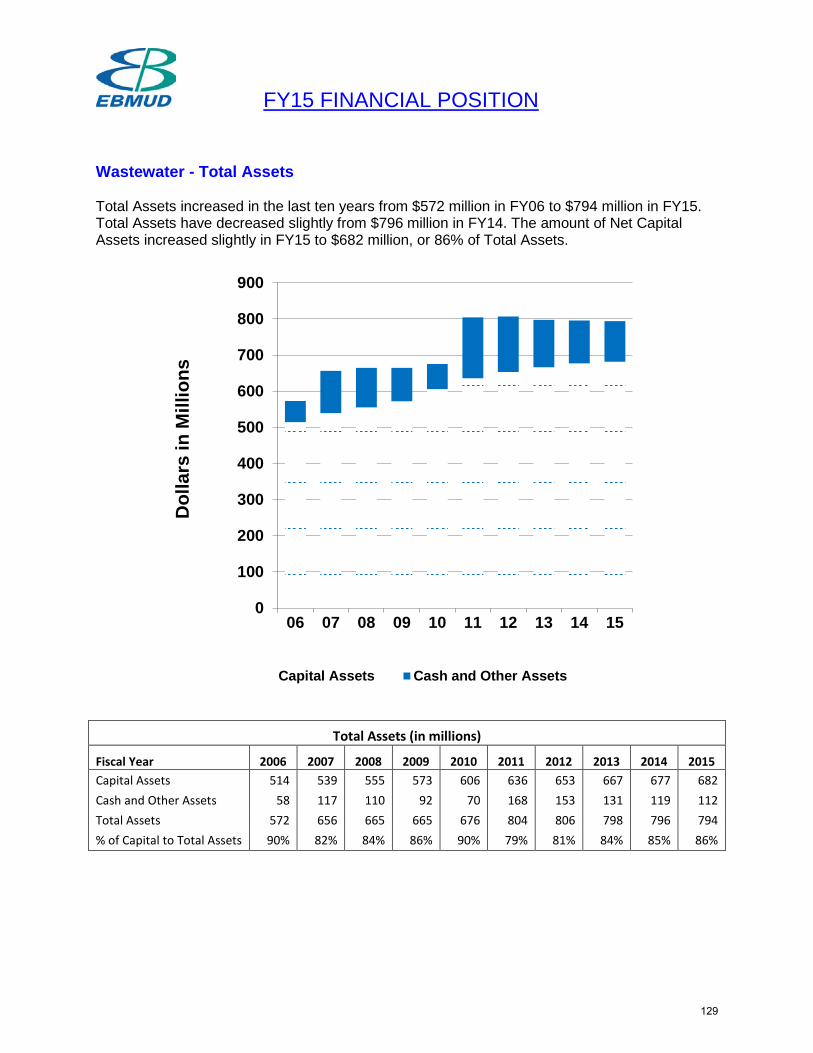
FY15 FINANCIAL POSITION Wastewater - Total Assets Total Assets increased in the last ten years from $572 million in FY06 to $794 million in FY15. Total Assets have decreased slightly from $796 million in FY14. The amount of Net Capital Assets increased slightly in FY15 to $682 million, or 86% of Total Assets.
Total Assets (in millions)
Fiscal Year 2006 2007 2008 2009 2010 2011 2012 2013 2014 2015 Capital Assets 514 539 555 573 606 636 653 667 677 682 Cash and Other Assets 58 117 110 92 70 168 153 131 119 112 Total Assets 572 656 665 665 676 804 806 798 796 794 % of Capital to Total Assets 90% 82% 84% 86% 90% 79% 81% 84% 85% 86%
0
100
200
300
400
500
600
700
800
900
06 07 08 09 10 11 12 13 14 15
Dol
lars
in M
illio
ns
Capital Assets Cash and Other Assets
129
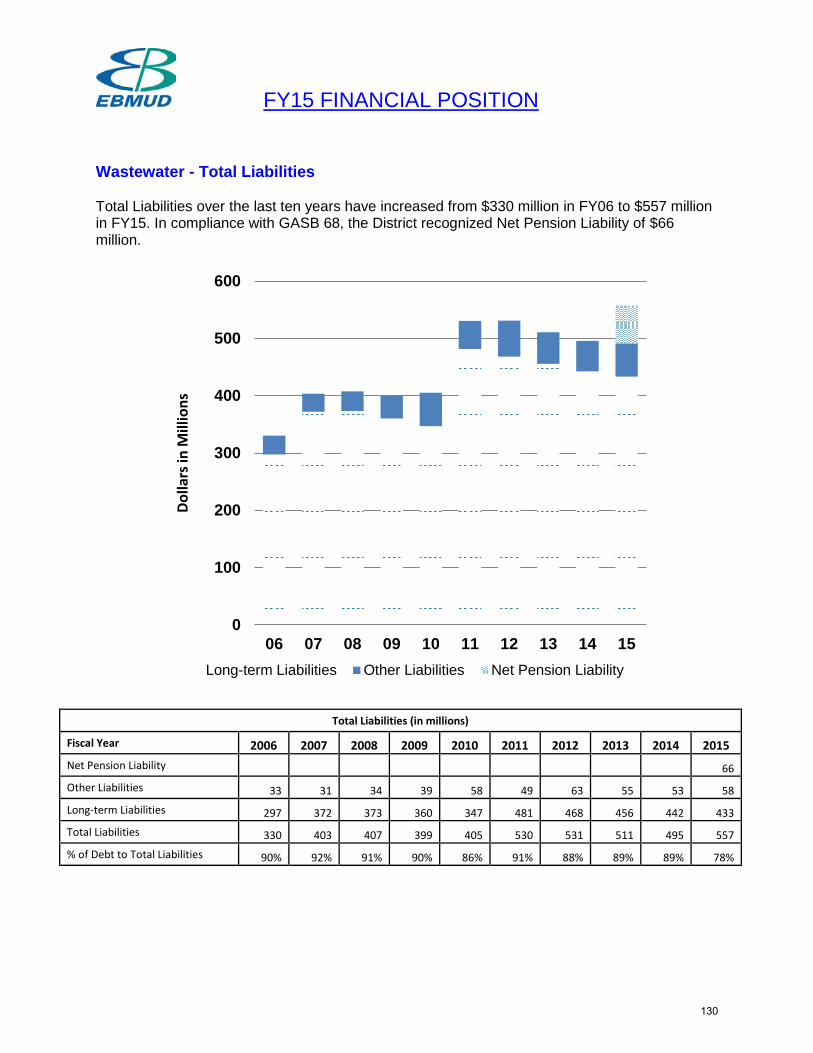
FY15 FINANCIAL POSITION Wastewater - Total Liabilities Total Liabilities over the last ten years have increased from $330 million in FY06 to $557 million in FY15. In compliance with GASB 68, the District recognized Net Pension Liability of $66 million.
Total Liabilities (in millions)
Fiscal Year 2006 2007 2008 2009 2010 2011 2012 2013 2014 2015 Net Pension Liability
66
Other Liabilities 33 31 34 39 58 49 63 55 53 58
Long-term Liabilities 297 372 373 360 347 481 468 456 442 433
Total Liabilities 330 403 407 399 405 530 531 511 495 557
% of Debt to Total Liabilities 90% 92% 91% 90% 86% 91% 88% 89% 89% 78%
0
100
200
300
400
500
600
06 07 08 09 10 11 12 13 14 15
Dolla
rs in
Mill
ions
Long-term Liabilities Other Liabilities Net Pension Liability
130
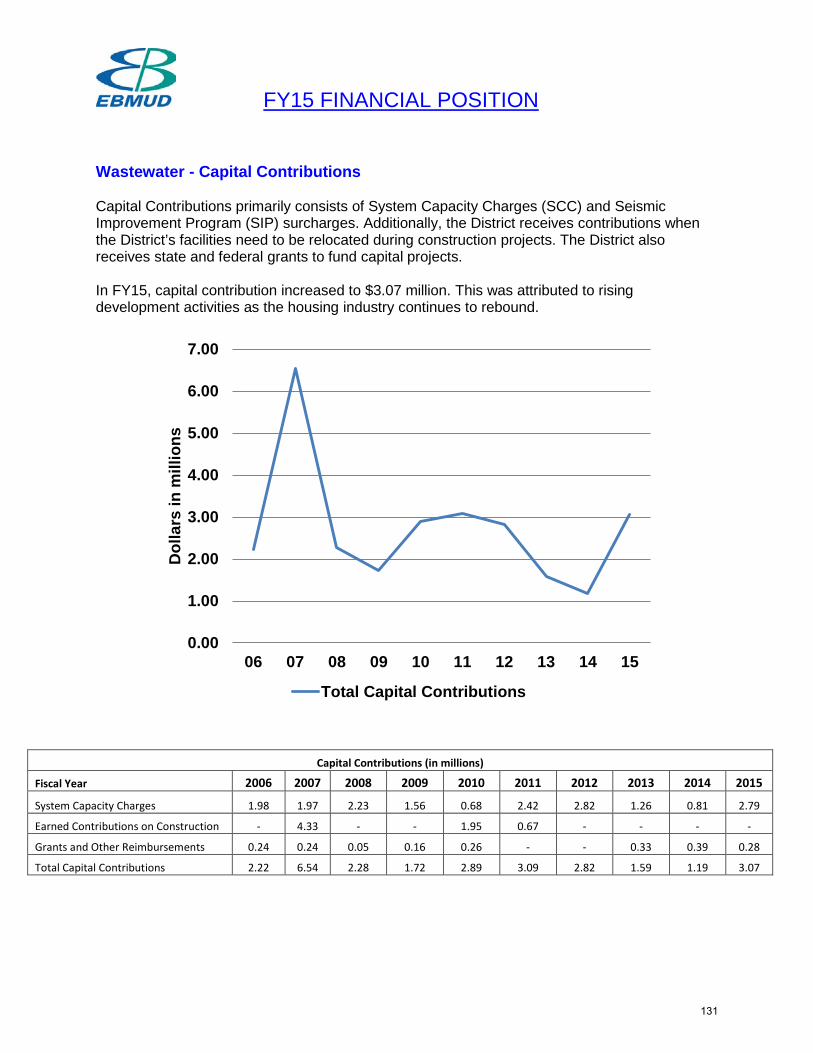
FY15 FINANCIAL POSITION Wastewater - Capital Contributions Capital Contributions primarily consists of System Capacity Charges (SCC) and Seismic Improvement Program (SIP) surcharges. Additionally, the District receives contributions when the District’s facilities need to be relocated during construction projects. The District also receives state and federal grants to fund capital projects. In FY15, capital contribution increased to $3.07 million. This was attributed to rising development activities as the housing industry continues to rebound.
Capital Contributions (in millions)
Fiscal Year 2006 2007 2008 2009 2010 2011 2012 2013 2014 2015
System Capacity Charges 1.98 1.97 2.23 1.56 0.68 2.42 2.82 1.26 0.81 2.79
Earned Contributions on Construction - 4.33 - - 1.95 0.67 - - - -
Grants and Other Reimbursements 0.24 0.24 0.05 0.16 0.26 - - 0.33 0.39 0.28
Total Capital Contributions 2.22 6.54 2.28 1.72 2.89 3.09 2.82 1.59 1.19 3.07
0.00
1.00
2.00
3.00
4.00
5.00
6.00
7.00
06 07 08 09 10 11 12 13 14 15
Dol
lars
in m
illio
ns
Total Capital Contributions
131
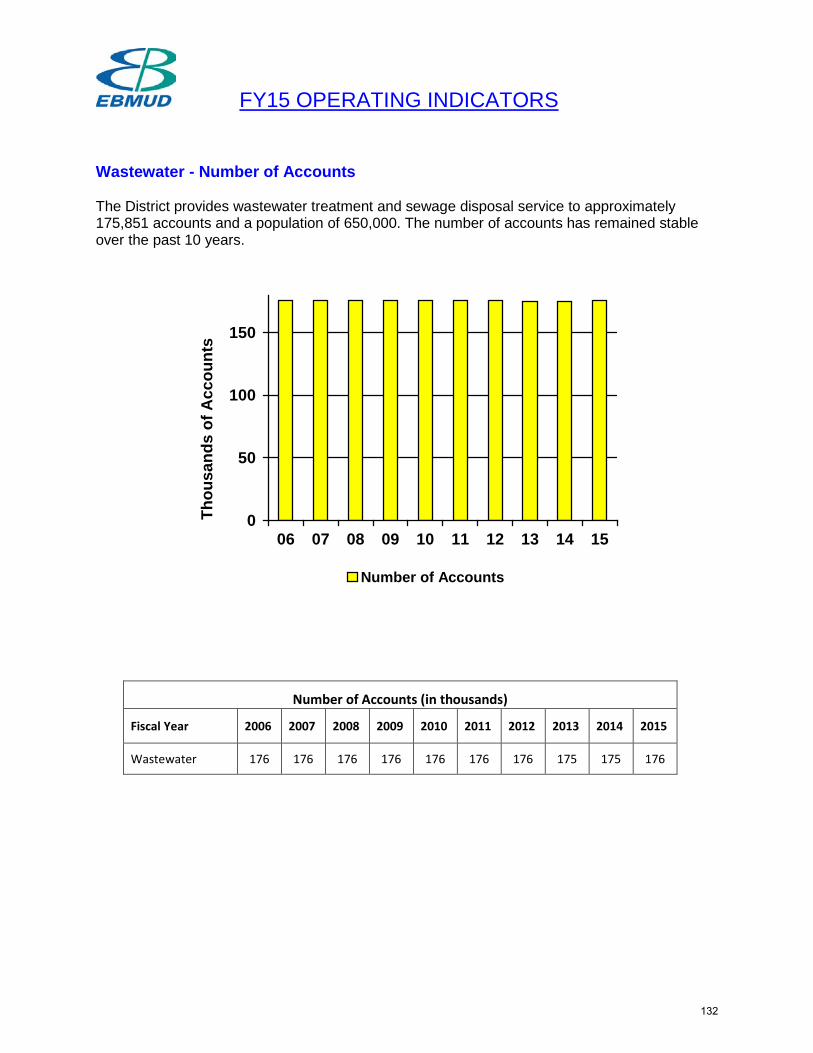
FY15 OPERATING INDICATORS Wastewater - Number of Accounts The District provides wastewater treatment and sewage disposal service to approximately 175,851 accounts and a population of 650,000. The number of accounts has remained stable over the past 10 years.
0
50
100
150
06 07 08 09 10 11 12 13 14 15
Thou
sand
s of
Acc
ount
s
Number of Accounts
Number of Accounts (in thousands)
Fiscal Year 2006 2007 2008 2009 2010 2011 2012 2013 2014 2015
Wastewater 176 176 176 176 176 176 176 175 175 176
132
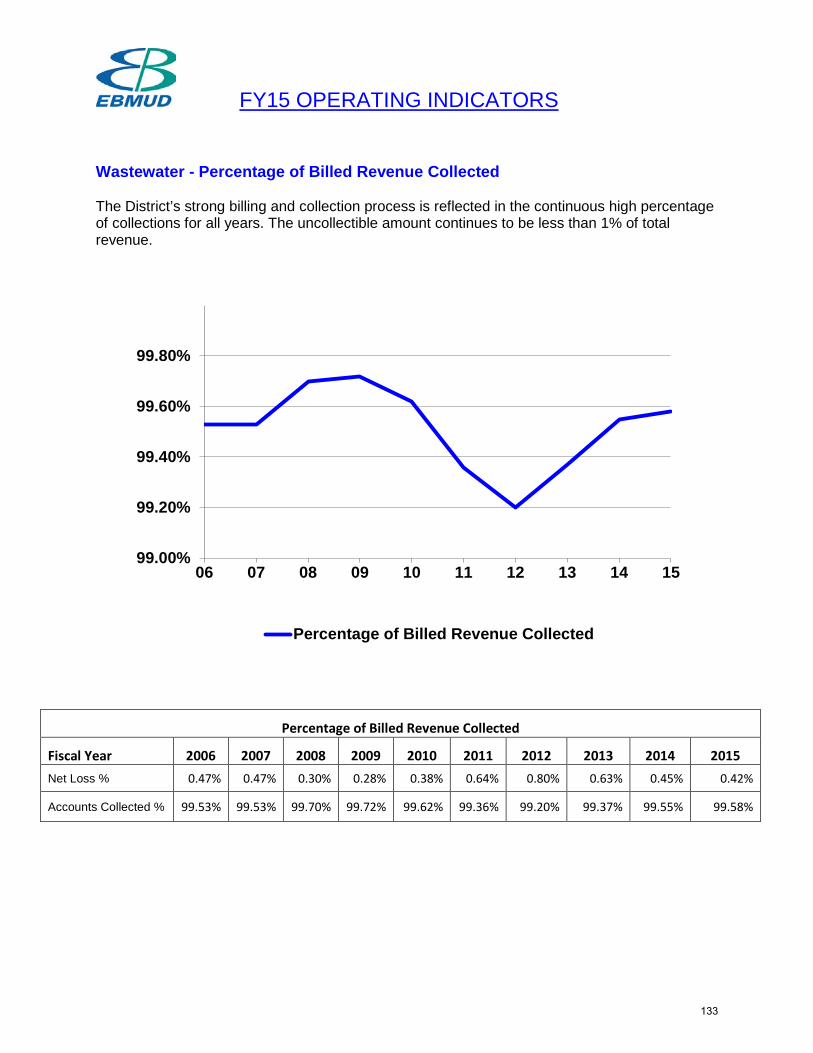
FY15 OPERATING INDICATORS Wastewater - Percentage of Billed Revenue Collected The District’s strong billing and collection process is reflected in the continuous high percentage of collections for all years. The uncollectible amount continues to be less than 1% of total revenue.
Percentage of Billed Revenue Collected
Fiscal Year 2006 2007 2008 2009 2010 2011 2012 2013 2014 2015 Net Loss % 0.47% 0.47% 0.30% 0.28% 0.38% 0.64% 0.80% 0.63% 0.45% 0.42%
Accounts Collected % 99.53% 99.53% 99.70% 99.72% 99.62% 99.36% 99.20% 99.37% 99.55% 99.58%
99.00%
99.20%
99.40%
99.60%
99.80%
06 07 08 09 10 11 12 13 14 15
Percentage of Billed Revenue Collected
133
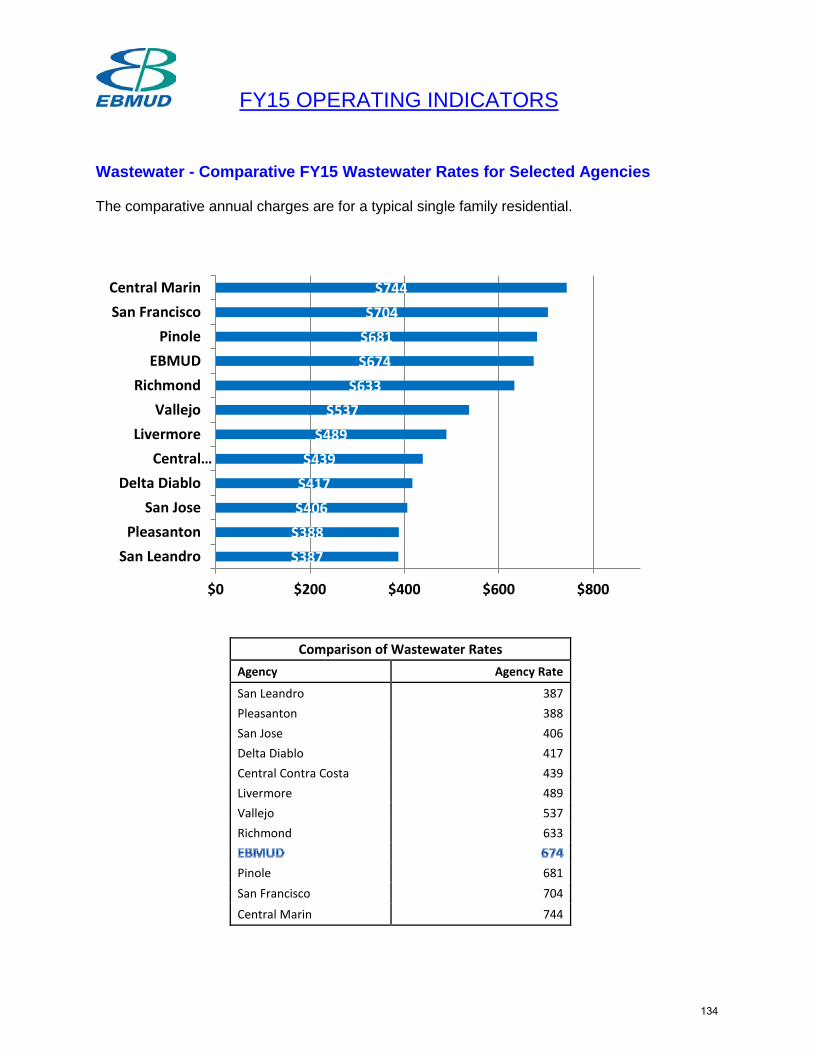
FY15 OPERATING INDICATORS Wastewater - Comparative FY15 Wastewater Rates for Selected Agencies The comparative annual charges are for a typical single family residential.
Comparison of Wastewater Rates Agency Agency Rate
San Leandro 387 Pleasanton 388 San Jose 406 Delta Diablo 417 Central Contra Costa 439 Livermore 489 Vallejo 537 Richmond 633
Pinole 681 San Francisco 704 Central Marin 744
$387 $388 $406 $417 $439
$489 $537
$633 $674 $681 $704
$744
$0 $200 $400 $600 $800
San LeandroPleasanton
San JoseDelta Diablo
Central…Livermore
VallejoRichmond
EBMUDPinole
San FranciscoCentral Marin
134
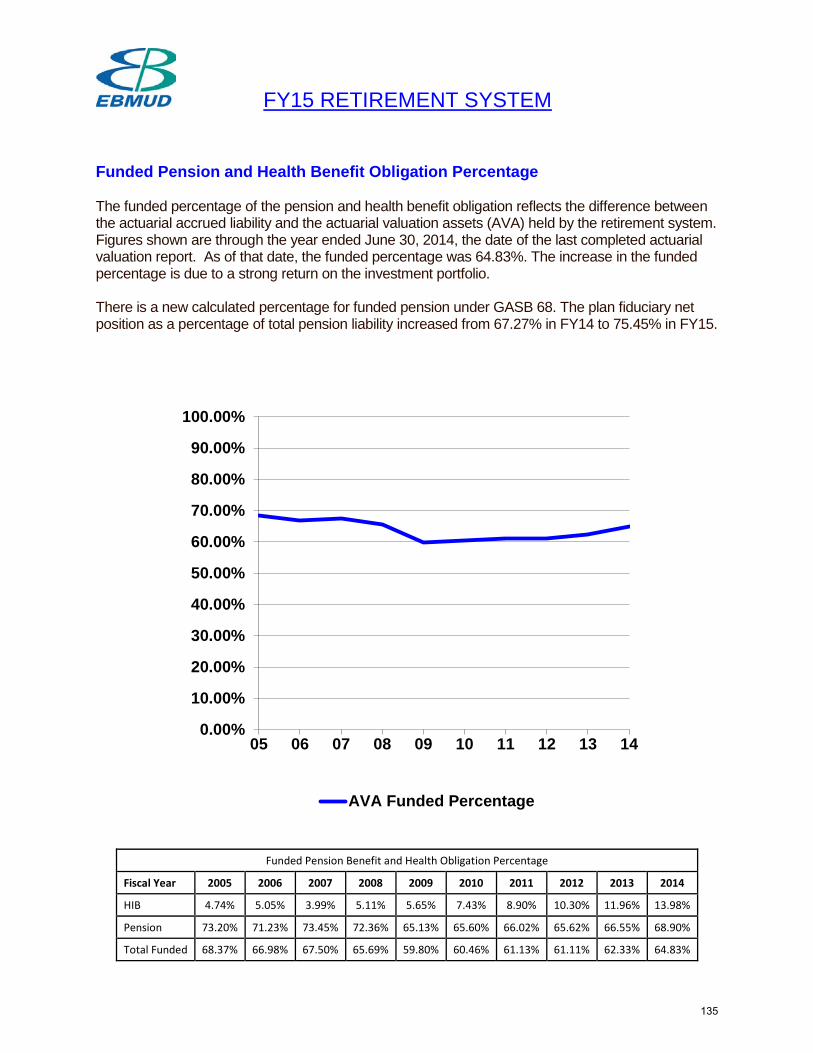
FY15 RETIREMENT SYSTEM Funded Pension and Health Benefit Obligation Percentage The funded percentage of the pension and health benefit obligation reflects the difference between the actuarial accrued liability and the actuarial valuation assets (AVA) held by the retirement system. Figures shown are through the year ended June 30, 2014, the date of the last completed actuarial valuation report. As of that date, the funded percentage was 64.83%. The increase in the funded percentage is due to a strong return on the investment portfolio. There is a new calculated percentage for funded pension under GASB 68. The plan fiduciary net position as a percentage of total pension liability increased from 67.27% in FY14 to 75.45% in FY15.
0.00%
10.00%
20.00%
30.00%
40.00%
50.00%
60.00%
70.00%
80.00%
90.00%
100.00%
05 06 07 08 09 10 11 12 13 14
AVA Funded Percentage
Funded Pension Benefit and Health Obligation Percentage
Fiscal Year 2005 2006 2007 2008 2009 2010 2011 2012 2013 2014
HIB 4.74% 5.05% 3.99% 5.11% 5.65% 7.43% 8.90% 10.30% 11.96% 13.98%
Pension 73.20% 71.23% 73.45% 72.36% 65.13% 65.60% 66.02% 65.62% 66.55% 68.90%
Total Funded 68.37% 66.98% 67.50% 65.69% 59.80% 60.46% 61.13% 61.11% 62.33% 64.83%
135
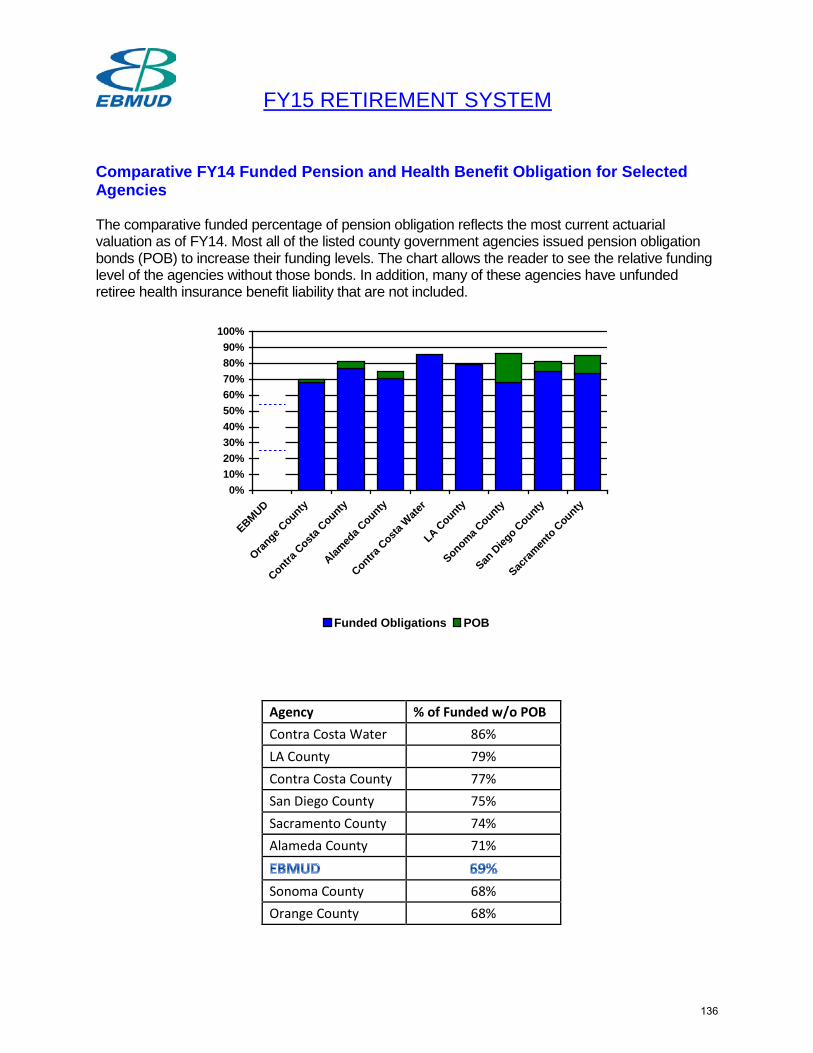
FY15 RETIREMENT SYSTEM Comparative FY14 Funded Pension and Health Benefit Obligation for Selected Agencies The comparative funded percentage of pension obligation reflects the most current actuarial valuation as of FY14. Most all of the listed county government agencies issued pension obligation bonds (POB) to increase their funding levels. The chart allows the reader to see the relative funding level of the agencies without those bonds. In addition, many of these agencies have unfunded retiree health insurance benefit liability that are not included.
0%10%20%30%40%50%60%70%80%90%
100%
EBMUD
Orange C
ounty
Contra C
osta C
ounty
Alamed
a County
Contra C
osta W
ater
LA County
Sonoma County
San D
iego C
ounty
Sacram
ento C
ounty
Funded Obligations POB
Agency % of Funded w/o POB Contra Costa Water 86% LA County 79% Contra Costa County 77% San Diego County 75% Sacramento County 74% Alameda County 71%
Sonoma County 68% Orange County 68%
136

STRATEGIC PLAN
KEY PERFORMANCE INDICATORS FOR FISCAL YEAR 2015
EAST BAY MUNICIPAL UTILITY DISTRICT
1
Table of Contents
Introduction .............................................................. 2
Strategic Plan Goals .................................................. 2
Key Performance Indicator Summary........................2 Long Term Water Supply ........................................... 5
Water Quality and Environmental Protection ........... 9
Long Term Infrastructure Investment .................... 12
Long Term Financial Stability ................................. 14
Customer Service .................................................... 16
Workforce Planning and Development ................... 18
2
INTRODUCTION These Key Performance Indicators (KPIs) reflect the various strategies contained within the July 2014 Strategic Plan goals, and include performance targets for each KPI. Performance against the targets is measured annually and enables staff to evaluate progress in meeting the Strategic Plan goals. There are 17 new KPIs for FY15. STRATEGIC PLAN GOALS The six Strategic Plan goals are: Long Term Water Supply - Ensure a reliable high quality water supply for the future.
Water Quality and Environmental Protection - Meet or surpass environmental and public health standards and protect public trust values.
Long Term Infrastructure Investment - Maintain and improve the District’s infrastructure in a cost effective manner to ensure sustainable delivery of reliable, high quality service now and in the future, addressing environmental, social, and financial concerns.
Long Term Financial Stability - Manage the District’s finances to meet funding needs and maintain reasonable water and wastewater rates.
Customer Service - Understand and be responsive to customer expectations for service.
Workforce Planning and Development - Create an environment that attracts, retains, and engages a high performing diverse workforce in support of the District’s mission. KEY PERFORMANCE INDICATOR SUMMARY The FY15 KPI results are summarized in the table below. The District met or was on target to meet 87% of its KPIs where targets were set and data was available.
Key Result # KPIs ++ Target met 41 + Target not met, but on track 11 -- Target not met 8 # Target/Data not available 1 Performance measure only 2 Total 63
The District has tracked performance since the first Strategic Plan was developed in 2004. A summary of the performance of each current KPI is shown on the following table from FY11 through FY15.
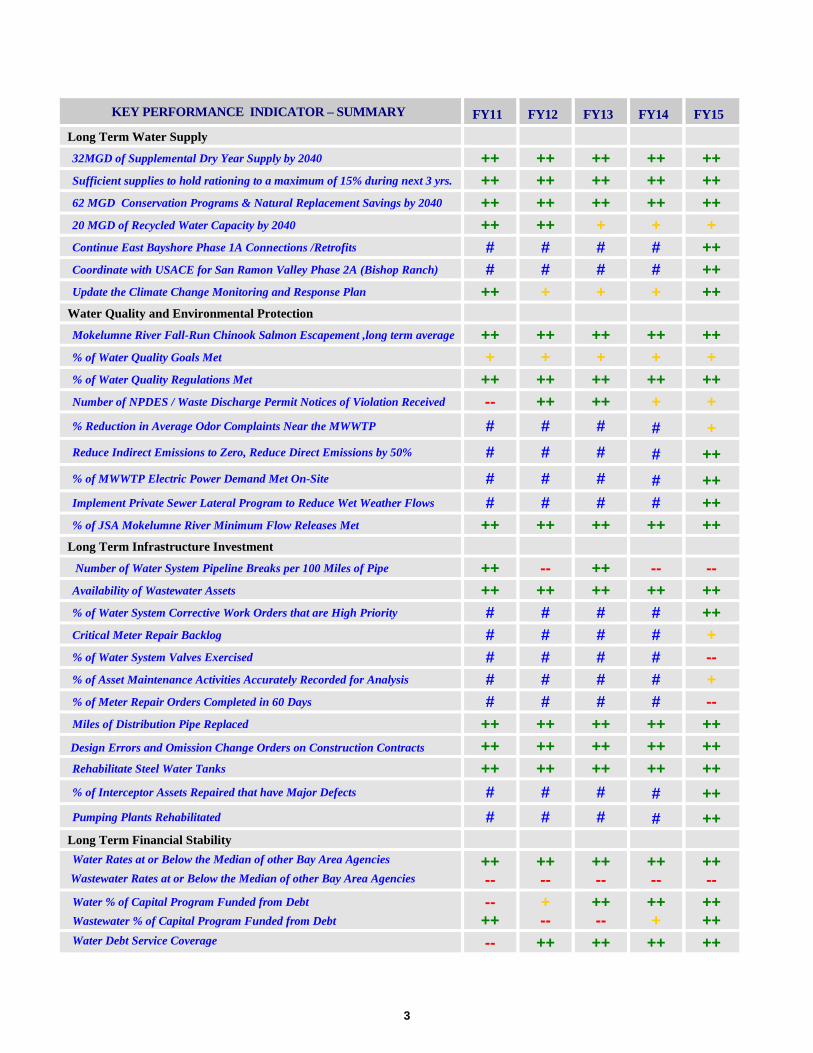
3
KEY PERFORMANCE INDICATOR – SUMMARY
FY11
FY12
FY13
FY14
FY15
Long Term Water Supply 32MGD of Supplemental Dry Year Supply by 2040 ++ ++ ++ ++ ++ Sufficient supplies to hold rationing to a maximum of 15% during next 3 yrs. ++ ++ ++ ++ ++ 62 MGD Conservation Programs & Natural Replacement Savings by 2040 ++ ++ ++ ++ ++ 20 MGD of Recycled Water Capacity by 2040 ++ ++ + + + Continue East Bayshore Phase 1A Connections /Retrofits # # # # ++ Coordinate with USACE for San Ramon Valley Phase 2A (Bishop Ranch) # # # # ++ Update the Climate Change Monitoring and Response Plan ++ + + + ++
Water Quality and Environmental Protection Mokelumne River Fall-Run Chinook Salmon Escapement ,long term average ++ ++ ++ ++ ++ % of Water Quality Goals Met + + + + + % of Water Quality Regulations Met ++ ++ ++ ++ ++ Number of NPDES / Waste Discharge Permit Notices of Violation Received -- ++ ++ + + % Reduction in Average Odor Complaints Near the MWWTP # # # # + Reduce Indirect Emissions to Zero, Reduce Direct Emissions by 50% # # # # ++ % of MWWTP Electric Power Demand Met On-Site # # # # ++ Implement Private Sewer Lateral Program to Reduce Wet Weather Flows # # # # ++ % of JSA Mokelumne River Minimum Flow Releases Met ++ ++ ++ ++ ++
Long Term Infrastructure Investment Number of Water System Pipeline Breaks per 100 Miles of Pipe ++ -- ++ -- -- Availability of Wastewater Assets ++ ++ ++ ++ ++ % of Water System Corrective Work Orders that are High Priority # # # # ++ Critical Meter Repair Backlog # # # # + % of Water System Valves Exercised # # # # -- % of Asset Maintenance Activities Accurately Recorded for Analysis # # # # + % of Meter Repair Orders Completed in 60 Days # # # # -- Miles of Distribution Pipe Replaced ++ ++ ++ ++ ++
Design Errors and Omission Change Orders on Construction Contracts ++ ++ ++ ++ ++ Rehabilitate Steel Water Tanks ++ ++ ++ ++ ++ % of Interceptor Assets Repaired that have Major Defects # # # # ++ Pumping Plants Rehabilitated # # # # ++
Long Term Financial Stability Water Rates at or Below the Median of other Bay Area Agencies
Wastewater Rates at or Below the Median of other Bay Area Agencies ++ --
++ --
++ --
++ --
++ --
Water % of Capital Program Funded from Debt Wastewater % of Capital Program Funded from Debt
-- ++
+ --
++ --
++ +
++ ++
Water Debt Service Coverage -- ++ ++ ++ ++
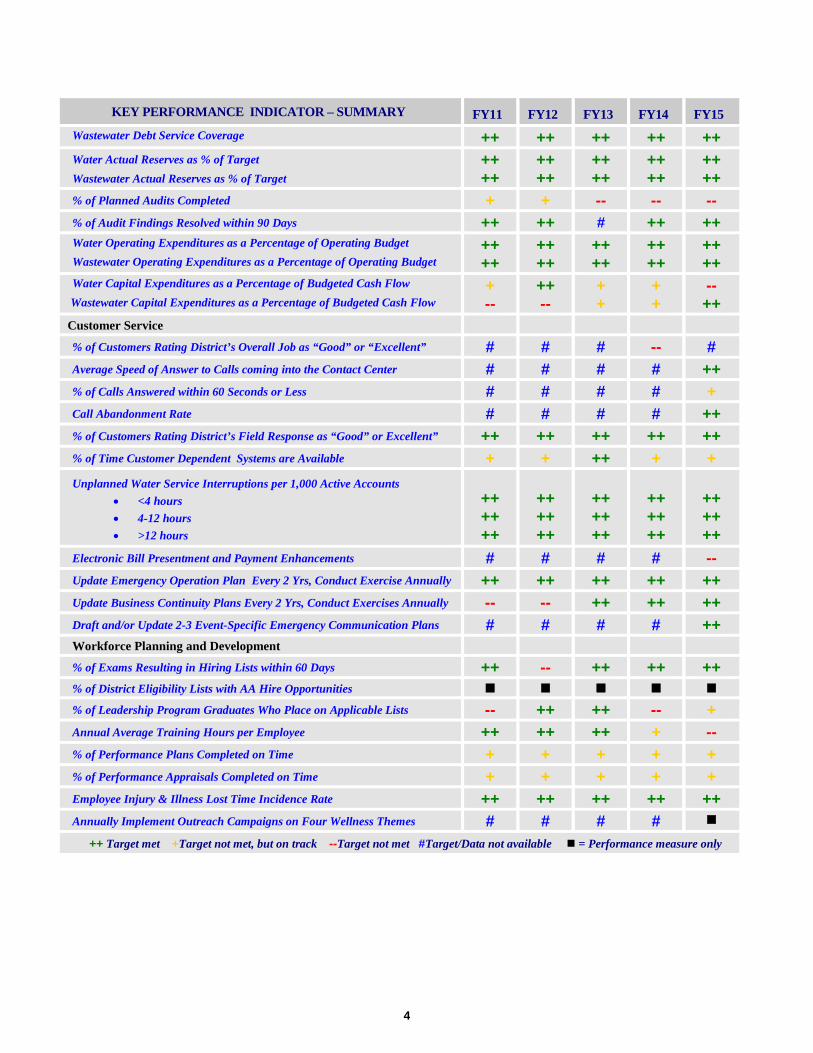
4
KEY PERFORMANCE INDICATOR – SUMMARY
FY11
FY12
FY13
FY14
FY15
Wastewater Debt Service Coverage ++ ++ ++ ++ ++ Water Actual Reserves as % of Target Wastewater Actual Reserves as % of Target
++ ++
++ ++
++ ++
++ ++
++ ++
% of Planned Audits Completed + + -- -- -- % of Audit Findings Resolved within 90 Days ++ ++ # ++ ++ Water Operating Expenditures as a Percentage of Operating Budget Wastewater Operating Expenditures as a Percentage of Operating Budget
++ ++
++ ++
++ ++
++ ++
++ ++
Water Capital Expenditures as a Percentage of Budgeted Cash Flow Wastewater Capital Expenditures as a Percentage of Budgeted Cash Flow
+ --
++ --
+ +
+ +
-- ++
Customer Service % of Customers Rating District’s Overall Job as “Good” or “Excellent” # # # -- # Average Speed of Answer to Calls coming into the Contact Center # # # # ++ % of Calls Answered within 60 Seconds or Less # # # # + Call Abandonment Rate # # # # ++ % of Customers Rating District’s Field Response as “Good” or Excellent” ++ ++ ++ ++ ++ % of Time Customer Dependent Systems are Available + + ++ + + Unplanned Water Service Interruptions per 1,000 Active Accounts
• <4 hours • 4-12 hours • >12 hours
++ ++ ++
++ ++ ++
++ ++ ++
++ ++ ++
++ ++ ++
Electronic Bill Presentment and Payment Enhancements # # # # -- Update Emergency Operation Plan Every 2 Yrs, Conduct Exercise Annually ++ ++ ++ ++ ++ Update Business Continuity Plans Every 2 Yrs, Conduct Exercises Annually -- -- ++ ++ ++ Draft and/or Update 2-3 Event-Specific Emergency Communication Plans # # # # ++ Workforce Planning and Development
% of Exams Resulting in Hiring Lists within 60 Days ++ -- ++ ++ ++ % of District Eligibility Lists with AA Hire Opportunities
% of Leadership Program Graduates Who Place on Applicable Lists -- ++ ++ -- + Annual Average Training Hours per Employee ++ ++ ++ + -- % of Performance Plans Completed on Time + + + + + % of Performance Appraisals Completed on Time + + + + + Employee Injury & Illness Lost Time Incidence Rate ++ ++ ++ ++ ++ Annually Implement Outreach Campaigns on Four Wellness Themes # # # #
++ Target met +Target not met, but on track --Target not met #Target/Data not available = Performance measure only
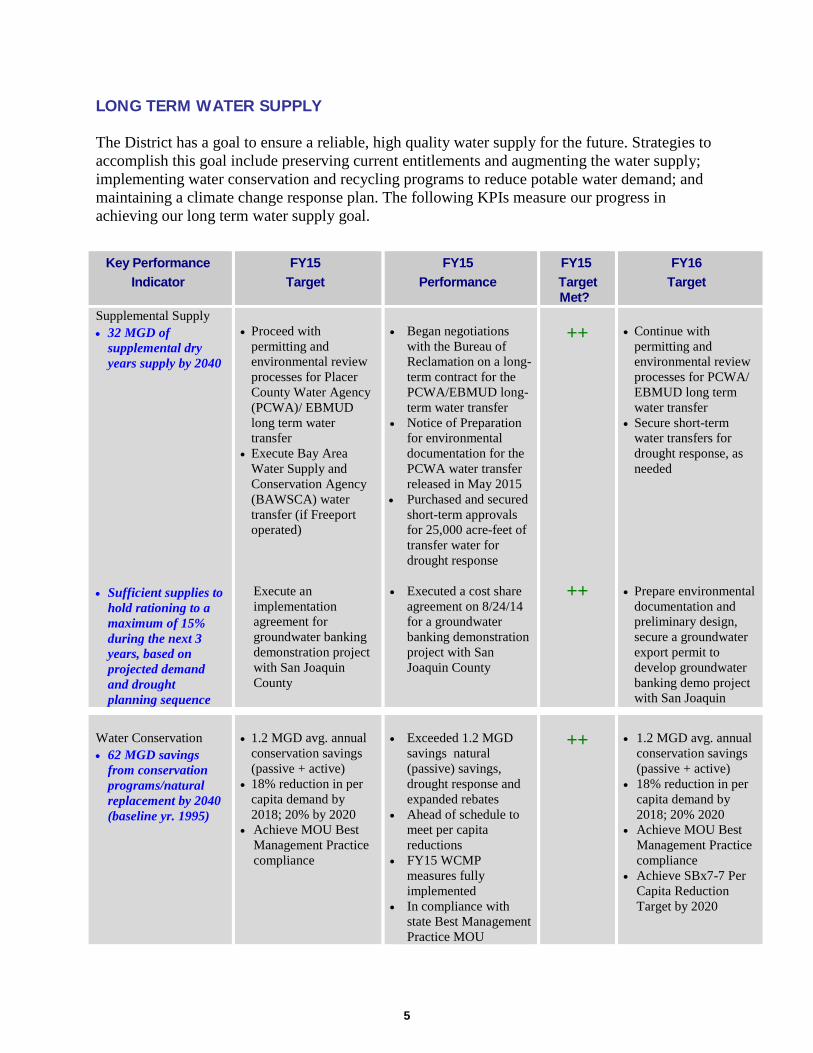
5
LONG TERM WATER SUPPLY The District has a goal to ensure a reliable, high quality water supply for the future. Strategies to accomplish this goal include preserving current entitlements and augmenting the water supply; implementing water conservation and recycling programs to reduce potable water demand; and maintaining a climate change response plan. The following KPIs measure our progress in achieving our long term water supply goal.
Key Performance Indicator
FY15 Target
FY15 Performance
FY15 Target
Met?
FY16 Target
Supplemental Supply • 32 MGD of
supplemental dry years supply by 2040
• Sufficient supplies to
hold rationing to a maximum of 15% during the next 3 years, based on projected demand and drought planning sequence
• Proceed with
permitting and environmental review processes for Placer County Water Agency (PCWA)/ EBMUD long term water transfer
• Execute Bay Area Water Supply and Conservation Agency (BAWSCA) water transfer (if Freeport operated)
Execute an implementation agreement for groundwater banking demonstration project with San Joaquin County
• Began negotiations
with the Bureau of Reclamation on a long-term contract for the PCWA/EBMUD long-term water transfer
• Notice of Preparation for environmental documentation for the PCWA water transfer released in May 2015
• Purchased and secured short-term approvals for 25,000 acre-feet of transfer water for drought response
• Executed a cost share agreement on 8/24/14 for a groundwater banking demonstration project with San Joaquin County
++
++
• Continue with
permitting and environmental review processes for PCWA/ EBMUD long term water transfer
• Secure short-term water transfers for drought response, as needed
• Prepare environmental
documentation and preliminary design, secure a groundwater export permit to develop groundwater banking demo project with San Joaquin
Water Conservation • 62 MGD savings
from conservation programs/natural replacement by 2040 (baseline yr. 1995)
• 1.2 MGD avg. annual
conservation savings (passive + active)
• 18% reduction in per capita demand by 2018; 20% by 2020
• Achieve MOU Best Management Practice compliance
• Exceeded 1.2 MGD
savings natural (passive) savings, drought response and expanded rebates
• Ahead of schedule to meet per capita reductions
• FY15 WCMP measures fully implemented
• In compliance with state Best Management Practice MOU
++
• 1.2 MGD avg. annual
conservation savings (passive + active)
• 18% reduction in per capita demand by 2018; 20% 2020
• Achieve MOU Best Management Practice compliance
• Achieve SBx7-7 Per Capita Reduction Target by 2020
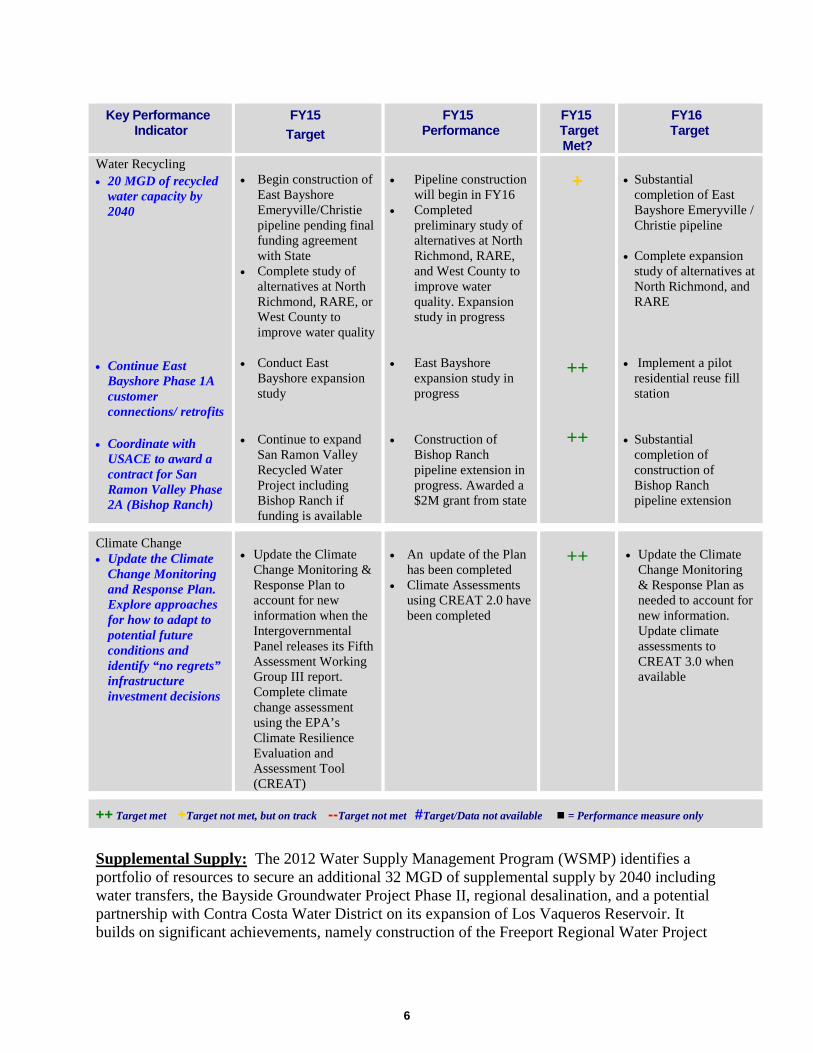
6
Key Performance Indicator
FY15 Target
FY15 Performance
FY15 Target Met?
FY16 Target
Water Recycling • 20 MGD of recycled
water capacity by 2040
• Continue East
Bayshore Phase 1A customer connections/ retrofits
• Coordinate with
USACE to award a contract for San Ramon Valley Phase 2A (Bishop Ranch)
• Begin construction of
East Bayshore Emeryville/Christie pipeline pending final funding agreement with State
• Complete study of alternatives at North Richmond, RARE, or West County to improve water quality
• Conduct East
Bayshore expansion study
• Continue to expand
San Ramon Valley Recycled Water Project including Bishop Ranch if funding is available
• Pipeline construction
will begin in FY16 • Completed
preliminary study of alternatives at North Richmond, RARE, and West County to improve water quality. Expansion study in progress
• East Bayshore
expansion study in progress
• Construction of
Bishop Ranch pipeline extension in progress. Awarded a $2M grant from state
+
++
++
• Substantial
completion of East Bayshore Emeryville / Christie pipeline
• Complete expansion study of alternatives at North Richmond, and RARE
• Implement a pilot residential reuse fill station
• Substantial completion of construction of Bishop Ranch pipeline extension
Climate Change • Update the Climate
Change Monitoring and Response Plan. Explore approaches for how to adapt to potential future conditions and identify “no regrets” infrastructure investment decisions
• Update the Climate
Change Monitoring & Response Plan to account for new information when the Intergovernmental Panel releases its Fifth Assessment Working Group III report. Complete climate change assessment using the EPA’s Climate Resilience Evaluation and Assessment Tool (CREAT)
• An update of the Plan
has been completed • Climate Assessments
using CREAT 2.0 have been completed
++
• Update the Climate
Change Monitoring & Response Plan as needed to account for new information. Update climate assessments to CREAT 3.0 when available
++ Target met +Target not met, but on track --Target not met #Target/Data not available = Performance measure only
Supplemental Supply: The 2012 Water Supply Management Program (WSMP) identifies a portfolio of resources to secure an additional 32 MGD of supplemental supply by 2040 including water transfers, the Bayside Groundwater Project Phase II, regional desalination, and a potential partnership with Contra Costa Water District on its expansion of Los Vaqueros Reservoir. It builds on significant achievements, namely construction of the Freeport Regional Water Project
7
and the Bayside Groundwater Phase I facilities, and completion of the Regional Desalination Pilot Project. In FY15, progress continued towards completing environmental reviews and approvals to implement a long-term water transfer arrangement with Placer County Water Agency (PCWA), including initiation of negotiations with the U.S. Bureau of Reclamation on a long-term Warren Act contract to use federal facilities to convey PCWA transfer water to EBMUD. In FY15, water transfer efforts were re-focused on securing short-term water transfers to meet the District’s immediate drought needs. In total, approximately 25,000 acre-feet of transfer water was secured from three sellers to be delivered to EBMUD in FY16. Also, progress continued toward development of a groundwater banking demonstration project in partnership with San Joaquin County. FY15 activities included preliminary injection and extraction site selection and the initiation of property owner negotiations. Work in FY16 will be performed to finalize property owner agreements, develop preliminary engineering plans, prepare environmental documents, and secure permits. Water Conservation: In FY15, we continued implementation of conservation measures included within the six strategies identified in the 2011 Water Conservation Master Plan (WCMP). Higher than average customers participation levels continued from FY14 due to ongoing drought response programs. Overall water savings met voluntary and mandatory drought reduction goals for the year through increased natural, behavioral-based measures and heightened participation in District indoor and outdoor conservation incentives, water use and leak detection surveys, and education programs. The FY15 baseline WCMP conservation programs include targeted savings and per capita water use reductions required to achieve compliance with the Water Conservation Act of 2009 (or 20 x 2020) and the California Urban Water Conservation Council Statewide Memorandum of Understanding for best management program reporting. The District’s overall 2015 demand was less than 125 gallons per capita per day (gpcd), well below the 20 x 2020 interim target of 158 gpcd. Water Recycling: The target for water recycling is an additional 11 MGD by the year 2040 or a total of 20 MGD by the year 2040 to reduce the demand for potable water. Recycled water use of about 9 MGD is achieved through a combination of irrigation and industrial reuse projects. Existing recycled water uses include refinery cooling towers and boiler feedwater; golf course irrigation in Alameda, Oakland, Richmond and San Ramon; parkway irrigation in Alameda; office building bathroom flushing in Oakland; office building cooling in Emeryville and landscape irrigation in various areas of Oakland, Emeryville and San Ramon. In FY15, progress was made on completing design and construction award of the East Bayshore Emeryville/Christie pipeline which was approved for a $1 million state grant for construction. The administration building was retrofitted to use recycled water in one of its cooling towers, and EBMUD hopes to learn from this pilot application. Also, the new Caltrans maintenance center near the bay bridge was connected to recycled water for irrigation and toilet flushing. A preliminary evaluation was conducted of improvements and expansion alternatives at North Richmond and RARE due to West County water quality. An expansion study of RARE and North Richmond is in progress. EBMUD was awarded a $2 million grant from the state for the next phase of the San Ramon project in Bishop Ranch. Construction began at the end of the
8
fiscal year. Also, EBMUD continued to coordinate with the Diablo Country Club to develop a pilot satellite recycled water project. Climate Change: This KPI ensures the District’s future water supply, water quality, and infrastructure planning incorporates adaptation to and mitigation of climate change. An update to the Climate Change Monitoring & Response Plan has been completed to account for new information. New or revised recommended actions include:
• Inventory the District’s greenhouse gas emissions annually; • Investigate new renewable energy projects consistent with Energy Policy 7.07; and • Update the District’s Energy Management Strategy.
The latest update to the Climate Change Monitoring and Response Plan summarizes the District’s work on climate change, information from the latest Intergovernmental Panel on Climate Change’s Fifth Assessment Report, and information in the 2014 US National Climate Assessment Report. This information was presented at the June 24, 2014 Sustainability/Energy Committee meeting. The District has completed climate change assessments using the EPA’s Climate Resilience Evaluation & Awareness Tool (CREAT) version 2.0. EPA developed CREAT, a software tool, to assist drinking water and wastewater utility owners and operators in understanding potential climate change threats and in assessing the related risks at their individual utilities. CREAT provides users with access to the most recent national assessment of climate change impacts for use in considering how these changes will impact utility operations and missions. The District has piloted CREAT version 3.0 which is currently in development.
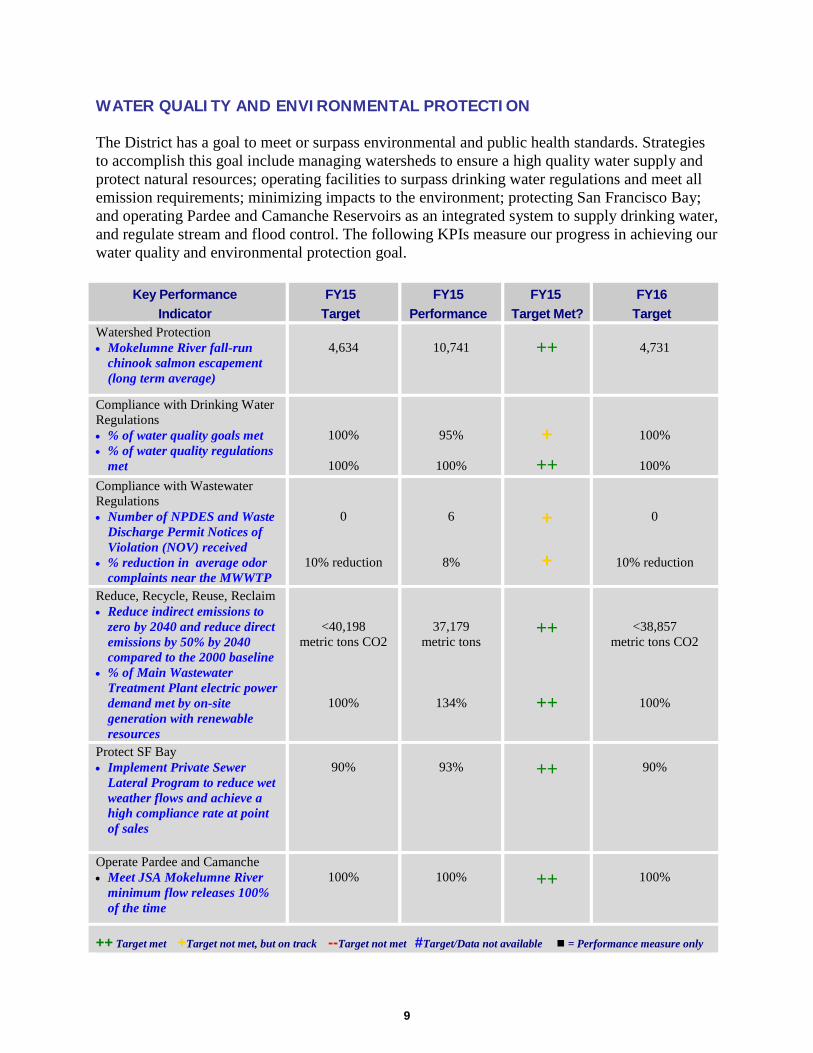
9
WATER QUALITY AND ENVIRONMENTAL PROTECTION The District has a goal to meet or surpass environmental and public health standards. Strategies to accomplish this goal include managing watersheds to ensure a high quality water supply and protect natural resources; operating facilities to surpass drinking water regulations and meet all emission requirements; minimizing impacts to the environment; protecting San Francisco Bay; and operating Pardee and Camanche Reservoirs as an integrated system to supply drinking water, and regulate stream and flood control. The following KPIs measure our progress in achieving our water quality and environmental protection goal.
Key Performance Indicator
FY15 Target
FY15 Performance
FY15 Target Met?
FY16 Target
Watershed Protection • Mokelumne River fall-run
chinook salmon escapement (long term average)
4,634
10,741
++
4,731
Compliance with Drinking Water Regulations • % of water quality goals met • % of water quality regulations
met
100%
100%
95%
100%
+
++
100%
100% Compliance with Wastewater Regulations • Number of NPDES and Waste
Discharge Permit Notices of Violation (NOV) received
• % reduction in average odor complaints near the MWWTP
0
10% reduction
6
8%
+
+
0
10% reduction
Reduce, Recycle, Reuse, Reclaim • Reduce indirect emissions to
zero by 2040 and reduce direct emissions by 50% by 2040 compared to the 2000 baseline
• % of Main Wastewater Treatment Plant electric power demand met by on-site generation with renewable resources
<40,198 metric tons CO2
100%
37,179 metric tons
134%
++
++
<38,857 metric tons CO2
100%
Protect SF Bay • Implement Private Sewer
Lateral Program to reduce wet weather flows and achieve a high compliance rate at point of sales
90%
93%
++
90%
Operate Pardee and Camanche • Meet JSA Mokelumne River
minimum flow releases 100% of the time
100%
100%
++
100%
++ Target met +Target not met, but on track --Target not met #Target/Data not available = Performance measure only
10
Watershed Protection: The FY15 target for the number of fish returning (escapement) to the Mokelumne River was based on the 1940 to 2013 long-term average. The FY15 performance represents the average escapement from 2009 to 2014, which is a six-year (2 cohorts) running average. The escapement for FY15 alone was 12,118 fish, which is slightly less than FY14, but still the 5th largest escapement recorded in the Mokelumne River since 1940. Through the Lower Mokelumne River Partnership, the District initiated adaptive management actions including pulse attraction flow events in the fall of 2014. As a result of these actions, the total return to the Mokelumne was 262 percent of the long-term average, which was greater than any San Joaquin River tributary. Moreover, the Mokelumne River Fish Hatchery produced roughly 5 million juvenile Chinook salmon. The target for FY16 may be revised in the future as resource agencies focus on in-river production versus production in hatcheries. Currently, most of the escapement on the Mokelumne is comprised of hatchery raised fish. Compliance with Drinking Water Regulations: The District voluntarily sets over 100 annual water quality goals that far surpass federal and state standards. In FY15, the District again met 100 percent of State and Federal regulations, and 95 percent of its more stringent water quality goals, similar to FY14 (96 percent). The water quality parameters not met were: 1) Total coliform, 2) Fluoride added to WTP (fluoride feed out temporarily of service at the Walnut Creek WTP), 3) Taste and Odor complaints, 4) Chlorate, 5) Total Trihalomethanes (TTHMs), and 6) Haloacetic Acids (HAAs). Details concerning these issues are contained in the 2015 Water Quality Program Semi-Annual Update that was presented to the Planning Committee.
Compliance with Wastewater Regulations: The goal is to have no violations of the 24 NPDES and Waste Discharge Requirements permits. In FY15 the District received six NOVs associated with its permits. However, three of these NOVs are being contested as they were simple reporting errors and it is anticipated that they will be rescinded. In August 2014 a NOV was received for a missed water quality sample at the Clay Station Raw Water Pumping Plant; staff put new communication procedures in place to prevent reoccurrence. Also in August 2014, a NOV was received for samples not being collected at the Camanche North Shore Water Treatment Plant in June 2014; this NOV was contested as there was no flow to sample at that time. In February 2015 the District received a NOV for settleable solids and total suspended solids exceedances in the discharge for the Segment 3/FSCC pipeline project; staff explained that this discharge never reached receiving waters. In March 2015 the District received a NOV for missed sampling at Camanche North Shore Water Treatment Plant; staff contested these NOVs due to no discharge happened at that time; report cover letters have since been amended to indicate when there is no flow and therefore sampling is not feasible. In June 2015 the District received a NOV for an unreported flow volume at the Camanche South Shore Water Treatment Plant; this NOV was contested as this was a simple reporting error because there was no discharge flow at that time. Also in June 2015, a NOV was received for a chlorine residual exceedance at the Pardee Recreation Area Water Treatment Plant; staff explained that this water did not reach receiving waters and therefore there were no impacts to beneficial uses and explained that the dechlorination system at the facility is in the process of upgrades; this NOV may result in a minimum mandatory penalty of $3,000.
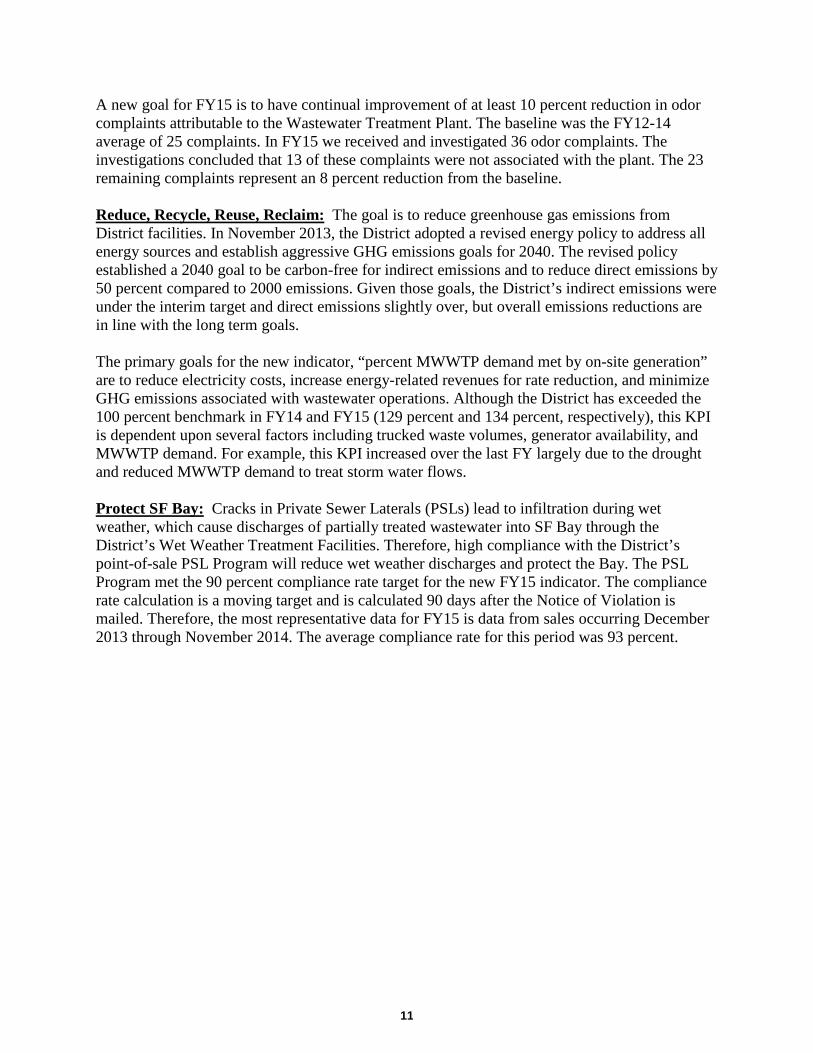
11
A new goal for FY15 is to have continual improvement of at least 10 percent reduction in odor complaints attributable to the Wastewater Treatment Plant. The baseline was the FY12-14 average of 25 complaints. In FY15 we received and investigated 36 odor complaints. The investigations concluded that 13 of these complaints were not associated with the plant. The 23 remaining complaints represent an 8 percent reduction from the baseline. Reduce, Recycle, Reuse, Reclaim: The goal is to reduce greenhouse gas emissions from District facilities. In November 2013, the District adopted a revised energy policy to address all energy sources and establish aggressive GHG emissions goals for 2040. The revised policy established a 2040 goal to be carbon-free for indirect emissions and to reduce direct emissions by 50 percent compared to 2000 emissions. Given those goals, the District’s indirect emissions were under the interim target and direct emissions slightly over, but overall emissions reductions are in line with the long term goals. The primary goals for the new indicator, “percent MWWTP demand met by on-site generation” are to reduce electricity costs, increase energy-related revenues for rate reduction, and minimize GHG emissions associated with wastewater operations. Although the District has exceeded the 100 percent benchmark in FY14 and FY15 (129 percent and 134 percent, respectively), this KPI is dependent upon several factors including trucked waste volumes, generator availability, and MWWTP demand. For example, this KPI increased over the last FY largely due to the drought and reduced MWWTP demand to treat storm water flows. Protect SF Bay: Cracks in Private Sewer Laterals (PSLs) lead to infiltration during wet weather, which cause discharges of partially treated wastewater into SF Bay through the District’s Wet Weather Treatment Facilities. Therefore, high compliance with the District’s point-of-sale PSL Program will reduce wet weather discharges and protect the Bay. The PSL Program met the 90 percent compliance rate target for the new FY15 indicator. The compliance rate calculation is a moving target and is calculated 90 days after the Notice of Violation is mailed. Therefore, the most representative data for FY15 is data from sales occurring December 2013 through November 2014. The average compliance rate for this period was 93 percent.
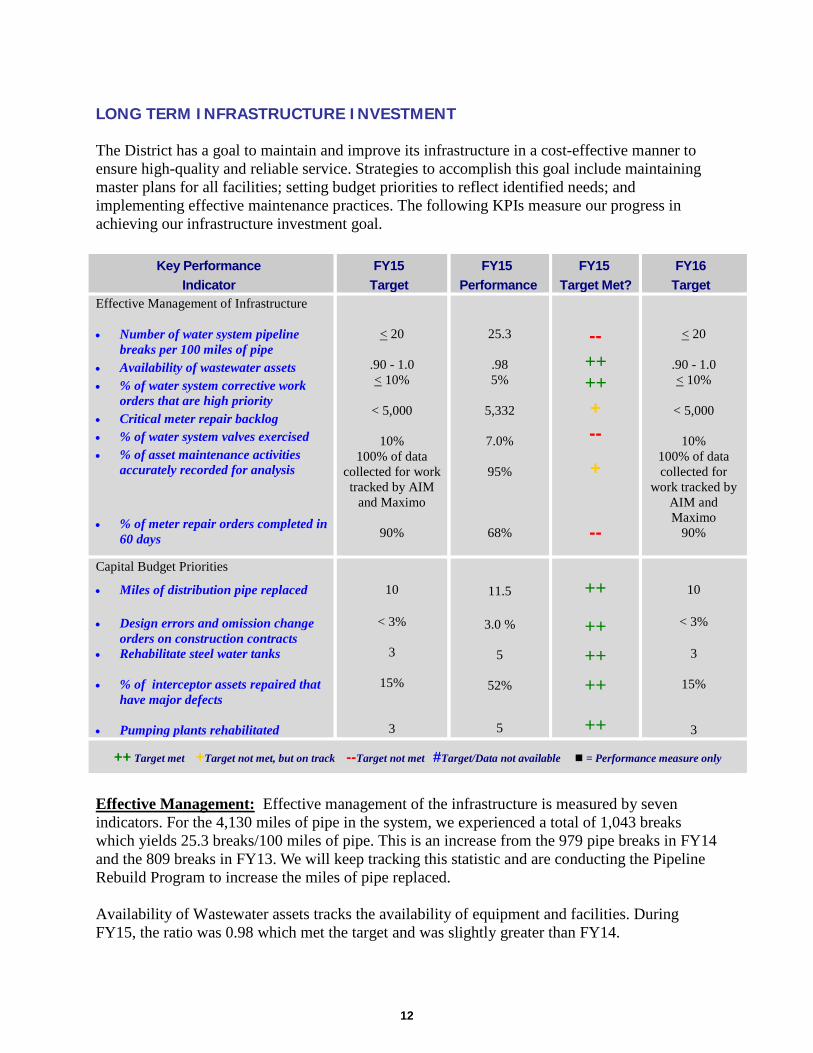
12
LONG TERM INFRASTRUCTURE INVESTMENT The District has a goal to maintain and improve its infrastructure in a cost-effective manner to ensure high-quality and reliable service. Strategies to accomplish this goal include maintaining master plans for all facilities; setting budget priorities to reflect identified needs; and implementing effective maintenance practices. The following KPIs measure our progress in achieving our infrastructure investment goal.
Key Performance Indicator
FY15 Target
FY15 Performance
FY15 Target Met?
FY16 Target
Effective Management of Infrastructure • Number of water system pipeline
breaks per 100 miles of pipe • Availability of wastewater assets • % of water system corrective work
orders that are high priority • Critical meter repair backlog • % of water system valves exercised • % of asset maintenance activities
accurately recorded for analysis • % of meter repair orders completed in
60 days
< 20
.90 - 1.0 < 10%
< 5,000
10%
100% of data collected for work tracked by AIM
and Maximo
90%
25.3
.98 5%
5,332
7.0%
95%
68%
-- ++ ++ + --
+
--
< 20
.90 - 1.0 < 10%
< 5,000
10%
100% of data collected for
work tracked by AIM and Maximo
90%
Capital Budget Priorities
• Miles of distribution pipe replaced • Design errors and omission change
orders on construction contracts • Rehabilitate steel water tanks • % of interceptor assets repaired that
have major defects
• Pumping plants rehabilitated
10
< 3%
3
15%
3
11.5
3.0 %
5
52%
5
++
++ ++ ++
++
10
< 3%
3
15%
3
++ Target met +Target not met, but on track --Target not met #Target/Data not available = Performance measure only
Effective Management: Effective management of the infrastructure is measured by seven indicators. For the 4,130 miles of pipe in the system, we experienced a total of 1,043 breaks which yields 25.3 breaks/100 miles of pipe. This is an increase from the 979 pipe breaks in FY14 and the 809 breaks in FY13. We will keep tracking this statistic and are conducting the Pipeline Rebuild Program to increase the miles of pipe replaced. Availability of Wastewater assets tracks the availability of equipment and facilities. During FY15, the ratio was 0.98 which met the target and was slightly greater than FY14.
13
A new indicator for FY15 is the percent of water system corrective work orders that are high priority. Data from the AIM system that records maintenance work orders shows 493 priority 5 work orders completed out of a total 10,120 corrective work orders, or 4.9 percent were high priority which met the FY15 target of less than 10 percent. The meter repair backlog is a new indicator and exceeded the target by 6.6 percent due to operational ramp-up and staff vacancies. Full staffing of the new Meter Reader/Mechanic positions should allow us to meet this goal in FY16. A new indicator for FY15 involves exercising water system valves. In FY15, 7.0 percent of the 58,070 valves were exercised, which did not meet the target of 10 percent. This KPI covers only the system valves used to isolate leaks during main breaks and other maintenance activities. Staff was diverted due to an unanticipated increase in applicant work and District capital projects resulting in reduced staff availability to exercise valves. Recording maintenance activities for analysis is critical for assessing asset condition and performance. This new indicator tracks maintenance activity work hours. Both water and wastewater system performance was 95 percent which was less than the target. This KPI is not easily measurable due to limitations in identifying all staff time available to be spent on maintenance activities. We will consider revising the KPI and/or target as part of the 2016 Strategic Plan update. Meter repair orders completed in 60 days is a new indicator for FY15. Work started slowly in the first half of the year, but by the second half over 92 percent of meter repair orders were completed within 60 days. Full staffing of the new Meter Reader/Mechanic positions should allow us to meet this goal in FY16. Capital Budget Priorities: Pipeline replacements again exceeded the target totaling 11.5 miles in FY15, slightly greater than the 11.0 miles in FY14 and the 11.1 miles replaced in FY13. Design errors and omissions change orders on Water and Wastewater System contracts were 3.0 percent on contracts valued at $50.0 million (Water System: 3.2 percent on contracts worth $47.6 million; Wastewater: 0 percent on contracts worth $2.5 million). Contracts to rehabilitate, replace or demolish five steel reservoirs were awarded. Round Hill reservoir will be rehabilitated; Acorn, Eden and University reservoirs will be replaced; and Stonewall reservoir will be demolished. Reservoir demolitions benefit the District by removing hazardous materials, reducing maintenance costs, and improving water quality by reducing storage in the distribution system. For FY15 there is a new indicator, “% of interceptor assets repaired that have major defects” to track progress relative to mitigating interceptor defect risks. In FY15, 52 percent of the known major defects were corrected, well above the target of 15 percent.
Contracts to replace or rehabilitation five pumping plants were awarded. Shasta, Woods, and Diablo Vista pumping plants will be replaced, and Moyers and Road 24 No. 2 pumping plants will be rehabilitated.
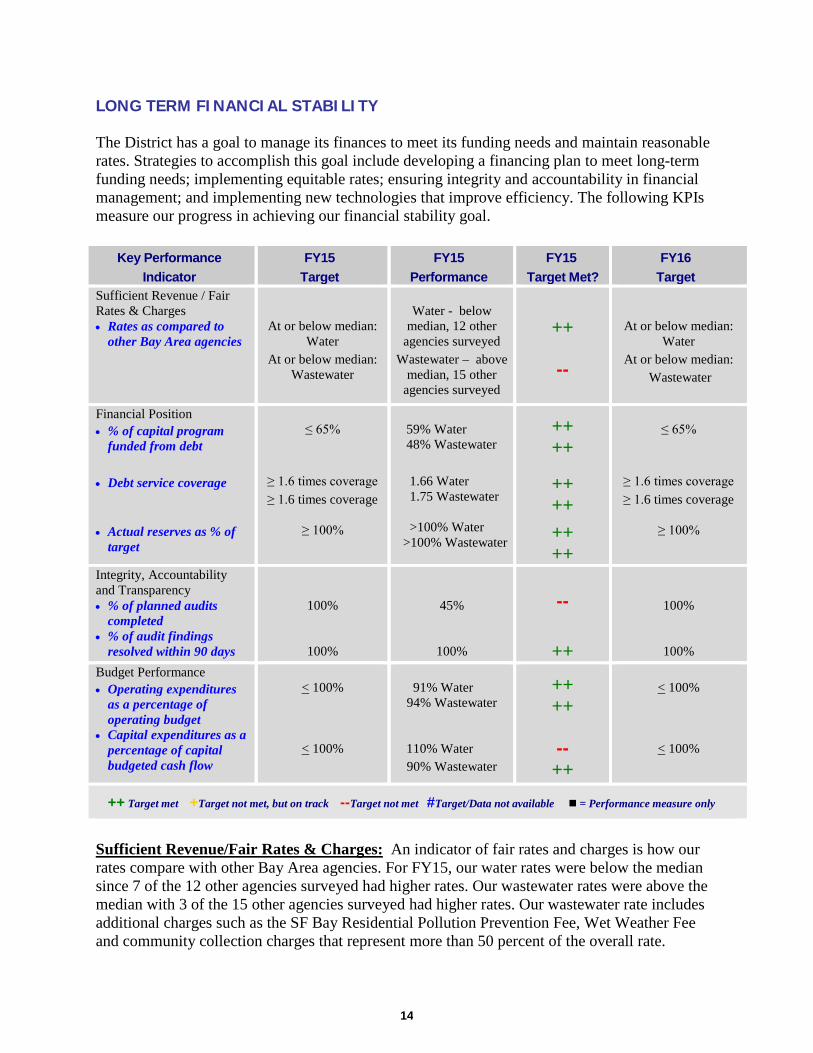
14
LONG TERM FINANCIAL STABILITY The District has a goal to manage its finances to meet its funding needs and maintain reasonable rates. Strategies to accomplish this goal include developing a financing plan to meet long-term funding needs; implementing equitable rates; ensuring integrity and accountability in financial management; and implementing new technologies that improve efficiency. The following KPIs measure our progress in achieving our financial stability goal.
Key Performance Indicator
FY15 Target
FY15 Performance
FY15 Target Met?
FY16 Target
Sufficient Revenue / Fair Rates & Charges • Rates as compared to
other Bay Area agencies
At or below median: Water
At or below median: Wastewater
Water - below
median, 12 other agencies surveyed
Wastewater – above median, 15 other
agencies surveyed
++
--
At or below median: Water
At or below median: Wastewater
Financial Position • % of capital program
funded from debt
• Debt service coverage
• Actual reserves as % of
target
≤ 65%
≥ 1.6 times coverage
≥ 1.6 times coverage
≥ 100%
59% Water 48% Wastewater 1.66 Water 1.75 Wastewater >100% Water >100% Wastewater
++ ++
++ ++
++ ++
≤ 65%
≥ 1.6 times coverage
≥ 1.6 times coverage
≥ 100%
Integrity, Accountability and Transparency • % of planned audits
completed • % of audit findings
resolved within 90 days
100%
100%
45%
100%
--
++
100%
100% Budget Performance • Operating expenditures
as a percentage of operating budget
• Capital expenditures as a percentage of capital budgeted cash flow
< 100%
< 100%
91% Water
94% Wastewater
110% Water
90% Wastewater
++ ++
-- ++
< 100%
< 100%
++ Target met +Target not met, but on track --Target not met #Target/Data not available = Performance measure only
Sufficient Revenue/Fair Rates & Charges: An indicator of fair rates and charges is how our rates compare with other Bay Area agencies. For FY15, our water rates were below the median since 7 of the 12 other agencies surveyed had higher rates. Our wastewater rates were above the median with 3 of the 15 other agencies surveyed had higher rates. Our wastewater rate includes additional charges such as the SF Bay Residential Pollution Prevention Fee, Wet Weather Fee and community collection charges that represent more than 50 percent of the overall rate.
15
Financial Position: Our financial policies specify targets for measuring our financial position. The percent of the Water System capital program funded by debt over the last 5 years was 59 percent which is less than last year’s 5-year average of 62 percent. The percent of the Wastewater System capital program funded by debt was less than the target at 48 percent, down from last year’s average of 66 percent. In the future we expect to continue funding a larger portion of the capital program with rate revenue. The measure for reserves is the variance between the target and actual reserve levels at the end of FY15. The target reserve levels of $126.3 million for Water and $21.3 million for Wastewater were exceeded due to lower operating costs. The additional reserves were deposited in the rate stabilization fund for each enterprise. The District has a policy target of 1.6 times debt service coverage. The Water System FY15 debt coverage ratio was 1.66 which met the target and is the same as FY14. The Wastewater System debt coverage ratio was 1.75 which met the target and is greater than the 1.60 in FY14. Integrity of Financial Systems: These audit measures monitor the internal control environment in place to ensure and promote asset accountability, financial reporting accuracy, and compliance with laws, regulations, and statutes. Four of the reviews scheduled in the FY15 Internal Audit plan were completed, while draft reports summarizing outcomes of three of the scheduled reviews are being developed. During this period an unscheduled review to follow up on purchasing related concerns was also reported. Three of the reviews scheduled in the FY15 plan were postponed and have been included in the FY16 plan. Detailed reports of the audits completed and the results from each were provided as part of the Annual Internal Audit Report that was presented to the Finance/Administration Committee in July 2015. There were no outstanding audit findings reported during the period or outstanding from prior periods that needed to be resolved. Budget Performance: This KPI measures the variance between spending and the approved budget, with a target for expenditures to not exceed 100 percent of the operating and capital budget including debt service. The FY15 Water System operating expenditures were 91 percent of budget primarily due to lower debt service costs, unspent contingency, and a greater offset for the administration of capital work, and is less than the 96 percent spent in FY14. The FY15 Wastewater System operating expenditures were 94 percent of budget primarily due to lower debt service costs, unspent contingency, and lower operation expenses, and is less than the 98 percent in FY14. Capital budget spending was over the target for the Water System at 110 percent as the cost of pipeline work and administering the capital project work was greater than planned. However, Water System capital spending fell within the total amount of appropriations approved by the Board. Capital spending was less than budget for the Wastewater System at 90 percent primarily due to reduced spending on sewer interceptor rehabilitation work.
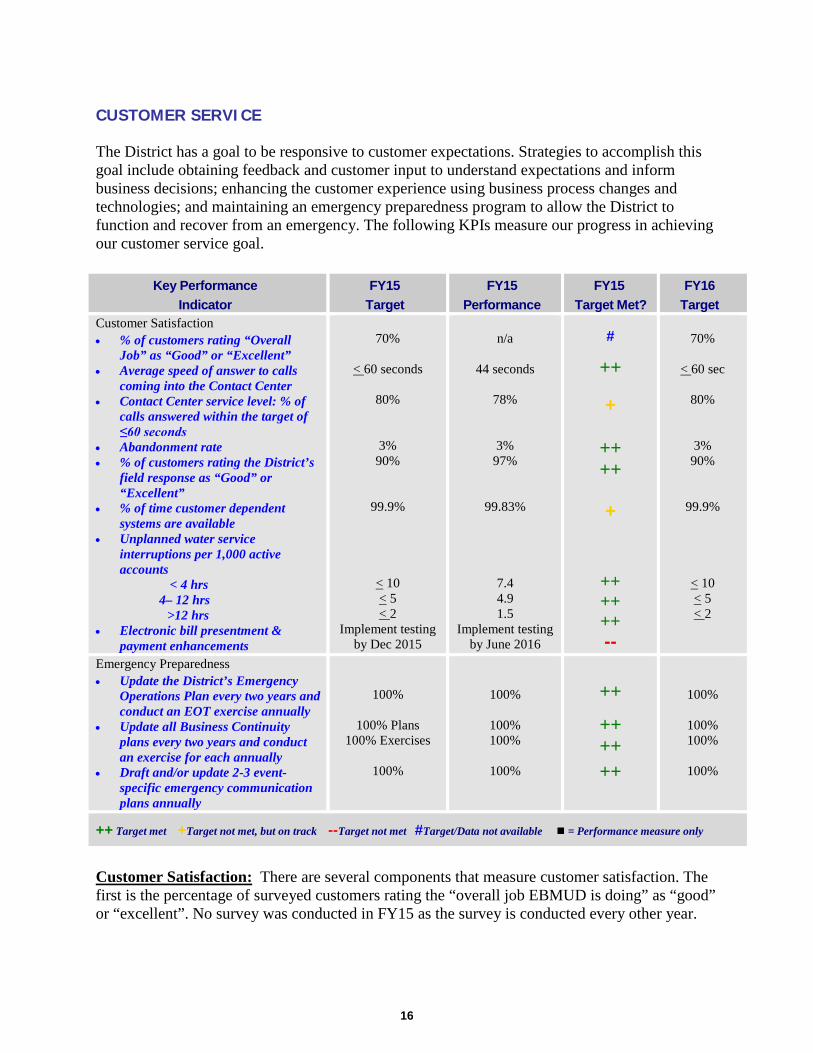
16
CUSTOMER SERVICE The District has a goal to be responsive to customer expectations. Strategies to accomplish this goal include obtaining feedback and customer input to understand expectations and inform business decisions; enhancing the customer experience using business process changes and technologies; and maintaining an emergency preparedness program to allow the District to function and recover from an emergency. The following KPIs measure our progress in achieving our customer service goal.
Key Performance Indicator
FY15 Target
FY15 Performance
FY15 Target Met?
FY16 Target
Customer Satisfaction • % of customers rating “Overall
Job” as “Good” or “Excellent” • Average speed of answer to calls
coming into the Contact Center • Contact Center service level: % of
calls answered within the target of ≤60 seconds
• Abandonment rate • % of customers rating the District’s
field response as “Good” or “Excellent”
• % of time customer dependent systems are available
• Unplanned water service interruptions per 1,000 active accounts < 4 hrs
4– 12 hrs >12 hrs
• Electronic bill presentment & payment enhancements
70%
< 60 seconds
80%
3% 90%
99.9%
< 10 < 5 < 2
Implement testing by Dec 2015
n/a
44 seconds
78%
3% 97%
99.83%
7.4 4.9 1.5
Implement testing by June 2016
#
++
+
++ ++
+
++ ++ ++ --
70%
< 60 sec
80%
3% 90%
99.9%
< 10 < 5 < 2
Emergency Preparedness • Update the District’s Emergency
Operations Plan every two years and conduct an EOT exercise annually
• Update all Business Continuity plans every two years and conduct an exercise for each annually
• Draft and/or update 2-3 event-specific emergency communication plans annually
100%
100% Plans 100% Exercises
100%
100%
100% 100%
100%
++
++ ++ ++
100%
100% 100%
100%
++ Target met +Target not met, but on track --Target not met #Target/Data not available = Performance measure only
Customer Satisfaction: There are several components that measure customer satisfaction. The first is the percentage of surveyed customers rating the “overall job EBMUD is doing” as “good” or “excellent”. No survey was conducted in FY15 as the survey is conducted every other year.
17
Another satisfaction measure involves indicators related to our contact center telephone response. FY15 was a drought year and the contact center received numerous inquiries concerning use, conservation programs, and rates and penalties. We achieved our goal of answering calls in less than 60 seconds with an average response time of 44 seconds, met the call abandonment rate of 3 percent, and almost met the target of answering 80 percent of calls within 60 seconds. In FY15 a total of 112 field service survey responses were completed compared to 99 in FY14, and ratings continue high at 97 percent of customers rating service as “Good or Excellent” which is similar to the 94 percent in FY14. The availability of automated systems used by customers (Internet, Call Center and Dispatch Center telephones, Customer Information System, and Integrated Voice Response self-service applications) is also a measure of customer satisfaction. Availability is determined by tracking the hours of unplanned down time. The FY15 target of 99.9% availability was almost met. In August 2014, the Interactive Voice Response system experienced technical issues and customers were not able to reach the automated system for 48 hours, but during business hours calls went directly to the Call Center and were answered promptly. In December 2014, the data storage system experienced technical issues, resulting in a 2 hour outage of the Customer Billing System. Minimizing the impacts to customers from unplanned service interruptions is vital. In FY15 the target was met and the number of interruptions was similar to FY14. A new indicator for FY15 involves electronic bill presentment and payment enhancements to improve customer access to information and services. The target for releasing the RFP was FY14, and to implement testing by December 2015. As a result of drought impacts, an approved contract is now expected in December 2015, and testing is estimated to be implemented in June 2016. Emergency Preparedness: In FY15, the District met these KPIs which are a measure of its ability to maintain an active emergency preparedness program by maintaining current documentation and testing of emergency response plans and business continuity plans. The Emergency Operations Plan was revised in FY15. The District conducted or participated in 35 exercises, tests and drills including a functional exercise of the Emergency Operations Team. The KPI for updating BCPs every two years and conducting exercises for each BCP once a year was met. This is the third year in a row of meeting this KPI. Details concerning business continuity are contained in the Annual Readiness Report and Program Update presented to the Planning Committee in August 2015. In 2015, event-specific emergency communications plans were drafted that provide guidance to staff in handling public communications during an emergency involving a creek spill and during an emergency involving algae blooms in EBMUD reservoirs.
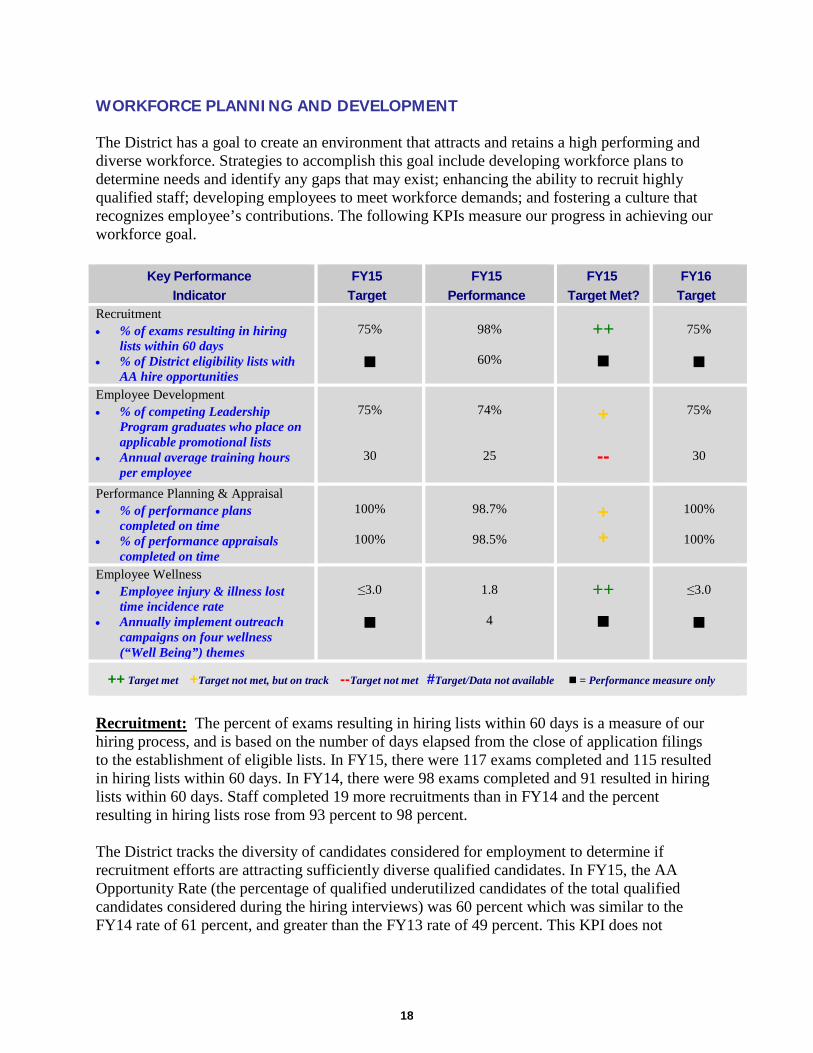
18
WORKFORCE PLANNING AND DEVELOPMENT The District has a goal to create an environment that attracts and retains a high performing and diverse workforce. Strategies to accomplish this goal include developing workforce plans to determine needs and identify any gaps that may exist; enhancing the ability to recruit highly qualified staff; developing employees to meet workforce demands; and fostering a culture that recognizes employee’s contributions. The following KPIs measure our progress in achieving our workforce goal.
Key Performance Indicator
FY15 Target
FY15 Performance
FY15 Target Met?
FY16 Target
Recruitment • % of exams resulting in hiring
lists within 60 days • % of District eligibility lists with
AA hire opportunities
75%
98%
60%
++
75%
Employee Development • % of competing Leadership
Program graduates who place on applicable promotional lists
• Annual average training hours per employee
75%
30
74%
25
+
--
75%
30
Performance Planning & Appraisal • % of performance plans
completed on time • % of performance appraisals
completed on time
100%
100%
98.7%
98.5%
+ +
100%
100%
Employee Wellness • Employee injury & illness lost
time incidence rate • Annually implement outreach
campaigns on four wellness (“Well Being”) themes
≤3.0
1.8
4
++
≤3.0
++ Target met +Target not met, but on track --Target not met #Target/Data not available = Performance measure only
Recruitment: The percent of exams resulting in hiring lists within 60 days is a measure of our hiring process, and is based on the number of days elapsed from the close of application filings to the establishment of eligible lists. In FY15, there were 117 exams completed and 115 resulted in hiring lists within 60 days. In FY14, there were 98 exams completed and 91 resulted in hiring lists within 60 days. Staff completed 19 more recruitments than in FY14 and the percent resulting in hiring lists rose from 93 percent to 98 percent. The District tracks the diversity of candidates considered for employment to determine if recruitment efforts are attracting sufficiently diverse qualified candidates. In FY15, the AA Opportunity Rate (the percentage of qualified underutilized candidates of the total qualified candidates considered during the hiring interviews) was 60 percent which was similar to the FY14 rate of 61 percent, and greater than the FY13 rate of 49 percent. This KPI does not
19
measure the diversity of candidates actually hired. We report performance on this measurement, but do not set targets.
Employee Development: The percentage of competing leadership program graduates placed on applicable promotional lists measures the effectiveness of our various developmental academies (e.g., LEAD and Pathways). During FY15, 74 percent of the 50 academy applicants scored as eligible on promotional lists.
The annual average number of training hours per employee is a common indicator benchmarked by other employers. For example, the American Society for Training and Development reports an average of 28 hours per year per employee among organizations surveyed, and an average of 38 hours per year per employee for Best Practice Organizations. The FY11 - FY15 five-year average was 25 hours annual training per employee, down from last year’s average of 28.5 hours. The reduction was in general training hours during this five-year period, and was a result of a strategy to contain non-mandatory training costs during difficult fiscal years. However, the number of regulatory compliance and technical training hours has remained constant during this time. The FY16 – FY17 budget includes additional funding for training.
Performance Planning & Appraisal: This KPI is measured by the percent of employees with performance plans and appraisals completed within the past 13 months. In FY15, 98.7 percent of employees had a current performance plan, which is similar to FY14 when 98.6 percent had a current plan. In FY15, 98.5 percent of employees had a current performance appraisal, which is similar to FY14 when 98.4 percent had a current appraisal.
Employee Retention: The Employee Injury and Illness Lost Time Incidence Rate is a measurement used by OSHA and the Bureau of Labor Statistics to show the number of job-related injuries and illnesses that result in one or more lost workdays by employees. For FY15, the Lost Time Incidence Rate was 1.8 (there were 27 lost time injuries recorded during the year) which was lower than the FY14 rate of 2.2, and the FY13 rate of 2.1.
A new indicator for FY15 is wellness campaigns for employees. We initially rolled out Well Being at our September 2014 Health Fair with smoothie making bike blenders. Campaigns also included urging employees to take care during the holidays, health topics for men in honor of men’s health month, and wearable devices and apps for tracking exercise and food which included bringing in a sports nutritionist.
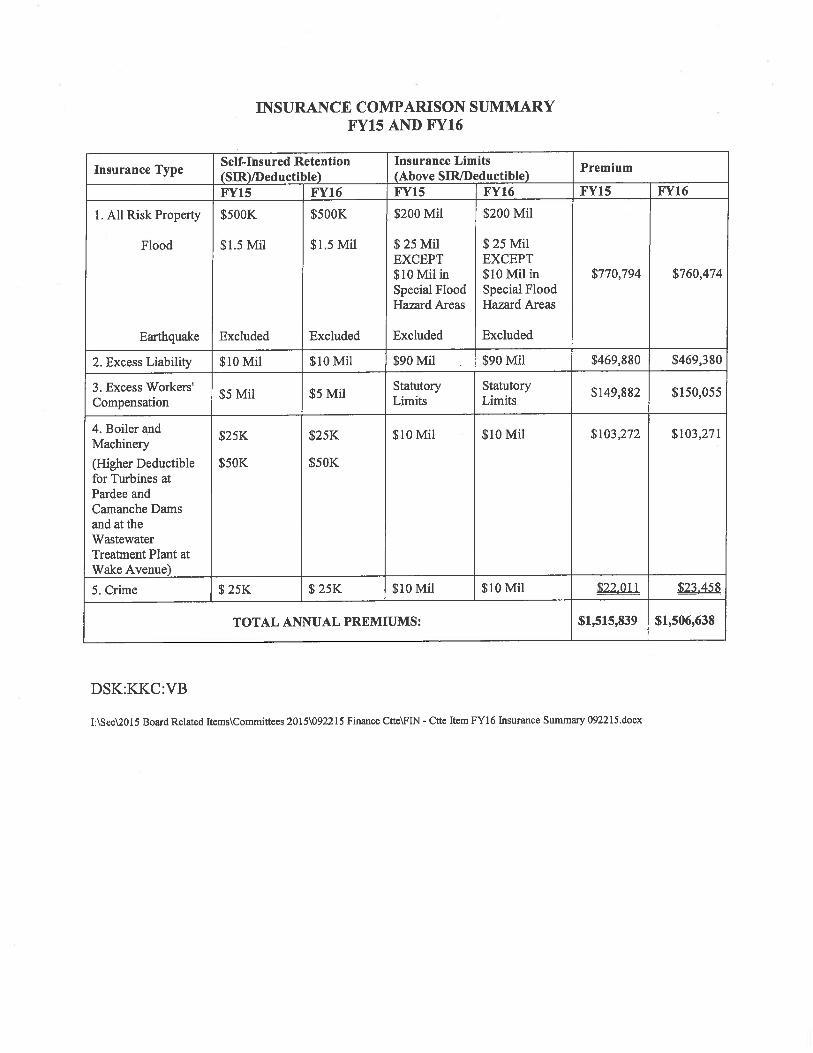


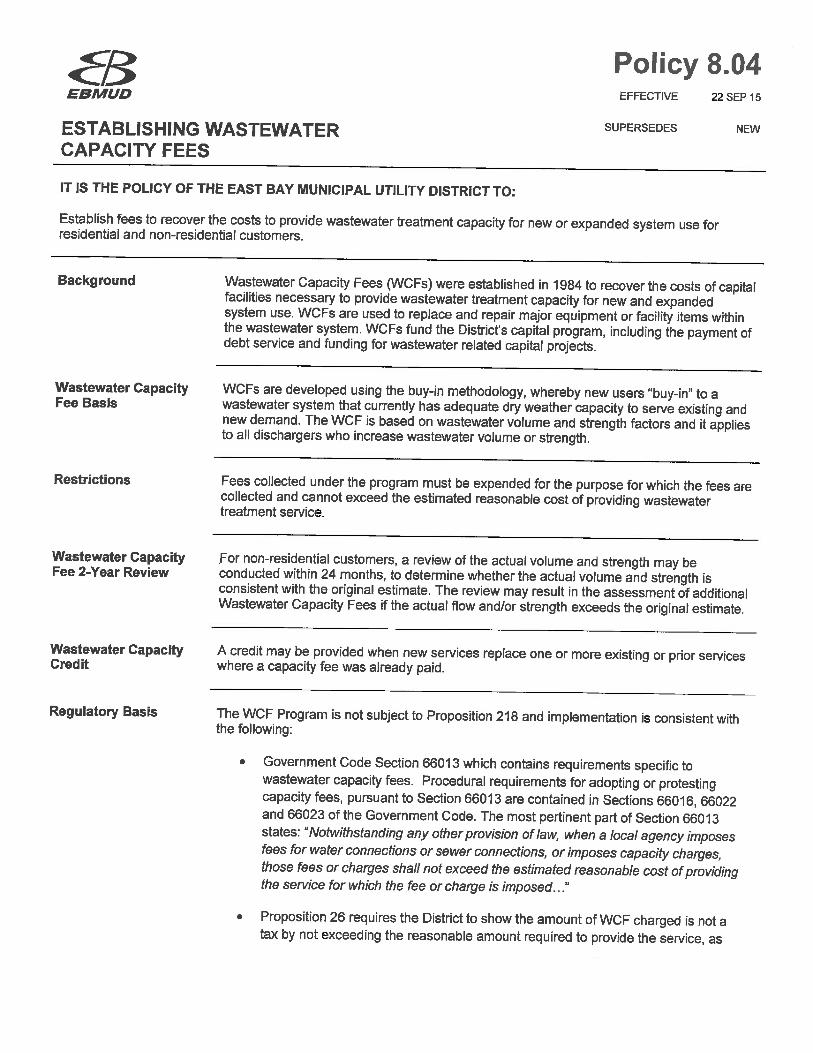
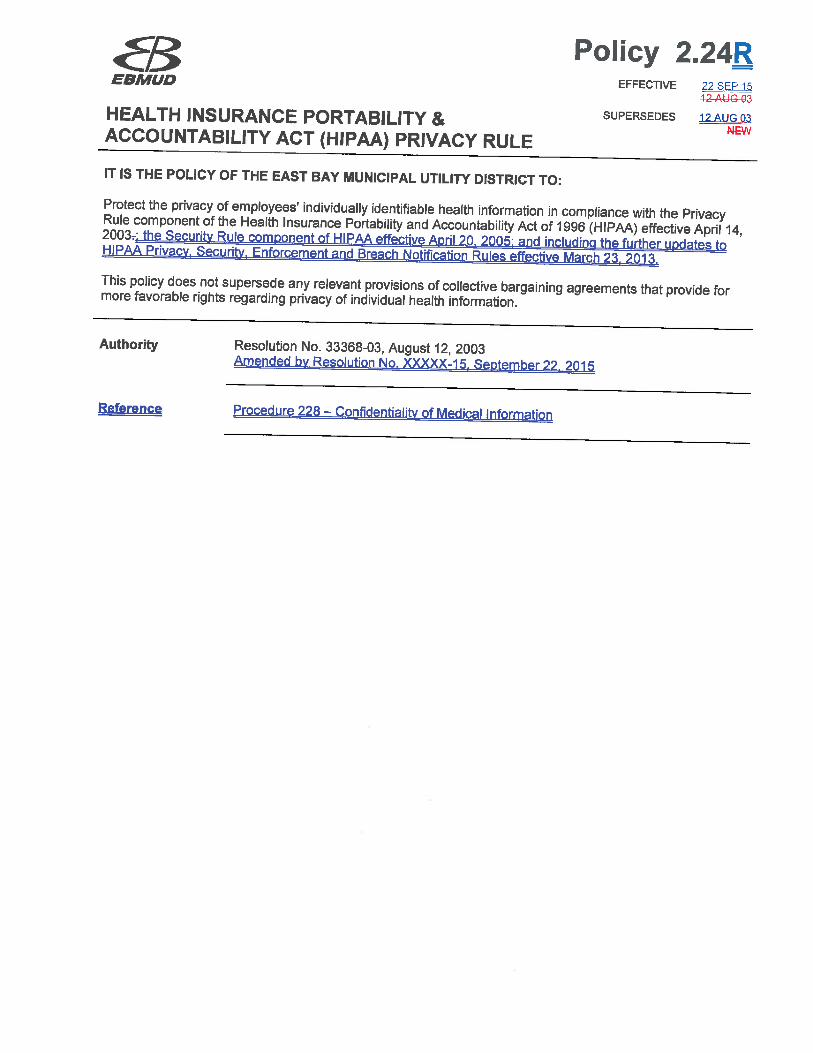
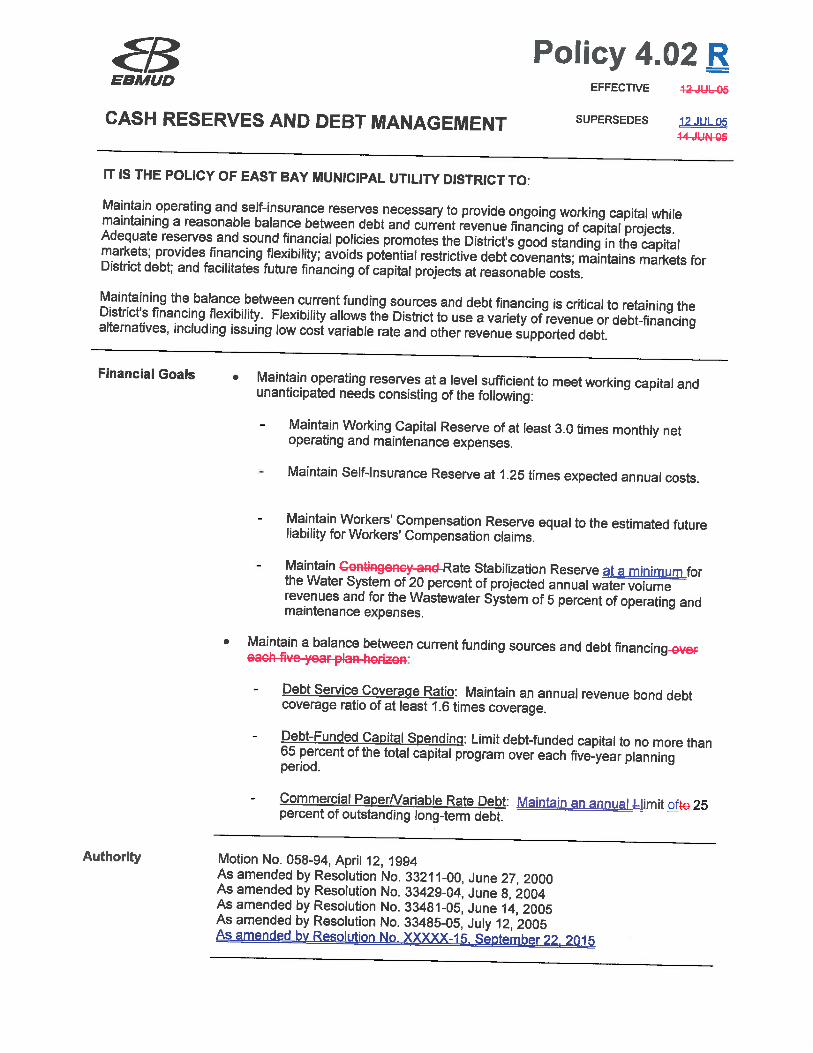
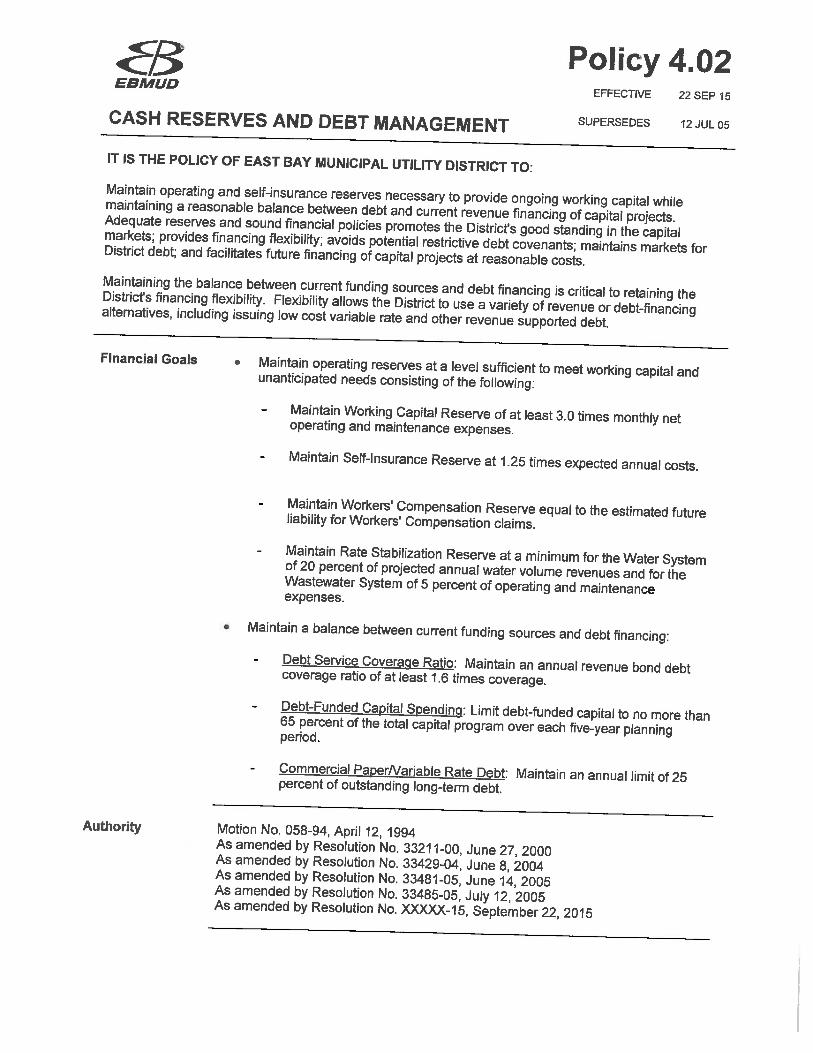


4NEdwin M. Lee
I SFEnvironment Mayor
Our home. Our city. Our planet. Deborah 0. RaphaelA Deportment of the City and County of Son Francisco Director
September 8, 2015
Alexander R. CoateGeneral ManagerEast Bay Municipal Utility DistrictP.O Box 24055, MS 804Oakland, CA 94623-1055
Re: Organics Diversion Program Collaboration
Dear Mr. Coate:
Thank you for your continued interest and partnership on programs to divert and digest discarded organics fromthe City and County of San Francisco. San Francisco continues to be interested to further develop ourrelationship with the East Bay Municipal Utility District (EBMUD) for the diversion of organics for anaerobicdigestion at your wastewater treatment plant.
EBMUD’s efforts and San Francisco’s goals are clearly aligned. In 2002, the City of San Francisco adopted apolicy committing to a goal of 75% landfill diversion by 2010 and zero waste by 2020. Increasing diversionand pursuing zero waste achieves three key sustainability goals:
I) Conserves valuable resources2) Reduces environmental impacts, such as climate change and pollution3) Creates green jobs
Part of San Francisco’s zero waste policy is the promotion of higher and better uses of discarded materials.Anaerobic digestion and renewable energy generation from organic materials through EBMUD’s ResourceRecovery Program and subsequent returning of the residual organics to the soil, fit into promoting higher andbetter uses of discarded organics. We appreciate the partnership that we have fostered with EBMUD, along withour service provider Recology, to further our mutual goals over the past ten years. The steps EBMUD iscommitting to in the next phase of its Resource Recovery Program are in alignment with San Francisco’s goals.
In San Francisco, we pride ourselves on our leading efforts toward zero waste. We have made significantprogress, such as achieving our 2010 goal, but there is still much work to do towards our zero waste goal.Diversion of the remaining organics from the mixed solid waste stream represents a key next stop towardsgetting to zero waste. We are excited about the Anaergia press technology that EBMUD and Recology haveidentified for extruding organics from the waste stream for digestion, and we look forward to expansion of this“urban organics” digestion program as the technology is proven for EBMUD and San Francisco.
We are pleased to hear of EBMUD’s plan to refine biogas generated from San Francisco’s urban organics intocompressed natural gas (CNG) for vehicle fuel. We are excited about the opportunity to fill Recology or Citytrucks with fuel derived from the City’s organic discards, in what is truly a sustainable loop and a model forother communities.
Son Francisco Deportment of the Environment1455 Market Street, Suite 1200, San Francisco, CA 94103Telephone: (415) 355.3700 • Fax: (415) 554-6393
Email: [email protected] • SFEnvironment.org Printed onlOO% post-consumer recycled paper.
Attachment
We also understand that EBMUD is also designing infrastructure that would allow the segregated digestion ofsource separated organics from digestion of municipal biosolids. This dedicated digestion could provide theopportunity for digestion of source separated food scraps, primarily from commercial generators or CommercialSource Separated Orgariics (CSSO), to create a high quality organic digestate product that can be used to buildhealthier soils, such as in being used as a organic certified compost feedstock.
EBMUD’s location —just across the bay bridge — makes it a great partner for sustainable organics managementand San Francisco appreciates the opportunity to partner with a neighboring public agency to further our mutualgoals. Recology collects over 650 tons per day of source separated organics from San Francisco including about400 tons per day of CSSO. EBMUD’s anaerobic digestion program creates opportunities for utilizing theseorganics to a higher and better use through generation of renewable energy and organic fertilizer products. Weare, therefore, interested in exploring a long-term partnership to continue our collaboration on sending SanFrancisco organics to EBMUD.
Assuming the proposed urban organics project is successful, we are interested investigating opportunities tosend additional organics to EBMUD for digestion. This includes expanding the urban organics program, andevaluating sending CSSO to EBMUD once your plant is able to separately digest those materials to create ahigh quality digestate product suitable for compost. We look forward to a continued partnership with EBMUDon organics projects to further increase landfill diversion, reduce greenhouse gas generation, and increaserenewable energy production and use.
Sincerely,
Deborah 0. RaphaelDirector
+