on-board diagnostics (obd) program overview
TRANSCRIPT
•1
On-Board Diagnostics (OBD) Program Overview
California Air Resources Board
Allen Lyons
April 2015 Mexico City
•2
Presentation Outline oOBD History and
Background oOBD Requirements oOBD Certification oOBD Enforcement oOBD and Smog Check
Certification
Enforcement
Regulations

•3
OBD II Regulation - History
• Adopted by Air Resources Board in 1989 o Implementation began in 1994 o Full Implementation achieved in 1996 o Over 150 million OBD II-equipped vehicles operating in the
United States today • Vehicle Applications (< 14,000 pounds)
o Passenger cars o Light-duty trucks o Medium-duty vehicles and engines
• OBD requirements adopted for heavy-duty vehicles in 2005 (HD OBD, > 14,000 pounds) o Full implementation in 2013

•4
Keeping In-use Cars and Trucks Clean
• Low emission vehicles depend on numerous and complex emission controls to clean up a dirty combustion process o Emission solutions are increasingly complex
• Malfunctions can increase emissions to many times the certification standards o Deterioration o Improper maintenance o Manufacturing defects o Tampering
•5
On-Board Computer • Modern vehicles use on-board computers
o Control fuel metering (fuel injection) o Actuate EGR and purge valves, etc. o Regulate anti-lock braking o Control transmission
• OBD II is an extension of the computer
•6
What is On-Board Diagnostics?
• A system in the engine’s on-board computer that monitors the performance of almost every emission-related components for malfunctions
• Uses information from sensors to judge
performance of emission controls o Sensors do not directly measure emissions
• Mostly software that runs diagnostics in the background
•7
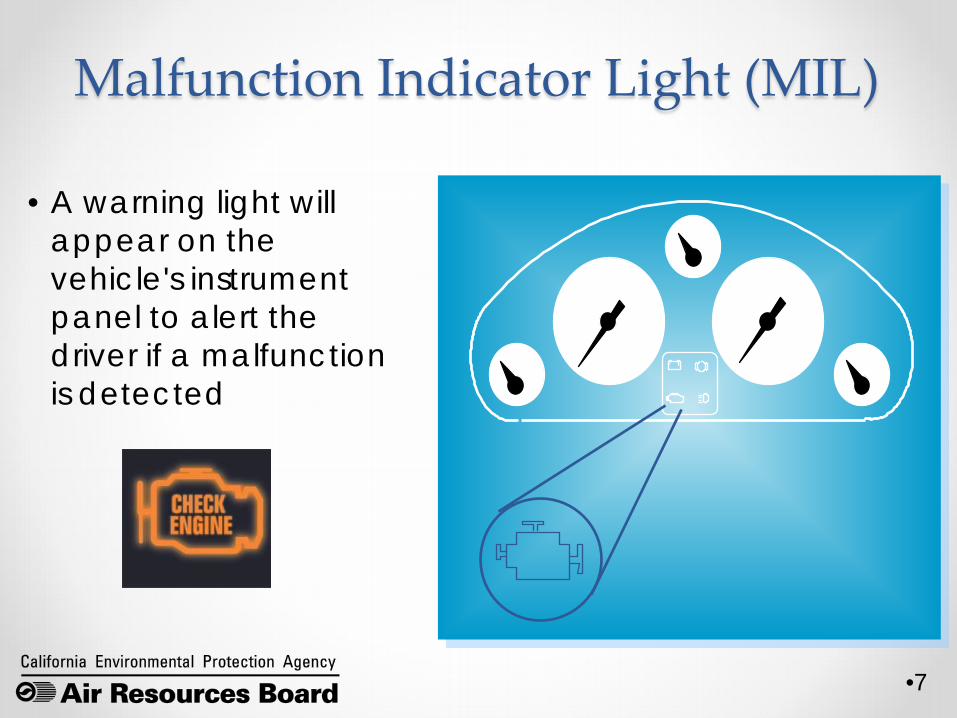
Malfunction Indicator Light (MIL)
•A warning light will appear on the vehicle's instrument panel to alert the driver if a malfunction is detected
•8
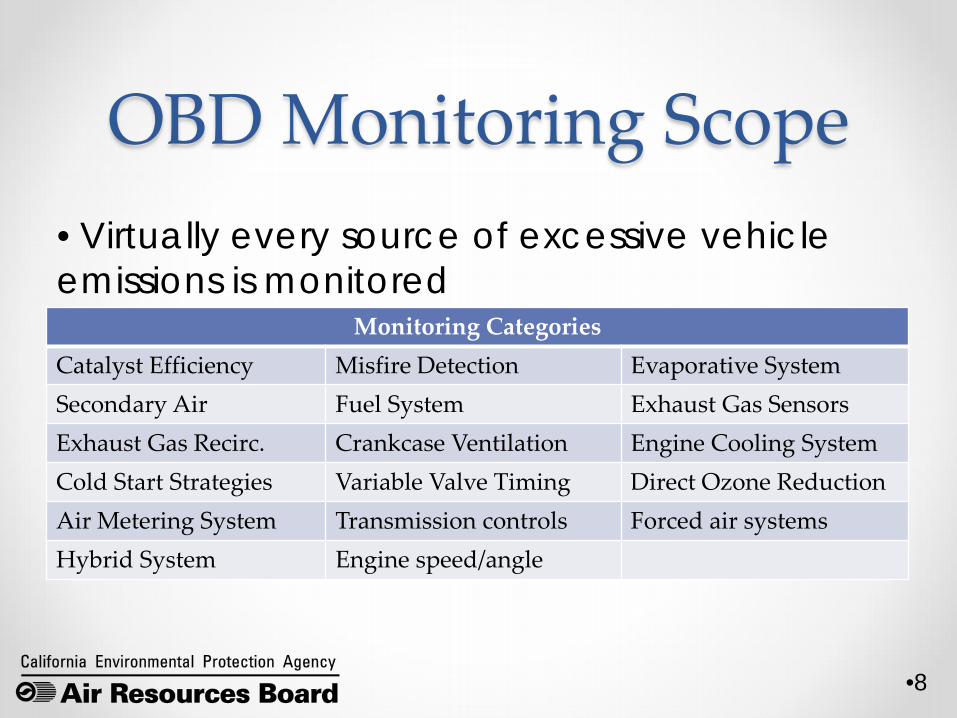
OBD Monitoring Scope
Monitoring Categories Catalyst Efficiency Misfire Detection Evaporative System Secondary Air Fuel System Exhaust Gas Sensors Exhaust Gas Recirc. Crankcase Ventilation Engine Cooling System Cold Start Strategies Variable Valve Timing Direct Ozone Reduction Air Metering System Transmission controls Forced air systems Hybrid System Engine speed/angle
• Virtually every source of excessive vehicle emissions is monitored
•9
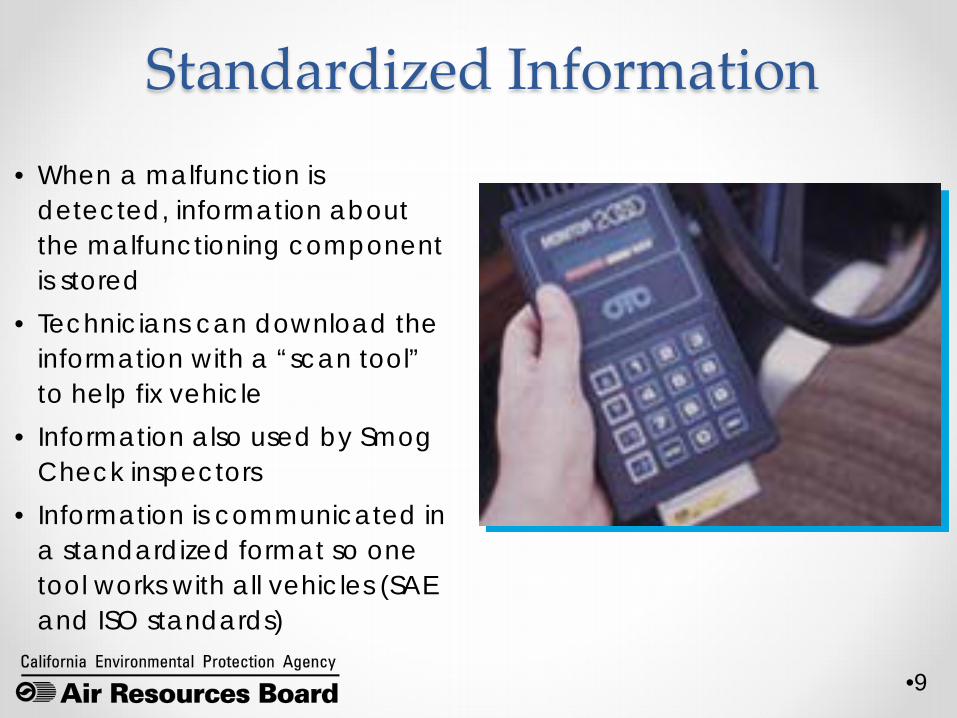
Standardized Information • When a malfunction is
detected, information about the malfunctioning component is stored
• Technicians can download the information with a “scan tool” to help fix vehicle
• Information also used by Smog Check inspectors
• Information is communicated in a standardized format so one tool works with all vehicles (SAE and ISO standards)
•10
Why Is OBD Needed?
• Maintain Emission Control Systems In-Use o Deterioration with age o Oldest 20% of vehicles cause 60% of pollution
• Help Technicians Properly Diagnose and Repair Complex Problems
•11
Other Benefits of OBD • Encourages design of durable and robust emission
control systems • Helps keep emissions low by identifying emission controls
in need of repair
• Provides for effective/inexpensive emission inspections
• Works for life of the vehicle
•12
Durable Components • Cause of MIL Subject to Emissions Warranty
o 3 Year / 50,000 miles (EGR, O2, etc.)
o 7 Year / 70,000 miles (catalyst, computer)
o 15 Year / 150,000 miles for PZEV
• Durability Less Expensive than Replacement
•13
Consumer Cost Benefits
• Early Detection of Malfunctions o Prevent secondary malfunctions (e.g., detect misfire before catalyst
damaged) o Marginal components replaced during warranty
• Eliminates Unnecessary Repairs o Fault codes and other scan tool data give information about area of
malfunction or the specific component o Contrast: tailpipe test simply identifies high emissions, but not fault
information, repairs are often trial and error
•14
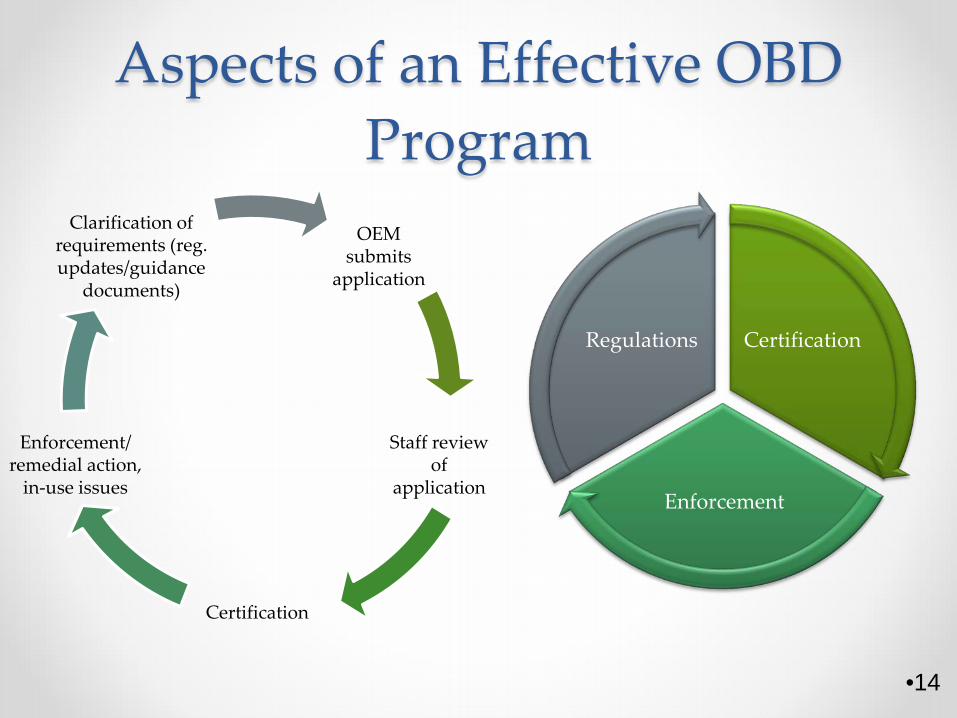
Aspects of an Effective OBD Program
Certification
Enforcement
Regulations
OEM submits
application
Staff review of
application
Certification
Enforcement/ remedial action,
in-use issues
Clarification of requirements (reg. updates/guidance
documents)
•15
Amendments • The regulation has often been amended to improve
effectiveness and to accommodate new vehicle technologies
• Adopted 1989 • Amended in 1991, 1994, 1996, 2002, 2006, 2015 • Other minor amendments through other
rulemakings • Rulemakings Available on the ARB OBD website:
http://www.arb.ca.gov/msprog/obdprog/obdregs.htm
•16
OBD Requirement Concepts • Emission threshold monitoring
o Malfunction Indicator Light on when emissions increase X% o Usually based on 1.5 x standards o 8-20 per vehicle
• Non- emission threshold monitoring o Comprehensive components o Functional, rational, electrical o 75-200 diagnostics per vehicle
• Standardization Requirements o Information OBD system required to store
• OBD testing and validation o Pre- and post-production; by vehicle manufacturer
•17
Basic OBD Diagnostic Procedure
• System waits for right monitoring conditions • Observes Signals Entering the Computer
o Directly from the component/system, or o Related to performance of component/system
• Verifies Peformance /Functionality / Rationality o Malfunction criteria
• Notifies Driver of Fault o MIL illumination o Unique fault code storage o Freeze frame information
•18
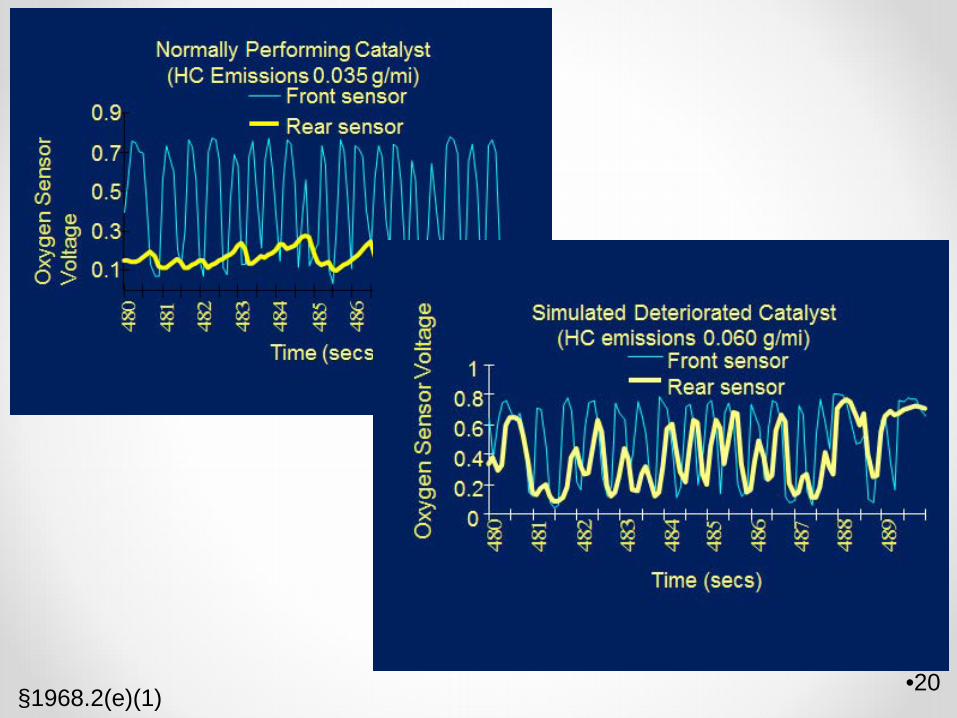
Example of how OBD works: Catalyst Monitoring
• Oxygen sensor data used to evaluate catalyst conversion performance
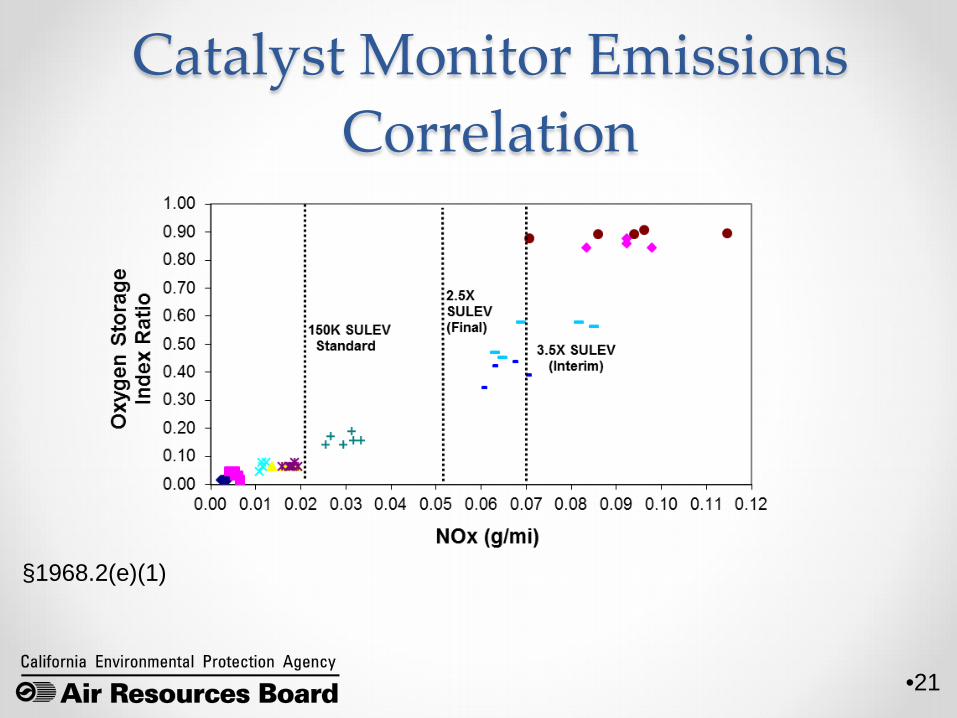
• Manufacturer correlates tailpipe emissions with catalyst system performance based on oxygen sensor data.
• OBD system is calibrated to turn on MIL and store fault information for the catalyst when performance drops to the point where emissions exceed malfunction threshold (1.75 X HC or NOx standard)
•19
•RICH
•LEAN
•RICH
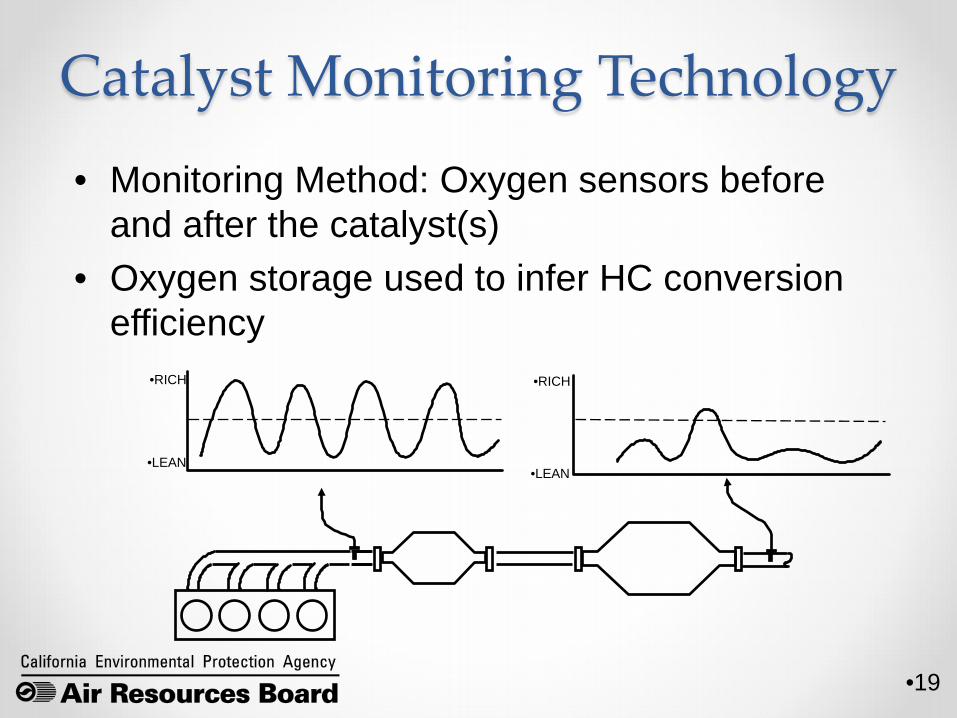
• Monitoring Method: Oxygen sensors before and after the catalyst(s)
• Oxygen storage used to infer HC conversion efficiency
•LEAN
Catalyst Monitoring Technology
•20
•20
§1968.2(e)(1)
•21
Catalyst Monitor Emissions Correlation
§1968.2(e)(1)
•22
Certification • Vehicle manufacturer required to submit
certification application for review and approval. Application includes: o Detailed specifications for all monitors in format prescribed in
regulation o Demonstration emission test data o Any other information/diagrams/data used to support OBD
system
• ARB Mail-Out #06-23 http://www.arb.ca.gov/msprog/obdprog/obdupdates.htm
•23
Certification • Require detailed disclosure of strategies at the time
of certification • Careful review of trained engineers to understand
and look for loopholes/shortcomings o OBD certification engineers need to understand OBD
system nearly as well as the manufacturer engineers o Needed for effective certification and enforcement
• Ability to still get certified and sell with shortcomings but require correction for future model years o Deficiencies are important part of successful program
• Reasonable amount of data included to support compliance of system (e.g., demonstration data)
•24
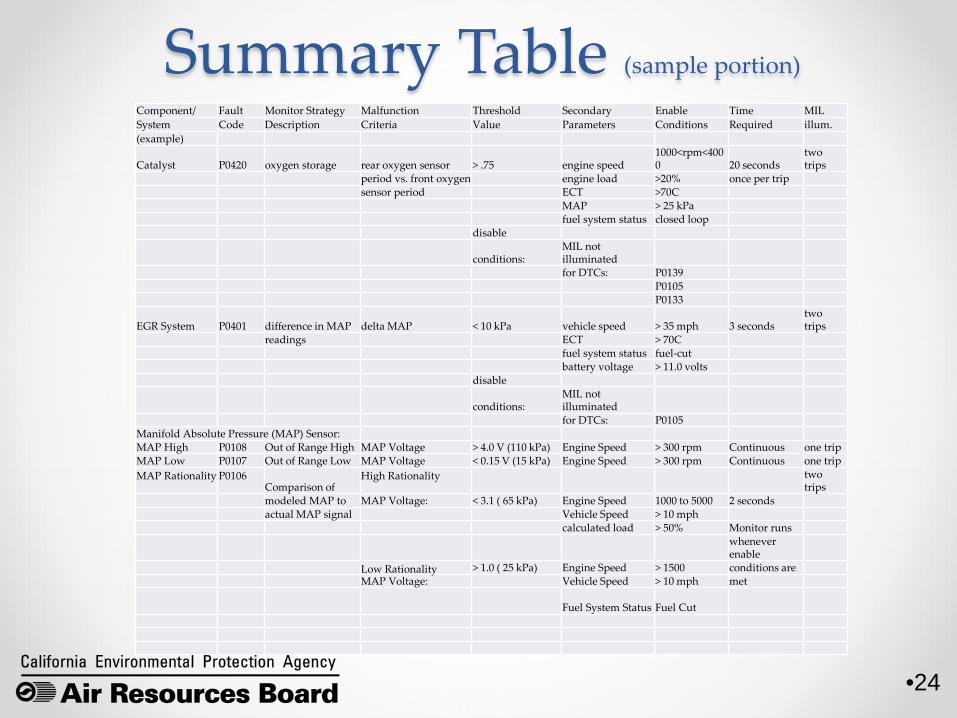
Summary Table (sample portion)
Component/ Fault Monitor Strategy Malfunction Threshold Secondary Enable Time MIL System Code Description Criteria Value Parameters Conditions Required illum. (example)
Catalyst P0420 oxygen storage rear oxygen sensor > .75 engine speed 1000<rpm<4000 20 seconds
two trips
period vs. front oxygen engine load >20% once per trip sensor period ECT >70C MAP > 25 kPa fuel system status closed loop disable
conditions: MIL not illuminated
for DTCs: P0139 P0105 P0133
EGR System P0401 difference in MAP delta MAP < 10 kPa vehicle speed > 35 mph 3 seconds two trips
readings ECT > 70C fuel system status fuel-cut battery voltage > 11.0 volts disable
conditions: MIL not illuminated
for DTCs: P0105 Manifold Absolute Pressure (MAP) Sensor: MAP High P0108 Out of Range High MAP Voltage > 4.0 V (110 kPa) Engine Speed > 300 rpm Continuous one trip MAP Low P0107 Out of Range Low MAP Voltage < 0.15 V (15 kPa) Engine Speed > 300 rpm Continuous one trip MAP Rationality P0106
Comparison of High Rationality
two trips
modeled MAP to MAP Voltage: < 3.1 ( 65 kPa) Engine Speed 1000 to 5000 2 seconds actual MAP signal Vehicle Speed > 10 mph calculated load > 50% Monitor runs
whenever enable
Low Rationality > 1.0 ( 25 kPa) Engine Speed > 1500 conditions are MAP Voltage: Vehicle Speed > 10 mph met
Fuel System Status Fuel Cut
•25
In-Use Compliance • Key to ensuring as-built cars actually match
design/certification. • Does OBD system work as described by
manufacturer? If not, find out why. • Combination of manufacturer self-testing and
agency testing • Divided into distinct regions to focus on areas where
problems have previously been found

•26
Compliance Testing: Manufacturer Self-Testing
• Demonstration Testing o Shows that malfunctions are detected before emissions exceed
thresholds (e.g., 1.5 X emission standards)
• Communication standardization via J1699 o Makes sure that production vehicles properly
handle/communicate required information through datalink
• Diagnostic function o Manufacturers have to implant faults and verify detection on
production vehicles
• IUMPR - In-use Monitor Performance Ratios o Tracks how frequently monitors really run on the road. Data
reported to ARB for review.
•27
Compliance Testing Agency Enforcement Testing
• Confirmatory testing of demonstration vehicles o ARB duplicates testing to verify that malfunctions are detected before
emissions exceed threshold levels (e.g., 1.5 x standards)
• Actual in-use vehicle testing by engineers with implanted faults, dyno and on-road driving, data logging. o Do the monitors run when they are supposed to? o Do they detect malfunctions that are implanted? o Is the right data stored when a malfunction is detected? o .. And so on.
•28
Enforcement: Remedial Action • Criteria to determine appropriate remedial
action in enforcement regulations
• Remedial action varies from nothing up to recall and fines o Field fix software o Service bulletin o Notification to OBD clearinghouse:
http://obdclearinghouse.com/
• Mandatory recall if a major monitor is non-functional, or if defect prevents I/M testing
•29
Background: OBD II and I/M
• OBD II designed from the beginning as an I/M Tool o Comprehensive monitoring requirements o Fault thresholds based on emission standards
• Readiness Indicators
•30
OBD Based I/M Procedure 1. Does the MIL work? (Key on engine off) 2. Is the vehicle ready for an inspection?
No recent code clearing
3. Is the MIL commanded off? If YES to all 3: PASS If NO, remedy as necessary:
Fix MIL lamp or wiring Conduct more in-use driving and return for re-inspection Fix detected fault and return for re-inspection
•31
Benefits over Tailpipe I/M • More comprehensive fault detection
o All emission-related components individually monitored
o Cold start problems detected o Evaporative emission problems detected o Broad in-use testing conditions o OBD failure rates 2.5X ASM failure rates
• Convenience o Faster (less than 5 minutes) o No surprises (MIL off = pass, unless recently serviced) o Less expensive
•32
Pre-Inspection Benefits • Most detected faults are addressed before
Inspection • Failure rates / Benefits much higher than Smog
Check database would indicate • Data indicates that benefits may be 3 times as high
as indicated by Smog Check failure rate.
•33
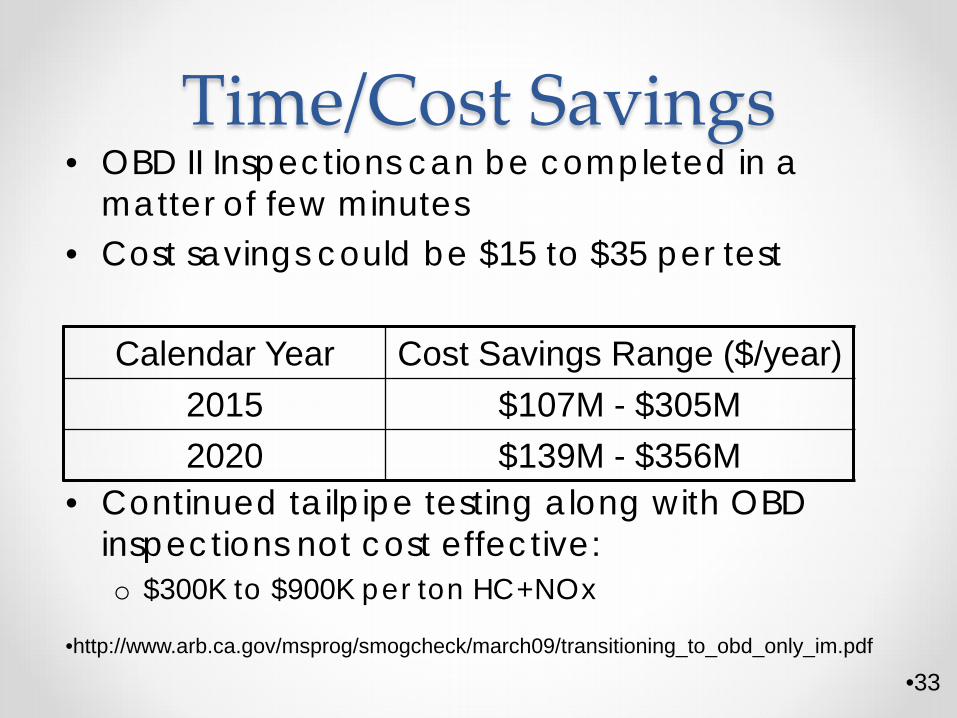
Time/Cost Savings • OBD II Inspections can be completed in a
matter of few minutes • Cost savings could be $15 to $35 per test
• Continued tailpipe testing along with OBD inspections not cost effective: o $300K to $900K per ton HC+NOx
Calendar Year Cost Savings Range ($/year) 2015 $107M - $305M 2020 $139M - $356M
•http://www.arb.ca.gov/msprog/smogcheck/march09/transitioning_to_obd_only_im.pdf
•34
Fraud Detection
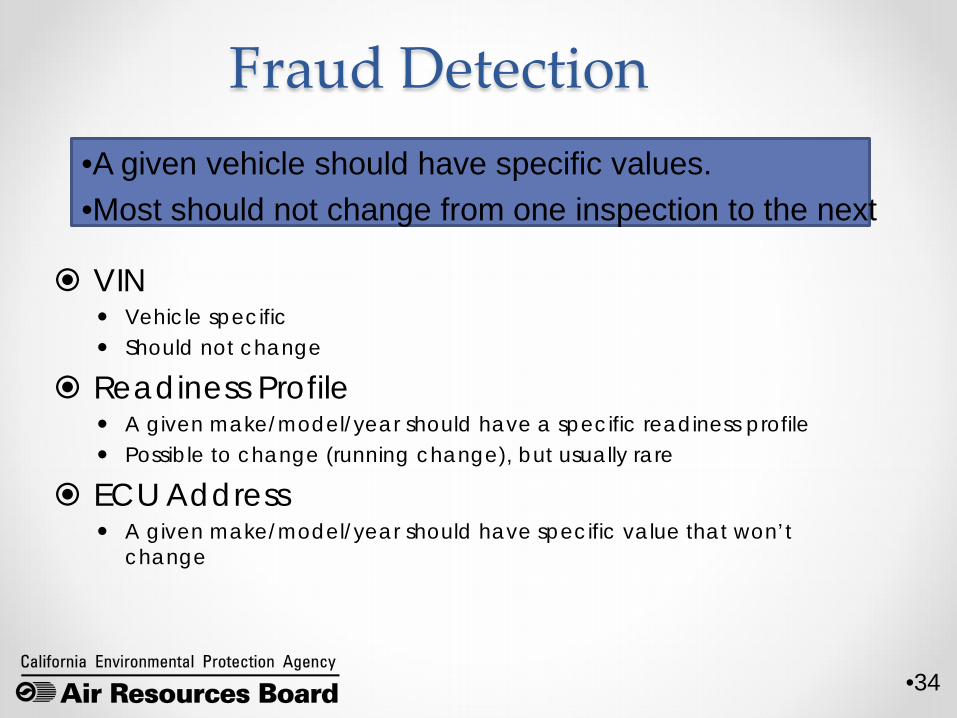
VIN Vehicle specific Should not change
Readiness Profile A given make/model/year should have a specific readiness profile Possible to change (running change), but usually rare
ECU Address A given make/model/year should have specific value that won’t
change
•A given vehicle should have specific values. •Most should not change from one inspection to the next

•35
More “Fingerprinting” Data Cal ID / CVN
Combinations are make/model/year specific. May change (field fixes), but still make/model/year specific
Communication Protocol Shouldn’t change Mostly useful for older vehicles
○ (all newer vehicles use same protocol)
Supported Parameter IDs (PID Count) Calculated value based on the types of data the vehicle supports Careful implementation necessary to ensure calculations are
consistent
•36
Readiness Indicators • Show whether or not major monitors have run since
computer memory was last clear. • When the indicators are “ready”, it means that the
OBD system is ready for inspection • When too many indicators are “not ready”, faults
could exist that haven’t been detected yet by the OBD system
• If the emission control is not on the vehicle (e.g., secondary air), the readiness indicator status will be “unsupported”, which is functionally equivalent to “ready”
•37
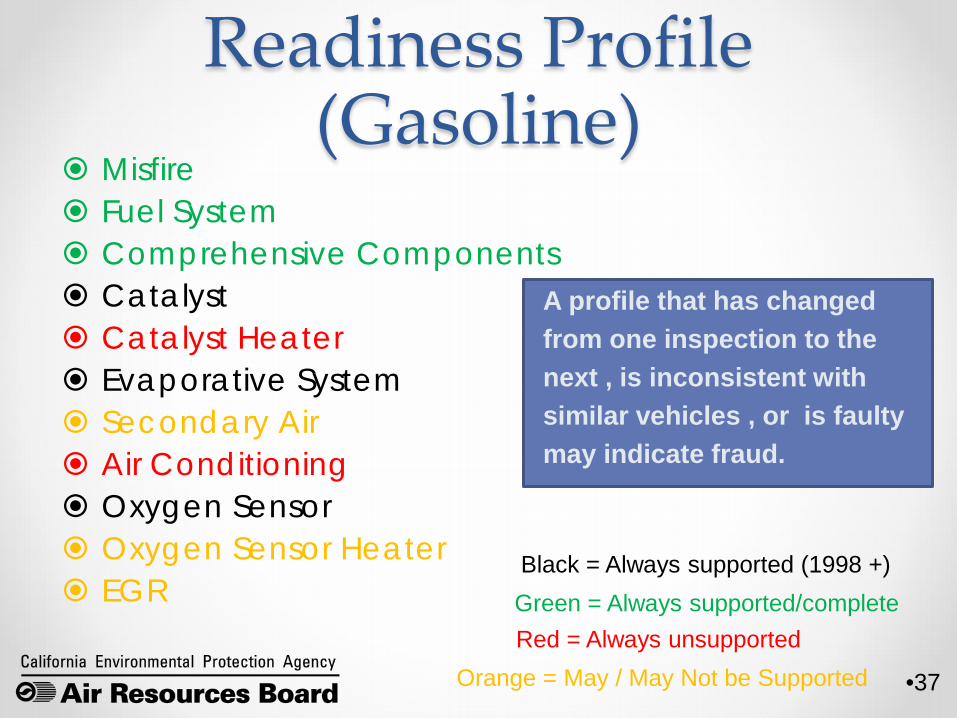
Readiness Profile (Gasoline)
Misfire Fuel System Comprehensive Components Catalyst Catalyst Heater Evaporative System Secondary Air Air Conditioning Oxygen Sensor Oxygen Sensor Heater EGR Green = Always supported/complete
Red = Always unsupported
Black = Always supported (1998 +)
Orange = May / May Not be Supported
A profile that has changed from one inspection to the next , is inconsistent with similar vehicles , or is faulty may indicate fraud.
•38
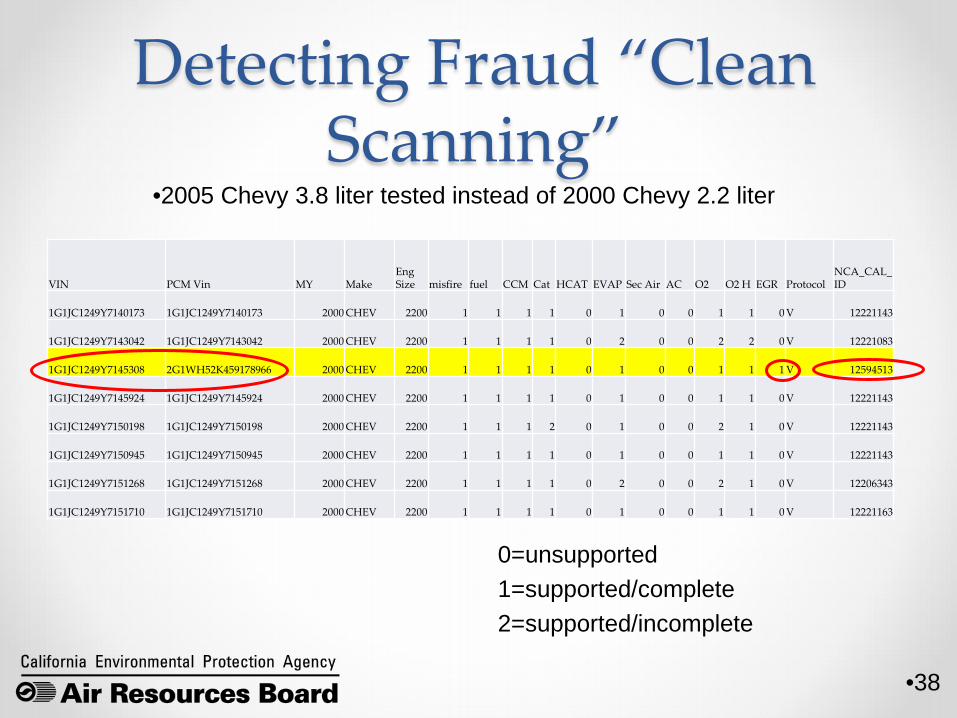
Detecting Fraud “Clean Scanning”
VIN PCM Vin MY Make Eng Size misfire fuel CCM Cat HCAT EVAP Sec Air AC O2 O2 H EGR Protocol
NCA_CAL_ID
1G1JC1249Y7140173 1G1JC1249Y7140173 2000 CHEV 2200 1 1 1 1 0 1 0 0 1 1 0 V 12221143
1G1JC1249Y7143042 1G1JC1249Y7143042 2000 CHEV 2200 1 1 1 1 0 2 0 0 2 2 0 V 12221083
1G1JC1249Y7145308 2G1WH52K459178966 2000 CHEV 2200 1 1 1 1 0 1 0 0 1 1 1 V 12594513
1G1JC1249Y7145924 1G1JC1249Y7145924 2000 CHEV 2200 1 1 1 1 0 1 0 0 1 1 0 V 12221143
1G1JC1249Y7150198 1G1JC1249Y7150198 2000 CHEV 2200 1 1 1 2 0 1 0 0 2 1 0 V 12221143
1G1JC1249Y7150945 1G1JC1249Y7150945 2000 CHEV 2200 1 1 1 1 0 1 0 0 1 1 0 V 12221143
1G1JC1249Y7151268 1G1JC1249Y7151268 2000 CHEV 2200 1 1 1 1 0 2 0 0 2 1 0 V 12206343
1G1JC1249Y7151710 1G1JC1249Y7151710 2000 CHEV 2200 1 1 1 1 0 1 0 0 1 1 0 V 12221163
•2005 Chevy 3.8 liter tested instead of 2000 Chevy 2.2 liter
0=unsupported 1=supported/complete 2=supported/incomplete
•39
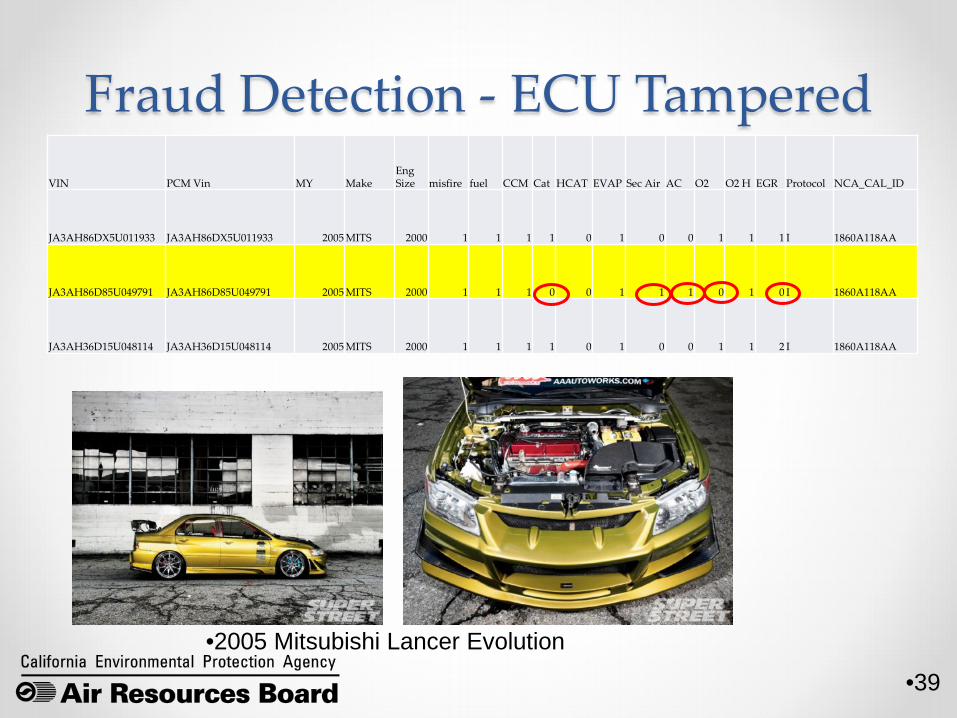
Fraud Detection - ECU Tampered VIN PCM Vin MY Make
Eng Size misfire fuel CCM Cat HCAT EVAP Sec Air AC O2 O2 H EGR Protocol NCA_CAL_ID
JA3AH86DX5U011933 JA3AH86DX5U011933 2005 MITS 2000 1 1 1 1 0 1 0 0 1 1 1 I 1860A118AA
JA3AH86D85U049791 JA3AH86D85U049791 2005 MITS 2000 1 1 1 0 0 1 1 1 0 1 0 I 1860A118AA
JA3AH36D15U048114 JA3AH36D15U048114 2005 MITS 2000 1 1 1 1 0 1 0 0 1 1 2 I 1860A118AA
•2005 Mitsubishi Lancer Evolution
•40
Continuous Testing Also known as “OBD III” or “Remote OBD” Vehicle OBD system status is
periodically/continuously transmitted and recorded Vehicles without problems don’t have to be
inspected If a vehicle has a malfunction, the owner addresses
it within a reasonable period of time.
•41
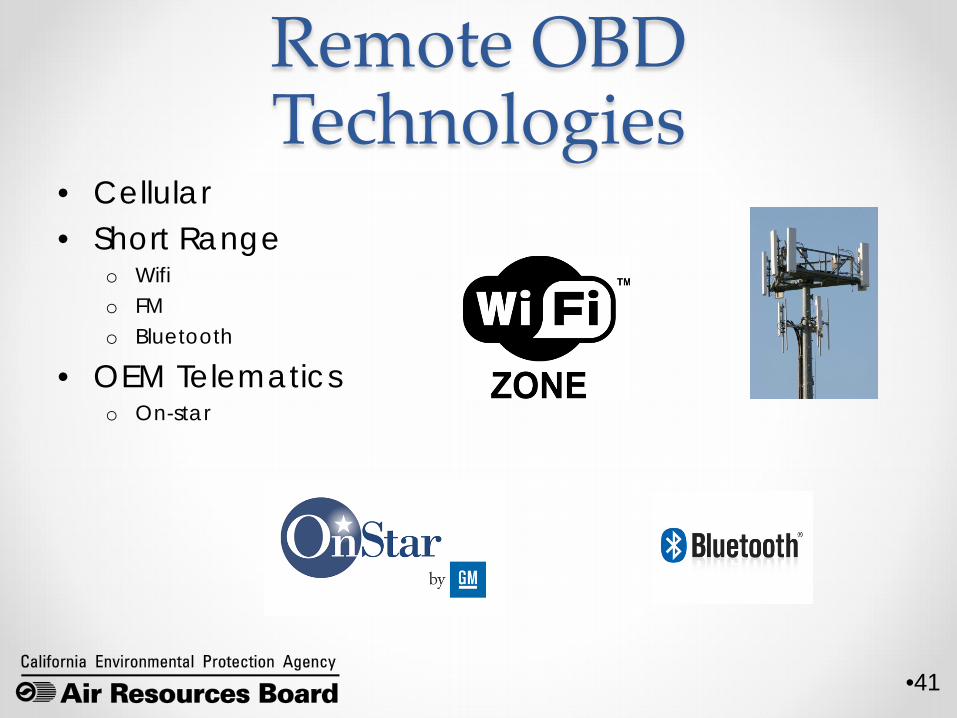
Remote OBD Technologies
• Cellular • Short Range
o Wifi o FM o Bluetooth
• OEM Telematics o On-star
•42
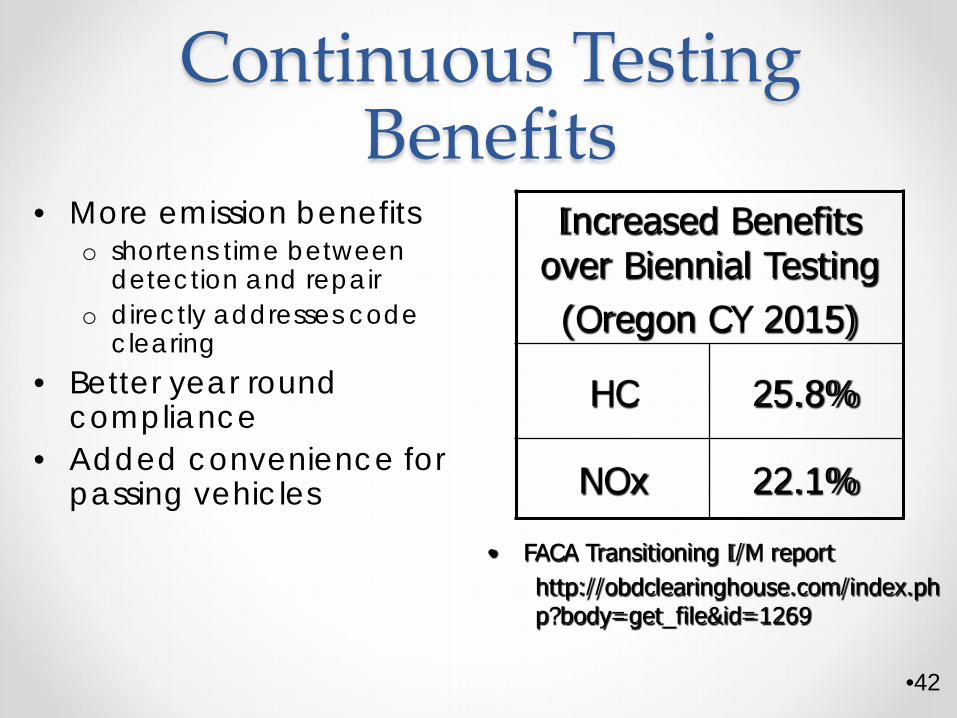
Continuous Testing Benefits
• More emission benefits o shortens time between
detection and repair o directly addresses code
clearing • Better year round
compliance • Added convenience for
passing vehicles
Increased Benefits over Biennial Testing (Oregon CY 2015)
HC 25.8%
NOx 22.1%
• FACA Transitioning I/M report http://obdclearinghouse.com/index.php?body=get_file&id=1269
•43
Continuous Testing Status • Some pilot programs have taken place, but no
widespread implementation yet • Program start up costs • Privacy issues