om location layout
DESCRIPTION
operations serivceTRANSCRIPT
Operations Management
Location and Layout Strategies
OM - location and layout strategy
Objective of Location Strategy
Maximize the benefit of location to the firm
OM - location and layout strategy
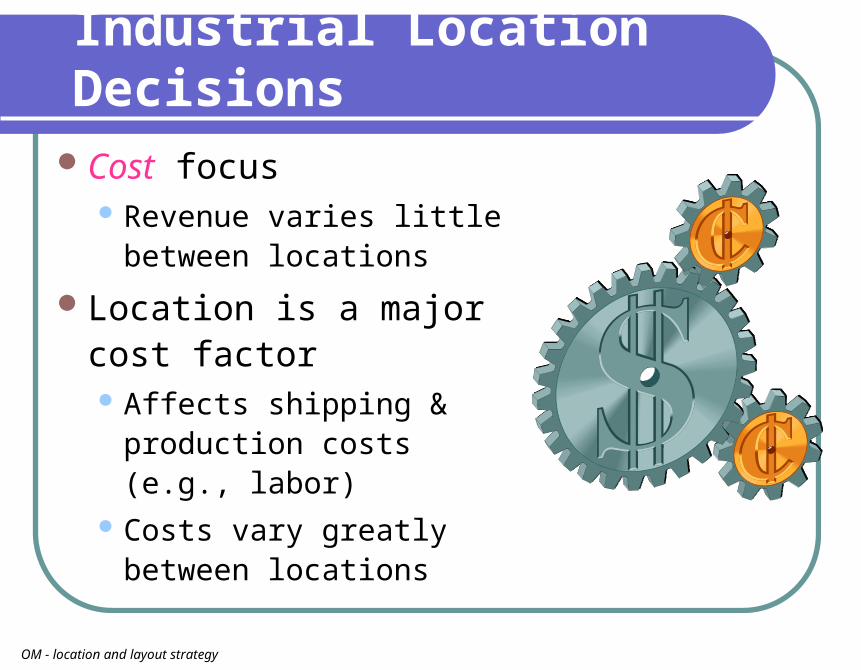
Industrial Location Decisions
Cost focus Revenue varies little
between locations
Location is a major cost factor Affects shipping &
production costs (e.g., labor)
Costs vary greatly between locations
OM - location and layout strategy
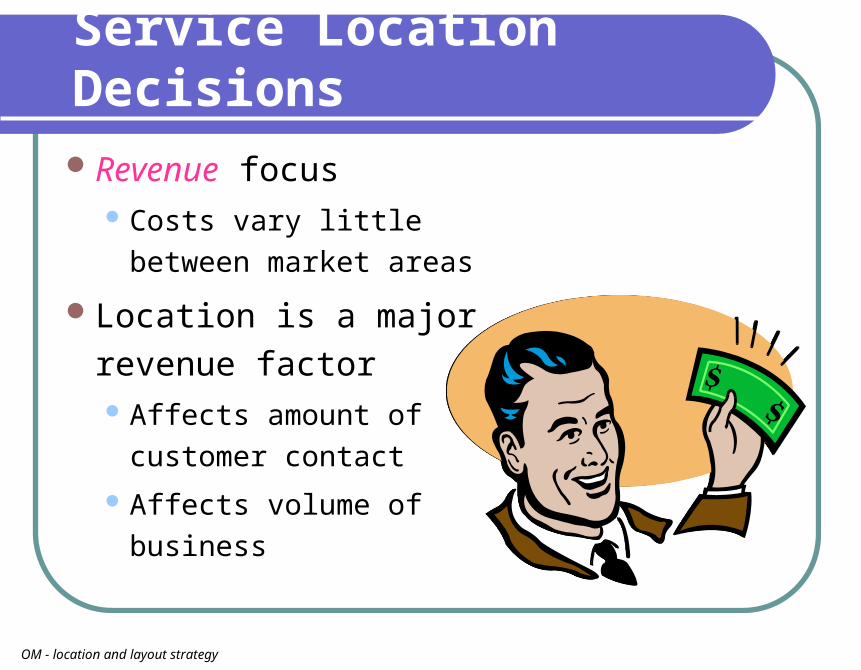
Service Location DecisionsRevenue focus
Costs vary little between market areas
Location is a major revenue factor Affects amount of
customer contact Affects volume of
business
OM - location and layout strategy
In General - Location Decisions
Long-term decisions
Difficult to reverse
Affect fixed & variable costs Transportation cost
As much as 25% of product price
Other costs: Taxes, wages, rent etc.
Objective: Maximize benefit of location
to firmOM - location and layout strategy
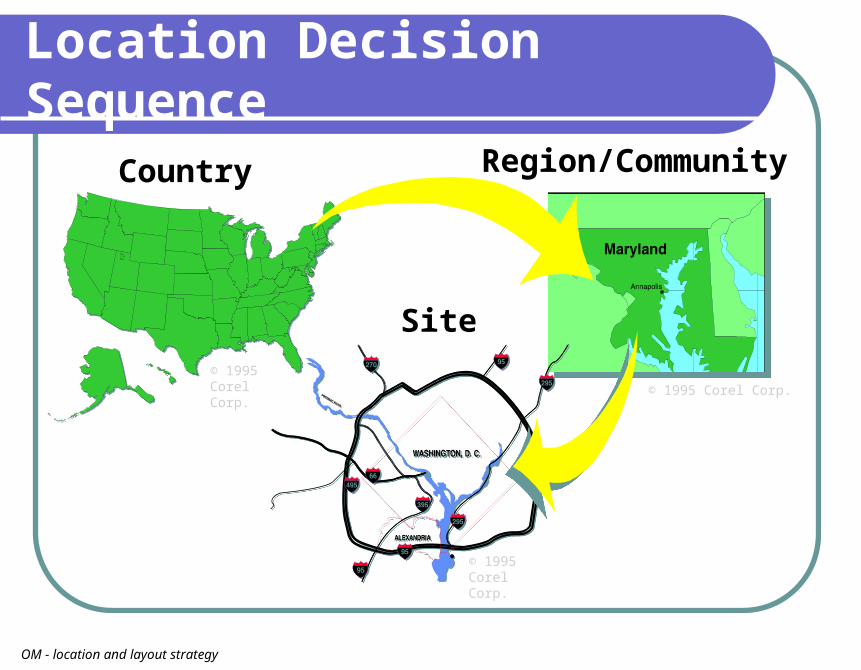
Location Decision Sequence
Country
© 1995 Corel Corp.
Region/Community
© 1995 Corel Corp.
Site
© 1995 Corel Corp.
OM - location and layout strategy
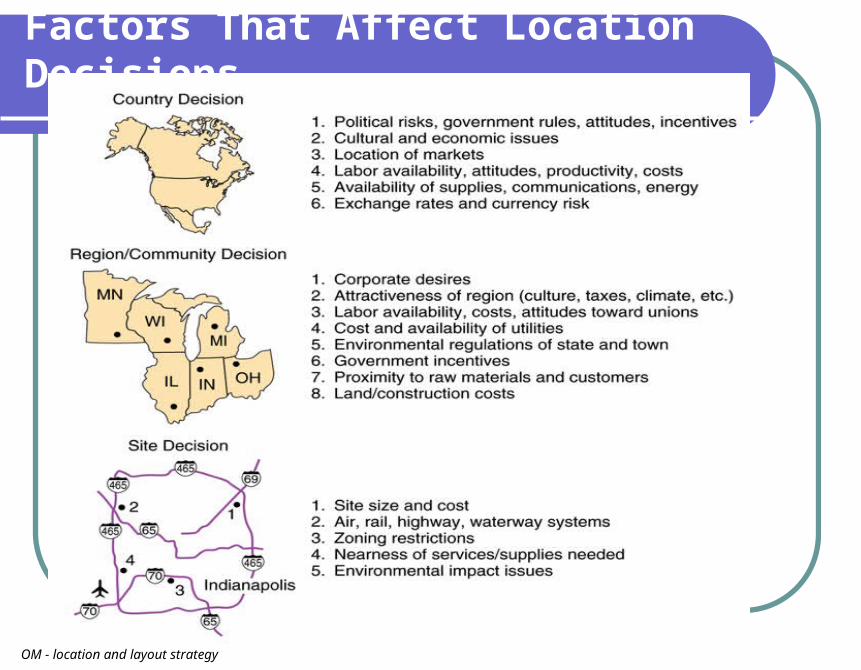
Factors That Affect Location Decisions
OM - location and layout strategy
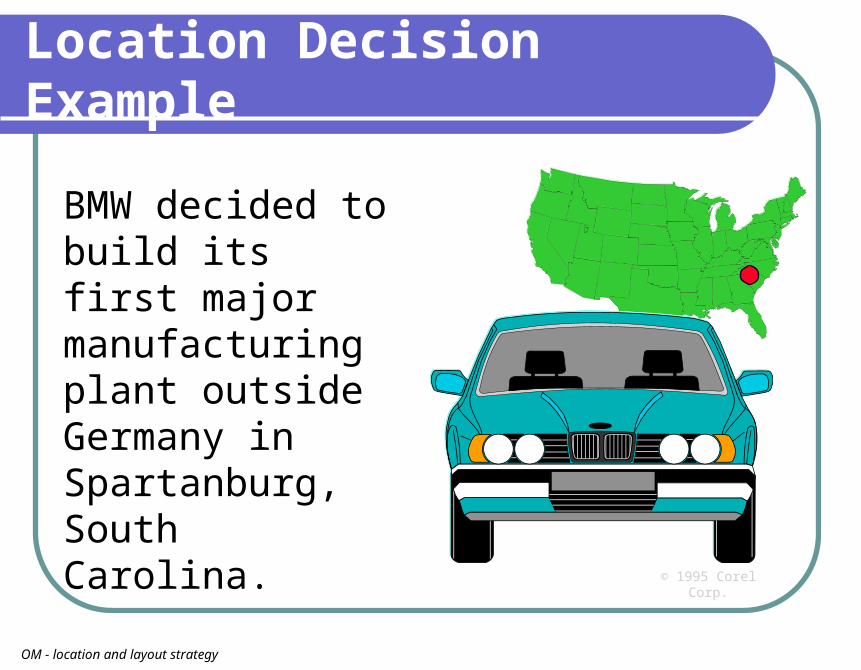
Location Decision Example
BMW decided to build its first major manufacturing plant outside Germany in Spartanburg, South Carolina.
© 1995 Corel Corp.
OM - location and layout strategy
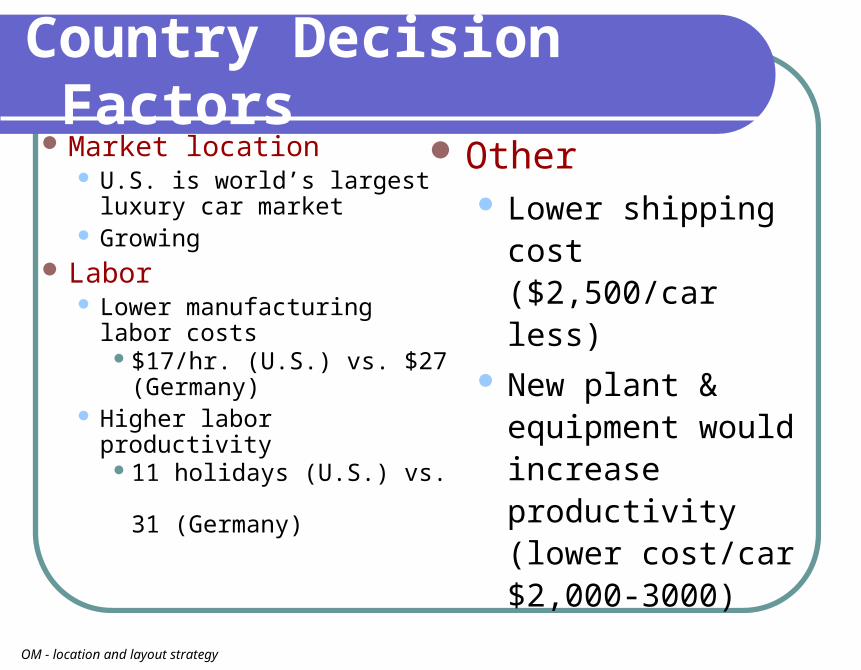
Country Decision Factors
Market location U.S. is world’s largest
luxury car market Growing
Labor Lower manufacturing
labor costs$17/hr. (U.S.) vs. $27
(Germany) Higher labor productivity
11 holidays (U.S.) vs. 31 (Germany)
Other Lower shipping
cost ($2,500/car less)
New plant & equipment would increase productivity (lower cost/car $2,000-3000)
OM - location and layout strategy
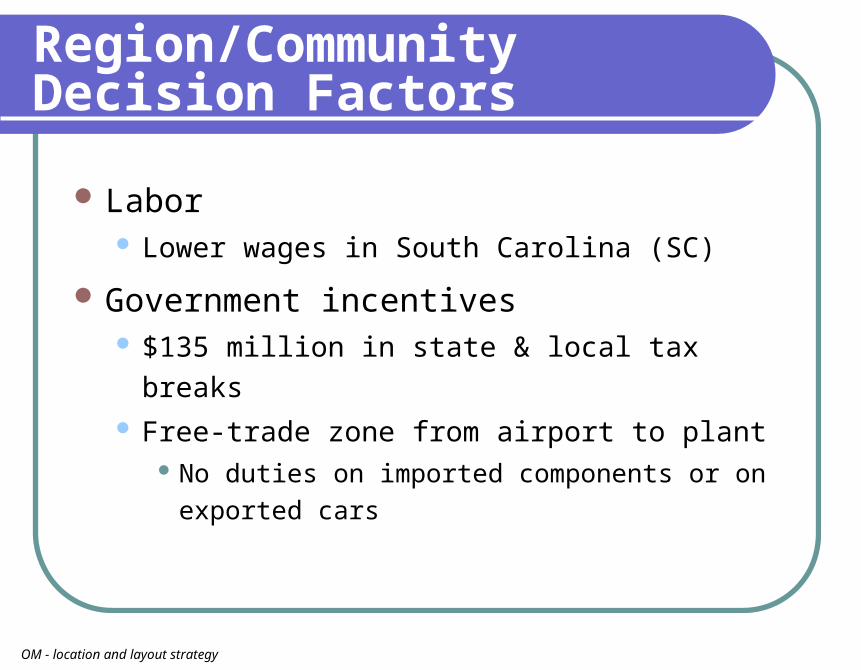
Region/Community Decision Factors
Labor Lower wages in South Carolina (SC)
Government incentives $135 million in state & local tax breaks Free-trade zone from airport to plant
No duties on imported components or on exported cars
OM - location and layout strategy
Location Evaluation Methods
Factor-rating
method
Locational break-
even analysis
Center of gravity
method
Transportation
modelOM - location and layout strategy
Factor-Rating Method
Most widely used location technique
Useful for service & industrial locations
Rates locations using factors
Tangible (quantitative) factors
Example: Short-run & long-run costs
Intangible (qualitative) factors
Example: Education quality, labor skills
OM - location and layout strategy
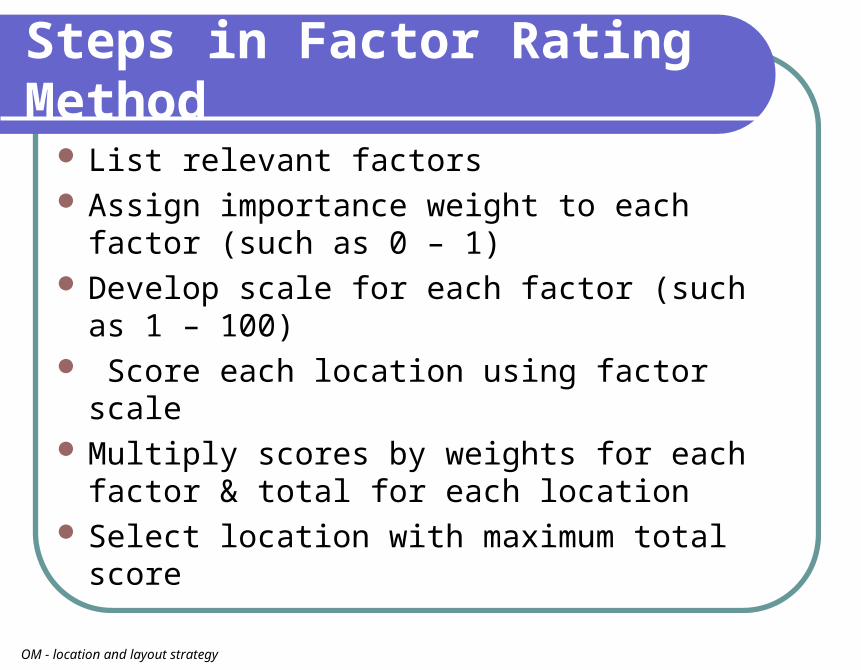
Steps in Factor Rating Method
List relevant factors Assign importance weight to each
factor (such as 0 – 1) Develop scale for each factor (such as
1 – 100) Score each location using factor scale Multiply scores by weights for each
factor & total for each location Select location with maximum total
score
OM - location and layout strategy
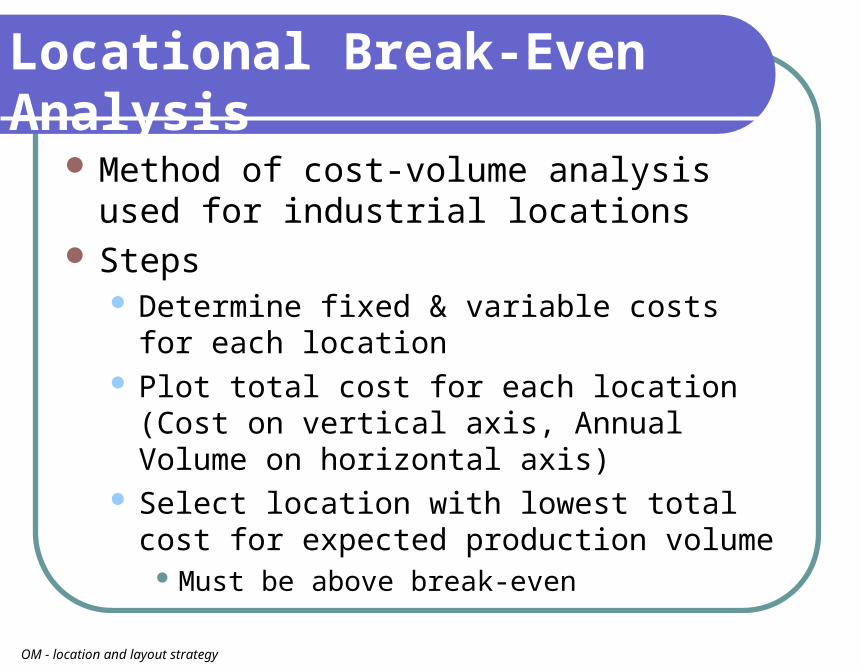
Method of cost-volume analysis used for industrial locations
Steps Determine fixed & variable costs for
each location Plot total cost for each location (Cost
on vertical axis, Annual Volume on horizontal axis)
Select location with lowest total cost for expected production volume
Must be above break-even
Locational Break-Even Analysis
OM - location and layout strategy
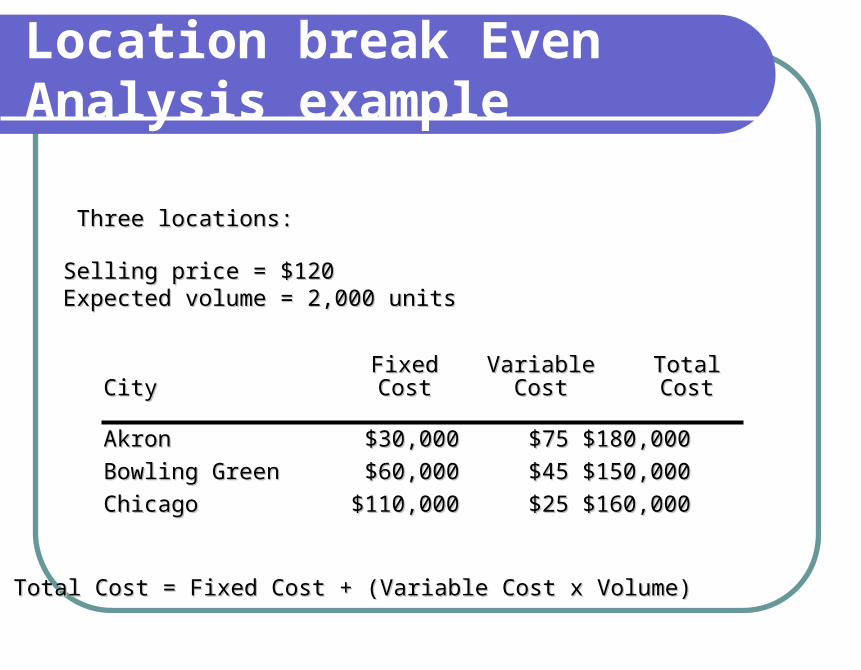
Three locations:Three locations:
AkronAkron $30,000$30,000 $75$75 $180,000$180,000
Bowling GreenBowling Green $60,000$60,000 $45$45 $150,000$150,000
ChicagoChicago $110,000$110,000 $25$25 $160,000$160,000
FixedFixed VariableVariable TotalTotalCityCity CostCost CostCost CostCost
Total Cost = Fixed Cost + (Variable Cost x Volume)Total Cost = Fixed Cost + (Variable Cost x Volume)
Selling price = $120Selling price = $120Expected volume = 2,000 unitsExpected volume = 2,000 units
Location break Even Analysis example
–$180,000 $180,000 –
–$160,000 $160,000 –$150,000 $150,000 –
–$130,000 $130,000 –
–$110,000 $110,000 –
––
$80,000 $80,000 ––
$60,000 $60,000 –––
$30,000 $30,000 ––
$10,000 $10,000 ––
An
nu
al c
ost
An
nu
al c
ost
| | | | | | |
00 500500 1,0001,000 1,5001,500 2,0002,000 2,5002,500 3,0003,000
VolumeVolume
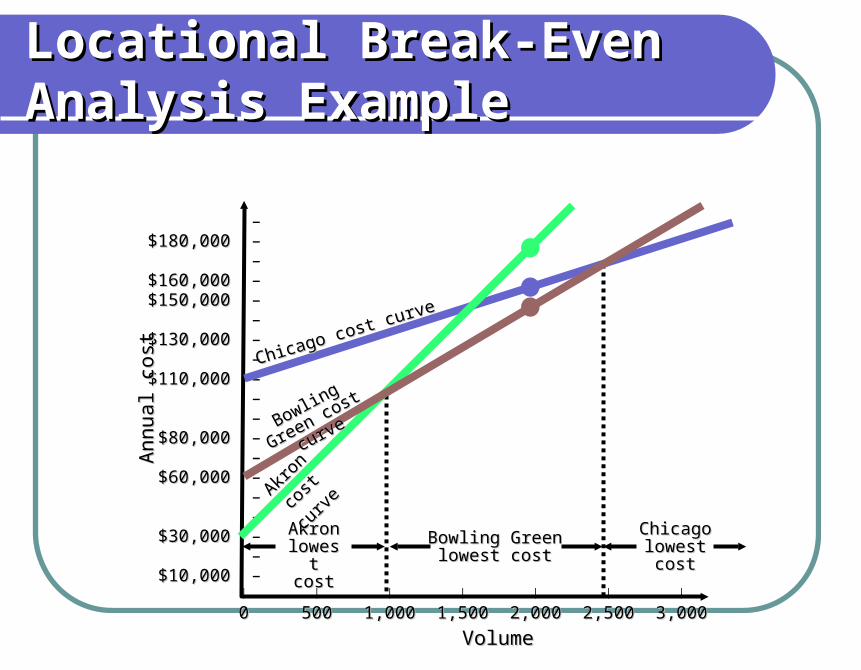
Akron Akron lowest lowest costcost
Bowling Green Bowling Green lowest costlowest cost
Chicago Chicago lowest costlowest cost
Chicago cost curve
Chicago cost curve
Akron
cost
Akron
cost
curv
ecu
rve
Bowling Green
Bowling Green
cost curve
cost curve
Locational Break-Even Locational Break-Even Analysis ExampleAnalysis Example
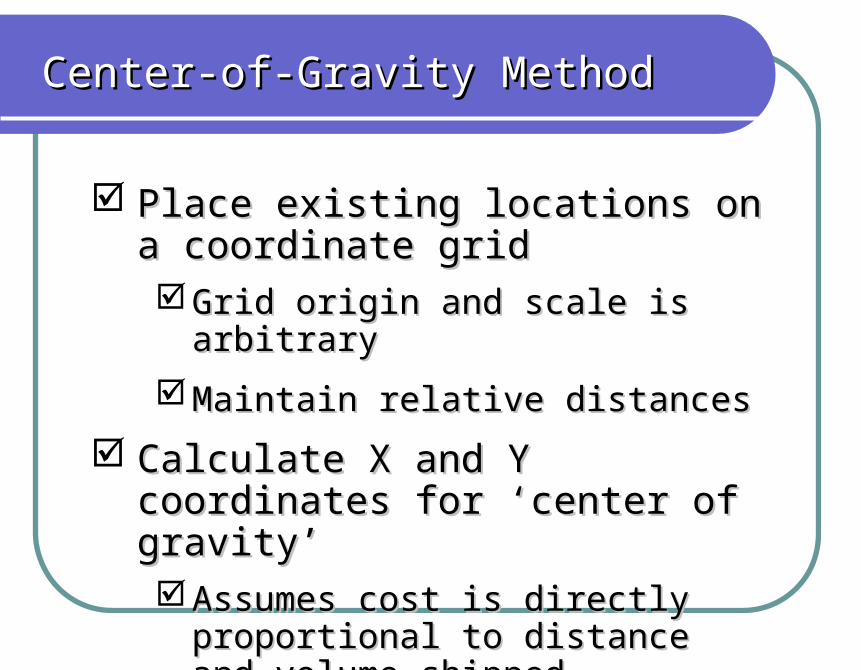
Place existing locations on a Place existing locations on a coordinate gridcoordinate grid Grid origin and scale is arbitrary Grid origin and scale is arbitrary
Maintain relative distancesMaintain relative distances
Calculate X and Y coordinates for Calculate X and Y coordinates for ‘center of gravity’‘center of gravity’ Assumes cost is directly proportional Assumes cost is directly proportional
to distance and volume shippedto distance and volume shipped
Center-of-Gravity MethodCenter-of-Gravity Method
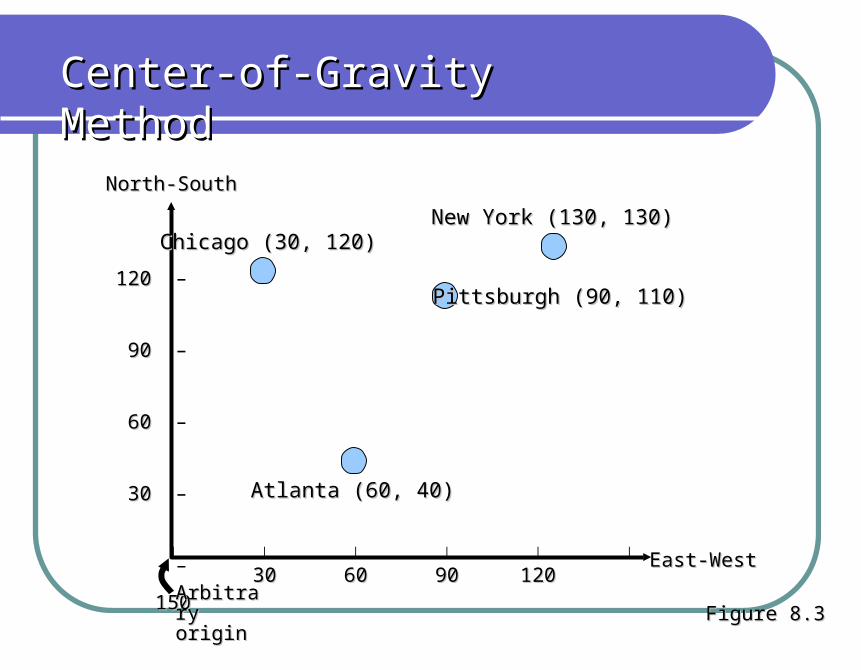
North-SouthNorth-South
East-WestEast-West
120 120 –
90 90 –
60 60 –
30 30 –
–| | | | | |
3030 6060 9090 120120
150150Arbitrary Arbitrary originorigin
Chicago (30, 120)Chicago (30, 120)New York (130, 130)New York (130, 130)
Pittsburgh (90, 110)Pittsburgh (90, 110)
Atlanta (60, 40)Atlanta (60, 40)
Figure 8.3Figure 8.3
Center-of-Gravity MethodCenter-of-Gravity Method
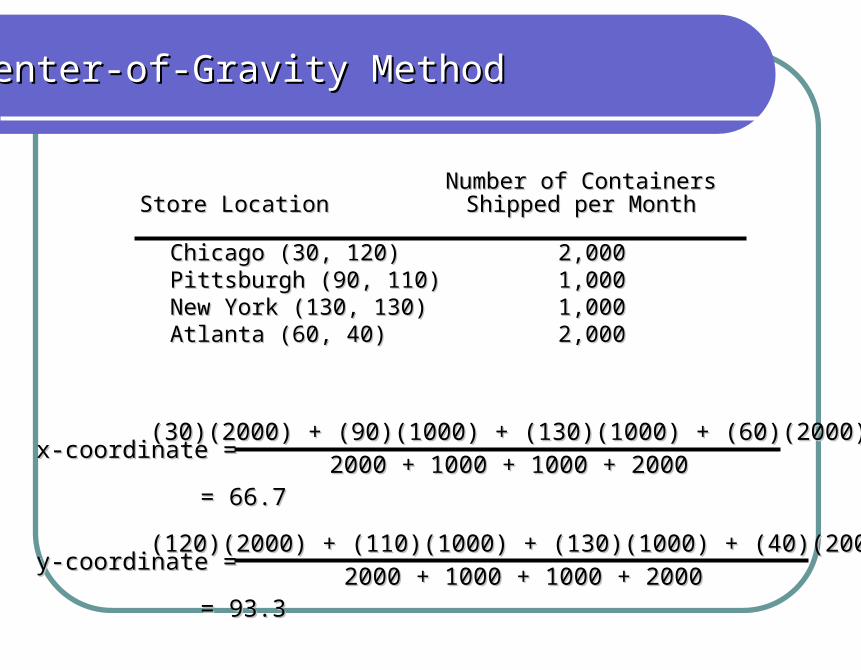
Number of ContainersNumber of ContainersStore LocationStore Location Shipped per MonthShipped per Month
Chicago (30, 120)Chicago (30, 120) 2,0002,000Pittsburgh (90, 110)Pittsburgh (90, 110) 1,0001,000New York (130, 130)New York (130, 130) 1,0001,000Atlanta (60, 40)Atlanta (60, 40) 2,0002,000
x-coordinate =x-coordinate =(30)(2000) + (90)(1000) + (130)(1000) + (60)(2000)(30)(2000) + (90)(1000) + (130)(1000) + (60)(2000)
2000 + 1000 + 1000 + 20002000 + 1000 + 1000 + 2000= 66.7= 66.7
y-coordinate =y-coordinate =(120)(2000) + (110)(1000) + (130)(1000) + (40)(2000)(120)(2000) + (110)(1000) + (130)(1000) + (40)(2000)
2000 + 1000 + 1000 + 20002000 + 1000 + 1000 + 2000= 93.3= 93.3
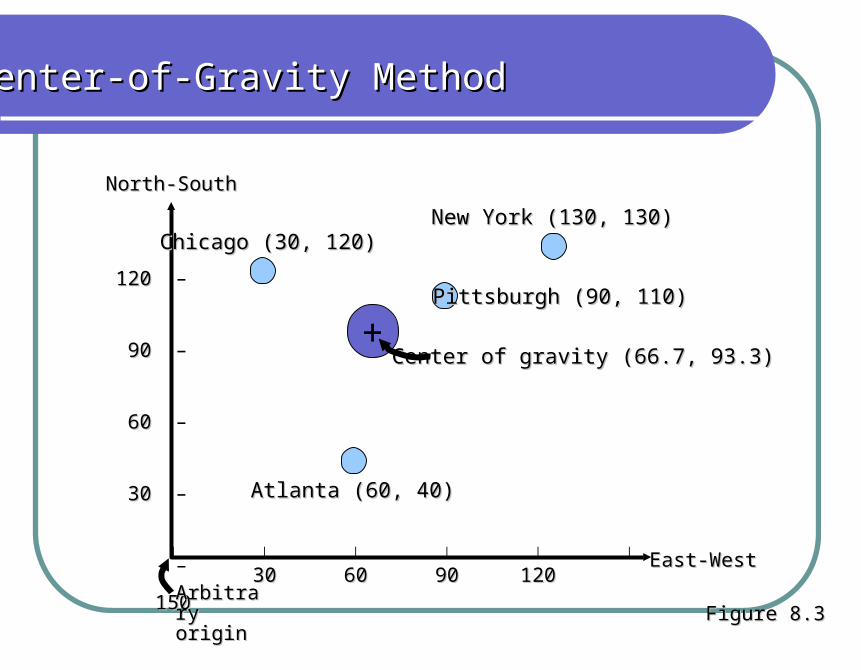
Center-of-Gravity MethodCenter-of-Gravity Method
North-SouthNorth-South
East-WestEast-West
120 120 –
90 90 –
60 60 –
30 30 –
–| | | | | |
3030 6060 9090 120120
150150Arbitrary Arbitrary originorigin
Chicago (30, 120)Chicago (30, 120)New York (130, 130)New York (130, 130)
Pittsburgh (90, 110)Pittsburgh (90, 110)
Atlanta (60, 40)Atlanta (60, 40)
Center of gravity (66.7, 93.3)Center of gravity (66.7, 93.3)+
Figure 8.3Figure 8.3
Center-of-Gravity MethodCenter-of-Gravity Method
What is Facility Layout
Location or arrangement of everything
within & around buildings
Determines long-run efficiency of
operations
Helps achieve a strategy that supports
differentiation, low cost or quick
response
OM - location and layout strategy
Strategic Importance of Layout
Proper layout enables:
Higher utilization of space, equipment,and
people
Improved flow of information, materials, or
people
Improved employee morale and safer working
conditions
Improved customer/client interaction
Flexibility to change – cross train; use small,
movable or modular equipment; etc
OM - location and layout strategy
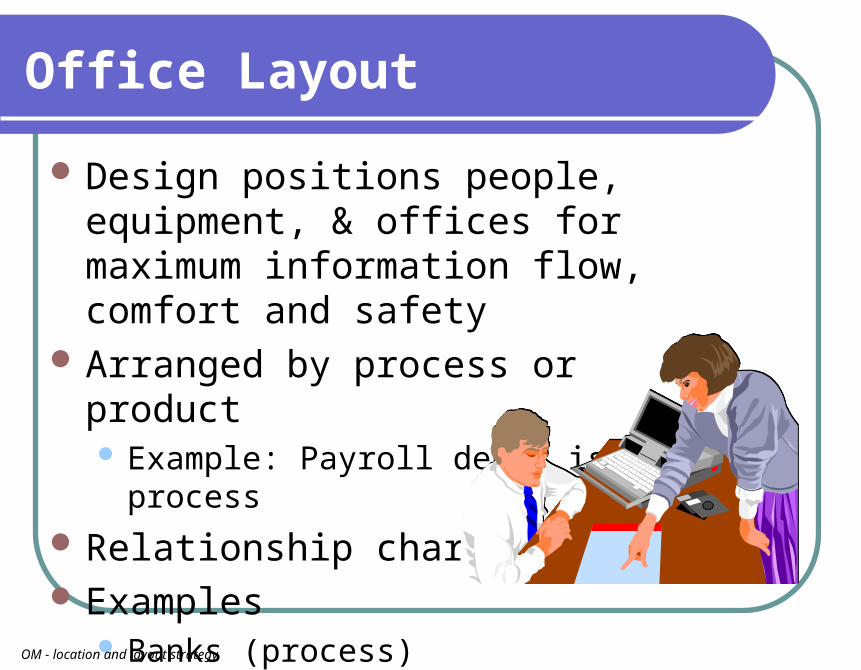
Office Layout
Design positions people, equipment, & offices for maximum information flow, comfort and safety
Arranged by process or product Example: Payroll dept. is by process
Relationship chart used Examples
Banks (process) Software company (Pdt)
OM - location and layout strategy
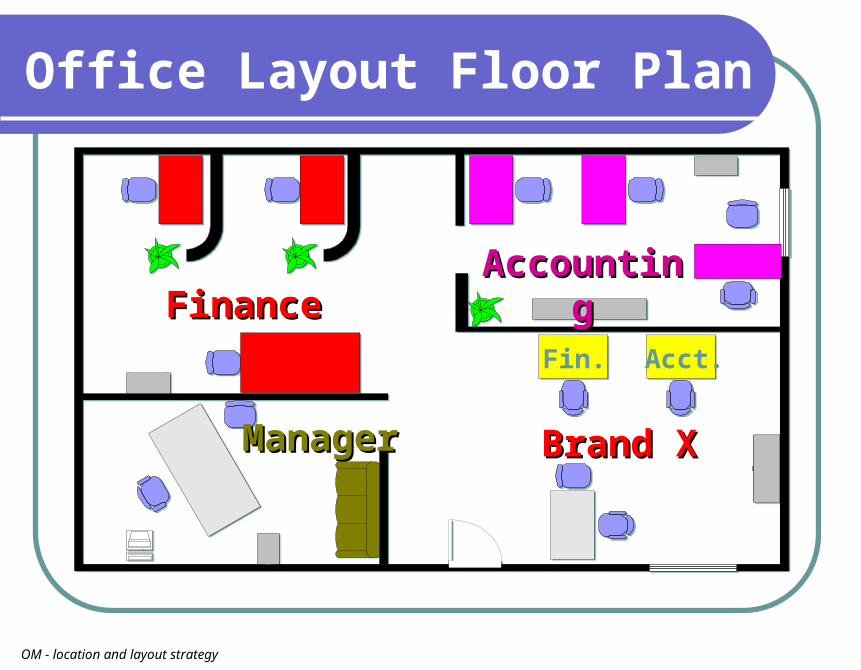
Office Layout Floor Plan
AccountingAccounting
ManagerManager Brand XBrand X
FinanceFinanceFin. Acct.
OM - location and layout strategy
Retail/Service Layout
Design maximizes product exposure to customers
Decision variables Store flow pattern Allocation of (shelf) space to products
Video
OM - location and layout strategy
Retail Layouts - Some Rules of Thumb
Locate high-draw items around the periphery of the store
Use prominent locations such as the first or last aisle for high-impulse and high margin items
Distribute “power items” (items that may dominate a shopping trip) to both sides of an aisle, and disperse them to increase the viewing of other items
Use end aisle locations because they have a very high exposure rate
Convey mission of store by positioning of primary items up front
OM - location and layout strategy
Environmental Dimensions of Servicescapes
Ambient Conditions: background characteristics such as noise level, music, lighting, temperature, and scent.
Spatial Layout and Functionality: arrangement of furnishings and equipment creating a visual and functional landscape
Signs, Symbols, and Artifacts: selection, orientation, location, and size of objects; serve as explicit or implicit signals
OM - location and layout strategy
Warehouse Layout
Design balances space (cube) utilization & handling cost
Similar to process layout Items moved between dock & various
storage areas
Optimum layout depends onVariety of items storedNumber of items picked
OM - location and layout strategy
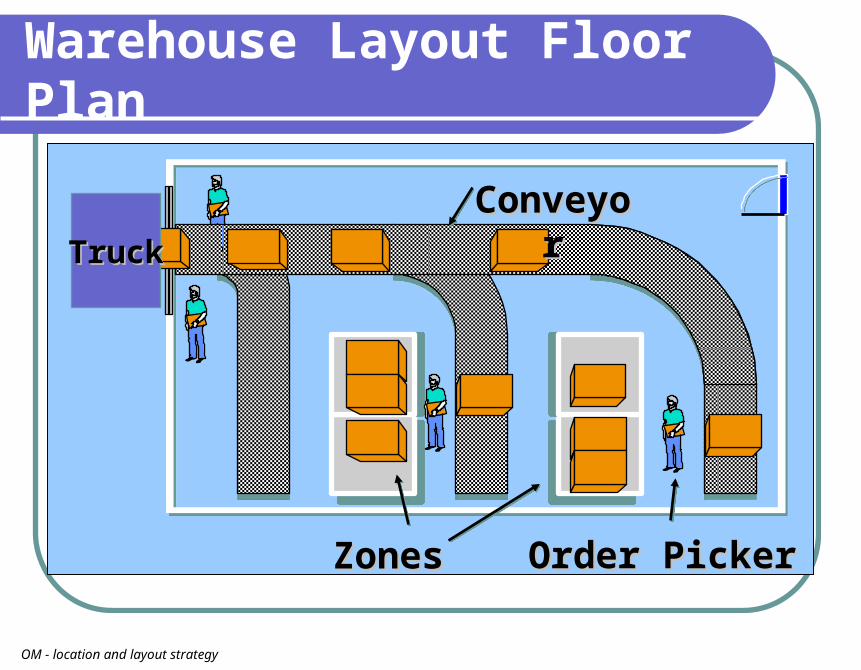
Warehouse Layout Floor Plan
ZonesZones
ConveyorConveyorTruckTruck
Order PickerOrder Picker
OM - location and layout strategy
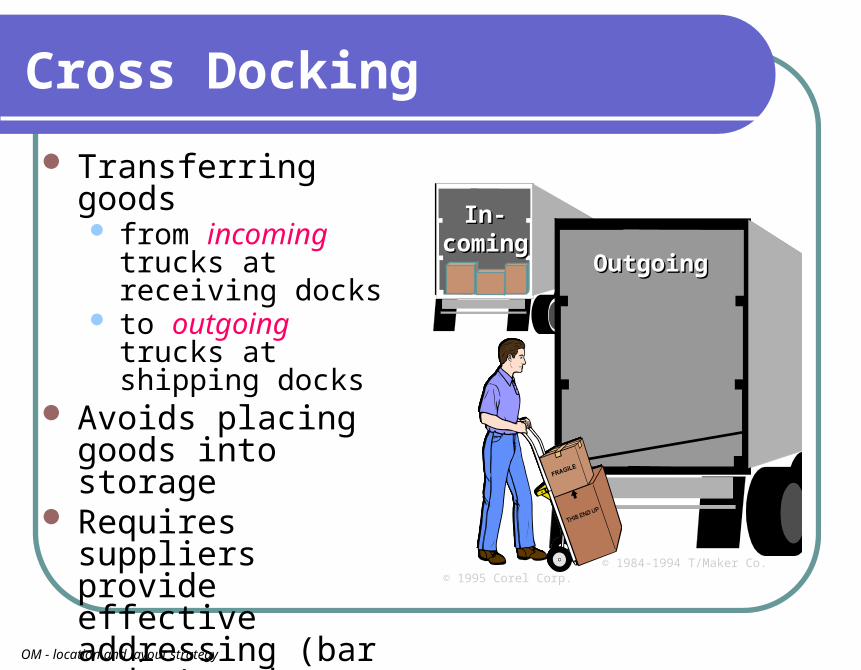
Cross Docking
Transferring goods from incoming
trucks at receiving docks
to outgoing trucks at shipping docks
Avoids placing goods into storage
Requires suppliers provide effective addressing (bar codes) and packaging that provides for rapid transhipment
In-In-comingcoming
OutgoingOutgoing
© 1984-1994 T/Maker Co.© 1995 Corel Corp.
OM - location and layout strategy
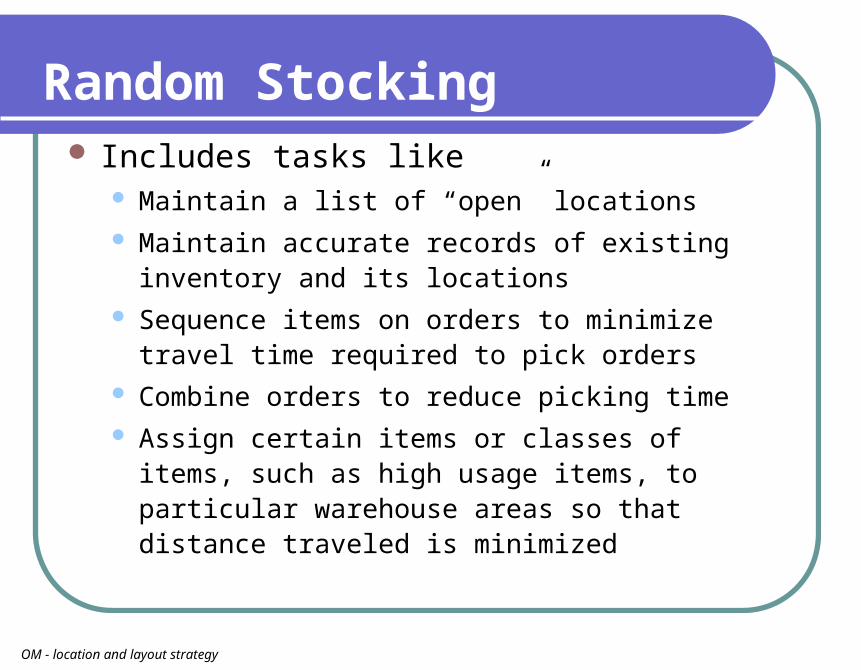
Random Stocking Includes tasks like
Maintain a list of “open” locations Maintain accurate records of existing inventory
and its locations Sequence items on orders to minimize travel
time required to pick orders Combine orders to reduce picking time Assign certain items or classes of items, such
as high usage items, to particular warehouse areas so that distance traveled is minimized
OM - location and layout strategy
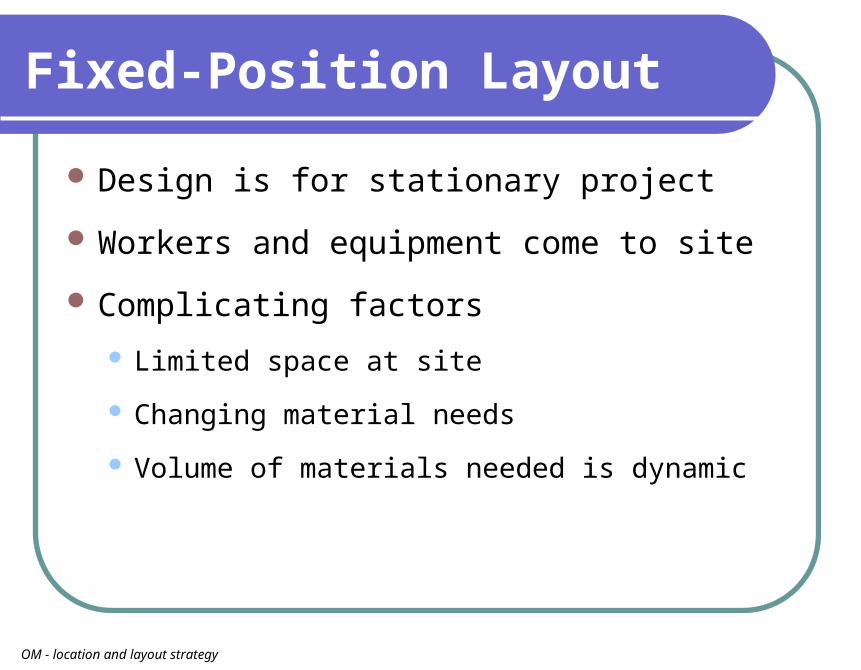
Fixed-Position Layout
Design is for stationary project
Workers and equipment come to site
Complicating factors
Limited space at site
Changing material needs
Volume of materials needed is dynamic
OM - location and layout strategy
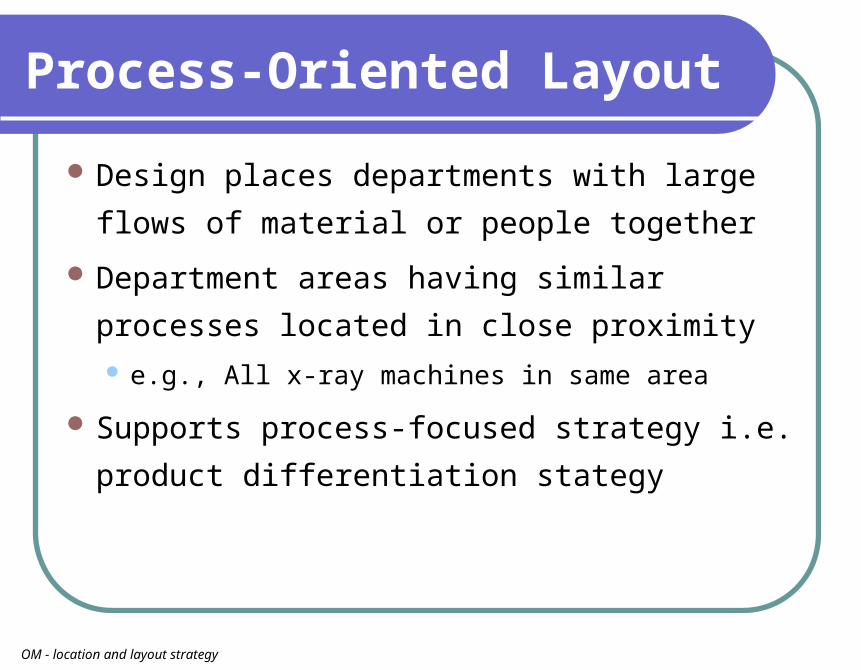
Process-Oriented Layout
Design places departments with large
flows of material or people together
Department areas having similar
processes located in close proximity e.g., All x-ray machines in same area
Supports process-focused strategy i.e.
product differentiation stategy
OM - location and layout strategy
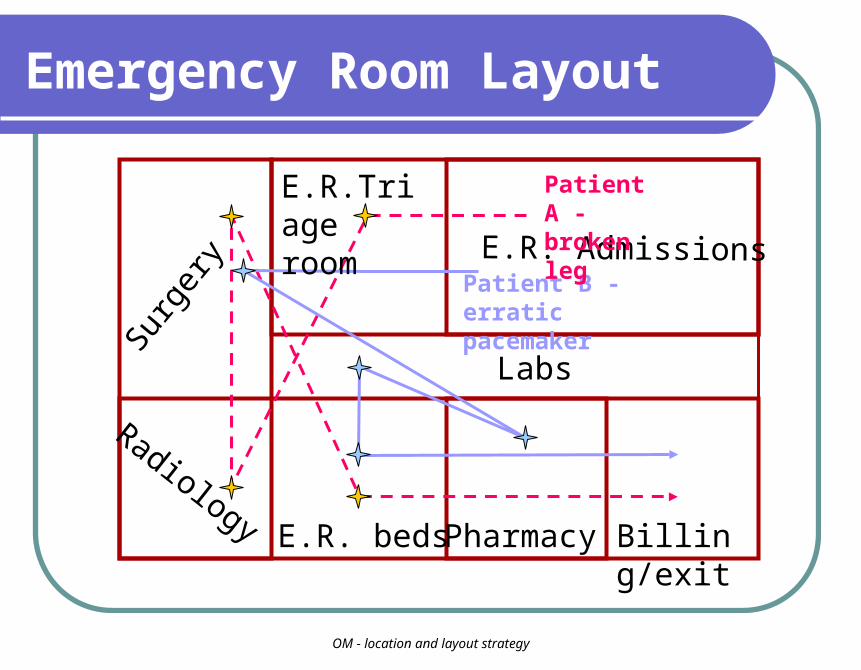
Emergency Room LayoutSurg
ery
RadiologyE.R. beds Pharmacy Billing/exit
E.R.Triage room
E.R. AdmissionsPatient B - erratic pacemaker
Patient A - broken leg
Labs
OM - location and layout strategy
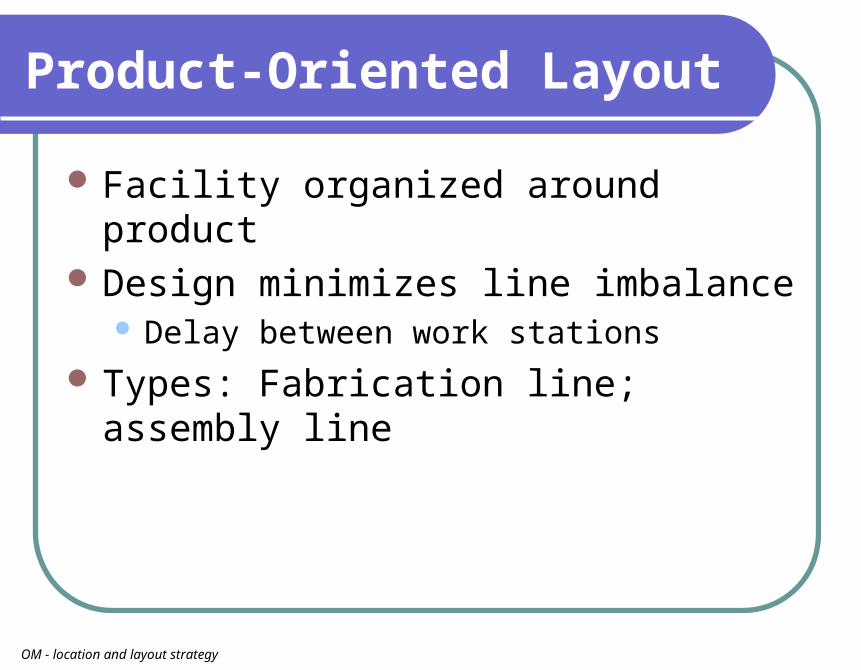
Product-Oriented Layout
Facility organized around product Design minimizes line imbalance
Delay between work stations Types: Fabrication line; assembly
line
OM - location and layout strategy