older pedestrians at risk - tri-state transportation … · 2012-08-15 · older pedestrians at...
TRANSCRIPT
Tri-State Transportation Campaign
August 2012
Older Pedestrians at Risk And How States Can Make it Safer and Easier
for Older Residents to Walk
2
Introduction
According to U.S. Census Bureau projections, by 2030 more than one in
five tri-state region residents will be 65 years or
older. The share of the population aged 75 and
older will grow to 9.1 percent of the region’s
population by 2030.
This trend makes it imperative for communities
across the tri-state, as well as state and city
agencies, to commit to making the region’s roads
safer for older pedestrians. Small changes that
improve streets for older pedestrians also help
other populations, such as young children and
the handicapped. Creating communities that are
walkable stimulates the local economy, encour-
ages active lifestyles, reduces congestion and in-
creases the community’s desirability as a place to
live and visit.
The Tri-State Transportation Campaign’s annual
Older Pedestrians at Risk report reveals that
older pedestrians in the tri-state region are par-
ticularly at risk of being killed in a collision with a
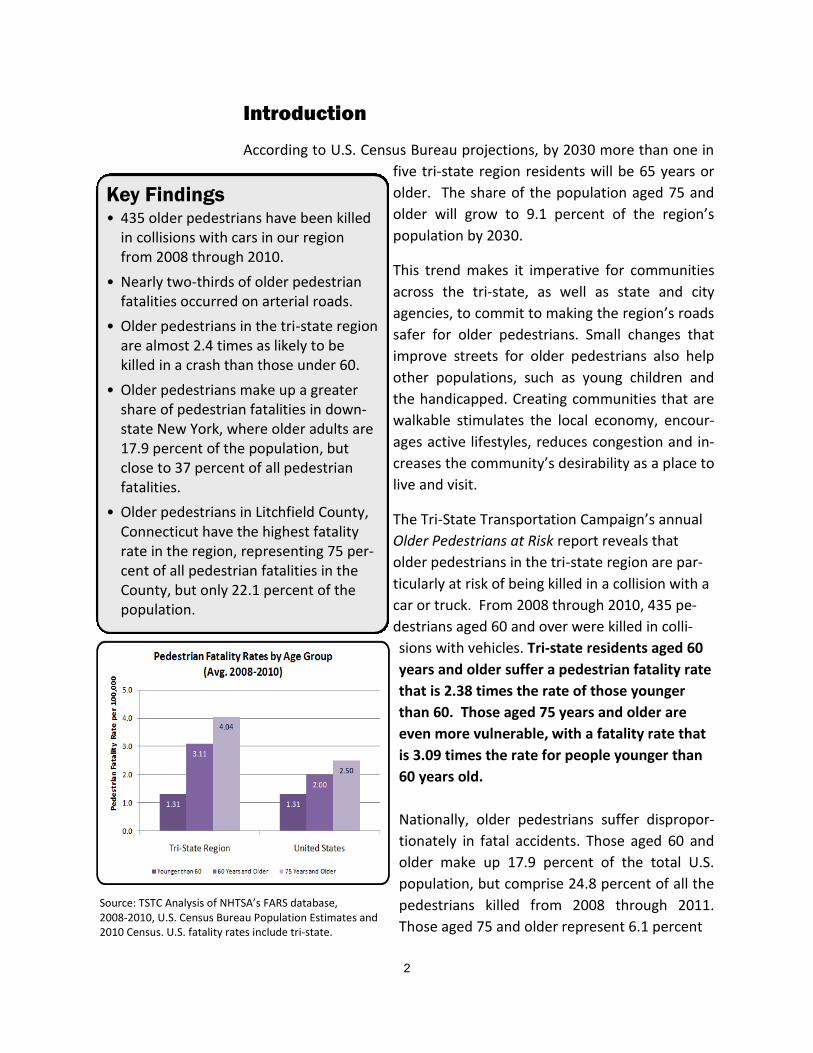
car or truck. From 2008 through 2010, 435 pe-
destrians aged 60 and over were killed in colli-
sions with vehicles. Tri-state residents aged 60
years and older suffer a pedestrian fatality rate
that is 2.38 times the rate of those younger
than 60. Those aged 75 years and older are
even more vulnerable, with a fatality rate that
is 3.09 times the rate for people younger than
60 years old.
Nationally, older pedestrians suffer dispropor-
tionately in fatal accidents. Those aged 60 and
older make up 17.9 percent of the total U.S.
population, but comprise 24.8 percent of all the
pedestrians killed from 2008 through 2011.
Those aged 75 and older represent 6.1 percent
Key Findings • 435 older pedestrians have been killed
in collisions with cars in our region from 2008 through 2010.
• Nearly two-thirds of older pedestrian fatalities occurred on arterial roads.
• Older pedestrians in the tri-state region are almost 2.4 times as likely to be killed in a crash than those under 60.
• Older pedestrians make up a greater share of pedestrian fatalities in down-state New York, where older adults are 17.9 percent of the population, but close to 37 percent of all pedestrian fatalities.
• Older pedestrians in Litchfield County, Connecticut have the highest fatality rate in the region, representing 75 per-cent of all pedestrian fatalities in the County, but only 22.1 percent of the population.
Source: TSTC Analysis of NHTSA’s FARS database, 2008-2010, U.S. Census Bureau Population Estimates and 2010 Census. U.S. fatality rates include tri-state.

3
of the of the total population but 10.6
percent of the pedestrian fatalities.
The age disparities in pedestrian fatality
rates are far greater in the tri-state region
than in the U.S. as a whole. Pedestrian
fatality rates for tri-state residents aged
60 and over is 3.11 per 100,000 residents,
compared to 2.00 per 100,000 residents
nationally. The pedestrian fatality rate for
tri-state pedestrians aged 75 years and
older is 4.04 per 100,000 residents, compared to 2.50 per 100,000 resi-
dents nationally.1 The pedestrian fatality rate for people aged 60 and
older in downstate New York, New Jersey and Connecticut is 64 percent
higher than the rest of the country (the 47 states). Those 75 and older
suffer a fatality rate than is 72 percent higher.
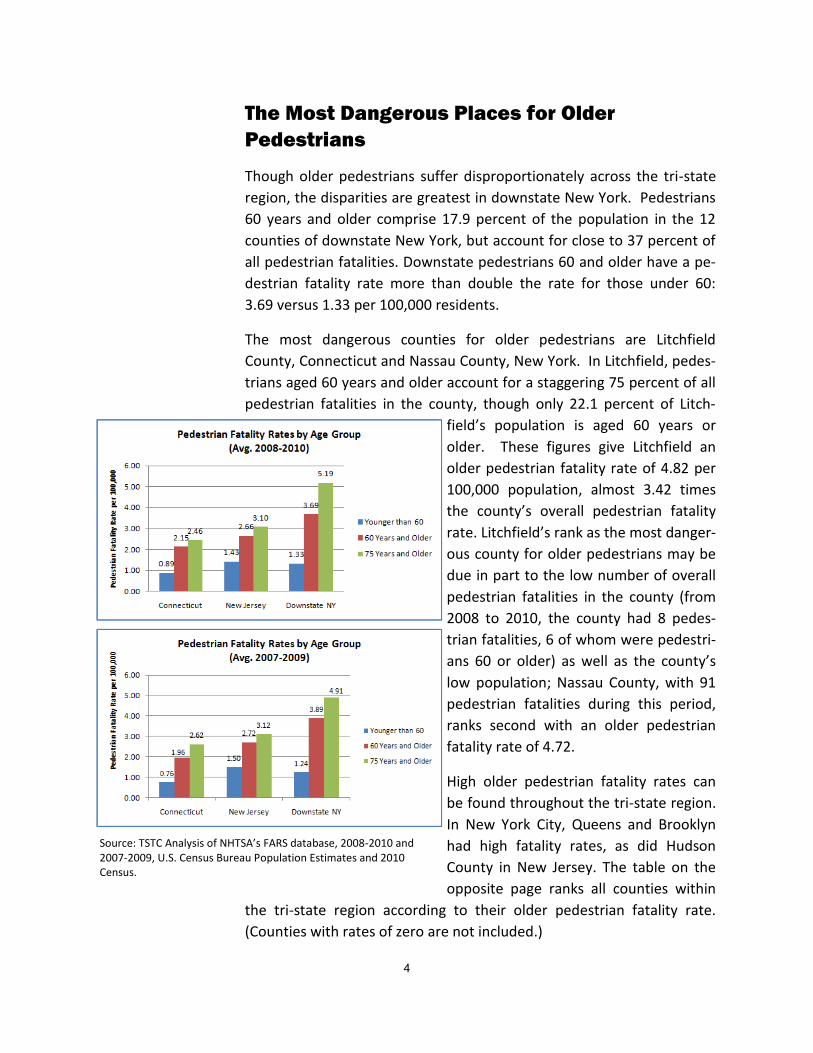
Comparing this year’s report with the Campaign’s previous report
(which looked at pedestrian fatalities from 2007 through 2009), regional
pedestrian fatality rates for pedestrians aged 60 and over fell slightly,
but for seniors 75 years and older, fatality rates increased. There are
various trends across the tri-state region: from 2008 through 2010, pe-
destrian fatality rates in New Jersey dropped overall compared with fa-
talities rates from 2007 through 2009. However, fatality rates increased
for those aged 60 years and older in Connecticut and for those 75 and
older in downstate New York. Overall, these findings underscore the
continued need for pedestrian safety improvements and policies across
the region.
Source: TSTC Analysis of NHTSA’s FARS database, 2008-2010 and 2007-2009, U.S. Census Bureau Population Estimates and 2010 Cen-sus.
1 National fatality rates (2.00 and 2.50) include the tri-state.
State Pedestrian Fatalities
(2008-2010) Older (60+ yrs) Pedestrian
Fatalities (2008-2010)
Avg. Older Pedestrian Fatality Rate per 100,000*
(2008-2010)
Connecticut 121 44 2.15
New Jersey 436 130 2.66
Downstate New York 711 261 3.69
Tri-State 1,268 435 3.11 Source: TSTC Analysis of NHTSA’s FARS database, 2008-2010, U.S. Census Bureau Population Estimates and 2010 Census. *Fatality rates are calculated according to the population of the relevant age group (i.e., population aged 60 years and older, population under 60 years).
Tri-State Pedestrian Fatalities, 2008-2010
4
The Most Dangerous Places for Older
Pedestrians
Though older pedestrians suffer disproportionately across the tri-state
region, the disparities are greatest in downstate New York. Pedestrians
60 years and older comprise 17.9 percent of the population in the 12
counties of downstate New York, but account for close to 37 percent of
all pedestrian fatalities. Downstate pedestrians 60 and older have a pe-
destrian fatality rate more than double the rate for those under 60:
3.69 versus 1.33 per 100,000 residents.
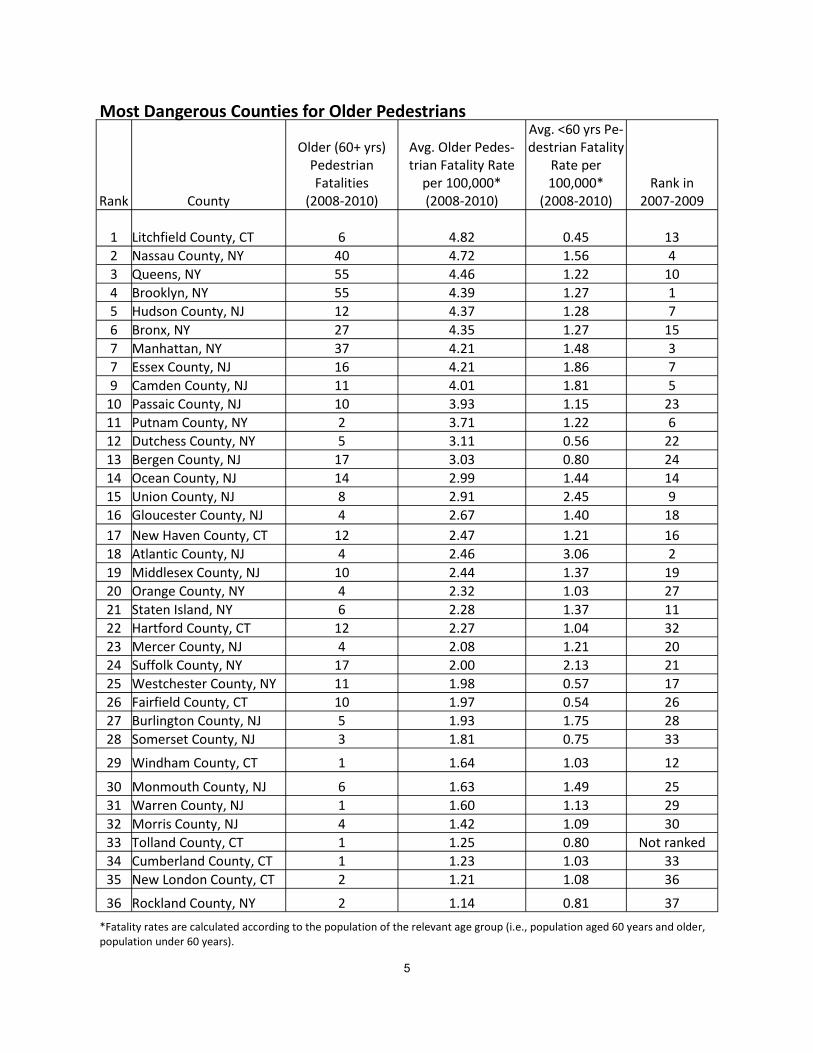
The most dangerous counties for older pedestrians are Litchfield
County, Connecticut and Nassau County, New York. In Litchfield, pedes-
trians aged 60 years and older account for a staggering 75 percent of all
pedestrian fatalities in the county, though only 22.1 percent of Litch-
field’s population is aged 60 years or
older. These figures give Litchfield an
older pedestrian fatality rate of 4.82 per
100,000 population, almost 3.42 times
the county’s overall pedestrian fatality
rate. Litchfield’s rank as the most danger-
ous county for older pedestrians may be
due in part to the low number of overall
pedestrian fatalities in the county (from
2008 to 2010, the county had 8 pedes-
trian fatalities, 6 of whom were pedestri-
ans 60 or older) as well as the county’s
low population; Nassau County, with 91
pedestrian fatalities during this period,
ranks second with an older pedestrian
fatality rate of 4.72.
High older pedestrian fatality rates can
be found throughout the tri-state region.
In New York City, Queens and Brooklyn
had high fatality rates, as did Hudson
County in New Jersey. The table on the
opposite page ranks all counties within
the tri-state region according to their older pedestrian fatality rate.
(Counties with rates of zero are not included.)
Source: TSTC Analysis of NHTSA’s FARS database, 2008-2010 and 2007-2009, U.S. Census Bureau Population Estimates and 2010 Census.
5
Rank County
Older (60+ yrs) Pedestrian Fatalities
(2008-2010)
Avg. Older Pedes-trian Fatality Rate
per 100,000* (2008-2010)
Avg. <60 yrs Pe-destrian Fatality
Rate per 100,000*
(2008-2010) Rank in
2007-2009
1 Litchfield County, CT 6 4.82 0.45 13
2 Nassau County, NY 40 4.72 1.56 4
3 Queens, NY 55 4.46 1.22 10
4 Brooklyn, NY 55 4.39 1.27 1
5 Hudson County, NJ 12 4.37 1.28 7
6 Bronx, NY 27 4.35 1.27 15
7 Manhattan, NY 37 4.21 1.48 3
7 Essex County, NJ 16 4.21 1.86 7
9 Camden County, NJ 11 4.01 1.81 5
10 Passaic County, NJ 10 3.93 1.15 23
11 Putnam County, NY 2 3.71 1.22 6
12 Dutchess County, NY 5 3.11 0.56 22
13 Bergen County, NJ 17 3.03 0.80 24
14 Ocean County, NJ 14 2.99 1.44 14
15 Union County, NJ 8 2.91 2.45 9
16 Gloucester County, NJ 4 2.67 1.40 18
17 New Haven County, CT 12 2.47 1.21 16
18 Atlantic County, NJ 4 2.46 3.06 2
19 Middlesex County, NJ 10 2.44 1.37 19
20 Orange County, NY 4 2.32 1.03 27
21 Staten Island, NY 6 2.28 1.37 11
22 Hartford County, CT 12 2.27 1.04 32
23 Mercer County, NJ 4 2.08 1.21 20
24 Suffolk County, NY 17 2.00 2.13 21
25 Westchester County, NY 11 1.98 0.57 17
26 Fairfield County, CT 10 1.97 0.54 26
27 Burlington County, NJ 5 1.93 1.75 28
28 Somerset County, NJ 3 1.81 0.75 33
29 Windham County, CT 1 1.64 1.03 12
30 Monmouth County, NJ 6 1.63 1.49 25
31 Warren County, NJ 1 1.60 1.13 29
32 Morris County, NJ 4 1.42 1.09 30
33 Tolland County, CT 1 1.25 0.80 Not ranked
34 Cumberland County, CT 1 1.23 1.03 33
35 New London County, CT 2 1.21 1.08 36
36 Rockland County, NY 2 1.14 0.81 37
Most Dangerous Counties for Older Pedestrians
*Fatality rates are calculated according to the population of the relevant age group (i.e., population aged 60 years and older, population under 60 years).
6
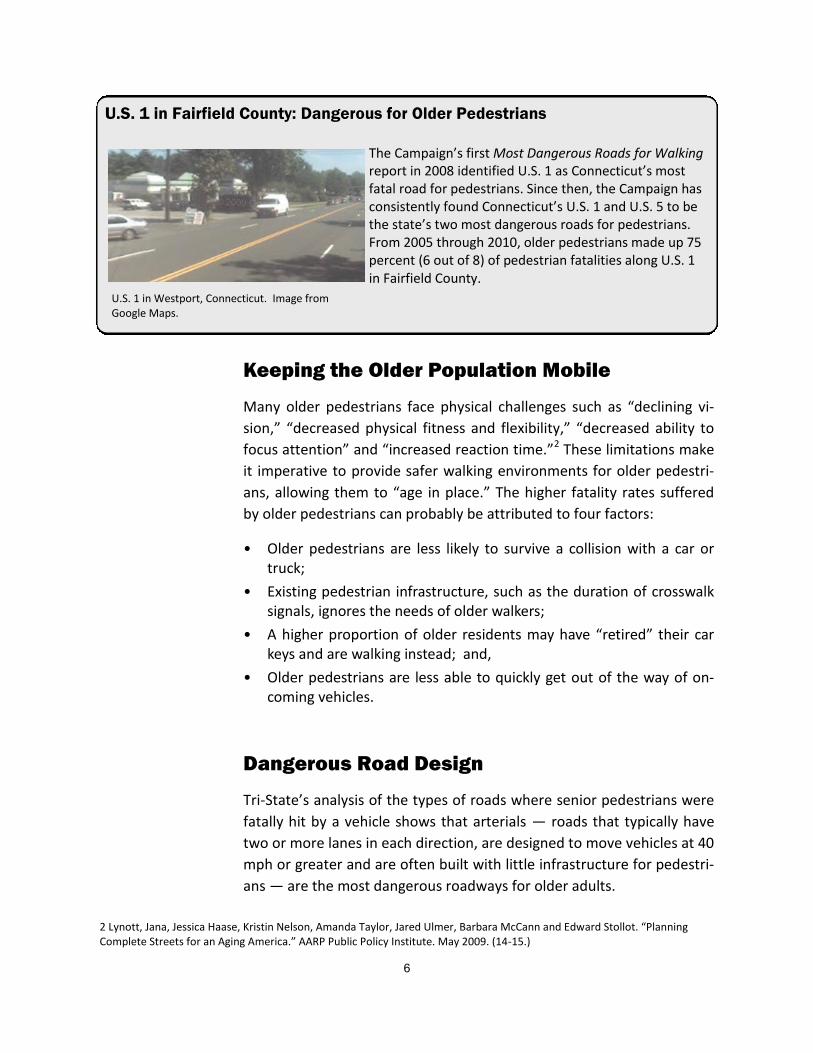
U.S. 1 in Fairfield County: Dangerous for Older Pedestrians
The Campaign’s first Most Dangerous Roads for Walking report in 2008 identified U.S. 1 as Connecticut’s most fatal road for pedestrians. Since then, the Campaign has consistently found Connecticut’s U.S. 1 and U.S. 5 to be the state’s two most dangerous roads for pedestrians. From 2005 through 2010, older pedestrians made up 75 percent (6 out of 8) of pedestrian fatalities along U.S. 1 in Fairfield County.
Keeping the Older Population Mobile
Many older pedestrians face physical challenges such as “declining vi-
sion,” “decreased physical fitness and flexibility,” “decreased ability to
focus attention” and “increased reaction time.”2 These limitations make
it imperative to provide safer walking environments for older pedestri-
ans, allowing them to “age in place.” The higher fatality rates suffered
by older pedestrians can probably be attributed to four factors:
• Older pedestrians are less likely to survive a collision with a car or truck;
• Existing pedestrian infrastructure, such as the duration of crosswalk signals, ignores the needs of older walkers;
• A higher proportion of older residents may have “retired” their car keys and are walking instead; and,
• Older pedestrians are less able to quickly get out of the way of on-coming vehicles.
Dangerous Road Design
Tri-State’s analysis of the types of roads where senior pedestrians were
fatally hit by a vehicle shows that arterials — roads that typically have
two or more lanes in each direction, are designed to move vehicles at 40
mph or greater and are often built with little infrastructure for pedestri-
ans — are the most dangerous roadways for older adults.
2 Lynott, Jana, Jessica Haase, Kristin Nelson, Amanda Taylor, Jared Ulmer, Barbara McCann and Edward Stollot. “Planning Complete Streets for an Aging America.” AARP Public Policy Institute. May 2009. (14-15.)
U.S. 1 in Westport, Connecticut. Image from Google Maps.
7
Throughout the region, arterial roadways of-
ten lack pedestrian infrastructure, such as
highly visible crosswalks, pedestrian count-
down clocks, and sidewalks, even though
these roads are lined with stores and offices
that people access daily.
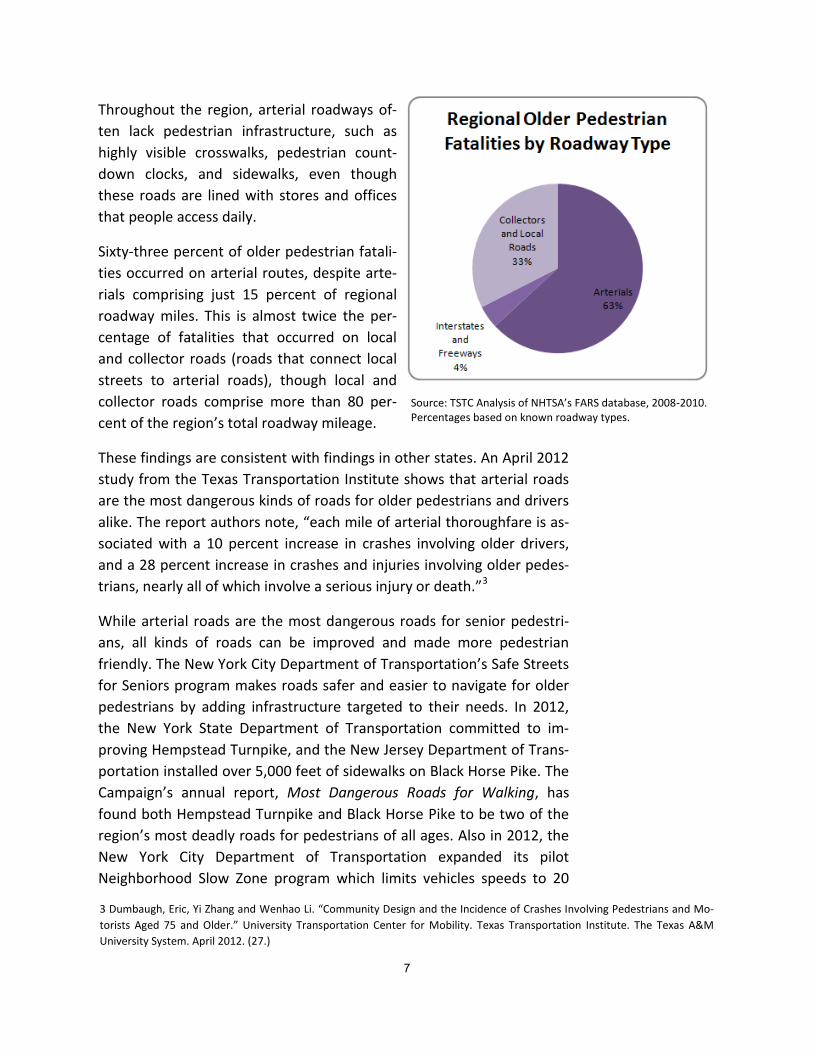
Sixty-three percent of older pedestrian fatali-
ties occurred on arterial routes, despite arte-
rials comprising just 15 percent of regional
roadway miles. This is almost twice the per-
centage of fatalities that occurred on local
and collector roads (roads that connect local
streets to arterial roads), though local and
collector roads comprise more than 80 per-
cent of the region’s total roadway mileage.
These findings are consistent with findings in other states. An April 2012
study from the Texas Transportation Institute shows that arterial roads
are the most dangerous kinds of roads for older pedestrians and drivers
alike. The report authors note, “each mile of arterial thoroughfare is as-
sociated with a 10 percent increase in crashes involving older drivers,
and a 28 percent increase in crashes and injuries involving older pedes-
trians, nearly all of which involve a serious injury or death.”3
While arterial roads are the most dangerous roads for senior pedestri-
ans, all kinds of roads can be improved and made more pedestrian
friendly. The New York City Department of Transportation’s Safe Streets
for Seniors program makes roads safer and easier to navigate for older
pedestrians by adding infrastructure targeted to their needs. In 2012,
the New York State Department of Transportation committed to im-
proving Hempstead Turnpike, and the New Jersey Department of Trans-
portation installed over 5,000 feet of sidewalks on Black Horse Pike. The
Campaign’s annual report, Most Dangerous Roads for Walking, has
found both Hempstead Turnpike and Black Horse Pike to be two of the
region’s most deadly roads for pedestrians of all ages. Also in 2012, the
New York City Department of Transportation expanded its pilot
Neighborhood Slow Zone program which limits vehicles speeds to 20
Source: TSTC Analysis of NHTSA’s FARS database, 2008-2010. Percentages based on known roadway types.
3 Dumbaugh, Eric, Yi Zhang and Wenhao Li. “Community Design and the Incidence of Crashes Involving Pedestrians and Mo-
torists Aged 75 and Older.” University Transportation Center for Mobility. Texas Transportation Institute. The Texas A&M
University System. April 2012. (27.)
8
mph (from the citywide 30 mph) in designated areas, and the Connecti-
cut Department of Transportation announced a “road diet” which will
narrow a section of Burnside Avenue/Route 44 in East Hartford from 2
lanes in each direction to 1 lane in each direction. Three cyclists have
been killed on Burnside Avenue since May 2010.
Conclusion and Recommendations
There are several steps that states and municipalities can take to make
it safer and easier for older residents to walk. In fact, many of these rec-
ommendations are already being implemented through existing pro-
grams such as New York State Department of Transportation’s SafeSen-
iors initiative, the New York City Department of Transportation’s Safe
Streets for Seniors program and the New Jersey Department of Trans-
portation’s Complete Streets workshops that connected municipality
officials with teams of experts in Complete Streets policies and designs.
Below are specific recommendations each state can adopt to minimize
the incidences of these tragic and preventable deaths.
New York • Use a portion of NYSDOT capital program funds to expand SafeSen-
iors and Safe Routes to School programs that aim to reduce traffic injuries and fatalities for older residents and schoolchildren.
• Create a statewide Safe Routes to Transit program aimed at
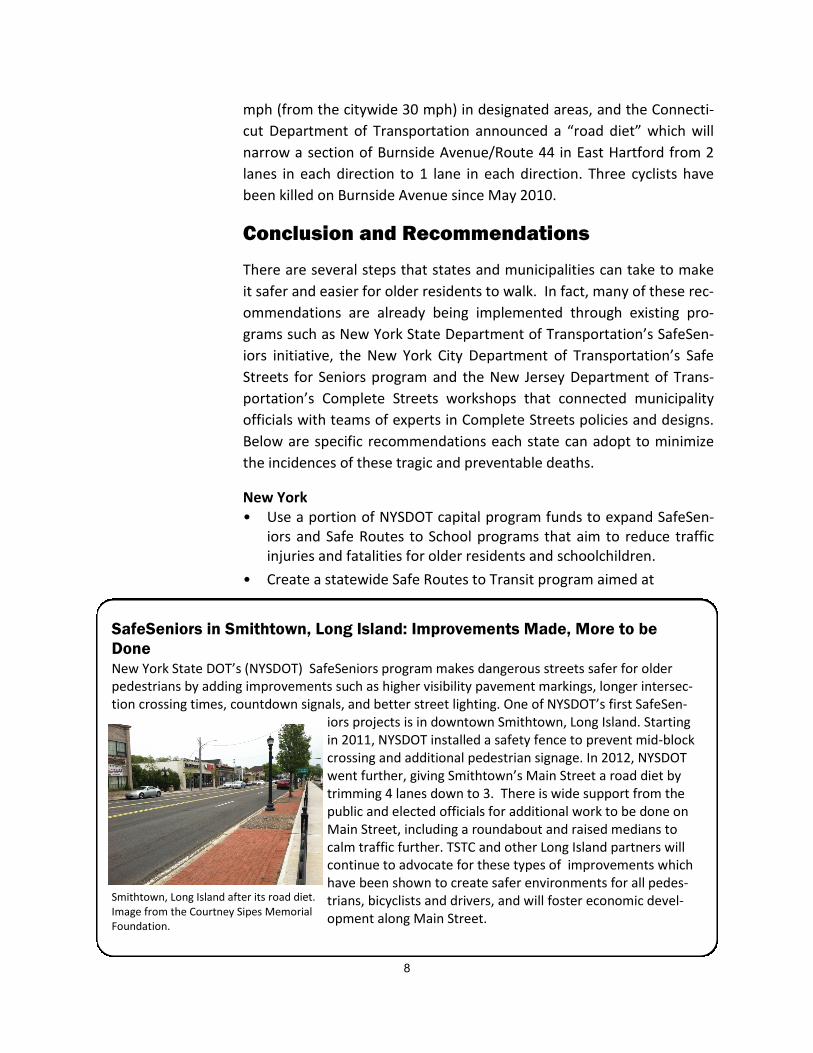
SafeSeniors in Smithtown, Long Island: Improvements Made, More to be
Done New York State DOT’s (NYSDOT) SafeSeniors program makes dangerous streets safer for older pedestrians by adding improvements such as higher visibility pavement markings, longer intersec-tion crossing times, countdown signals, and better street lighting. One of NYSDOT’s first SafeSen-
iors projects is in downtown Smithtown, Long Island. Starting in 2011, NYSDOT installed a safety fence to prevent mid-block crossing and additional pedestrian signage. In 2012, NYSDOT went further, giving Smithtown’s Main Street a road diet by trimming 4 lanes down to 3. There is wide support from the public and elected officials for additional work to be done on Main Street, including a roundabout and raised medians to calm traffic further. TSTC and other Long Island partners will continue to advocate for these types of improvements which have been shown to create safer environments for all pedes-trians, bicyclists and drivers, and will foster economic devel-opment along Main Street.
Smithtown, Long Island after its road diet. Image from the Courtney Sipes Memorial Foundation.

9
Cover image: pedestrian crossing street in Little Falls, New Jersey (image: TSTC)
addressing pedestrian safety needs in the areas around bus stops, sub-way stations, railroad stations and other transit stops. • Pass traffic enforcement measures that make streets safer for pe-
destrians and drivers alike such as red light enforcement cameras and speed cameras in New York City.
• Fund Long Island’s Local Safe Streets and Traffic Calming program, set to be defunded at the end of the year.
New Jersey
• Continue to incentivize municipal-level adoption of Complete Streets policies that require the design of roads to accommodate the needs of all users, including older pedestrians.
• Pass a vulnerable users bill that would stiffen penalties for drivers who recklessly kill or injure pedestrians, bicyclists, highway workers, or state troopers.
• Develop a Safe Streets for Seniors program. Identify and fix some of New Jersey’s most dangerous intersections for senior pedestrians.
Connecticut • Create and fund Safe Routes for Seniors and Safe Routes to Transit
programs.
• Pass a vulnerable users bill that would stiffen penalties for drivers who recklessly kill or injure pedestrians, bicyclists, highway workers, or state troopers.
• Ensure safety funds are spent on pedestrian safety projects, espe-cially for areas around transit that attract high concentrations of pe-destrians.
Challenges for Funding Safer Streets in New Federal Transportation Law The new federal transportation law, Moving Ahead with Progress (MAP-21), will go into effect in Oc-tober 2012. Under the new regulations, funding for bicycle and pedestrian projects has been cut by about one third. In addition, half of the remaining bicycle/pedestrian funding will be “optional,” al-lowing states not to use these funds. State and local leaders must fully utilize these funds to improve safety for bicyclist and pedestrians in their communities, as well as dedicate additional flexible federal funds, and leverage additional state and local resources for these kinds of projects.
10
350 W 31st Street
New York, NY 10001
p: (212) 268-7474 f: (212) 268-7333
www.tstc.org Tri-State Transportation Campaign gratefully acknowledges the foundations that made this report possible: the One Region Funders’ Group and its foundation partners, including Fairfield County Community Foundation, Long Island Community Foundation, New York Community Trust, Rauch Foundation, Surdna Foundation, Emily Hall Tremaine Foundation, and Westchester Community Foundation.