old dogs, new tricks - rethinking country-image studies
TRANSCRIPT
Old dogs, new tricks – Rethinking country-image studies
JASHA BOWE1*, LARRY LOCKSHIN2, RICHARD LEE2 and CAM RUNGIE2
1Research Associate of the Ehrenberg-Bass Institute for Marketing Science, University of South Australia, Adelaide SA 5000, Australia2University of South Australia, School of Marketing North Terrace, Adelaide 5000, Australia
ABSTRACT
In international marketing, countries are often conceptualised as image constructs that have an influence on product image formation.Destination image and country of origin image are held to account for bias in consumer perceptions towards products because of the countryfrom which they originate. Studies in these areas are typically underpinned by attitude-based Likert or semantic differential scale methods,analysed using structural equation models. This paper achieves two key outcomes. Firstly, it adds to the small but growing body of literaturethat looks at the impact of tourism on post-tour, export product evaluations. Secondly, it compares this traditional attitude-based approach tocountry-image studies with an alternative associative network theory approach, operationalised with a free-choice, pick-any survey method,which is popular within the branding literature. We compare the two methods by applying each to the same set of respondents to establish ifthe two methods are complementary, and find they produce different outcomes that could have critical implications for how country-imagestudies are conceptualised and executed. Copyright © 2013 John Wiley & Sons, Ltd.
INTRODUCTION
More than 50 years has been spent in the field of country-of-origin image research exploring how a consumer’s image ofa particular country influences their perceptions of productsfrom that country (Roth and Diamantopoulos, 2009; Elliotet al., 2011). Similarly, tourism industry researchers andtourism marketing scholars have long pondered how theimage of a country would determine how many people wouldvisit it – for pleasure, for business or as potential migrants(Pike, 2002; Dolnicar and Grün, 2013).
Both streams of literature conceptualise countries asimage constructs that have a determined and quantifiableeffect on consumer behaviour. Yet, each literature has carriedout so in relative isolation from the other over many years.Despite this divide, only a handful of study have looked atthe influence of both destination image (DI) and country oforigin image (COI) in influencing product image (PI) in thesame model, and previous works have either considered eachconstruct separately (Lee and Lockshin, 2011) as being anantecedent of the other (Nadeau et al., 2008; Elliot et al.,2011) or as being causally related to the purchase decision(Josiassen and Assaf, 2013) rather than having a direct effecton a non-tour specific products. This paper aims to contributeto this under-researched yet managerially relevant area byconsidering both DI and COI within a single model.
Moreover, studies in these areas are typically underpinnedby attitude-based Likert scale methodologies, analysed usingstructural equation models (SEM). We postulate that thisprevailing conceptualisation of country image in the countryof origin and tourism literature may be too narrowly focusedwithin each discipline to successfully capture the full rangeof effects that a country’s image may have on consumerperceptions and behaviour. In this study, we adopt a two-
method approach to measure the influence that countryimage – being both or either COI from the country of originliterature and/or DI from the tourism literature – has on theformation of PI across the same cohort of respondents.Method 1 examines COI and DI in a traditional format usingLikert scale measures and SEM to assess the relativeinfluence each country-related image has on the formation ofPI. Method 2 draws on an associative network theory (ANT)approach (Anderson and Bower, 1980) operationalised with afree-choice, pick-any survey methodology, which is popularwithin the branding literature (Romaniuk, 2012).
The traditional approach used in Method 1 is consistentwith the classical models of consumer behaviour, withparticular reference to Fishbein and Ajzen’s (1975) theory ofreasoned action, where it is suggested that intention to actand subsequent behaviour are a function of attitude towardsan object. This position dominates country of origin and isprevalent within the tourism studies. However, an influentialbody of literature exists, which is critical of the way Likertscales are used to measure and interpret data (Maxwell andRomaniuk, 2008; Driesener and Romaniuk, 2006; Dolnicaret al., 2004; Jamieson, 2004) and how reliable measures ofattitude are in predicting behaviour (Wright and Klÿn, 1998).In attempting to add knowledge to this area, we considerwhether there is an inherent bias imposed by the traditionalLikert-based SEM approach to country-image studies, whichcauses certain relationships to be stronger or weaker becauseof the method. The particular issues are discussed later.
As a result, Method 2 of this study alternatively conceptu-alises consumer knowledge as stored and retrieved on thebasis of Anderson and Bower’s (1973) ANT of memory.ANT is best measured by first developing a set of items thatconsumers could link to the construct and then using free-choice pick-any surveys and frequency counts to measurethe salience of these items – that is, the cognitive or subcon-scious prominence of attributes in the mind of the consumer(Romaniuk, 2010). No study has looked at the directrelationship between COI, DI and PI using the ANT frame-works and its most frequently associated measure before.
*Correspondence to: Jasha Bowe, Research Associate of the Ehrenberg-Bass Institute for Marketing Science, University of South Australia, AdelaideSA 5000, Australia.E-mail: [email protected]
Copyright © 2013 John Wiley & Sons, Ltd.
Journal of Consumer Behaviour, J. Consumer Behav. 12: 460–471 (2013)Published online in Wiley Online Library (wileyonlinelibrary.com) DOI: 10.1002/cb.1443

In recent years, there has been some strong debateregarding the relevance of country of origin studies. Suchconsiderations are not trivial to the research at hand. Someauthors have criticised COI research as being in a state ofprivileged seclusion from the facts and practicalities of thereal world, suggesting the field has grown increasinglydisconnected with consumer and commercial concern(Usunier, 2006). A field lacking a sufficiently robust theoret-ical framework to help informs the market of manageriallyrelevant and actionable outcomes (Samiee, 2010). Otherauthors, while sharing some of these concerns, are lessscathing and offer a more progressive approach to tacklingthe issues that face the study of country of origin effects(Josiassen and Harzing, 2008). Our paper draws on thesentiment of the latter authors. Believing that COI researchis still a relevant pursuit, our paper contributes to the theoret-ical discourse in the field as well as presenting some manage-rially relevant and actionable findings – something called forby contemporary COI scholars in order for the field to moveforward and continue to be relevant.
In summation, this paper suggests that academics andpractitioners alike should carefully consider how country-image studies are conceptualised and executed – what arethey measuring, why and how? Companies, destination-marketing organisations and governments already seek toleverage domestic and export sales off the image countriesor places have as tourist destinations (ACIL, 2002; Bruwerand Lesschaeve, 2012); as such, this research has significantmanagerial relevance.
BACKGROUND – COUNTRY OF ORIGIN ANDDESTINATION IMAGE STUDIES
Within the realm of international marketing, there are twoprevailing constructs that deal with country as image andthe influence this has on consumer behaviour: (i) tourismDI, which originates from the tourism literature (Balogluand McCleary, 1999; Pike, 2002) and deals with consumers’expectations and evaluation of tour products such as packageholidays, guided tours, accommodation and souvenirs; and(ii) COI, which represents the bias towards goods andservices because of the country they come from (Han,1989; Roth and Diamantopoulos, 2009). Both the DI andthe COI constructs measure a bias towards products in orfrom a given country. In both streams of research, countryimage has been seen to have an effect on consumer percep-tions, behaviour and product evaluations (Echtner andRitchie, 2003; Roth and Diamantopoulos, 2009).
Irrespective of the apparent conceptual similarities,researchers have shown little interest in learning from theprogressions and or alternative measurement approachesused in each other’s respective fields (Papadopoulos, 2004).This is a curious position, particularly in regard to COI stud-ies, which have a longer history and are held to have strongertheoretical grounding, as arguably the last substantial theo-retical contribution to the literature specifically sought towiden the conceptualisation of COI studies. Papadopouloset al. (1993) undertook a wide ranging review of COI studies
highlighting a number of issues, which needed to beaddressed if studies in the area were not to be considered as‘being misleading and too narrow’ (Askegaard and Ger, 1998).They highlighted a need to expand the definition andconceptualisation of product origins and, among other things,called on researchers to consider whole countries as consump-tion items. Such a position virtually demands the integration oftourism and COI studies to provide a more holistic approach tothe way country images are used in consumer product evalua-tions. Other authors have subsequently also called for anintegration of these studies (Kotler and Gertner, 2002), and inparticular, Gnoth (2002) postulated a theoretical frameworkby which this might be achieved.
Despite this, very few empirical works have been pub-lished, which test the proposition that perceptions and imagesof a country as a tour destination may also have an impact onthe perceptions of products from that country (Papadopoulosand Heslop, 1986; Nadeau et al., 2008; Lee and Lockshin,2011; Josiassen and Assaf, 2013). Nevertheless, it is thissmall body of work that has contributed to the synthesis ofthis paper by providing the inspiration for, and conceptualbasis on which to conduct, our research.
In establishing the direct link between tourism and non-tour product evaluations, Lee and Lockshin’s (2011) workis to posit if there exists a direct positive relationship betweenthe Australian DI and its wine, but in the absence of the COIconstruct. Although this is the first paper to examine this linkin this way, we feel that the omission of the COI componentomits a significant component of the research, the one weaim to address here. The other recent works in this area haveinvolved integrated models that include DI measurement as apart of a larger evaluative model included with COI (Rothand Diamantopoulos, 2009).
The two major empirical works produced have appearedin tourism journals and have considered the interface betweenCOI and DI in making tour-related product evaluations.Josiassen and Assaf (2013) consider the interrelationshipbetween destination choice, measured in DI and choice/evaluation of transportation to the destination, via COI –that is, they explicitly operationalise COI in their model.Nadeau et al. (2008) also discuss how COI may be inter-related with DI; however, they argue that it is DI studiesthat can learn from advances in the COI literature and thatthe Nepalese tourist industry may do well to leverage of apositive assessment of its product-country images – it willbe our contention that the opposite position may be trueand that COI studies might be advanced by researchconducted into tourism.
The paper of Nadeau et al. (2008) is the first work toprovide a theoretical platform to support integrating DI andCOI in the same model.
Product country image (PCI) and tourist destination image(TDI) are two fields of research that have evolved sepa-rately through distinct literature and research communi-ties, yet developments in the former can contributesignificantly to the latter.
In this paper, they acknowledge and identify the areas wherecountry of origin and destination image crossover.
Old dogs, new tricks – Rethinking country-image studies 461
Copyright © 2013 John Wiley & Sons, Ltd. J. Consumer Behav. 12: 460–471 (2013)
DOI: 10.1002/cb
In particular, they identify the ‘touch points’ wherenaturally and necessarily the fields already overlap, such asplace-branding, the promotion of major events and the useof tourism as a control variable for COI research. Theyexplain that from an attitude theory framework consideringthe two constructs together under the broader country-imagemoniker can lead to the better understanding of touristintentions. They argue that it is DI studies that can learn fromadvances in the COI literature. Specifically, they suggest theNepalese tourist industry may do well to leverage of a posi-tive assessment of its product-country images. Although theyindicate that other authors (i.e. Mossberg and Kleppe, 2005)have made attempts to include facets of each field in studiesby including place and destination images in country oforigin research, until their paper, no substantive theory hadbeen posited justifying the need for or appropriateness ofdoing so. They further present an attitude theory-basedmodel integrating the two fields/image constructs, findingthat incorporating product-country image helps predicttourist intentions.
Josiassen and Assaf (2013) provide the most recent exam-ple of a study, which specifically considers COI measures inconjunction with DI. They consider the interrelationshipbetween destination choice, measured in DI and choice/evaluation of transportation to the destination, via COI –that is, they explicitly operationalise COI in their model.They use a two-study approach to their investigation, theintegration of a COI measure appears in the second study.Although it is not the primary concern of the paper, it isstill of key importance to this research as it is one of thefew studies to consider the two country constructs togetherin one model.
In their research, the COI aspect relates specifically to thechoice of airline that tourists consider when planning aholiday. Specifically, the choice of a particular country’sairline was measured in terms of country competencies suchas that country’s airline being of high quality, being betterthan the same service offering from another country, and thatcountry having a long history of providing airline services.They found that the airline choice was a more importantinformation cue in the decision-making process; the morethe holiday being selected was considered as being sociallyvisible – that is, where the public (i.e. friends, family andcolleagues) will be able to evaluate it, in comparison towhere the evaluation will be limited to the individual makingthe decision. They further found that individuals moresusceptible to normative influence were more sensitive tothe COI information than those less susceptible. Despite theCOI construct not being the main issue under investigation,this study provides an excellent example of the possibilityof integrating COI considerations in tourism studies. Thekey difference with our study is that we are integrating DIin a country of origin context.
Despite these works – which are all underpinned bytraditional Likert-based SEM or hierarchical regressionanalysis – we are not aware of any paper that simultaneouslymodels the two country-image constructs as having a directinfluence over the formation of non-tour related PI. Likewise,no other study utilises two different methods and theoretical
approaches to measuring this. We feel this denotes a gap thatshould be addressed in order to more deeply consider whatrole DI has in the formation of product beliefs and associa-tions. This paper tests this possible relationship in threeways: (i) by simultaneously modelling both constructs’ influ-ence on PI for two product categories; (i) by individuallymodelling each construct’s influence on PI for the sametwo categories of product; and by (3) considering an alterna-tive method for measuring the influence of each construct onPI for the two product categories, which combines bothconstructs into one set of consumer memory structuresrelevant to their image of the country’s products.
SAMPLE COMPOSITION
Selecting respondents from China was deemed appropriategiven the great interest companies from many countries havein entering the large Chinese consumer and outboundtourism markets. An international consumer panel companyprovided 286 respondents who took part in an online survey.
Respondents were sourced from the Chinese SpecialEconomic Zones (SEZs), which represent a concentrationof Chinese wealth and in and outbound economic activity.The majority of respondents came from the large cities ofGuangzhou (Guangdong province), Jiangsu, Shanghai andBeijing; however, other provinces in the SEZ and CoastalDevelopment Areas were all well and evenly represented.The respondents came from a diverse range of industries withnone particularly overrepresented, although overall theseindustries were of a skilled rather than unskilled nature.Respondent’s ages ranged from 18 to 60 years, with 33 per centwomen and 67 per cent men.
The respondents had to have been on an overnight holidayat least once in the past 2 years. From a larger sample, onlyrespondents who had specifically been to Australia onholiday were used in the analysis. Respondents not meetingthis criterion were excluded from the analysis after the datawere collected. The survey was unmarked – that is, respon-dents could not determine which country the survey originatedfrom – and presented in simplified Chinese. All participantsanswered exactly the same questions so that a within-subjectanalysis of the results could be performed, although questionswere randomised to reduce response bias.
As the study was based in Australia, two product catego-ries, seafood and wine, were selected, which representedgrowing Australian export markets in China. China isforecast to become Australia’s largest tourism source marketby 2017, with a forecast of 860 000 visitors per annum by2020 (Tourism Australia, 2011). At the same time China isthe largest growth market for Australian wine, but accountedfor only 6% by volume and 12% by value of Australia’s totalwine exports in 20011–2012 (Wine Australia, 2013). Austra-lian wine only accounts for 13% by volume and 15% byvalue of the imported wine market in China (Wine Australia,2013). Similarly, although China holds great potential forthe export of Australian seafood products, it currently sitsonly sixth behind Japan, Hong Kong, Taipei, the USA andSingapore in export value (Australian Government, 2010).
462 J. Bowe et al.
Copyright © 2013 John Wiley & Sons, Ltd. J. Consumer Behav. 12: 460–471 (2013)
DOI: 10.1002/cb
The combination of the increase in Chinese tourists to Australiaand the relatively low market share, together with the awarenessof Australian wine and seafood domestically in China, meansthat country-of-origin perceptions for these products might bedeveloping from a tourism image-related perspective. Theseproduct categories are not well advertised, so there wouldbe few initial impressions, which provides a suitable platformto seek the answers to the research objectives.
To obscure which country the survey originated from,which would otherwise confound the results, and to allowfor comparisons in part 2 of the study, a competitive set ofseven countries was selected for use that was representativeof countries that produce seafood and wine available inChina and, also, countries that Chinese tourists visit. Thesecountries were chosen to determine a range of both country-of-origin perceptions and tourist destination perceptionsregarding the product categories of wine and seafood. Theseven countries are South Africa, France, England, the USA,Australia, New Zealand and Chile.
METHODOLOGY
Scale item and attribute elicitationConsistent with the approaches in many studies (particularlyin tourism) and adopting Churchill’s (1979) approach toscale development, we have used a two-phase approach dodeveloping the scale and attribute items used in the study –a qualitative phase and a qualitative phase. To do this, wefirst needed to establish a list of salient-attribute items tofacilitate the assessment of the twomethodological approaches.
To do this, we ran two attribute-elicitation focus groups withChinese consumers in Australia – one of visiting Chinese inter-national students (n=13) and one of older and more long-termChinese visitors or permanent residents (n=9).
Respondents were required to be Chinese nationals andconsumers in China (i.e. not child migrants), to have been inAustralia longer than 3months, and to have partaken in at leastone tourist activity while here. Many had numerous experi-ences. Time spent in Australia ranged from 4months to10 years, ages ranged from 19 to 40 years, 15 different Chineseprovinces were represented (including both rural and urban/major city areas) and tourist experiences ranged from asingle trip to Harbour Town (a discount shopping destina-tion in Adelaide) to tours and visits to Sydney, Melbourne,Perth and the Great Barrier Reef. We asked the respondentsof each group to think freely of attributes relating to thefollowing anchor concepts: Australia as a tourist destination(DI), Australia as a country of origin for export products(COI), Australian seafood and Australian wine.
Following this process and a review of the literature, wedeveloped purified scales and pick-any batteries by integrat-ing the results of the focus groups with items alreadydeveloped for each of the main constructs. Specifically, wedrew on the following studies to define our scale items andconstructs – for DI, we use seven items drawn from Beerliand Martin (2004) and Baloglu and McCleary (1999); forCOI, we used a five-item scale drawn from Parameswaranand Pisharodi (1994) and Heslop et al. (2008); whereas for(wine/seafood) PI, two 5-item scales are used drawn fromLee and Lockshin (2011) and Gil and Sanchez (1997). Thesescale items can be seen in Table 1. The attribute items used
Table 1. Likert scale items for constructs in all models
Constructs and indicator variables Mean Standard deviation Com. n
Country of origin image (COI)Australia is rich in natural resources 5.94 1.09 0.73 286Australia is a rich country 5.90 1.02 0.74 286Australia has good government infrastructure 5.76 1.14 0.75 286Australia produces high-quality goods 5.68 1.09 0.74 286Australia is a technologically advanced country 5.60 1.13 0.67 286
Destination Image (DI)Australia has natural scenic beauty 5.89 1.30 0.79 286Australia has beautiful seasides & beaches 5.86 1.27 0.85 286Australia has unique environments to explore 5.84 1.27 0.79 286Australia has famous attractions 5.80 1.30 0.81 286Australia has unique wildlife 5.80 1.38 0.73 286Australia has a clean environment 5.79 1.29 0.82 286Australia is a value for money holiday destination 5.75 1.28 0.81 286Australia has a variety of recreational activities 5.55 1.25 0.65 286
Product image – wineAustralian wine is suitable for gifts 5.67 1.15 0.74 286Australian wine is high quality 5.60 1.10 0.81 286Australian wine is very stylish 5.55 1.12 0.75 286Australian wine is a status product 5.47 1.14 0.77 286Australian wine is well known in China 5.34 1.22 0.75 286
Product image – seafoodAustralian seafood is high quality 5.80 1.05 0.77 286Australian seafood is fresh 5.79 1.02 0.74 286Australian seafood is suitable for gifts 5.79 1.04 0.74 286Australian seafood is large 5.73 1.05 0.72 286Australian seafood is value for money 5.67 1.03 0.69 286
Old dogs, new tricks – Rethinking country-image studies 463
Copyright © 2013 John Wiley & Sons, Ltd. J. Consumer Behav. 12: 460–471 (2013)
DOI: 10.1002/cb
for the pick and batteries can be seen in Table 8, where theyare utilised in the results.
METHOD 1 – LATENT STRUCTURE ANALYSIS:MEASURING COI AND DI
Typically, COI and DI are measured as latent constructsusing pre-tested scales and are related to other constructsusing covariance structure modelling (SEM). It is importantto note that although the fit of a latent variable model to thedata might not prove the existence of causality betweenoperationalised latent variables, the researcher can formulatethis as a hypothesis, and as a result, the fit of such models canbe offered as evidence supporting the hypothesis (Borsboomet al., 2003). The great majority of SEM are formulated usingLikert scales, where responses are anchored on statementslike ‘strongly agree’ and ‘strongly disagree’, with a varyingnumber of scaling points in-between. This form of analysisdominates both COI and DI studies.
We used a self-reported, 7-point Likert scale survey instru-ment (as detailed in the previous section) to measure DI, COIand PI. The scales used in part 1 of the study, synthesised fromexisting scales and the preceding qualitative phase, aredisplayed in Table 1 along with their mean, standard deviationand communality scores derived from an exploratory factoranalysis. Table 2 is a matrix that details the correlationsbetween the factorised constructs being operationalised. Ascan be observed, no correlation between any of the constructsexceeds 0.8, which indicates there are no issues withmulti-colinearity in the data (Hair et al., 2010).
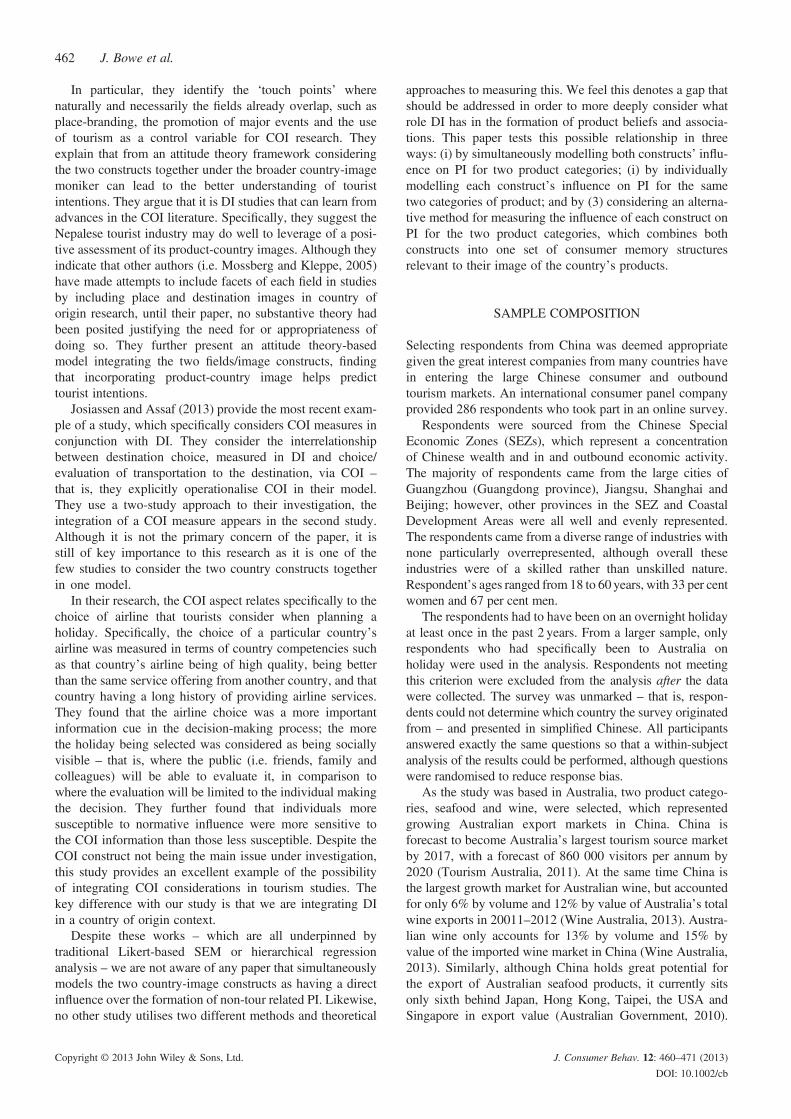
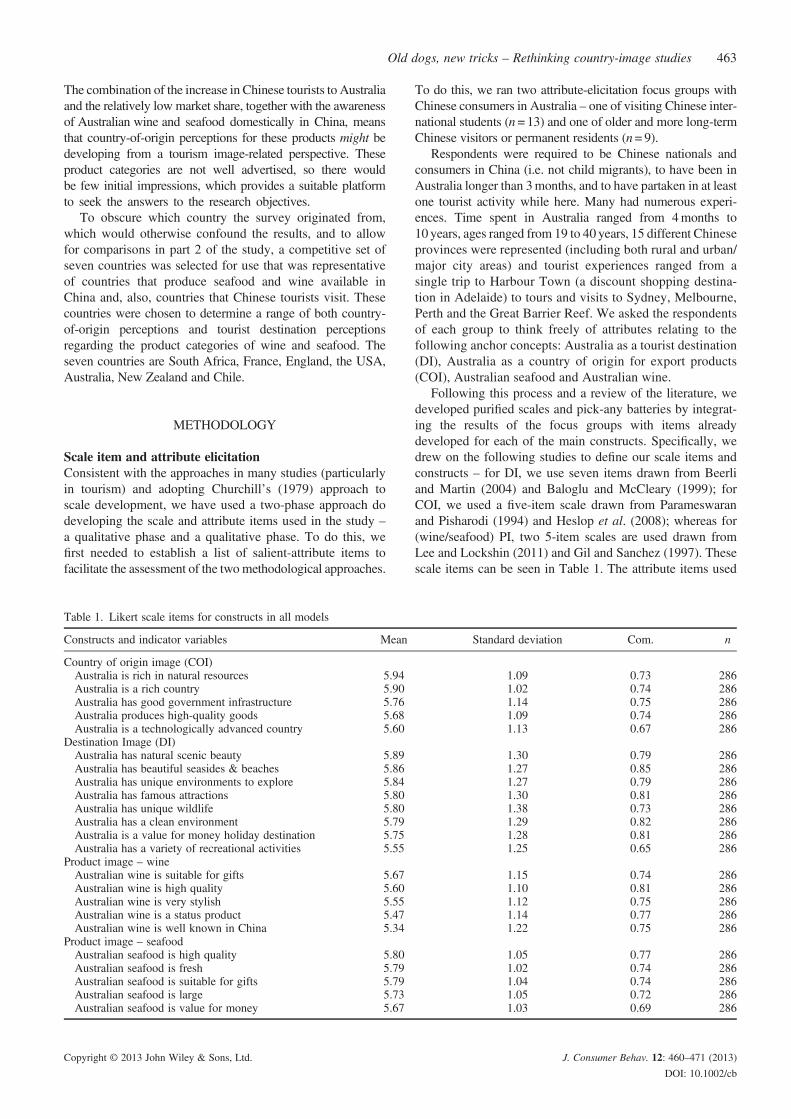
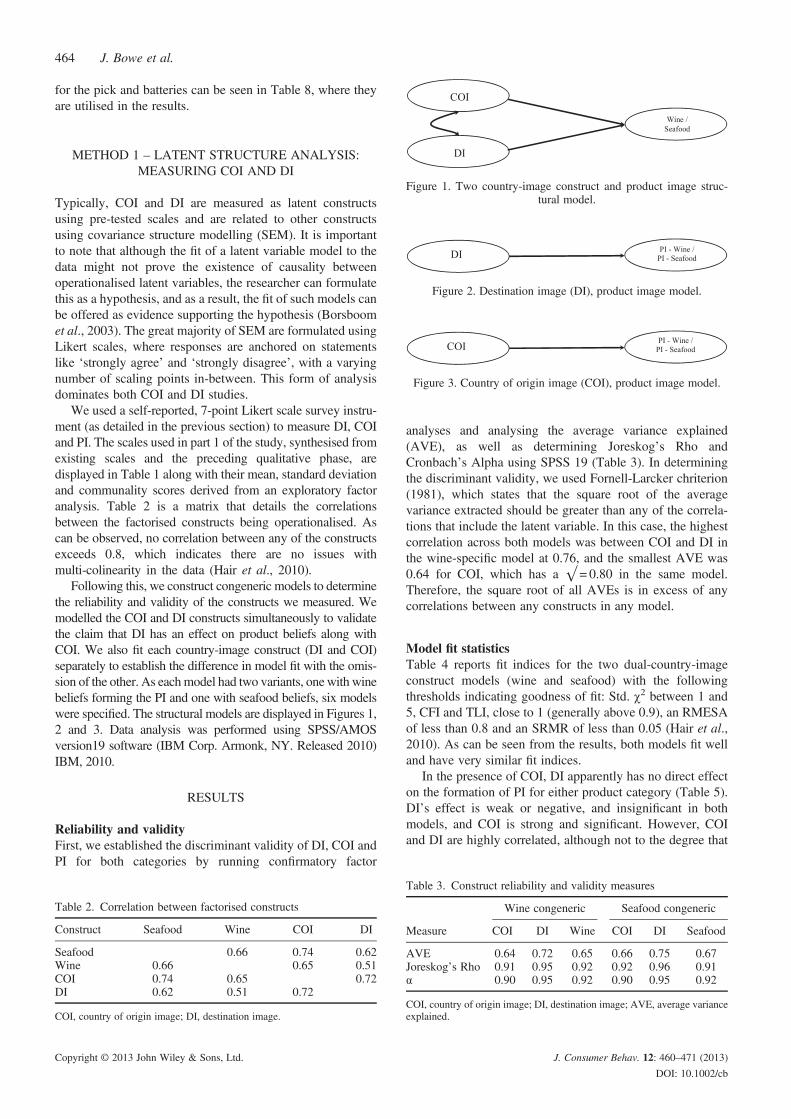
Following this, we construct congeneric models to determinethe reliability and validity of the constructs we measured. Wemodelled the COI and DI constructs simultaneously to validatethe claim that DI has an effect on product beliefs along withCOI. We also fit each country-image construct (DI and COI)separately to establish the difference in model fit with the omis-sion of the other. As eachmodel had two variants, one with winebeliefs forming the PI and one with seafood beliefs, six modelswere specified. The structural models are displayed in Figures 1,2 and 3. Data analysis was performed using SPSS/AMOSversion19 software (IBM Corp. Armonk, NY. Released 2010)IBM, 2010.
RESULTS
Reliability and validityFirst, we established the discriminant validity of DI, COI andPI for both categories by running confirmatory factor
analyses and analysing the average variance explained(AVE), as well as determining Joreskog’s Rho andCronbach’s Alpha using SPSS 19 (Table 3). In determiningthe discriminant validity, we used Fornell-Larcker chriterion(1981), which states that the square root of the averagevariance extracted should be greater than any of the correla-tions that include the latent variable. In this case, the highestcorrelation across both models was between COI and DI inthe wine-specific model at 0.76, and the smallest AVE was0.64 for COI, which has a √= 0.80 in the same model.Therefore, the square root of all AVEs is in excess of anycorrelations between any constructs in any model.
Model fit statisticsTable 4 reports fit indices for the two dual-country-imageconstruct models (wine and seafood) with the followingthresholds indicating goodness of fit: Std. χ2 between 1 and5, CFI and TLI, close to 1 (generally above 0.9), an RMESAof less than 0.8 and an SRMR of less than 0.05 (Hair et al.,2010). As can be seen from the results, both models fit welland have very similar fit indices.
In the presence of COI, DI apparently has no direct effecton the formation of PI for either product category (Table 5).DI’s effect is weak or negative, and insignificant in bothmodels, and COI is strong and significant. However, COIand DI are highly correlated, although not to the degree that
Table 2. Correlation between factorised constructs
Construct Seafood Wine COI DI
Seafood 0.66 0.74 0.62Wine 0.66 0.65 0.51COI 0.74 0.65 0.72DI 0.62 0.51 0.72
COI, country of origin image; DI, destination image.
Figure 1. Two country-image construct and product image struc-tural model.
Figure 2. Destination image (DI), product image model.
Figure 3. Country of origin image (COI), product image model.
Table 3. Construct reliability and validity measures
Measure
Wine congeneric Seafood congeneric
COI DI Wine COI DI Seafood
AVE 0.64 0.72 0.65 0.66 0.75 0.67Joreskog’s Rho 0.91 0.95 0.92 0.92 0.96 0.91α 0.90 0.95 0.92 0.90 0.95 0.92
COI, country of origin image; DI, destination image; AVE, average varianceexplained.
464 J. Bowe et al.
Copyright © 2013 John Wiley & Sons, Ltd. J. Consumer Behav. 12: 460–471 (2013)
DOI: 10.1002/cb
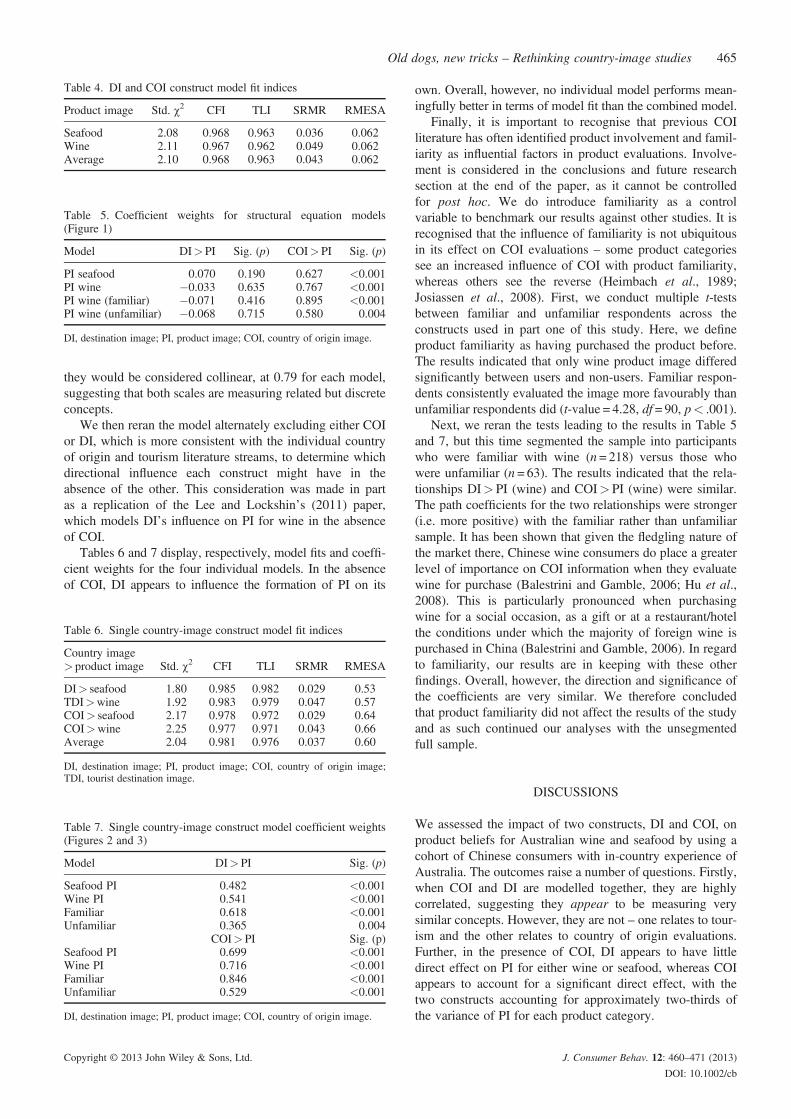
they would be considered collinear, at 0.79 for each model,suggesting that both scales are measuring related but discreteconcepts.
We then reran the model alternately excluding either COIor DI, which is more consistent with the individual countryof origin and tourism literature streams, to determine whichdirectional influence each construct might have in theabsence of the other. This consideration was made in partas a replication of the Lee and Lockshin’s (2011) paper,which models DI’s influence on PI for wine in the absenceof COI.
Tables 6 and 7 display, respectively, model fits and coeffi-cient weights for the four individual models. In the absenceof COI, DI appears to influence the formation of PI on its
own. Overall, however, no individual model performs mean-ingfully better in terms of model fit than the combined model.
Finally, it is important to recognise that previous COIliterature has often identified product involvement and famil-iarity as influential factors in product evaluations. Involve-ment is considered in the conclusions and future researchsection at the end of the paper, as it cannot be controlledfor post hoc. We do introduce familiarity as a controlvariable to benchmark our results against other studies. It isrecognised that the influence of familiarity is not ubiquitousin its effect on COI evaluations – some product categoriessee an increased influence of COI with product familiarity,whereas others see the reverse (Heimbach et al., 1989;Josiassen et al., 2008). First, we conduct multiple t-testsbetween familiar and unfamiliar respondents across theconstructs used in part one of this study. Here, we defineproduct familiarity as having purchased the product before.The results indicated that only wine product image differedsignificantly between users and non-users. Familiar respon-dents consistently evaluated the image more favourably thanunfamiliar respondents did (t-value = 4.28, df = 90, p< .001).
Next, we reran the tests leading to the results in Table 5and 7, but this time segmented the sample into participantswho were familiar with wine (n= 218) versus those whowere unfamiliar (n = 63). The results indicated that the rela-tionships DI> PI (wine) and COI> PI (wine) were similar.The path coefficients for the two relationships were stronger(i.e. more positive) with the familiar rather than unfamiliarsample. It has been shown that given the fledgling nature ofthe market there, Chinese wine consumers do place a greaterlevel of importance on COI information when they evaluatewine for purchase (Balestrini and Gamble, 2006; Hu et al.,2008). This is particularly pronounced when purchasingwine for a social occasion, as a gift or at a restaurant/hotelthe conditions under which the majority of foreign wine ispurchased in China (Balestrini and Gamble, 2006). In regardto familiarity, our results are in keeping with these otherfindings. Overall, however, the direction and significance ofthe coefficients are very similar. We therefore concludedthat product familiarity did not affect the results of the studyand as such continued our analyses with the unsegmentedfull sample.
DISCUSSIONS
We assessed the impact of two constructs, DI and COI, onproduct beliefs for Australian wine and seafood by using acohort of Chinese consumers with in-country experience ofAustralia. The outcomes raise a number of questions. Firstly,when COI and DI are modelled together, they are highlycorrelated, suggesting they appear to be measuring verysimilar concepts. However, they are not – one relates to tour-ism and the other relates to country of origin evaluations.Further, in the presence of COI, DI appears to have littledirect effect on PI for either wine or seafood, whereas COIappears to account for a significant direct effect, with thetwo constructs accounting for approximately two-thirds ofthe variance of PI for each product category.
Table 4. DI and COI construct model fit indices
Product image Std. χ2 CFI TLI SRMR RMESA
Seafood 2.08 0.968 0.963 0.036 0.062Wine 2.11 0.967 0.962 0.049 0.062Average 2.10 0.968 0.963 0.043 0.062
Table 5. Coefficient weights for structural equation models(Figure 1)
Model DI>PI Sig. (p) COI> PI Sig. (p)
PI seafood 0.070 0.190 0.627 <0.001PI wine �0.033 0.635 0.767 <0.001PI wine (familiar) �0.071 0.416 0.895 <0.001PI wine (unfamiliar) �0.068 0.715 0.580 0.004
DI, destination image; PI, product image; COI, country of origin image.
Table 6. Single country-image construct model fit indices
Country image> product image Std. χ2 CFI TLI SRMR RMESA
DI> seafood 1.80 0.985 0.982 0.029 0.53TDI>wine 1.92 0.983 0.979 0.047 0.57COI> seafood 2.17 0.978 0.972 0.029 0.64COI>wine 2.25 0.977 0.971 0.043 0.66Average 2.04 0.981 0.976 0.037 0.60
DI, destination image; PI, product image; COI, country of origin image;TDI, tourist destination image.
Table 7. Single country-image construct model coefficient weights(Figures 2 and 3)
Model DI> PI Sig. (p)
Seafood PI 0.482 <0.001Wine PI 0.541 <0.001Familiar 0.618 <0.001Unfamiliar 0.365 0.004
COI> PI Sig. (p)Seafood PI 0.699 <0.001Wine PI 0.716 <0.001Familiar 0.846 <0.001Unfamiliar 0.529 <0.001
DI, destination image; PI, product image; COI, country of origin image.
Old dogs, new tricks – Rethinking country-image studies 465
Copyright © 2013 John Wiley & Sons, Ltd. J. Consumer Behav. 12: 460–471 (2013)
DOI: 10.1002/cb

When DI-only models are run separately, they alsodisplay excellent model fit, with a significant positive effecton PI that accounts for approximately one-third of PI’svariance in each product category. When COI is run alonewith PI, it also achieves very good model fit. The regressionweight from COI to PI and the amount of variance that COIaccounts for are very similar to those it exerts in the dual-construct model. So the quandary remains; given theseresults, what does this indicate?
Even when controlling for product familiarity, the resultsdo not differ in their inference. Although there is a significantdifference between users and non-users of wine in regard tothe assessment of wine attributes (with no other significantdifference on any variable for wine or seafood users), thedifference is indicative of the well-known image usage bias,where users of a product/brand commonly indicate higherevaluations of product attributes than non-users do. Thus,the directional relationships inferred by the models relatingto wine remain unchanged, although the effect size is slightlylarger for users. What is interesting is that the seafoodevaluations between users and non-users do not differ, mean-ing that the effect of the country and product-specific dimen-sions respondents’ evaluations are seemingly unaffected byfamiliarity with the product.
It seems, however, that despite their parsimonious nature,good-fit statistics and interesting familiarity characteristics,these models do not give a great insight into the mind of theChinese tourist or export consumer. It seems difficult to drawdefinitive conclusions from the results, and they do not provideany clarity in supporting or rebuffing the espousals madeearlier in the paper, or the results found in other papers thatsuggest DI has a demonstrative influence on PI.
In light of this, we considered if there is some methodo-logical influence or constraint being imposed that allowsfor a parsimonious model that fits well but does not accuratelyrepresent the actual processes used in image formation. Wefeel that the forced-choice nature of Likert scale questionsresults in measurements of attributes that may not actually bepart of the image structure for some or even all respondents.Relationships that may not exist if measured differently canbe reported.
As a result, part 2 of the study examines whether a differ-ent theoretical approach, the ANT of memory and its mostcommonly associated measurement methodology, might beable to answer the issues raised in part 1.
METHOD 2 – ANT ANALYSIS: MEASURING COI, DIAND PRODUCT IMAGE
We propose that the ANT of memory (Anderson and Bower,1973) might better explain the results we found and that thisis a reasonable theory to test the coalescence between the twostreams of research. A review of the literature in branding,memory and psychology supports this proposition.
Human memory and associative network theoryDrawing on the psychology (Fazio, 2001), memory (Andersonand Bower, 1973) and marketing (Keller, 1993) literature, it is
widely accepted that human memory is constructed of a bi-directionally interlinked network of information chunks thatare used for cataloguing and storing information. Theseinformation chunks, which are referred to as nodes, are createdin human memory to reduce cognitive effort (Miller, 1956)when encountering a problem-solving situation – such as apurchase scenario. The links established between the nodesare said to represent meaningful associations (Nedungadi,1990). The ANT of memory further defines memory as havingtwo discrete states: working memory and long-term memory(Nedungadi, 1990; Romaniuk, 2006).
Working memory is the place where information isrecalled and processed from long-term memory. Long-termmemory is suggested to have virtually unlimited storagecapacity – that is, all information encountered can beprocessed into long-term memory. However, the propensityof that information to be recalled is determined by a numberof factors (Driesener and Romaniuk, 2006). Working mem-ory usually facilitates the transit of information from long-term memory for a short period and is triggered by anenvironmental cue or stimuli. The temporal nature ofshort-term memory has been explored in a number ofstudies that suggest humans can only process between fourand eight pieces of information simultaneously in workingmemory – that is, it has limited capacity (Miller, 1956;Nedungadi, 1990).
Because short-term memory has limited capacity, peopletend to chunk or summarise information in a way that makesit easier to store and retrieve from long-term memory (Miller,1956). Such informational chunks can consist of a mix ofsemantic, auditory, visual and affective information. In aconsumer setting, this may result from product experienceand/or marketing communications. This allows pieces ofproduct information – such as brand, price or COI – to functionas a cue into which consumers consolidate previously acquiredproduct knowledge. Consumers augment their existing productknowledge with extra information that may enhance orsimplify their purchase decision. Keller (1993; 2003) acknowl-edges that using ANT allows marketers to understand howbrands and brand knowledge are created in memory, andnow, these principles are starting to be applied in the area oftourism and place-branding (Pike, 2010).
The information encountered during brand or productexperiences, if processed as posited by ANT, becomes linkedto the brand name (anchor concept) in a consumer’s memory(Romaniuk and Sharp, 2004). Associative theories ofmemory have been applied in a branding context to explainhow a brand is represented in memory (Keller, 1993;Krishnan, 1996; Keller, 2001), describing the brand as agroup of elements or concepts (nodes) that are meaningfullyassociated to a target word or anchor (Krishnan and Shapiro,1996). Brand associations result from this form of informa-tion processing. These associations have a multitude ofoutcomes, including being components of the consumer’soverall brand attitude or performing as heuristics forinformation processing during product selection and con-sumption situations (Driesener and Romaniuk, 2006). More-over, they play an important role in a key memory process:information retrieval.
466 J. Bowe et al.
Copyright © 2013 John Wiley & Sons, Ltd. J. Consumer Behav. 12: 460–471 (2013)
DOI: 10.1002/cb
When retrieving items from memory, a source node isactivated by an external or environmental cue. Activatingone node can result in a flow of activation that spreadsthrough the links or associations from that node to all ofthe nodes it connects to (Collins and Loftus, 1975). Twofactors determine whether the image object (i.e. Australia)is retrieved: (i) whether associations with the object exist inmemory at all, and (ii) if they do, the strength of the associa-tive links between the item in memory in relation to thesource or activation node (the stimuli) and relative to othersimilar associations – that is, their salience. Hence, the moresalient the attribute in the mind of the consumer, the morelikely it is to activate a network of associations (Driesenerand Romaniuk, 2006). This implies that there is a thresholdfor node and consequential network activation. This thresh-old is context-specific and generally held to be heteroge-neous between individuals. However, in all cases, the linkand node strength has to be sufficient for activation to occur(Collins and Loftus, 1975). This means those images that arethe strongest and most easily accessible will deliver thestrongest and most consistent influences on behaviour byactivating more nodes in a network.
Free-choice, pick-any surveys for measuring associativenetworksThe optimal survey method for measuring associative net-works, as derived from the brand salience literature (Driesenerand Romaniuk, 2006), is a pick-any type instrument, whererespondents are able to freely select attributes which theyassociate with a brand, rather than being forced to rate one ormore brands on a scale as with a Likert-type survey.
The optimal instrument contains a representative range ofattributes/cues that could be used to ‘think of’ a brand. Itshould measure how a brand is recalled or noticed relativeto a set of competitors rather than for a brand alone. Thishelps to determine how mentally available a brand is com-pared with its rivals and to establish which nodes and mentalnetworks are associated with a brand. Much of the focus ofthis technique is to determine whether a brand is actuallythought of rather than seeking to determine how favourablyit is judged (Driesener and Romaniuk, 2006). Unless a brandis actually thought of in a purchase situation, it does notmatter how favourably someone rates the brand on paper.As Driesener and Romaniuk (Driesener and Romaniuk,2006) point out, ‘someone might not choose a brand withthe pick-any technique but give that brand a high rating whenforced to respond with a rating measure’. This is an issue inbrand image studies. In this study, the brand is actually thecountry, Australia.
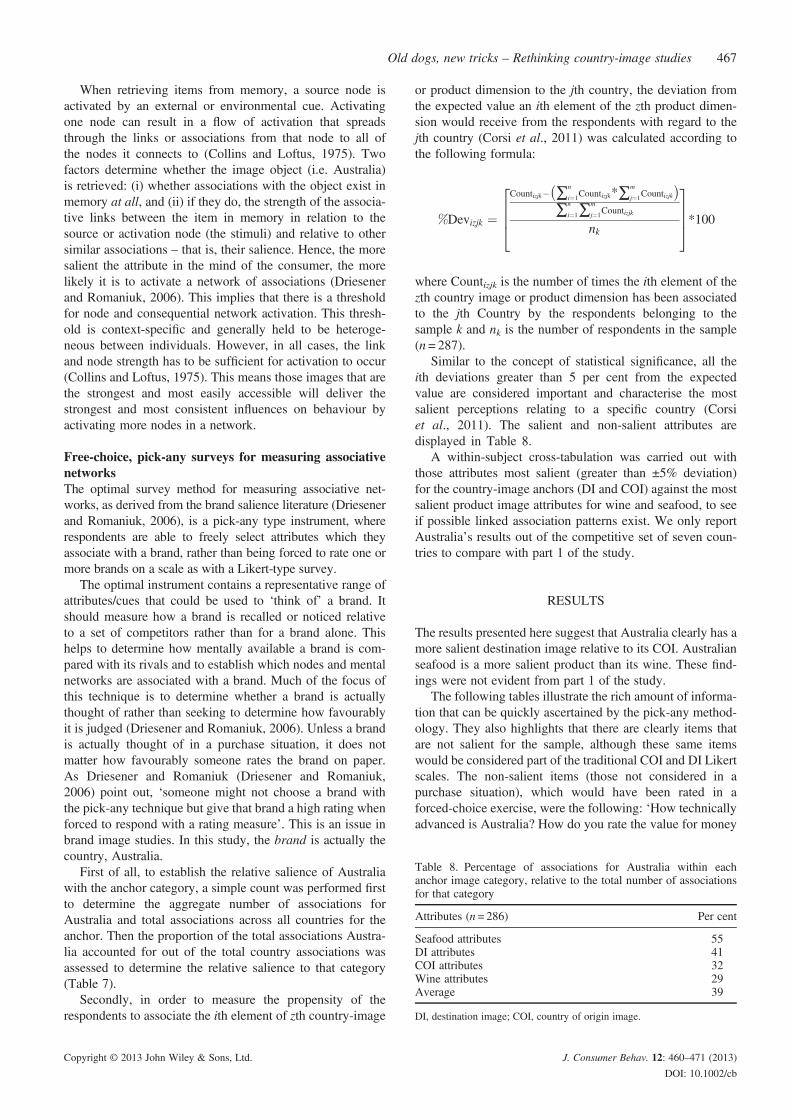
First of all, to establish the relative salience of Australiawith the anchor category, a simple count was performed firstto determine the aggregate number of associations forAustralia and total associations across all countries for theanchor. Then the proportion of the total associations Austra-lia accounted for out of the total country associations wasassessed to determine the relative salience to that category(Table 7).
Secondly, in order to measure the propensity of therespondents to associate the ith element of zth country-image
or product dimension to the jth country, the deviation fromthe expected value an ith element of the zth product dimen-sion would receive from the respondents with regard to thejth country (Corsi et al., 2011) was calculated according tothe following formula:
%Devizjk ¼Countizjk� ∑n
i¼1Countizjk*∑m
j¼1Countizjk� �∑n
i¼1∑m
j¼1Countizjk
nk
2664
3775*100
where Countizjk is the number of times the ith element of thezth country image or product dimension has been associatedto the jth Country by the respondents belonging to thesample k and nk is the number of respondents in the sample(n = 287).
Similar to the concept of statistical significance, all theith deviations greater than 5 per cent from the expectedvalue are considered important and characterise the mostsalient perceptions relating to a specific country (Corsiet al., 2011). The salient and non-salient attributes aredisplayed in Table 8.
A within-subject cross-tabulation was carried out withthose attributes most salient (greater than ±5% deviation)for the country-image anchors (DI and COI) against the mostsalient product image attributes for wine and seafood, to seeif possible linked association patterns exist. We only reportAustralia’s results out of the competitive set of seven coun-tries to compare with part 1 of the study.
RESULTS
The results presented here suggest that Australia clearly has amore salient destination image relative to its COI. Australianseafood is a more salient product than its wine. These find-ings were not evident from part 1 of the study.
The following tables illustrate the rich amount of informa-tion that can be quickly ascertained by the pick-any method-ology. They also highlights that there are clearly items thatare not salient for the sample, although these same itemswould be considered part of the traditional COI and DI Likertscales. The non-salient items (those not considered in apurchase situation), which would have been rated in aforced-choice exercise, were the following: ‘How technicallyadvanced is Australia? How do you rate the value for money
Table 8. Percentage of associations for Australia within eachanchor image category, relative to the total number of associationsfor that category
Attributes (n= 286) Per cent
Seafood attributes 55DI attributes 41COI attributes 32Wine attributes 29Average 39
DI, destination image; COI, country of origin image.
Old dogs, new tricks – Rethinking country-image studies 467
Copyright © 2013 John Wiley & Sons, Ltd. J. Consumer Behav. 12: 460–471 (2013)
DOI: 10.1002/cb

and quality of, or attention to detail paid to, Australianproducts?’
Looking at the average percentage of respondents whoselected both a salient country image and a PI attribute(Tables 8), it is clear that Australia PIs for wine and seafoodwere more often associated with DI than COI attributes foreach product category (Table 10).
It is important to note that Table 9 delineates only thoseitems that are particularly salient for Australia, relative tothe other countries. There are many other attributes in thepick-any battery, but those attributes not listed are more orless equally shared between the competitor countries (i.e.there is homogeneity to their level of salience).
The data are characterised by a consistent pattern: tourismattributes play a far larger role in activating memory struc-tures than country of origin attributes. Further, scale itemsthat would traditionally be considered in country-of-originstudies appear not to be brought to mind spontaneouslyin a product evaluation. This result is supportive of ourdiscussion in part 1.
DISCUSSIONS
Much existing literature in international marketing links COIto consumer product perceptions. In tourism literature, thereis a focus on DI as the link to travel intention and behaviour,as well as on-tour spending and post-tour holiday evalua-tions. However, following from part 1, we see results thatalign with the suggestion of several papers (Papadopoulosand Heslop, 1986; Elliot et al., 2011; Lee and Lockshin,2011) that the image of a country as a tour destination alsohas an impact on the perceptions of products produced in thatcountry. We propose that the ANT of memory drawn from
memory, branding and recent tourism literature, and itsassociated pick-any-survey approach offers a more insightfulexplanation of this phenomenon than traditional COI mea-sures using Likert scales.
We can draw a number of conclusions from our results.First, we can confirm that country image, both DI and COI,has an influence on product perceptions and that this isconsistent with the halo effect known in country-of-originresearch. By using traditional attitudinal Likert-based meth-odology analysed using SEM, COI appears to consistentlydominate the theorised relationship between country and PIformation; it appears to be the main driver of PI formationwhenever it is included in the structural model irrespectiveof the product category. In considering why this may be thecase, we suggest that the scales derived from the traditionalcountry of origin and tourism literature are phrased in sucha way that they skew responses towards a COI-dominatedrelationship, for both seafood and wine. Particularly, ifrespondents are required to rate a country on its tourism attri-butes (i.e. how beautiful its beaches are and the uniquenessof its wildlife) and country-of-origin attributes (such as thequality of its manufacturing and level of technologicaladvancement), then rate the country’s products on product-specific attributes such as quality, freshness and whetherthe product is safe to consume.
Table 9. Salient/non-salient country and product image attributes for Australia
Salient (>%5 dev.) Non-Salient (<�%5 dev.)
Destination image Friendly people International sporting eventsPromoted in China Good shoppingNatural scenic beauty Fine cuisineValue for money for holidaying Interesting cultural heritagePleasant climate MulticulturalUnique wildlife Activities and holiday entertainmentBeautiful beaches and seaside
Country of origin image Is a good trading partner with China Are technically advancedTrustworthy people Participates positively in international affairsPeople with a stress free lifestyle Good value for money productsPeaceful people Produces high-quality productsCare about the environment Hard working peopleHas unpolluted environmentIs rich in natural resources
Seafood Abalone Seafood that conveys high statusLobster Frozen seafoodSeafood you can buy in China Seafood that is farmedUnpolluted seafood Expensive seafoodSeafood that is large in sizeSeafood that can be given as a gift
Wine Brands of wine I know Expensive wineHigh-quality wine Represents statusUnpolluted wine Wine you can buy in China
Luxury wine
Table 10. Cross-tab of salient country & product image attributesfor Australia
Seafood (%) Wine (%)
DI 41 27COI 30 22Ave 36 25
DI, destination image; COI, country of origin image.
468 J. Bowe et al.
Copyright © 2013 John Wiley & Sons, Ltd. J. Consumer Behav. 12: 460–471 (2013)
DOI: 10.1002/cb
These quality-assurance type attributes will – as they do inour results – correlate more with the technical aspectsembodied in the COI construct. However, by using thistraditional evaluative attitudinal model to assess the relation-ship between a country’s image and products, importantrelationships could be overlooked – as can be seen fromthe results of part 2 of the study. A forced-choice Likertmodel presumes that a respondent might consider all theattributes presented to them for evaluation and that each isgiven equal weight in making PI assessments.
In contrast, what is evident from part 2 is that the respon-dents’ country image for Australia is driven by well-knowniconic tourism images and not images of Australia as acountry of hi-tech development, technological advancement,hard work and great production capacity as portrayed ingeneric country-of-origin scales. Product images for wineand seafood, particularly regarding quality, appear to beclosely associated in memory with tourist-centric imagery.This gives weight to the suggestion that the methodology inpart 1 creates results that may overestimate or distort theinfluence of traditional COI measures in forming productbeliefs. It also supports our view that DI and COI are notdiscrete constructs but representations of a higher-order con-struct, country image.
One of the key tenets of ANT is that an attribute for aproduct or place has to be present in memory for it to beactivated and utilised in a choice behaviour. It appears, inthis context, that the respondents are sometimes being askedto rate items or attributes about Australia (or any country)that they would not have considered freely themselves. Thismeans that in a choice situation, those items or attributeswould not be activated when consumers are consideringwhether to choose an Australian product. The attitude-basedLikert scale method introduces an artificial condition intothe study’s results, one not possible to impose in theANT-driven pick-any methodology. When measuring theinfluence of DI and COI on the perception of Australianseafood and wine for Chinese tourists/consumers, ANTand pick-any appear to provide a more holistic representa-tion of the influence that a country’s image has on PIformation than traditional forms of analysis. It providesmore tangible information about what respondents are usingto form product and country images, and importantly, it doesnot utilise information they are not using.
CONCLUSIONS AND FUTURE RESEARCH
Part 1 of this study used a traditional COI approach tocountry-image measurement and influence on product eval-uation. It produced good statistical fit across a number ofmodels using a large sample of holidaymaker consumers.However, the results did not give good insight into the mindof the consumer when it came to forming their productperceptions of seafood and wine from Australia. This ledus to consider the effect of the methodology on the reliabil-ity of the results.
The results in part 2 of the study clearly suggest that forcertain image attributes and product categories, which the
consumer considers to be in the category of tourism, thereare apparent semantic linkages with certain product attributes,particularly relating to quality perception (size, freshness andtaste); these linkages are less evident with more traditionalcountry-of-origin categorizations. It is clear from both studiesthat Australia’s image as a tourist destination prevails – iconicand well-known images of beautiful pristine environments,beaches, sun and surf – and this may well be a significant ante-cedent of PI formation. Although some of these measures areconsidered in country-of-origin research, they tend to be moreheavily focused on manufacturing and production capacity, aswell as the perceived technological advancement of thecountry. These images of Australia are not as salient in theminds of the respondents in the study and not retrieved frommemory as often as those of Australia as a laid-back andbeautiful country. According to ANT, it is these images thatwill have the greatest effect on consumer choice for theproducts tested.
Future research should consider where these conditionshold. Any study would need to test both the measures andthe theories outlined in parts 1 and 2 across a larger cohortof consumers and nationalities as well as considering otherproduct categories. Another consideration should be thenoted influence product involvement may have on COI effectsis, with prior research finding that COI cues may be utiliseddifferently depending on the level of involvement requiredfor a purchase decision or product evaluation. In this study,we have considered Australian seafood and wine to be in thesame involvement category. Both these products are primarilyconsumed on-premise in China, and as such, they are notconsidered as everyday items. Both products operate in asimilar price space when sold in restaurant’s (baring extremelyhigh end wine) as well as being complementary products thatare ordered at the same time in the same scenario. This makesthem appropriate products for testing differing COI effectseven if accounting for involvement. However, it may be ofinterest to others in the future to replicate this study using prod-ucts of varying involvement levels. One of the key limitationsof this study is that the product categories of seafood and winecould be perceived as related to tourism (i.e. things peoplemight experience when on holiday or perceive as hedonic inthe same way that a holiday may be hedonic) in comparisonto more utilitarian products such as cars or computers. Futurestudies should look at utilitarian or technology-related productsas well. Nevertheless, in an Australian context at least, startingwith the biggest – and growing – consumer market in theworld, combined with the soon-to-be biggest inbound tourismsegment, this research is an ample pathway to future researchin this area.
ACKNOWLEDGEMENT
This research has received financial assistance from theAustralian Seafood Centre for Cooperative Research (CRC)– project number 2009/761. This partial funding is for alarger research project, of which this manuscript is a deriva-tive. The CRC have not been directly involved in any of theformulation of the research, writing or analysis.
Old dogs, new tricks – Rethinking country-image studies 469
Copyright © 2013 John Wiley & Sons, Ltd. J. Consumer Behav. 12: 460–471 (2013)
DOI: 10.1002/cb

BIOGRAPHICAL NOTES
Jasha Bowe, Jasha comes from a background in marketing andcommunications. His previous roles have been as a marketingmanager at the University of South Australia’s Student ServicesOrganisation, as a key account manager for a boutique creative,graphic design and marketing agency and a research and commu-nications officer for the South Australian government. Jasha’sresearch interests are in consumer behaviour and internationalmarketing, with a specific focus on the image and branding ofcountries and places. His PhD focuses on these fields in the areasof tourism and exporting, in particular, seafood and wine. Jashahas a Bachelor of Politics, a Master of International Studies anda Master of Marketing.
Professor Larry Lockshin, is a professor of wine marketing and thehead of the School of Marketing at the University of South Australia.Professor Lockshin has spent more than 20 years working with thewine industry, first as a viticulturist and now as a marketing academicand consultant. Professor Lockshin has published over 100 academicarticles and over 200 trade articles on wine marketing. His researchinterests are consumer choice behaviour for wine and wine industrystrategy. He is currently working on modelling of consumer choicefor wine based on simulated shopping experiments and large paneldata sets, packaging and retail influences on choice and sustainabilityin the wine sector and success factors for small and medium sizedwineries.
Dr Richard Lee, teaches consumer behaviour and internet marketingwith the University of South Australia. Prior to academia, Dr Leespent more than 10 years managing the marketing functions of ITcompanies in Asia. His research interests are in consumer behaviourincluding customer loyalty, country-of-origin and social influences.
Dr Cam Rungie, joined the School of Marketing at the University ofSouth Australia in 2002. Since then, he has published 20 refereedjournal papers, won three best paper awards, supervised to comple-tion six PhD candidates, worked regularly with the Australian TVand radio audience measurement industry, received recognitionfrom the university for his teaching and research and won anAustralian Research Council Discovery Grant with colleagues fromthe University of Technology, Sydney and the University ofQueensland. His research is developing new mathematical methodsfor analyzing consumer choice, the integration of structural equationand discrete choice modeling. Previously he was a brand managerfor Neutrogena at Fauldings, worked in the market research industryincluding running his own business and lectured in Mathematics.
REFERENCES
ACIL. 2002. Review of wine tourism and wine exports. ACILconsulting.
Anderson JR, Bower GH. 1973. Human Associative Memory.Winston & Sons: Washington.
Anderson JR, Bower GH. 1980. Human Associative Memory: ABrief Edition. Erlbaum Associates: Hillsdale N.J.
Arbuckle J. 2007. Amos 18 Users Guide. Amos DevelopmentCorporation: Chicago.
Askegaard S, Ger G. 1998. Product–country images: towards a con-textualized approach. European advances in consumer research3(1): 50–58.
Australian Government. 2010. Australian Bureau of Agriculturaland Resource Economics Bureau of Rural Sciences. AustralianFisheries Statistics 2009.
Balestrini P, Gamble P. 2006. Country-of-origin effects on Chinesewine consumers. British Food Journal 108(5): 396–412.
Baloglu S, McCleary KW. 1999. A model of destination imageformation. Annals of Tourism Research 26(4): 868–897.
Beerli A, Martin JD. 2004. Factors influencing destination image.Annals of Tourism Research 31(3): 657–681.
Borsboom D, Mellenbergh GJ, van Heerden J. 2003. The theoret-ical status of latent variables. Psychological Review 110(2):203–219.
Bruwer J, Lesschaeve I. 2012. Wine tourists’ destination regionbrand image perception and antecedents: Conceptualization ofa winescape framework. Journal of Travel & Tourism Marketing29(7): 611–628.
Churchill GA, Jr. 1979. A paradigm for developing better mea-sures of marketing constructs. Journal of Marketing Research16(February): 64–73.
Collins AM, Loftus EF. 1975. A spreading activation theory ofsemantic processing. Psychological Review 82(6): 407–428.
Corsi A, Lockshin L, Mueller S. 2011. Competition between andcompetition within: The strategic positioning of competingcountries in key export markets. 6th AWBR Internationalconference. France.
Dolnicar S, Grün B. 2013. Validly measuring destination image insurvey studies. Journal of Travel Research 52(1): 3–14.
Dolnicar S, Grun B, Leisch F. 2004. Time efficient brand imagemeasurement – Is binary format sufficient to gain the marketinsight required? In: Proceedings of the 33rd Annual EMACConference, 18–21 May 2004 University of Murcia, Spain. 8.
Driesener C, Romaniuk J. 2006. Comparing methods of brand im-age measurement. International Journal of Market Research48(6): 681–698.
Echtner C, Ritchie B. 2003. The meaning and measurement ofdestination image. Journal of Tourism Studies 14(1): 37–48.
Elliot S, Papadopoulos N, Kim SS. 2011. An integrative model ofplace image exploring relationships between destination, prod-uct, and country images. Journal of Travel Research 50(5):520–534.
Fazio RH. 2001. On the automatic activation of associated evalua-tions: An overview. Cognition & Emotion 15(2): 115–141.
Fishbein M, Ajzen I. 1975. Belief, Attitude, Intention and Behav-iour: An Introduction to Theory and Research. Addison-WesleyPublishing Company: Reading, MA.
Fornell C, Larcker DF. 1981. Structural equation models withunobservable variables and measurement error: Algebra andstatistics. Journal of marketing research 382–388.
Gil JM, Sanchez M. 1997. Consumer preferences for wine attri-butes: A conjoint approach. British Food Journal 99(1): 3–11.
Gnoth J. 2002. Leveraging export brands through a tourismdestination brand. The Journal of Brand Management 9(4):262–280.
Hair J, Black W, Babin B and Anderson R. 2010. MultivariateData Analysis: A Global Perspective. Pearson: Upper SaddleRiver, NJ.
Han CM. 1989. Country image: Halo or summary construct ? JMR16: 222–229.
Heimbach AE, Johansson JK, MacLachlan DL. 1989. Productfamiliarity, information processing, and country-of-origin cues.Advances in Consumer Research 16(1): 460–467.
Heslop LA, Lu IR, Cray D. 2008. Modeling country image effectsthrough an international crisis. International Marketing Review25(4): 354–378.
Hu X, Li L, Xie C and Zhou J. 2008. The effects of country-of-origin on Chinese consumers’ wine purchasing behaviour.Journal of Technology Management in China 3(3): 292–306.
Jamieson S. 2004. Likert scales: How to (ab)use them. MedicalEducation 38(12): 1217–1218.
Josiassen A, Assaf G. 2013. Look at me – I am flying: The influenceof social visibility of consumption on tourism decisions. Annalsof Tourism Research 40: 155–175.
Josiassen A, Harzing AW. 2008. Comment: Descending fromthe ivory tower: reflections on the relevance and future ofcountry-of-origin research. European Management Review5(4): 264–270.
Josiassen A, Lukas BA, Whitwell GJ. 2008. Country-of-origincontingencies: competing perspectives on product familiarityand product involvement. International Marketing Review 25(4):423–440.
470 J. Bowe et al.
Copyright © 2013 John Wiley & Sons, Ltd. J. Consumer Behav. 12: 460–471 (2013)
DOI: 10.1002/cb
Keller KL. 1993. Conceptualizing, measuring, and managingcustomer-based brand equity. The Journal of Marketing 57(1):1–22.
Keller KL. 2001. Building customer-based brand equity. MarketingManagement 10(2): 14–19.
Keller KL. 2003. Brand synthesis: The multidimensionality ofbrand knowledge. Journal of Consumer Research 29(4):595–601.
Kotler P, Gertner D. 2002. Country as brand, product and beyond:A place marketing and brand management perspective. Journalof Brand Management 9(4–5): 249–261.
Krishnan H. 1996. Characteristics of memory associations: Aconsumer-based brand equity perspective. International Journalof Research in Marketing 13(4): 389–405.
Krishnan HS, Shapiro S. 1996. Comparing implicit and explicitmemory for brand names from advertisements. Journal ofExperimental Psychology. Applied 2(2): 147–163.
Lee R, Lockshin L. 2011. Halo effects of tourists’ destination imageon domestic product perceptions. Australasian Marketing Journal19: 7–13.
Maxwell W, Romaniuk J. 2008. Negative brand beliefs and brandusage. International Journal of Market Research 50(3): 355–375.
Miller GA. 1956. The magic number seven, plus or minus two:Some limits on our capacity for processing information. ThePsychological Review 63(No. 2, March): 81–97.
Mossberg L, Kleppe IA. 2005. Country and destination image –Different or similar image concepts? The Service IndustriesJournal 25(4): 493–503.
Nadeau J, Heslop L, O’Reilly N, Luk P. 2008. Destination in acountry image context. Annals of Tourism Research 35(1):84–106.
Nedungadi P. 1990. Recall and consumer consideration sets:Influencing choice without altering brand evaluations. Journalof Consumer Research 17(3): 263–276.
Papadopoulos N, Heslop L. 1986. Travela as a correlate of productand country images. ASAC 1986 Conference. Whistler, BritishColumbia.
Papadopoulos N. 1993. What product and country images are andare not. Product–country images: Impact and role in interna-tional marketing 3–38.
Papadopoulos N. 2004. Place branding: Evolution, meaning andimplications. Place Branding 1(1): 36–49.
Parameswaran R, Pisharodi RM. 1994. Facets of country of originimage: An empirical assessment. Journal of Advertising 23(1):43–56.
Pike S. 2002. Destination image analysis – A review of 142 papersfrom 1973–2000. Tourism Management 23: 541–549.
Pike S. 2010. Destination branding case study: Tracking brandequity for an emerging destination between 2003 and 2007.Journal of Hospitality & Tourism Research 34(1): 124–139.
Romaniuk J. 2006. Comparing prompted and unpromptedmethods for measuring consumer brand associations. Journalof Targeting, Measurement and Analysis for Marketing 15(1):3–11.
Romaniuk J. 2010. Brand salience measurement and metrics.Ehrenberg-Bass Institute.
Romaniuk J. 2012. Modeling mental market share. Journal of Busi-ness Research, In Press.
Romaniuk J, Sharp B. 2004. Conceptualizing and measuring brandsalience. Marketing Theory 4(4): 327–342.
Roth KP, Diamantopoulos A. 2009. Advancing the country imageconstruct. Journal of Business Research 62(7): 726–740.
Samiee S. 2010. Advancing the country image construct – A com-mentary essay. Journal of Business Research 63(4): 442–445.
Tourism Australia. 2011. 2020: Summary of Tourism Australia’sChina 2020 Strategic Plan. Tourism Australia: Australia.
Usunier JC. 2006. Relevance in business research: The case ofcountry-of-origin research in marketing. European ManagementReview 3(1): 60–73.
Wine Australia. 2013. September Wine Export Approval Report(July 2013). Wine Australia: Australia.
Wright M, Klÿn B. 1998. Environmental attitude–behaviour corre-lations in 21 countries. Journal of Empirical Generalisationsin Marketing Science 3(3).
Old dogs, new tricks – Rethinking country-image studies 471
Copyright © 2013 John Wiley & Sons, Ltd. J. Consumer Behav. 12: 460–471 (2013)
DOI: 10.1002/cb