olam international limitedolamgroup.com/wp-content/uploads/2014/03/h1fy2013... · 2014-03-22 ·...
TRANSCRIPT
Page 1
OLAM INTERNATIONAL LIMITED Financial Statements for the Second Quarter and First Half Ended 31 December 2012 PART I: Information required for announcements of Quarterly (Q1, Q2, Q3 & Q4), Half-Year and
Full Year Results. 1(a)(i) An income statement and statement of comprehensive income or a statement of comprehensive
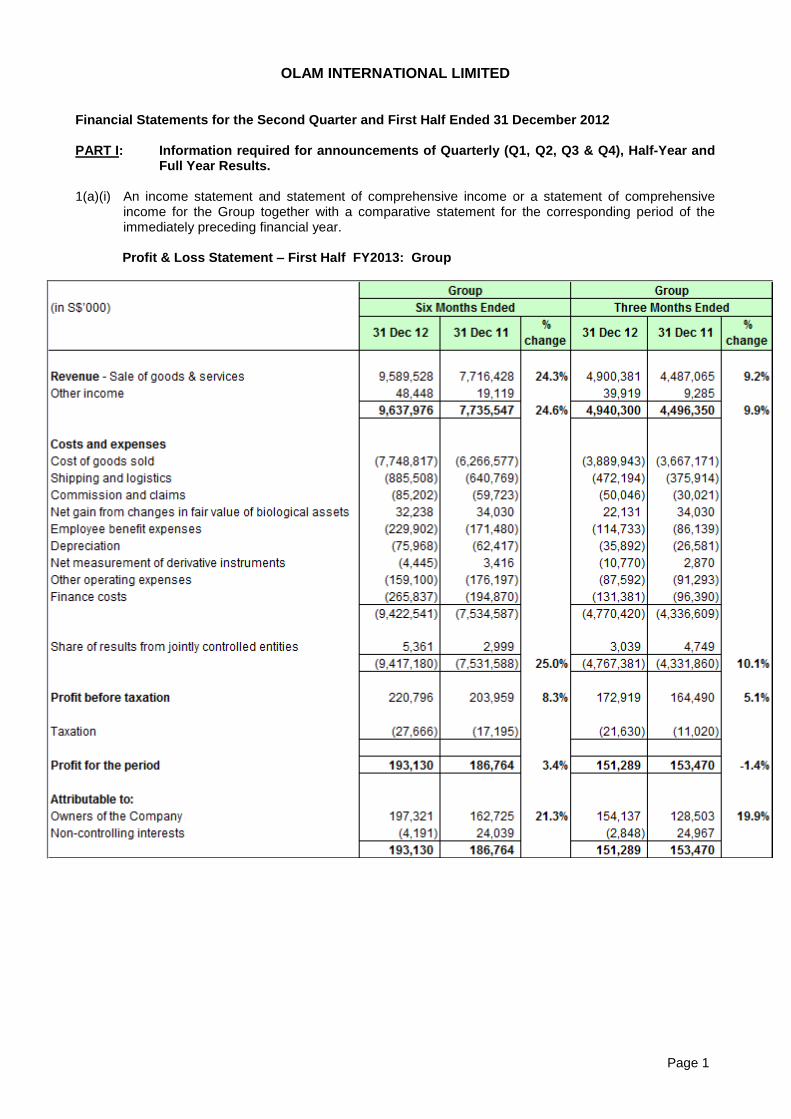
income for the Group together with a comparative statement for the corresponding period of the immediately preceding financial year.
Profit & Loss Statement – First Half FY2013: Group
Page 2
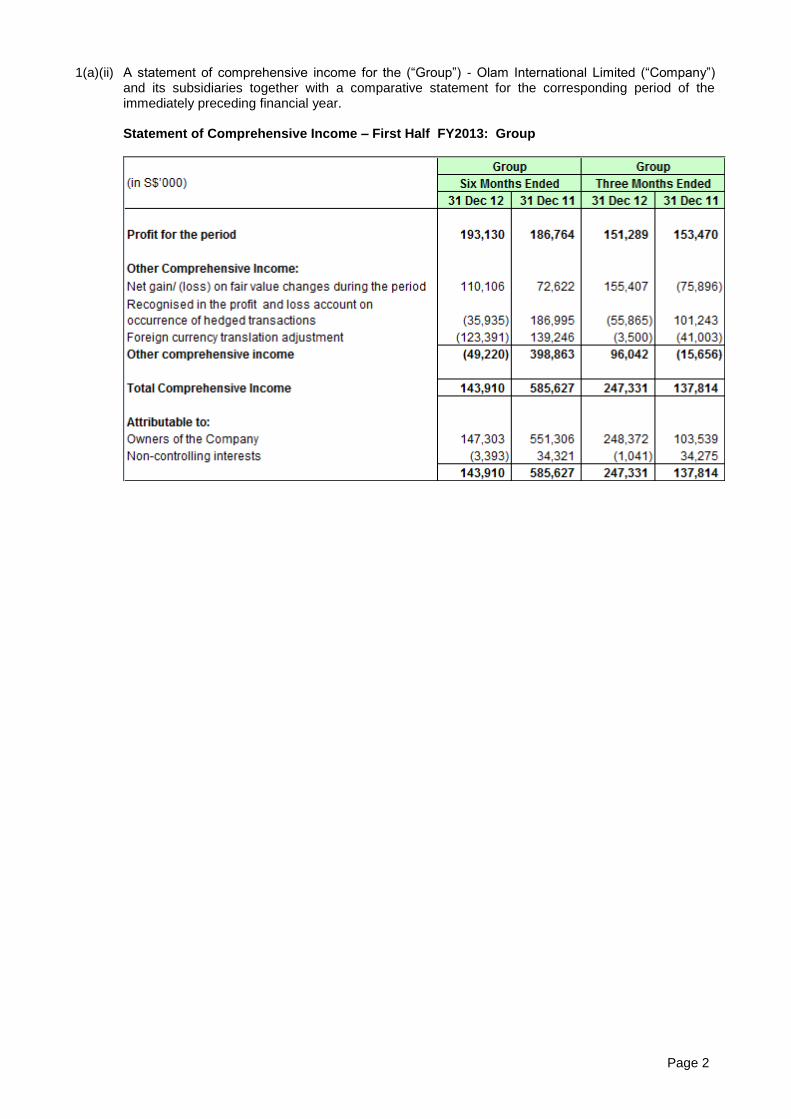
1(a)(ii) A statement of comprehensive income for the (“Group”) - Olam International Limited (“Company”) and its subsidiaries together with a comparative statement for the corresponding period of the immediately preceding financial year. Statement of Comprehensive Income – First Half FY2013: Group
Page 3
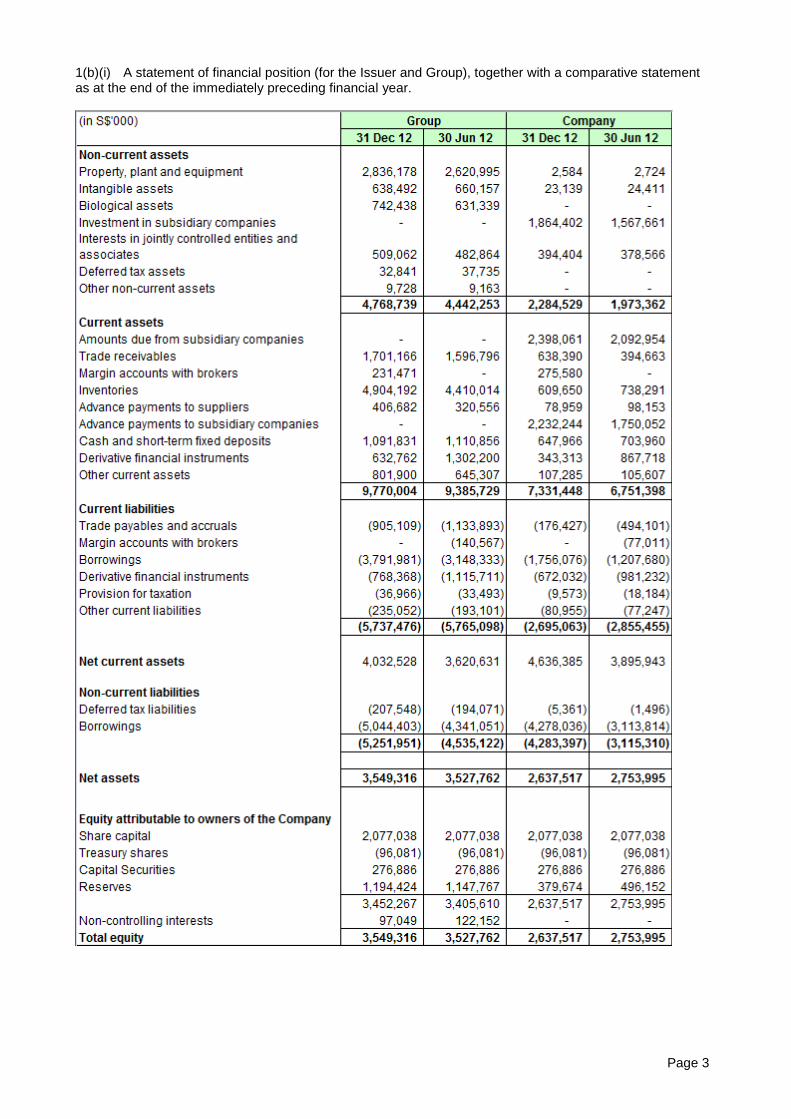
1(b)(i) A statement of financial position (for the Issuer and Group), together with a comparative statement as at the end of the immediately preceding financial year.
Page 4
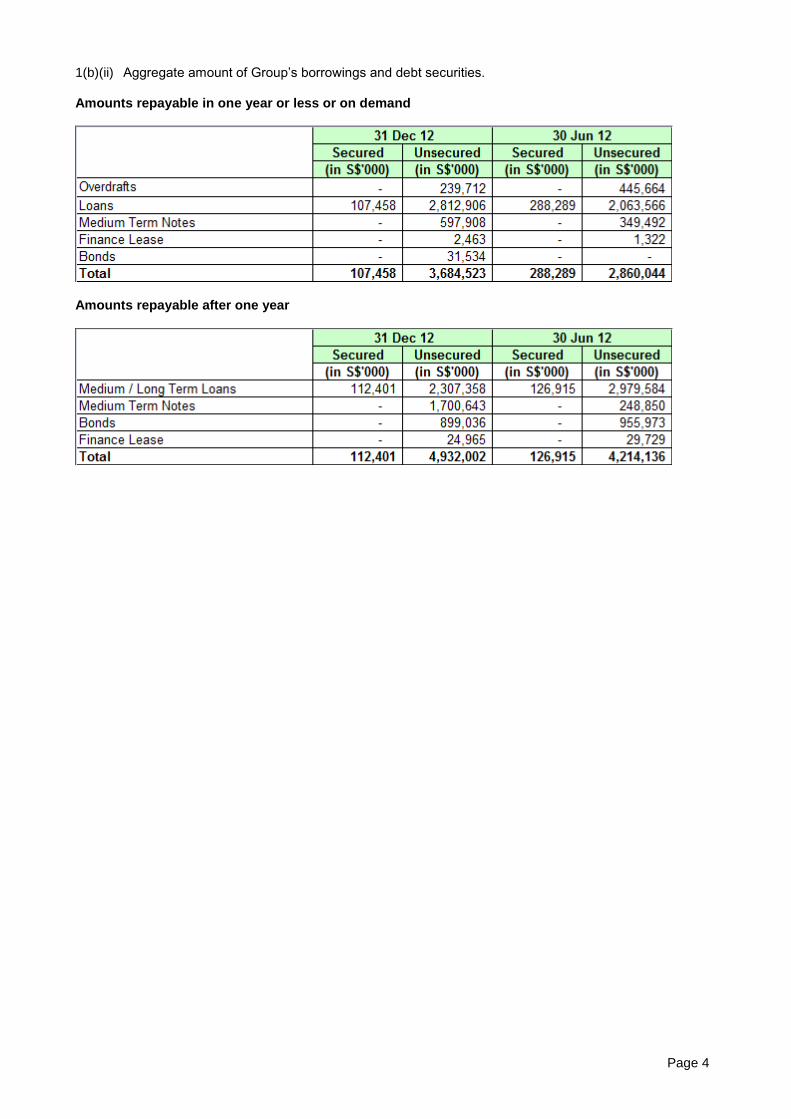
1(b)(ii) Aggregate amount of Group’s borrowings and debt securities. Amounts repayable in one year or less or on demand
Amounts repayable after one year
Page 5
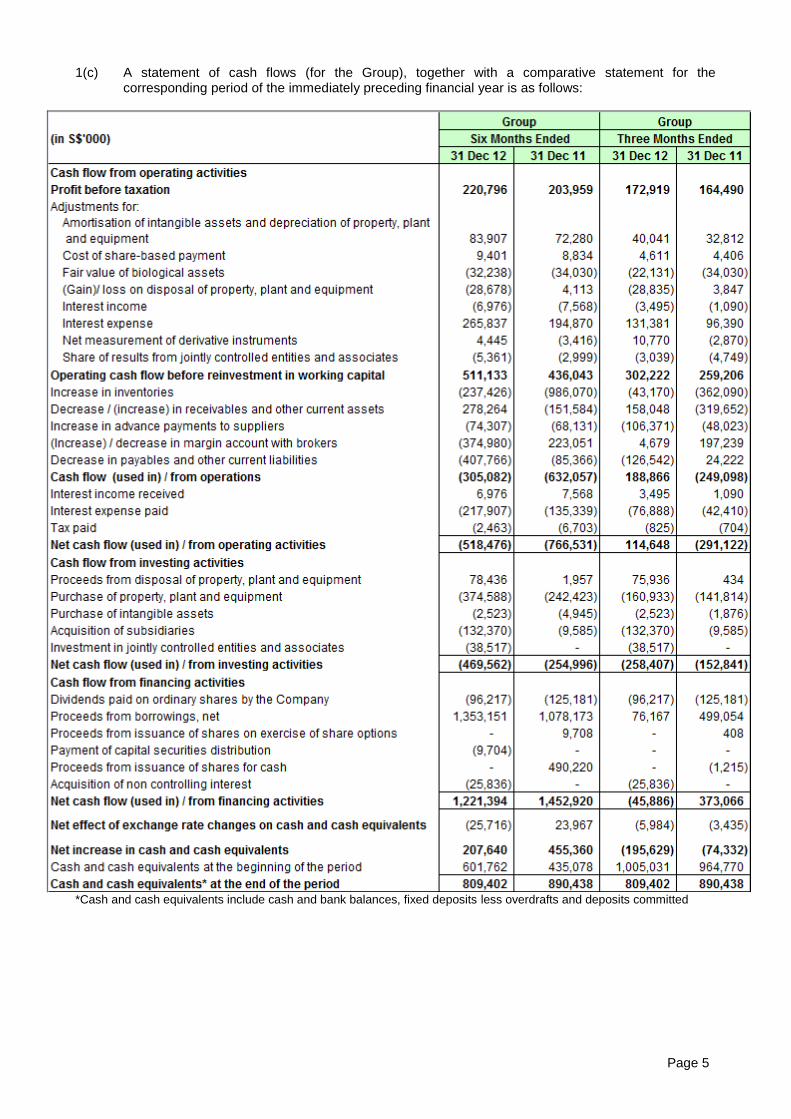
1(c) A statement of cash flows (for the Group), together with a comparative statement for the corresponding period of the immediately preceding financial year is as follows:
*Cash and cash equivalents include cash and bank balances, fixed deposits less overdrafts and deposits committed
Page 6
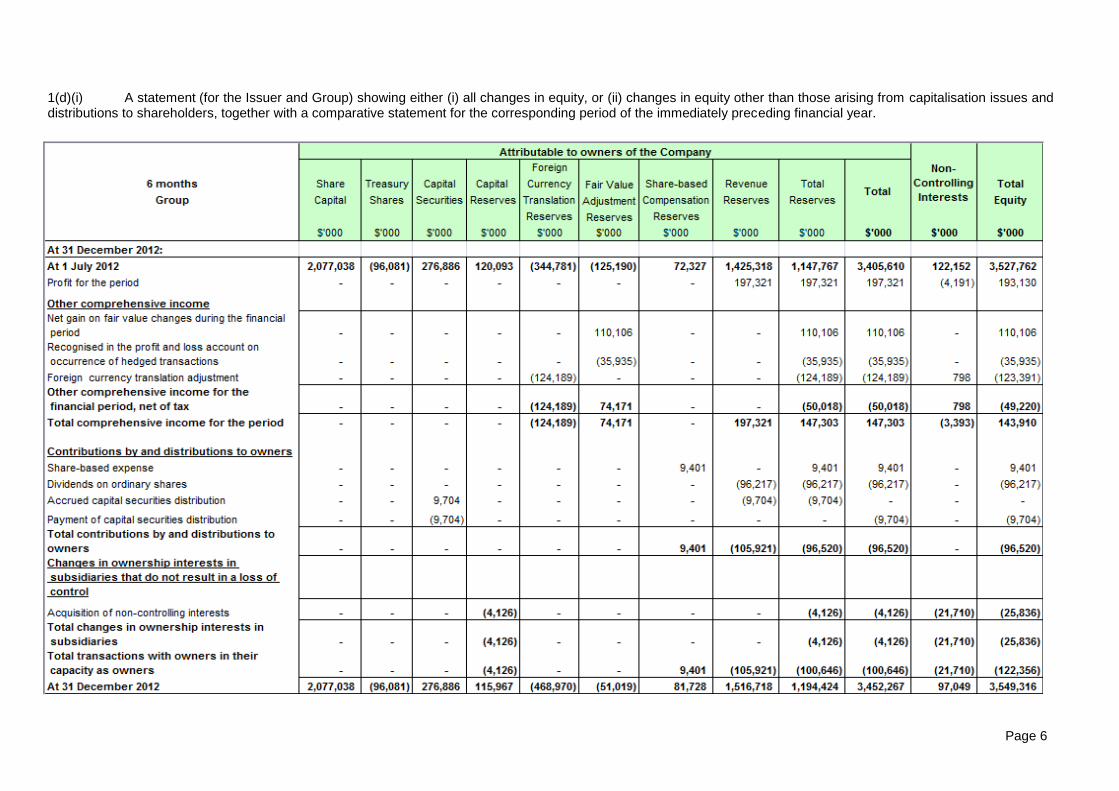
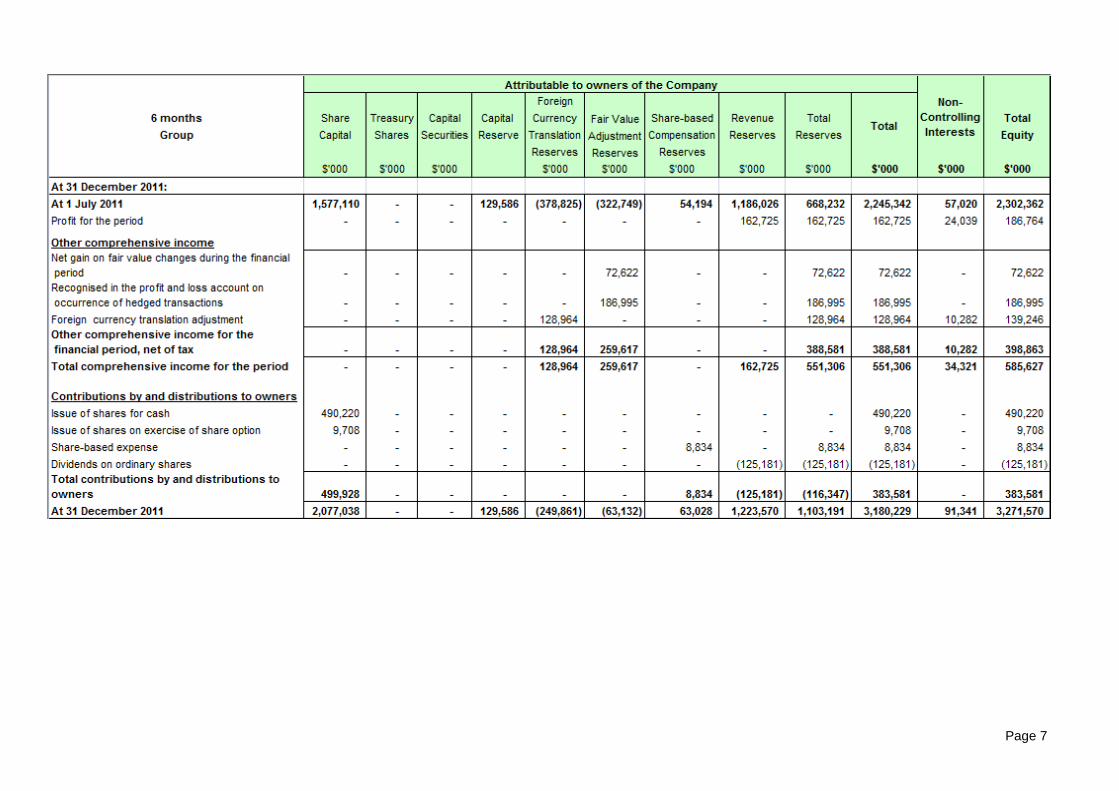
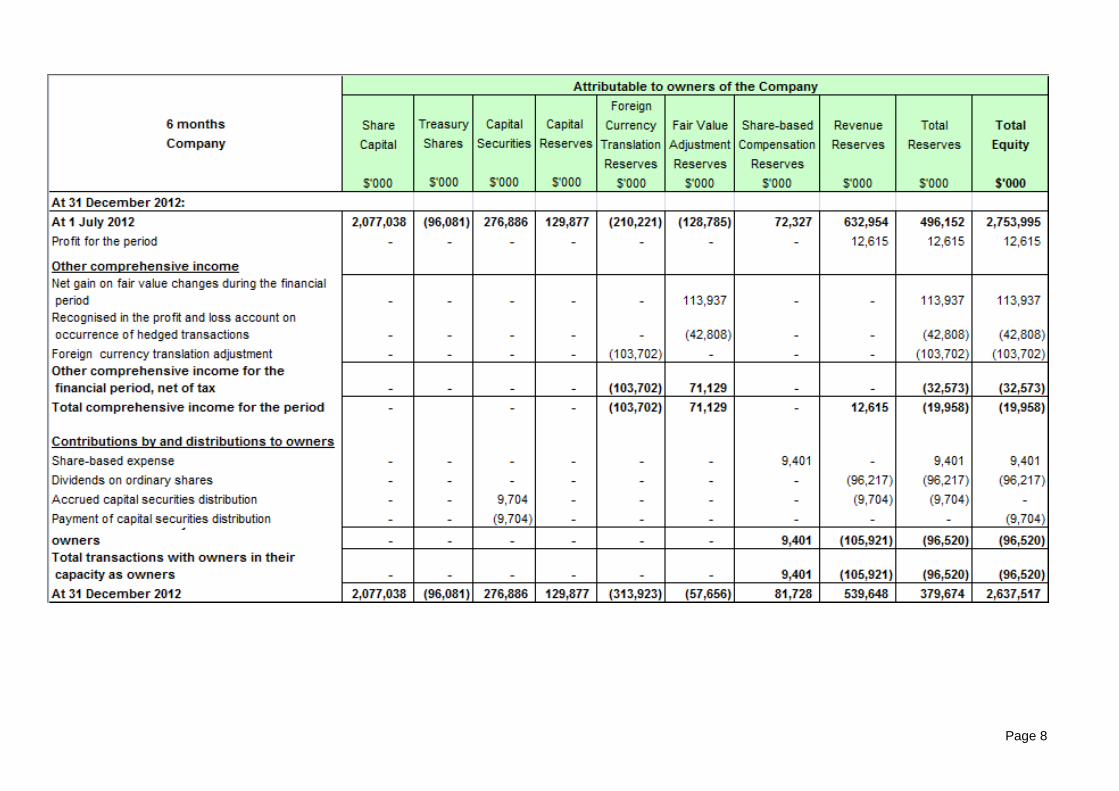
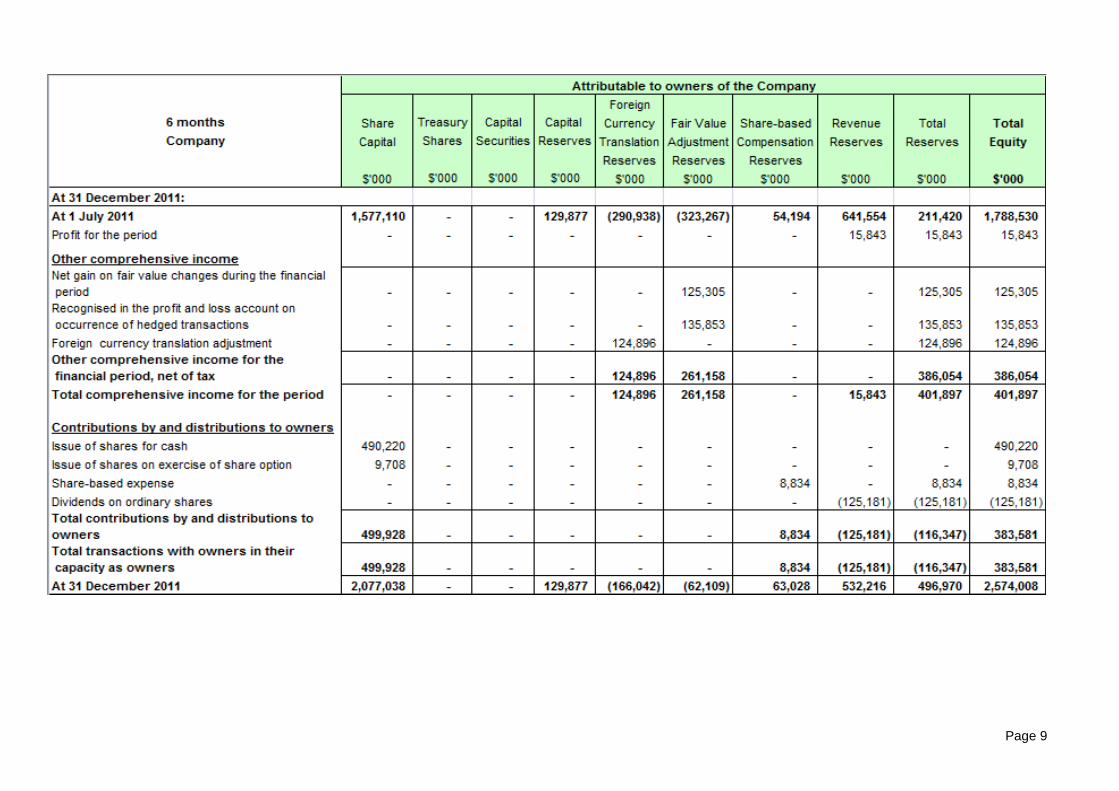
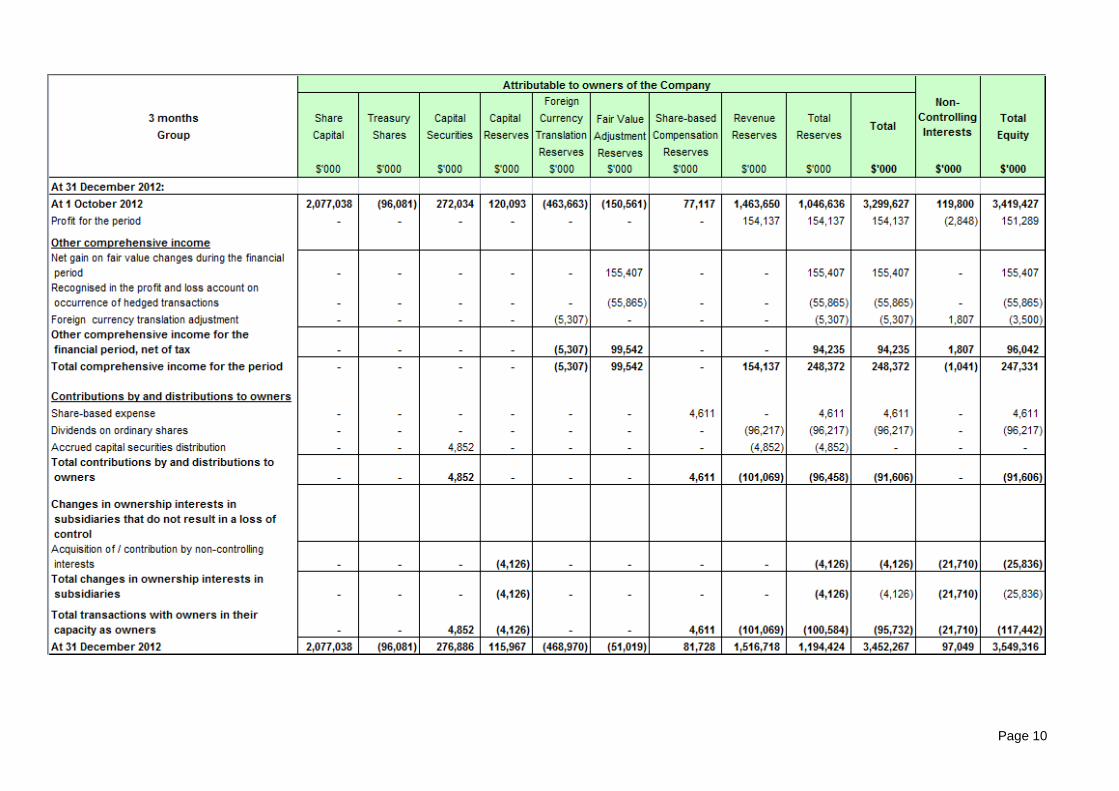
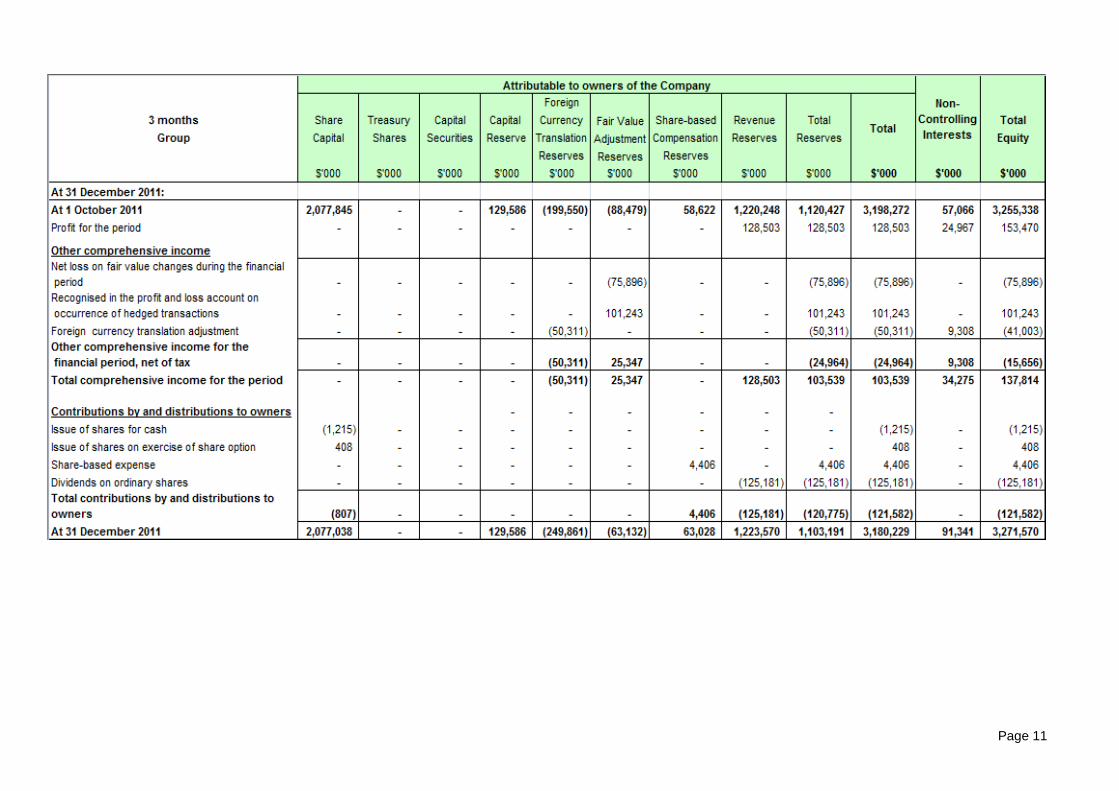
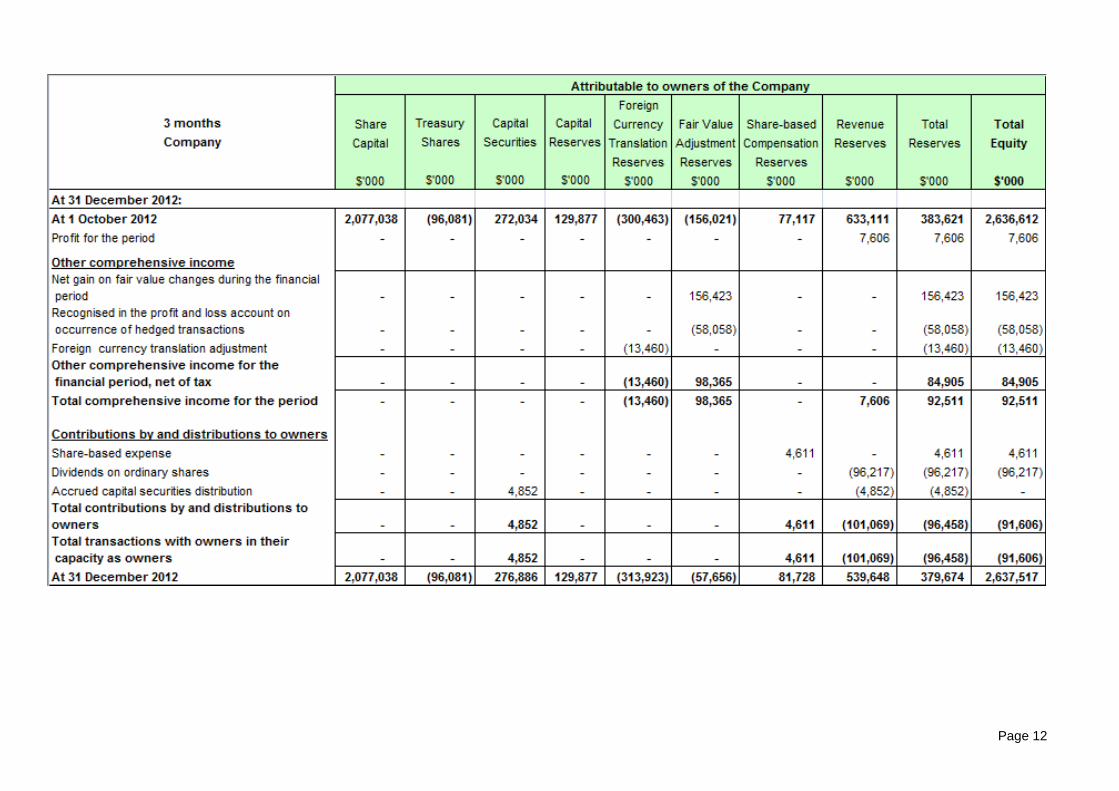
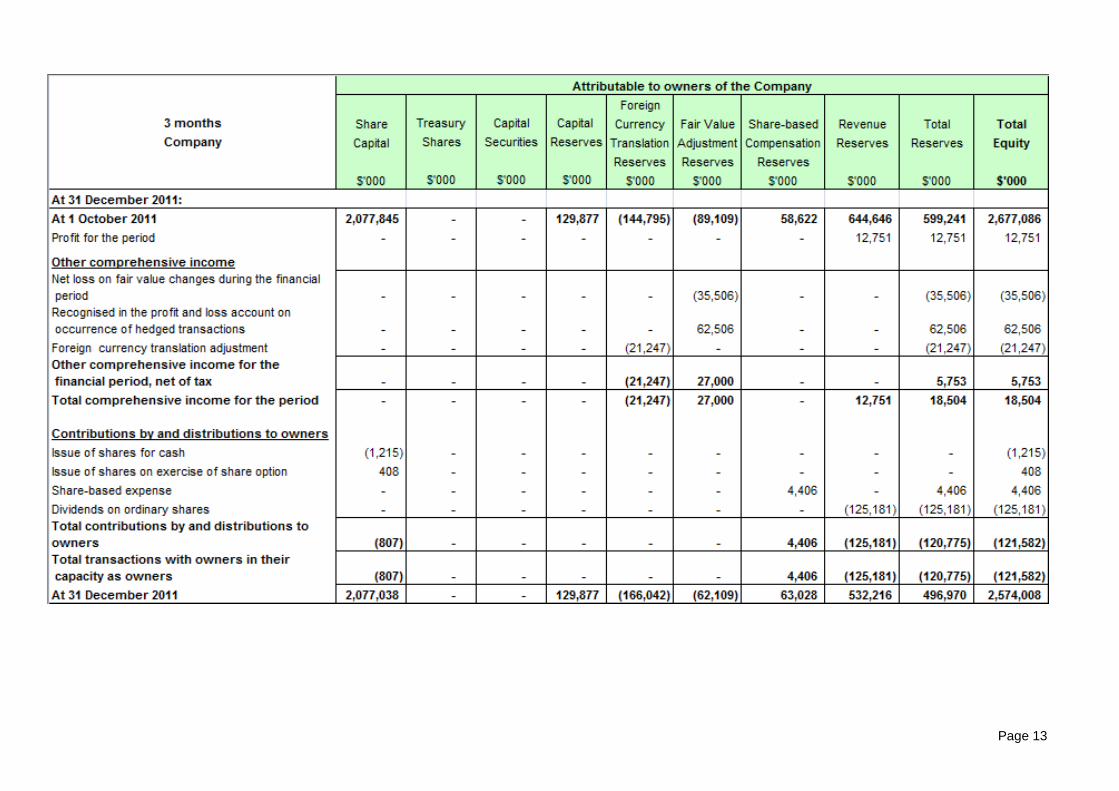
1(d)(i) A statement (for the Issuer and Group) showing either (i) all changes in equity, or (ii) changes in equity other than those arising from capitalisation issues and distributions to shareholders, together with a comparative statement for the corresponding period of the immediately preceding financial year.
Page 7
Page 8
Page 9
Page 10
Page 11
Page 12
Page 13
Page 14
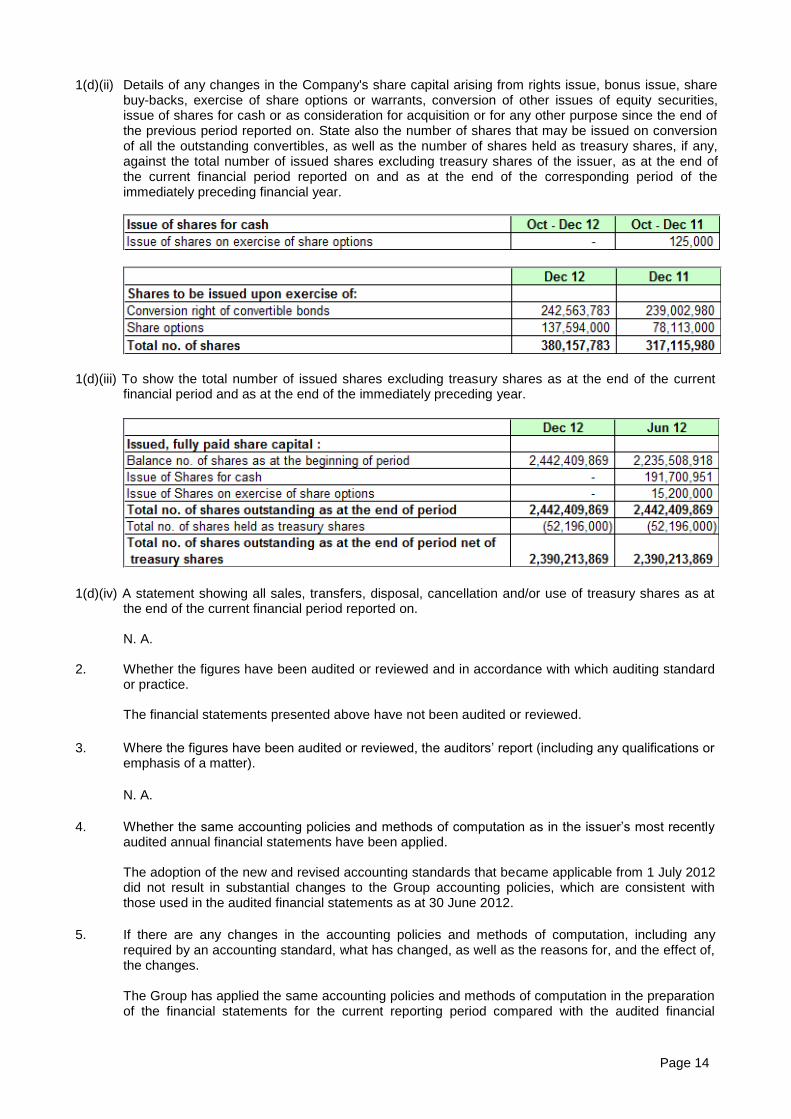
1(d)(ii) Details of any changes in the Company's share capital arising from rights issue, bonus issue, share buy-backs, exercise of share options or warrants, conversion of other issues of equity securities, issue of shares for cash or as consideration for acquisition or for any other purpose since the end of the previous period reported on. State also the number of shares that may be issued on conversion of all the outstanding convertibles, as well as the number of shares held as treasury shares, if any, against the total number of issued shares excluding treasury shares of the issuer, as at the end of the current financial period reported on and as at the end of the corresponding period of the immediately preceding financial year.
1(d)(iii) To show the total number of issued shares excluding treasury shares as at the end of the current financial period and as at the end of the immediately preceding year.
1(d)(iv) A statement showing all sales, transfers, disposal, cancellation and/or use of treasury shares as at the end of the current financial period reported on.
N. A.
2. Whether the figures have been audited or reviewed and in accordance with which auditing standard or practice.
The financial statements presented above have not been audited or reviewed.
3. Where the figures have been audited or reviewed, the auditors’ report (including any qualifications or emphasis of a matter).
N. A.
4. Whether the same accounting policies and methods of computation as in the issuer’s most recently audited annual financial statements have been applied.
The adoption of the new and revised accounting standards that became applicable from 1 July 2012 did not result in substantial changes to the Group accounting policies, which are consistent with those used in the audited financial statements as at 30 June 2012.
5. If there are any changes in the accounting policies and methods of computation, including any
required by an accounting standard, what has changed, as well as the reasons for, and the effect of, the changes.
The Group has applied the same accounting policies and methods of computation in the preparation
of the financial statements for the current reporting period compared with the audited financial
Page 15
statements as at 30 June 2012 except for the adoption of new or revised FRS that are mandatory for financial years beginning on or after 1 July 2012. The adoption of these FRS has no significant impact to the Group.
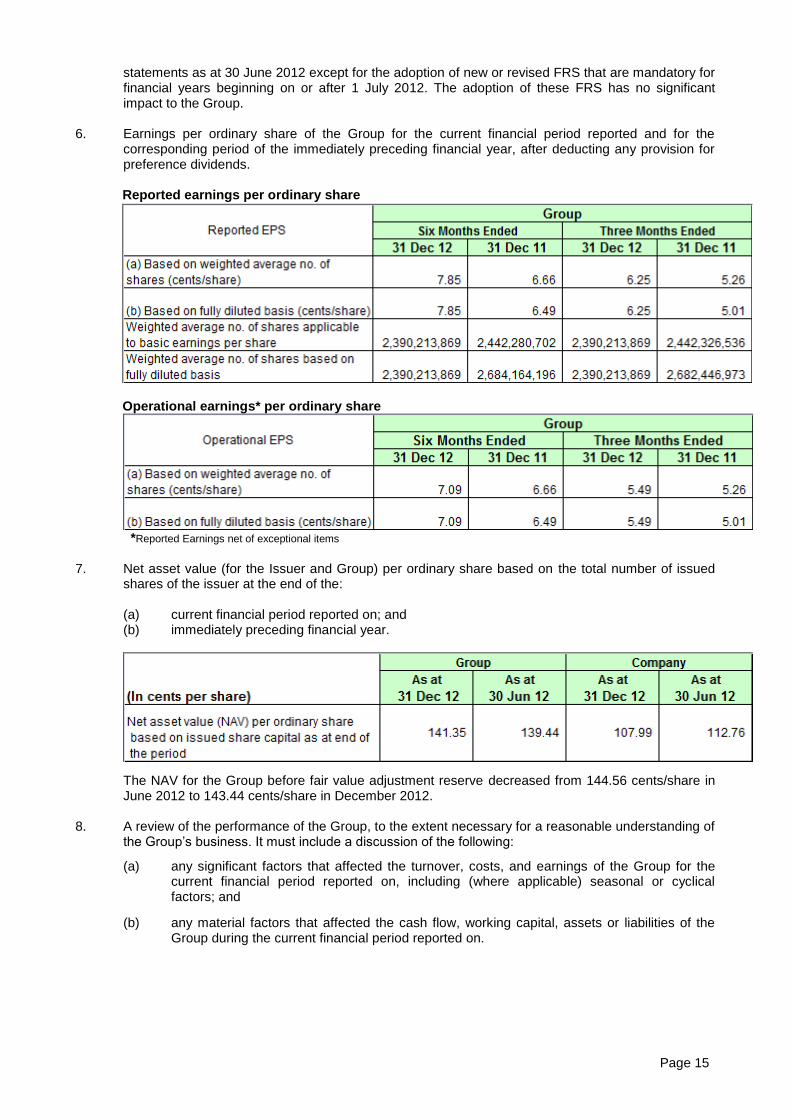
6. Earnings per ordinary share of the Group for the current financial period reported and for the
corresponding period of the immediately preceding financial year, after deducting any provision for preference dividends.
Reported earnings per ordinary share
Operational earnings* per ordinary share
*Reported Earnings net of exceptional items
7. Net asset value (for the Issuer and Group) per ordinary share based on the total number of issued
shares of the issuer at the end of the:
(a) current financial period reported on; and (b) immediately preceding financial year.
The NAV for the Group before fair value adjustment reserve decreased from 144.56 cents/share in June 2012 to 143.44 cents/share in December 2012.
8. A review of the performance of the Group, to the extent necessary for a reasonable understanding of
the Group’s business. It must include a discussion of the following:
(a) any significant factors that affected the turnover, costs, and earnings of the Group for the current financial period reported on, including (where applicable) seasonal or cyclical factors; and
(b) any material factors that affected the cash flow, working capital, assets or liabilities of the Group during the current financial period reported on.
Page 16
Introduction Olam is a leading global integrated supply chain manager of agricultural products and food ingredients, with operations in 65 countries. As supply chain managers, we are engaged in the sourcing of a wide range of agricultural commodities from the producing countries and the processing, warehousing, transporting, shipping, distributing and marketing of these products right up to the factory gate of our customers in the destination markets. We also manage risk at each stage of the supply chain. From our founding in 1989, the Company has evolved from a single country, single product trader to a multi-country, multi-product supply chain manager. In that process of evolution and development, the Olam business model has grown both in depth as well as breadth, pursuing selected value chain adjacencies which both complement and enhance our core supply chain model. The evolution of our business model over recent years has led us to develop new competencies as we have pursued our strategic goals, including the capabilities to identify, execute and integrate attractive acquisition opportunities in selected countries and within or adjacent to our core value chain activities. Successfully completed transactions have addressed opportunities in the upstream (plantation and farming), midstream (manufacturing/ processing) and downstream parts of the value chain. Building on existing and new capabilities, the Group has selectively expanded upstream into plantation ownership and management (perennial crops), farming (annual crops), dairy farming and forest concessions management. These opportunities, both organic and inorganic, have been pursued in countries that have a comparative advantage to produce these commodities relatively better and at relatively lower costs on a sustainable basis. Pursuit of this strategy has led us to invest selectively in palm and rubber plantations in Africa; almond orchards in Australia and California; coffee plantation in Laos, Ethiopia, Tanzania and Zambia; peanut, soybean and corn farming in Argentina; rice farming in Nigeria and Mozambique; cotton farming in Mozambique, Brazil, Ghana and Ivory Coast; dairy farming in Uruguay and Russia and the development of tropical hard wood forest concessions in The Republic of Congo (ROC), Gabon and Mozambique. Similarly, in the midstream part of the value chain, we have pursued initiatives in value added processing and manufacturing activities such as wheat milling in Nigeria and Ghana; sugar milling and refining in India, and Indonesia; cocoa processing in Ivory Coast and Nigeria; tomato paste manufacturing in California; dehydrates manufacturing in USA and China; peanut ingredient manufacturing in USA; palm oil refining in the Ivory Coast and Mozambique; mechanical processing of cashews in Ivory Coast and Nigeria; cashew ingredients manufacturing in Vietnam and the USA; spice grinding in Vietnam; dairy processing in Ivory Coast and Malaysia; specialty fats manufacturing in the UK; hazelnut processing in Turkey; soluble coffee manufacturing in Spain and Vietnam; and sawmilling in ROC and Gabon amongst others. Another growth initiative covers the proposed manufacturing and distribution of Fertiliser in Gabon, which will capitalise further on our extensive grower and supplier base in various producing countries. Downstream progress has been reflected in the initiatives completed in Packaged Foods distribution in West Africa and building our own consumer brands in the food category, which capitalises on our intimate knowledge of African markets, operations, brands and consumers. This downstream activity also builds on our capabilities in management of food supply chains and on the common distribution network that we have built for related commodity products (including rice, sugar, wheat flour and dairy products) in West Africa. Initiatives in this segment include biscuits and candies manufacturing and downstream distribution in Nigeria and Ghana; juice and dairy beverages in Nigeria; instant noodles, seasonings, tomato paste distribution in Nigeria and selective West African markets. In addition, Olam has diversified into a set of new businesses which build on latent assets and capabilities developed over the last 23 years including the Commodity Financial Services business segment (CFS), which benefits from our deep understanding of both commodity and financial markets, as well as from our capabilities in and knowledge of leading-edge risk management practices. Recent events On 3 December 2012, the Company announced a renounceable underwritten rights issue of US$750 million in principal amount of 6.75% bonds due 2018, with 387,365,079 free detachable warrants (“Warrants”), each Warrant carrying the right to subscribe for one new ordinary share in the Company. If all the Warrants are
Page 17
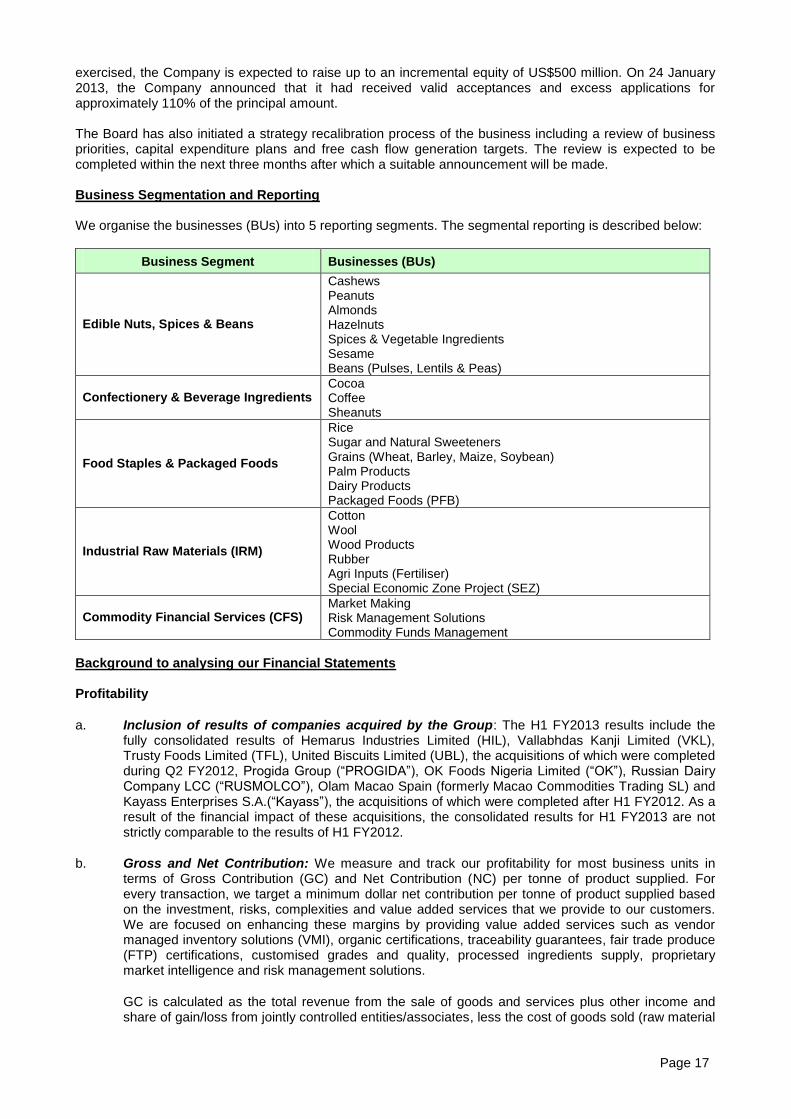
exercised, the Company is expected to raise up to an incremental equity of US$500 million. On 24 January 2013, the Company announced that it had received valid acceptances and excess applications for approximately 110% of the principal amount. The Board has also initiated a strategy recalibration process of the business including a review of business priorities, capital expenditure plans and free cash flow generation targets. The review is expected to be completed within the next three months after which a suitable announcement will be made. Business Segmentation and Reporting We organise the businesses (BUs) into 5 reporting segments. The segmental reporting is described below:
Business Segment Businesses (BUs)
Edible Nuts, Spices & Beans
Cashews Peanuts Almonds Hazelnuts Spices & Vegetable Ingredients Sesame Beans (Pulses, Lentils & Peas)
Confectionery & Beverage Ingredients Cocoa Coffee Sheanuts
Food Staples & Packaged Foods
Rice Sugar and Natural Sweeteners Grains (Wheat, Barley, Maize, Soybean) Palm Products Dairy Products Packaged Foods (PFB)
Industrial Raw Materials (IRM)
Cotton Wool Wood Products Rubber Agri Inputs (Fertiliser) Special Economic Zone Project (SEZ)
Commodity Financial Services (CFS) Market Making Risk Management Solutions Commodity Funds Management
Background to analysing our Financial Statements
Profitability
a. Inclusion of results of companies acquired by the Group: The H1 FY2013 results include the fully consolidated results of Hemarus Industries Limited (HIL), Vallabhdas Kanji Limited (VKL), Trusty Foods Limited (TFL), United Biscuits Limited (UBL), the acquisitions of which were completed during Q2 FY2012, Progida Group (“PROGIDA”), OK Foods Nigeria Limited (“OK”), Russian Dairy Company LCC (“RUSMOLCO”), Olam Macao Spain (formerly Macao Commodities Trading SL) and Kayass Enterprises S.A.(“Kayass”), the acquisitions of which were completed after H1 FY2012. As a result of the financial impact of these acquisitions, the consolidated results for H1 FY2013 are not strictly comparable to the results of H1 FY2012.
b. Gross and Net Contribution: We measure and track our profitability for most business units in terms of Gross Contribution (GC) and Net Contribution (NC) per tonne of product supplied. For every transaction, we target a minimum dollar net contribution per tonne of product supplied based on the investment, risks, complexities and value added services that we provide to our customers. We are focused on enhancing these margins by providing value added services such as vendor managed inventory solutions (VMI), organic certifications, traceability guarantees, fair trade produce (FTP) certifications, customised grades and quality, processed ingredients supply, proprietary market intelligence and risk management solutions.
GC is calculated as the total revenue from the sale of goods and services plus other income and share of gain/loss from jointly controlled entities/associates, less the cost of goods sold (raw material
Page 18
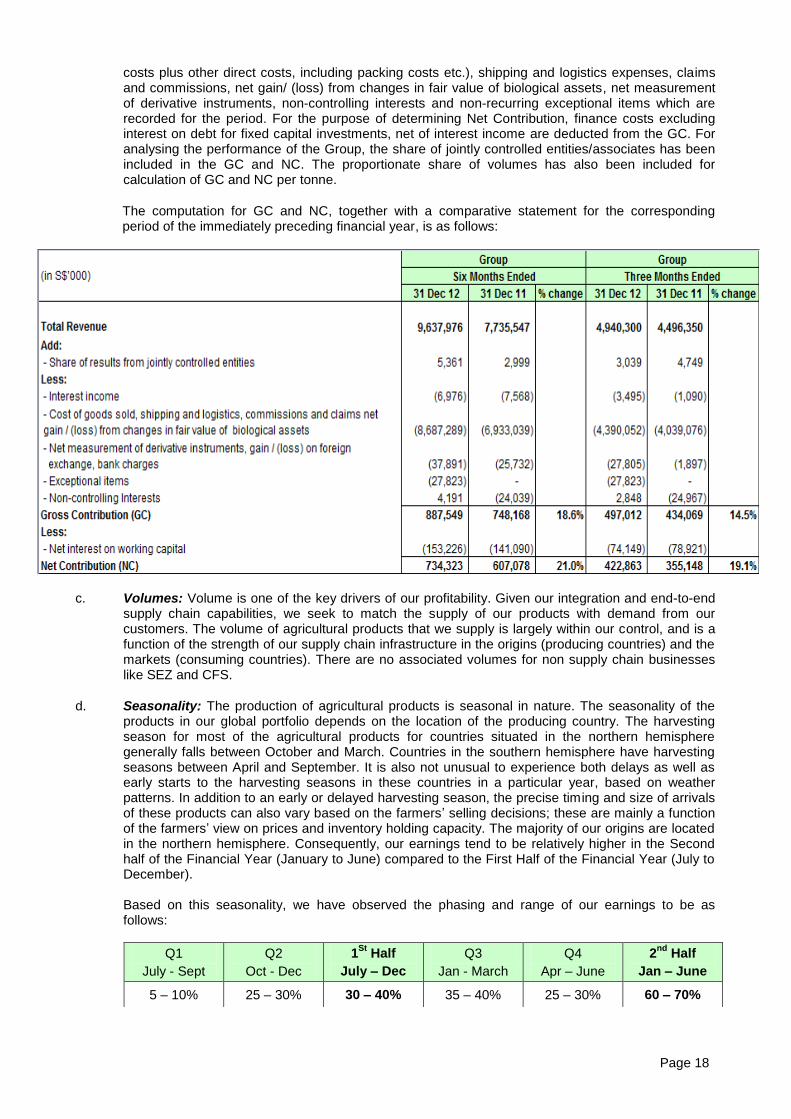
costs plus other direct costs, including packing costs etc.), shipping and logistics expenses, claims and commissions, net gain/ (loss) from changes in fair value of biological assets, net measurement of derivative instruments, non-controlling interests and non-recurring exceptional items which are recorded for the period. For the purpose of determining Net Contribution, finance costs excluding interest on debt for fixed capital investments, net of interest income are deducted from the GC. For analysing the performance of the Group, the share of jointly controlled entities/associates has been included in the GC and NC. The proportionate share of volumes has also been included for calculation of GC and NC per tonne.
The computation for GC and NC, together with a comparative statement for the corresponding period of the immediately preceding financial year, is as follows:
c. Volumes: Volume is one of the key drivers of our profitability. Given our integration and end-to-end supply chain capabilities, we seek to match the supply of our products with demand from our customers. The volume of agricultural products that we supply is largely within our control, and is a function of the strength of our supply chain infrastructure in the origins (producing countries) and the markets (consuming countries). There are no associated volumes for non supply chain businesses like SEZ and CFS.
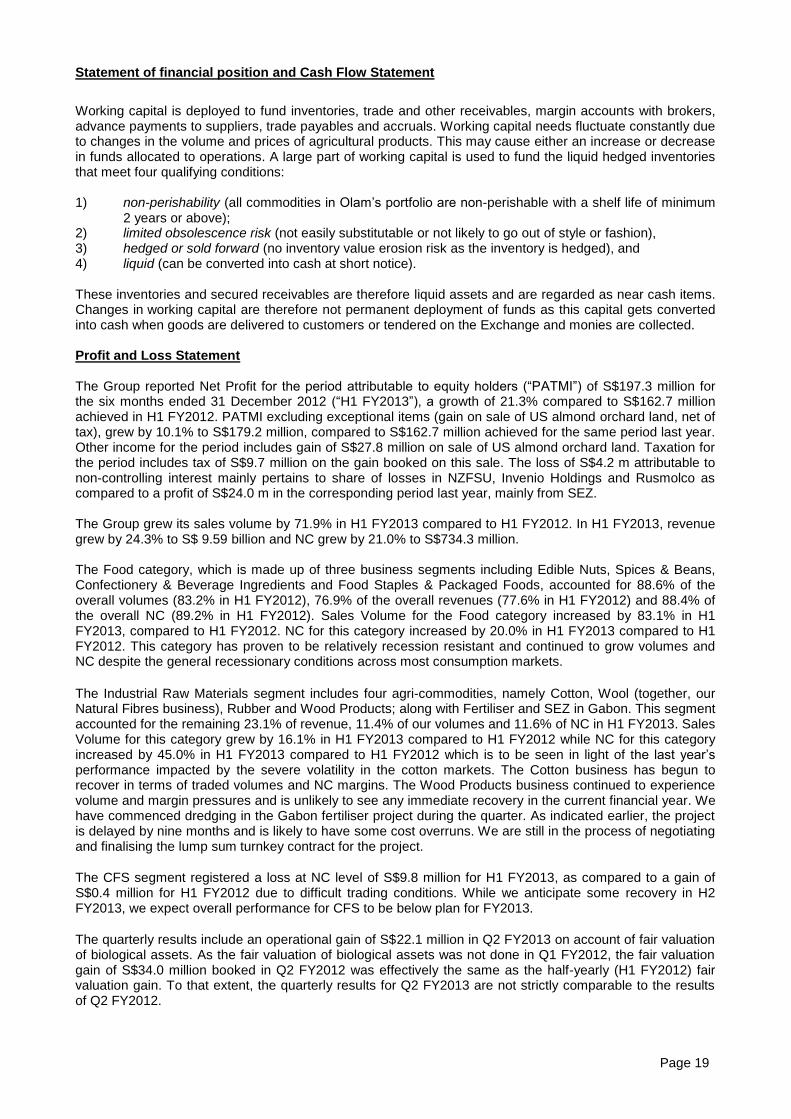
d. Seasonality: The production of agricultural products is seasonal in nature. The seasonality of the products in our global portfolio depends on the location of the producing country. The harvesting season for most of the agricultural products for countries situated in the northern hemisphere generally falls between October and March. Countries in the southern hemisphere have harvesting seasons between April and September. It is also not unusual to experience both delays as well as early starts to the harvesting seasons in these countries in a particular year, based on weather patterns. In addition to an early or delayed harvesting season, the precise timing and size of arrivals of these products can also vary based on the farmers’ selling decisions; these are mainly a function of the farmers’ view on prices and inventory holding capacity. The majority of our origins are located in the northern hemisphere. Consequently, our earnings tend to be relatively higher in the Second half of the Financial Year (January to June) compared to the First Half of the Financial Year (July to December).
Based on this seasonality, we have observed the phasing and range of our earnings to be as
follows:
Q1
July - Sept
Q2
Oct - Dec
1St
Half
July – Dec
Q3
Jan - March
Q4
Apr – June
2nd
Half
Jan – June
5 – 10% 25 – 30% 30 – 40% 35 – 40% 25 – 30% 60 – 70%
Page 19
Statement of financial position and Cash Flow Statement
Working capital is deployed to fund inventories, trade and other receivables, margin accounts with brokers, advance payments to suppliers, trade payables and accruals. Working capital needs fluctuate constantly due to changes in the volume and prices of agricultural products. This may cause either an increase or decrease in funds allocated to operations. A large part of working capital is used to fund the liquid hedged inventories that meet four qualifying conditions: 1) non-perishability (all commodities in Olam’s portfolio are non-perishable with a shelf life of minimum
2 years or above); 2) limited obsolescence risk (not easily substitutable or not likely to go out of style or fashion), 3) hedged or sold forward (no inventory value erosion risk as the inventory is hedged), and 4) liquid (can be converted into cash at short notice). These inventories and secured receivables are therefore liquid assets and are regarded as near cash items. Changes in working capital are therefore not permanent deployment of funds as this capital gets converted into cash when goods are delivered to customers or tendered on the Exchange and monies are collected. Profit and Loss Statement The Group reported Net Profit for the period attributable to equity holders (“PATMI”) of S$197.3 million for the six months ended 31 December 2012 (“H1 FY2013”), a growth of 21.3% compared to S$162.7 million achieved in H1 FY2012. PATMI excluding exceptional items (gain on sale of US almond orchard land, net of tax), grew by 10.1% to S$179.2 million, compared to S$162.7 million achieved for the same period last year. Other income for the period includes gain of S$27.8 million on sale of US almond orchard land. Taxation for the period includes tax of S$9.7 million on the gain booked on this sale. The loss of S$4.2 m attributable to non-controlling interest mainly pertains to share of losses in NZFSU, Invenio Holdings and Rusmolco as compared to a profit of S$24.0 m in the corresponding period last year, mainly from SEZ. The Group grew its sales volume by 71.9% in H1 FY2013 compared to H1 FY2012. In H1 FY2013, revenue grew by 24.3% to S$ 9.59 billion and NC grew by 21.0% to S$734.3 million. The Food category, which is made up of three business segments including Edible Nuts, Spices & Beans, Confectionery & Beverage Ingredients and Food Staples & Packaged Foods, accounted for 88.6% of the overall volumes (83.2% in H1 FY2012), 76.9% of the overall revenues (77.6% in H1 FY2012) and 88.4% of the overall NC (89.2% in H1 FY2012). Sales Volume for the Food category increased by 83.1% in H1 FY2013, compared to H1 FY2012. NC for this category increased by 20.0% in H1 FY2013 compared to H1 FY2012. This category has proven to be relatively recession resistant and continued to grow volumes and NC despite the general recessionary conditions across most consumption markets.
The Industrial Raw Materials segment includes four agri-commodities, namely Cotton, Wool (together, our Natural Fibres business), Rubber and Wood Products; along with Fertiliser and SEZ in Gabon. This segment accounted for the remaining 23.1% of revenue, 11.4% of our volumes and 11.6% of NC in H1 FY2013. Sales Volume for this category grew by 16.1% in H1 FY2013 compared to H1 FY2012 while NC for this category increased by 45.0% in H1 FY2013 compared to H1 FY2012 which is to be seen in light of the last year’s performance impacted by the severe volatility in the cotton markets. The Cotton business has begun to recover in terms of traded volumes and NC margins. The Wood Products business continued to experience volume and margin pressures and is unlikely to see any immediate recovery in the current financial year. We have commenced dredging in the Gabon fertiliser project during the quarter. As indicated earlier, the project is delayed by nine months and is likely to have some cost overruns. We are still in the process of negotiating and finalising the lump sum turnkey contract for the project.
The CFS segment registered a loss at NC level of S$9.8 million for H1 FY2013, as compared to a gain of S$0.4 million for H1 FY2012 due to difficult trading conditions. While we anticipate some recovery in H2 FY2013, we expect overall performance for CFS to be below plan for FY2013.
The quarterly results include an operational gain of S$22.1 million in Q2 FY2013 on account of fair valuation of biological assets. As the fair valuation of biological assets was not done in Q1 FY2012, the fair valuation gain of S$34.0 million booked in Q2 FY2012 was effectively the same as the half-yearly (H1 FY2012) fair valuation gain. To that extent, the quarterly results for Q2 FY2013 are not strictly comparable to the results of Q2 FY2012.
Page 20
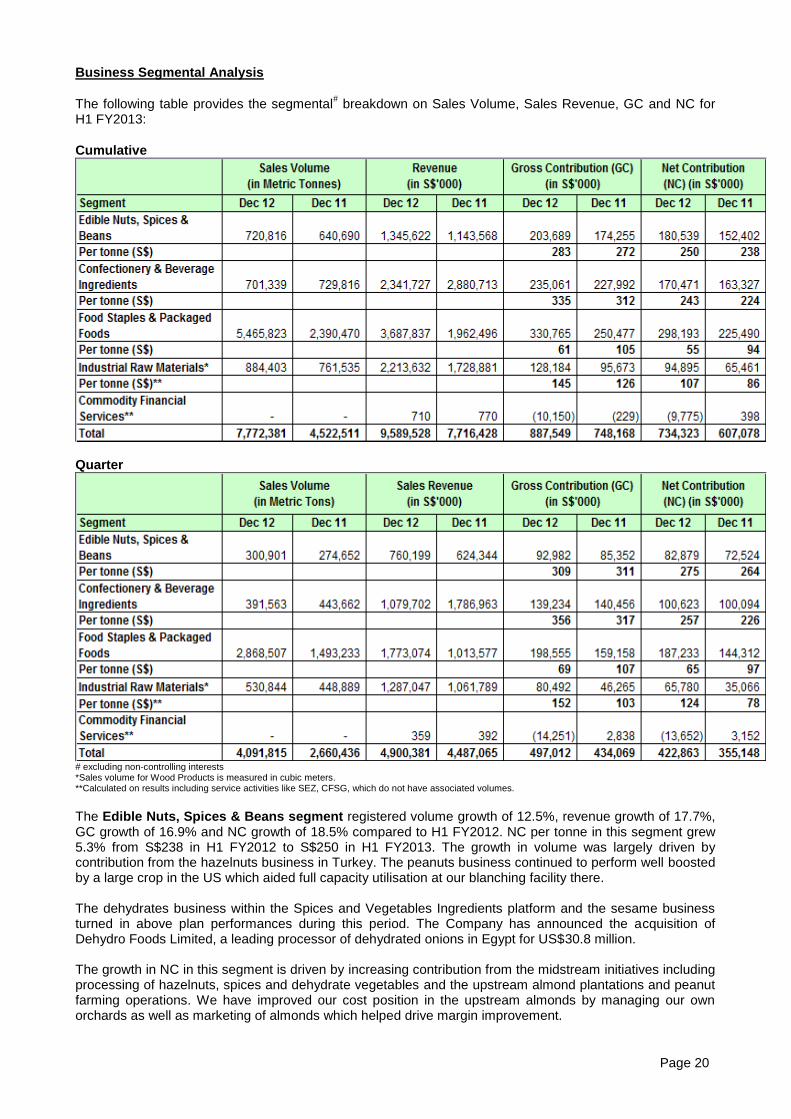
Business Segmental Analysis
The following table provides the segmental# breakdown on Sales Volume, Sales Revenue, GC and NC for
H1 FY2013:
Cumulative
Quarter
# excluding non-controlling interests
*Sales volume for Wood Products is measured in cubic meters. **Calculated on results including service activities like SEZ, CFSG, which do not have associated volumes.
The Edible Nuts, Spices & Beans segment registered volume growth of 12.5%, revenue growth of 17.7%, GC growth of 16.9% and NC growth of 18.5% compared to H1 FY2012. NC per tonne in this segment grew 5.3% from S$238 in H1 FY2012 to S$250 in H1 FY2013. The growth in volume was largely driven by contribution from the hazelnuts business in Turkey. The peanuts business continued to perform well boosted by a large crop in the US which aided full capacity utilisation at our blanching facility there. The dehydrates business within the Spices and Vegetables Ingredients platform and the sesame business turned in above plan performances during this period. The Company has announced the acquisition of Dehydro Foods Limited, a leading processor of dehydrated onions in Egypt for US$30.8 million. The growth in NC in this segment is driven by increasing contribution from the midstream initiatives including processing of hazelnuts, spices and dehydrate vegetables and the upstream almond plantations and peanut farming operations. We have improved our cost position in the upstream almonds by managing our own orchards as well as marketing of almonds which helped drive margin improvement.
Page 21
The Confectionery & Beverage Ingredients segment registered volume decline of 3.9%, GC growth of 3.1% and 4.4% growth in NC compared to H1 FY2012. The segment grew its NC per tonne by 8.6% from S$224 in H1 FY2012 to S$243 in H1 FY2013. The segment saw a decline in volumes primarily due to extended sales and shipment schedules from key cocoa and coffee origins. The pending shipments are expected to take place in Q3 FY2013. Robusta coffee origination out of Indonesia performed ahead of plan. Margin growth is driven by improving supply chain margins as well as enhanced margins from investments in upstream coffee plantation as well as midstream cocoa processing in Spain/ UK and soluble coffee manufacturing in Vietnam. Phase 2 expansion of this facility was completed on time and on budget in Q2 FY2013. During Q2 FY2013, the Company acquired the soluble coffee assets and business of Seda Solubles in Spain in order to expand our soluble coffee franchise for a total consideration of US$ 52 million. In addition, the Company plans to invest an additional US$7 million capex in the plant. The Food Staples & Packaged Foods segment achieved volume growth of 128.7%, GC growth of 32.1% and NC growth of 32.2% compared to H1 FY2012. The strong volume growth was driven by the Grains business, which saw an increase in milling volumes in Africa, as well as origination volumes across Australia, Russia and Ukraine. This also led to a decline in the NC per tonne from S$94 in H1 FY2012 to S$55 in H1 FY2013 due to the inherently lower margin on bulk products like wheat, corn, soybeans and barley. However, the lower NC per tonne was offset by the much higher volume growth, contributing to the robust growth in the overall NC pool for the segment. Rice, palm and packaged food businesses continued to perform well while dairy business was behind plan. During the quarter, the Company acquired 50% interest in Acacia Investments in order to expand its edible oil refining and distribution footprint in East Africa. The planned acquisition of a Brazilian sugar milling asset (“UAP”), which was announced in May 2012, was terminated on mutual consent as Olam and UAP were not able to reach an agreement on the final closing terms and conditions. On 19 December 2012, the Company also completed its acquisition of 100% of the equity interest in New Zealand Dairy Farming Systems, Uruguay (“NZFSU”) and subsequently de-listed NZFSU from the New Zealand stock exchange. The Industrial Raw Materials segment saw volume growth of 16.1%, GC growth of 34.0% and NC growth of 45.0% compared to H1 FY2012. This segment constituted 11.4% of the Group’s volumes, 23.1% of its revenues, 14.4% of its GC and 12.9% of its NC. NC per tonne in this segment grew by 24.8% from S$86 in H1 FY2012 to S$107 in H1 FY2013. The Cotton business has seen volume and margin recovery during the quarter and we expect it to stabilise at these levels going forward. The Wool and Rubber businesses have had a good start during the quarter while Wood Products business continues to be lacklustre. The Commodity Financial Services segment registered a loss at NC level of S$9.8 million in H1 FY2013, compared to a gain of S$0.4 million for H1 FY2012 due to difficult trading conditions. While we anticipate some recovery in H2 FY2013, we expect overall performance for CFS to be below plan for FY2013. Costs and Expenses H1 FY2013: Overhead expenses at S$431.5 million for H1 FY2013 were 13.3% higher than the S$380.9 incurred in H1 FY2012. Overhead expenses include employee benefit expenses which increased from S$171.5 million in H1 FY2012 to S$229.9 million in H1 FY2013 largely due to consolidation of acquisitions done during FY2012, viz, HIL, VKL, TFL, UBL, PROGIDA, OK, RUSMOLCO and Olam Macao Spain. Overhead expenses also include depreciation expenses which increased from S$62.4 million in H1 FY2012 to S$76.0 million in H1 FY2013 and other operating expenses which decreased from S$147.0 million in H1 FY2012 to S$125.7 million in H1 FY2013. Q2 FY2013: Overhead expenses at S$221.2 million for Q2 FY2013 were 11.0% higher than the corresponding quarter in FY2012. Overhead expenses include employee benefit expenses which increased from S$86.1 million in Q2 FY2012 to S$114.7 million in Q2 FY2013 for the reasons cited above. Overhead expenses also include depreciation expenses which increased from S$26.6 million in Q2 FY2012 to S$35.9 million in Q2 FY2013 and other operating expenses which decreased from S$86.5 million in Q2 FY2012 to S$70.6 million in Q2 FY2013. Taxation H1 FY2013: Income Tax provisions have increased to S$27.7 million for H1 FY2013 as compared to S$17.2 million for H1 FY2012. This includes tax provision of S$9.7 million on gains due to the sale of US almond orchard land.
Page 22
Q2 FY2013: Income Tax provisions have increased to S$21.6 million for Q2 FY2013 as compared to S$11.0 million for Q2 FY2012. This includes tax provision of S$9.7 million on gains due to the sale of US almond orchard land. Net profit after tax H1 FY2013: Net profit after tax increased by 3.4% to S$193.1 million for H1 FY2013 from S$186.8 million in H1 FY2012. Operational Net Profit for the period attributable to equity holders grew by 10.1% to S$179.2 million compared to S$162.7 million achieved in the previous corresponding period. Q2 FY2013: Net profit after tax decreased by 1.4% to S$151.3 million for Q2 FY2013 from S$153.5 million in Q2 FY2012. Operational Net Profit for the period attributable to equity holders grew by 5.9% to S$136.1 million, compared to S$128.5 million achieved for the same period last year. Statement of financial position & Cash Flow
As of 31 December 2012, the Group maintained undrawn bank lines aggregating S$4,439 million to provide for any near term commodity price inflation that would increase the working capital requirement. During Q2 FY2013, the Company issued S$500 million 6% fixed rate notes due 2022.
Current Assets Debtors Analysis Debtor days as at 31 December 2012 decreased to 32 days as compared to 34 days as at 31 December 2011.
Stocks
Stock turnover days also decreased to 102 days as at 31 December 2012, as compared to 119 days as at 31 December 2011. While the absolute value of inventory increased, the higher turnover during the period led to the decrease in overall stock turnover days.
Advances to Suppliers
Advance to suppliers increased to 8 days as at 31 December 2012 from 7 days as at 31 December 2011. The advances increased from S$320.6 million as at 30 June 2012 to S$406.7 million as at 31 December 2012. Cash and Fixed Deposits Cash and Fixed Deposits decreased by 1.7% to S$1,091.8 million as of 31 December 2012 from S$1,110.9 million as of 30 June 2012 which was drawn down to fund the peak season procurement. Other Current Assets Other Current Assets include cash consideration paid of S$132.4 million invested on acquisition of Kayass, Dehydro Foods Limited, Seda Soluble and Northern Coffee Corporation Limited, pending completion of Purchase Price Allocation (PPA) exercise. After completion of PPA exercise, the corresponding assets and liabilities including the resultant goodwill (positive or negative) will be recognised accordingly. Borrowings
Borrowings increased to S$8,836.4 million as of 31 December 2012 from S$7,489.4 million as of 30 June 2012. This increase was mainly on account of a drawdown of the long-term facilities for deployment in working capital / M&A projects / capital expenditures. Group borrowings, net of cash and fixed deposits, increased by S$1,366.1 million to S$7,744.6 million as compared to S$6,378.5 million as at 30 June 2012. Secured loans, which decreased from S$415 million as of 30 June 2012 to S$220 million as of 31 December 2012, relate to loans taken by subsidiaries and are secured by specific assets of these subsidiaries. During Q2 FY2013, the Company issued S$500 million 6% fixed rate notes due 2022.
Page 23
Cash flow
During the period, S$469.6 million has been invested in capex and acquisitions. The Group invested S$132.4 million on acquisition of Kayass, Dehydro Foods Limited, Seda Soluble and Northern Coffee Corporation Limited. Investment in jointly controlled entities, Acacia and Lansing, amounted to S$38.5 million. The Group also made a net investment of $296.2 million during the period on various capex investments mainly in Gabon, Nigeria, Russia, Australia, Ivory Coast, Vietnam, USA and India.
These investments along with increased working capital deployment in operations because of peak procurement season, have resulted in Net Debt to Equity to increase from 1.81x as of 30 June 2012 to 2.21x as of 31 December 2012.
Equity Total share capital and reserves (before Fair Value Adjustment Reserves and Non-controlling interest) decreased by 0.8% from S$3,530.8 million as of 30 June 2012 to S$3,503.3 million as of 31 December 2012 mainly due to change in currency translation reserves. Fair Value Adjustment Reserves decreased from (S$125.2) million as of 30 June 2012 to (S$51.0 ) million as of 31 December 2012. During H1 FY2013, the Company did not issue any shares for cash or share options. 9. Where a forecast, or a prospect statement, has been previously disclosed to shareholders, any
variance between it and the actual results.
There was no forecast made by the Company. 10. A commentary at the date of the announcement of the significant trends and competitive conditions
of the industry in which the Group operates and any known factors or events that may affect the Group in the next reporting period and the next 12 months.
The Group operates in an attractive sector with strong growth prospects. Major secular trends favour the continuing growth and attractive characteristics of the industry.
The Group is currently in the process of recalibrating its strategy and is expected to complete the exercise within the next three months after which a suitable announcement will be made.
11. Dividend
(a) Current Financial Period Reported on 31 December 2012.
Any dividend recommended for the current financial period reported on?
NIL
(b) Corresponding Period of the Immediately Preceding Financial Year.
Any dividend declared for the corresponding period of the immediately preceding financial year? NIL
(c) Whether the dividend is before tax, net of tax or tax exempt. If before tax or net of tax, state the tax rate and the country where the dividend is derived. (If the dividend is not taxable in the hands of shareholders, this must be stated).
N.A.
(d) Date payable
N.A.
Page 24
(e) Books closure date
N.A.
12. If no dividend has been declared/recommended, a statement to that effect.
N.A.
13. If the Group has obtained a general mandate from shareholders for IPTs, the aggregate value of such transactions as required under Rule 920(1)(a)(ii). If no IPT mandate has been obtained, a statement to that effect. The Company has not obtained a general mandate from shareholders for Interested Person Transactions.
Confirmation of the Board We refer to the requirement under Rule 705(5) of the Listing Manual. We hereby confirm to the best of our knowledge that nothing has come to the attention of the Board of Directors of the Company which may render the unaudited interim financial results for period ended 31 December 2012 to be false or misleading in any material aspects. On behalf of the Board of Directors R. Jayachandran Sunny George Verghese Chairman Group Managing Director & CEO BY ORDER OF THE BOARD
Sunny George Verghese Group Managing Director & CEO 7 February 2013