(oil spill contingency plan) - welcome to...
TRANSCRIPT

Appendix 2 (Oil Spill Contingency Plan)
ADANI PETRONET (DAHEJ) PORT PVT. LTD. DAHEJ
OIL SPILL CONTINGENCY RESPONSE PLAN
Prepared By : Mr. Chintan Bhatt Issue No. : 00 Issued On : 10/10/2012 Approved By : Capt. Achal K. Singh Revision No. : 02 Page 10 of 45
OIL SPILL CONTINGENCY RESPONSE PLAN
TIER 1
ADANI PETRONET (DAHEJ) PORT PVT. LTD.
At. & Post : Lakhigam, Taluka Vagra, via Dahej,
Bharuch : 392 130, Gujarat, India
PH. : (02641) 285030 / 285020 FAX : (02641) 285030
(COVER PAGE)
Section 00: DOCUMENT CONTROL
ADANI PETRONET (DAHEJ) PORT PVT. LTD. DAHEJ
OIL SPILL CONTINGENCY RESPONSE PLAN
Prepared By : Mr. Chintan Bhatt Issue No. : 00 Issued On : 10/10/2012 Approved By : Capt. Achal K. Singh Revision No. : 02 Page 10 of 45
00.1. This document is the property of Adani Petronet (Dahej) Port Pvt. Ltd,
hereinafter referred to as APPPL - Dahej, and shall not be removed from the Company’s premises.
00.2. When the controlled copy holder ceases to be the authorized recipient of this
document, the document should be returned to the Head Marine, Dahej Office. 00.3. This document is distributed as per OSCRP – Section 04 – Section 1.7 – Distribution
list of Oil Spill Contingency Response plan. In addition, documents on a “need based” basis will be distributed.
00.4. All documents so distributed will be controlled documents & identified by a unique
control number as per OSCRP – Section 04 – Section 1.7 – Distribution list of Oil Spill Contingency Response plan.
00.5. The holder of the control copy shall ensure that the persons working under him,
who are responsible for any activity described in this document, are made aware of such responsibility. These persons shall be given this document to read and as acknowledgment of having read shall sign the OSCRP – Section 01 Record of Circulation page of this document.
00.6. All persons to whom the documents have been circulated shall also be made
aware of any revisions thereto by the holder of the controlled copy of the document. The person shall, after reading, sign in the OSCRP – Section 01 Record of Circulation page of this document as acknowledgment of having read and under stood the document.
00.7. Marine staff at APPPL Dahej shall sign in the control copy issued to Marine
Control Room Dahej (Copy no. 05)

ADANI PETRONET (DAHEJ) PORT PVT. LTD. DAHEJ
OIL SPILL CONTINGENCY RESPONSE PLAN
Prepared By : Mr. Chintan Bhatt Issue No. : 00 Issued On : 10/10/2012 Approved By : Capt. Achal K. Singh Revision No. : 02 Page 10 of 45
Section 01
RECORD OF CIRCULATION The holder of the copy thereto shall circulate this document and any revisions to concerned persons. After reading, this document shall be signed and returned to the holder.
Name Rank Date read Signature
ADANI PETRONET (DAHEJ) PORT PVT. LTD. DAHEJ
OIL SPILL CONTINGENCY RESPONSE PLAN
Prepared By : Mr. Chintan Bhatt Issue No. : 00 Issued On : 10/10/2012 Approved By : Capt. Achal K. Singh Revision No. : 02 Page 10 of 45
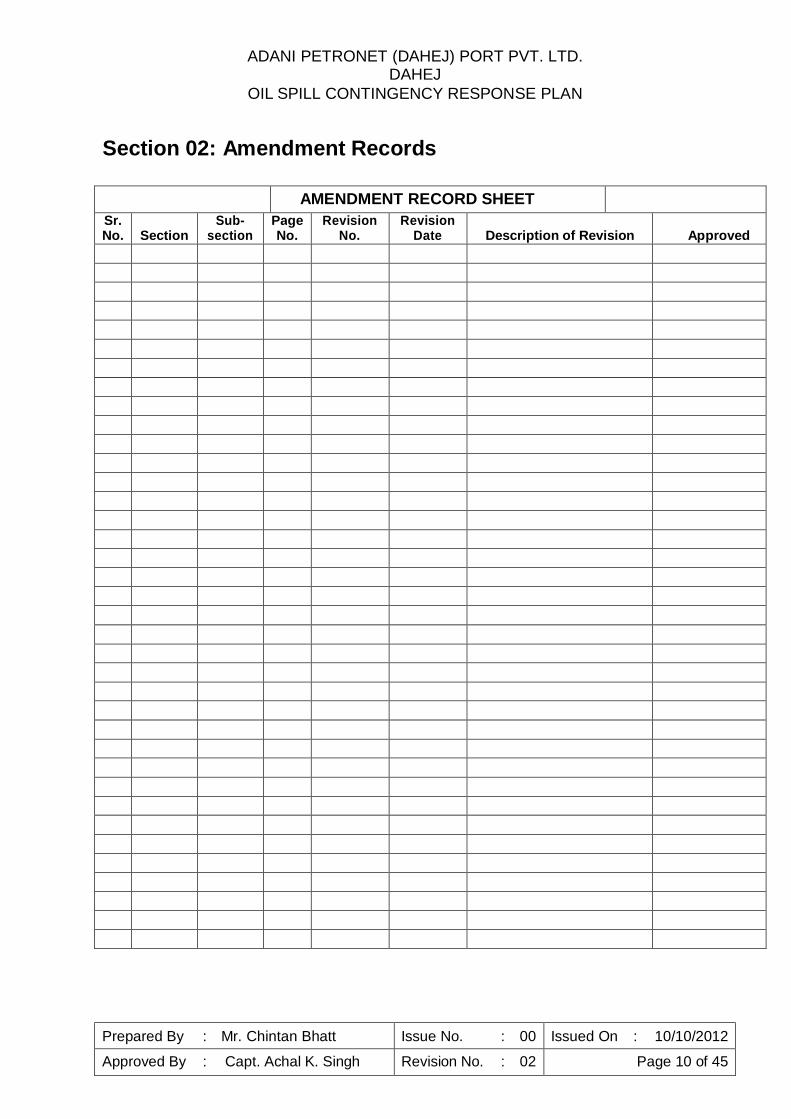
Section 02: Amendment Records AMENDMENT RECORD SHEET
Sr. No.
Section
Sub- section
Page No.
Revision No.
Revision Date
Description of Revision
Approved
ADANI PETRONET (DAHEJ) PORT PVT. LTD. DAHEJ
OIL SPILL CONTINGENCY RESPONSE PLAN
Prepared By : Mr. Chintan Bhatt Issue No. : 00 Issued On : 10/10/2012 Approved By : Capt. Achal K. Singh Revision No. : 02 Page 10 of 45
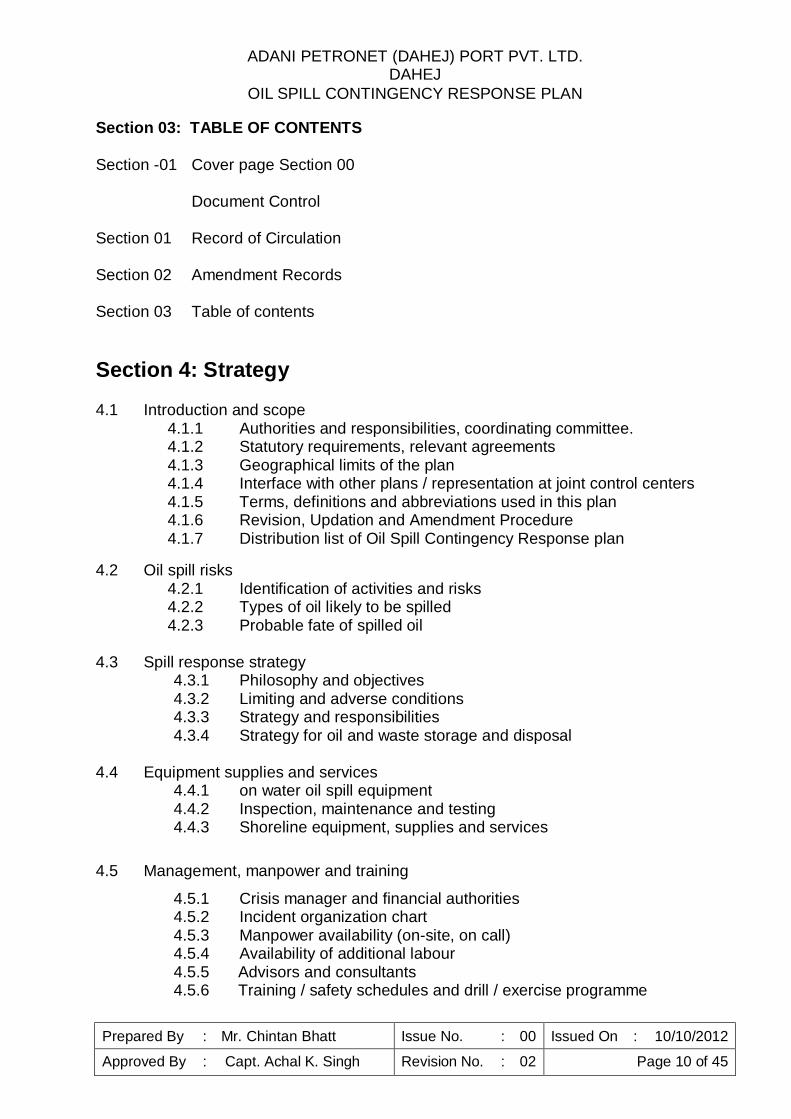
Section 03: TABLE OF CONTENTS Section -01 Cover page Section 00
Document Control
Section 01 Record of Circulation
Section 02 Amendment Records
Section 03 Table of contents
Section 4: Strategy
4.1 Introduction and scope
4.1.1 Authorities and responsibilities, coordinating committee. 4.1.2 Statutory requirements, relevant agreements 4.1.3 Geographical limits of the plan 4.1.4 Interface with other plans / representation at joint control centers 4.1.5 Terms, definitions and abbreviations used in this plan 4.1.6 Revision, Updation and Amendment Procedure 4.1.7 Distribution list of Oil Spill Contingency Response plan
4.2 Oil spill risks
4.2.1 Identification of activities and risks 4.2.2 Types of oil likely to be spilled 4.2.3 Probable fate of spilled oil
4.3 Spill response strategy
4.3.1 Philosophy and objectives 4.3.2 Limiting and adverse conditions 4.3.3 Strategy and responsibilities 4.3.4 Strategy for oil and waste storage and disposal
4.4 Equipment supplies and services
4.4.1 on water oil spill equipment 4.4.2 Inspection, maintenance and testing 4.4.3 Shoreline equipment, supplies and services
4.5 Management, manpower and training
4.5.1 Crisis manager and financial authorities 4.5.2 Incident organization chart 4.5.3 Manpower availability (on-site, on call) 4.5.4 Availability of additional labour 4.5.5 Advisors and consultants 4.5.6 Training / safety schedules and drill / exercise programme
ADANI PETRONET (DAHEJ) PORT PVT. LTD. DAHEJ
OIL SPILL CONTINGENCY RESPONSE PLAN
Prepared By : Mr. Chintan Bhatt Issue No. : 00 Issued On : 10/10/2012 Approved By : Capt. Achal K. Singh Revision No. : 02 Page 10 of 45
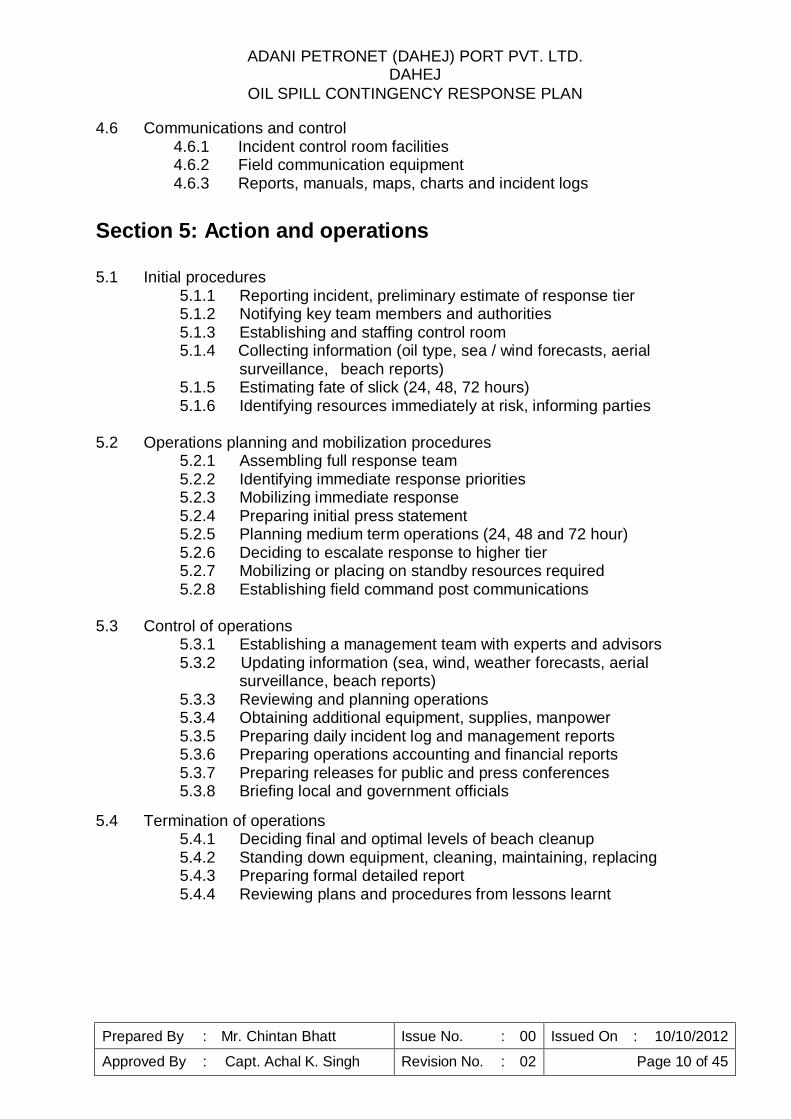
4.6 Communications and control
4.6.1 Incident control room facilities 4.6.2 Field communication equipment 4.6.3 Reports, manuals, maps, charts and incident logs
Section 5: Action and operations
5.1 Initial procedures
5.1.1 Reporting incident, preliminary estimate of response tier 5.1.2 Notifying key team members and authorities 5.1.3 Establishing and staffing control room 5.1.4 Collecting information (oil type, sea / wind forecasts, aerial
surveillance, beach reports) 5.1.5 Estimating fate of slick (24, 48, 72 hours) 5.1.6 Identifying resources immediately at risk, informing parties
5.2 Operations planning and mobilization procedures
5.2.1 Assembling full response team 5.2.2 Identifying immediate response priorities 5.2.3 Mobilizing immediate response 5.2.4 Preparing initial press statement 5.2.5 Planning medium term operations (24, 48 and 72 hour) 5.2.6 Deciding to escalate response to higher tier 5.2.7 Mobilizing or placing on standby resources required 5.2.8 Establishing field command post communications
5.3 Control of operations
5.3.1 Establishing a management team with experts and advisors 5.3.2 Updating information (sea, wind, weather forecasts, aerial
surveillance, beach reports) 5.3.3 Reviewing and planning operations 5.3.4 Obtaining additional equipment, supplies, manpower 5.3.5 Preparing daily incident log and management reports 5.3.6 Preparing operations accounting and financial reports 5.3.7 Preparing releases for public and press conferences 5.3.8 Briefing local and government officials
5.4 Termination of operations
5.4.1 Deciding final and optimal levels of beach cleanup 5.4.2 Standing down equipment, cleaning, maintaining, replacing 5.4.3 Preparing formal detailed report 5.4.4 Reviewing plans and procedures from lessons learnt
ADANI PETRONET (DAHEJ) PORT PVT. LTD. DAHEJ
OIL SPILL CONTINGENCY RESPONSE PLAN
Prepared By : Mr. Chintan Bhatt Issue No. : 00 Issued On : 10/10/2012 Approved By : Capt. Achal K. Singh Revision No. : 02 Page 10 of 45
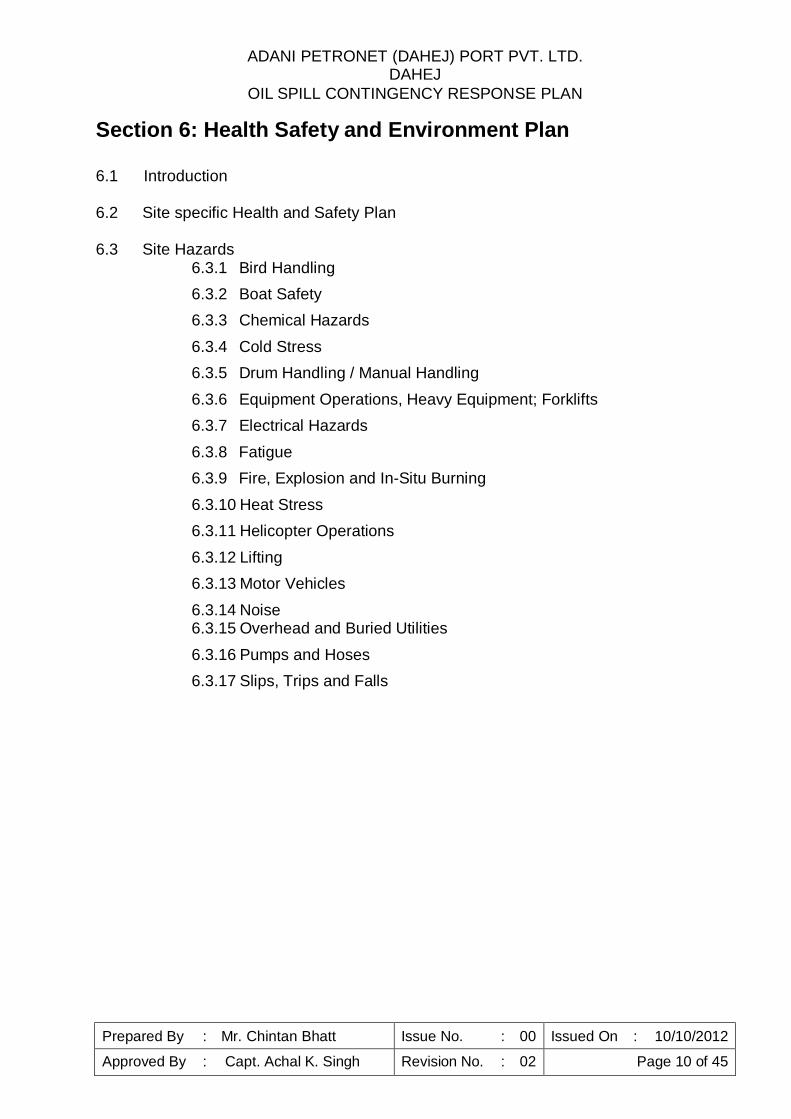
Section 6: Health Safety and Environment Plan
6.1 Introduction
6.2 Site specific Health and Safety Plan
6.3 Site Hazards
6.3.1 Bird Handling
6.3.2 Boat Safety
6.3.3 Chemical Hazards
6.3.4 Cold Stress
6.3.5 Drum Handling / Manual Handling
6.3.6 Equipment Operations, Heavy Equipment; Forklifts
6.3.7 Electrical Hazards
6.3.8 Fatigue
6.3.9 Fire, Explosion and In-Situ Burning
6.3.10 Heat Stress
6.3.11 Helicopter Operations
6.3.12 Lifting
6.3.13 Motor Vehicles
6.3.14 Noise 6.3.15 Overhead and Buried Utilities
6.3.16 Pumps and Hoses
6.3.17 Slips, Trips and Falls
ADANI PETRONET (DAHEJ) PORT PVT. LTD. DAHEJ
OIL SPILL CONTINGENCY RESPONSE PLAN
Prepared By : Mr. Chintan Bhatt Issue No. : 00 Issued On : 10/10/2012 Approved By : Capt. Achal K. Singh Revision No. : 02 Page 10 of 45
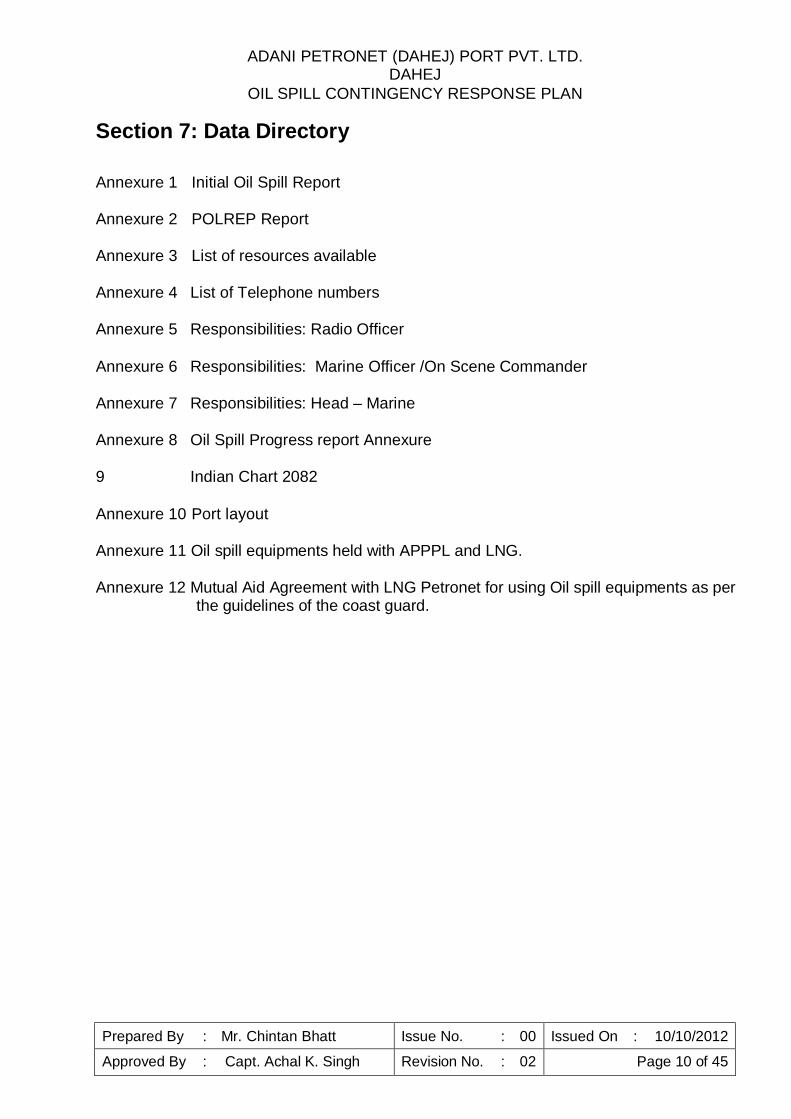
Section 7: Data Directory
Annexure 1 Initial Oil Spill Report
Annexure 2 POLREP Report
Annexure 3 List of resources available
Annexure 4 List of Telephone numbers
Annexure 5 Responsibilities: Radio Officer
Annexure 6 Responsibilities: Marine Officer /On Scene Commander
Annexure 7 Responsibilities: Head – Marine
Annexure 8 Oil Spill Progress report Annexure
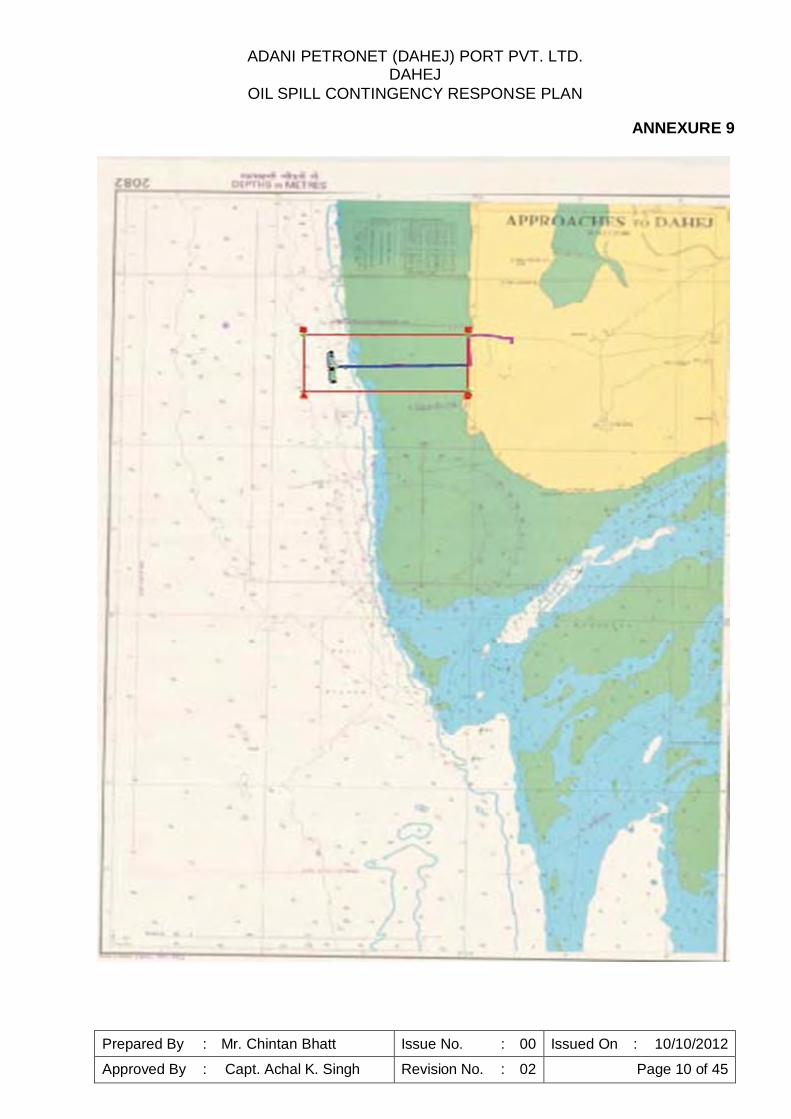
9 Indian Chart 2082
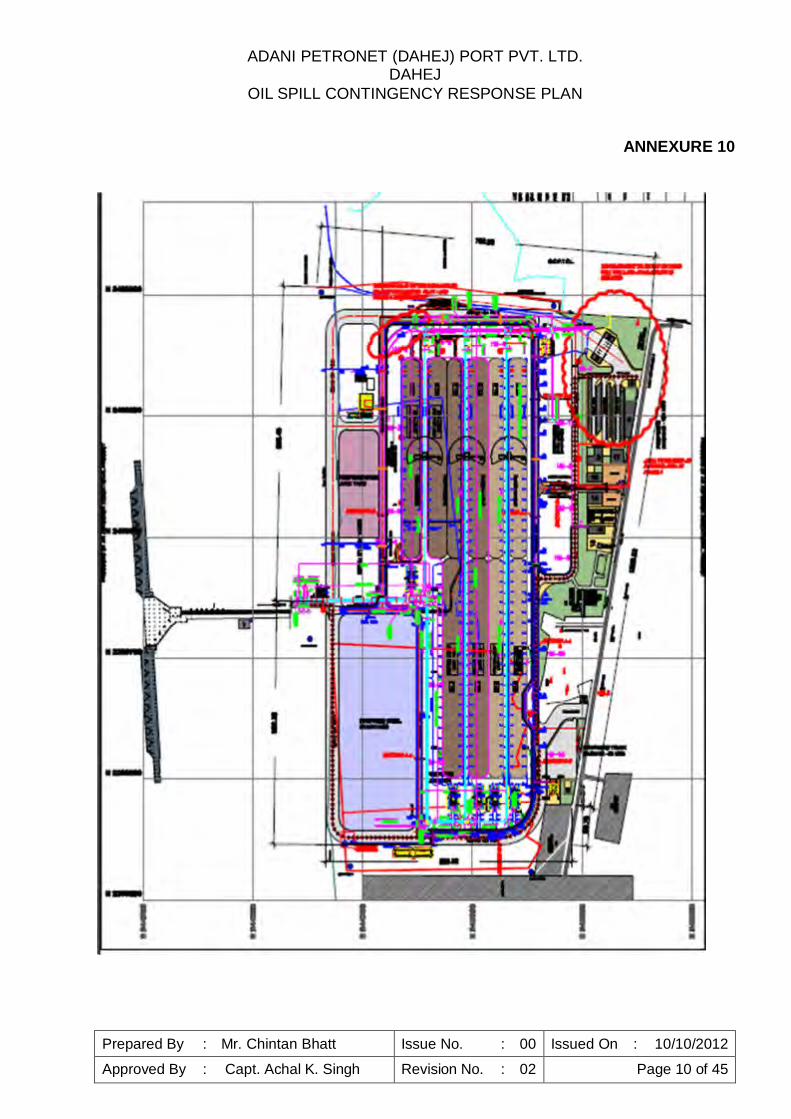
Annexure 10 Port layout
Annexure 11 Oil spill equipments held with APPPL and LNG.
Annexure 12 Mutual Aid Agreement with LNG Petronet for using Oil spill equipments as per the guidelines of the coast guard.
ADANI PETRONET (DAHEJ) PORT PVT. LTD. DAHEJ
OIL SPILL CONTINGENCY RESPONSE PLAN
Prepared By : Mr. Chintan Bhatt Issue No. : 00 Issued On : 10/10/2012 Approved By : Capt. Achal K. Singh Revision No. : 02 Page 10 of 45
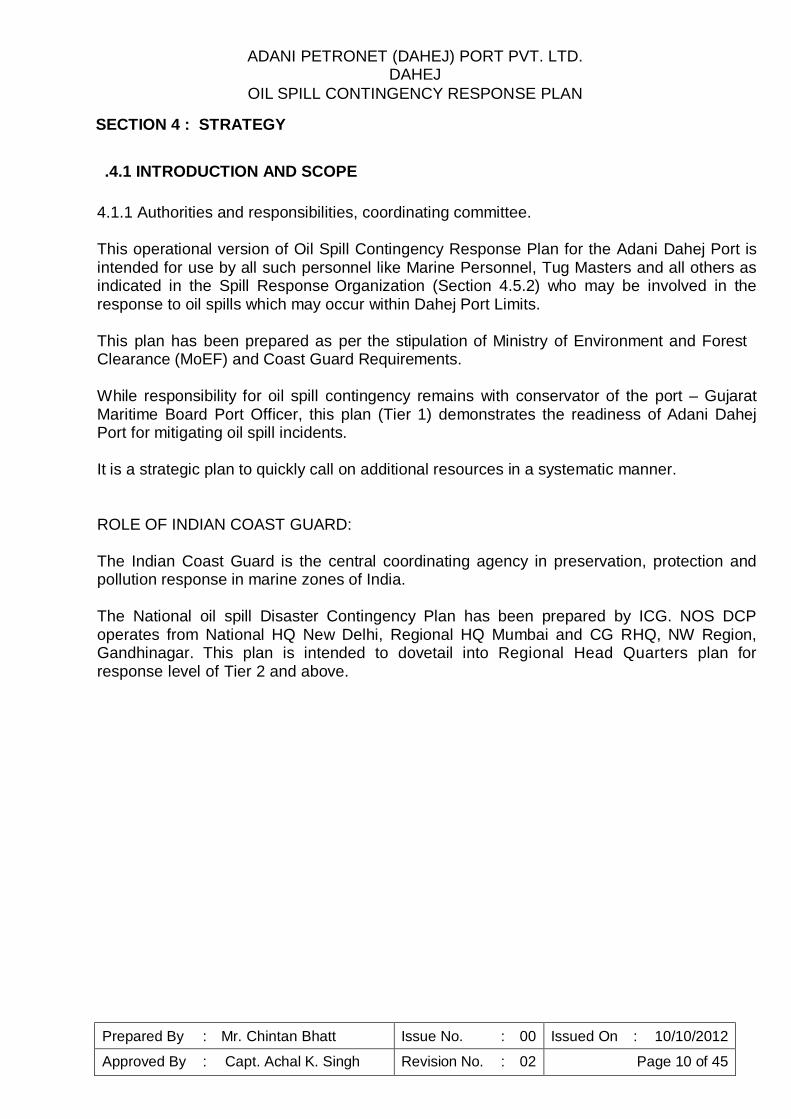
SECTION 4 : STRATEGY
.4.1 INTRODUCTION AND SCOPE
4.1.1 Authorities and responsibilities, coordinating committee.
This operational version of Oil Spill Contingency Response Plan for the Adani Dahej Port is intended for use by all such personnel like Marine Personnel, Tug Masters and all others as indicated in the Spill Response Organization (Section 4.5.2) who may be involved in the response to oil spills which may occur within Dahej Port Limits.
This plan has been prepared as per the stipulation of Ministry of Environment and Forest Clearance (MoEF) and Coast Guard Requirements.
While responsibility for oil spill contingency remains with conservator of the port – Gujarat Maritime Board Port Officer, this plan (Tier 1) demonstrates the readiness of Adani Dahej Port for mitigating oil spill incidents.
It is a strategic plan to quickly call on additional resources in a systematic manner.
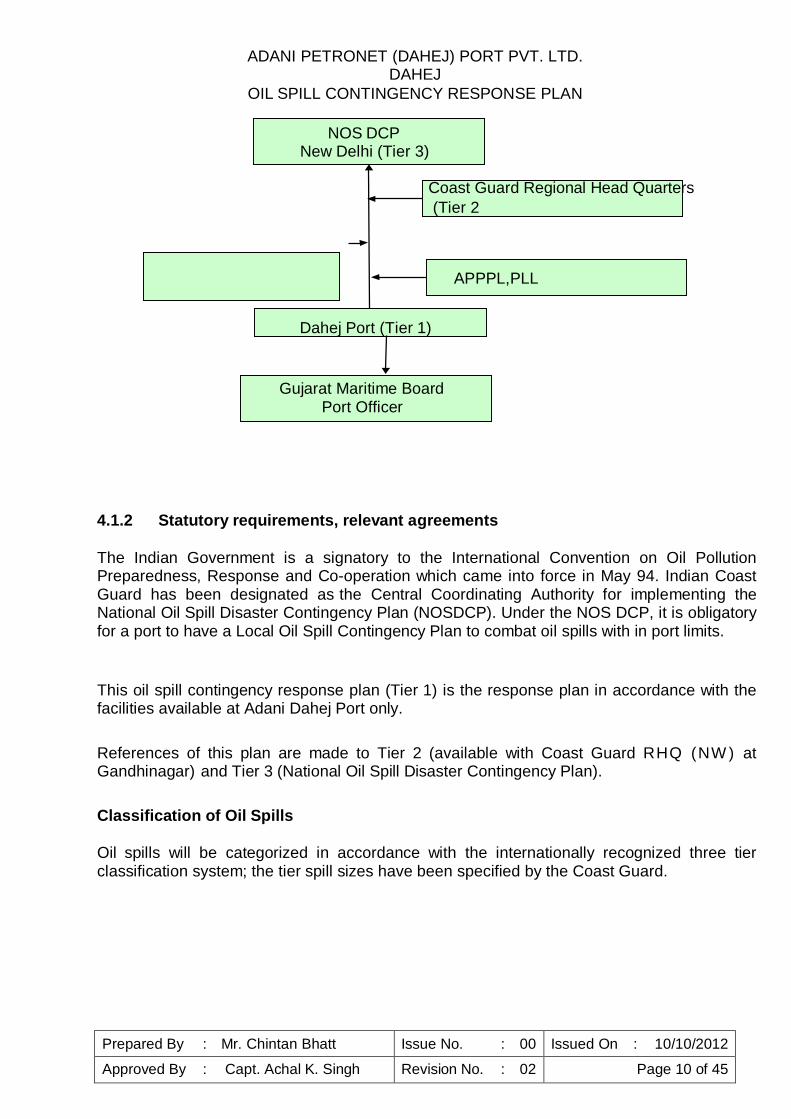
ROLE OF INDIAN COAST GUARD:
The Indian Coast Guard is the central coordinating agency in preservation, protection and pollution response in marine zones of India.
The National oil spill Disaster Contingency Plan has been prepared by ICG. NOS DCP operates from National HQ New Delhi, Regional HQ Mumbai and CG RHQ, NW Region, Gandhinagar. This plan is intended to dovetail into Regional Head Quarters plan for response level of Tier 2 and above.
ADANI PETRONET (DAHEJ) PORT PVT. LTD. DAHEJ
OIL SPILL CONTINGENCY RESPONSE PLAN
Prepared By : Mr. Chintan Bhatt Issue No. : 00 Issued On : 10/10/2012 Approved By : Capt. Achal K. Singh Revision No. : 02 Page 10 of 45
NOS DCP New Delhi (Tier 3)
Coast Guard Regional Head Quarters (Tier 2
APPPL,PLL
Dahej Port (Tier 1)
Gujarat Maritime Board Port Officer
4.1.2 Statutory requirements, relevant agreements
The Indian Government is a signatory to the International Convention on Oil Pollution Preparedness, Response and Co-operation which came into force in May 94. Indian Coast Guard has been designated as the Central Coordinating Authority for implementing the National Oil Spill Disaster Contingency Plan (NOSDCP). Under the NOS DCP, it is obligatory for a port to have a Local Oil Spill Contingency Plan to combat oil spills with in port limits.
This oil spill contingency response plan (Tier 1) is the response plan in accordance with the facilities available at Adani Dahej Port only.
References of this plan are made to Tier 2 (available with Coast Guard RHQ (NW ) at Gandhinagar) and Tier 3 (National Oil Spill Disaster Contingency Plan).
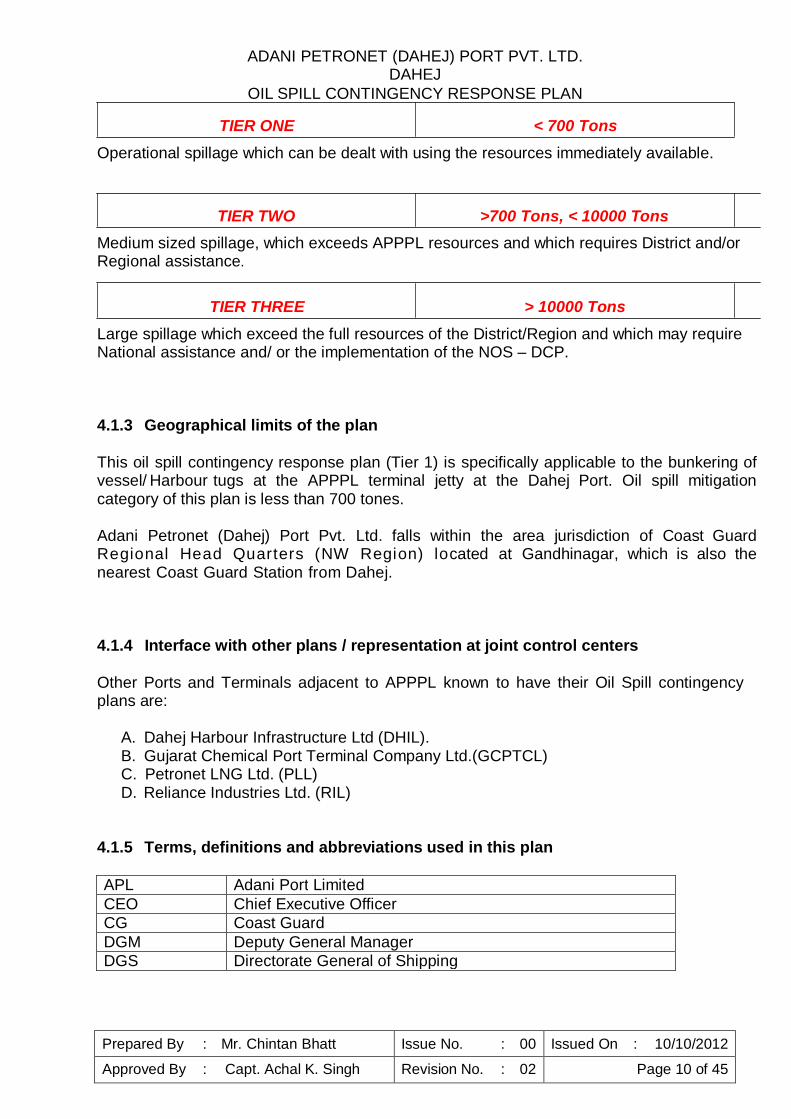
Classification of Oil Spills
Oil spills will be categorized in accordance with the internationally recognized three tier classification system; the tier spill sizes have been specified by the Coast Guard.
ADANI PETRONET (DAHEJ) PORT PVT. LTD. DAHEJ
OIL SPILL CONTINGENCY RESPONSE PLAN
Prepared By : Mr. Chintan Bhatt Issue No. : 00 Issued On : 10/10/2012 Approved By : Capt. Achal K. Singh Revision No. : 02 Page 10 of 45
TIER ONE < 700 Tons
Operational spillage which can be dealt with using the resources immediately available.
TIER TWO >700 Tons, < 10000 Tons
Medium sized spillage, which exceeds APPPL resources and which requires District and/or Regional assistance.
TIER THREE > 10000 Tons
Large spillage which exceed the full resources of the District/Region and which may require National assistance and/ or the implementation of the NOS – DCP.
4.1.3 Geographical limits of the plan
This oil spill contingency response plan (Tier 1) is specifically applicable to the bunkering of vessel/ Harbour tugs at the APPPL terminal jetty at the Dahej Port. Oil spill mitigation category of this plan is less than 700 tones.
Adani Petronet (Dahej) Port Pvt. Ltd. falls within the area jurisdiction of Coast Guard Regional Head Quarters (NW Region) located at Gandhinagar, which is also the nearest Coast Guard Station from Dahej.
4.1.4 Interface with other plans / representation at joint control centers
Other Ports and Terminals adjacent to APPPL known to have their Oil Spill contingency plans are:
A. Dahej Harbour Infrastructure Ltd (DHIL). B. Gujarat Chemical Port Terminal Company Ltd.(GCPTCL) C. Petronet LNG Ltd. (PLL) D. Reliance Industries Ltd. (RIL)
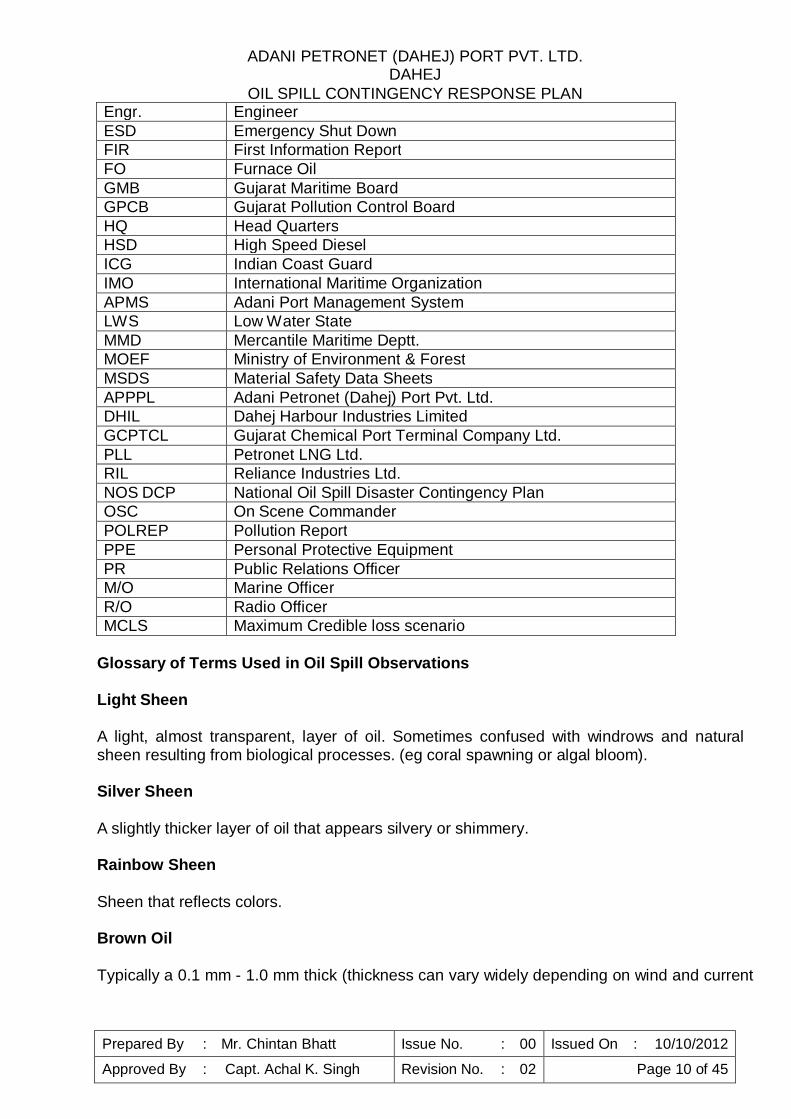
4.1.5 Terms, definitions and abbreviations used in this plan
APL Adani Port Limited CEO Chief Executive Officer CG Coast Guard DGM Deputy General Manager DGS Directorate General of Shipping
ADANI PETRONET (DAHEJ) PORT PVT. LTD. DAHEJ
OIL SPILL CONTINGENCY RESPONSE PLAN
Prepared By : Mr. Chintan Bhatt Issue No. : 00 Issued On : 10/10/2012 Approved By : Capt. Achal K. Singh Revision No. : 02 Page 10 of 45
Engr. Engineer ESD Emergency Shut Down FIR First Information Report FO Furnace Oil GMB Gujarat Maritime Board GPCB Gujarat Pollution Control Board HQ Head Quarters HSD High Speed Diesel ICG Indian Coast Guard IMO International Maritime Organization APMS Adani Port Management System LWS Low Water State MMD Mercantile Maritime Deptt. MOEF Ministry of Environment & Forest MSDS Material Safety Data Sheets APPPL Adani Petronet (Dahej) Port Pvt. Ltd. DHIL Dahej Harbour Industries Limited GCPTCL Gujarat Chemical Port Terminal Company Ltd. PLL Petronet LNG Ltd. RIL Reliance Industries Ltd. NOS DCP National Oil Spill Disaster Contingency Plan OSC On Scene Commander POLREP Pollution Report PPE Personal Protective Equipment PR Public Relations Officer M/O Marine Officer R/O Radio Officer MCLS Maximum Credible loss scenario
Glossary of Terms Used in Oil Spill Observations
Light Sheen
A light, almost transparent, layer of oil. Sometimes confused with windrows and natural sheen resulting from biological processes. (eg coral spawning or algal bloom).
Silver Sheen
A slightly thicker layer of oil that appears silvery or shimmery.
Rainbow Sheen
Sheen that reflects colors.
Brown Oil
Typically a 0.1 mm - 1.0 mm thick (thickness can vary widely depending on wind and current

ADANI PETRONET (DAHEJ) PORT PVT. LTD. DAHEJ
OIL SPILL CONTINGENCY RESPONSE PLAN
Prepared By : Mr. Chintan Bhatt Issue No. : 00 Issued On : 10/10/2012 Approved By : Capt. Achal K. Singh Revision No. : 02 Page 10 of 45
conditions) layer of water-in-oil emulsion. May be referred as heavy or dull coloured sheens.
Mousse
Water-in-oil emulsion often formed as oil weathers: colors can range from orange or tan to dark brown.
Black Oil
Area of black coloured oil sometimes appearing with a latex texture. Often confused with kelp beds and other natural phenomenon.
Windrows
Oil or sheen oriented in lines or streaks. Brown oil and mousse can be easily confused with algae scum collecting in convergence lines, algae patches, or mats or kelp or fucus. Sometimes called streaks, stringers or fingers.
Tarballs
Weathered oil that has formed a pliable ball. Size may vary from pinhead to about 30 cm. Sheen may or may not be present.
Tar Mats
Non-floating mats of oily debris (usually sediment and/or plant matter) that are found on beaches or just offshore.
4.1.6 Revision, Updation and Amendment Procedure
The Oil Spill Contingency Plan is reviewed periodically by HOD (Marine) in consultation with other personnel responsible for the execution to ensure compliance.
Each revision is introduced formally by the System Co-ordinator by issue of revised Section(s) for each of the copy as per the Distribution List (Section 4.1.7).
When revisions take place, the revisions are indicated by the issue number in each of the revised sections, and recorded in the Amendment Record Sheet (Section 2). If there are more than 20 amendments in the plan, the complete plan is revised to next revision number.
The insertion of the additional / amended sections and the removal of the old sections in the individual controlled copies as per the distribution list of the register is the responsibility of the person holding the individual copy. All old sections so removed are marked “OBSOLETE” and returned to the System Coordinator who ensures that the same are destroyed.
ADANI PETRONET (DAHEJ) PORT PVT. LTD. DAHEJ
OIL SPILL CONTINGENCY RESPONSE PLAN
Prepared By : Mr. Chintan Bhatt Issue No. : 00 Issued On : 10/10/2012 Approved By : Capt. Achal K. Singh Revision No. : 02 Page 10 of 45
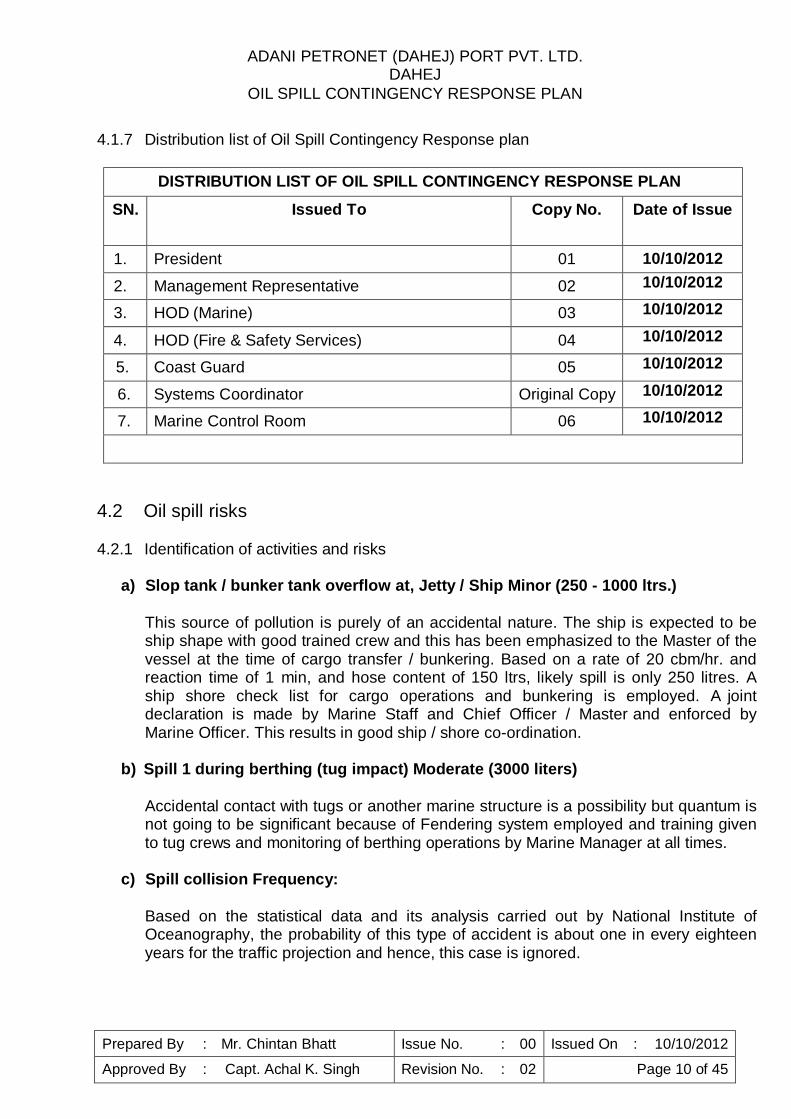
4.1.7 Distribution list of Oil Spill Contingency Response plan
DISTRIBUTION LIST OF OIL SPILL CONTINGENCY RESPONSE PLAN
SN. Issued To Copy No. Date of Issue
1. President 01 10/10/2012
2. Management Representative 02 10/10/2012
3. HOD (Marine) 03 10/10/2012
4. HOD (Fire & Safety Services) 04 10/10/2012
5. Coast Guard 05 10/10/2012
6. Systems Coordinator Original Copy 10/10/2012
7. Marine Control Room 06 10/10/2012
4.2 Oil spill risks
4.2.1 Identification of activities and risks
a) Slop tank / bunker tank overflow at, Jetty / Ship Minor (250 - 1000 ltrs.)
This source of pollution is purely of an accidental nature. The ship is expected to be ship shape with good trained crew and this has been emphasized to the Master of the vessel at the time of cargo transfer / bunkering. Based on a rate of 20 cbm/hr. and reaction time of 1 min, and hose content of 150 ltrs, likely spill is only 250 litres. A ship shore check list for cargo operations and bunkering is employed. A joint declaration is made by Marine Staff and Chief Officer / Master and enforced by Marine Officer. This results in good ship / shore co-ordination.
b) Spill 1 during berthing (tug impact) Moderate (3000 liters)
Accidental contact with tugs or another marine structure is a possibility but quantum is not going to be significant because of Fendering system employed and training given to tug crews and monitoring of berthing operations by Marine Manager at all times.
c) Spill collision Frequency:
Based on the statistical data and its analysis carried out by National Institute of Oceanography, the probability of this type of accident is about one in every eighteen years for the traffic projection and hence, this case is ignored.
ADANI PETRONET (DAHEJ) PORT PVT. LTD. DAHEJ
OIL SPILL CONTINGENCY RESPONSE PLAN
Prepared By : Mr. Chintan Bhatt Issue No. : 00 Issued On : 10/10/2012 Approved By : Capt. Achal K. Singh Revision No. : 02 Page 10 of 45
d) Ship Grounding Frequency: Based on the statistical data and its analysis carried out by National Institute of Oceanography, the probability of this type of accident is about one in every eighteen years for the traffic projection.
4.2.3 Probable fate of spilled oil
The spilled ‘persistent’ fuel oil undergoes a number of physical and chemical changes know as “weathering”. The major weathering processes are spreading, evaporation, dispersion, emulsification, dissolution, oxidation sedimentation and biodegradation.
The term persistent is used to describe those oils which, because of their chemical composition, are usually slow to dissipate naturally when spilled into the marine environment and are therefore likely to spread and require cleaning up. Non- persistent oils tend to evaporate quickly when spilled and do not require cleaning up. Neither persistence nor non-persistence is defined in the Conventions. However, under guidelines developed by the 1971 Fund, an oil is considered non-persistent if at the time of shipment at least 50% of the hydrocarbon fractions, by volume, distill at a temperature of 340ºC (645ºF), and at least 95% of the hydrocarbon fractions, by volume, distill at a temperature of 370ºC (700ºF) when tested in accordance with the American Society for Testing and Materials Method D86/78 or any subsequent revision thereof.”
a) Spreading : is one of the most significant processes during early stages of a spill is initially due to gravity. The oil spreads as a coherent slick and the rate is influenced by its activity. After a few hours, the slick begins to break-up and after this stage, spreading is primarily due to turbulence. Wind and wave actions also tend to fragment the slick, breaking it up into islands and windrows.
b) Evaporation : The rate and extent of evaporation depends primarily on the volatility of
the oil. In general, oil components with a boiling point below 200 D C evaporate within 4 to 16 hours in tropical conditions. Spills of refined products such as kerosene and gasoline evaporate completely and light crude lose up to 40 % of its volume within a few hours. In contrast, heavy crude and fuel oils undergo little evaporation.
c) Dispersion : Waves and turbulence act on the slick to produce droplets of oil of
different sizes. Small droplets remain in suspension while the larges ones rise to the surface. The rate of dispersion mainly depends on the nature of the oil and the sea state. Oils which remain fluid can spread unhindered by other weathering processes can disperse completely in moderate sea conditions within a few days. Viscous oils tend to form thick lenses on the water surface with slow tendency to disperse, which can persist for several weeks.
d) Emulsification : Several oils have tendency to absorb water to form water-in-oil
emulsions thereby increasing the volumes of the emulsified mass by a factor of 3 to 4. The arte at which the oil is emulsified is largely a function of sea state though viscous oils absorb water slowly. In turbulent sea conditions, low viscosity oils can incorporate as high as 80 % water by volume within 2 to 3 hours.
ADANI PETRONET (DAHEJ) PORT PVT. LTD. DAHEJ
OIL SPILL CONTINGENCY RESPONSE PLAN
Prepared By : Mr. Chintan Bhatt Issue No. : 00 Issued On : 10/10/2012 Approved By : Capt. Achal K. Singh Revision No. : 02 Page 10 of 45
Prepared By : Mr. Chintan Bhatt Issue No. : 00 Issued On : 01/07/2010 Approved By : Capt. Achal K. Singh Revision No. : 02 Page 15 of 45
ADANI PETRONET (DAHEJ) PORT PVT. LTD. DAHEJ
OIL SPILL CONTINGENCY RESPONSE PLAN
Prepared By : Mr. Chintan Bhatt Issue No. : 00 Issued On : 10/10/2012 Approved By : Capt. Achal K. Singh Revision No. : 02 Page 10 of 45
e) Dissolution : The heavy components of crude oil are virtually insoluble in sea water
while lighter compounds are slightly soluble. Hence levels of dissolved PHc rarely exceed 1 mg/l following a spill. Therefore, dissolution, does not make a significant contribution to the removal of oil from the sea surface.
f) Sedimentation : Very few oils are sufficiently heavy to sink in sea water. However,
the weathered residue gets mixed up with the suspended substances in water and may sink. This process becomes significant when water-in-oil emulsions attain specific gravity near to one and therefore need very little suspended substances to exceed the specific gravity of sea water (1.025).
g) Biodegradation : Several micro-organisms present in sea water can utilize oil as a
source of carbon and energy. The main factor affecting bio-degradation in tropical waters are availability of nutrients and oxygen.
4.3 Spill response strategy
4.3.1 Philosophy and objectives
This plan is intended to assist APPPL in dealing with an accidental release or discharge of oil. Its primary purpose is to set in motion the necessary actions to stop or minimize the discharge and to mitigate its effects. Effective planning ensures that the necessary actions are taken in a structured, logical and timely manner.
This plan guides the Head Marine and his Duty Staff through the decisions which will be required in an incident response. The tables, figures and checklists provide a visible form of information, thus reducing the chance of oversight or error during the early stages of dealing with an emergency situation.
For this plan to be effective, it must be:
• familiar to those APPPL staff with key response functions; • regularly exercised; and, • reviewed and updated on a regular basis.
This plan uses a tiered response to oil and chemical pollution incidents. The plan is designed to deal with Tier One spillage (as defined by the Coast Guard) and to provide guidance for the initial response to Tier Two and Tier Three incidents.
During oil spill response activities, account must be taken of the following:
• Site hazard information • adherence to permit procedures • spill site pre-entry briefing • boat safety
ADANI PETRONET (DAHEJ) PORT PVT. LTD. DAHEJ
OIL SPILL CONTINGENCY RESPONSE PLAN
Prepared By : Mr. Chintan Bhatt Issue No. : 00 Issued On : 10/10/2012 Approved By : Capt. Achal K. Singh Revision No. : 02 Page 10 of 45
• APPPL safety manual and material safety data sheets • Personal protective equipment needs • H eat stress • D econtamination
4.3.2 Strategy and responsibilities
Response guidelines depend on type of oil pollution and sensitivity of the area. Based on product handled at this Port except accidental spill of F.O. characteristic of the spill is one of non – persistent oils. Impact of this kind of pollution is relatively limited because of it being dispersed due to evaporation, agitation of water due to propellers, effect of tide and currents.
Approved dispersants are maintained with booms for application from Tug Dolphin No. 3 and 4, after obtaining Coast Guard permission it can be used. efforts will be made to contain its spread by moping it up as soon as possible with the help of absorbent pillows and straw / waste cotton or equivalent.
In the unlikely event of spill following responsibilities have been assigned:
a) Radio Officer is in-charge of all communication emanating from incident site & log keeping. i) He shall man VHF station and keep close contact with President office and Port
Operation Centre. ii) He will act as on scene commander till Marine Manager takes charge.
b) Duty Port Captain (Marine Manager / On Scene Commander) : i) Will be located at Marine Control Room ii) To co-ordinate communication with all interested parties iii) POLREP form to be filled and information forwarded to coast Guard iv) Mobilise resources / logistic support v) Communicate with HOD (Marine) and Marine Control Petronet LNG. vi) Take charge of oil pollution equipment available with APPPL and Petronet LNG and deploy them as per directives of on scene commander. vii) Collecting information (oil type, sea / wind forecasts, aerial surveillance,
beach reports) viii) Estimating fate of slick (24, 48, 72 hours) ix) Identifying resources immediately at risk, informing parties x) Utilize checklist as in Annex 6 xi) Attend debrief
C) Head - Marine i) Will be located at Marine Control Room ii) Confirm / amend initial classification iii) Manage the APPPL response to the oil spill iv) Approve all expenditure commitments v) Liase with Head Marine of Petronet LNG for quick deployment of their resources.

ADANI PETRONET (DAHEJ) PORT PVT. LTD. DAHEJ
OIL SPILL CONTINGENCY RESPONSE PLAN
Prepared By : Mr. Chintan Bhatt Issue No. : 00 Issued On : 10/10/2012 Approved By : Capt. Achal K. Singh Revision No. : 02 Page 10 of 45
vi) Liase with Indian Coast Guard (if Required)vii) Brief all higher authorities.
viii) Utilize checklist as in Annex 8ix) Conduct a debrief session after every incident
f) Operation / Business Head APPPLi) Shall confirm receipt of FIR and sufficient information from HOD (Marine) to be able
to issue press statement.ii) He shall liaise with civiladministration. iii) Convene oil spill management team. iv) Make predictions of oi l slick movements, authorize additional resources if required
and keep higher authorities posted of developments. v) Make amendments to press statement.vi) Terminate clean up operations and collate log / incident report findings.vii) Hold extensive cause analysis and debriefing session, take preventive action
and authorize amendment to Oil Contingency Plan as appropriate.
Sample collection: The oil spill on scene commander is responsible forobtaining samples of oil in prescribed 1 Ltrs. bottles and from alleged polluter.Collection is to be authenticated by third party witness. Samples are sent foranalysis to Port Officer.
4.3.4 Strategy for oil and waste storage and disposal
After the natural degradation by coagulation and evaporation of oil on water, residual oil and waste material collected during a Tier 1 response will be disposed off by in-situ or terrestrial burning.
4.4 Equipment supplies and services
4.4.1 On water oil spill equipment
The distribution of the above is detailed in Annexure 3
4.4.2 Inspection, maintenance and testing
Routine inspection, maintenance and testing are to be performed as per the stipulated requirements.
4.4.3 Shoreline equipment, supplies and services
The equipment, supplies and services during a tier 2 or 3 response scenario will be indented from the coast guard while APPPL will utilize all available equipment, supplies and services to maintain the spill below tier 1.
ADANI PETRONET (DAHEJ) PORT PVT. LTD. DAHEJ
OIL SPILL CONTINGENCY RESPONSE PLAN
Prepared By : Mr. Chintan Bhatt Issue No. : 00 Issued On : 10/10/2012 Approved By : Capt. Achal K. Singh Revision No. : 02 Page 10 of 45
FLOTILLA Jetty Supervisor
4.5 Management, manpower and training
4.5.1 Crisis manager and financial authorities
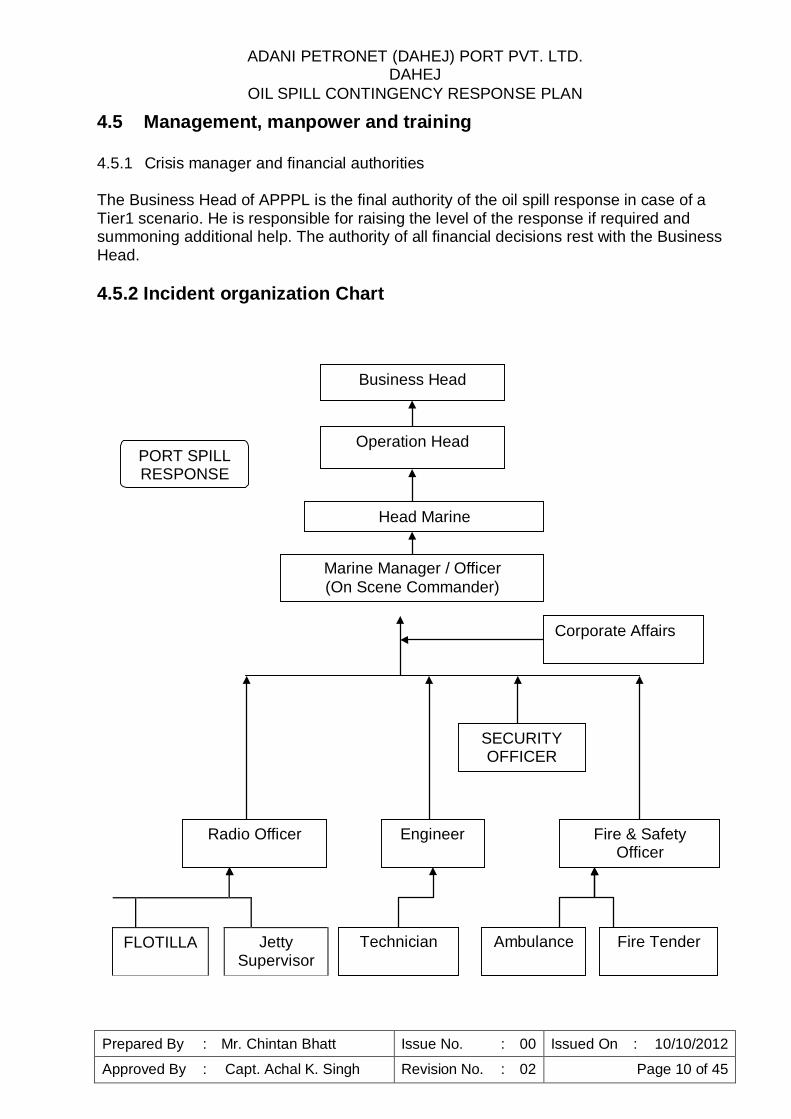
The Business Head of APPPL is the final authority of the oil spill response in case of a Tier1 scenario. He is responsible for raising the level of the response if required and summoning additional help. The authority of all financial decisions rest with the Business Head.
4.5.2 Incident organization Chart
Business Head
PORT SPILL RESPONSE
Operation Head
Head Marine
Marine Manager / Officer (On Scene Commander)
Corporate Affairs
SECURITY OFFICER
Radio Officer Engineer Fire & Safety Officer
Technician Ambulance Fire Tender
ADANI PETRONET (DAHEJ) PORT PVT. LTD. DAHEJ
OIL SPILL CONTINGENCY RESPONSE PLAN
Prepared By : Mr. Chintan Bhatt Issue No. : 00 Issued On : 10/10/2012 Approved By : Capt. Achal K. Singh Revision No. : 02 Page 10 of 45
4.5.3 Manpower availability (on-site, on call)
In an event of incident the I n d i a n Coast Guard, RHQ (NW), Gandhinagar, Gujarat Maritime Board, Gulf of Khambhat Ports, District and Regional plans are deemed to have been implemented. APPPL and Petronet LNG manpower and resources will be put at the disposal and will be deployed as required, provided APPPL is the polluter and the spill within the Port Limits.
In the event of APPPL not being the polluter and any event outside the port limit of Dahej Port, APPPL equipment will be subject to mutual assistance plan and it will be the responsibility of the above forum.
4.5.4 Availability of additional labour
Similarly in the event of APPPL being the polluter, additional manpower and supplies can be requested from the resources which are part of this forum.
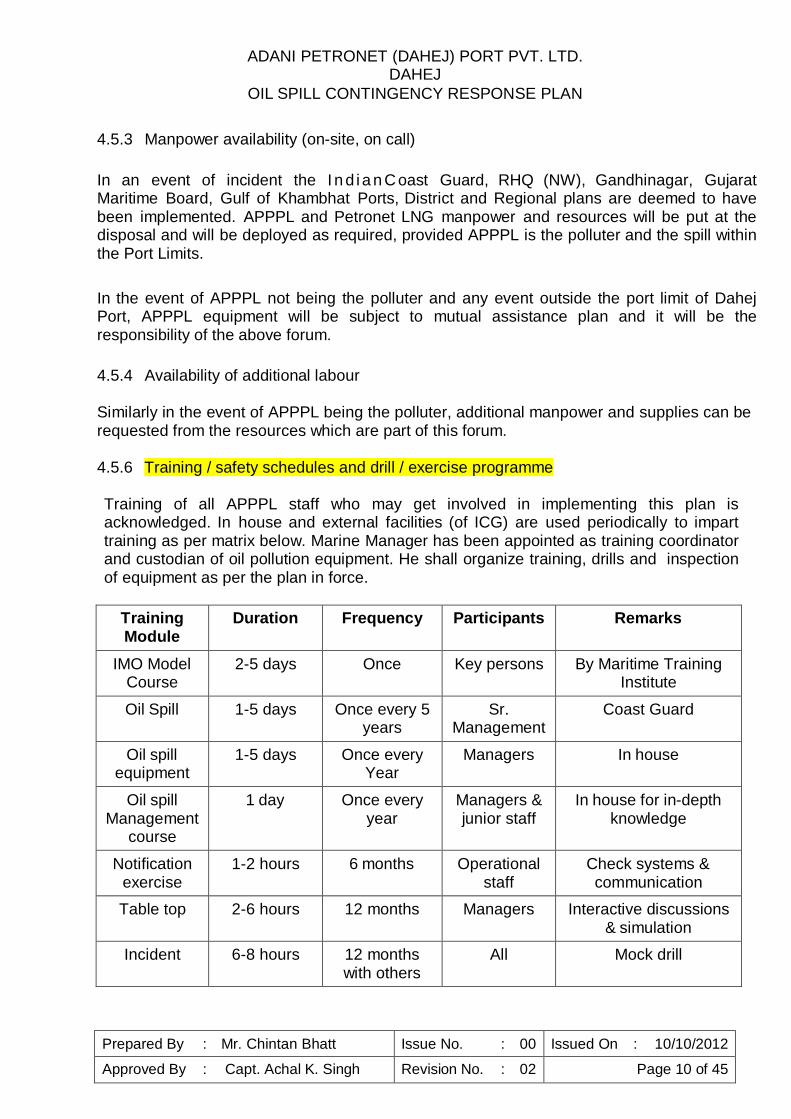
4.5.6 Training / safety schedules and drill / exercise programme
Training of all APPPL staff who may get involved in implementing this plan is acknowledged. In house and external facilities (of ICG) are used periodically to impart training as per matrix below. Marine Manager has been appointed as training coordinator and custodian of oil pollution equipment. He shall organize training, drills and inspection of equipment as per the plan in force.
Training Module
Duration Frequency Participants Remarks
IMO Model Course
2-5 days Once Key persons By Maritime Training Institute
Oil Spill 1-5 days Once every 5 years
Sr. Management
Coast Guard
Oil spill equipment
1-5 days Once every Year
Managers In house
Oil spill Management
course
1 day Once every year
Managers & junior staff
In house for in-depth knowledge
Notification exercise
1-2 hours 6 months Operational staff
Check systems & communication
Table top 2-6 hours 12 months Managers Interactive discussions & simulation
Incident 6-8 hours 12 months with others
All Mock drill
ADANI PETRONET (DAHEJ) PORT PVT. LTD. DAHEJ
OIL SPILL CONTINGENCY RESPONSE PLAN
Prepared By : Mr. Chintan Bhatt Issue No. : 00 Issued On : 10/10/2012 Approved By : Capt. Achal K. Singh Revision No. : 02 Page 10 of 45
4.6 Communications and control
4.6.1 Incident control room facilities
Detailed in Annexure 3
4.6.2 Field communication equipment
Detailed in Annexure 3
4.6.3 Reports, manuals, maps, charts and incident logs
Section 5: Action and operations
5.1 Initial procedures
5.1.1 Reporting incident, preliminary estimate of response tier
The first few minutes after the incident / accident are invariably the most critical period in prevention of escalation. Therefore the person available at or near the incident site (and often responsible for carrying out that particular activity) on round the clock basis play a vital role in an emergency.
The emergency (due to spill) should be initiated by the first person noticing it by activating the fire alarm from the nearest call-point or by contacting the fire control room immediately on the internal telephone or through mobile phone or through VHF Channel.
The On Scene Commander will report the spill to the control room along with his estimate of the response tier.
5.1.2 Notifying key team members and authorities
Statutory First Information Report (FIR - given in annexure 1) is to be communicated by fastest means possible to President, GMB port and CG, RHQ (NW) at Gandhinagar, followed by full Pollution Report (POLREP – given in annexure 2). The report is to be updated, should the oil spill not be contained and likely to increase to Tier 2
5.1.3 Establishing and staffing control room
Auxiliary control center is located at Marine control. Escalation of emergency if any, is monitored here and Coast Guard resources summoned as appropriate. Statutory reporting procedures of FIR and POLREP of developing situation and action taken are also sent from
ADANI PETRONET (DAHEJ) PORT PVT. LTD. DAHEJ
OIL SPILL CONTINGENCY RESPONSE PLAN
Prepared By : Mr. Chintan Bhatt Issue No. : 00 Issued On : 10/10/2012 Approved By : Capt. Achal K. Singh Revision No. : 02 Page 10 of 45
this center. Press and civil administration is also briefed from this center as directed by Head Marine. The detail of the contacts to whom the information is to be given is placed at Annexure 4.
5.1.4 Collecting information (oil type, sea / wind forecasts, aerial surveillance, beach reports)
Duty Port Captain (Marine Manager) has the responsibility of arranging the collection of the relevant information which will help in mitigating the emergency
5.1.5 Estimating fate of slick (24, 48, 72 hours)
Considering the prevalent tidal stream, wind and weather conditions, section 4.2.3 is to be used in estimating the fate of the slick
5.1.6 Identifying resources immediately at risk, informing parties
Depending on the quantity of fluid spilled and the prevalent wind & weather conditions, the resources / facilities immediately at risk have to be identified by the On scene commander and the concerned parties informed.
5.2 Operations planning and mobilization procedures
5.2.1 Assembling full response team
On being appraised of the spill, the duty Radio officer will inform the marine manager, who will, in turn initiate the assembly of the complete response team which essentially involves relaying information to all relevant personnel, parties and authorities and informing them of the initial response requirements.
5.2.2 Identifying immediate response priorities
Depending on the initial estimated response tier and the prevalent weather conditions, the marine manager, in consultation with Radio officer will identify the immediate resources at risk and the response priorities.
5.2.3 Mobilizing immediate response
After performing steps as in 5.2.1 and 5.2.2, the marine manager will initiate the mobilization procedure of the spill equipment, resources and personnel depending on the scale of emergency at hand.
5.2.4 Preparing initial press statement
ADANI PETRONET (DAHEJ) PORT PVT. LTD. DAHEJ
OIL SPILL CONTINGENCY RESPONSE PLAN
Prepared By : Mr. Chintan Bhatt Issue No. : 00 Issued On : 10/10/2012 Approved By : Capt. Achal K. Singh Revision No. : 02 Page 10 of 45
The Head Marine will prepare an initial press statement in consultation with the Marine Manager / Officer and release it after consultation with the Business Head APPPL.
No other person is authorized to communicate with any external party by any means whatsoever unless expressly permitted by the Head Marine or Business Head APPPL
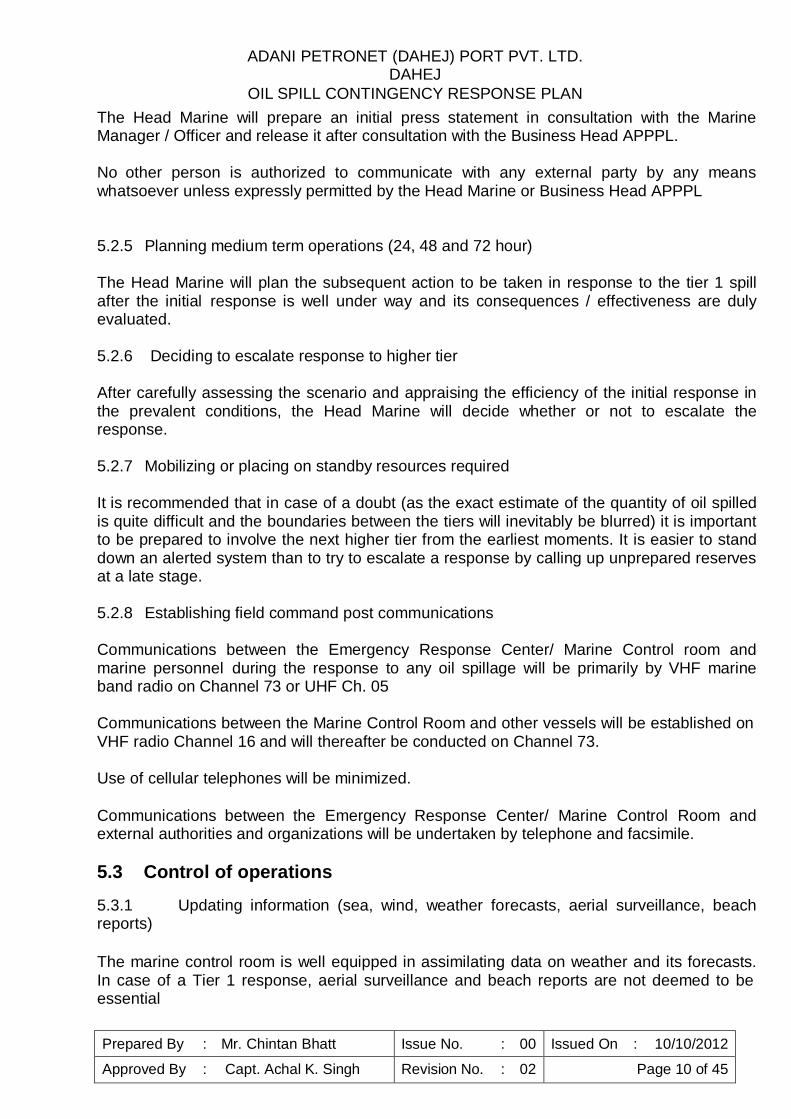
5.2.5 Planning medium term operations (24, 48 and 72 hour)
The Head Marine will plan the subsequent action to be taken in response to the tier 1 spill after the initial response is well under way and its consequences / effectiveness are duly evaluated.
5.2.6 Deciding to escalate response to higher tier
After carefully assessing the scenario and appraising the efficiency of the initial response in the prevalent conditions, the Head Marine will decide whether or not to escalate the response.
5.2.7 Mobilizing or placing on standby resources required
It is recommended that in case of a doubt (as the exact estimate of the quantity of oil spilled is quite difficult and the boundaries between the tiers will inevitably be blurred) it is important to be prepared to involve the next higher tier from the earliest moments. It is easier to stand down an alerted system than to try to escalate a response by calling up unprepared reserves at a late stage.
5.2.8 Establishing field command post communications
Communications between the Emergency Response Center/ Marine Control room and marine personnel during the response to any oil spillage will be primarily by VHF marine band radio on Channel 73 or UHF Ch. 05
Communications between the Marine Control Room and other vessels will be established on VHF radio Channel 16 and will thereafter be conducted on Channel 73.
Use of cellular telephones will be minimized.
Communications between the Emergency Response Center/ Marine Control Room and external authorities and organizations will be undertaken by telephone and facsimile.
5.3 Control of operations
5.3.1 Updating information (sea, wind, weather forecasts, aerial surveillance, beach reports) The marine control room is well equipped in assimilating data on weather and its forecasts. In case of a Tier 1 response, aerial surveillance and beach reports are not deemed to be essential
ADANI PETRONET (DAHEJ) PORT PVT. LTD. DAHEJ
OIL SPILL CONTINGENCY RESPONSE PLAN
Prepared By : Mr. Chintan Bhatt Issue No. : 00 Issued On : 10/10/2012 Approved By : Capt. Achal K. Singh Revision No. : 02 Page 10 of 45
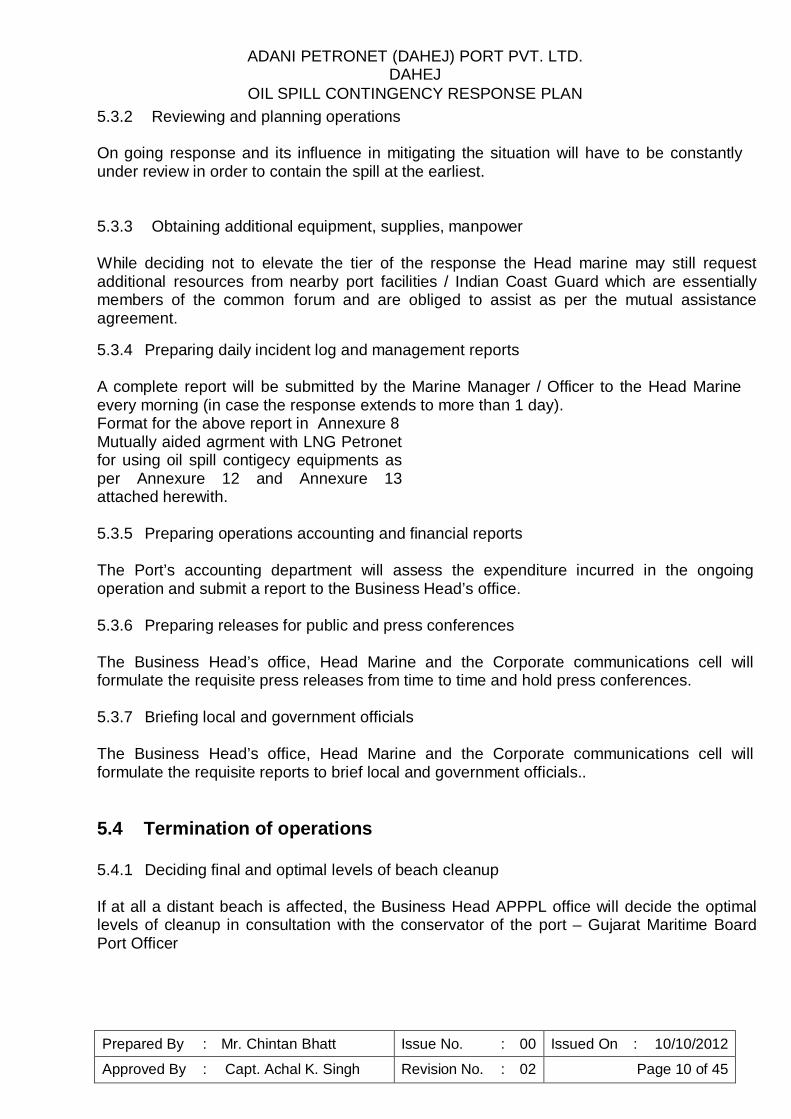
5.3.2 Reviewing and planning operations
On going response and its influence in mitigating the situation will have to be constantly under review in order to contain the spill at the earliest.
5.3.3 Obtaining additional equipment, supplies, manpower
While deciding not to elevate the tier of the response the Head marine may still request additional resources from nearby port facilities / Indian Coast Guard which are essentially members of the common forum and are obliged to assist as per the mutual assistance agreement.
5.3.4 Preparing daily incident log and management reports
A complete report will be submitted by the Marine Manager / Officer to the Head Marine every morning (in case the response extends to more than 1 day). Format for the above report in Annexure 8 Mutually aided agrment with LNG Petronet for using oil spill contigecy equipments as per Annexure 12 and Annexure 13 attached herewith.
5.3.5 Preparing operations accounting and financial reports
The Port’s accounting department will assess the expenditure incurred in the ongoing operation and submit a report to the Business Head’s office.
5.3.6 Preparing releases for public and press conferences
The Business Head’s office, Head Marine and the Corporate communications cell will formulate the requisite press releases from time to time and hold press conferences.
5.3.7 Briefing local and government officials
The Business Head’s office, Head Marine and the Corporate communications cell will formulate the requisite reports to brief local and government officials..
5.4 Termination of operations
5.4.1 Deciding final and optimal levels of beach cleanup
If at all a distant beach is affected, the Business Head APPPL office will decide the optimal levels of cleanup in consultation with the conservator of the port – Gujarat Maritime Board Port Officer
ADANI PETRONET (DAHEJ) PORT PVT. LTD. DAHEJ
OIL SPILL CONTINGENCY RESPONSE PLAN
Prepared By : Mr. Chintan Bhatt Issue No. : 00 Issued On : 10/10/2012 Approved By : Capt. Achal K. Singh Revision No. : 02 Page 10 of 45
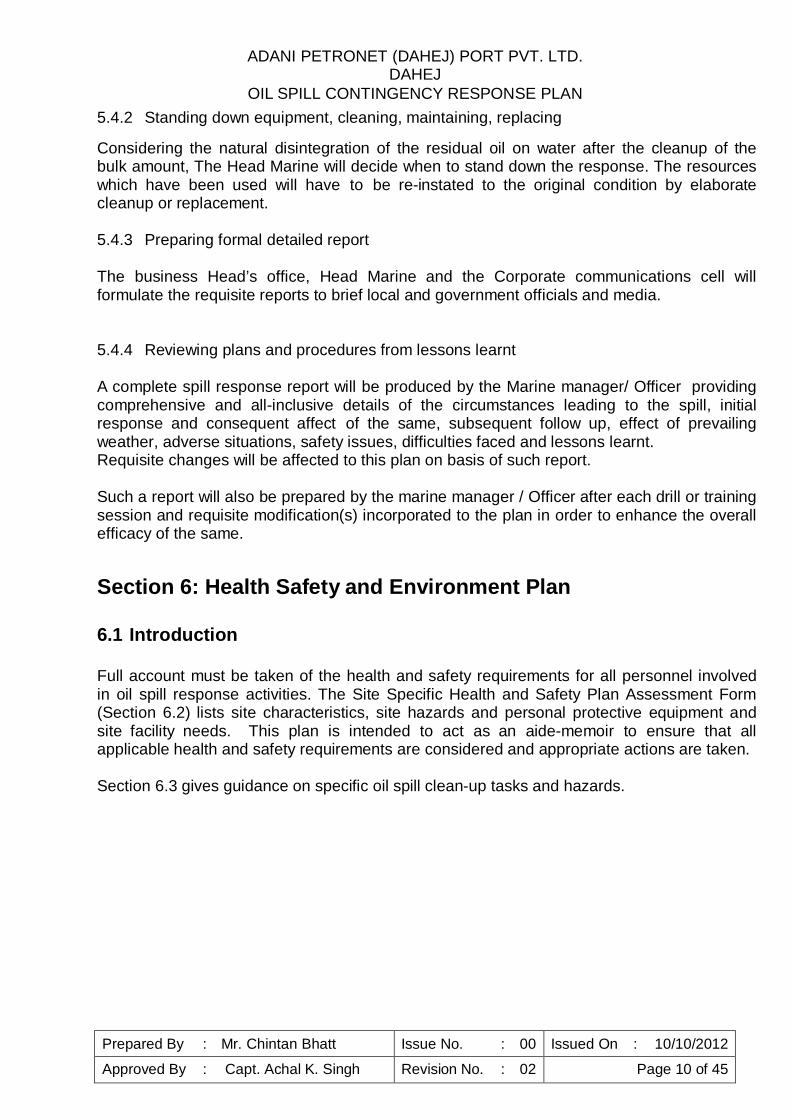
5.4.2 Standing down equipment, cleaning, maintaining, replacing
Considering the natural disintegration of the residual oil on water after the cleanup of the bulk amount, The Head Marine will decide when to stand down the response. The resources which have been used will have to be re-instated to the original condition by elaborate cleanup or replacement.
5.4.3 Preparing formal detailed report
The business Head’s office, Head Marine and the Corporate communications cell will formulate the requisite reports to brief local and government officials and media.
5.4.4 Reviewing plans and procedures from lessons learnt
A complete spill response report will be produced by the Marine manager/ Officer providing comprehensive and all-inclusive details of the circumstances leading to the spill, initial response and consequent affect of the same, subsequent follow up, effect of prevailing weather, adverse situations, safety issues, difficulties faced and lessons learnt. Requisite changes will be affected to this plan on basis of such report.
Such a report will also be prepared by the marine manager / Officer after each drill or training session and requisite modification(s) incorporated to the plan in order to enhance the overall efficacy of the same.
Section 6: Health Safety and Environment Plan
6.1 Introduction
Full account must be taken of the health and safety requirements for all personnel involved in oil spill response activities. The Site Specific Health and Safety Plan Assessment Form (Section 6.2) lists site characteristics, site hazards and personal protective equipment and site facility needs. This plan is intended to act as an aide-memoir to ensure that all applicable health and safety requirements are considered and appropriate actions are taken.
Section 6.3 gives guidance on specific oil spill clean-up tasks and hazards.
ADANI PETRONET (DAHEJ) PORT PVT. LTD. DAHEJ
OIL SPILL CONTINGENCY RESPONSE PLAN
Prepared By : Mr. Chintan Bhatt Issue No. : 00 Issued On : 10/10/2012 Approved By : Capt. Achal K. Singh Revision No. : 02 Page 10 of 45
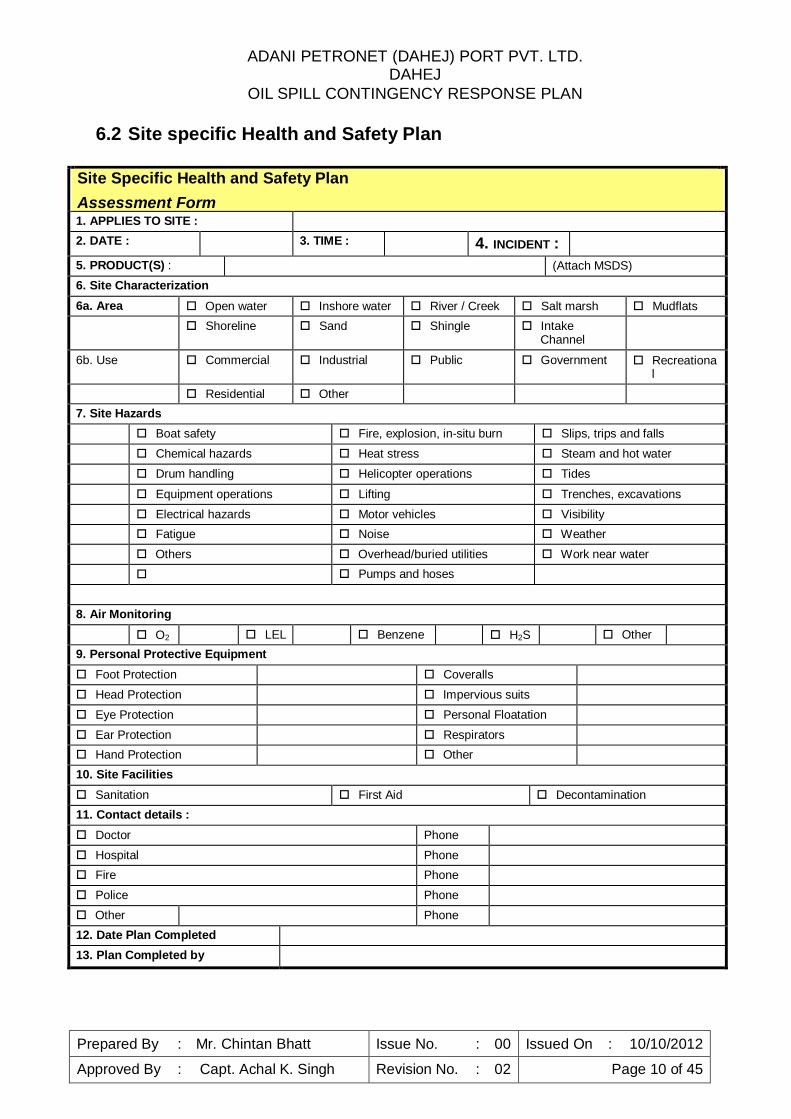
6.2 Site specific Health and Safety Plan Site Specific Health and Safety Plan Assessment Form
1. APPLIES TO SITE : 2. DATE : 3. TIME : 4. INCIDENT : 5. PRODUCT(S) : (Attach MSDS) 6. Site Characterization 6a. Area Open water Inshore water River / Creek Salt marsh Mudflats
Shoreline Sand Shingle Intake Channel
6b. Use Commercial Industrial Public Government Recreationa l
Residential Other 7. Site Hazards
Boat safety Fire, explosion, in-situ burn Slips, trips and falls Chemical hazards Heat stress Steam and hot water Drum handling Helicopter operations Tides Equipment operations Lifting Trenches, excavations Electrical hazards Motor vehicles Visibility Fatigue Noise Weather Others Overhead/buried utilities Work near water Pumps and hoses 8. Air Monitoring
O2 LEL Benzene H2S Other 9. Personal Protective Equipment Foot Protection Coveralls Head Protection Impervious suits Eye Protection Personal Floatation Ear Protection Respirators Hand Protection Other 10. Site Facilities Sanitation First Aid Decontamination 11. Contact details : Doctor Phone Hospital Phone Fire Phone Police Phone Other Phone 12. Date Plan Completed 13. Plan Completed by
ADANI PETRONET (DAHEJ) PORT PVT. LTD. DAHEJ
OIL SPILL CONTINGENCY RESPONSE PLAN
Prepared By : Mr. Chintan Bhatt Issue No. : 00 Issued On : 10/10/2012 Approved By : Capt. Achal K. Singh Revision No. : 02 Page 10 of 45
6.3 Site Hazards
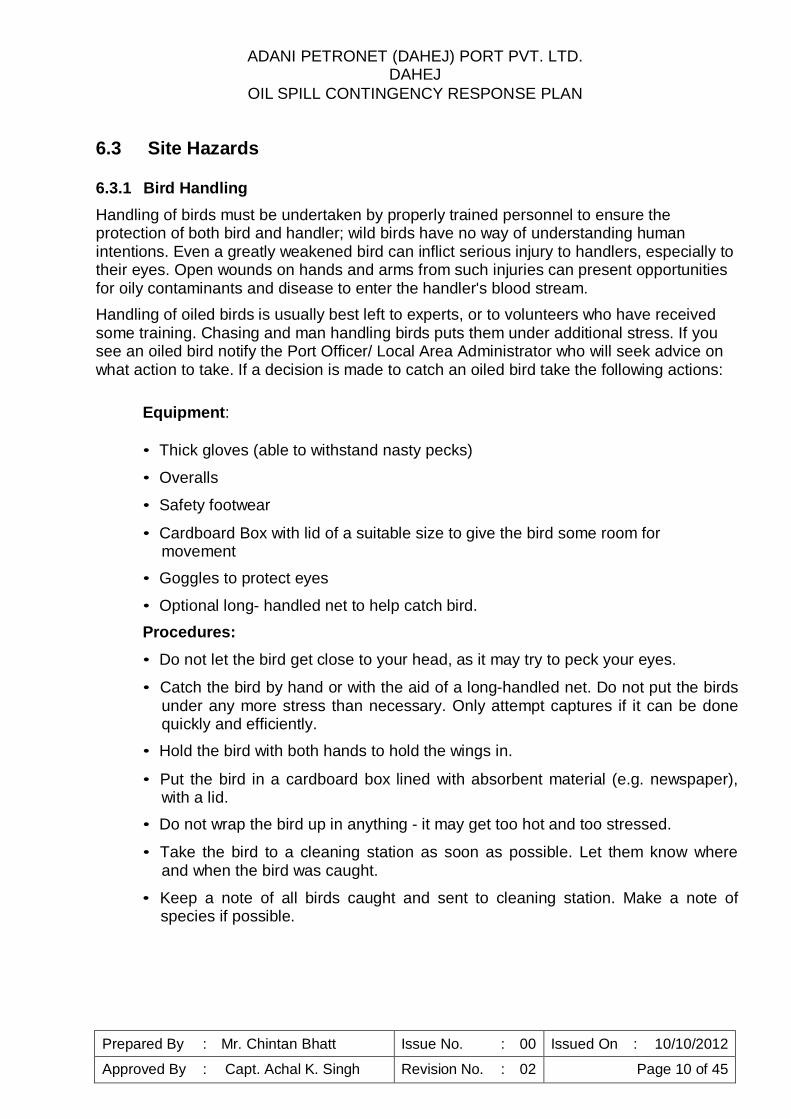
6.3.1 Bird Handling
Handling of birds must be undertaken by properly trained personnel to ensure the protection of both bird and handler; wild birds have no way of understanding human intentions. Even a greatly weakened bird can inflict serious injury to handlers, especially to their eyes. Open wounds on hands and arms from such injuries can present opportunities for oily contaminants and disease to enter the handler's blood stream.
Handling of oiled birds is usually best left to experts, or to volunteers who have received some training. Chasing and man handling birds puts them under additional stress. If you see an oiled bird notify the Port Officer/ Local Area Administrator who will seek advice on what action to take. If a decision is made to catch an oiled bird take the following actions:
Equipment:
• Thick gloves (able to withstand nasty pecks)
• Overalls
• Safety footwear
• Cardboard Box with lid of a suitable size to give the bird some room for movement
• Goggles to protect eyes
• Optional long- handled net to help catch bird.
Procedures:
• Do not let the bird get close to your head, as it may try to peck your eyes.
• Catch the bird by hand or with the aid of a long-handled net. Do not put the birds under any more stress than necessary. Only attempt captures if it can be done quickly and efficiently.
• Hold the bird with both hands to hold the wings in.
• Put the bird in a cardboard box lined with absorbent material (e.g. newspaper), with a lid.
• Do not wrap the bird up in anything - it may get too hot and too stressed.
• Take the bird to a cleaning station as soon as possible. Let them know where and when the bird was caught.
• Keep a note of all birds caught and sent to cleaning station. Make a note of species if possible.
ADANI PETRONET (DAHEJ) PORT PVT. LTD. DAHEJ
OIL SPILL CONTINGENCY RESPONSE PLAN
Prepared By : Mr. Chintan Bhatt Issue No. : 00 Issued On : 10/10/2012 Approved By : Capt. Achal K. Singh Revision No. : 02 Page 10 of 45
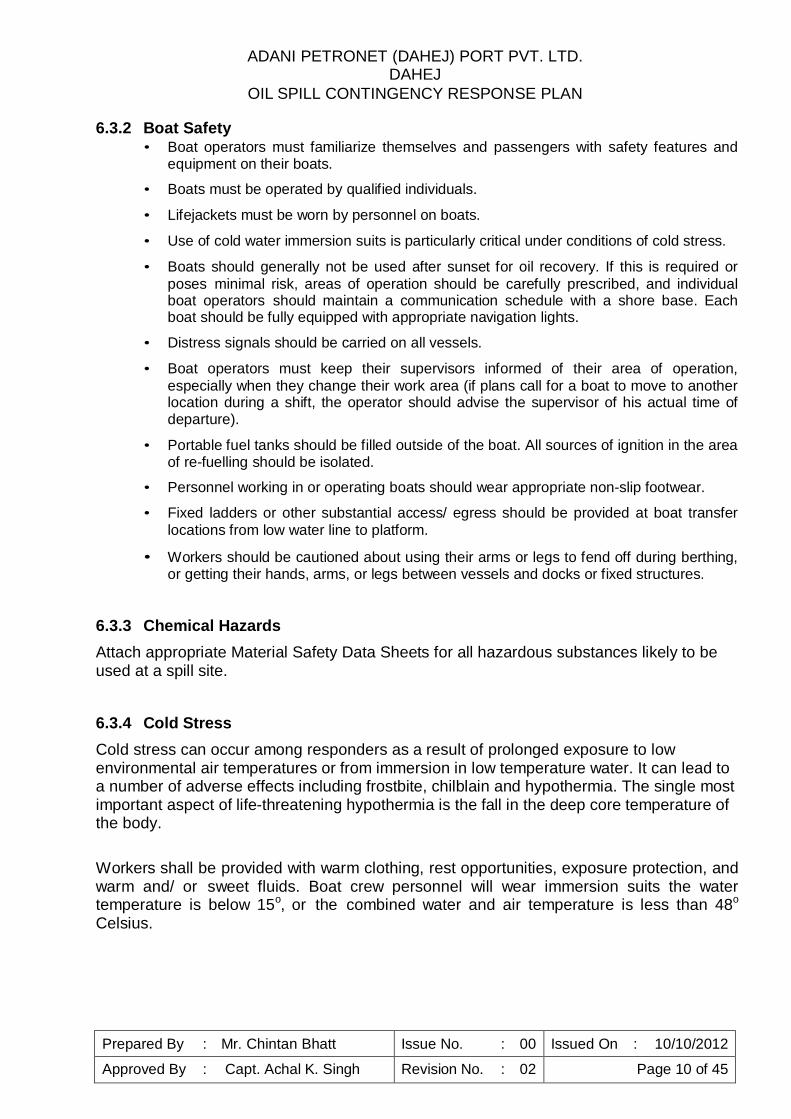
6.3.2 Boat Safety
• Boat operators must familiarize themselves and passengers with safety features and equipment on their boats.
• Boats must be operated by qualified individuals.
• Lifejackets must be worn by personnel on boats.
• Use of cold water immersion suits is particularly critical under conditions of cold stress.
• Boats should generally not be used after sunset for oil recovery. If this is required or poses minimal risk, areas of operation should be carefully prescribed, and individual boat operators should maintain a communication schedule with a shore base. Each boat should be fully equipped with appropriate navigation lights.
• Distress signals should be carried on all vessels.
• Boat operators must keep their supervisors informed of their area of operation, especially when they change their work area (if plans call for a boat to move to another location during a shift, the operator should advise the supervisor of his actual time of departure).
• Portable fuel tanks should be filled outside of the boat. All sources of ignition in the area
of re-fuelling should be isolated.
• Personnel working in or operating boats should wear appropriate non-slip footwear.
• Fixed ladders or other substantial access/ egress should be provided at boat transfer locations from low water line to platform.
• Workers should be cautioned about using their arms or legs to fend off during berthing,
or getting their hands, arms, or legs between vessels and docks or fixed structures. 6.3.3 Chemical Hazards
Attach appropriate Material Safety Data Sheets for all hazardous substances likely to be used at a spill site.
6.3.4 Cold Stress
Cold stress can occur among responders as a result of prolonged exposure to low environmental air temperatures or from immersion in low temperature water. It can lead to a number of adverse effects including frostbite, chilblain and hypothermia. The single most important aspect of life-threatening hypothermia is the fall in the deep core temperature of the body.
Workers shall be provided with warm clothing, rest opportunities, exposure protection, and warm and/ or sweet fluids. Boat crew personnel will wear immersion suits the water temperature is below 15o, or the combined water and air temperature is less than 48o
Celsius.

ADANI PETRONET (DAHEJ) PORT PVT. LTD. DAHEJ
OIL SPILL CONTINGENCY RESPONSE PLAN
Prepared By : Mr. Chintan Bhatt Issue No. : 00 Issued On : 10/10/2012 Approved By : Capt. Achal K. Singh Revision No. : 02 Page 10 of 45
WIND CHILL CHART Strength Speed Temperature Celsius
Calm
Breeze
Moderate
Near Gale
Gale
0km 16km
32km
48km
64km
10 4 -1 -7 - - - - ¹- ¹- ¹-45 12 18 23 29 34 40
4 -2 -9 - - - ¹- ¹- ¹- ¹- ²-64 15 23 31 44 51 51 57
0 -8 - - ¹- ¹- ¹- ¹- ²- ²- ²-80 15 23 32 40 48 55 64 72
-2 - - - ¹- ¹- ¹- ²- ²- ²- ²-88 10 19 28 36 45 53 62 71 79
-4 - - - ¹- ¹- ¹- ²- ²- ²- ²-92 12 21 31 38 48 57 66 74 83
Little danger to properly dressed personnel
¹Danger of freezing exposed flesh
² Greatest Danger
6.3.5 Drum Handling / Manual Handling
Drum handling at a spill site will primarily involve drums of waste and contaminated clothing. Several types of drums and containers may be used ranging from 25 to 200 liters in size. All drums and containers must be properly labeled. If in doubt as to the contents of a drum – seek advice.
Manual lifting and moving of drums should be kept to a minimum. A guide to manual handling is as follows:
• Wear gloves.
• Assess the weight of the load and get help if it is beyond your capability. Where appropriate, use mechanical aids provided.
• Size up the job – remove any obstructions; note any snags and make sure there is a clear space where the load has to be set down. Ensure that you can see over the load when carrying it.
• Look out for any splinters, projecting nails or sharp edges or wire.
• Stand close to the object and with your feet 20 to 30cm apart, places one-foot in advance of the other, pointing in the direction you intend to move.
• Put your chin in – avoid moving your head backwards or forwards.
• Bend your knees to a crouch position, keeping your back straight.
• Get a firm grip at opposite corners of the load with the palm of the hand and the roots of the fingers, arms as close to the body as possible.
• Lift with your thigh muscles by looking up and straightening your legs.
• Apply the above principles, to any movement such as pushing, pulling, digging, shoveling etc.
ADANI PETRONET (DAHEJ) PORT PVT. LTD. DAHEJ
OIL SPILL CONTINGENCY RESPONSE PLAN
Prepared By : Mr. Chintan Bhatt Issue No. : 00 Issued On : 10/10/2012 Approved By : Capt. Achal K. Singh Revision No. : 02 Page 10 of 45
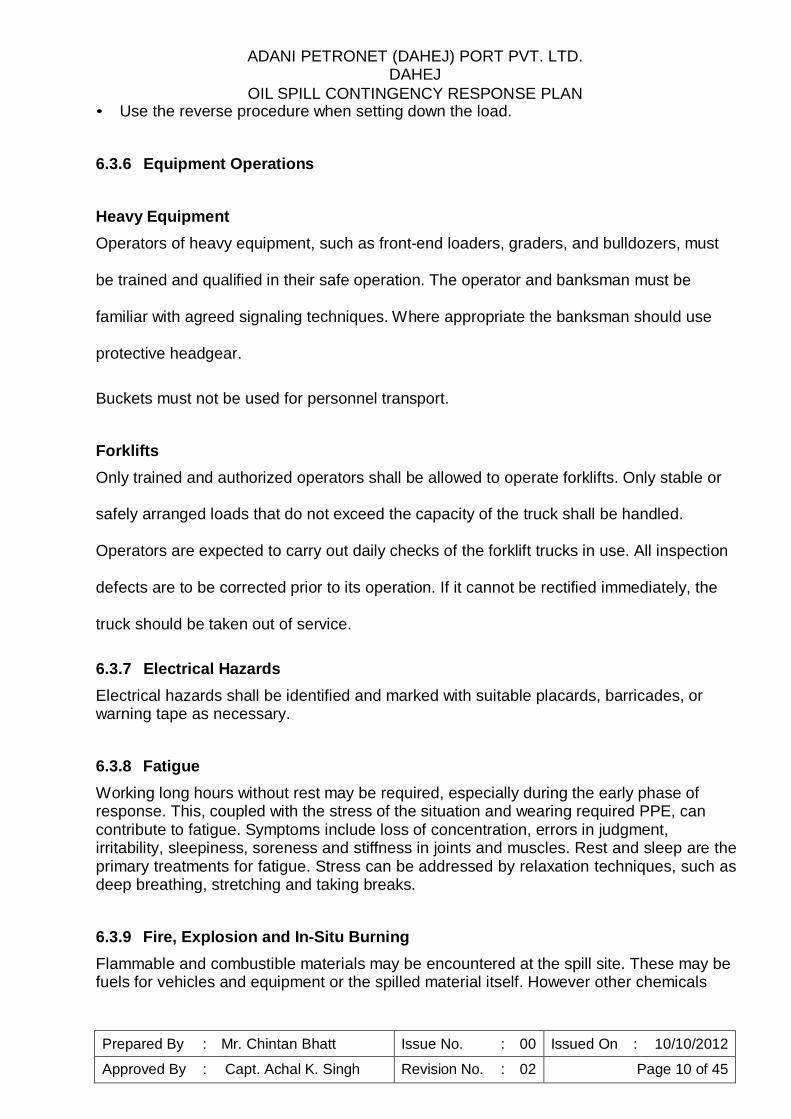
• Use the reverse procedure when setting down the load. 6.3.6 Equipment Operations
Heavy Equipment
Operators of heavy equipment, such as front-end loaders, graders, and bulldozers, must
be trained and qualified in their safe operation. The operator and banksman must be
familiar with agreed signaling techniques. Where appropriate the banksman should use
protective headgear.
Buckets must not be used for personnel transport. Forklifts
Only trained and authorized operators shall be allowed to operate forklifts. Only stable or
safely arranged loads that do not exceed the capacity of the truck shall be handled.
Operators are expected to carry out daily checks of the forklift trucks in use. All inspection
defects are to be corrected prior to its operation. If it cannot be rectified immediately, the
truck should be taken out of service.
6.3.7 Electrical Hazards
Electrical hazards shall be identified and marked with suitable placards, barricades, or warning tape as necessary.
6.3.8 Fatigue
Working long hours without rest may be required, especially during the early phase of response. This, coupled with the stress of the situation and wearing required PPE, can contribute to fatigue. Symptoms include loss of concentration, errors in judgment, irritability, sleepiness, soreness and stiffness in joints and muscles. Rest and sleep are the primary treatments for fatigue. Stress can be addressed by relaxation techniques, such as deep breathing, stretching and taking breaks.
6.3.9 Fire, Explosion and In-Situ Burning
Flammable and combustible materials may be encountered at the spill site. These may be fuels for vehicles and equipment or the spilled material itself. However other chemicals
ADANI PETRONET (DAHEJ) PORT PVT. LTD. DAHEJ
OIL SPILL CONTINGENCY RESPONSE PLAN
Prepared By : Mr. Chintan Bhatt Issue No. : 00 Issued On : 10/10/2012 Approved By : Capt. Achal K. Singh Revision No. : 02 Page 10 of 45
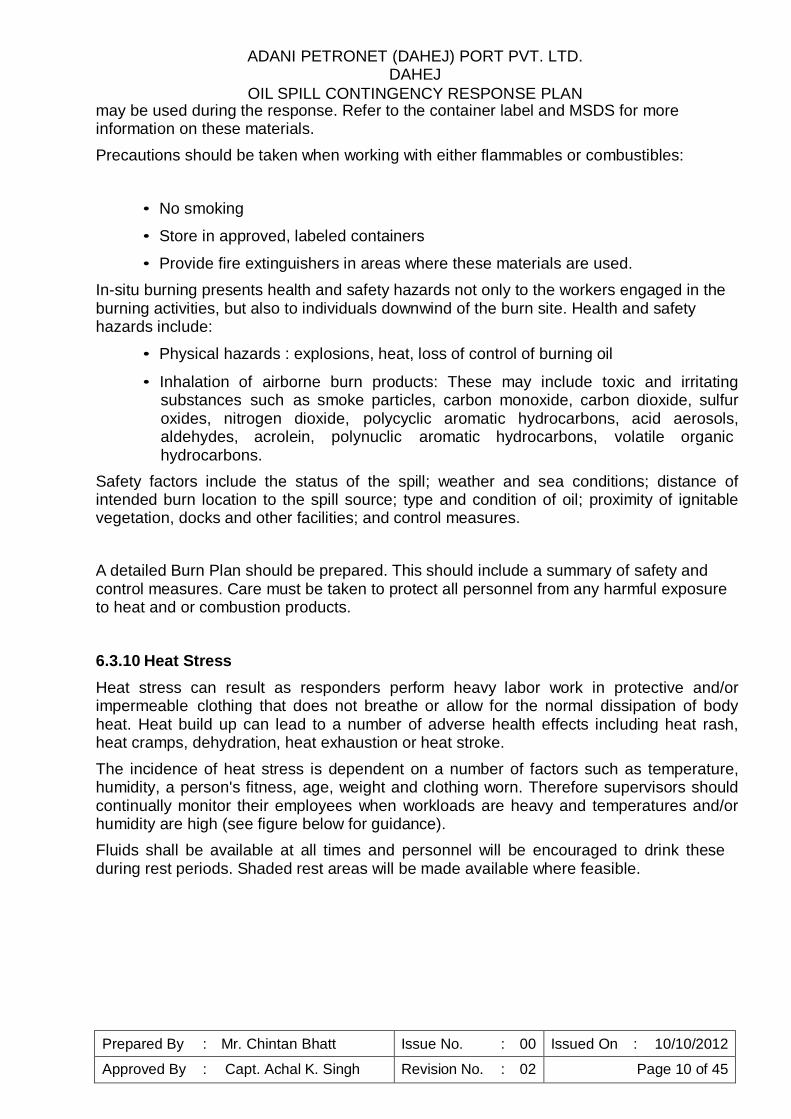
may be used during the response. Refer to the container label and MSDS for more information on these materials.
Precautions should be taken when working with either flammables or combustibles:
• No smoking
• Store in approved, labeled containers
• Provide fire extinguishers in areas where these materials are used.
In-situ burning presents health and safety hazards not only to the workers engaged in the burning activities, but also to individuals downwind of the burn site. Health and safety hazards include:
• Physical hazards : explosions, heat, loss of control of burning oil
• Inhalation of airborne burn products: These may include toxic and irritating substances such as smoke particles, carbon monoxide, carbon dioxide, sulfur oxides, nitrogen dioxide, polycyclic aromatic hydrocarbons, acid aerosols, aldehydes, acrolein, polynuclic aromatic hydrocarbons, volatile organic hydrocarbons.
Safety factors include the status of the spill; weather and sea conditions; distance of intended burn location to the spill source; type and condition of oil; proximity of ignitable vegetation, docks and other facilities; and control measures.
A detailed Burn Plan should be prepared. This should include a summary of safety and control measures. Care must be taken to protect all personnel from any harmful exposure to heat and or combustion products.
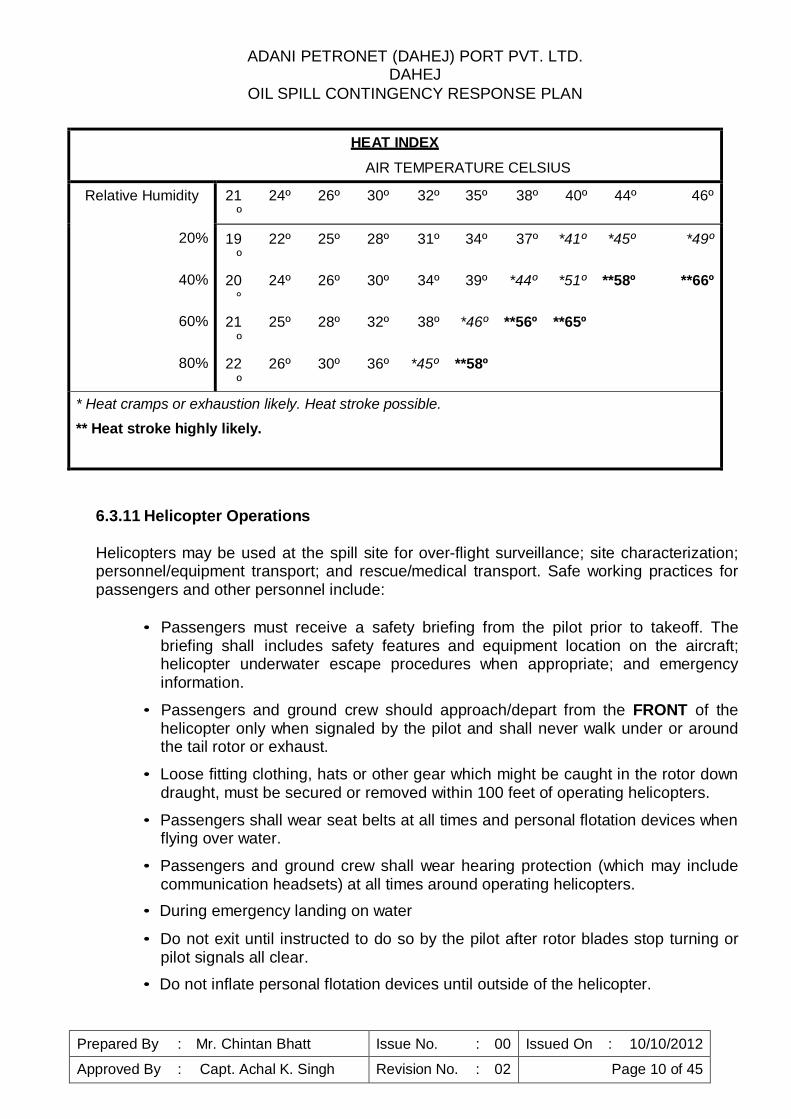
6.3.10 Heat Stress
Heat stress can result as responders perform heavy labor work in protective and/or impermeable clothing that does not breathe or allow for the normal dissipation of body heat. Heat build up can lead to a number of adverse health effects including heat rash, heat cramps, dehydration, heat exhaustion or heat stroke.
The incidence of heat stress is dependent on a number of factors such as temperature, humidity, a person's fitness, age, weight and clothing worn. Therefore supervisors should continually monitor their employees when workloads are heavy and temperatures and/or humidity are high (see figure below for guidance).
Fluids shall be available at all times and personnel will be encouraged to drink these during rest periods. Shaded rest areas will be made available where feasible.
ADANI PETRONET (DAHEJ) PORT PVT. LTD. DAHEJ
OIL SPILL CONTINGENCY RESPONSE PLAN
Prepared By : Mr. Chintan Bhatt Issue No. : 00 Issued On : 10/10/2012 Approved By : Capt. Achal K. Singh Revision No. : 02 Page 10 of 45
HEAT INDEX
AIR TEMPERATURE CELSIUS
Relative Humidity
20%
40%
60%
80%
21 24º 26º 30º 32º 35º 38º 40º 44º 46º º
19 22º 25º 28º 31º 34º 37º *41º *45º *49º º
20 24º 26º 30º 34º 39º *44º *51º **58º **66º °
21 25º 28º 32º 38º *46º **56º **65º º
22 26º 30º 36º *45º **58º º
* Heat cramps or exhaustion likely. Heat stroke possible.
** Heat stroke highly likely.
6.3.11 Helicopter Operations
Helicopters may be used at the spill site for over-flight surveillance; site characterization; personnel/equipment transport; and rescue/medical transport. Safe working practices for passengers and other personnel include:
• Passengers must receive a safety briefing from the pilot prior to takeoff. The
briefing shall includes safety features and equipment location on the aircraft; helicopter underwater escape procedures when appropriate; and emergency information.
• Passengers and ground crew should approach/depart from the FRONT of the helicopter only when signaled by the pilot and shall never walk under or around the tail rotor or exhaust.
• Loose fitting clothing, hats or other gear which might be caught in the rotor down draught, must be secured or removed within 100 feet of operating helicopters.
• Passengers shall wear seat belts at all times and personal flotation devices when flying over water.
• Passengers and ground crew shall wear hearing protection (which may include communication headsets) at all times around operating helicopters.
• During emergency landing on water
• Do not exit until instructed to do so by the pilot after rotor blades stop turning or pilot signals all clear.
• Do not inflate personal flotation devices until outside of the helicopter.
ADANI PETRONET (DAHEJ) PORT PVT. LTD. DAHEJ
OIL SPILL CONTINGENCY RESPONSE PLAN
Prepared By : Mr. Chintan Bhatt Issue No. : 00 Issued On : 10/10/2012 Approved By : Capt. Achal K. Singh Revision No. : 02 Page 10 of 45
6.3.12 Lifting
Cranes must be operated in accordance with the manufacturers' instructions and established construction practices. Only trained and authorized operators shall be allowed to operate cranes. Outriggers must be fully extended to assure maximum stability of the equipment. Cranes must only be operated where the ground provides adequate support.
Rigging components must be inspected daily. Only certified wire rope slings or web strops shall be used. Each sling or strop must be clearly marked or tagged with its rated capacity and must not be used in excess of this rating. Personnel should not be allowed under the jib or load except for the minimum time necessary to hook or unhook the load.
6.3.13 Motor Vehicles
Drivers shall maintain a safe speed at all times, and shall not be allowed to operate vehicles in a reckless manner.
6.3.14 Noise
Appropriate hearing protection shall be used in designated high noise areas where personnel noise exposure exceed 85-dBA time weighted average over an 8-hour work shift/ period.
6.3.15 Overhead and Buried Utilities If work has to be carried out near overhead lines, consultation with the organization that operates the supply system should be undertaken. A safe working distance from these overhead lines should be determined and the area cordoned off.
The estimated location of buried utilities such as sewer; telephone, fuel, electric or water should be predetermined before work begins. Utility companies or owners must be contacted, advised of the proposed work and informed of the urgency of the situation.
6.3.16 Pumps and Hoses
Pumps and hoses may be used at the spill site to apply water, steam or chemical for clean up and/or decontamination. They may also be used for transfer of liquid waste. Caution should be used when working in these areas where hoses are being used as they represent a tripping hazard. Additionally when using pumps and hoses determine their last contents to avoid unnecessary contamination.
ADANI PETRONET (DAHEJ) PORT PVT. LTD. DAHEJ
OIL SPILL CONTINGENCY RESPONSE PLAN
Prepared By : Mr. Chintan Bhatt Issue No. : 00 Issued On : 10/10/2012 Approved By : Capt. Achal K. Singh Revision No. : 02 Page 10 of 45
6.3.17 Slips, Trips and Falls Slips, trips and falls on oily surfaces are the major cause of injuries at an oil spill site. Many of these injuries occur in the first few minutes of work before workers realize the conditions and begin to take precautionary measures. When entering a spill site, walk slowly and carefully in oil coated areas. Be especially careful when walking on oil covered rocks. Oil resistant safety footwear with non-slip soles should be worn.
It is better to clear an access/egress route than to walk through oiled areas.
ADANI PETRONET (DAHEJ) PORT PVT. LTD. DAHEJ
OIL SPILL CONTINGENCY RESPONSE PLAN
Prepared By : Mr. Chintan Bhatt Issue No. : 00 Issued On : 10/10/2012 Approved By : Capt. Achal K. Singh Revision No. : 02 Page 10 of 45
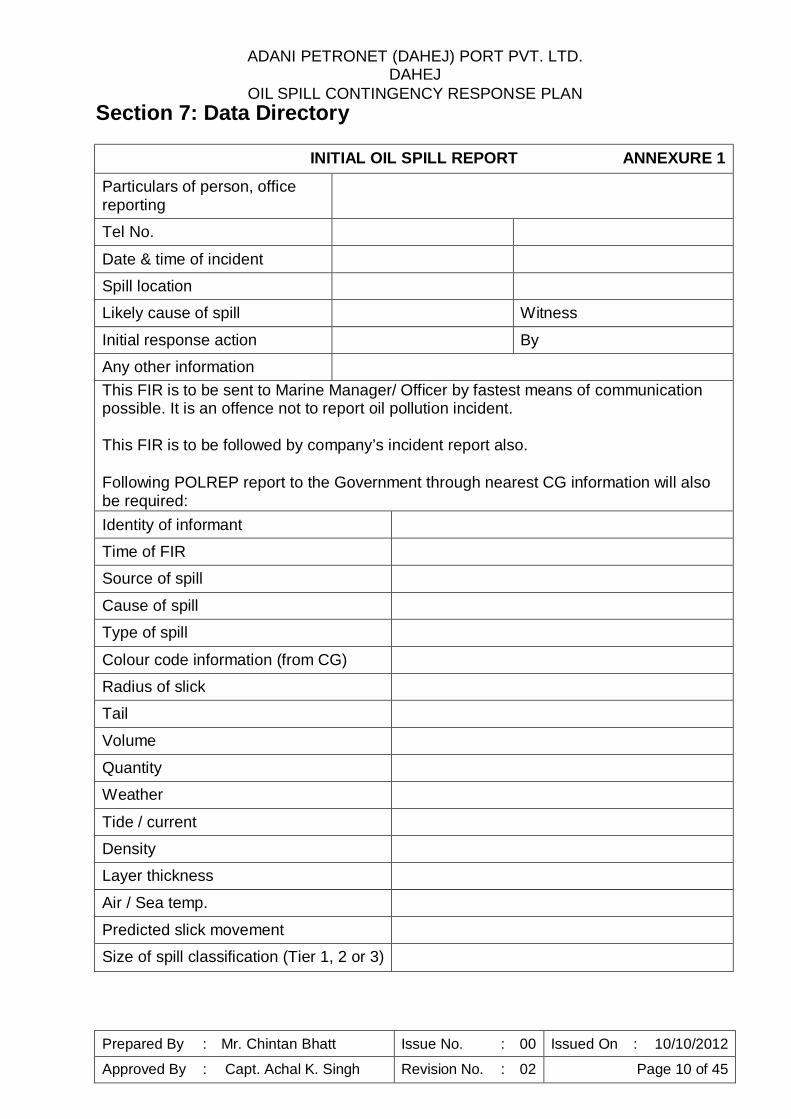
Section 7: Data Directory
INITIAL OIL SPILL REPORT ANNEXURE 1
Particulars of person, office reporting
Tel No.
Date & time of incident
Spill location
Likely cause of spill Witness
Initial response action By
Any other information This FIR is to be sent to Marine Manager/ Officer by fastest means of communication possible. It is an offence not to report oil pollution incident.
This FIR is to be followed by company’s incident report also.
Following POLREP report to the Government through nearest CG information will also be required: Identity of informant
Time of FIR
Source of spill
Cause of spill
Type of spill
Colour code information (from CG)
Radius of slick
Tail
Volume
Quantity
Weather
Tide / current
Density
Layer thickness
Air / Sea temp.
Predicted slick movement
Size of spill classification (Tier 1, 2 or 3)
ADANI PETRONET (DAHEJ) PORT PVT. LTD. DAHEJ
OIL SPILL CONTINGENCY RESPONSE PLAN
Prepared By : Mr. Chintan Bhatt Issue No. : 00 Issued On : 10/10/2012 Approved By : Capt. Achal K. Singh Revision No. : 02 Page 10 of 45
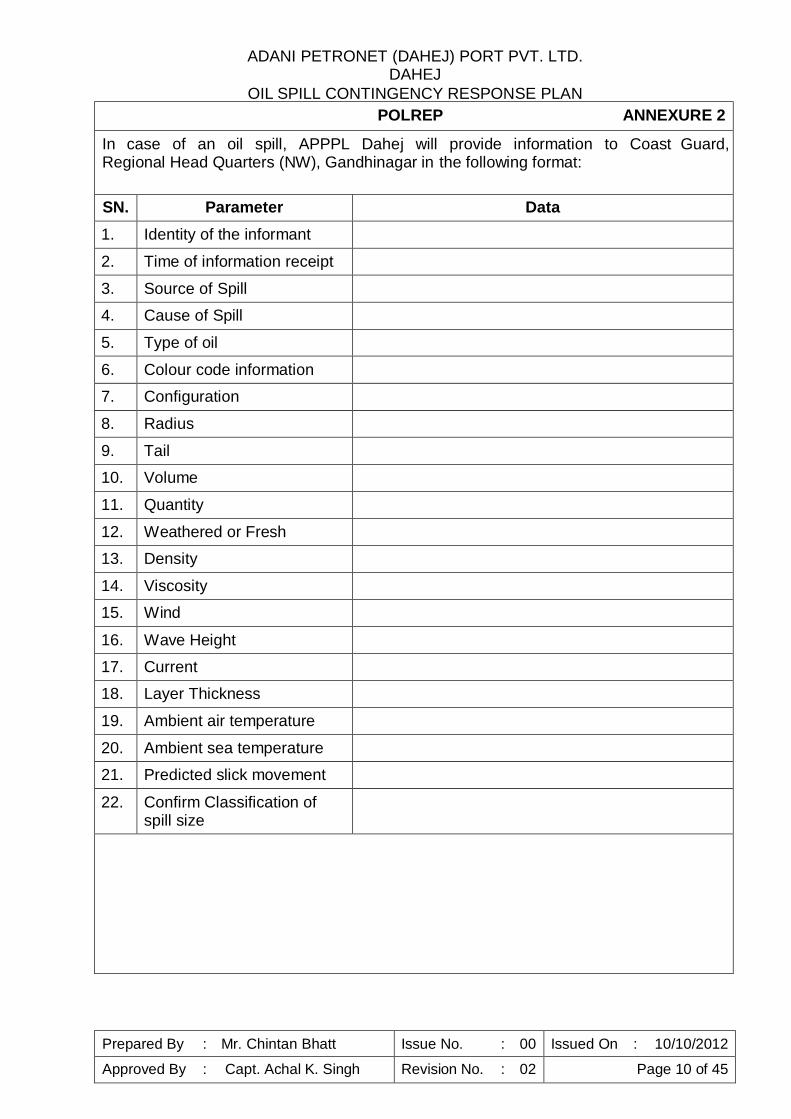
POLREP ANNEXURE 2
In case of an oil spill, APPPL Dahej will provide information to Coast Guard, Regional Head Quarters (NW), Gandhinagar in the following format:
SN. Parameter Data
1. Identity of the informant
2. Time of information receipt
3. Source of Spill
4. Cause of Spill
5. Type of oil
6. Colour code information
7. Configuration
8. Radius
9. Tail
10. Volume
11. Quantity
12. Weathered or Fresh
13. Density
14. Viscosity
15. Wind
16. Wave Height
17. Current
18. Layer Thickness
19. Ambient air temperature
20. Ambient sea temperature
21. Predicted slick movement
22. Confirm Classification of spill size
ADANI PETRONET (DAHEJ) PORT PVT. LTD. DAHEJ
OIL SPILL CONTINGENCY RESPONSE PLAN
Prepared By : Mr. Chintan Bhatt Issue No. : 00 Issued On : 10/10/2012 Approved By : Capt. Achal K. Singh Revision No. : 02 Page 10 of 45
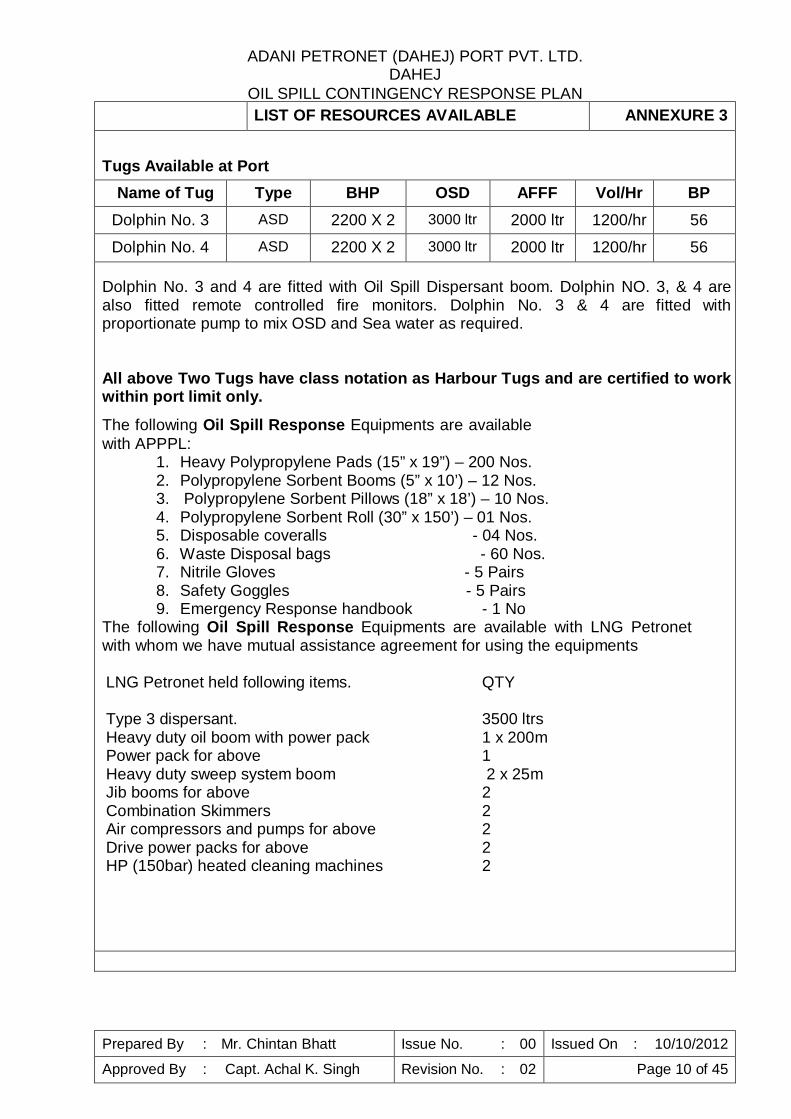
LIST OF RESOURCES AVAILABLE ANNEXURE 3
Tugs Available at Port Name of Tug Type BHP OSD AFFF Vol/Hr BP
Dolphin No. 3 ASD 2200 X 2 3000 ltr 2000 ltr 1200/hr 56
Dolphin No. 4 ASD 2200 X 2 3000 ltr 2000 ltr 1200/hr 56
Dolphin No. 3 and 4 are fitted with Oil Spill Dispersant boom. Dolphin NO. 3, & 4 are also fitted remote controlled fire monitors. Dolphin No. 3 & 4 are fitted with proportionate pump to mix OSD and Sea water as required.
All above Two Tugs have class notation as Harbour Tugs and are certified to work within port limit only.
The following Oil Spill Response Equipments are available with APPPL:
1. Heavy Polypropylene Pads (15” x 19”) – 200 Nos.2. Polypropylene Sorbent Booms (5” x 10’) – 12 Nos.3. Polypropylene Sorbent Pillows (18” x 18’) – 10 Nos.4. Polypropylene Sorbent Roll (30” x 150’) – 01 Nos.5. Disposable coveralls - 04 Nos. 6. Waste Disposal bags - 60 Nos. 7. Nitrile Gloves - 5 Pairs 8. Safety Goggles - 5 Pairs 9. Emergency Response handbook - 1 No
The following Oil Spill Response Equipments are available with LNG Petronet with whom we have mutual assistance agreement for using the equipments
LNG Petronet held following items. QTY
Type 3 dispersant. 3500 ltrs Heavy duty oil boom with power pack 1 x 200m Power pack for above 1 Heavy duty sweep system boom 2 x 25m Jib booms for above 2 Combination Skimmers 2 Air compressors and pumps for above 2 Drive power packs for above 2 HP (150bar) heated cleaning machines 2
ADANI PETRONET (DAHEJ) PORT PVT. LTD. DAHEJ
OIL SPILL CONTINGENCY RESPONSE PLAN
Prepared By : Mr. Chintan Bhatt Issue No. : 00 Issued On : 10/10/2012 Approved By : Capt. Achal K. Singh Revision No. : 02 Page 10 of 45
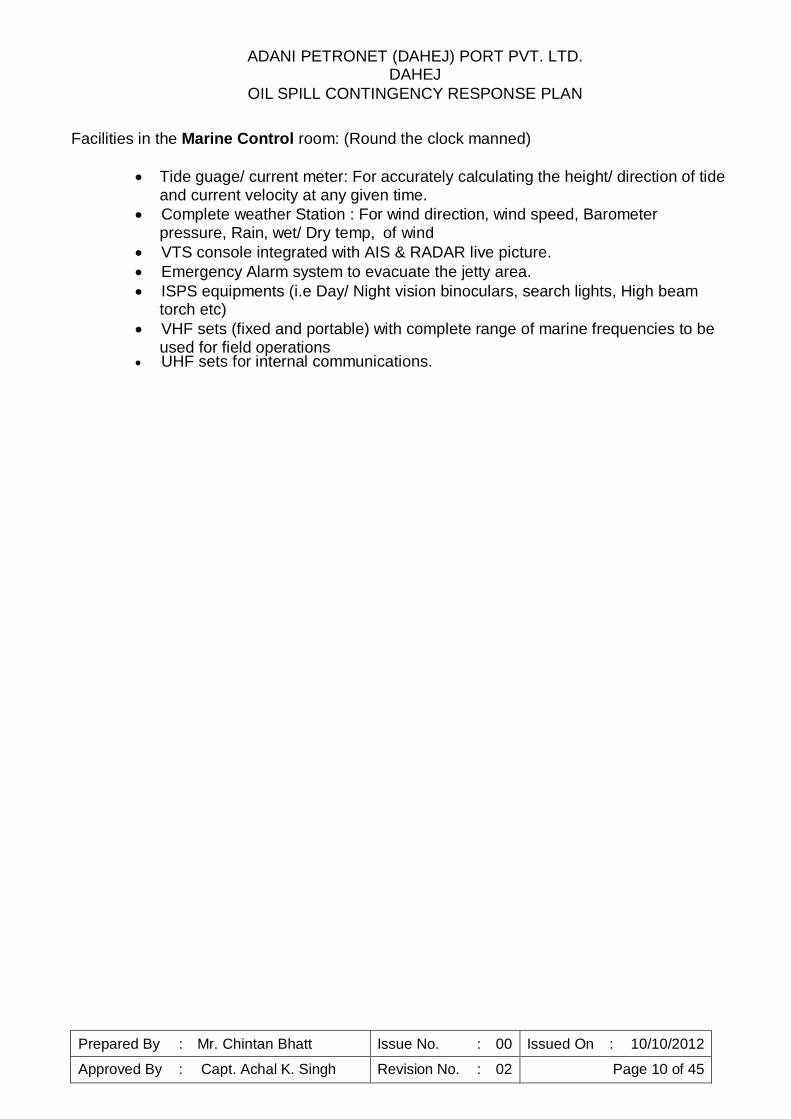
Facilities in the Marine Control room: (Round the clock manned)
Tide guage/ current meter: For accurately calculating the height/ direction of tide
and current velocity at any given time. Complete weather Station : For wind direction, wind speed, Barometer
pressure, Rain, wet/ Dry temp, of wind VTS console integrated with AIS & RADAR live picture. Emergency Alarm system to evacuate the jetty area. ISPS equipments (i.e Day/ Night vision binoculars, search lights, High beam
torch etc) VHF sets (fixed and portable) with complete range of marine frequencies to be
used for field operations UHF sets for internal communications.
ADANI PETRONET (DAHEJ) PORT PVT. LTD. DAHEJ
OIL SPILL CONTINGENCY RESPONSE PLAN
Prepared By : Mr. Chintan Bhatt Issue No. : 00 Issued On : 10/10/2012 Approved By : Capt. Achal K. Singh Revision No. : 02 Page 10 of 45
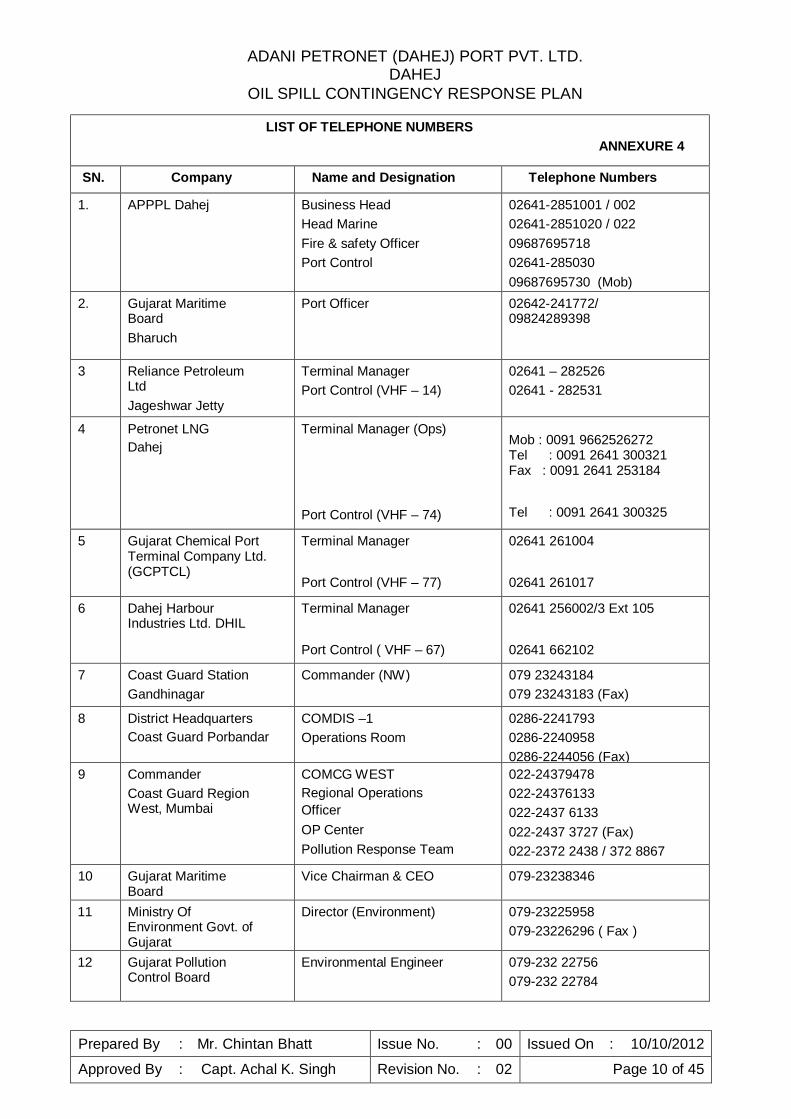
LIST OF TELEPHONE NUMBERS ANNEXURE 4
SN. Company Name and Designation Telephone Numbers
1. APPPL Dahej Business Head Head Marine Fire & safety Officer Port Control
02641-2851001 / 002 02641-2851020 / 022 09687695718 02641-285030 09687695730 (Mob)
2. Gujarat Maritime Board Bharuch
Port Officer 02642-241772/ 09824289398
3 Reliance Petroleum Ltd Jageshwar Jetty
Terminal Manager Port Control (VHF – 14)
02641 – 282526 02641 - 282531
4 Petronet LNG Dahej
Terminal Manager (Ops)
Port Control (VHF – 74)
Mob : 0091 9662526272 Tel : 0091 2641 300321 Fax : 0091 2641 253184
Tel : 0091 2641 300325
5 Gujarat Chemical Port Terminal Company Ltd. (GCPTCL)
Terminal Manager
Port Control (VHF – 77)
02641 261004
02641 261017
6 Dahej Harbour Industries Ltd. DHIL
Terminal Manager
Port Control ( VHF – 67)
02641 256002/3 Ext 105
02641 662102
7 Coast Guard Station Gandhinagar
Commander (NW) 079 23243184 079 23243183 (Fax)
8 District Headquarters Coast Guard Porbandar
COMDIS –1 Operations Room
0286-2241793 0286-2240958 0286-2244056 (Fax)
9 Commander Coast Guard Region West, Mumbai
COMCG WEST Regional Operations Officer OP Center Pollution Response Team
022-24379478 022-24376133 022-2437 6133 022-2437 3727 (Fax) 022-2372 2438 / 372 8867
10 Gujarat Maritime Board
Vice Chairman & CEO 079-23238346
11 Ministry Of Environment Govt. of Gujarat
Director (Environment) 079-23225958 079-23226296 ( Fax )
12 Gujarat Pollution Control Board
Environmental Engineer 079-232 22756 079-232 22784
ADANI PETRONET (DAHEJ) PORT PVT. LTD. DAHEJ
OIL SPILL CONTINGENCY RESPONSE PLAN
Prepared By : Mr. Chintan Bhatt Issue No. : 00 Issued On : 10/10/2012 Approved By : Capt. Achal K. Singh Revision No. : 02 Page 10 of 45
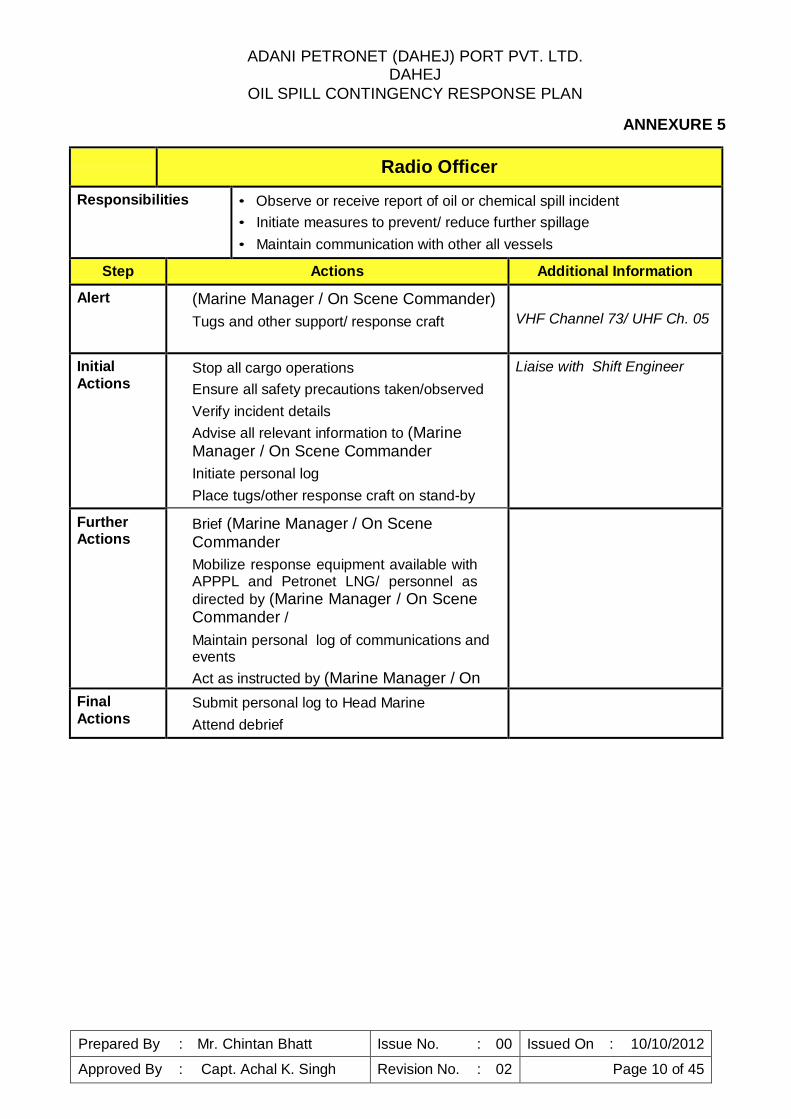
ANNEXURE 5
Radio Officer
Responsibilities • Observe or receive report of oil or chemical spill incident• Initiate measures to prevent/ reduce further spillage• Maintain communication with other all vessels
Step Actions Additional Information
Alert (Marine Manager / On Scene Commander) Tugs and other support/ response craft VHF Channel 73/ UHF Ch. 05
Initial Actions
Stop all cargo operations Ensure all safety precautions taken/observed Verify incident details Advise all relevant information to (Marine Manager / On Scene Commander Initiate personal log Place tugs/other response craft on stand-by
Liaise with Shift Engineer
Further Actions
Brief (Marine Manager / On Scene Commander Mobilize response equipment available with APPPL and Petronet LNG/ personnel as directed by (Marine Manager / On Scene Commander / Maintain personal log of communications and events Act as instructed by (Marine Manager / On Scene Commander Final
Actions Submit personal log to Head Marine Attend debrief
ADANI PETRONET (DAHEJ) PORT PVT. LTD. DAHEJ
OIL SPILL CONTINGENCY RESPONSE PLAN
Prepared By : Mr. Chintan Bhatt Issue No. : 00 Issued On : 10/10/2012 Approved By : Capt. Achal K. Singh Revision No. : 02 Page 10 of 45
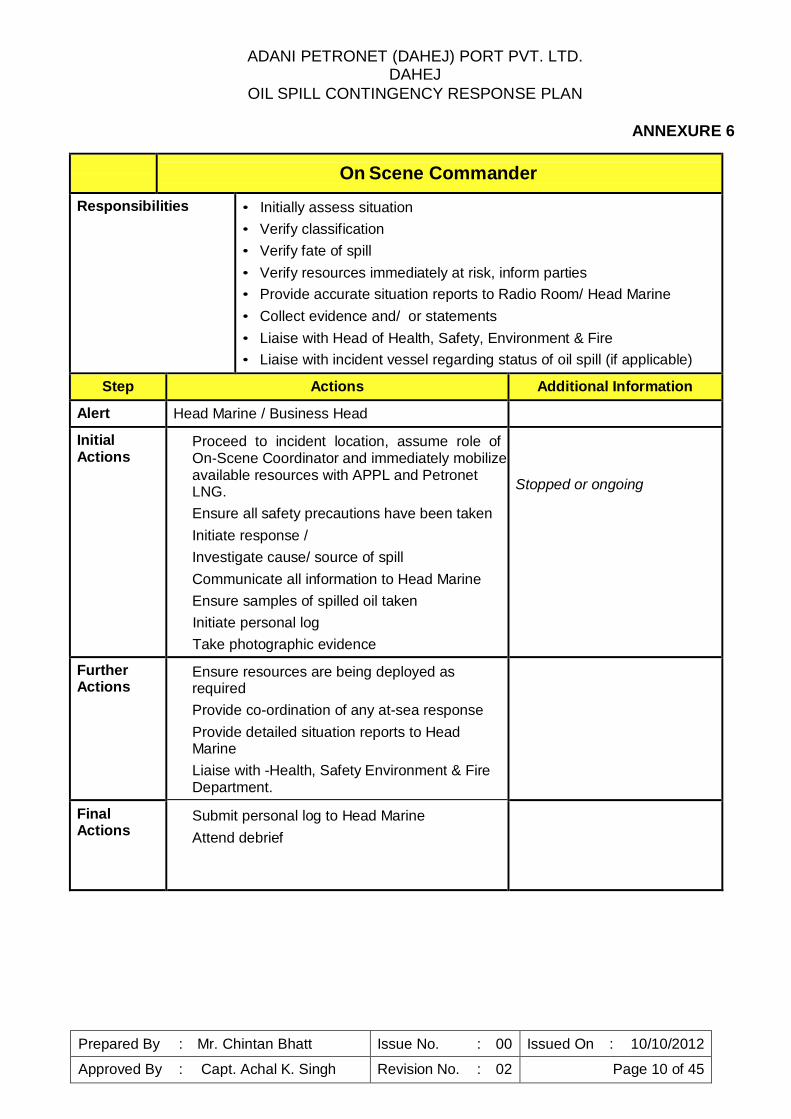
ANNEXURE 6
On Scene Commander
Responsibilities • Initially assess situation• Verify classification• Verify fate of spill• Verify resources immediately at risk, inform parties• Provide accurate situation reports to Radio Room/ Head Marine• Collect evidence and/ or statements• Liaise with Head of Health, Safety, Environment & Fire• Liaise with incident vessel regarding status of oil spill (if applicable)
Step Actions Additional Information
Alert Head Marine / Business Head
Initial Actions
Proceed to incident location, assume role of On-Scene Coordinator and immediately mobilize available resources with APPL and Petronet LNG. Ensure all safety precautions have been taken Initiate response / Investigate cause/ source of spill Communicate all information to Head Marine Ensure samples of spilled oil taken Initiate personal log Take photographic evidence
Stopped or ongoing
Further Actions
Ensure resources are being deployed as required Provide co-ordination of any at-sea response Provide detailed situation reports to Head Marine Liaise with -Health, Safety Environment & Fire Department.
Final Actions
Submit personal log to Head Marine Attend debrief
ADANI PETRONET (DAHEJ) PORT PVT. LTD. DAHEJ
OIL SPILL CONTINGENCY RESPONSE PLAN
Prepared By : Mr. Chintan Bhatt Issue No. : 00 Issued On : 10/10/2012 Approved By : Capt. Achal K. Singh Revision No. : 02 Page 10 of 45
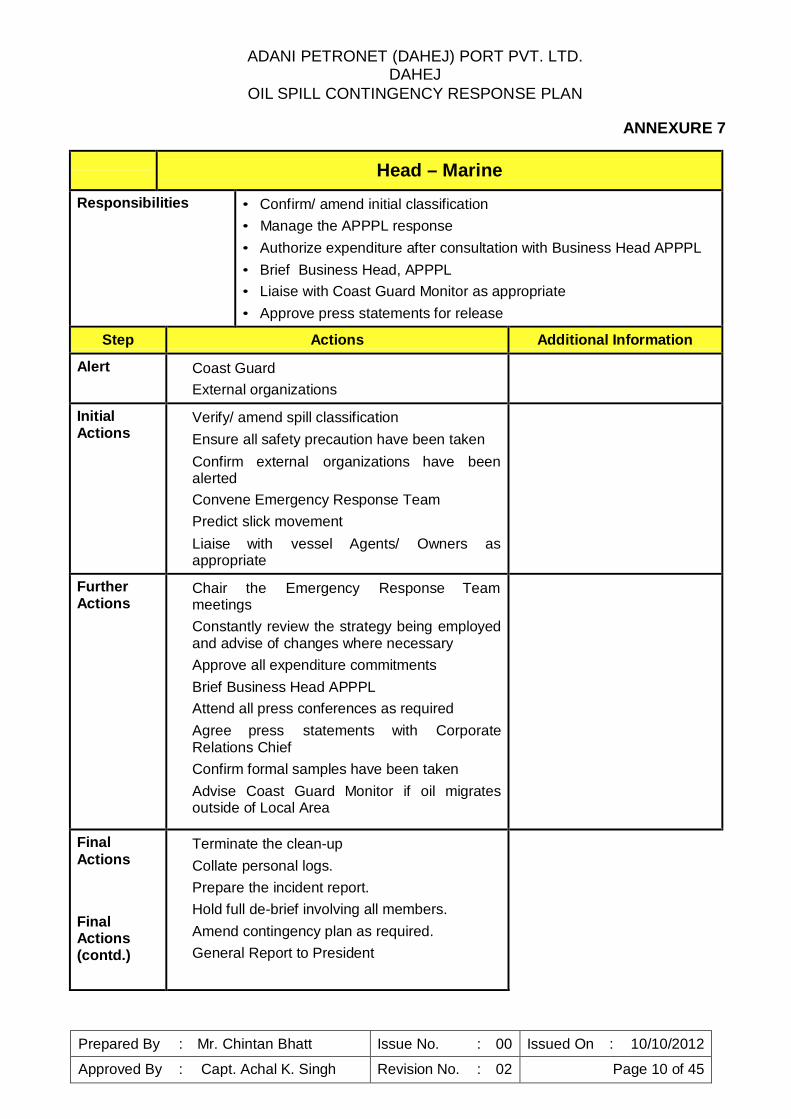
ANNEXURE 7
Head – Marine
Responsibilities • Confirm/ amend initial classification• Manage the APPPL response• Authorize expenditure after consultation with Business Head APPPL• Brief Business Head, APPPL• Liaise with Coast Guard Monitor as appropriate• Approve press statements for release
Step Actions Additional Information
Alert Coast Guard External organizations
Initial Actions
Verify/ amend spill classification Ensure all safety precaution have been taken Confirm external organizations have been alerted Convene Emergency Response Team Predict slick movement Liaise with vessel Agents/ Owners as appropriate
Further Actions
Chair the Emergency Response Team meetings Constantly review the strategy being employed and advise of changes where necessary Approve all expenditure commitments Brief Business Head APPPL Attend all press conferences as required Agree press statements with Corporate Relations Chief Confirm formal samples have been taken Advise Coast Guard Monitor if oil migrates outside of Local Area
Final Actions
Final Actions (contd.)
Terminate the clean-up Collate personal logs. Prepare the incident report. Hold full de-brief involving all members. Amend contingency plan as required. General Report to President
ADANI PETRONET (DAHEJ) PORT PVT. LTD. DAHEJ
OIL SPILL CONTINGENCY RESPONSE PLAN
Prepared By : Mr. Chintan Bhatt Issue No. : 00 Issued On : 10/10/2012 Approved By : Capt. Achal K. Singh Revision No. : 02 Page 10 of 45
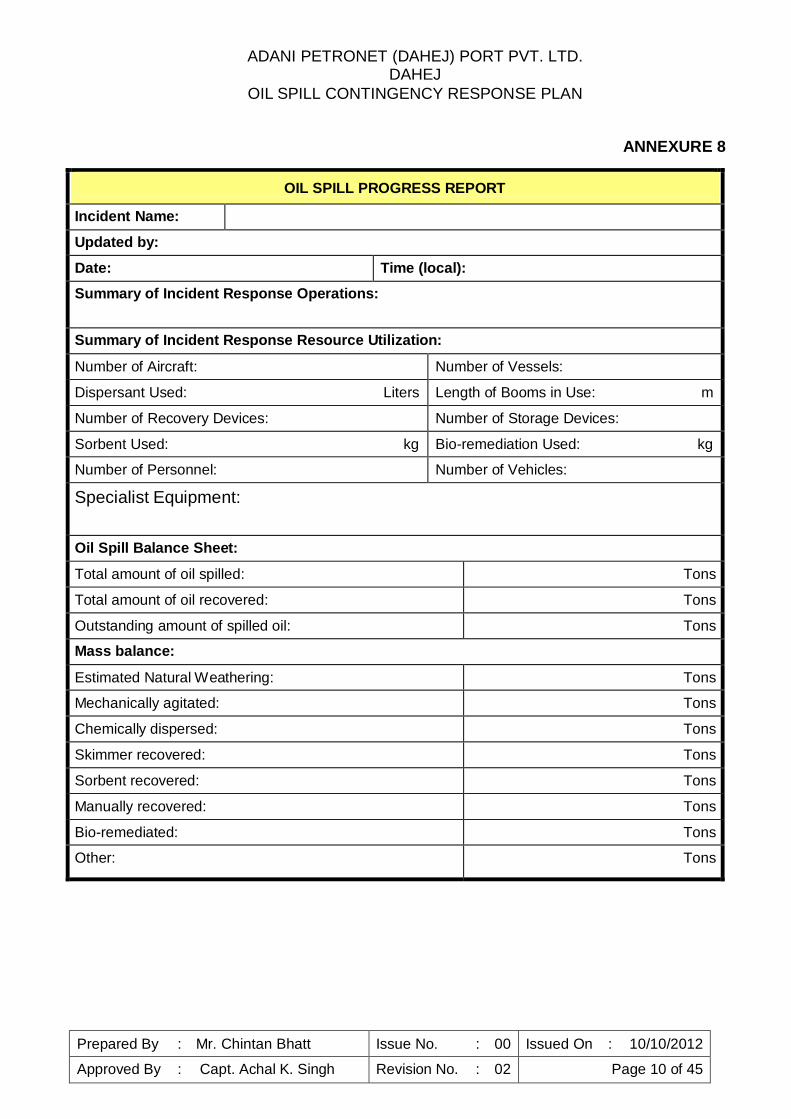
ANNEXURE 8
OIL SPILL PROGRESS REPORT
Incident Name: Updated by: Date: Time (local): Summary of Incident Response Operations:
Summary of Incident Response Resource Utilization:
Number of Aircraft: Number of Vessels: Dispersant Used: Liters Length of Booms in Use: m Number of Recovery Devices: Number of Storage Devices: Sorbent Used: kg Bio-remediation Used: kg Number of Personnel: Number of Vehicles:
Specialist Equipment:
Oil Spill Balance Sheet: Total amount of oil spilled: Tons Total amount of oil recovered: Tons Outstanding amount of spilled oil: Tons Mass balance:
Estimated Natural Weathering: Tons Mechanically agitated: Tons Chemically dispersed: Tons Skimmer recovered: Tons Sorbent recovered: Tons Manually recovered: Tons Bio-remediated: Tons Other: Tons
ADANI PETRONET (DAHEJ) PORT PVT. LTD. DAHEJ
OIL SPILL CONTINGENCY RESPONSE PLAN
Prepared By : Mr. Chintan Bhatt Issue No. : 00 Issued On : 10/10/2012 Approved By : Capt. Achal K. Singh Revision No. : 02 Page 10 of 45
ANNEXURE 9
ADANI PETRONET (DAHEJ) PORT PVT. LTD. DAHEJ
OIL SPILL CONTINGENCY RESPONSE PLAN
Prepared By : Mr. Chintan Bhatt Issue No. : 00 Issued On : 10/10/2012 Approved By : Capt. Achal K. Singh Revision No. : 02 Page 10 of 45
ANNEXURE 10
ADANI PETRONET (DAHEJ) PORT PVT. LTD. DAHEJ
OIL SPILL CONTINGENCY RESPONSE PLAN
Prepared By : Mr. Chintan Bhatt Issue No. : 00 Issued On : 10/10/2012 Approved By : Capt. Achal K. Singh Revision No. : 02 Page 10 of 45
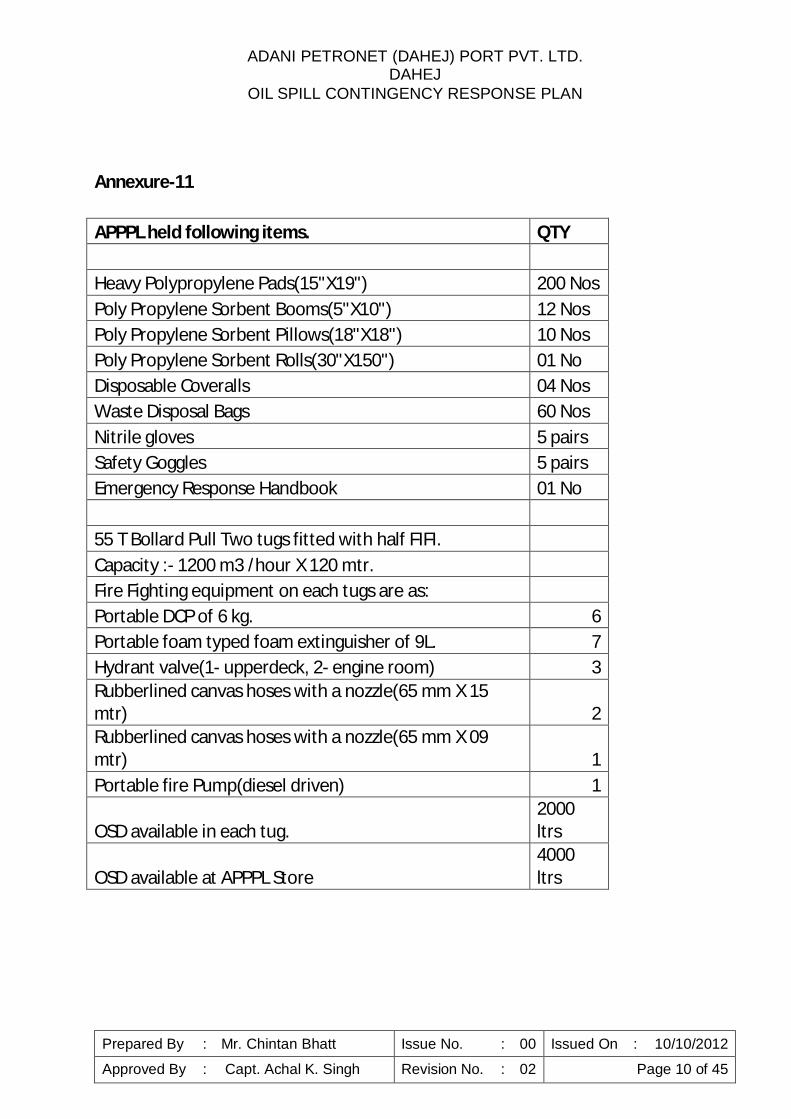
Annexure-11
APPPL held following items. QTY
Heavy Polypropylene Pads(15"X19") 200 Nos Poly Propylene Sorbent Booms(5"X10") 12 Nos Poly Propylene Sorbent Pillows(18"X18") 10 Nos Poly Propylene Sorbent Rolls(30"X150") 01 No Disposable Coveralls 04 Nos Waste Disposal Bags 60 Nos Nitrile gloves 5 pairs Safety Goggles 5 pairs Emergency Response Handbook 01 No
55 T Bollard Pull Two tugs fitted with half FIFI. Capacity :- 1200 m3 /hour X 120 mtr. Fire Fighting equipment on each tugs are as: Portable DCP of 6 kg. 6 Portable foam typed foam extinguisher of 9L. 7 Hydrant valve(1- upperdeck, 2- engine room) 3 Rubberlined canvas hoses with a nozzle(65 mm X 15 mtr) 2 Rubberlined canvas hoses with a nozzle(65 mm X 09 mtr) 1 Portable fire Pump(diesel driven) 1
OSD available in each tug. 2000 ltrs
OSD available at APPPL Store 4000 ltrs
ADANI PETRONET (DAHEJ) PORT PVT. LTD. DAHEJ
OIL SPILL CONTINGENCY RESPONSE PLAN
Prepared By : Mr. Chintan Bhatt Issue No. : 00 Issued On : 10/10/2012 Approved By : Capt. Achal K. Singh Revision No. : 02 Page 10 of 45
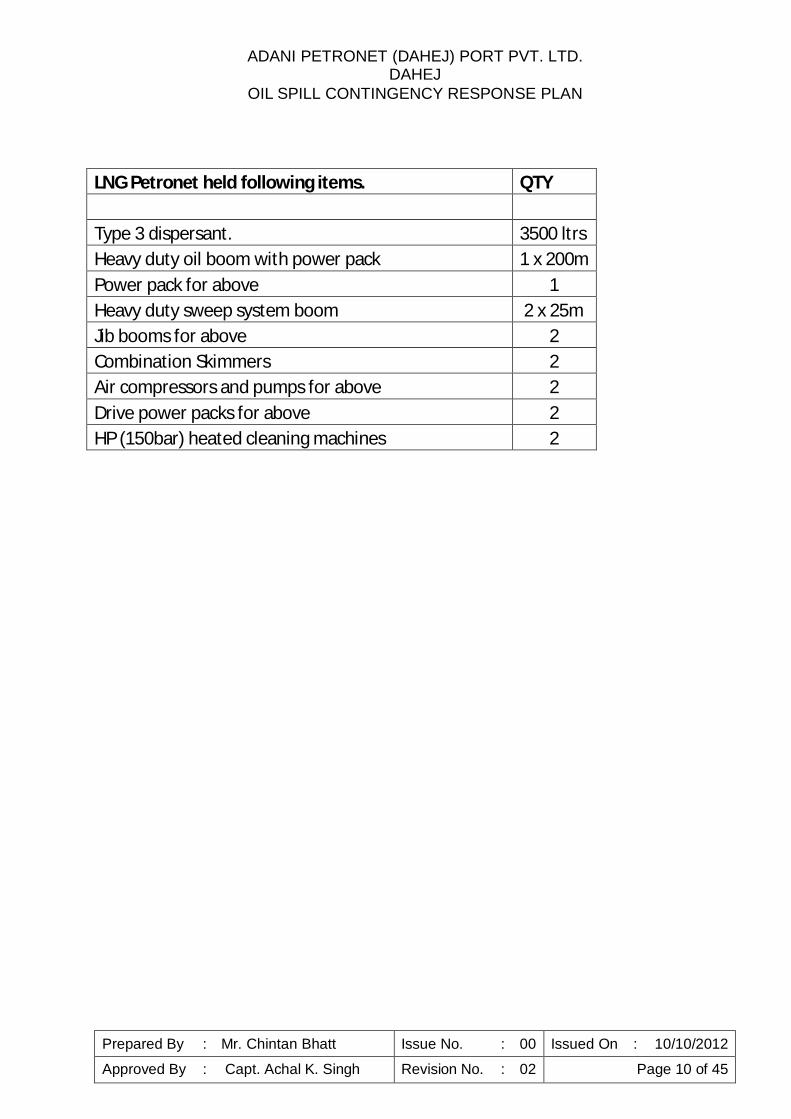
LNG Petronet held following items. QTY Type 3 dispersant. 3500 ltrs Heavy duty oil boom with power pack 1 x 200m Power pack for above 1 Heavy duty sweep system boom 2 x 25m Jib booms for above 2 Combination Skimmers 2 Air compressors and pumps for above 2 Drive power packs for above 2 HP (150bar) heated cleaning machines 2
Appendix 3 (Emergency Response and Disaster Management Plan)
ADANI PETRONET (DAHEJ) PORT PRIVATE LIMITED
Page 1 of 48
EMERGENCY RESPONSE & DISASTER MANAGEMENT PLAN Rev : 01
Issue No. 01 Date: 4th March, 2012
EMERGENCY RESPONSE
AND
DISASTER MANAGEMENT PLAN
ADANI PETRONET (DAHEJ) PORT PRIVATE LIMITED
Page 2 of 48
EMERGENCY RESPONSE & DISASTER MANAGEMENT PLAN Rev : 01
Issue No. 01 Date: 4th March, 2012
02.00.INTRODUCTION
This “EMERGENCY RESPONSE & DISASTER MANAGEMENT PLAN” is the property of
Adani Petronet (DAHEJ) Port PVT. LTD., herein after referred to as APPPL, and shall not
be removed from the Company’s premises.
This EMERGENCY RESPONSE & DISASTER MANAGEMENT PLAN is distributed to all
users. This EMERGENCY RESPONSE & DISASTER MANAGEMENT PLAN shall not
normally be distributed to outsiders. If required, report on a “need basis” will be
distributed. EMERGENCY RESPONSE & DISASTER MANAGEMENT PLAN so
distributed will be controlled & identified by a unique control number.
The holder of the control copy shall ensure that the persons working under him, who are
responsible for any activity described in this EMERGENCY RESPONSE & DISASTER
MANAGEMENT PLAN, are made aware of such responsibility. All persons to whom the
EMERGENCY RESPONSE & DISASTER MANAGEMENT PLAN has been circulated
shall also be made aware of any revisions thereto by the holder of the controlled copy of
the EMERGENCY RESPONSE & DISASTER MANAGEMENT PLAN.
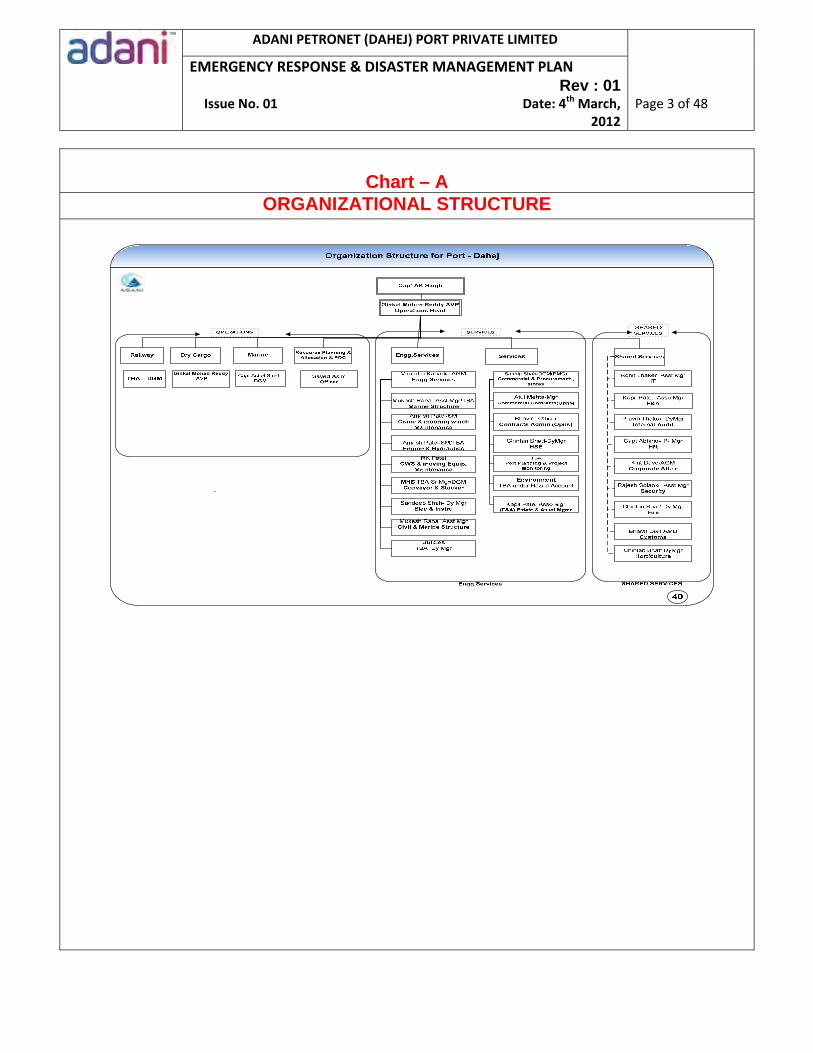
The Organizational Structure at APPPL is as outlined in Chart A.
ADANI PETRONET (DAHEJ) PORT PRIVATE LIMITED
Page 3 of 48
EMERGENCY RESPONSE & DISASTER MANAGEMENT PLAN Rev : 01
Issue No. 01 Date: 4th March, 2012
Chart – A
ORGANIZATIONAL STRUCTURE
ADANI PETRONET (DAHEJ) PORT PRIVATE LIMITED
Page 4 of 48
EMERGENCY RESPONSE & DISASTER MANAGEMENT PLAN Rev : 01
Issue No. 01 Date: 4th March, 2012
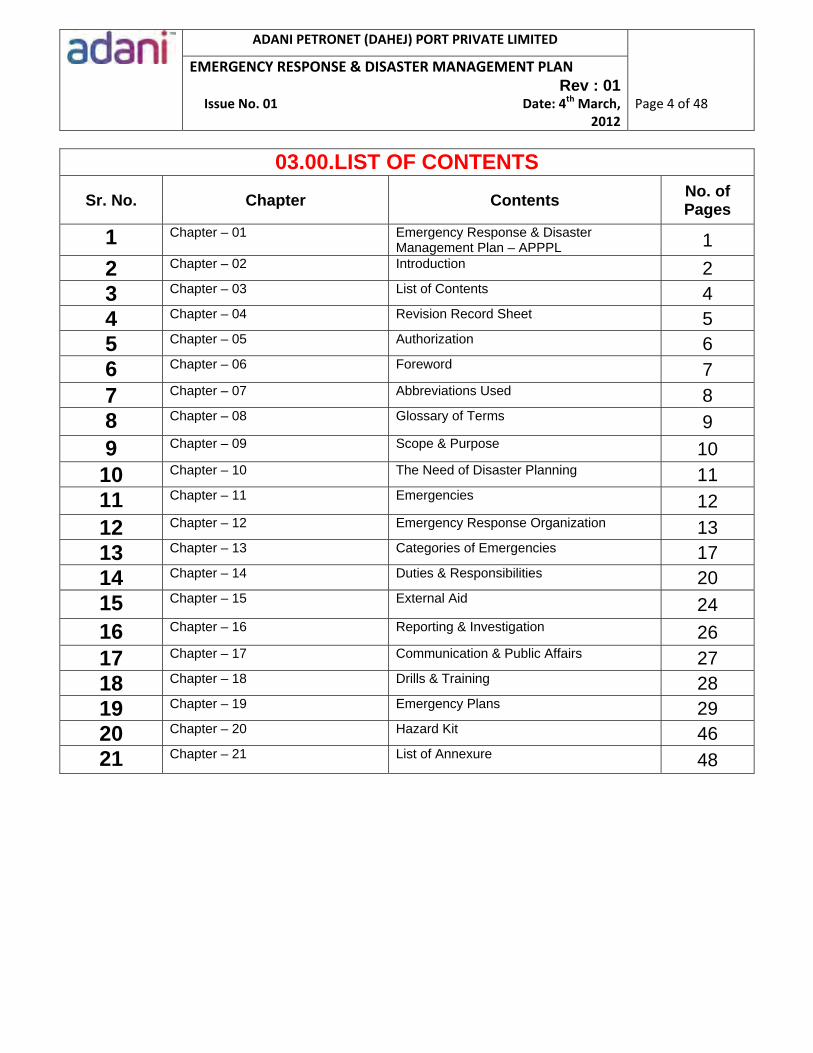
03.00.LIST OF CONTENTS
Sr. No. Chapter ContentsNo. of Pages
1 Chapter – 01 Emergency Response & Disaster Management Plan – APPPL 1
2 Chapter – 02 Introduction 2 3 Chapter – 03 List of Contents 4 4 Chapter – 04 Revision Record Sheet 5 5 Chapter – 05 Authorization 6 6 Chapter – 06 Foreword 7 7 Chapter – 07 Abbreviations Used 8 8 Chapter – 08 Glossary of Terms 9 9 Chapter – 09 Scope & Purpose 10 10 Chapter – 10 The Need of Disaster Planning 11 11 Chapter – 11 Emergencies 12 12 Chapter – 12 Emergency Response Organization 13 13 Chapter – 13 Categories of Emergencies 17 14 Chapter – 14 Duties & Responsibilities 20 15 Chapter – 15 External Aid 24 16 Chapter – 16 Reporting & Investigation 26 17 Chapter – 17 Communication & Public Affairs 27 18 Chapter – 18 Drills & Training 28 19 Chapter – 19 Emergency Plans 29 20 Chapter – 20 Hazard Kit 46 21 Chapter – 21 List of Annexure 48

ADANI PETRONET (DAHEJ) PORT PRIVATE LIMITED
Page 5 of 48
EMERGENCY RESPONSE & DISASTER MANAGEMENT PLAN Rev : 01
Issue No. 01 Date: 4th March, 2012
04.00. REVISION RECORD SHEET
When it becomes necessary to revise contents of this EMMERGENCY RESPONSE & DISASTER MANAGEMENT
PLAN, the issue of a new page will make corrections for the relevant section. The revised page(s) will bear the
revision no. & Date of revision and the same are entered on this revision record sheet and approved by HOD
(QHSE & F).
The recipient should destroy the old page(s) and insert the revised sheets along with this revision record sheet.
Sr. No.
Chapter Section/ Annexure
Page No.
Revision No.
Date of revision
Details of revision Approved By
ADANI PETRONET (DAHEJ) PORT PRIVATE LIMITED
Page 6 of 48
EMERGENCY RESPONSE & DISASTER MANAGEMENT PLAN Rev : 01
Issue No. 01 Date: 4th March, 2012
05.00.AUTHORIZATION
This “EMERGENCY RESPONSE & DISASTER MANAGEMENT PLAN” is the property of Adani Petronet
(Dahej) Port Private Limited and is authorized for use in the APPPL premises.
This copy shall be returned when the holder of this copy ceases to be the authorized recipient of the
“EMERGENCY RESPONSE & DISASTER MANAGEMENT PLAN.”
_______________________________________________________
Operation Head
ADANI PETRONET (DAHEJ) PORT PRIVATE LIMITED
Page 7 of 48
EMERGENCY RESPONSE & DISASTER MANAGEMENT PLAN Rev : 01
Issue No. 01 Date: 4th March, 2012
06.00.FOREWORD The management of Adani Petronet (Dahej) Port Private Limited, referred to as APPPL is committed to the establishment and maintenance of action plans to meet any emergency for the purpose of fulfilling the objectives of occupational health & safety and protection of environment. In order to harmonize the actions during an emergency, a set of guidelines have been identified and included in this plan. Individual departments shall take into account the guidelines given in this plan. The guidelines given in this plan are broadly directional, and nothing in this plan shall restrict the Site Main Controller and/ or Site incident Controller to take additional measures in the interest of safety of men, machine and for the protection of environment.
___________________________ HOD (QHSE & FIRE)

ADANI PETRONET (DAHEJ) PORT PRIVATE LIMITED
Page 8 of 48
EMERGENCY RESPONSE & DISASTER MANAGEMENT PLAN Rev : 01
Issue No. 01 Date: 4th March, 2012
07.00.ABBREAVIATIONS USED APPPL : ADANI PETRONET PORT PRIVATE LIMITED
Dept. : Department
GM : General Manager
HOD : Head of Department
HOS : Head of Section
QHSE & F : Quality, Health, Safety, Environment & Fire
ES : Engineering Services
GPCB : Gujarat Pollution Control Board
GMB : Gujarat Maritime Board
ICG : Indian Coast Guards
GEN. : General
PROC. : Procedure
Govt. : Government
OSY : Open Stack Yard
CG : Close Go-down
Ex. : Example
ER & DMP : Emergency Response & Disaster Management Plan
P & A : Planning & Allocation
R & D : Research & Development
POC : Port Operation Control
Cont. : Continue
PRO : Public Relation Officer
HR : Human Resources
SCBA : Self Contained Breathing Apparatus
PPE’s : Personal Protective Equipments
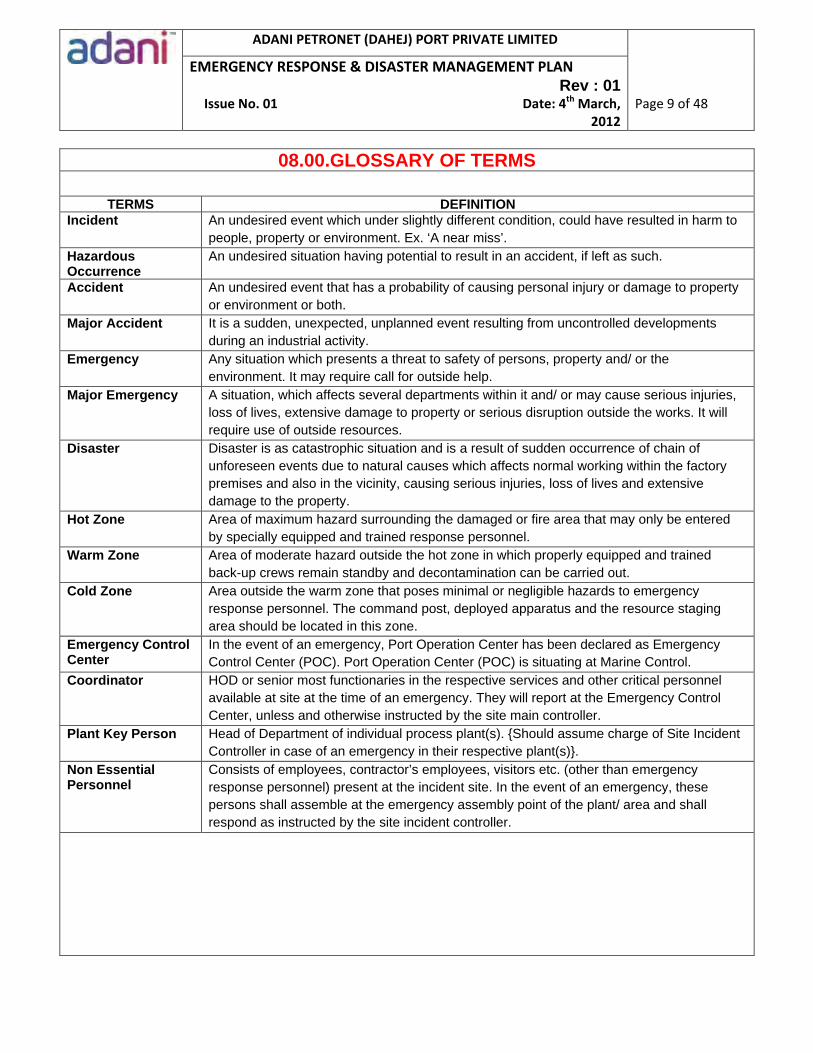
ADANI PETRONET (DAHEJ) PORT PRIVATE LIMITED
Page 9 of 48
EMERGENCY RESPONSE & DISASTER MANAGEMENT PLAN Rev : 01
Issue No. 01 Date: 4th March, 2012
08.00.GLOSSARY OF TERMS
TERMS DEFINITIONIncident An undesired event which under slightly different condition, could have resulted in harm to
people, property or environment. Ex. ‘A near miss’. Hazardous Occurrence
An undesired situation having potential to result in an accident, if left as such.
Accident An undesired event that has a probability of causing personal injury or damage to property or environment or both.
Major Accident It is a sudden, unexpected, unplanned event resulting from uncontrolled developments during an industrial activity.
Emergency Any situation which presents a threat to safety of persons, property and/ or the environment. It may require call for outside help.
Major Emergency A situation, which affects several departments within it and/ or may cause serious injuries, loss of lives, extensive damage to property or serious disruption outside the works. It will require use of outside resources.
Disaster Disaster is as catastrophic situation and is a result of sudden occurrence of chain of unforeseen events due to natural causes which affects normal working within the factory premises and also in the vicinity, causing serious injuries, loss of lives and extensive damage to the property.
Hot Zone Area of maximum hazard surrounding the damaged or fire area that may only be entered by specially equipped and trained response personnel.
Warm Zone Area of moderate hazard outside the hot zone in which properly equipped and trained back-up crews remain standby and decontamination can be carried out.
Cold Zone Area outside the warm zone that poses minimal or negligible hazards to emergency response personnel. The command post, deployed apparatus and the resource staging area should be located in this zone.
Emergency Control Center
In the event of an emergency, Port Operation Center has been declared as Emergency Control Center (POC). Port Operation Center (POC) is situating at Marine Control.
Coordinator HOD or senior most functionaries in the respective services and other critical personnel available at site at the time of an emergency. They will report at the Emergency Control Center, unless and otherwise instructed by the site main controller.
Plant Key Person Head of Department of individual process plant(s). {Should assume charge of Site Incident Controller in case of an emergency in their respective plant(s)}.
Non Essential Personnel
Consists of employees, contractor’s employees, visitors etc. (other than emergency response personnel) present at the incident site. In the event of an emergency, these persons shall assemble at the emergency assembly point of the plant/ area and shall respond as instructed by the site incident controller.

ADANI PETRONET (DAHEJ) PORT PRIVATE LIMITED
Page 10 of 48
EMERGENCY RESPONSE & DISASTER MANAGEMENT PLAN Rev : 01
Issue No. 01 Date: 4th March, 2012
09.00.SCOPE & PURPOSE
09.01.SCOPE The very purpose of this plan is to activate the emergency response organization smoothly and effectively, once the
emergency is declared. The plan details the arrangements for responding to emergency scenarios, covering in
details the following aspects:
To assess and define emergency including level of risk.
To contain the incident and bring it under control.
To coordinate with mutual aid members and Government authorities.
To minimize damage to lives, property and the environment.
To rescue and evacuate workers to safe areas.
To provide necessary assistance to casualties.
09.02.PURPOSE The purpose of this plan is to:
Establish & define roles of coordinators, key personnel and other emergency response personnel.
Establish guidelines for effective response to any emergency.
Ensure a smooth interface between various emergency procedures and the APPPL Emergency Action
Plan.
For this plan to be effective, it is necessary that:
Coordinators, key personnel and other emergency response personnel are familiarized with this action
plan.
On-site resources are mobilized in minimum time.
Assistance from outside agencies is readily available.
The drills for identified emergencies are regularly exercised.
The emergency responses are reviewed and updated based on latest developments, other information and
requirements in order to improve effectiveness of the APPPL-ER & DMP.
ADANI PETRONET (DAHEJ) PORT PRIVATE LIMITED
Page 11 of 48
EMERGENCY RESPONSE & DISASTER MANAGEMENT PLAN Rev : 01
Issue No. 01 Date: 4th March, 2012
10.00.THE NEED OF DISASTER PLANNING AT APPPL
Disaster and APPPL :
A major emergency in Port is one, which has the potential to cause serious injury or loss of life. It may cause
extensive damage to property and serious disruption both inside and outside the port. Sometimes, it would require
the assistance of outside emergency services to handle it effectively. Although an emergency may be caused by a
number of different factors, viz. plant failure, human error, earthquake, Cyclone, flood, vessel collide, vehicle clash,
major spillage or sabotage, it will normally manifest itself in two basic forms viz. - Fire, Explosion.
Need of Disaster Planning :
In spite of universal acceptance of excellent codes of practices for design and operation of plants and storage,
there have been occurrences of a number of losses due to major accidents of varying degree of severity. In fact, no
industrial plant or office and no commercial or mercantile organization can be totally immune from disaster. These
disasters could be attributed to various causes including failure of adherence to codes of practice.
The first few minutes after an emergency situation occurs are generally the most critical. The wrong action or a few
seconds delayed action in crises can make all the difference. A quick and effective response at that time can have
tremendous significance on whether the situation is controlled with little loss or whether it turns into a disaster.
Contingency planning increases thinking accuracy and reduces thinking time in an emergency, which reduces loss.
The effectiveness of what we should do if disaster strikes will depend upon how well we have prepared the
contingency plans and trained the people who will have to implement them. Even if the plans generated and
equipment provided are never used, the very fact that the plans have been developed and equipment have been
provided creates confidence among employees and from an economic point, may reduce the insurance rates.
The Social and legal consequences of “Bhopal” Gas Tragedy have sufficiently demonstrated that these
considerations alone are important enough to persuade management of hazardous plants to develop suitable
plans.
Thus disaster is a situation generally arising with little or no warning and causing or threatening death, injury or
serious disruption to people and services which cannot be controlled, by fire, police and services operating alone.
The incident will require special mobilization and co-operation of other bodies and voluntary organization.
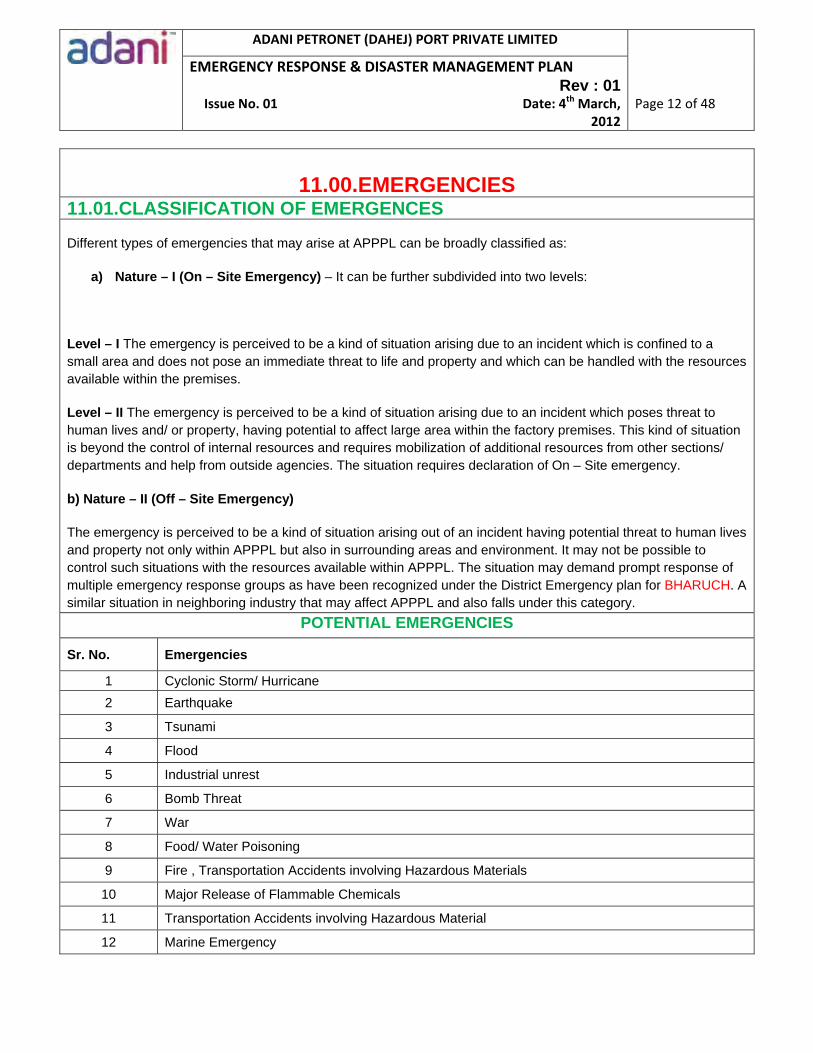
ADANI PETRONET (DAHEJ) PORT PRIVATE LIMITED
Page 12 of 48
EMERGENCY RESPONSE & DISASTER MANAGEMENT PLAN Rev : 01
Issue No. 01 Date: 4th March, 2012
11.00.EMERGENCIES
11.01.CLASSIFICATION OF EMERGENCES
Different types of emergencies that may arise at APPPL can be broadly classified as:
a) Nature – I (On – Site Emergency) – It can be further subdivided into two levels:
Level – I The emergency is perceived to be a kind of situation arising due to an incident which is confined to a small area and does not pose an immediate threat to life and property and which can be handled with the resources available within the premises.
Level – II The emergency is perceived to be a kind of situation arising due to an incident which poses threat to human lives and/ or property, having potential to affect large area within the factory premises. This kind of situation is beyond the control of internal resources and requires mobilization of additional resources from other sections/ departments and help from outside agencies. The situation requires declaration of On – Site emergency.
b) Nature – II (Off – Site Emergency)
The emergency is perceived to be a kind of situation arising out of an incident having potential threat to human lives and property not only within APPPL but also in surrounding areas and environment. It may not be possible to control such situations with the resources available within APPPL. The situation may demand prompt response of multiple emergency response groups as have been recognized under the District Emergency plan for BHARUCH. A similar situation in neighboring industry that may affect APPPL and also falls under this category.
POTENTIAL EMERGENCIES
Sr. No. Emergencies
1 Cyclonic Storm/ Hurricane 2 Earthquake
3 Tsunami
4 Flood
5 Industrial unrest
6 Bomb Threat
7 War
8 Food/ Water Poisoning
9 Fire , Transportation Accidents involving Hazardous Materials
10 Major Release of Flammable Chemicals
11 Transportation Accidents involving Hazardous Material
12 Marine Emergency
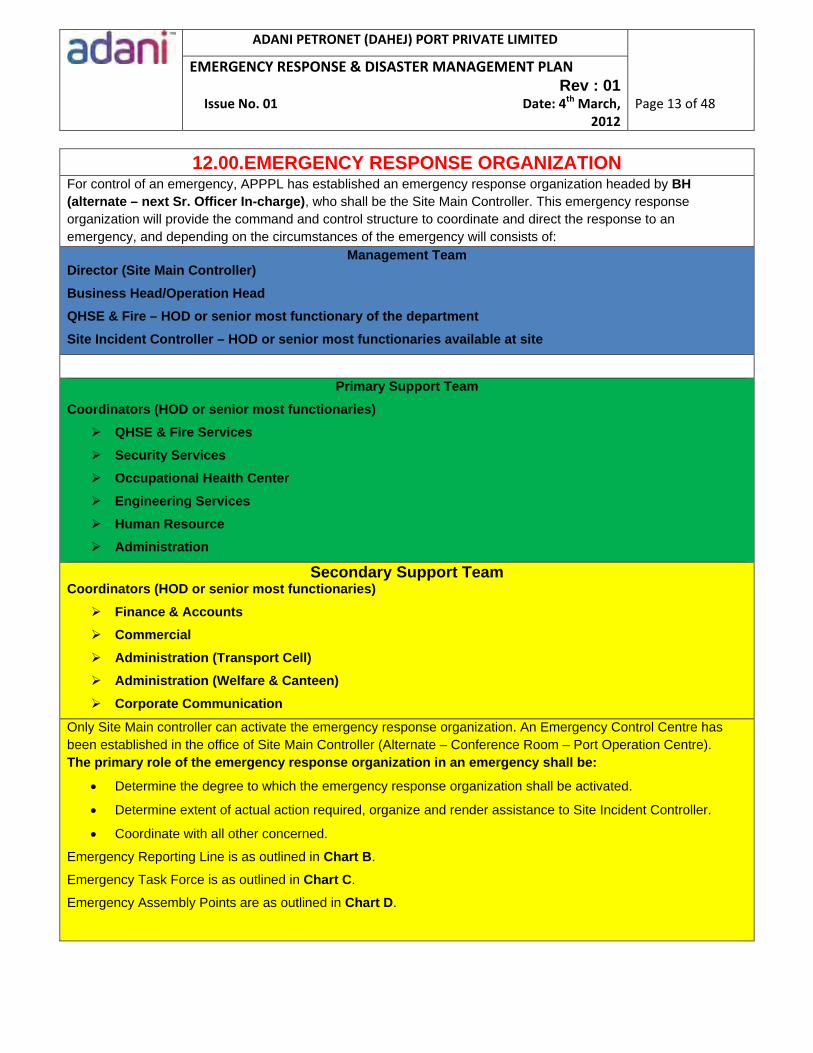
ADANI PETRONET (DAHEJ) PORT PRIVATE LIMITED
Page 13 of 48
EMERGENCY RESPONSE & DISASTER MANAGEMENT PLAN Rev : 01
Issue No. 01 Date: 4th March, 2012
12.00.EMERGENCY RESPONSE ORGANIZATION For control of an emergency, APPPL has established an emergency response organization headed by BH (alternate – next Sr. Officer In-charge), who shall be the Site Main Controller. This emergency response organization will provide the command and control structure to coordinate and direct the response to an emergency, and depending on the circumstances of the emergency will consists of:
Management Team Director (Site Main Controller)
Business Head/Operation Head
QHSE & Fire – HOD or senior most functionary of the department
Site Incident Controller – HOD or senior most functionaries available at site
Primary Support Team
Coordinators (HOD or senior most functionaries)
QHSE & Fire Services
Security Services
Occupational Health Center
Engineering Services
Human Resource
Administration
Secondary Support Team Coordinators (HOD or senior most functionaries)
Finance & Accounts
Commercial
Administration (Transport Cell)
Administration (Welfare & Canteen)
Corporate Communication
Only Site Main controller can activate the emergency response organization. An Emergency Control Centre has been established in the office of Site Main Controller (Alternate – Conference Room – Port Operation Centre). The primary role of the emergency response organization in an emergency shall be:
Determine the degree to which the emergency response organization shall be activated.
Determine extent of actual action required, organize and render assistance to Site Incident Controller.
Coordinate with all other concerned.
Emergency Reporting Line is as outlined in Chart B.
Emergency Task Force is as outlined in Chart C.
Emergency Assembly Points are as outlined in Chart D.
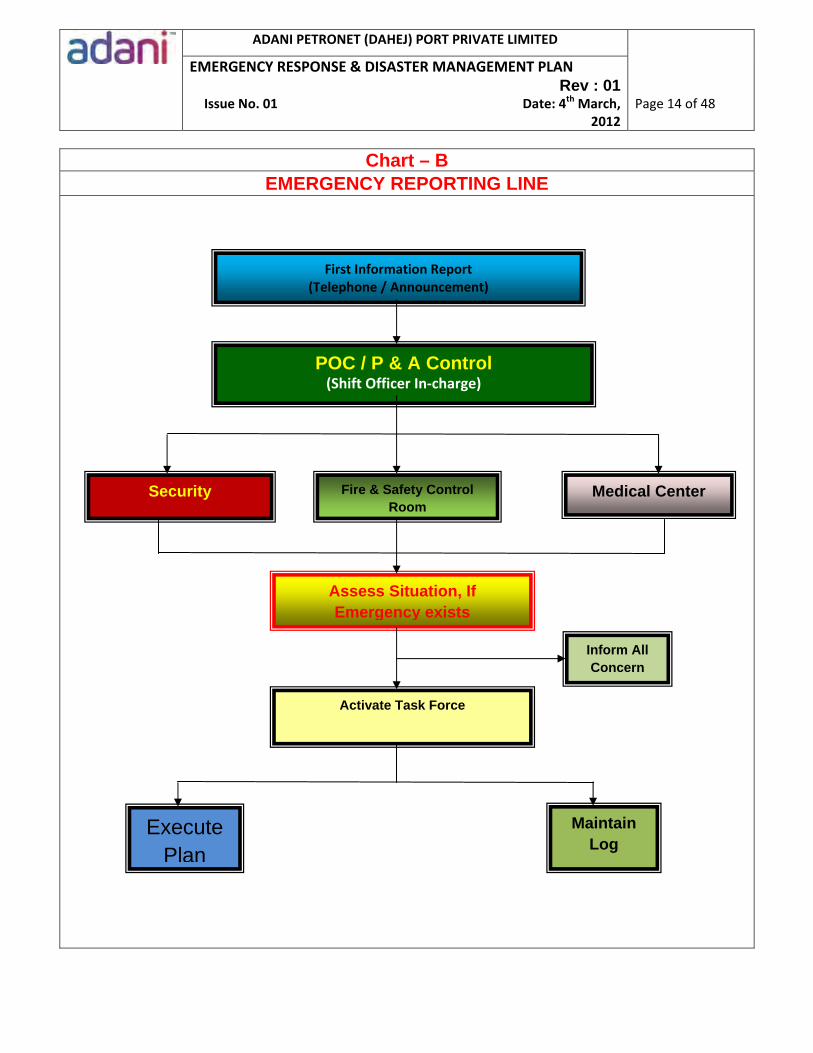
ADANI PETRONET (DAHEJ) PORT PRIVATE LIMITED
Page 14 of 48
EMERGENCY RESPONSE & DISASTER MANAGEMENT PLAN Rev : 01
Issue No. 01 Date: 4th March, 2012
Chart – B
EMERGENCY REPORTING LINE
First Information Report (Telephone / Announcement)
POC / P & A Control (Shift Officer In‐charge)
Security Fire & Safety Control Room
Medical Center
Maintain Log
Activate Task Force
Inform All Concern
Execute Plan
Assess Situation, If Emergency exists
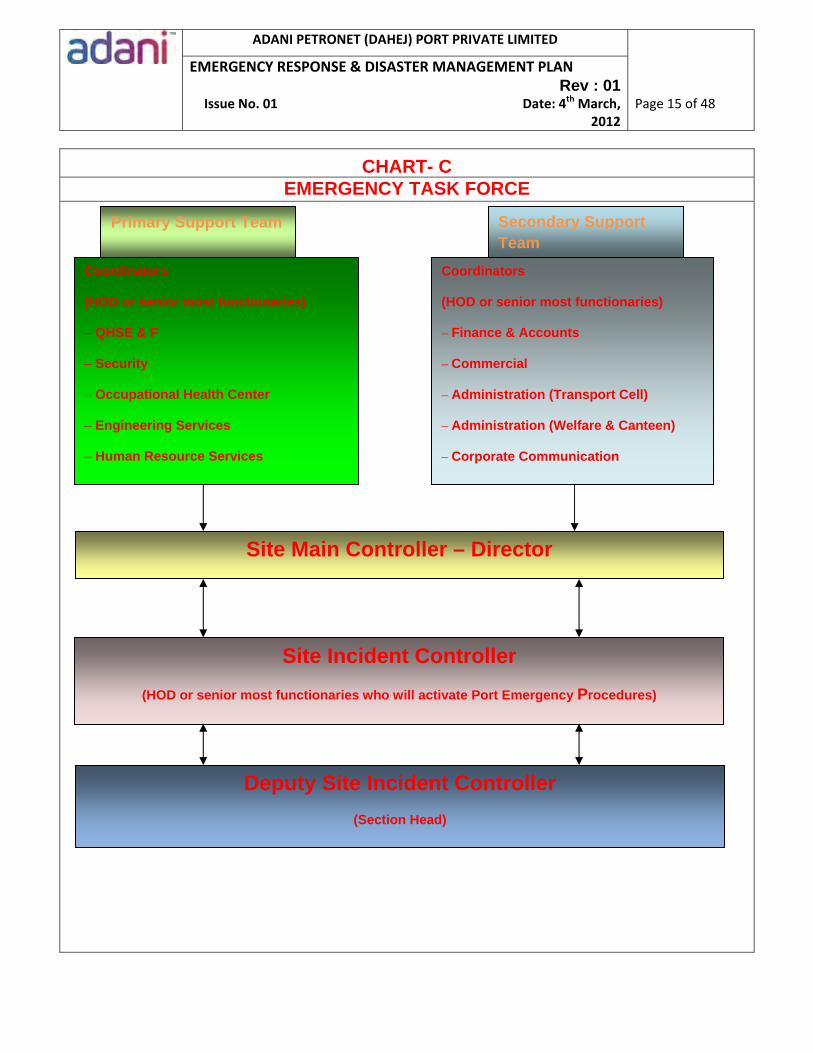
ADANI PETRONET (DAHEJ) PORT PRIVATE LIMITED
Page 15 of 48
EMERGENCY RESPONSE & DISASTER MANAGEMENT PLAN Rev : 01
Issue No. 01 Date: 4th March, 2012
CHART- C EMERGENCY TASK FORCE
Primary Support Team Secondary Support Team
Coordinators
(HOD or senior most functionaries)
– QHSE & F
– Security
– Occupational Health Center
– Engineering Services
– Human Resource Services
Coordinators
(HOD or senior most functionaries)
– Finance & Accounts
– Commercial
– Administration (Transport Cell)
– Administration (Welfare & Canteen)
– Corporate Communication
Site Main Controller – Director
Site Incident Controller
(HOD or senior most functionaries who will activate Port Emergency Procedures)
Deputy Site Incident Controller
(Section Head)
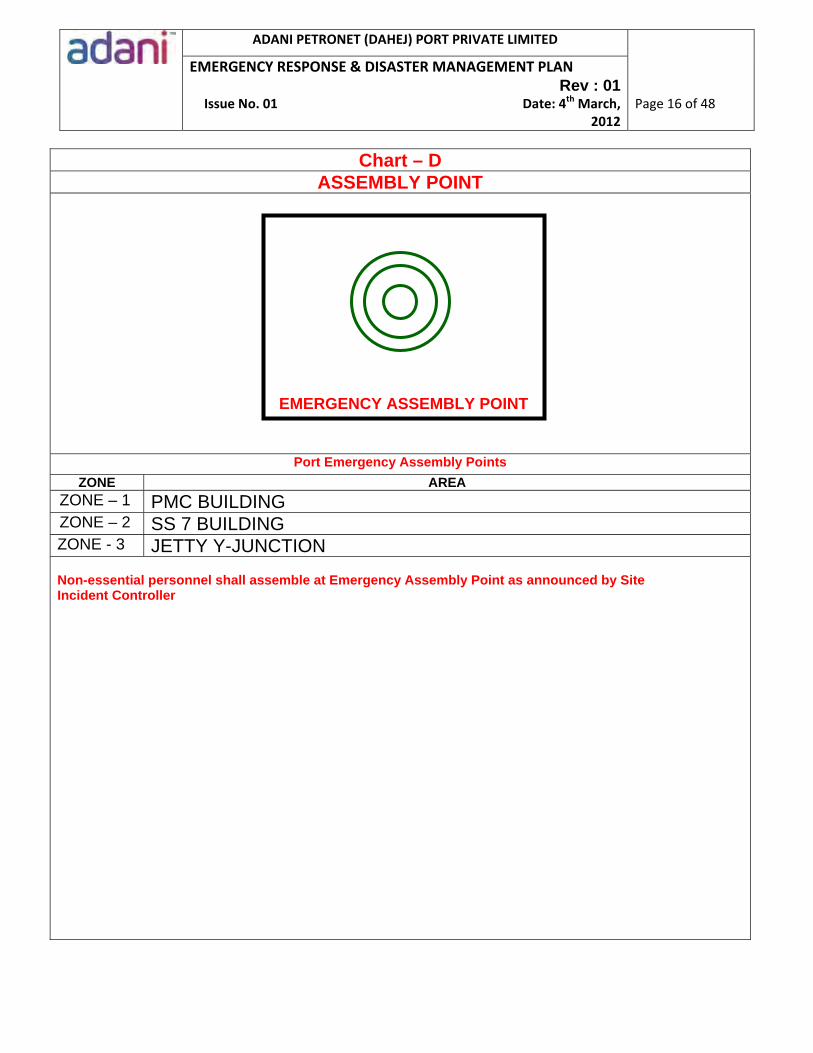
ADANI PETRONET (DAHEJ) PORT PRIVATE LIMITED
Page 16 of 48
EMERGENCY RESPONSE & DISASTER MANAGEMENT PLAN Rev : 01
Issue No. 01 Date: 4th March, 2012
Chart – DASSEMBLY POINT
Port Emergency Assembly Points
ZONE AREAZONE – 1 PMC BUILDING ZONE – 2 SS 7 BUILDING ZONE - 3 JETTY Y-JUNCTION Non-essential personnel shall assemble at Emergency Assembly Point as announced by Site Incident Controller
EMERGENCY ASSEMBLY POINT
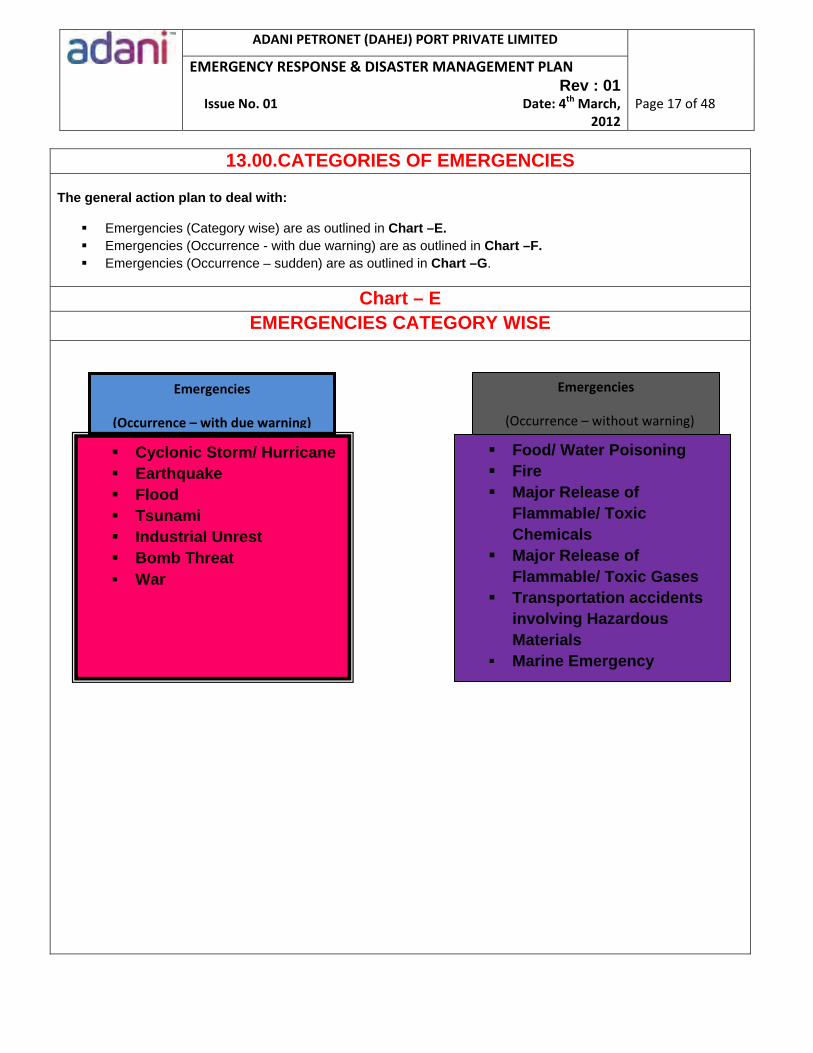
ADANI PETRONET (DAHEJ) PORT PRIVATE LIMITED
Page 17 of 48
EMERGENCY RESPONSE & DISASTER MANAGEMENT PLAN Rev : 01
Issue No. 01 Date: 4th March, 2012
13.00.CATEGORIES OF EMERGENCIES
The general action plan to deal with:
Emergencies (Category wise) are as outlined in Chart –E. Emergencies (Occurrence - with due warning) are as outlined in Chart –F. Emergencies (Occurrence – sudden) are as outlined in Chart –G.
Chart – E
EMERGENCIES CATEGORY WISE
Emergencies
(Occurrence – with due warning)
Emergencies
(Occurrence – without warning)
Cyclonic Storm/ Hurricane Earthquake Flood Tsunami Industrial Unrest Bomb Threat War
Food/ Water Poisoning Fire Major Release of
Flammable/ Toxic Chemicals
Major Release of Flammable/ Toxic Gases
Transportation accidents involving Hazardous Materials
Marine Emergency
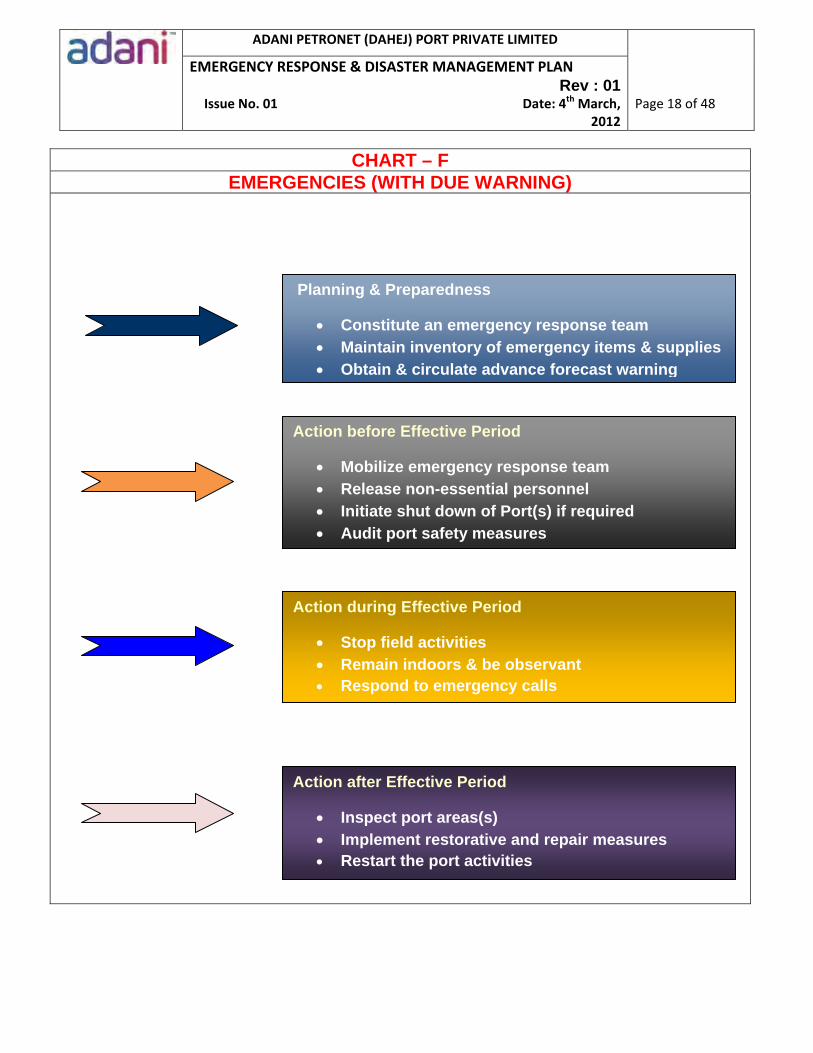
ADANI PETRONET (DAHEJ) PORT PRIVATE LIMITED
Page 18 of 48
EMERGENCY RESPONSE & DISASTER MANAGEMENT PLAN Rev : 01
Issue No. 01 Date: 4th March, 2012
CHART – F EMERGENCIES (WITH DUE WARNING)
Planning & Preparedness
Constitute an emergency response team Maintain inventory of emergency items & supplies Obtain & circulate advance forecast warning
Action before Effective Period
Mobilize emergency response team Release non-essential personnel Initiate shut down of Port(s) if required Audit port safety measures
Action during Effective Period
Stop field activities Remain indoors & be observant Respond to emergency calls
Action after Effective Period
Inspect port areas(s) Implement restorative and repair measures Restart the port activities
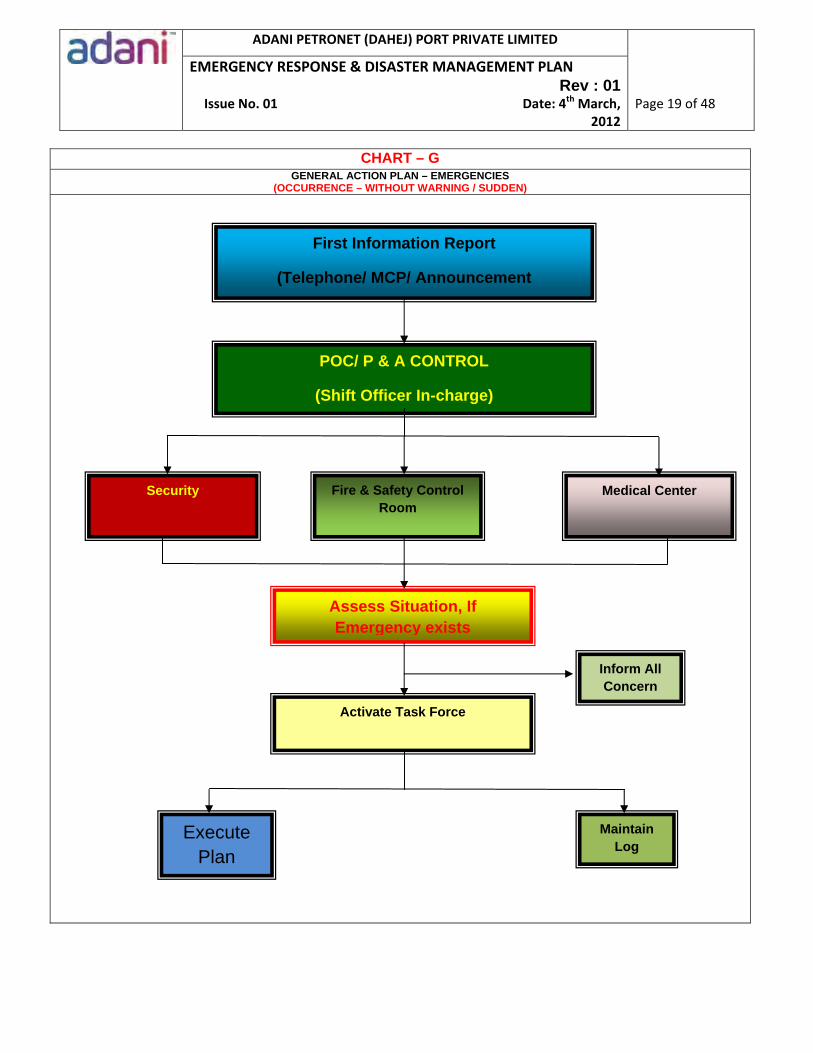
ADANI PETRONET (DAHEJ) PORT PRIVATE LIMITED
Page 19 of 48
EMERGENCY RESPONSE & DISASTER MANAGEMENT PLAN Rev : 01
Issue No. 01 Date: 4th March, 2012
CHART – GGENERAL ACTION PLAN – EMERGENCIES
(OCCURRENCE – WITHOUT WARNING / SUDDEN)
First Information Report
(Telephone/ MCP/ Announcement
POC/ P & A CONTROL
(Shift Officer In-charge)
Security Fire & Safety Control Room
Medical Center
Maintain Log
Activate Task Force
Inform All Concern
Execute Plan
Assess Situation, If Emergency exists
ADANI PETRONET (DAHEJ) PORT PRIVATE LIMITED
Page 20 of 48
EMERGENCY RESPONSE & DISASTER MANAGEMENT PLAN Rev : 01
Issue No. 01 Date: 4th March, 2012
14.00.DUTIES & RESPONSIBILITIES 14.01.Site Main Controller :
Has overall responsibility for the conduct of all emergency operations within the port complex.
Shall immediately assess the situation plus its consequences, formally declare the level of emergency and
order appropriate action.
Shall direct all emergency operations within the port premises with the following priority:
Safety of personnel, property and equipment
Pollution and environmental impact control
Damage and loss control
Minimum curtailment of port activities
Shall ensure all possible assistance to personnel affected for medical attention and hospitalization as
appropriate.
Shall ensure that all local and statutory authorities are kept advised of the facts and status.
Shall ensure that normalcy is declared only when considered absolutely safe to do so.
Shall be responsible for making available all possible company resources for emergency operations within
APPPL, if required; request the appropriate Government Authority or “Mutual Aid” organization.
14.02.Site Incident Controller
hall immediately assess the scale of emergency and report to Site Main Controller for instructions/directions.
Shall be responsible for operations in affected area with priorities as under:
Safety of personnel, property and equipment
Pollution and environmental impact control
Damage and loss control
Minimum curtailment of port activities
Shall liaise with other heads of department for their support and assistance.
Shall ensure continual reporting of situation to Site Main Controller and shall recommend calling for external resources as appropriate.
ADANI PETRONET (DAHEJ) PORT PRIVATE LIMITED
Page 21 of 48
EMERGENCY RESPONSE & DISASTER MANAGEMENT PLAN Rev : 01
Issue No. 01 Date: 4th March, 2012
14.03.Emergency Support Officers Shall report to Site Incident Controller immediately and assist him as required (all possible portable
emergency equipment, resources and personnel to incident location). Shall liaise closely with Head- Administration to facilitate the transfer of equipment, resources and personnel
to incident location as appropriate. Shall carefully evaluate the risks, effects and possible consequences of: The incident to his area of responsibility and propose further course of action to the Site Incident Controller
with particular concern about safety of personnel, protection of environment and control of operation.
14.04.HOD – HR & Administration (Transport Cell, Welfare & Canteen)
Shall report to Site Incident Controller immediately and assist him as directed. Shall coordinate the activities of administration units. Shall inform and liaise with local bodies and authorities and police department in respect of the incident/
emergency. Shall arrange for transportation of whatever nature for use in the situation. Shall ensure that internal and external communication systems are available. Arrange for hot drinks / snacks / foods as requires at incident location. Shall arrange for assistance, if required from the “Mutual Aid” system if available and as directed by
Incident Controller.
14.05.HOD – Human Resources
Shall report immediately to Site Incident Controller and assist him as directed. Shall ensure Assembly Points are manned and all persons reporting there properly identified. Shall arrange to record full details of all persons affected by the incident and to inform next of kin as
appropriate. Shall arrange for the transfer of all affected persons to suitable places for first aid or further medical attention
as appropriate. Shall arrange for the evacuation, from the location of incident of all personnel not essential. Shall arrange to depute company personnel to each location where affected persons are being treated or
are gathered for whatever reasons, to render assistance. Shall arrange to keep regularly informed of status and facts pertaining to incident to the families of company
personal in its residential area. Shall inform to Government Authorities (DISH, GPCB etc.) Ligning with Government Authorities (DISH, GPCB etc.)
14.06.HOD – Corporate Affairs
Shall report immediately to Site Incident Controller and assist him as directed. Shall assume the role of Public Relation Officer (PRO) for communication, dissemination of information,
status and facts (preparation of communiqués, statements etc.) Shall co-ordinate with business related statutory and Government organization.
ADANI PETRONET (DAHEJ) PORT PRIVATE LIMITED
Page 22 of 48
EMERGENCY RESPONSE & DISASTER MANAGEMENT PLAN Rev : 01
Issue No. 01 Date: 4th March, 2012
14.07.HOD – Engineering Services Shall report immediately to Site Incident Controller and assist him as directed. Shall ensure activation of departmental damage limitation activities. Shall ensure immediate electrical isolation of the incident location thereafter; arrange availability of power
after ascertaining safety of doing so. Shall make available all support that may be possible for the extrication/ evacuation of persons from the
affected area. Shall liaise with the Engineering Services of organizations in close neighborhood for sourcing of
supplemental equipment resources and assistance. Shall depute all available personnel to assist administration department.
14.08.HOD – Commercial Ensure availability of materials required by the Site Incident Controller. Issue materials from central stores round-the-clock (if required). Arrange emergency procurements from local dealers/ vendors or from neighboring industries. Arrange transportation of materials from central stores to the site of incident in coordination with the
Coordinator (Transport Cell). 14.09.HOD – Finance & Accounts
Shall report immediately to Site Incident Controller and assist him as directed. Shall ensure availability of funds and cash for all emergent requirements. Shall depute all available department personnel to assist HR in their activities. Shall ensure that under writers, shareholders, lenders, bankers and other Financial Institutions and statutory
bodies are kept advised of the situation as appropriate. 14.10.HOD – Security
Close the visitors’ gate. Instruct the security to occupy pre-determined post for controlling security of installation. Call up additional help from Barracks. Ensure that unauthorized persons / vehicles do not enter the gate. Provide security men for firefighting & rescue. Arrange for transport of higher authorities to the terminal. Transport vehicles would be provided near emergency control center. Depute two security guards for controlling traffic at scene of disaster. Produce a list of port staff on duty in co-ordination with time office. Ensure availability of security men at gates so that they can lead authorities to disaster site. Ensure that non-essential persons do not crowd affected area.
14.11.Executive – Fire Services
He will report to Site Incident Controller and has the single motive – concern for safety of personnel during emergency response operations. He will normally function as an advisor to the Site Incident Controller.
He will not be directing any activity, issuing or relaying orders/ information.
ADANI PETRONET (DAHEJ) PORT PRIVATE LIMITED
Page 23 of 48
EMERGENCY RESPONSE & DISASTER MANAGEMENT PLAN Rev : 01
Issue No. 01 Date: 4th March, 2012
14.12.HOD – Safety
Report at Emergency Control Center and assist Site Main Controller with necessary information, support and resources.
Mobilize off-duty personnel for assistance. Coordinate with the Coordinator – Commercial to mobilize additional resources, viz. spill containment
equipment/ firefighting equipment/ personal protective equipment, spare breathing air cylinders etc., as may be required at the site of incident.
14.13. Medical Officer – Occupational Health Center
Contact Site Main Controller. Report at Emergency Control Center or at Occupational Health Center as instructed by the Site Main Controller.
Organize first aid arrangements for the affected persons at the site of incident (cold zone) as may be necessary.
Ensure that adequate paramedical staff, equipment and medicines are available at the Occupational Health Center. Mobilize additional resources (if necessary).
Liaise with the local medical authorities and city hospitals, if the casualties are high and situation demands external medical help.
Coordinate with the Coordinator - Transport for transporting victims to various hospitals.
ADANI PETRONET (DAHEJ) PORT PRIVATE LIMITED
Page 24 of 48
EMERGENCY RESPONSE & DISASTER MANAGEMENT PLAN Rev : 01
Issue No. 01 Date: 4th March, 2012
15.00.EXTERNAL AID
15.01.General
In case of an emergency, which poses threat to human lives or/ and property, within APPPL as well as in the surrounding neighborhood areas, it may not be possible to control such situations with the resources available at APPPL. In such situations, additional resources are mobilized from other agencies, which include:
Neighboring Industries (Mutual Aid Members)
Government Authorities
External Aid Providers are as outlined in Chart H
15.02.Mutual Aid Members
Adani Petronet Port will enter into an agreement for mutual aid with Petronet LNG & GCPTCL for help/ assistance in the event of an emergency. The mutual aid members shall:
Respond promptly to the emergency call as and when communicated.
Send their fire tenders/ crewmembers along with necessary supplies/ materials at the site of incident (as requested) and report at the APPPL Security Gate and get instructions from security personnel on duty. These resources and personnel shall be deployed as directed by Site Incident Controller.
The crew in–charges of the mutual aid members shall be responsible for safety of their crew engaged in emergency operations.
15.03.Government Authorities If the situation demands response from multiple groups / teams, APPPL may seek assistance from various Government Authorities as have been recognized under the District Disaster Management Plan. These may include:
District Collector Fire Brigade (Bharuch) Police Commissioner Gujarat Pollution Control Board (GPCB) Gujarat Maritime Board (GMB) Indian Coast Guards (ICG) Indian Navy Immigration & Customs Coastal Security
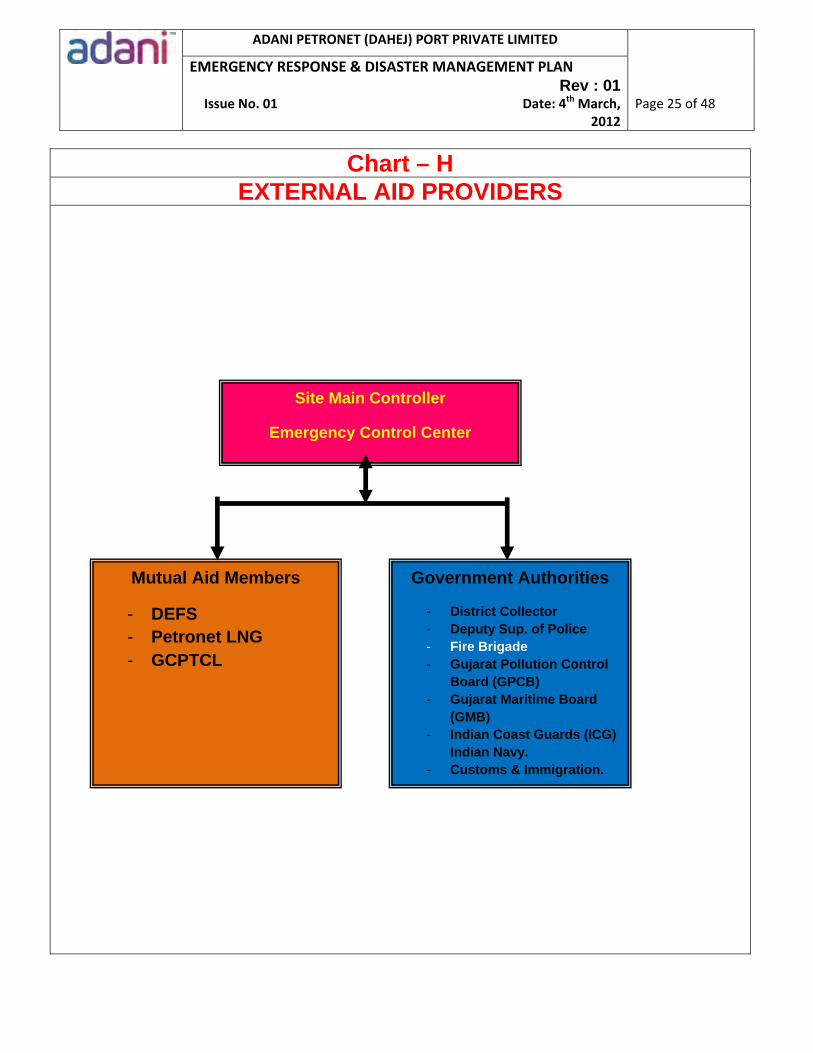
ADANI PETRONET (DAHEJ) PORT PRIVATE LIMITED
Page 25 of 48
EMERGENCY RESPONSE & DISASTER MANAGEMENT PLAN Rev : 01
Issue No. 01 Date: 4th March, 2012
Chart – H EXTERNAL AID PROVIDERS
Site Main Controller
Emergency Control Center
Mutual Aid Members
- DEFS - Petronet LNG - GCPTCL
Government Authorities
- District Collector - Deputy Sup. of Police - Fire Brigade - Gujarat Pollution Control
Board (GPCB) - Gujarat Maritime Board
(GMB) - Indian Coast Guards (ICG) Indian Navy. - Customs & Immigration.
ADANI PETRONET (DAHEJ) PORT PRIVATE LIMITED
Page 26 of 48
EMERGENCY RESPONSE & DISASTER MANAGEMENT PLAN Rev : 01
Issue No. 01 Date: 4th March, 2012
16.00.REPORTING & INVESTIGATION16.01.Reporting
Any incident / accident (whether minor or major) shall be reported. The main objective of incident reporting is to:
Provide first-hand information to all the concerned Initiate investigation Prepare failure analysis report Report to the Government authorities (if required)
References
Procedure for Incident Reporting Incident Report Format Work Injury Report
16.02.Investigation All incidents / accidents (whether minor or major) shall be investigated. The main objectives of incident investigation are to:
Identify the root cause(s) of the incident. Take appropriate preventive measures to prevent recurrence. To comply with the statutory requirements.
References
Incident Investigation Procedure
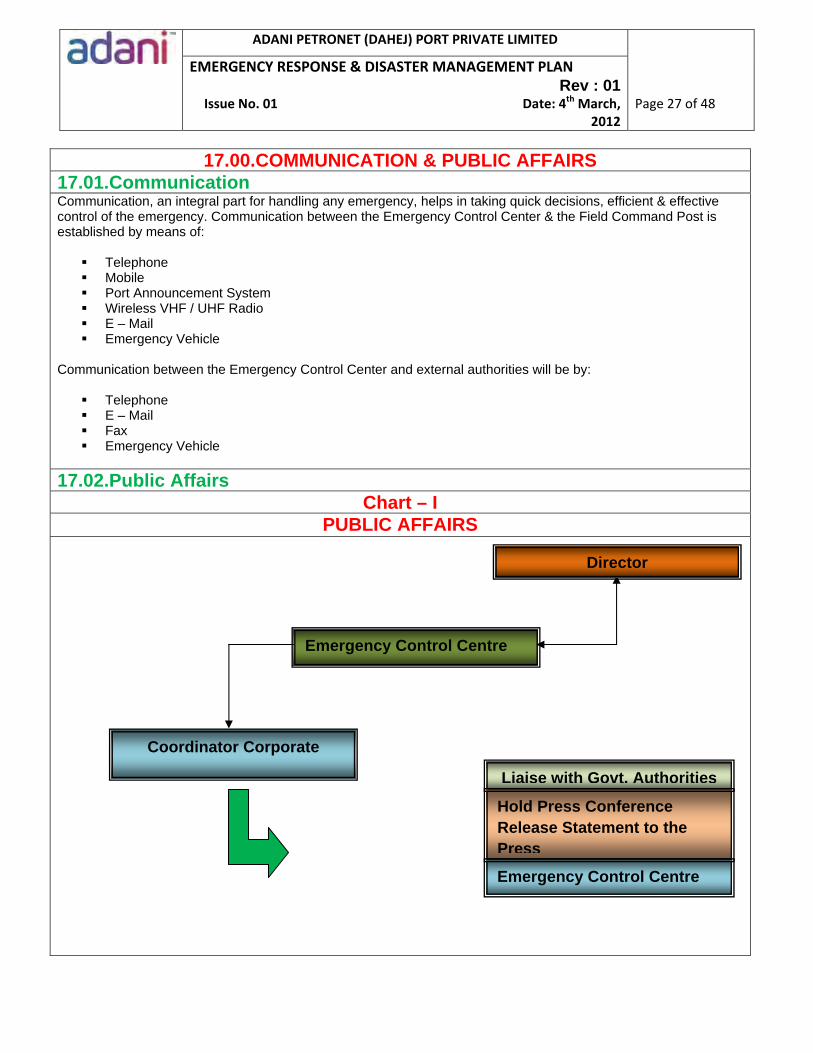
ADANI PETRONET (DAHEJ) PORT PRIVATE LIMITED
Page 27 of 48
EMERGENCY RESPONSE & DISASTER MANAGEMENT PLAN Rev : 01
Issue No. 01 Date: 4th March, 2012
17.00.COMMUNICATION & PUBLIC AFFAIRS 17.01.Communication Communication, an integral part for handling any emergency, helps in taking quick decisions, efficient & effective control of the emergency. Communication between the Emergency Control Center & the Field Command Post is established by means of:
Telephone Mobile Port Announcement System Wireless VHF / UHF Radio E – Mail Emergency Vehicle
Communication between the Emergency Control Center and external authorities will be by:
Telephone E – Mail Fax Emergency Vehicle
17.02.Public Affairs Chart – I
PUBLIC AFFAIRS
Coordinator Corporate
Emergency Control Centre
Liaise with Govt. Authorities
Hold Press Conference Release Statement to the Press
Emergency Control Centre
Director
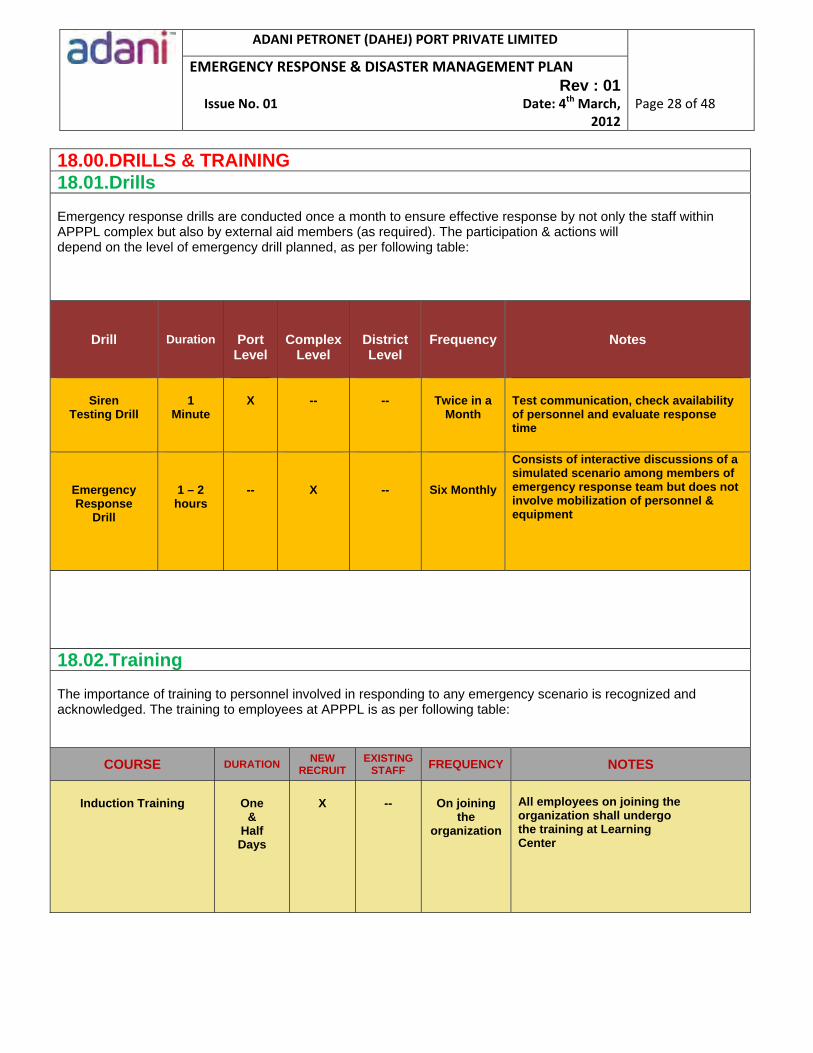
ADANI PETRONET (DAHEJ) PORT PRIVATE LIMITED
Page 28 of 48
EMERGENCY RESPONSE & DISASTER MANAGEMENT PLAN Rev : 01
Issue No. 01 Date: 4th March, 2012
18.00.DRILLS & TRAINING 18.01.Drills Emergency response drills are conducted once a month to ensure effective response by not only the staff within APPPL complex but also by external aid members (as required). The participation & actions will depend on the level of emergency drill planned, as per following table:
Drill
Duration
Port Level
Complex
Level
District Level
Frequency
Notes
Siren
Testing Drill
1
Minute
X
--
--
Twice in a
Month
Test communication, check availability of personnel and evaluate response time
Emergency Response
Drill
1 – 2 hours
--
X
--
Six Monthly
Consists of interactive discussions of a simulated scenario among members of emergency response team but does not involve mobilization of personnel & equipment
18.02.Training The importance of training to personnel involved in responding to any emergency scenario is recognized and acknowledged. The training to employees at APPPL is as per following table:
COURSE DURATION NEW
RECRUIT EXISTING
STAFF FREQUENCY NOTES
Induction Training
One
& Half Days
X
--
On joining
the organization
All employees on joining the organization shall undergo the training at Learning Center
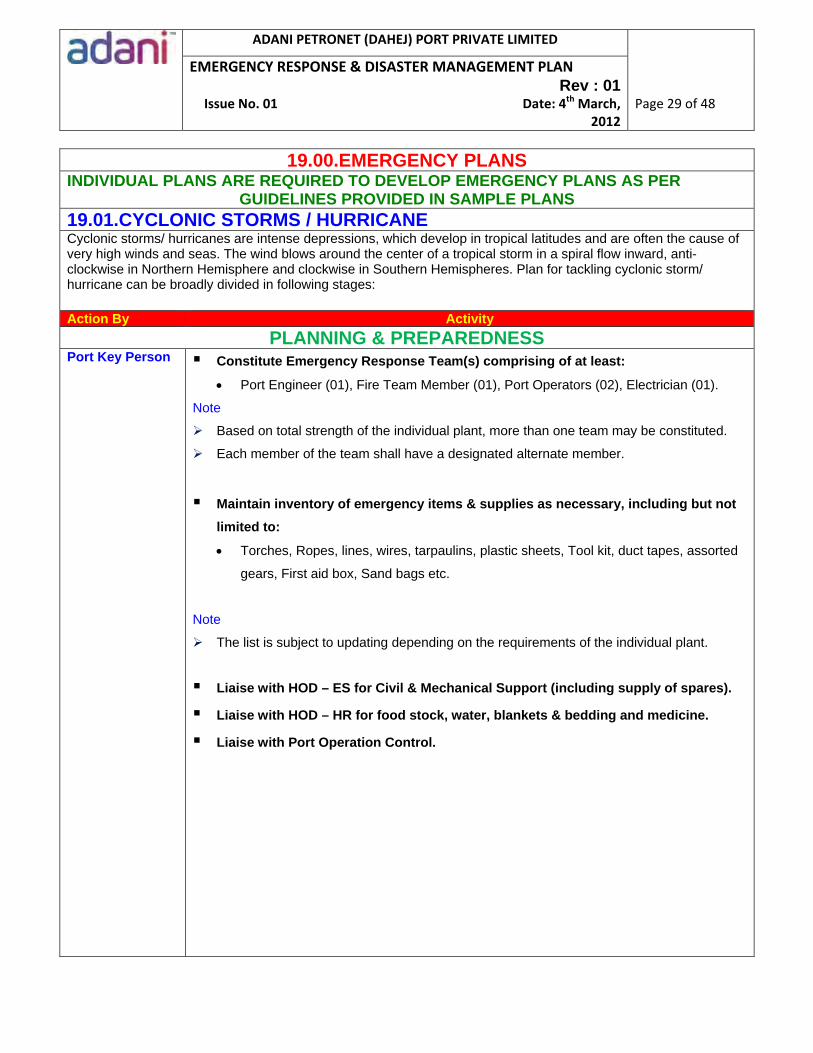
ADANI PETRONET (DAHEJ) PORT PRIVATE LIMITED
Page 29 of 48
EMERGENCY RESPONSE & DISASTER MANAGEMENT PLAN Rev : 01
Issue No. 01 Date: 4th March, 2012
19.00.EMERGENCY PLANSINDIVIDUAL PLANS ARE REQUIRED TO DEVELOP EMERGENCY PLANS AS PER
GUIDELINES PROVIDED IN SAMPLE PLANS 19.01.CYCLONIC STORMS / HURRICANE Cyclonic storms/ hurricanes are intense depressions, which develop in tropical latitudes and are often the cause of very high winds and seas. The wind blows around the center of a tropical storm in a spiral flow inward, anti-clockwise in Northern Hemisphere and clockwise in Southern Hemispheres. Plan for tackling cyclonic storm/ hurricane can be broadly divided in following stages: Action By Activity
PLANNING & PREPAREDNESS Port Key Person Constitute Emergency Response Team(s) comprising of at least:
Port Engineer (01), Fire Team Member (01), Port Operators (02), Electrician (01).
Note
Based on total strength of the individual plant, more than one team may be constituted.
Each member of the team shall have a designated alternate member.
Maintain inventory of emergency items & supplies as necessary, including but not
limited to:
Torches, Ropes, lines, wires, tarpaulins, plastic sheets, Tool kit, duct tapes, assorted
gears, First aid box, Sand bags etc.
Note
The list is subject to updating depending on the requirements of the individual plant.
Liaise with HOD – ES for Civil & Mechanical Support (including supply of spares).
Liaise with HOD – HR for food stock, water, blankets & bedding and medicine.
Liaise with Port Operation Control.

ADANI PETRONET (DAHEJ) PORT PRIVATE LIMITED
Page 30 of 48
EMERGENCY RESPONSE & DISASTER MANAGEMENT PLAN Rev : 01
Issue No. 01 Date: 4th March, 2012
ACTION BEFORE EFFECTIVE PERIOD Port Key Person
Liaise with Site Main Controller Mobilize Emergency Response Team(s).
Note
Members to be briefed about the emergency.
Members to be informed that they may be required to stay at site during & after the
emergency.
Release non-essential personnel.
Note
Port key person reserves prerogative on the release of employees.
Personnel to be briefed on the possible time of return to work.
Initiate Port shut down based in:
Consultation with Site Main Controller.
Audit Port area(s) for safety measures to ensure that:
Loose items are secured. Electric machinery is covered and protected against water ingress. Storm water drains are cleared of any obstructions.
Implement preventive & precautionary measures (including but not limited) to
ensure:
Inventory of emergency supplies is maintained. Material and equipment that can possibly be damaged by water ingress is
elevated. Windows & doors are weather tight. Roof mounted equipment are braced. Material & equipment that cannot be moved are covered. Sandbags are placed in doorways where flooding from storm water can occur.
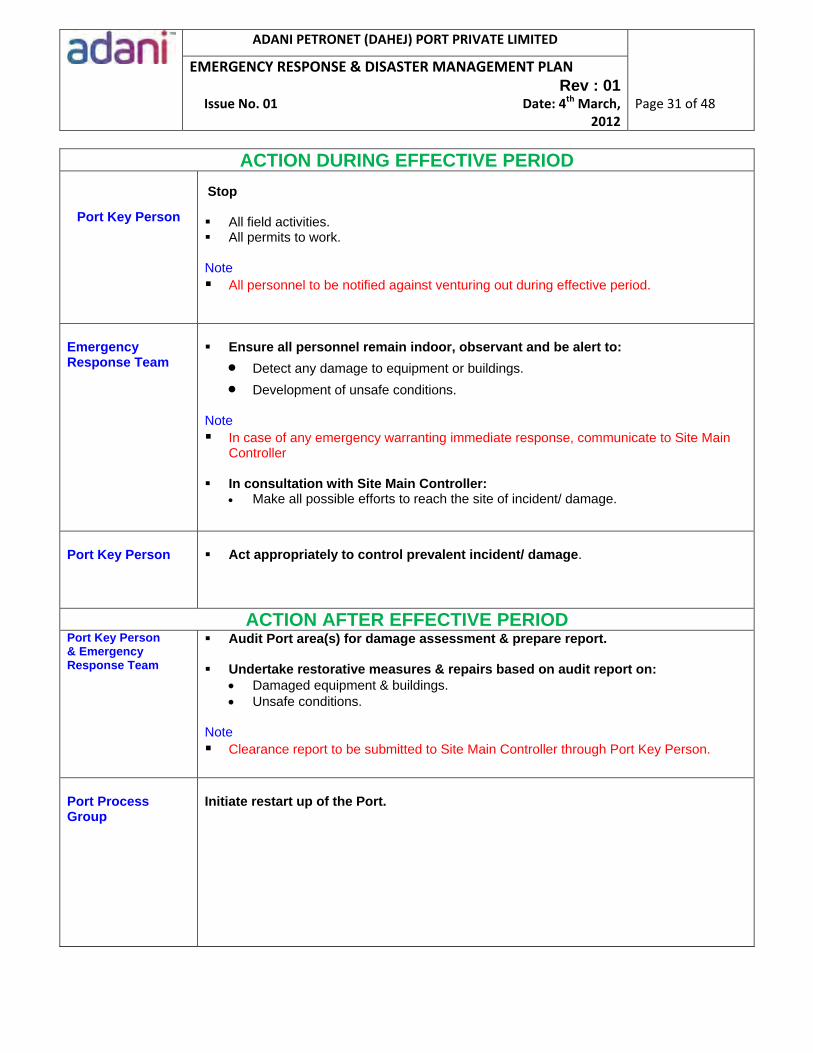
ADANI PETRONET (DAHEJ) PORT PRIVATE LIMITED
Page 31 of 48
EMERGENCY RESPONSE & DISASTER MANAGEMENT PLAN Rev : 01
Issue No. 01 Date: 4th March, 2012
ACTION DURING EFFECTIVE PERIOD
Port Key Person
Stop All field activities. All permits to work. Note All personnel to be notified against venturing out during effective period.
Emergency Response Team
Ensure all personnel remain indoor, observant and be alert to:
Detect any damage to equipment or buildings. Development of unsafe conditions.
Note In case of any emergency warranting immediate response, communicate to Site Main
Controller
In consultation with Site Main Controller: Make all possible efforts to reach the site of incident/ damage.
Port Key Person
Act appropriately to control prevalent incident/ damage.
ACTION AFTER EFFECTIVE PERIOD Port Key Person & Emergency Response Team
Audit Port area(s) for damage assessment & prepare report. Undertake restorative measures & repairs based on audit report on:
Damaged equipment & buildings. Unsafe conditions.
Note Clearance report to be submitted to Site Main Controller through Port Key Person.
Port Process Group
Initiate restart up of the Port.
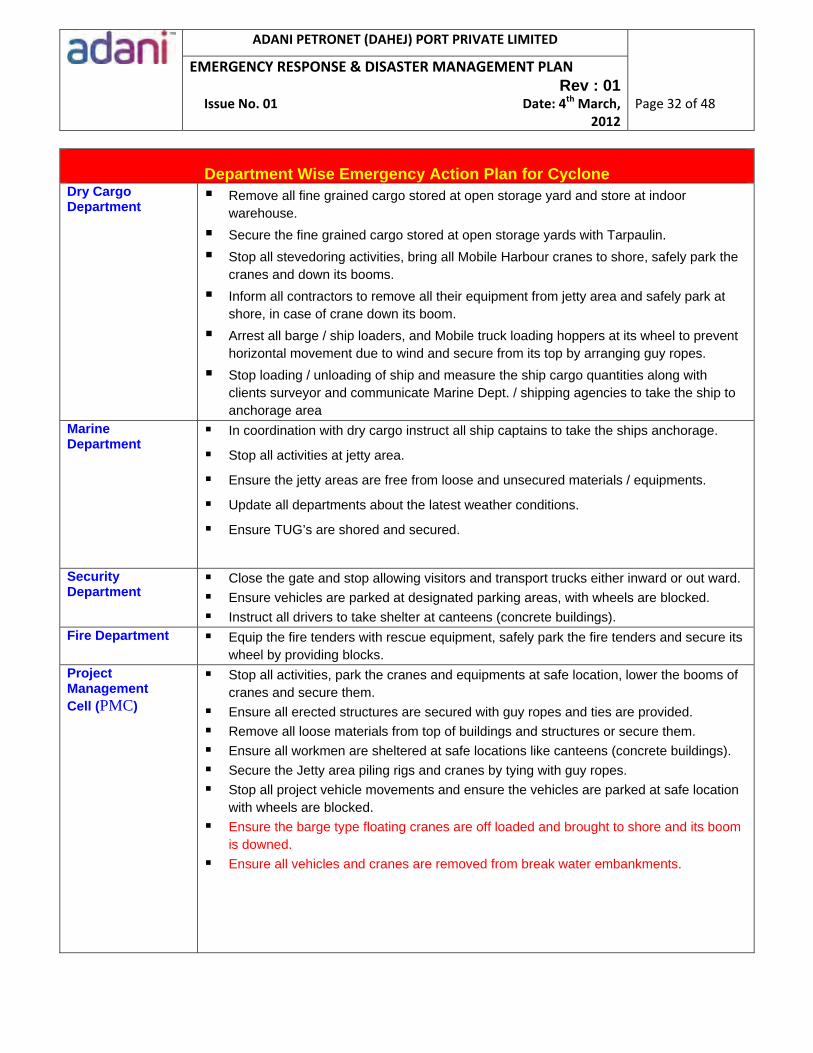
ADANI PETRONET (DAHEJ) PORT PRIVATE LIMITED
Page 32 of 48
EMERGENCY RESPONSE & DISASTER MANAGEMENT PLAN Rev : 01
Issue No. 01 Date: 4th March, 2012
Department Wise Emergency Action Plan for Cyclone Dry Cargo Department
Remove all fine grained cargo stored at open storage yard and store at indoor warehouse.
Secure the fine grained cargo stored at open storage yards with Tarpaulin. Stop all stevedoring activities, bring all Mobile Harbour cranes to shore, safely park the
cranes and down its booms. Inform all contractors to remove all their equipment from jetty area and safely park at
shore, in case of crane down its boom. Arrest all barge / ship loaders, and Mobile truck loading hoppers at its wheel to prevent
horizontal movement due to wind and secure from its top by arranging guy ropes. Stop loading / unloading of ship and measure the ship cargo quantities along with
clients surveyor and communicate Marine Dept. / shipping agencies to take the ship to anchorage area
Marine Department
In coordination with dry cargo instruct all ship captains to take the ships anchorage.
Stop all activities at jetty area.
Ensure the jetty areas are free from loose and unsecured materials / equipments.
Update all departments about the latest weather conditions.
Ensure TUG’s are shored and secured.
Security Department
Close the gate and stop allowing visitors and transport trucks either inward or out ward. Ensure vehicles are parked at designated parking areas, with wheels are blocked. Instruct all drivers to take shelter at canteens (concrete buildings).
Fire Department Equip the fire tenders with rescue equipment, safely park the fire tenders and secure its wheel by providing blocks.
Project Management Cell (PMC)
Stop all activities, park the cranes and equipments at safe location, lower the booms of cranes and secure them.
Ensure all erected structures are secured with guy ropes and ties are provided. Remove all loose materials from top of buildings and structures or secure them. Ensure all workmen are sheltered at safe locations like canteens (concrete buildings). Secure the Jetty area piling rigs and cranes by tying with guy ropes. Stop all project vehicle movements and ensure the vehicles are parked at safe location
with wheels are blocked. Ensure the barge type floating cranes are off loaded and brought to shore and its boom
is downed. Ensure all vehicles and cranes are removed from break water embankments.
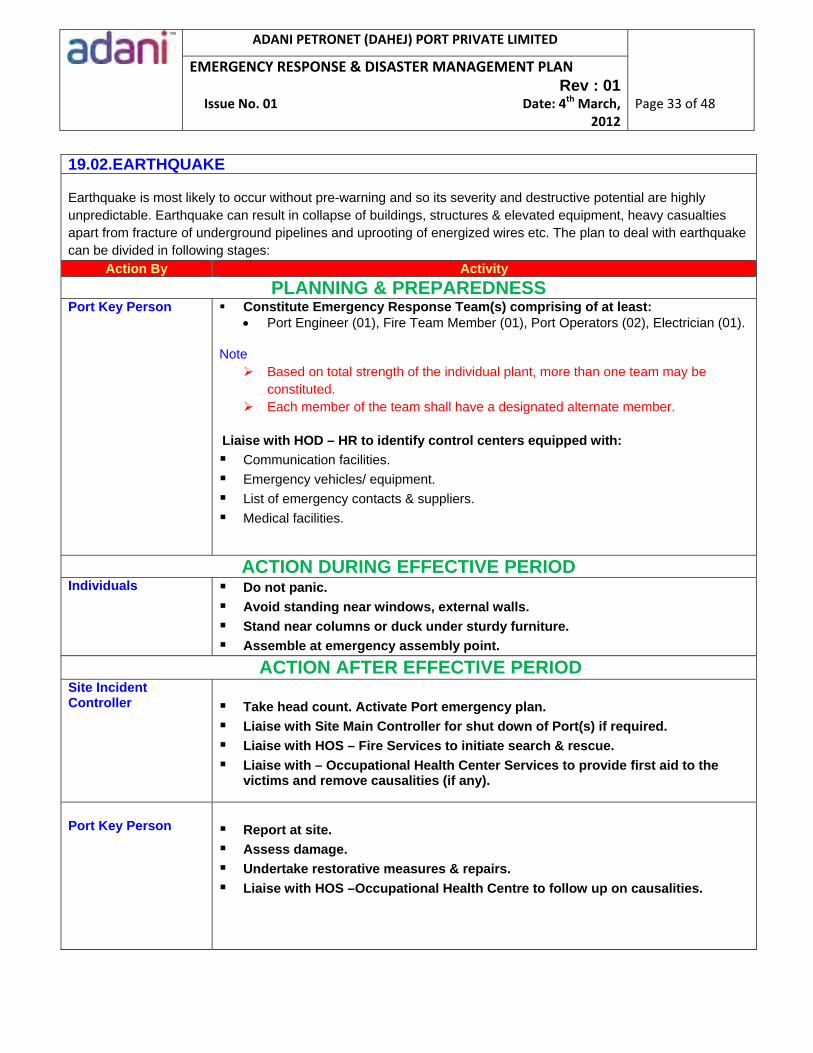
ADANI PETRONET (DAHEJ) PORT PRIVATE LIMITED
Page 33 of 48
EMERGENCY RESPONSE & DISASTER MANAGEMENT PLAN Rev : 01
Issue No. 01 Date: 4th March, 2012
19.02.EARTHQUAKE
Earthquake is most likely to occur without pre-warning and so its severity and destructive potential are highly unpredictable. Earthquake can result in collapse of buildings, structures & elevated equipment, heavy casualties apart from fracture of underground pipelines and uprooting of energized wires etc. The plan to deal with earthquake can be divided in following stages:
Action By Activity PLANNING & PREPAREDNESS
Port Key Person Constitute Emergency Response Team(s) comprising of at least: Port Engineer (01), Fire Team Member (01), Port Operators (02), Electrician (01).
Note Based on total strength of the individual plant, more than one team may be
constituted. Each member of the team shall have a designated alternate member.
Liaise with HOD – HR to identify control centers equipped with:
Communication facilities. Emergency vehicles/ equipment. List of emergency contacts & suppliers. Medical facilities.
ACTION DURING EFFECTIVE PERIOD Individuals Do not panic.
Avoid standing near windows, external walls.
Stand near columns or duck under sturdy furniture.
Assemble at emergency assembly point.
ACTION AFTER EFFECTIVE PERIOD Site Incident Controller
Take head count. Activate Port emergency plan.
Liaise with Site Main Controller for shut down of Port(s) if required.
Liaise with HOS – Fire Services to initiate search & rescue.
Liaise with – Occupational Health Center Services to provide first aid to the victims and remove causalities (if any).
Port Key Person
Report at site.
Assess damage.
Undertake restorative measures & repairs.
Liaise with HOS –Occupational Health Centre to follow up on causalities.
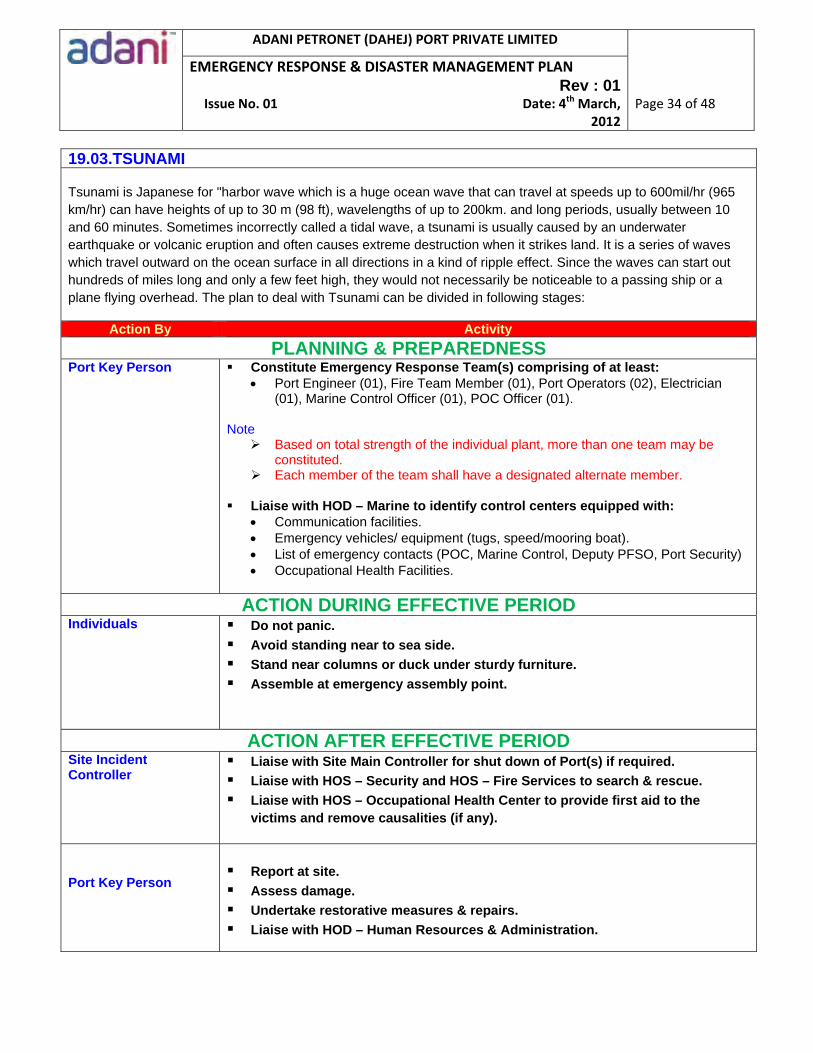
ADANI PETRONET (DAHEJ) PORT PRIVATE LIMITED
Page 34 of 48
EMERGENCY RESPONSE & DISASTER MANAGEMENT PLAN Rev : 01
Issue No. 01 Date: 4th March, 2012
19.03.TSUNAMI
Tsunami is Japanese for "harbor wave which is a huge ocean wave that can travel at speeds up to 600mil/hr (965 km/hr) can have heights of up to 30 m (98 ft), wavelengths of up to 200km. and long periods, usually between 10 and 60 minutes. Sometimes incorrectly called a tidal wave, a tsunami is usually caused by an underwater earthquake or volcanic eruption and often causes extreme destruction when it strikes land. It is a series of waves which travel outward on the ocean surface in all directions in a kind of ripple effect. Since the waves can start out hundreds of miles long and only a few feet high, they would not necessarily be noticeable to a passing ship or a plane flying overhead. The plan to deal with Tsunami can be divided in following stages:
Action By Activity PLANNING & PREPAREDNESS
Port Key Person Constitute Emergency Response Team(s) comprising of at least: Port Engineer (01), Fire Team Member (01), Port Operators (02), Electrician
(01), Marine Control Officer (01), POC Officer (01).
Note Based on total strength of the individual plant, more than one team may be
constituted. Each member of the team shall have a designated alternate member.
Liaise with HOD – Marine to identify control centers equipped with:
Communication facilities. Emergency vehicles/ equipment (tugs, speed/mooring boat). List of emergency contacts (POC, Marine Control, Deputy PFSO, Port Security) Occupational Health Facilities.
ACTION DURING EFFECTIVE PERIOD
Individuals Do not panic.
Avoid standing near to sea side.
Stand near columns or duck under sturdy furniture.
Assemble at emergency assembly point.
ACTION AFTER EFFECTIVE PERIOD Site Incident Controller
Liaise with Site Main Controller for shut down of Port(s) if required.
Liaise with HOS – Security and HOS – Fire Services to search & rescue.
Liaise with HOS – Occupational Health Center to provide first aid to the victims and remove causalities (if any).
Port Key Person
Report at site.
Assess damage.
Undertake restorative measures & repairs.
Liaise with HOD – Human Resources & Administration.
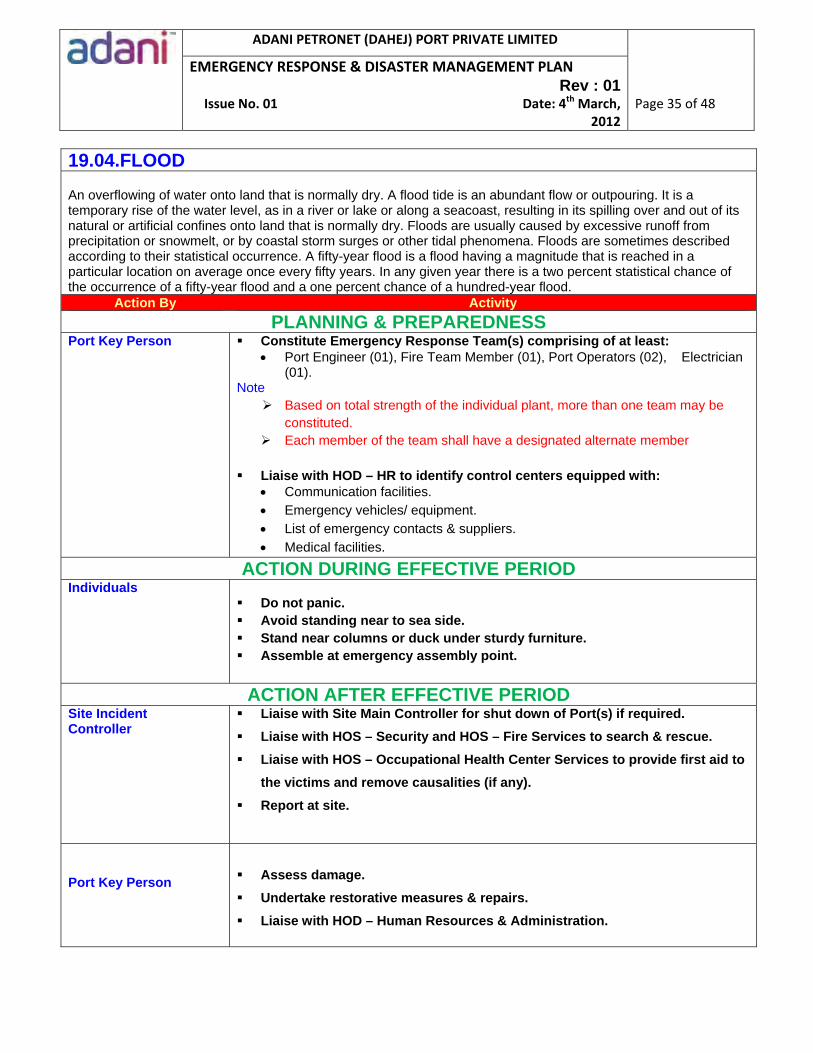
ADANI PETRONET (DAHEJ) PORT PRIVATE LIMITED
Page 35 of 48
EMERGENCY RESPONSE & DISASTER MANAGEMENT PLAN Rev : 01
Issue No. 01 Date: 4th March, 2012
19.04.FLOOD
An overflowing of water onto land that is normally dry. A flood tide is an abundant flow or outpouring. It is a temporary rise of the water level, as in a river or lake or along a seacoast, resulting in its spilling over and out of its natural or artificial confines onto land that is normally dry. Floods are usually caused by excessive runoff from precipitation or snowmelt, or by coastal storm surges or other tidal phenomena. Floods are sometimes described according to their statistical occurrence. A fifty-year flood is a flood having a magnitude that is reached in a particular location on average once every fifty years. In any given year there is a two percent statistical chance of the occurrence of a fifty-year flood and a one percent chance of a hundred-year flood.
Action By Activity
PLANNING & PREPAREDNESS Port Key Person Constitute Emergency Response Team(s) comprising of at least:
Port Engineer (01), Fire Team Member (01), Port Operators (02), Electrician (01).
Note Based on total strength of the individual plant, more than one team may be
constituted. Each member of the team shall have a designated alternate member
Liaise with HOD – HR to identify control centers equipped with:
Communication facilities. Emergency vehicles/ equipment. List of emergency contacts & suppliers. Medical facilities.
ACTION DURING EFFECTIVE PERIOD Individuals
Do not panic. Avoid standing near to sea side. Stand near columns or duck under sturdy furniture. Assemble at emergency assembly point.
ACTION AFTER EFFECTIVE PERIOD Site Incident Controller
Liaise with Site Main Controller for shut down of Port(s) if required.
Liaise with HOS – Security and HOS – Fire Services to search & rescue.
Liaise with HOS – Occupational Health Center Services to provide first aid to
the victims and remove causalities (if any).
Report at site.
Port Key Person
Assess damage.
Undertake restorative measures & repairs.
Liaise with HOD – Human Resources & Administration.
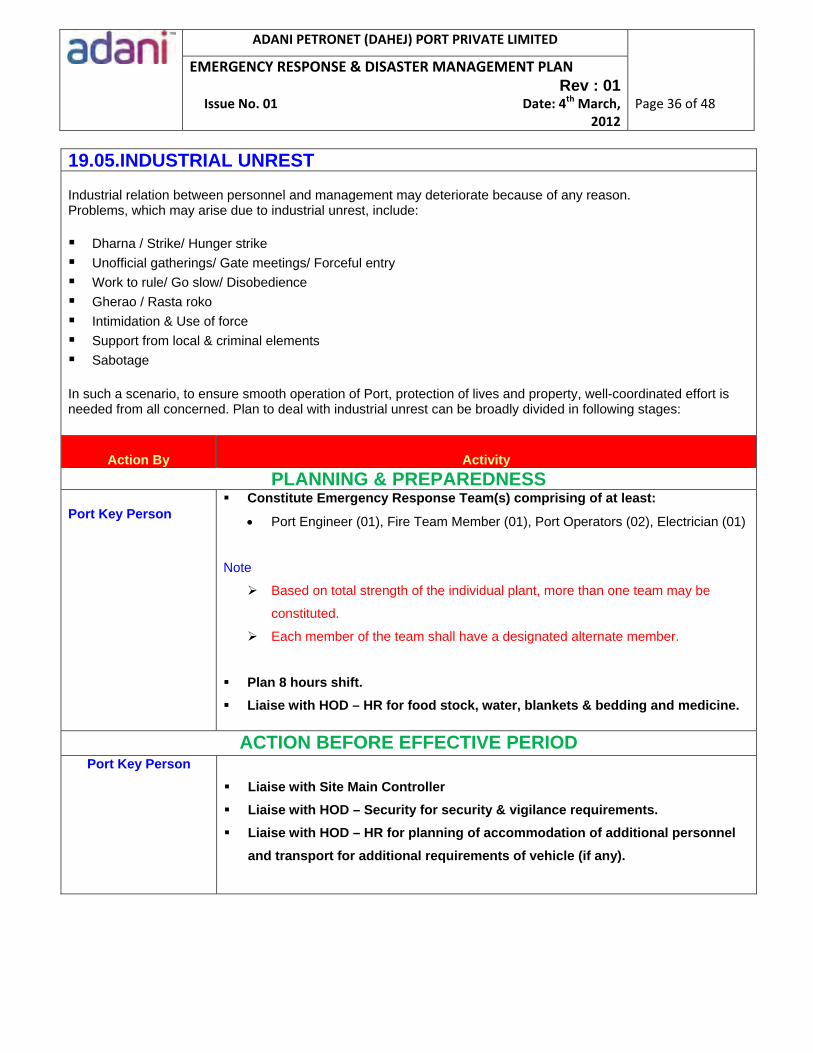
ADANI PETRONET (DAHEJ) PORT PRIVATE LIMITED
Page 36 of 48
EMERGENCY RESPONSE & DISASTER MANAGEMENT PLAN Rev : 01
Issue No. 01 Date: 4th March, 2012
19.05.INDUSTRIAL UNREST
Industrial relation between personnel and management may deteriorate because of any reason. Problems, which may arise due to industrial unrest, include:
Dharna / Strike/ Hunger strike Unofficial gatherings/ Gate meetings/ Forceful entry Work to rule/ Go slow/ Disobedience Gherao / Rasta roko Intimidation & Use of force Support from local & criminal elements Sabotage
In such a scenario, to ensure smooth operation of Port, protection of lives and property, well-coordinated effort is needed from all concerned. Plan to deal with industrial unrest can be broadly divided in following stages:
Action By Activity PLANNING & PREPAREDNESS
Port Key Person Constitute Emergency Response Team(s) comprising of at least:
Port Engineer (01), Fire Team Member (01), Port Operators (02), Electrician (01)
Note
Based on total strength of the individual plant, more than one team may be
constituted.
Each member of the team shall have a designated alternate member.
Plan 8 hours shift.
Liaise with HOD – HR for food stock, water, blankets & bedding and medicine.
ACTION BEFORE EFFECTIVE PERIOD
Port Key Person
Liaise with Site Main Controller
Liaise with HOD – Security for security & vigilance requirements.
Liaise with HOD – HR for planning of accommodation of additional personnel
and transport for additional requirements of vehicle (if any).

ADANI PETRONET (DAHEJ) PORT PRIVATE LIMITED
Page 37 of 48
EMERGENCY RESPONSE & DISASTER MANAGEMENT PLAN Rev : 01
Issue No. 01 Date: 4th March, 2012
ACTION DURING EFFECTIVE PERIOD Port Key Person Liaise with HOD – Security for
Strengthening security at sensitive points.
Ensuring protection of lives & property.
Vigilance & patrolling.
Maintaining law & order.
Liaise with Site Main Controller for
Updates on the situation.
ACTION AFTER EFFECTIVE PERIOD Port Key Person
Assess damage (if any).
Liaise with Site Main Controller for restoring normalcy.
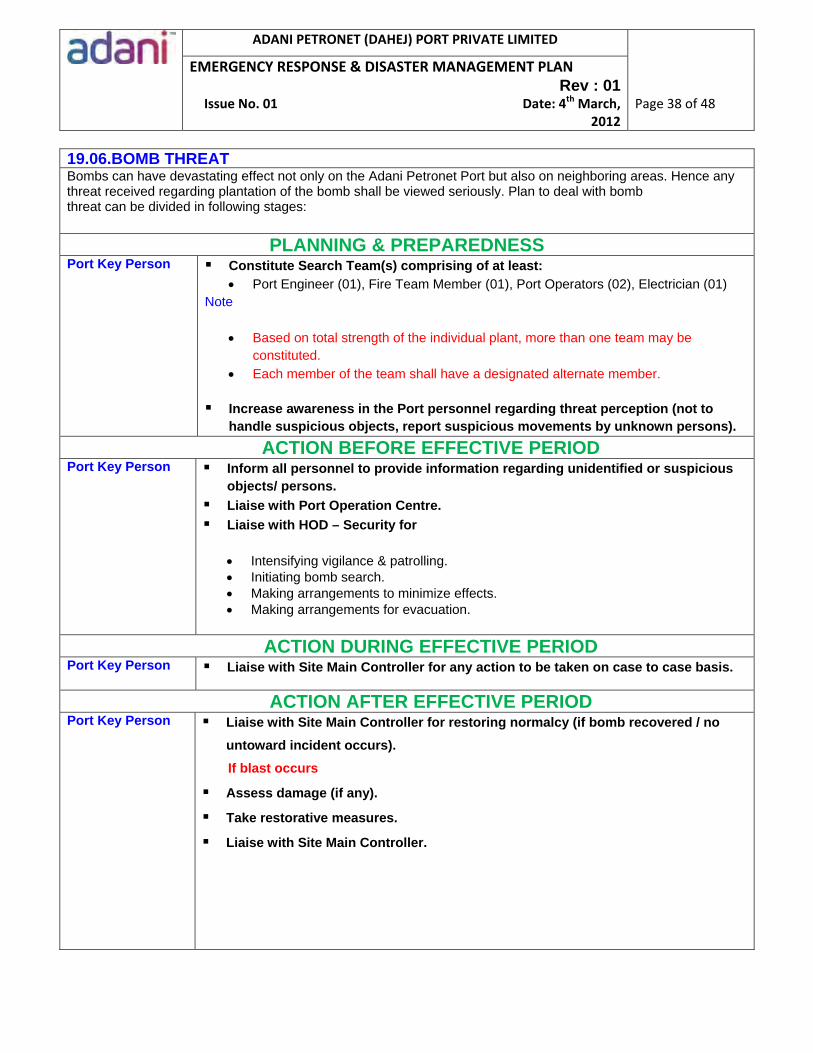
ADANI PETRONET (DAHEJ) PORT PRIVATE LIMITED
Page 38 of 48
EMERGENCY RESPONSE & DISASTER MANAGEMENT PLAN Rev : 01
Issue No. 01 Date: 4th March, 2012
19.06.BOMB THREAT Bombs can have devastating effect not only on the Adani Petronet Port but also on neighboring areas. Hence any threat received regarding plantation of the bomb shall be viewed seriously. Plan to deal with bomb threat can be divided in following stages:
PLANNING & PREPAREDNESS Port Key Person Constitute Search Team(s) comprising of at least:
Port Engineer (01), Fire Team Member (01), Port Operators (02), Electrician (01) Note
Based on total strength of the individual plant, more than one team may be constituted.
Each member of the team shall have a designated alternate member. Increase awareness in the Port personnel regarding threat perception (not to
handle suspicious objects, report suspicious movements by unknown persons).
ACTION BEFORE EFFECTIVE PERIOD Port Key Person Inform all personnel to provide information regarding unidentified or suspicious
objects/ persons.
Liaise with Port Operation Centre.
Liaise with HOD – Security for
Intensifying vigilance & patrolling. Initiating bomb search. Making arrangements to minimize effects. Making arrangements for evacuation.
ACTION DURING EFFECTIVE PERIOD Port Key Person Liaise with Site Main Controller for any action to be taken on case to case basis.
ACTION AFTER EFFECTIVE PERIOD Port Key Person Liaise with Site Main Controller for restoring normalcy (if bomb recovered / no
untoward incident occurs).
If blast occurs
Assess damage (if any).
Take restorative measures.
Liaise with Site Main Controller.
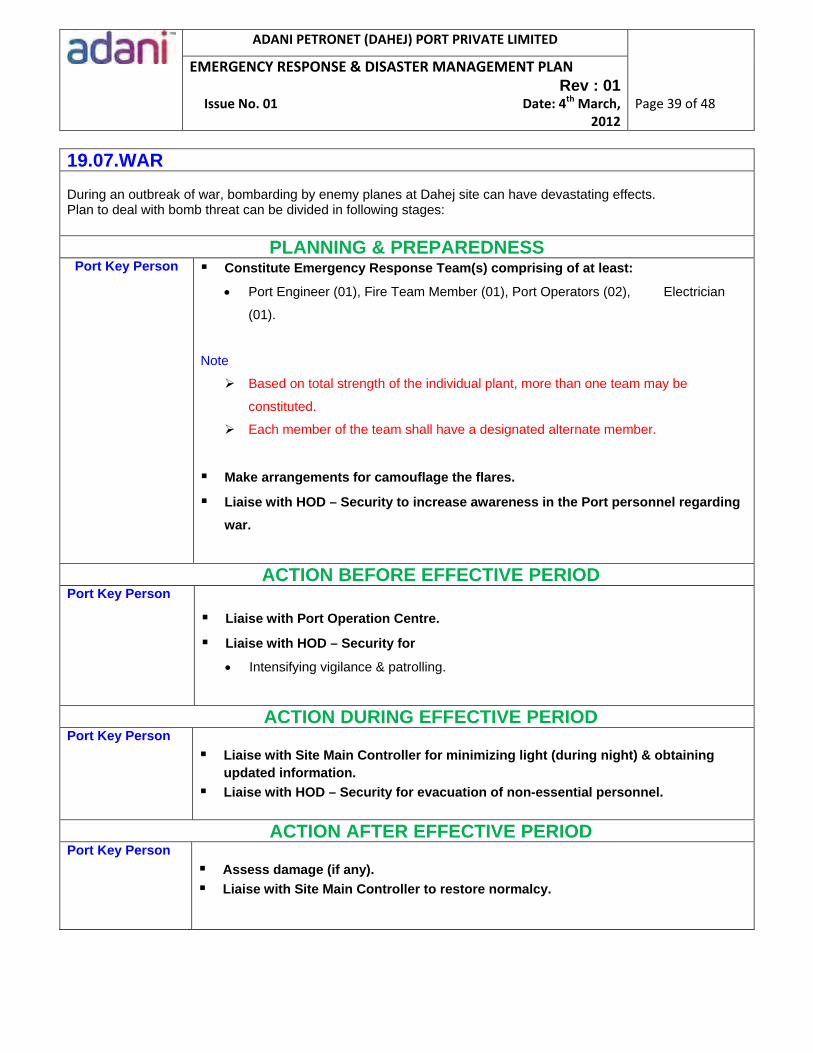
ADANI PETRONET (DAHEJ) PORT PRIVATE LIMITED
Page 39 of 48
EMERGENCY RESPONSE & DISASTER MANAGEMENT PLAN Rev : 01
Issue No. 01 Date: 4th March, 2012
19.07.WAR During an outbreak of war, bombarding by enemy planes at Dahej site can have devastating effects. Plan to deal with bomb threat can be divided in following stages:
PLANNING & PREPAREDNESS Port Key Person Constitute Emergency Response Team(s) comprising of at least:
Port Engineer (01), Fire Team Member (01), Port Operators (02), Electrician
(01).
Note
Based on total strength of the individual plant, more than one team may be
constituted.
Each member of the team shall have a designated alternate member.
Make arrangements for camouflage the flares.
Liaise with HOD – Security to increase awareness in the Port personnel regarding
war.
ACTION BEFORE EFFECTIVE PERIOD Port Key Person
Liaise with Port Operation Centre.
Liaise with HOD – Security for
Intensifying vigilance & patrolling.
ACTION DURING EFFECTIVE PERIOD Port Key Person
Liaise with Site Main Controller for minimizing light (during night) & obtaining updated information.
Liaise with HOD – Security for evacuation of non-essential personnel.
ACTION AFTER EFFECTIVE PERIOD Port Key Person
Assess damage (if any).
Liaise with Site Main Controller to restore normalcy.
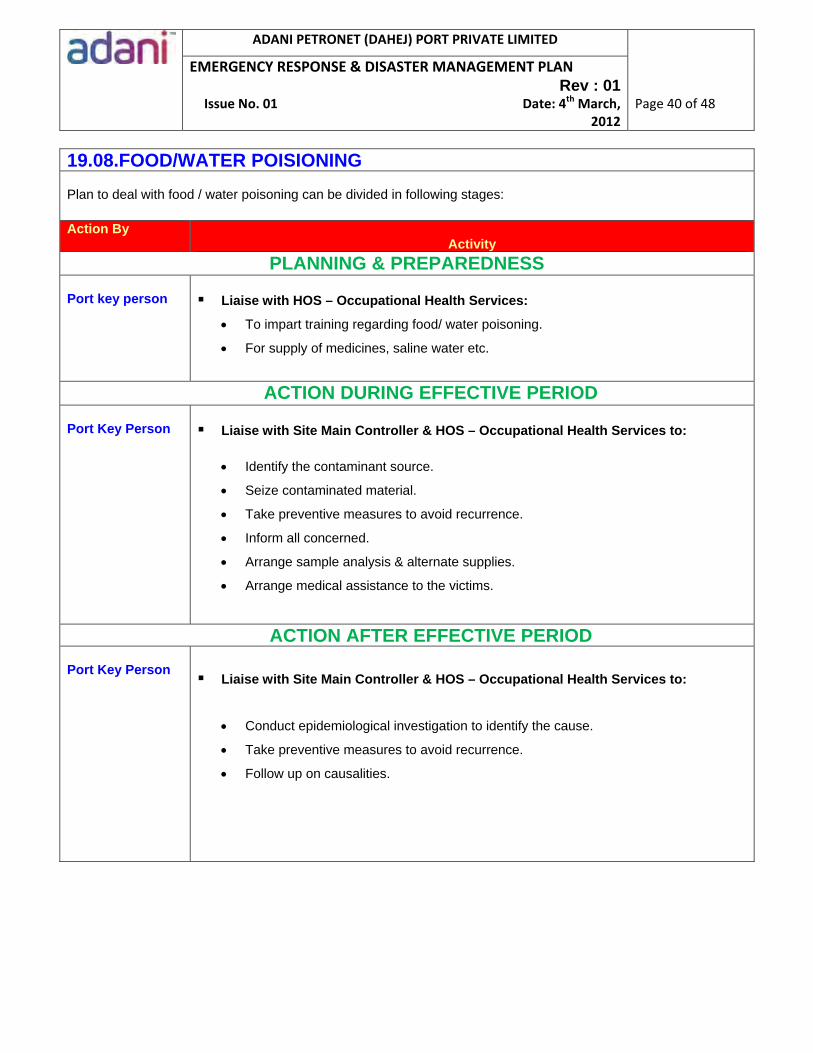
ADANI PETRONET (DAHEJ) PORT PRIVATE LIMITED
Page 40 of 48
EMERGENCY RESPONSE & DISASTER MANAGEMENT PLAN Rev : 01
Issue No. 01 Date: 4th March, 2012
19.08.FOOD/WATER POISIONING Plan to deal with food / water poisoning can be divided in following stages: Action By
Activity
PLANNING & PREPAREDNESS Port key person
Liaise with HOS – Occupational Health Services:
To impart training regarding food/ water poisoning.
For supply of medicines, saline water etc.
ACTION DURING EFFECTIVE PERIOD
Port Key Person
Liaise with Site Main Controller & HOS – Occupational Health Services to:
Identify the contaminant source.
Seize contaminated material.
Take preventive measures to avoid recurrence.
Inform all concerned.
Arrange sample analysis & alternate supplies.
Arrange medical assistance to the victims.
ACTION AFTER EFFECTIVE PERIOD Port Key Person
Liaise with Site Main Controller & HOS – Occupational Health Services to:
Conduct epidemiological investigation to identify the cause.
Take preventive measures to avoid recurrence.
Follow up on causalities.
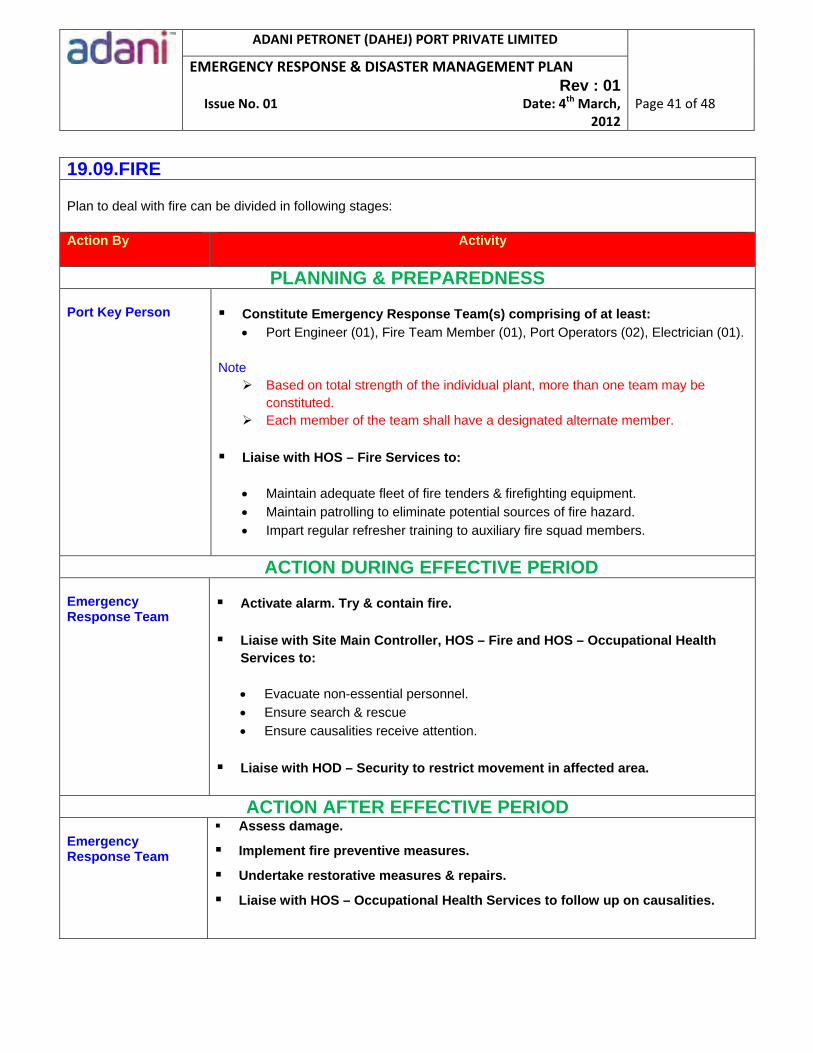
ADANI PETRONET (DAHEJ) PORT PRIVATE LIMITED
Page 41 of 48
EMERGENCY RESPONSE & DISASTER MANAGEMENT PLAN Rev : 01
Issue No. 01 Date: 4th March, 2012
19.09.FIRE Plan to deal with fire can be divided in following stages: Action By
Activity
PLANNING & PREPAREDNESS Port Key Person
Constitute Emergency Response Team(s) comprising of at least:
Port Engineer (01), Fire Team Member (01), Port Operators (02), Electrician (01).
Note Based on total strength of the individual plant, more than one team may be
constituted. Each member of the team shall have a designated alternate member.
Liaise with HOS – Fire Services to:
Maintain adequate fleet of fire tenders & firefighting equipment. Maintain patrolling to eliminate potential sources of fire hazard. Impart regular refresher training to auxiliary fire squad members.
ACTION DURING EFFECTIVE PERIOD Emergency Response Team
Activate alarm. Try & contain fire.
Liaise with Site Main Controller, HOS – Fire and HOS – Occupational Health Services to:
Evacuate non-essential personnel. Ensure search & rescue Ensure causalities receive attention.
Liaise with HOD – Security to restrict movement in affected area.
ACTION AFTER EFFECTIVE PERIOD Emergency Response Team
Assess damage.
Implement fire preventive measures.
Undertake restorative measures & repairs.
Liaise with HOS – Occupational Health Services to follow up on causalities.
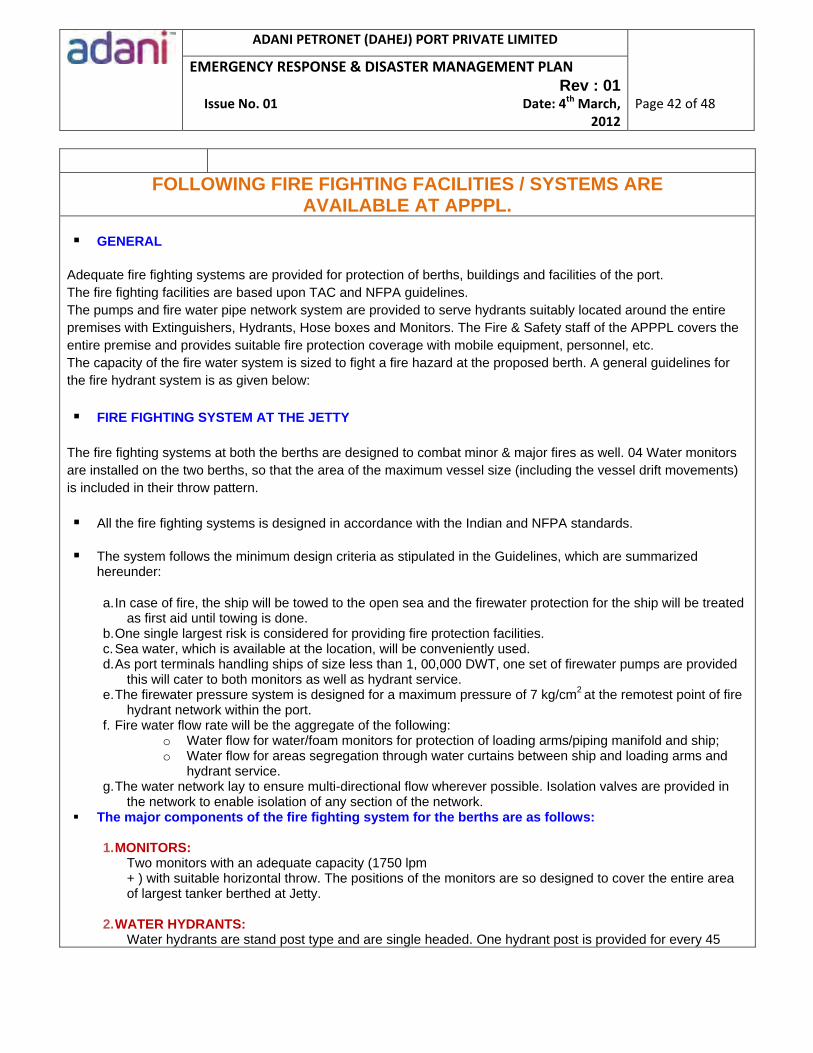
ADANI PETRONET (DAHEJ) PORT PRIVATE LIMITED
Page 42 of 48
EMERGENCY RESPONSE & DISASTER MANAGEMENT PLAN Rev : 01
Issue No. 01 Date: 4th March, 2012
FOLLOWING FIRE FIGHTING FACILITIES / SYSTEMS ARE AVAILABLE AT APPPL.
GENERAL
Adequate fire fighting systems are provided for protection of berths, buildings and facilities of the port. The fire fighting facilities are based upon TAC and NFPA guidelines. The pumps and fire water pipe network system are provided to serve hydrants suitably located around the entire premises with Extinguishers, Hydrants, Hose boxes and Monitors. The Fire & Safety staff of the APPPL covers the entire premise and provides suitable fire protection coverage with mobile equipment, personnel, etc. The capacity of the fire water system is sized to fight a fire hazard at the proposed berth. A general guidelines for the fire hydrant system is as given below:
FIRE FIGHTING SYSTEM AT THE JETTY The fire fighting systems at both the berths are designed to combat minor & major fires as well. 04 Water monitors are installed on the two berths, so that the area of the maximum vessel size (including the vessel drift movements) is included in their throw pattern.
All the fire fighting systems is designed in accordance with the Indian and NFPA standards.
The system follows the minimum design criteria as stipulated in the Guidelines, which are summarized hereunder:
a. In case of fire, the ship will be towed to the open sea and the firewater protection for the ship will be treated as first aid until towing is done.
b. One single largest risk is considered for providing fire protection facilities. c. Sea water, which is available at the location, will be conveniently used. d. As port terminals handling ships of size less than 1, 00,000 DWT, one set of firewater pumps are provided
this will cater to both monitors as well as hydrant service. e. The firewater pressure system is designed for a maximum pressure of 7 kg/cm2
at the remotest point of fire hydrant network within the port.
f. Fire water flow rate will be the aggregate of the following: o Water flow for water/foam monitors for protection of loading arms/piping manifold and ship; o Water flow for areas segregation through water curtains between ship and loading arms and
hydrant service. g. The water network lay to ensure multi-directional flow wherever possible. Isolation valves are provided in
the network to enable isolation of any section of the network. The major components of the fire fighting system for the berths are as follows:
1. MONITORS:
Two monitors with an adequate capacity (1750 lpm + ) with suitable horizontal throw. The positions of the monitors are so designed to cover the entire area of largest tanker berthed at Jetty.
2. WATER HYDRANTS:
Water hydrants are stand post type and are single headed. One hydrant post is provided for every 45
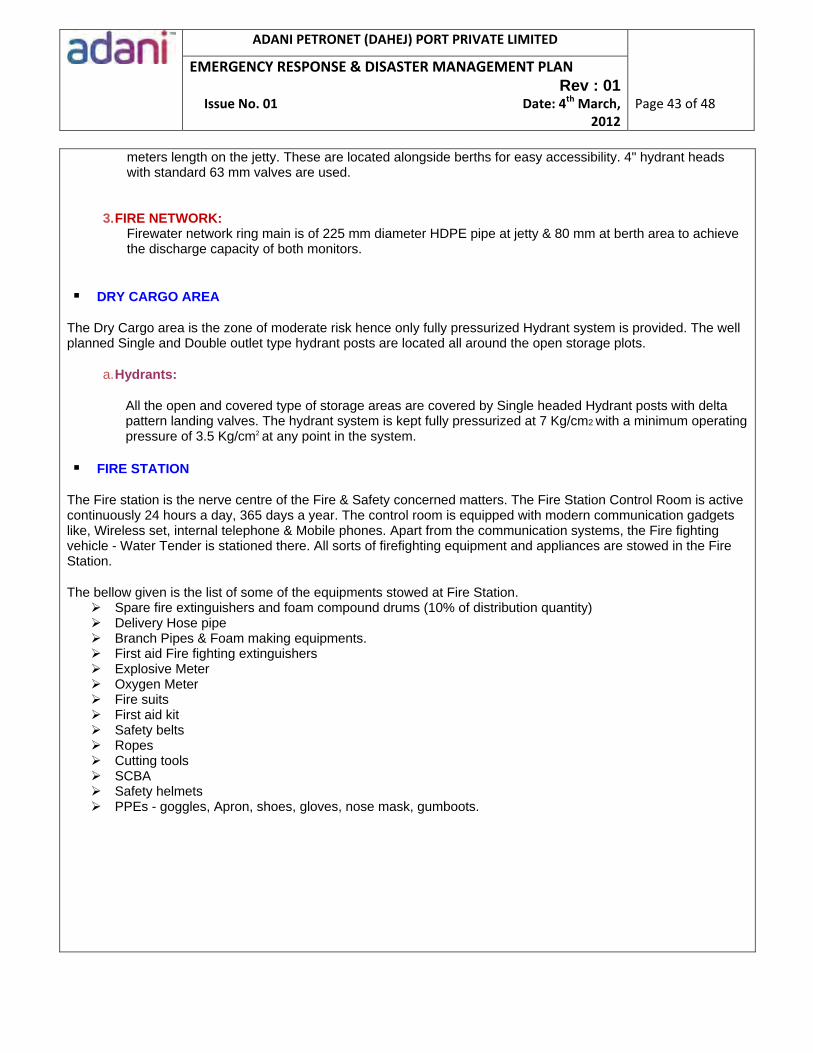
ADANI PETRONET (DAHEJ) PORT PRIVATE LIMITED
Page 43 of 48
EMERGENCY RESPONSE & DISASTER MANAGEMENT PLAN Rev : 01
Issue No. 01 Date: 4th March, 2012
meters length on the jetty. These are located alongside berths for easy accessibility. 4" hydrant heads with standard 63 mm valves are used.
3. FIRE NETWORK: Firewater network ring main is of 225 mm diameter HDPE pipe at jetty & 80 mm at berth area to achieve the discharge capacity of both monitors.
DRY CARGO AREA
The Dry Cargo area is the zone of moderate risk hence only fully pressurized Hydrant system is provided. The well planned Single and Double outlet type hydrant posts are located all around the open storage plots.
a. Hydrants:
All the open and covered type of storage areas are covered by Single headed Hydrant posts with delta pattern landing valves. The hydrant system is kept fully pressurized at 7 Kg/cm2 with a minimum operating pressure of 3.5 Kg/cm2 at any point in the system.
FIRE STATION
The Fire station is the nerve centre of the Fire & Safety concerned matters. The Fire Station Control Room is active continuously 24 hours a day, 365 days a year. The control room is equipped with modern communication gadgets like, Wireless set, internal telephone & Mobile phones. Apart from the communication systems, the Fire fighting vehicle - Water Tender is stationed there. All sorts of firefighting equipment and appliances are stowed in the Fire Station.
The bellow given is the list of some of the equipments stowed at Fire Station. Spare fire extinguishers and foam compound drums (10% of distribution quantity) Delivery Hose pipe Branch Pipes & Foam making equipments. First aid Fire fighting extinguishers Explosive Meter Oxygen Meter Fire suits First aid kit Safety belts Ropes Cutting tools SCBA Safety helmets PPEs - goggles, Apron, shoes, gloves, nose mask, gumboots.
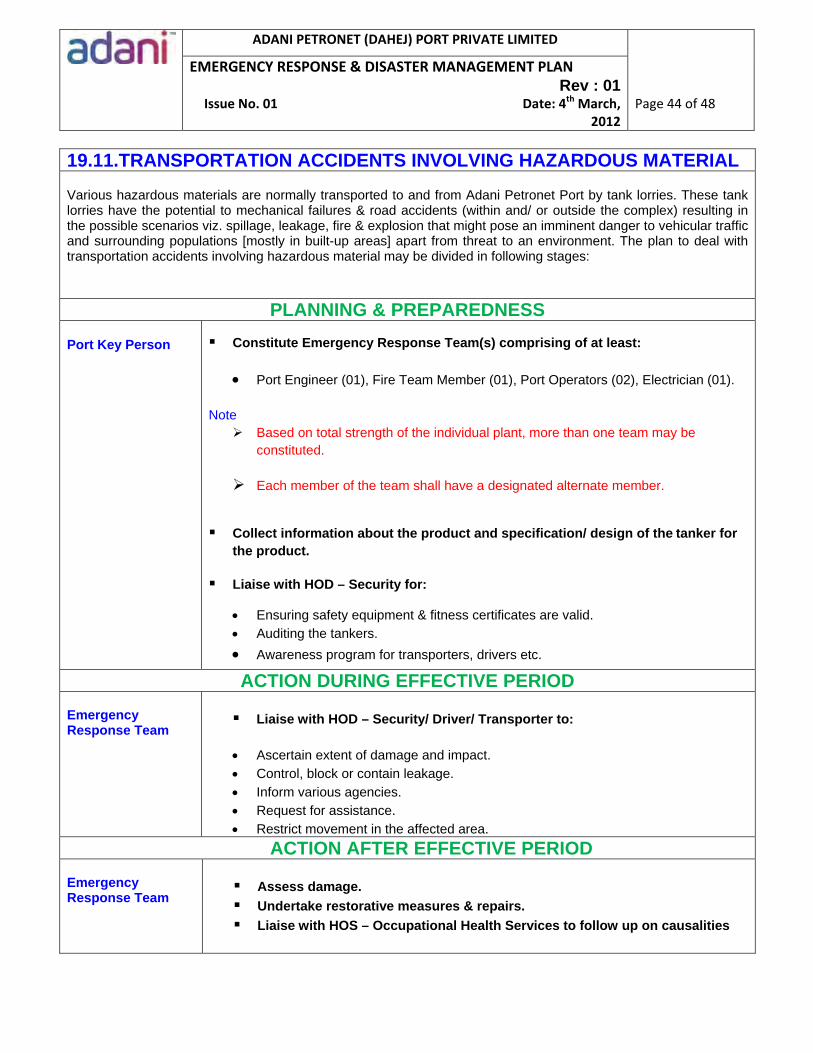
ADANI PETRONET (DAHEJ) PORT PRIVATE LIMITED
Page 44 of 48
EMERGENCY RESPONSE & DISASTER MANAGEMENT PLAN Rev : 01
Issue No. 01 Date: 4th March, 2012
19.11.TRANSPORTATION ACCIDENTS INVOLVING HAZARDOUS MATERIAL
Various hazardous materials are normally transported to and from Adani Petronet Port by tank lorries. These tank lorries have the potential to mechanical failures & road accidents (within and/ or outside the complex) resulting in the possible scenarios viz. spillage, leakage, fire & explosion that might pose an imminent danger to vehicular traffic and surrounding populations [mostly in built-up areas] apart from threat to an environment. The plan to deal with transportation accidents involving hazardous material may be divided in following stages:
PLANNING & PREPAREDNESS
Port Key Person Constitute Emergency Response Team(s) comprising of at least:
Port Engineer (01), Fire Team Member (01), Port Operators (02), Electrician (01). Note
Based on total strength of the individual plant, more than one team may be constituted.
Each member of the team shall have a designated alternate member.
Collect information about the product and specification/ design of the tanker for the product.
Liaise with HOD – Security for:
Ensuring safety equipment & fitness certificates are valid. Auditing the tankers. Awareness program for transporters, drivers etc.
ACTION DURING EFFECTIVE PERIOD Emergency Response Team
Liaise with HOD – Security/ Driver/ Transporter to:
Ascertain extent of damage and impact. Control, block or contain leakage. Inform various agencies. Request for assistance. Restrict movement in the affected area.
ACTION AFTER EFFECTIVE PERIOD Emergency Response Team
Assess damage.
Undertake restorative measures & repairs.
Liaise with HOS – Occupational Health Services to follow up on causalities
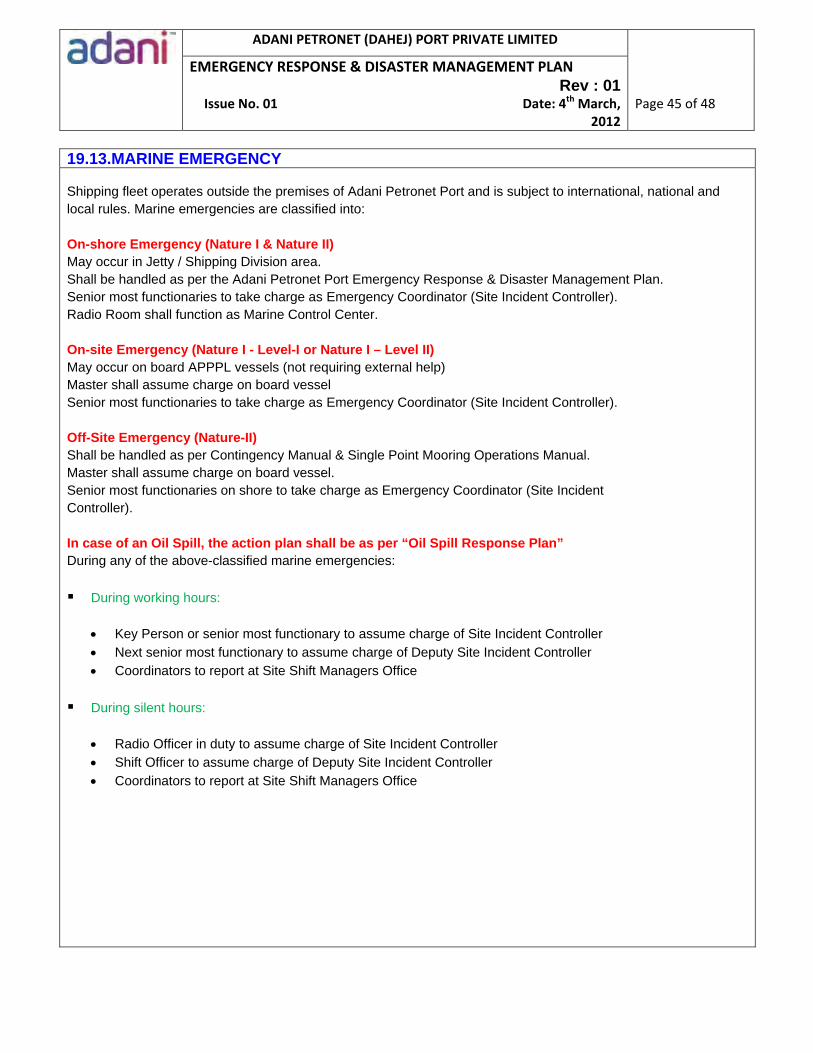
ADANI PETRONET (DAHEJ) PORT PRIVATE LIMITED
Page 45 of 48
EMERGENCY RESPONSE & DISASTER MANAGEMENT PLAN Rev : 01
Issue No. 01 Date: 4th March, 2012
19.13.MARINE EMERGENCY Shipping fleet operates outside the premises of Adani Petronet Port and is subject to international, national and local rules. Marine emergencies are classified into: On-shore Emergency (Nature I & Nature II) May occur in Jetty / Shipping Division area. Shall be handled as per the Adani Petronet Port Emergency Response & Disaster Management Plan. Senior most functionaries to take charge as Emergency Coordinator (Site Incident Controller). Radio Room shall function as Marine Control Center. On-site Emergency (Nature I - Level-I or Nature I – Level II) May occur on board APPPL vessels (not requiring external help) Master shall assume charge on board vessel Senior most functionaries to take charge as Emergency Coordinator (Site Incident Controller). Off-Site Emergency (Nature-II) Shall be handled as per Contingency Manual & Single Point Mooring Operations Manual. Master shall assume charge on board vessel. Senior most functionaries on shore to take charge as Emergency Coordinator (Site Incident Controller). In case of an Oil Spill, the action plan shall be as per “Oil Spill Response Plan” During any of the above-classified marine emergencies: During working hours:
Key Person or senior most functionary to assume charge of Site Incident Controller Next senior most functionary to assume charge of Deputy Site Incident Controller Coordinators to report at Site Shift Managers Office
During silent hours:
Radio Officer in duty to assume charge of Site Incident Controller Shift Officer to assume charge of Deputy Site Incident Controller Coordinators to report at Site Shift Managers Office
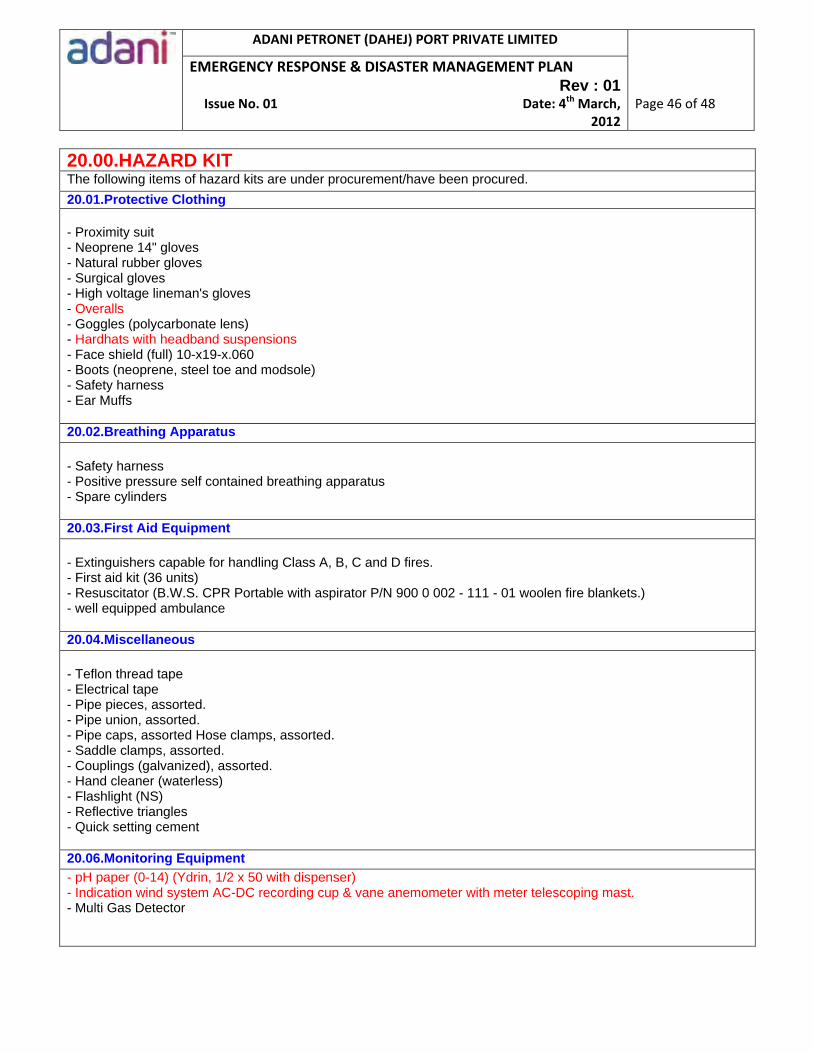
ADANI PETRONET (DAHEJ) PORT PRIVATE LIMITED
Page 46 of 48
EMERGENCY RESPONSE & DISASTER MANAGEMENT PLAN Rev : 01
Issue No. 01 Date: 4th March, 2012
20.00.HAZARD KIT The following items of hazard kits are under procurement/have been procured.20.01.Protective Clothing - Proximity suit - Neoprene 14" gloves - Natural rubber gloves - Surgical gloves - High voltage lineman's gloves - Overalls - Goggles (polycarbonate lens) - Hardhats with headband suspensions - Face shield (full) 10-x19-x.060 - Boots (neoprene, steel toe and modsole) - Safety harness - Ear Muffs 20.02.Breathing Apparatus - Safety harness - Positive pressure self contained breathing apparatus - Spare cylinders 20.03.First Aid Equipment - Extinguishers capable for handling Class A, B, C and D fires. - First aid kit (36 units) - Resuscitator (B.W.S. CPR Portable with aspirator P/N 900 0 002 - 111 - 01 woolen fire blankets.) - well equipped ambulance 20.04.Miscellaneous - Teflon thread tape - Electrical tape - Pipe pieces, assorted. - Pipe union, assorted. - Pipe caps, assorted Hose clamps, assorted. - Saddle clamps, assorted. - Couplings (galvanized), assorted. - Hand cleaner (waterless) - Flashlight (NS) - Reflective triangles - Quick setting cement 20.06.Monitoring Equipment - pH paper (0-14) (Ydrin, 1/2 x 50 with dispenser) - Indication wind system AC-DC recording cup & vane anemometer with meter telescoping mast. - Multi Gas Detector

ADANI PETRONET (DAHEJ) PORT PRIVATE LIMITED
Page 47 of 48
EMERGENCY RESPONSE & DISASTER MANAGEMENT PLAN Rev : 01
Issue No. 01 Date: 4th March, 2012
20.07.Tools and hardware - Drill (electrical) - Drill set, assorted sizes (short length) - Drill set, assorted sizes (length) - Punch set, assorted sizes - Wire brush - Paint brushes - Tape measure steel tape - Foot ruler (metal) - Welding kit - Pipe cutters - Drum trolleys - Chemical buckets - Dust pans - Hacksaw - Hacksaw blades 20.08.Oxygen Trauma, First-Aid & Emergency Box Kit (Medical) - Oxygen Cylinder - Water gel Blankets. - Rescue Blankets - Oxygen breathing kit - Instant Glucose - Paramedic Scissors - Forceps - Gloves - Ring cutter - Cervical collar - Eye pads - Tourniquets - Multi-trauma dressings - Adaptec dressing - Flexible Bandages - Pocket Masks - Eyewash bottle - Bag mask resuscitator - Portable respirator - Portable lamps / torches - Mouth-to-mask - Blood pressure Equipment 20.09.Adequate number of fire tender Water Tender of 12000 liters water capacity with adequate numbers of firefighting equipment and rear mounted portable pump of 450 liters / min. capacity
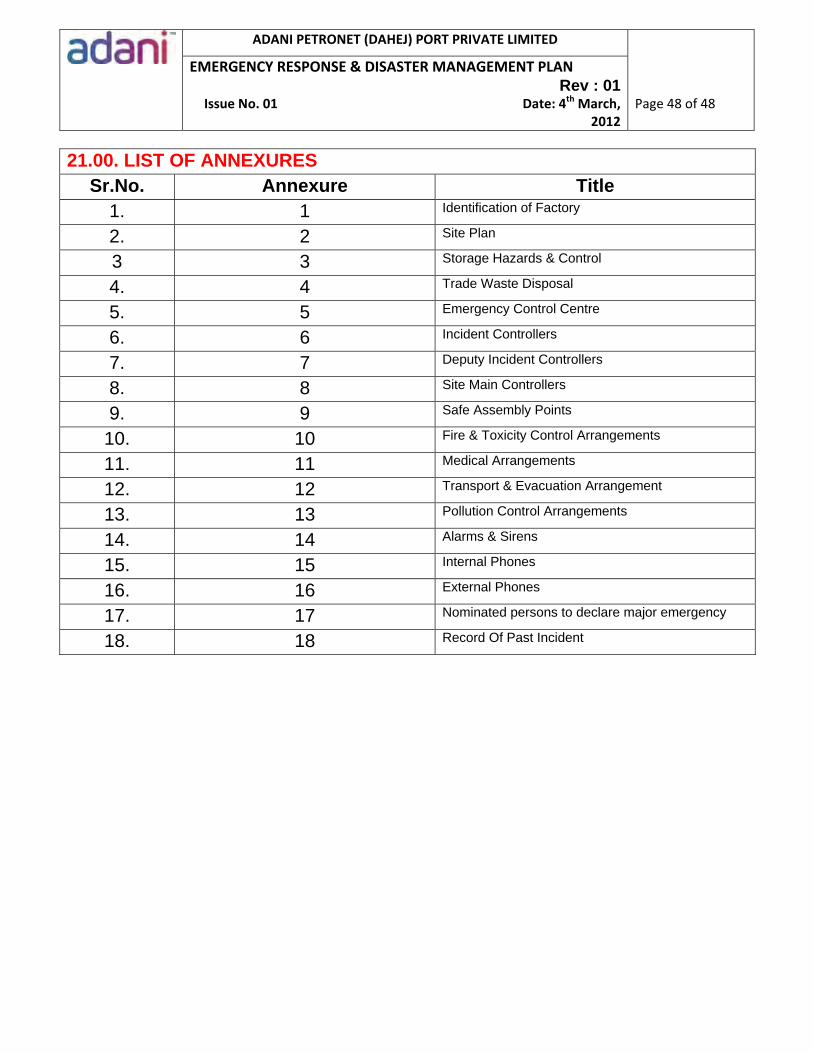
ADANI PETRONET (DAHEJ) PORT PRIVATE LIMITED
Page 48 of 48
EMERGENCY RESPONSE & DISASTER MANAGEMENT PLAN Rev : 01
Issue No. 01 Date: 4th March, 2012
21.00. LIST OF ANNEXURES Sr.No. Annexure Title
1. 1 Identification of Factory
2. 2 Site Plan
3 3 Storage Hazards & Control
4. 4 Trade Waste Disposal
5. 5 Emergency Control Centre
6. 6 Incident Controllers
7. 7 Deputy Incident Controllers
8. 8 Site Main Controllers
9. 9 Safe Assembly Points
10. 10 Fire & Toxicity Control Arrangements
11. 11 Medical Arrangements
12. 12 Transport & Evacuation Arrangement
13. 13 Pollution Control Arrangements
14. 14 Alarms & Sirens
15. 15 Internal Phones
16. 16 External Phones
17. 17 Nominated persons to declare major emergency
18. 18 Record Of Past Incident

Appendix 4 (Hydrodynamic Modeling / Shoreline Study Report)
HYDRODYNAMIC AND SEDIMENT TRANSPORT MODELING STUDIES FOR THE EXPANSION OF
ADANI PETRONET (DAHEJ) PORT PRIVATE LIMITED GUJARAT
FINAL REPORT
Consultancy Project Sponsored
by
Cholamandalam MS Risk Service Limited
Chennai – 600 001
Principal Consultant: Dr. Prasad K. Bhaskaran
Department of Ocean Engineering & Naval Architecture Indian Institute of Technology, Kharagpur
Kharagpur, West Bengal (INDIA)
April 2014
1
CONTENTS
I. STUDY REGION 1 II. BATHYMETRY OF THE STUDY REGION 3 III. GRID STRUCTURE F THE STUDY REGION 4 MODEL DESCRIPTION 8 1. Introduction 8 1.1 Description of the SWAN Wave Model 8 1.2 The Action Balance Equation 9 1.2.1 Source and Sink Mechanisms in SWAN 10 1.2.2 Generation by Wind - Sin 10 1.2.3 Non-linear Wave-Wave Interactions - Snl 13 1.2.4 Dissipation Mechanisms - Sds 15 2.1 Wave induced setup 19 3.1 Numerical Approaches 20 3.1.1 Numerical Stability 23 4.1 Description of ADCIRC Hydrodynamic model 24 5.1 The SEDTRANS Model 26 IV. HYDRODYNAMICS FOR THE MONTH 28 OF DECEMBER 2013 V. HYDRODYNAMICS FOR THE MONTH 56 OF JANUARY 2014 VI. HYDRODYNAMICS FOR THE MONTH 82 OF FEBRUARY 2014 VII. HYDRODYNAMICS FOR THE MONTH 107 OF MARCH 2014 VIII. SEDIMENT TRANSPORT MODELING 130 IX. COMMENTS AND RECOMMENDATIONS 150

2
I. Study Region
The Gulf of Khambhat located in the west coast of India has the highest tidal range along
the Indian coastline. The large variations in tidal range create strong currents observed all
along the Gulf region. The Gulf has a width of about 80 Km at the mouth that funnels
down to 25 Km over the longitudinal reach of 140 Km. The bottom topography of Gulf
comprise of large tidal flats with numerous tidal creeks. Rivers such as ambika, Purna,
Kim, Tapti, Narmada, mahe, Sabarmati and Dhadhar discharge into the Gulf. Sand shoals
such as the Mal Bank is prominent in the northern reach of the Gulf. The middle portion
of Gulf is deeper with depth ranging upto 30 m. The seabed in most parts of the Gulf
remains quasi-steady state with sand bars migrating with tides. Due to the presence of
strong flood and ebb tides, the water in Gulf remains always turbid with high bed and
suspended sediment loads. The Adani Petronet has a port facility in the upper portion in
the Dahej area, Gulf of Khambhat.
Figure-1: The proposed and existing backup area of Adani Petronet PPL, Dahej
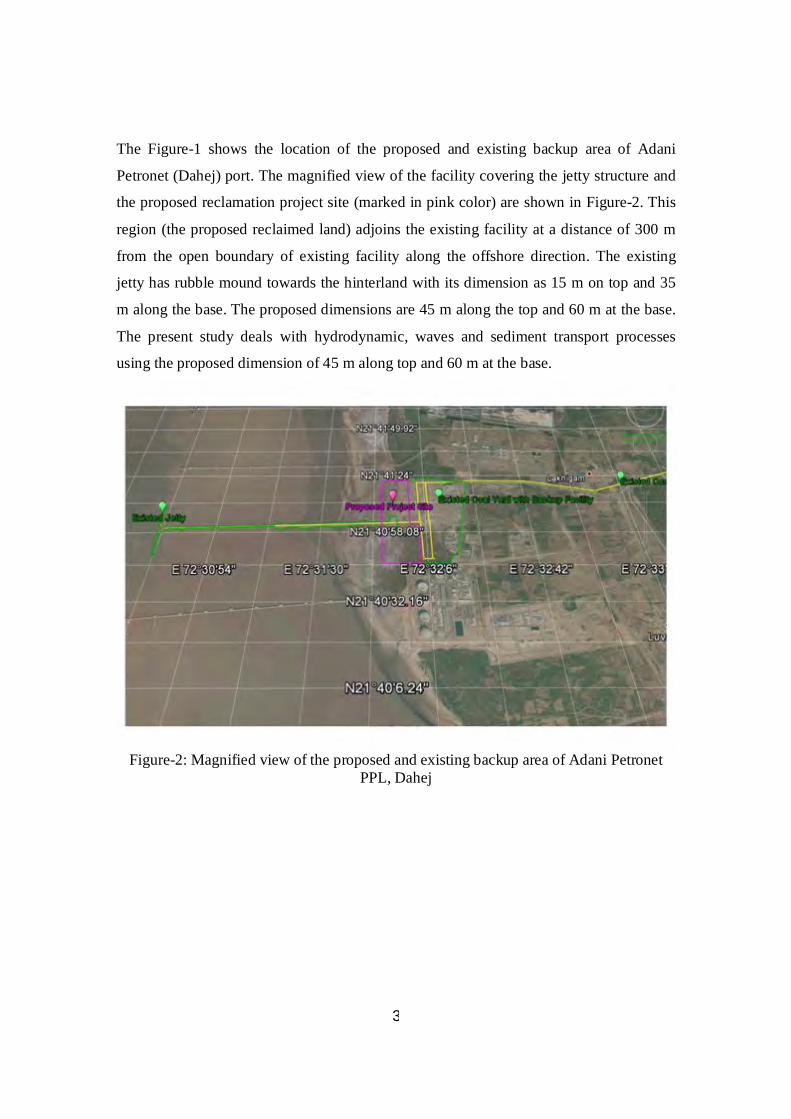
3
The Figure-1 shows the location of the proposed and existing backup area of Adani
Petronet (Dahej) port. The magnified view of the facility covering the jetty structure and
the proposed reclamation project site (marked in pink color) are shown in Figure-2. This
region (the proposed reclaimed land) adjoins the existing facility at a distance of 300 m
from the open boundary of existing facility along the offshore direction. The existing
jetty has rubble mound towards the hinterland with its dimension as 15 m on top and 35
m along the base. The proposed dimensions are 45 m along the top and 60 m at the base.
The present study deals with hydrodynamic, waves and sediment transport processes
using the proposed dimension of 45 m along top and 60 m at the base.
Figure-2: Magnified view of the proposed and existing backup area of Adani Petronet
PPL, Dahej
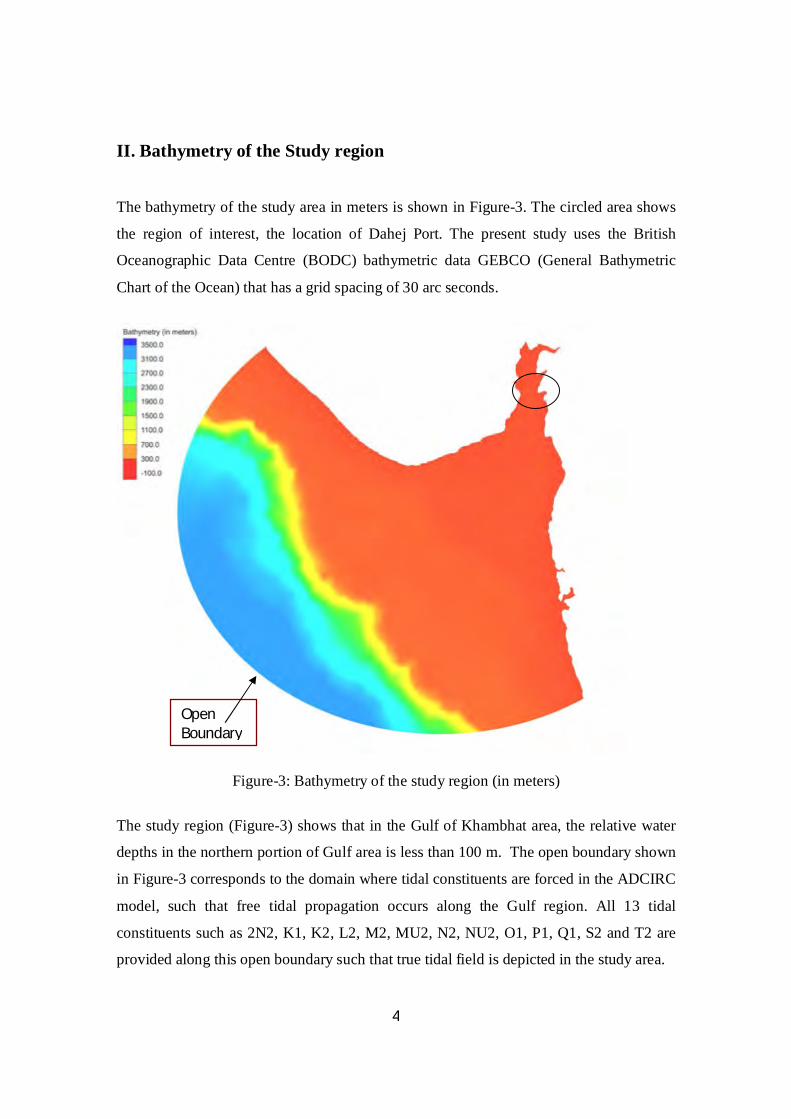
4
II. Bathymetry of the Study region
The bathymetry of the study area in meters is shown in Figure-3. The circled area shows
the region of interest, the location of Dahej Port. The present study uses the British
Oceanographic Data Centre (BODC) bathymetric data GEBCO (General Bathymetric
Chart of the Ocean) that has a grid spacing of 30 arc seconds.
Figure-3: Bathymetry of the study region (in meters)
The study region (Figure-3) shows that in the Gulf of Khambhat area, the relative water
depths in the northern portion of Gulf area is less than 100 m. The open boundary shown
in Figure-3 corresponds to the domain where tidal constituents are forced in the ADCIRC
model, such that free tidal propagation occurs along the Gulf region. All 13 tidal
constituents such as 2N2, K1, K2, L2, M2, MU2, N2, NU2, O1, P1, Q1, S2 and T2 are
provided along this open boundary such that true tidal field is depicted in the study area.
Open Boundary
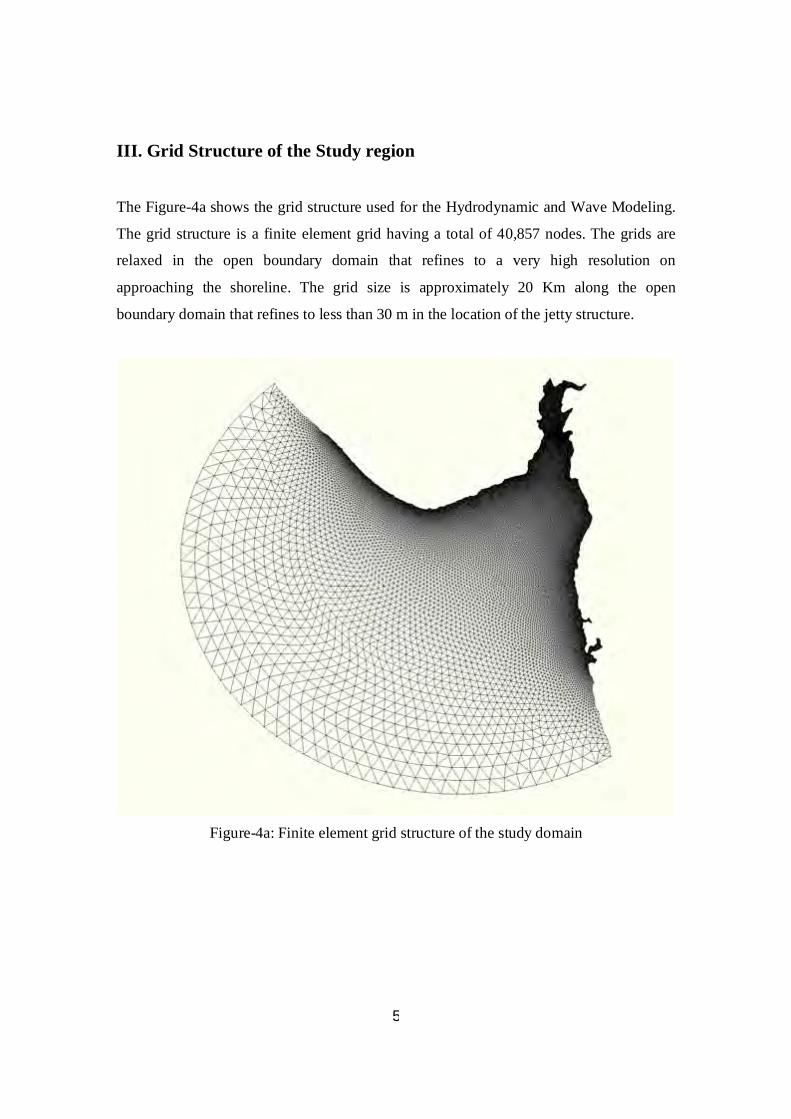
5
III. Grid Structure of the Study region
The Figure-4a shows the grid structure used for the Hydrodynamic and Wave Modeling.
The grid structure is a finite element grid having a total of 40,857 nodes. The grids are
relaxed in the open boundary domain that refines to a very high resolution on
approaching the shoreline. The grid size is approximately 20 Km along the open
boundary domain that refines to less than 30 m in the location of the jetty structure.
Figure-4a: Finite element grid structure of the study domain
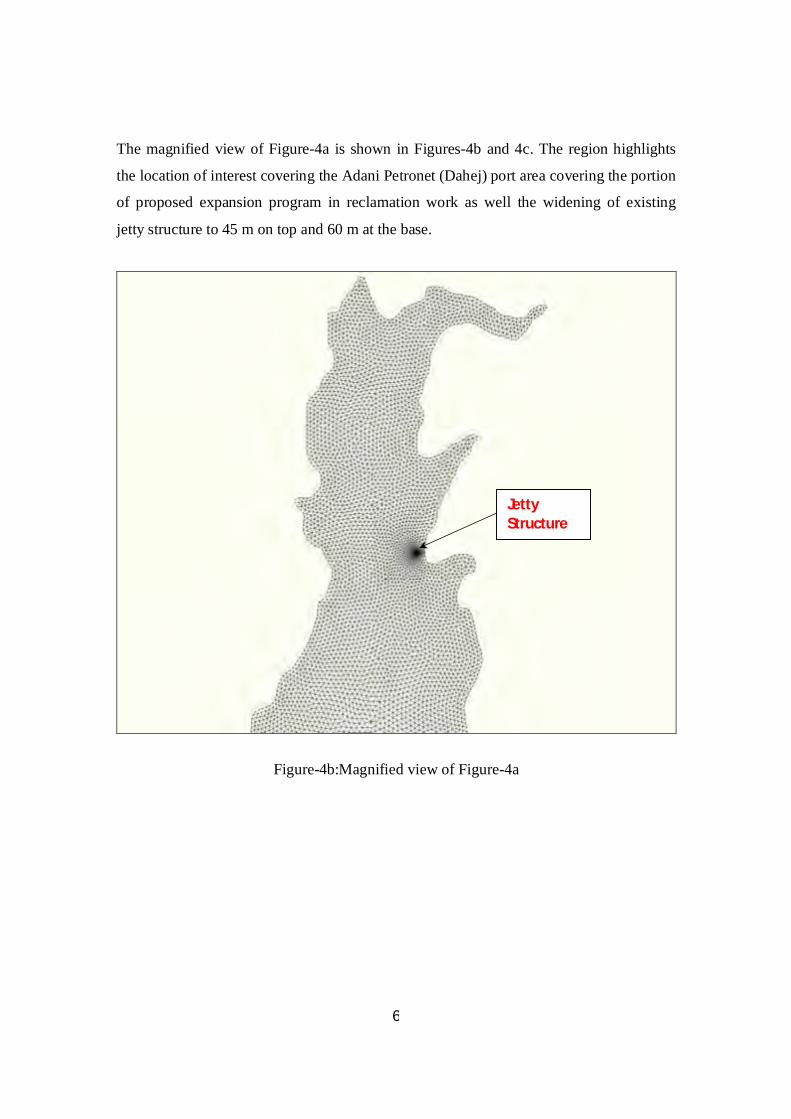
6
The magnified view of Figure-4a is shown in Figures-4b and 4c. The region highlights
the location of interest covering the Adani Petronet (Dahej) port area covering the portion
of proposed expansion program in reclamation work as well the widening of existing
jetty structure to 45 m on top and 60 m at the base.
Figure-4b:Magnified view of Figure-4a
Jetty Structure
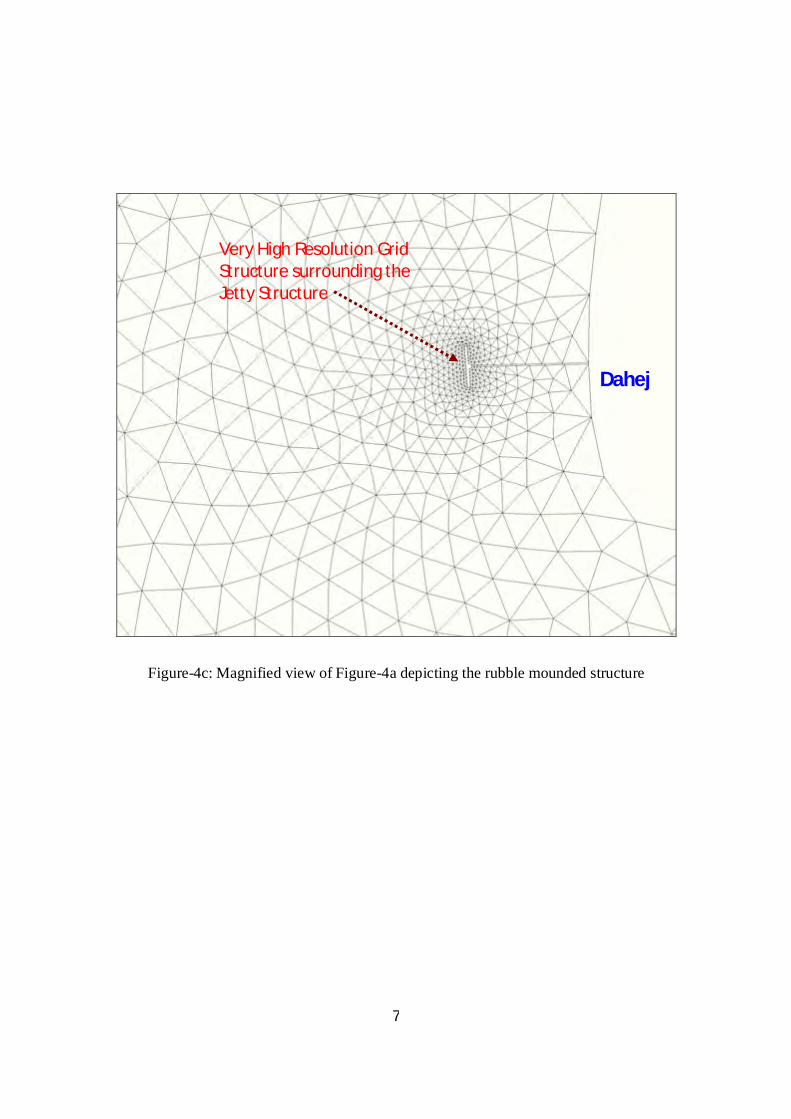
7
Figure-4c: Magnified view of Figure-4a depicting the rubble mounded structure
Dahej
Very High Resolution Grid Structure surrounding the Jetty Structure
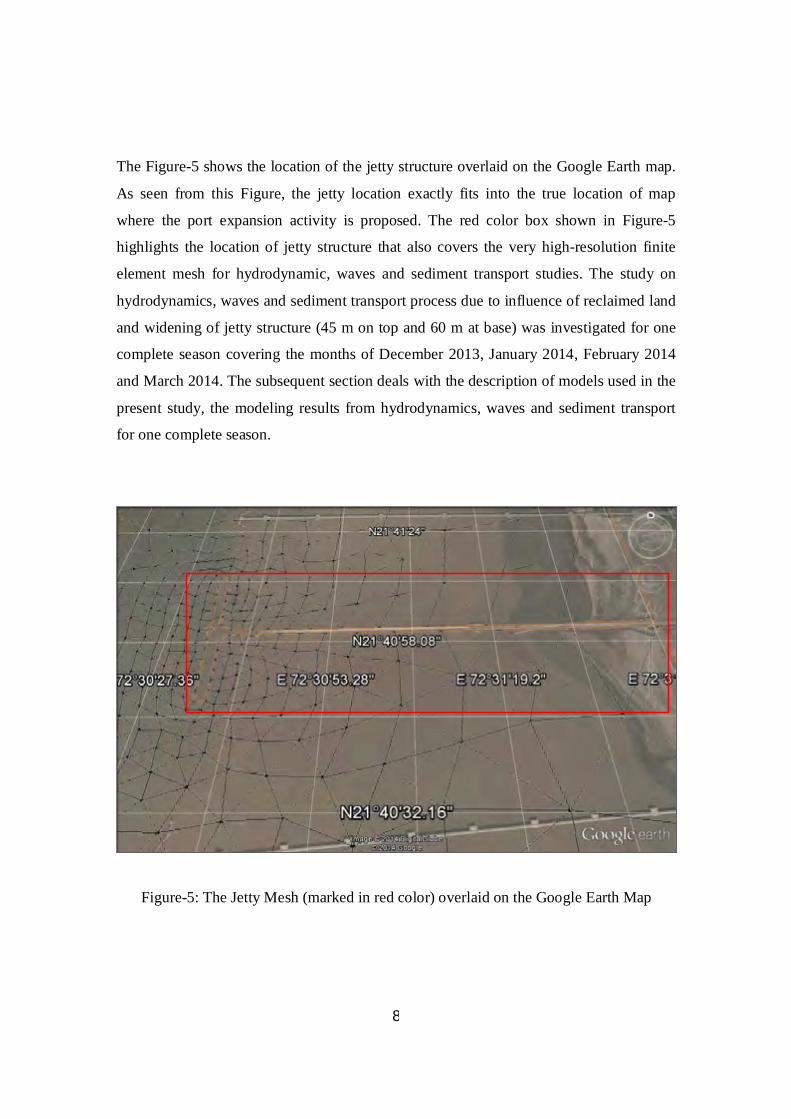
8
The Figure-5 shows the location of the jetty structure overlaid on the Google Earth map.
As seen from this Figure, the jetty location exactly fits into the true location of map
where the port expansion activity is proposed. The red color box shown in Figure-5
highlights the location of jetty structure that also covers the very high-resolution finite
element mesh for hydrodynamic, waves and sediment transport studies. The study on
hydrodynamics, waves and sediment transport process due to influence of reclaimed land
and widening of jetty structure (45 m on top and 60 m at base) was investigated for one
complete season covering the months of December 2013, January 2014, February 2014
and March 2014. The subsequent section deals with the description of models used in the
present study, the modeling results from hydrodynamics, waves and sediment transport
for one complete season.
Figure-5: The Jetty Mesh (marked in red color) overlaid on the Google Earth Map
9
I. Model Description
1. Introduction
The state-of-art numerical wave model, hydrodynamic and sediment transport models is
discussed. The SWAN model (latest version 40.91) was used to simulate basic wave
parameters such as significant wave height, wave period and wave direction used in this
study. The hydrodynamic model ADCIRC was used to study the hydrodynamic variables
such as the flow field and water level elevation for the study domain covering the jetty
structure. The results from SWAN and ADCIRC are integrated to the SEDTRANS
model to evaluate and assess the mechanics of sediment transport from the proposed
reclamation near the jetty location.
1.1 Description of the SWAN Wave Model
The SWAN (Simulating WAves Nearshore) numerical model, is a state-of-art third
generation wave model designed exclusively to simulate waves in the coastal and near-
shore waters, and developed at Delft University of Technology, Netherlands (Booij et
al.,1999). Similar to the other third generation wave models such as WAM (WAMDI
Group, 1988), WAVE WATCH III (Tolman, 1991), it solves the spectral action balance
equation without any a priori restrictions on the spectrum for the evolution of wave
growth. In other words, SWAN is an extension of the third-generation deep-water wave
model. It incorporates the state-of-the-art formulations for deep-water processes relevant
to wave generation, dissipation and the quadruplet wave-wave interactions from WAM
model (Komen et al., 1994) with additional shallow water processes, such as state-of-the-
art formulations for dissipation due to bottom friction, triad wave-wave interactions and
depth-induced breaking.
The first version of SWAN model called Cycle-1, was formulated to handle only
stationary conditions on a rectangular grid. Further developments to handle both
stationary and non-stationary conditions on a curvilinear grid led to the Cycle-2 version
10
of SWAN model. The previous versions such as 30.62, 30.75, 32.10 and 40.01 are
categorized in the Cycle-2 versions. Subsequent modifications in the model physics,
nesting mechanisms, and incorporation of wave damping due to vegetations led to the
Cycle 3 versions. The Cycle-3 version of SWAN includes 40.11, 40.20, 40.31, 40.41,
40.51, 40.72, 40.81, 40.85 and 40.91. Based on extensive verification with field
measurements (Holthuijsen et al., 1997 and Mai et al., 1999), the SWAN model is an
ideal and robust model for shallow waters and near-shore wave modeling.
1.2 The Action Balance Equation
The wave models generally solve the energy balance equation ( , ; , , )E x y t . However,
models like WAM and SWAN that accounts for wave-current interactions, determine
evolution of action density ( , ; , )N x t based in terms of relative radian frequency
rather than absolute frequency . The action density N is defined as the ratio of total
energy to the frequency ( /E ) which is conserved during propagation in the presence of
ambient current, whereas energy density E is not. The evolution of this action density N
is governed by the action balance equation (Komen et al., 1994), which is:
.[ ] totgx
c N c N SN c U Nt
(1)
The left hand side of Eq.1 represents the kinematics part, and the right hand side
represents combinations of various source and sink term totS . The first term in the
kinematics part, represents the local rate of change of action density in time, and the
second term denotes the propagation of wave energy in two-dimensional geographical
x -space, with group velocity c . The third term represents the effect of shifting
frequency due to variations in depth and mean currents. The fourth term represents depth-
induced and current-induced refraction. The source and sink terms includes the wave
generation, non-linear wave-wave interactions and dissipation processes. The quantities
c and c are the propagation velocities in spectral space ( , ). The Eq.1 in a Cartesian
coordinate system can be represented by:
11
yx totc Nc N c N c N SN
t x y
(2)
The Eq.2 reduces to Eq.3 (below) in the absence of ambient current, called the energy
balance equation which depends on the absolute radian frequency instead of .
, ,g x g y totc E c E c E SE
t x y
(3)
1.2.1 Source and Sink Mechanisms in SWAN
This sub-section deals with important physical processes of generation by wind,
dissipation due to depth-induced breaking, white-capping, bottom friction and non-linear
wave-wave interactions, implemented in the SWAN model. In general, the sources and
sink mechanism in SWAN can be represented mathematically as:
3 4 , , ,tot in nl nl ds w ds b ds brS S S S S S S (4)
where, inS represents the wave growth by wind; 3 4,nl nlS S represents the non-linear transfer
of wave energy by the triad and quadruplet interactions, and , , ,, ,ds w ds b ds brS S S represents
the wave decay due to white-capping, bottom friction and depth-induced wave breaking.
1.2.2 Generation by Wind - inS
Waves in the open ocean are generated by continuous flow of wind on its surface. This
transfer of wind energy takes place via the wind stress. Phillips (1957) and Miles (1957)
suggested that the momentum transfer from atmosphere to free surface is because of two
phenomena: an external turbulent pressure forcing mechanism and a linear feedback
mechanism. This can be expressed as:
( , ) . ( , )inS E (5)

12
where ( , )inS is a function of relative radian frequency and wave direction . The term
‘ ’ in the above equation represent Phillips mechanism of linearity for wave growth
with respect to time, and ‘ .E ’ is the Miles instability mechanism which supports the
exponential growth in time. Normally the wind speed at a height of 10 meter above sea-
surface ( 10U ) is specified in SWAN, the calculations requires the friction velocity *u
obtained from the formula: 2 2* 10Du C U (6)
where, DC is the wind-drag coefficient. The drag coefficient formulation in the SWAN
follows from Wu (1982): -3 -1
10-3 -1
10 10
1.2875 10 , for 7.5
(0.8 0.065 ) 10 , for 7.5 D
U msC
U U ms
(7)
The first drag formulation in Eq.7 is of WAM Cycle-3 and the second is of WAM Cycle-
4. For the WAM Cycle-4 formulation in SWAN, calculation of friction velocity *u is an
integral part to compute wave generation by wind. The formulation for in Eq.5,
representing the initial wave growth, is due to Cavaleri and Malanotte-Rizzoli (1981)
with a cut off to avoid growth at frequencies lower than the Pierson-Moskowitz
frequency (Tolman, 1992a).
3
4*2
1.5 10 [ cos( - )] for - 902
0 for 90
wind wind
wind
u Gg
(8)
where, the cut-off function G is give by: 4
0 13exp with 228
*PM*
PM *
. gGu
(9)
In Eqs.8 and 9, wind is the wind direction and *PM is the peak-frequency of the Pierson-
Moskowitz spectrum (1964) respectively.
13
For the exponential growth part of Eq.5, is taken from Synder et al. (1984) and Komen
et al. (1984). Mathematically it is given by:
*max 0 0 25 [28 cos 1]airwind
water
u, . ( )c
(10)
where, c is the phase speed and air and water are the densities of air and water,
respectively. In the Cycle-4 formulation of WAM in SWAN, the coefficient is taken
from Komen et al. (1994).
2
2 4*2
1 2max 0 cos , lnairwind
water
u ., ( - )c
(11)
in which being the parameter due to Janssen (1991) where,
2 exp[ cos( ) ] for 1e* wind
gz c / |u |c
(12)
and
0 for 1 (13)
In the above Eq.3.22, =0.41 (von-Karman constant) and ez is the effective surface
roughness height. *u is the friction velocity computed using the Janssen (1991)
formulae:
10*
010ln e
e
Uuz zz
(14)
in which, 2*
0 0.001uzg
(surface-roughness length) and 0
1 /ewave
zz
, where
2*airu is total surface stress, wave is the wave-induced stress given by:
2
0 0,wave water E d d
(15)
14
Thus using above the set of equations *u is determined for a given wind speed 10U .
1.2.3 Non-linear Wave-Wave Interactions - nlS
The mechanisms that affects wave growth in deep water and shallow water is the transfer
of energy amongst the waves, i.e., from one wave to another, by resonance. In the deeper
ocean, resonance conditions accounts from viz; matching of wave speed, wavelength and
direction when one pair of wave components interact with another pair. It is termed the
quadruplet wave-wave interaction. In shallow waters, the quadruplets change and the
corresponding wave-wave interactions become even stronger than in deep water with
shift of low frequency-lobe to lower frequencies. These interactions may grow so strong,
that the underlying assumptions from the theory of quadruplet wave-wave interactions do
not hold. To capture these effects of energy transfer in shallower water, triad wave-wave
interaction is considered.
(i) Quadruplet Wave-Wave Interactions
In the open ocean, non-linear interaction is explained by quadruplet wave-wave
interactions. In SWAN, quadruplet interaction is computed using the discrete-interaction
approximation (DIA) of Hasselmann et al. (1985). In the DIA theory two quadruplets of
wave numbers are considered, both with the following frequencies:
1 2
3
4
(1 )
(1 )
(16)
where, =0.25 is a coefficient which is constant. In order to satisfy the resonance
condition for the first quadruplet (deep water), the wave-number vectors with frequencies
3 and 4 lie at angles 1 11.5 and 2 33.6 to the other two wave-number
vectors 1 and 2 that are identical to each other in frequency, wave number and
direction. The second quadruplet is the mirror of the first quadruplet i.e. wave number
with frequency 3 and 4 lie at mirror angles of 3 11.5 and 4 33.6 . The source
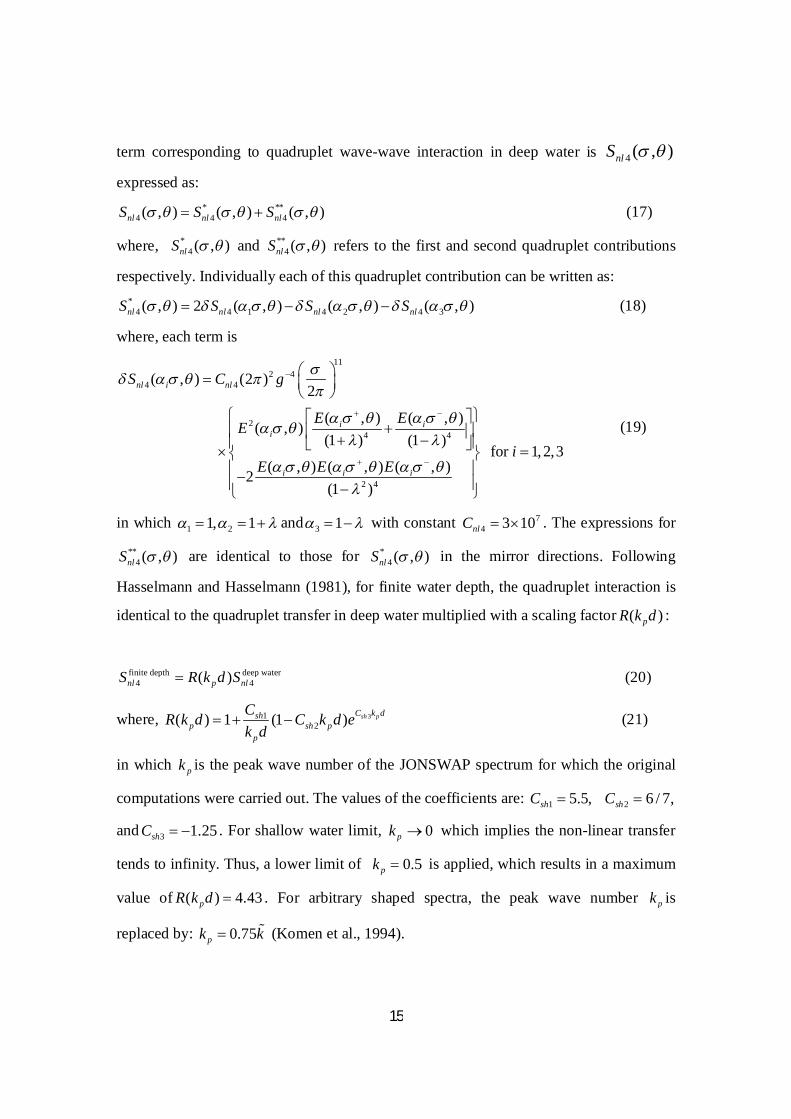
15
term corresponding to quadruplet wave-wave interaction in deep water is 4 ( , )nlS
expressed as: * **
4 4 4( , ) ( , ) ( , )nl nl nlS S S (17)
where, *4 ( , )nlS and **
4 ( , )nlS refers to the first and second quadruplet contributions
respectively. Individually each of this quadruplet contribution can be written as: *
4 4 1 4 2 4 3( , ) 2 ( , ) ( , ) ( , )nl nl nl nlS S S S (18)
where, each term is 11
2 44 4
24 4
2 4
( , ) (2 )2
( , ) ( , )( , )(1 ) (1 )
for 1,2,3( , ) ( , ) ( , )2
(1 )
nl i nl
i ii
i i i
S C g
E EEi
E E E
(19)
in which 1 21, 1 and 3 1 with constant 74 3 10nlC . The expressions for
**4 ( , )nlS are identical to those for *
4 ( , )nlS in the mirror directions. Following
Hasselmann and Hasselmann (1981), for finite water depth, the quadruplet interaction is
identical to the quadruplet transfer in deep water multiplied with a scaling factor ( )pR k d :
finite depth deep water
4 4( )nl p nlS R k d S (20)
where, 312( ) 1 (1 ) sh pC k dsh
p sh pp
CR k d C k d ek d
(21)
in which pk is the peak wave number of the JONSWAP spectrum for which the original
computations were carried out. The values of the coefficients are: 1 5.5,shC 2 6 / 7,shC
and 3 1.25shC . For shallow water limit, 0pk which implies the non-linear transfer
tends to infinity. Thus, a lower limit of 0.5pk is applied, which results in a maximum
value of ( ) 4.43pR k d . For arbitrary shaped spectra, the peak wave number pk is
replaced by: 0.75pk k (Komen et al., 1994).
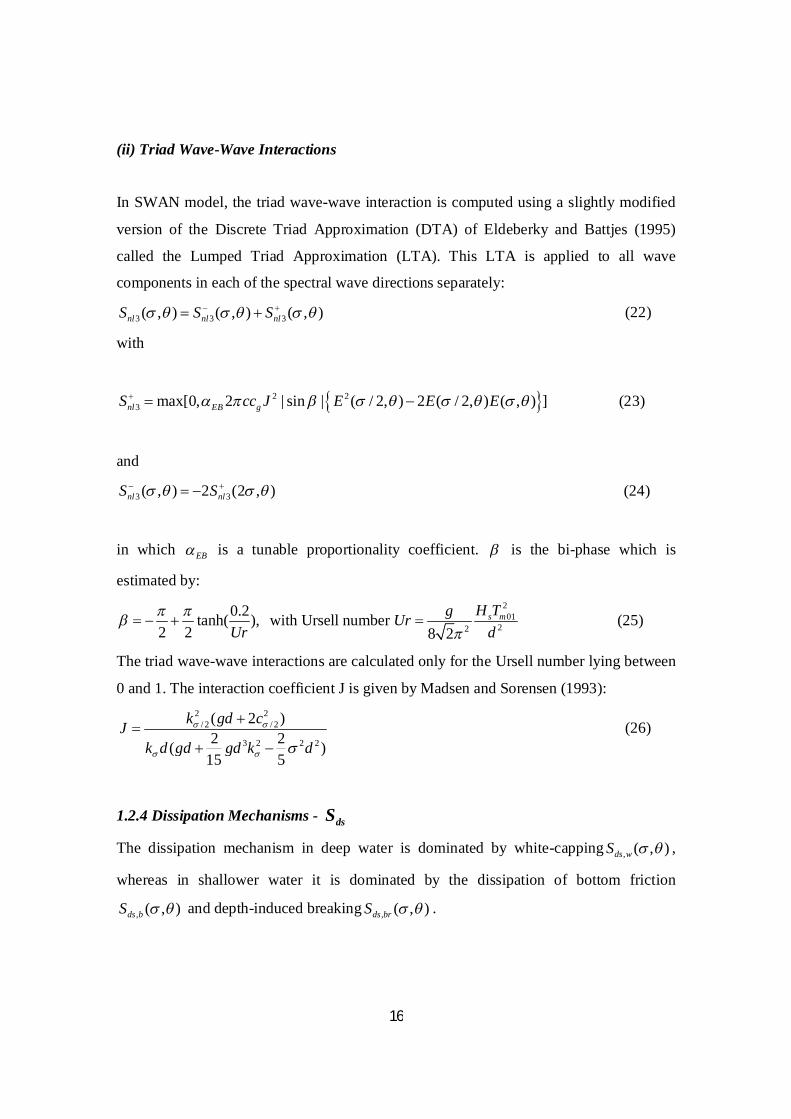
16
(ii) Triad Wave-Wave Interactions
In SWAN model, the triad wave-wave interaction is computed using a slightly modified
version of the Discrete Triad Approximation (DTA) of Eldeberky and Battjes (1995)
called the Lumped Triad Approximation (LTA). This LTA is applied to all wave
components in each of the spectral wave directions separately:
3 3 3( , ) ( , ) ( , )nl nl nlS S S (22)
with
2 23 max[0, 2 | sin | ( / 2, ) 2 ( / 2, ) ( , ) ]nl EB gS cc J E E E (23)
and
3 3( , ) 2 (2 , )nl nlS S (24)
in which EB is a tunable proportionality coefficient. is the bi-phase which is
estimated by: 201
22
0.2tanh( ), with Ursell number 2 2 8 2
s mH TgUrUr d
(25)
The triad wave-wave interactions are calculated only for the Ursell number lying between
0 and 1. The interaction coefficient J is given by Madsen and Sorensen (1993): 2 2
/ 2 / 2
3 2 2 2
( 2 )2 2( )
15 5
k gd cJk d gd gd k d
(26)
1.2.4 Dissipation Mechanisms - dsS
The dissipation mechanism in deep water is dominated by white-capping , ( , )ds wS ,
whereas in shallower water it is dominated by the dissipation of bottom friction
, ( , )ds bS and depth-induced breaking , ( , )ds brS .
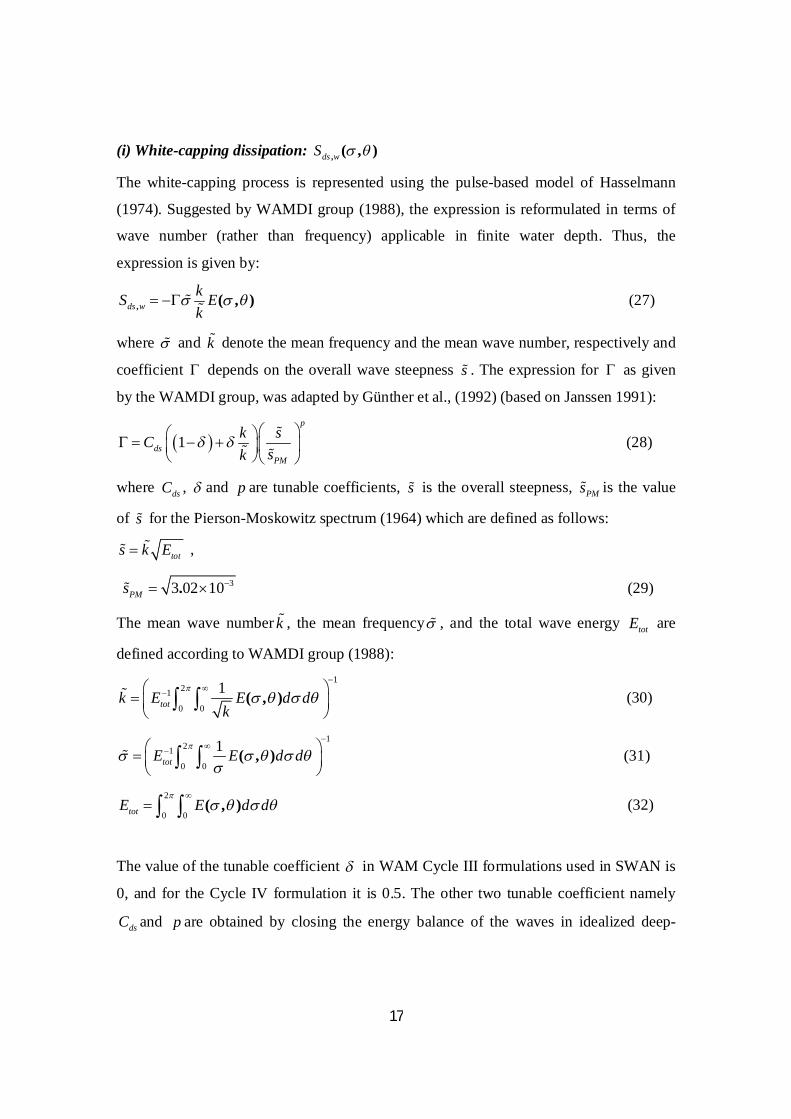
17
(i) White-capping dissipation: ds wS , ( , )
The white-capping process is represented using the pulse-based model of Hasselmann
(1974). Suggested by WAMDI group (1988), the expression is reformulated in terms of
wave number (rather than frequency) applicable in finite water depth. Thus, the
expression is given by:
ds wkS Ek
, ( , ) (27)
where and k denote the mean frequency and the mean wave number, respectively and
coefficient depends on the overall wave steepness s . The expression for as given
by the WAMDI group, was adapted by Günther et al., (1992) (based on Janssen 1991):
1p
dsPM
k sCsk
(28)
where dsC , and p are tunable coefficients, s is the overall steepness, PMs is the value
of s for the Pierson-Moskowitz spectrum (1964) which are defined as follows:
tots k E ,
33 02 10PMs . (29)
The mean wave number k , the mean frequency , and the total wave energy totE are
defined according to WAMDI group (1988): 1
21
0 0
1 ( , )totk E E d dk
(30)
121
0 0
1 ( , )totE E d d
(31)
2
0 0( , )totE E d d
(32)
The value of the tunable coefficient in WAM Cycle III formulations used in SWAN is
0, and for the Cycle IV formulation it is 0.5. The other two tunable coefficient namely
dsC and p are obtained by closing the energy balance of the waves in idealized deep-
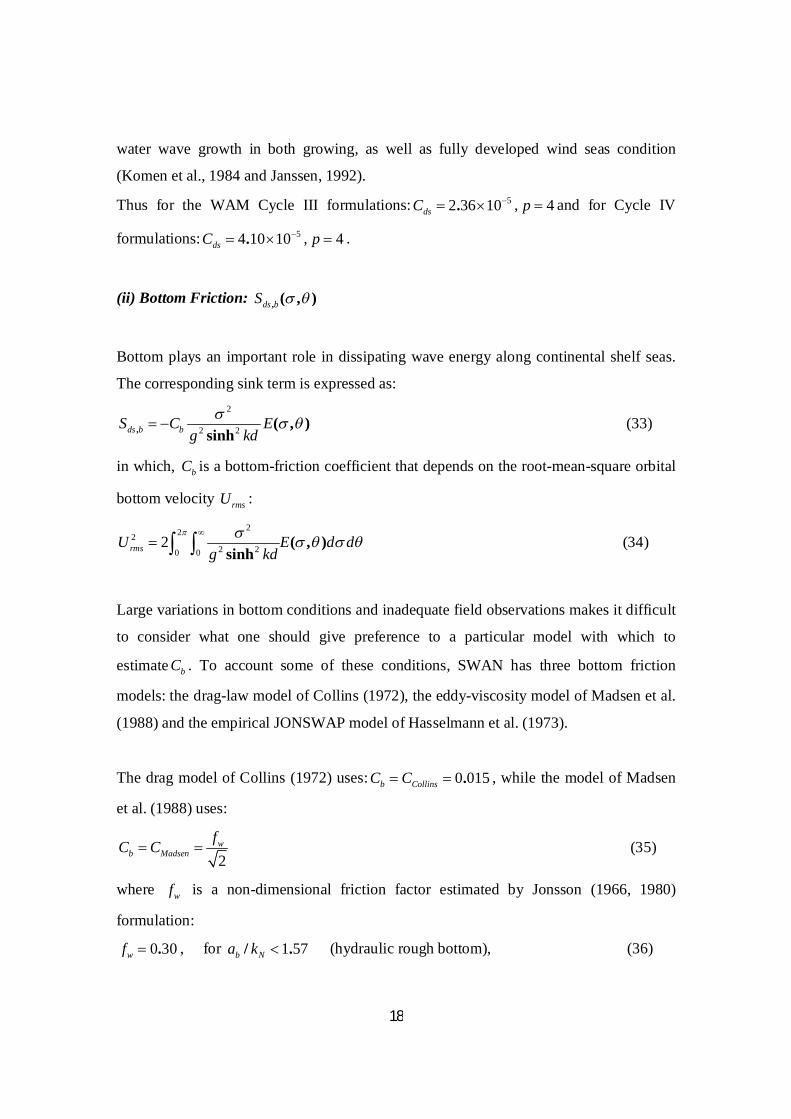
18
water wave growth in both growing, as well as fully developed wind seas condition
(Komen et al., 1984 and Janssen, 1992).
Thus for the WAM Cycle III formulations: 52 36 10.dsC , 4p and for Cycle IV
formulations: 54 10 10.dsC , 4p .
(ii) Bottom Friction: , ( , )ds bS
Bottom plays an important role in dissipating wave energy along continental shelf seas.
The corresponding sink term is expressed as: 2
2 2, ( , )sinhds b bS C E
g kd (33)
in which, bC is a bottom-friction coefficient that depends on the root-mean-square orbital
bottom velocity rmsU :
2222 20 0
2 ( , )sinhrmsU E d d
g kd
(34)
Large variations in bottom conditions and inadequate field observations makes it difficult
to consider what one should give preference to a particular model with which to
estimate bC . To account some of these conditions, SWAN has three bottom friction
models: the drag-law model of Collins (1972), the eddy-viscosity model of Madsen et al.
(1988) and the empirical JONSWAP model of Hasselmann et al. (1973).
The drag model of Collins (1972) uses: 0 015.b CollinsC C , while the model of Madsen
et al. (1988) uses:
2w
b MadsenfC C (35)
where wf is a non-dimensional friction factor estimated by Jonsson (1966, 1980)
formulation:
0 30.wf , for 1 57/ .b Na k (hydraulic rough bottom), (36)
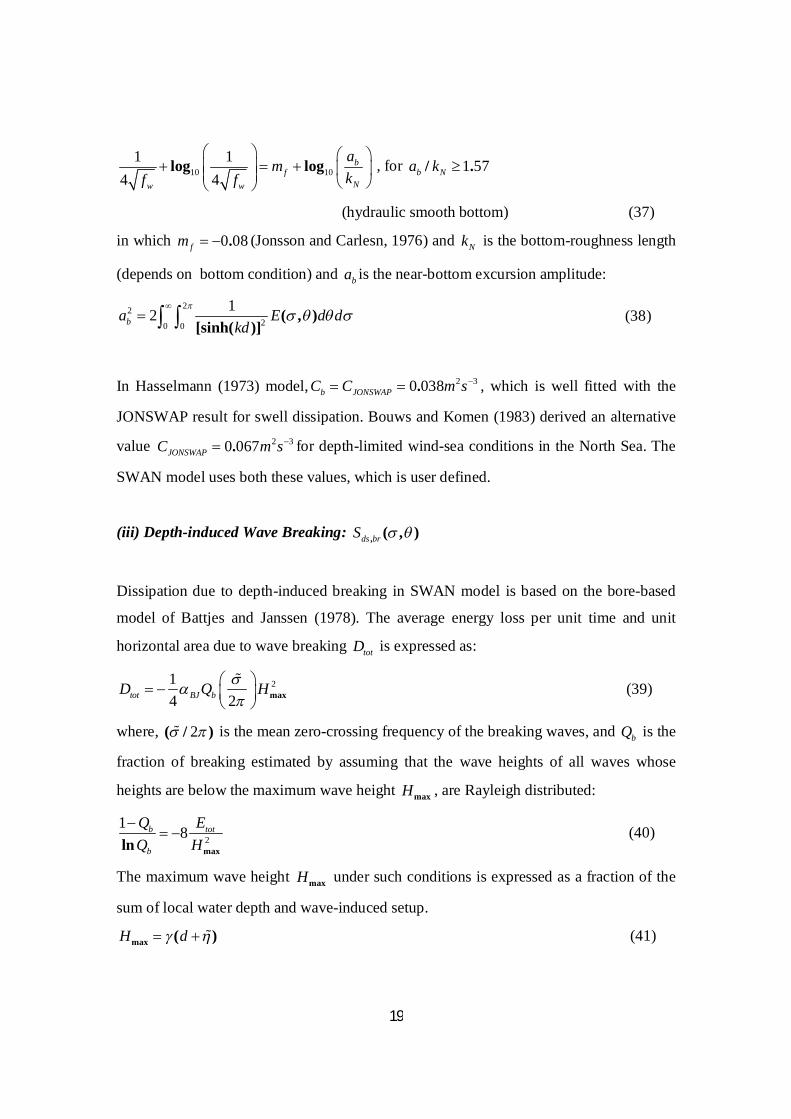
19
10 101 1
4 4log log b
fNw w
amkf f
, for 1 57/ .b Na k
(hydraulic smooth bottom) (37)
in which 0 08.fm (Jonsson and Carlesn, 1976) and Nk is the bottom-roughness length
(depends on bottom condition) and ba is the near-bottom excursion amplitude:
2220 0
12 ( , )[sinh( )]ba E d d
kd
(38)
In Hasselmann (1973) model, 2 30 038.b JONSWAPC C m s , which is well fitted with the
JONSWAP result for swell dissipation. Bouws and Komen (1983) derived an alternative
value 2 30 067.JONSWAPC m s for depth-limited wind-sea conditions in the North Sea. The
SWAN model uses both these values, which is user defined.
(iii) Depth-induced Wave Breaking: , ( , )ds brS
Dissipation due to depth-induced breaking in SWAN model is based on the bore-based
model of Battjes and Janssen (1978). The average energy loss per unit time and unit
horizontal area due to wave breaking totD is expressed as:
214 2 maxtot BJ bD Q H
(39)
where, 2( / ) is the mean zero-crossing frequency of the breaking waves, and bQ is the
fraction of breaking estimated by assuming that the wave heights of all waves whose
heights are below the maximum wave height maxH , are Rayleigh distributed:
2
18
maxlnb tot
b
Q EQ H
(40)
The maximum wave height maxH under such conditions is expressed as a fraction of the
sum of local water depth and wave-induced setup.
max ( )H d (41)
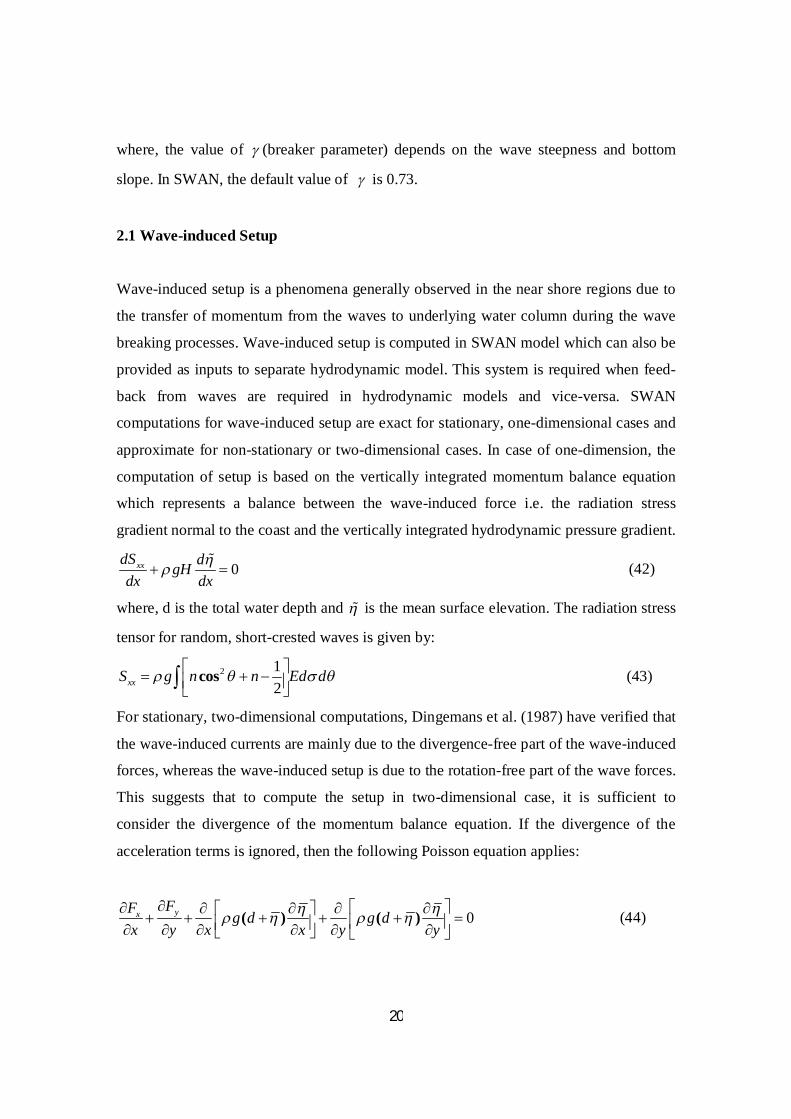
20
where, the value of (breaker parameter) depends on the wave steepness and bottom
slope. In SWAN, the default value of is 0.73.
2.1 Wave-induced Setup
Wave-induced setup is a phenomena generally observed in the near shore regions due to
the transfer of momentum from the waves to underlying water column during the wave
breaking processes. Wave-induced setup is computed in SWAN model which can also be
provided as inputs to separate hydrodynamic model. This system is required when feed-
back from waves are required in hydrodynamic models and vice-versa. SWAN
computations for wave-induced setup are exact for stationary, one-dimensional cases and
approximate for non-stationary or two-dimensional cases. In case of one-dimension, the
computation of setup is based on the vertically integrated momentum balance equation
which represents a balance between the wave-induced force i.e. the radiation stress
gradient normal to the coast and the vertically integrated hydrodynamic pressure gradient.
0xxdS dgHdx dx
(42)
where, d is the total water depth and is the mean surface elevation. The radiation stress
tensor for random, short-crested waves is given by:
2 12
cosxxS g n n Ed d (43)
For stationary, two-dimensional computations, Dingemans et al. (1987) have verified that
the wave-induced currents are mainly due to the divergence-free part of the wave-induced
forces, whereas the wave-induced setup is due to the rotation-free part of the wave forces.
This suggests that to compute the setup in two-dimensional case, it is sufficient to
consider the divergence of the momentum balance equation. If the divergence of the
acceleration terms is ignored, then the following Poisson equation applies:
0( ) ( )yxFF g d g d
x y x x y y
(44)
21
which is used in SWAN to compute the setup for random, short-crested waves. This
approximation is only applicable for open coast where there is unlimited supply of water
from outside the domain.
3.1 Numerical Approaches
A numerical algorithm that approximates the wave field has to be stable, economic and
most important is the accuracy in the results. In the third generation wave models,
presence of multiple time steps poses a numerical difficulty hence taking proper care of
these time scales is a necessary condition for stability and accuracy. Considering very
small time steps is impractical and as action balance equation is stiff, economically large
time steps may prevent a stable solution. Particularly, nonlinear wave-wave interaction
poses biggest problem, since this process is associated with high sensitivity to spectral
change.
In SWAN, for small-scale computations, the geographic space is discretized with a
rectangular grid, having constant resolutions x and y along x - and y -directions
respectively. For geographically large-scale computations, the resolutions is kept constant
in terms of longitude and latitude, with resolutions and , respectively. Time
being discretized with a constant time step t for simultaneous integration of propagation
and source terms (time is not considered in stationary runs), and the spectral space is
discretized with constant directional resolution and a constant relative resolution for
the radian frequency / . The frequencies are defined with a fixed low-frequency cut-
off minf and a fixed high-frequency cut-off maxf . This range is known as prognostic range
of the spectrum since the spectral density is free to develop in this range. Typically, this
range varies from 0.04 Hz and 1 Hz. The spectrum is set to zero below the low-frequency
cut-off and above the high-frequency cut-off, an mf tail is imposed. This set of
frequency is called diagnostic range of spectrum. Reason of using a fixed high-frequency
cut-off rather than a dynamic cut-off frequency depends on the wind speed or on the
mean frequency is that, in shallow waters, mixed sea states with rather different
22
characteristic frequencies may present. When using the WAM Cycle-3 wind generation
formulation of Komen et al. (1984) in SWAN, m is set to 4, and while using the WAM
Cycle-4 wind generation formulation of Janssen (1991), m is set to 5.
Wave energy always propagates down-wave, even in the presence of ambient current; the
state at a geographic grid point in SWAN is determined by the state at the up-wave grid
points. Since implicit schemes are always unconditionally stable and the values of the
discrete steps in space and time can be chosen independently, allowing relatively large
time steps in the computations, the most robust numerical propagation scheme would be
an implicit wind-up scheme. For small-scale computations i.e within 25 km range,
implicit first order up-wind difference scheme in geographic space is the best choice
(Holthuijsen et al., 1989). In case of large-scale computations, higher-order implicit
schemes are used to reduce diffusion effects and in directional space, a higher than first-
order scheme is used. There are three alternative up-wind schemes in SWAN which can
be used for propagation in geographic space:
(i) The first order backward space and backward time (BSBT) scheme with
considerable diffusion for both stationary and non stationary cases.
(ii) The second-order S&L scheme (Stelling and Leendertse, 1992) with very little
diffusion for non stationary cases and
(iii) The second-order SORDUP scheme (Rogers et al., 2002), with little diffusion
for stationary cases.
Among these, the BSBT scheme is commonly used for non stationary conditions. The
corresponding discretization of the action balance equation for the BSBT scheme (for
positive propagation speeds) is:
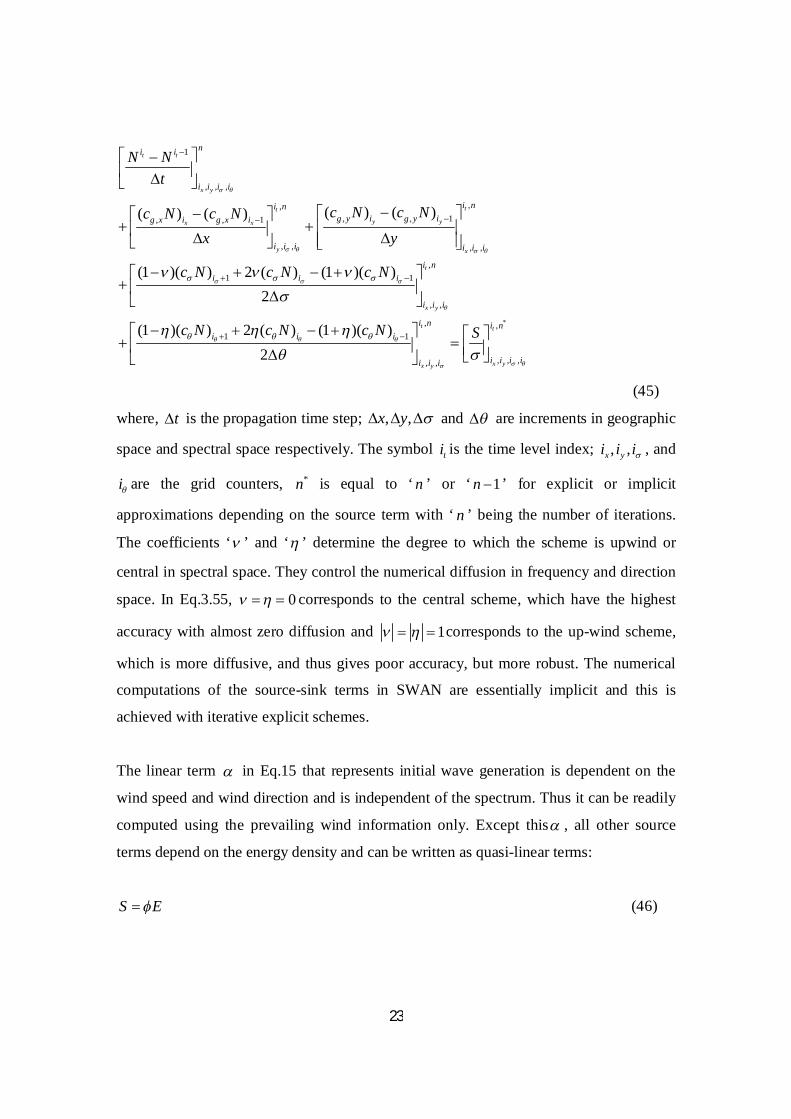
23
1
, , ,
,,, , 1, , 1
, , , ,
,1 1
, ,
1
( ) ( )( ) ( )
(1 )( ) 2 ( ) (1 )( )2
(1 )( ) 2 ( )
t t
x y
tt
y yx x
y x
t
x y
ni i
i i i i
i ni ng y i g y ig x i g x i
i i i i i i
i ni i i
i i i
i i
N Nt
c N c Nc N c Nx y
c N c N c N
c N c N
*, ,1
, , ,, ,
(1 )( )2
t t
x yx y
i n i ni
i i i ii i i
c N S
(45)
where, t is the propagation time step; , ,x y and are increments in geographic
space and spectral space respectively. The symbol ti is the time level index; , ,x yi i i , and
i are the grid counters, *n is equal to ‘ n ’ or ‘ 1n ’ for explicit or implicit
approximations depending on the source term with ‘ n ’ being the number of iterations.
The coefficients ‘ ’ and ‘ ’ determine the degree to which the scheme is upwind or
central in spectral space. They control the numerical diffusion in frequency and direction
space. In Eq.3.55, 0 corresponds to the central scheme, which have the highest
accuracy with almost zero diffusion and 1 corresponds to the up-wind scheme,
which is more diffusive, and thus gives poor accuracy, but more robust. The numerical
computations of the source-sink terms in SWAN are essentially implicit and this is
achieved with iterative explicit schemes.
The linear term in Eq.15 that represents initial wave generation is dependent on the
wind speed and wind direction and is independent of the spectrum. Thus it can be readily
computed using the prevailing wind information only. Except this , all other source
terms depend on the energy density and can be written as quasi-linear terms:
S E (46)
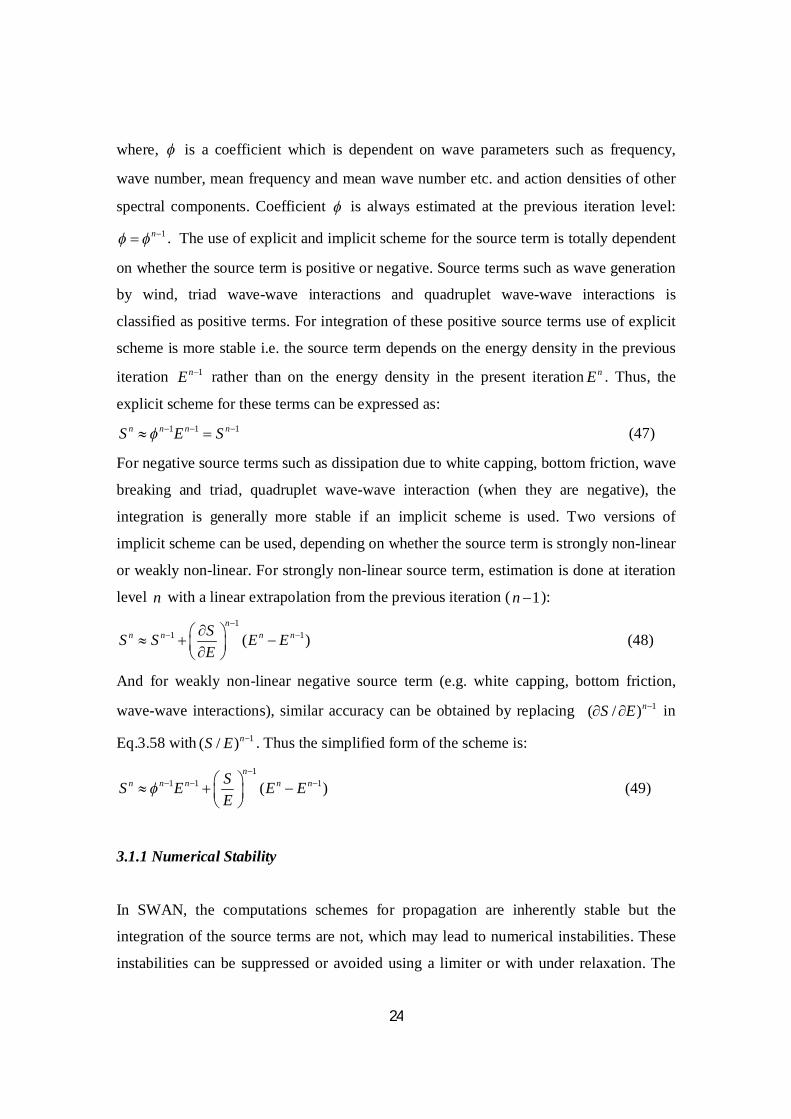
24
where, is a coefficient which is dependent on wave parameters such as frequency,
wave number, mean frequency and mean wave number etc. and action densities of other
spectral components. Coefficient is always estimated at the previous iteration level: 1n . The use of explicit and implicit scheme for the source term is totally dependent
on whether the source term is positive or negative. Source terms such as wave generation
by wind, triad wave-wave interactions and quadruplet wave-wave interactions is
classified as positive terms. For integration of these positive source terms use of explicit
scheme is more stable i.e. the source term depends on the energy density in the previous
iteration 1nE rather than on the energy density in the present iteration nE . Thus, the
explicit scheme for these terms can be expressed as: 1 1 1n n n nS E S (47)
For negative source terms such as dissipation due to white capping, bottom friction, wave
breaking and triad, quadruplet wave-wave interaction (when they are negative), the
integration is generally more stable if an implicit scheme is used. Two versions of
implicit scheme can be used, depending on whether the source term is strongly non-linear
or weakly non-linear. For strongly non-linear source term, estimation is done at iteration
level n with a linear extrapolation from the previous iteration ( 1n ): 1
1 1( )n
n n n nSS S E EE
(48)
And for weakly non-linear negative source term (e.g. white capping, bottom friction,
wave-wave interactions), similar accuracy can be obtained by replacing 1( / )nS E in
Eq.3.58 with 1( / )nS E . Thus the simplified form of the scheme is:
11 1 1( )
nn n n n nSS E E E
E
(49)
3.1.1 Numerical Stability
In SWAN, the computations schemes for propagation are inherently stable but the
integration of the source terms are not, which may lead to numerical instabilities. These
instabilities can be suppressed or avoided using a limiter or with under relaxation. The
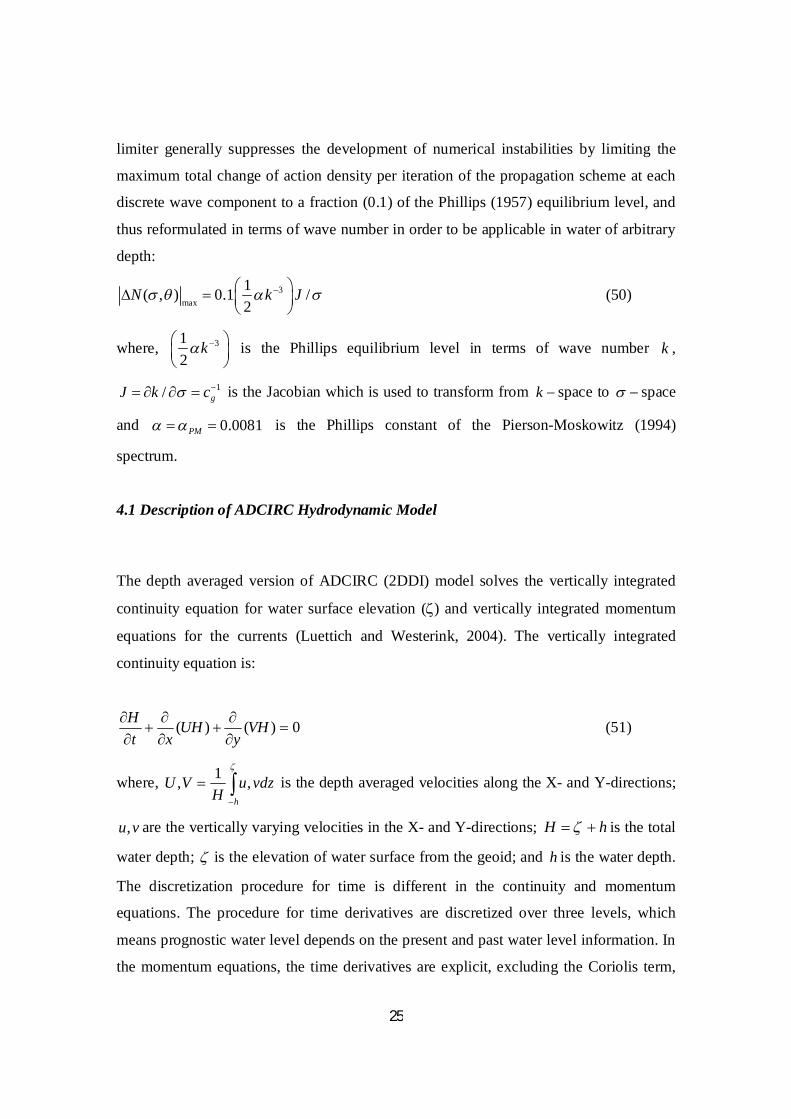
25
limiter generally suppresses the development of numerical instabilities by limiting the
maximum total change of action density per iteration of the propagation scheme at each
discrete wave component to a fraction (0.1) of the Phillips (1957) equilibrium level, and
thus reformulated in terms of wave number in order to be applicable in water of arbitrary
depth:
3max
1( , ) 0.1 /2
N k J
(50)
where, 312
k
is the Phillips equilibrium level in terms of wave number k ,
1/ gJ k c is the Jacobian which is used to transform from k space to space
and 0.0081PM is the Phillips constant of the Pierson-Moskowitz (1994)
spectrum.
4.1 Description of ADCIRC Hydrodynamic Model
The depth averaged version of ADCIRC (2DDI) model solves the vertically integrated
continuity equation for water surface elevation () and vertically integrated momentum
equations for the currents (Luettich and Westerink, 2004). The vertically integrated
continuity equation is:
0)()(
VH
yUH
xtH (51)
where,
h
vdzuH
VU ,1, is the depth averaged velocities along the X- and Y-directions;
vu, are the vertically varying velocities in the X- and Y-directions; hH is the total
water depth; is the elevation of water surface from the geoid; and h is the water depth.
The discretization procedure for time is different in the continuity and momentum
equations. The procedure for time derivatives are discretized over three levels, which
means prognostic water level depends on the present and past water level information. In
the momentum equations, the time derivatives are explicit, excluding the Coriolis term,
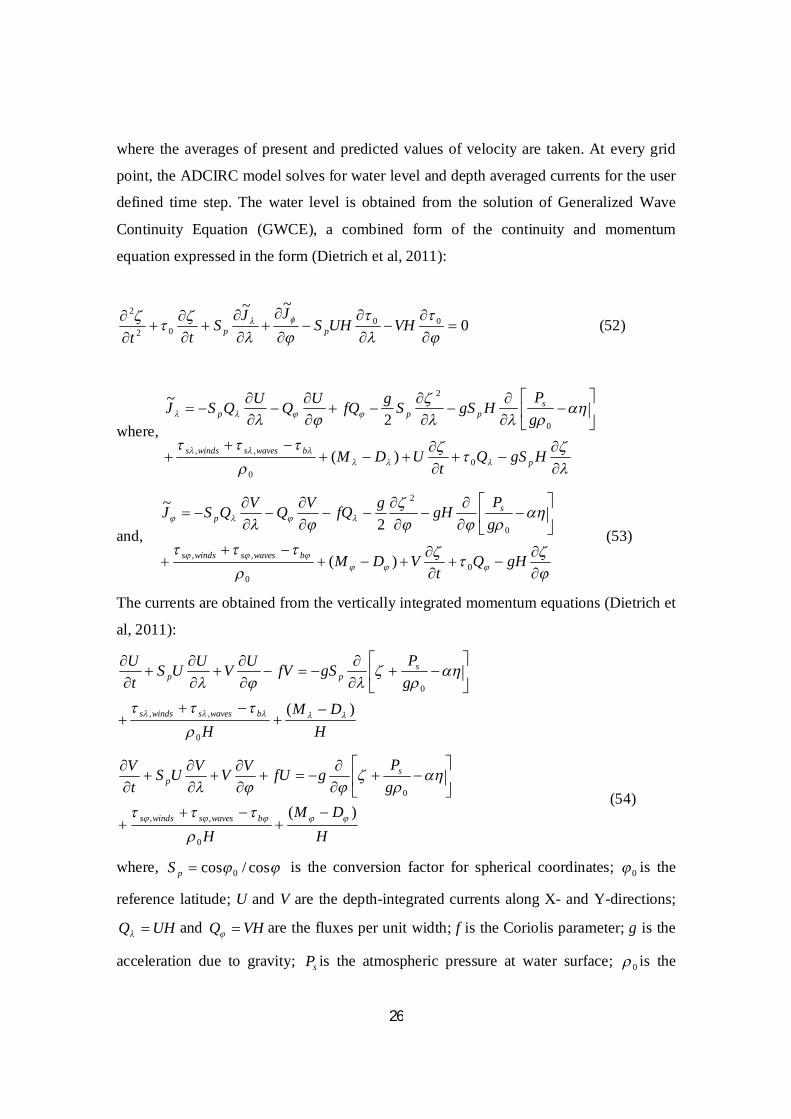
26
where the averages of present and predicted values of velocity are taken. At every grid
point, the ADCIRC model solves for water level and depth averaged currents for the user
defined time step. The water level is obtained from the solution of Generalized Wave
Continuity Equation (GWCE), a combined form of the continuity and momentum
equation expressed in the form (Dietrich et al, 2011):
0~~
0002
2
VHUHS
JJStt pp (52)
where,
HgSQt
UDM
gP
HgSSgfQUQUQSJ
pbwavesswindss
sppp
00
,,
0
2
)(
2~
and,
gHQt
VDM
gPgHgfQVQVQSJ
bwavesswindss
sp
00
,,
0
2
)(
2~
(53)
The currents are obtained from the vertically integrated momentum equations (Dietrich et
al, 2011):
HDM
H
gPgSfVUVUUS
tU
bwavesswindss
spp
)(
0
,,
0
HDM
H
gPgfUVVVUS
tV
bwavesswindss
sp
)(
0
,,
0
(54)
where, cos/cos 0pS is the conversion factor for spherical coordinates; 0 is the
reference latitude; U and V are the depth-integrated currents along X- and Y-directions;
UHQ and VHQ are the fluxes per unit width; f is the Coriolis parameter; g is the
acceleration due to gravity; sP is the atmospheric pressure at water surface; 0 is the
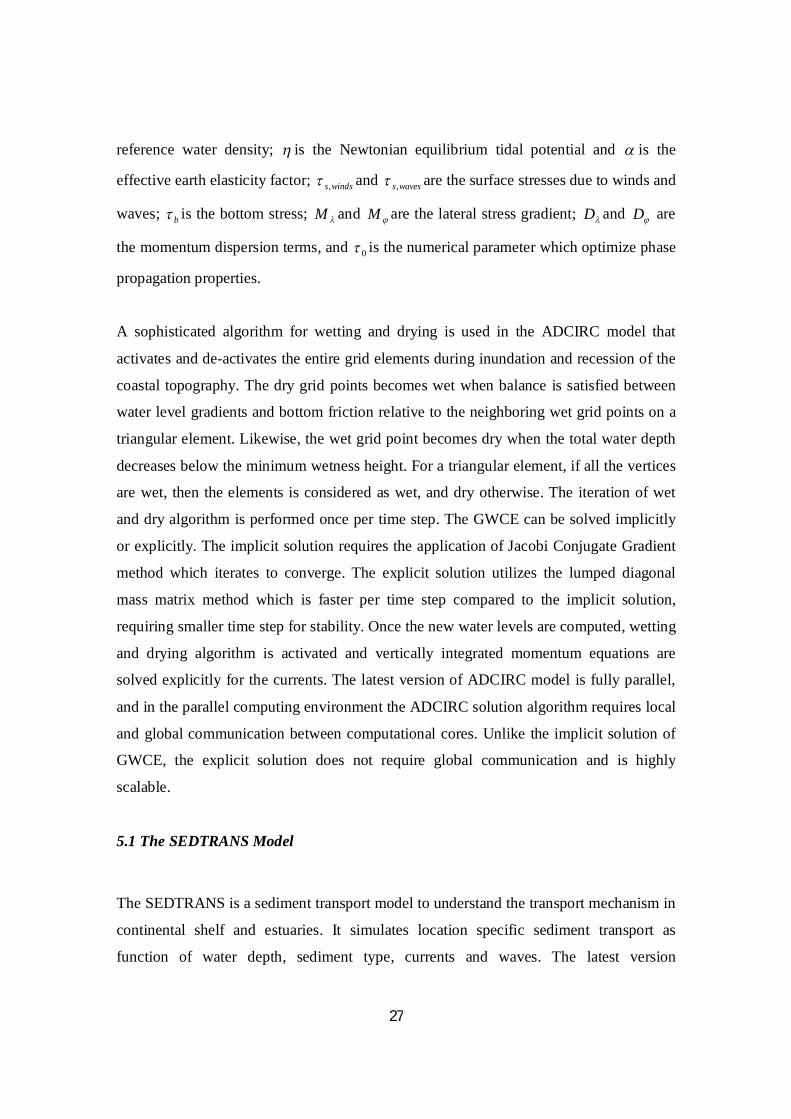
27
reference water density; is the Newtonian equilibrium tidal potential and is the
effective earth elasticity factor; windss, and wavess, are the surface stresses due to winds and
waves; b is the bottom stress; M and M are the lateral stress gradient; D and D are
the momentum dispersion terms, and 0 is the numerical parameter which optimize phase
propagation properties.
A sophisticated algorithm for wetting and drying is used in the ADCIRC model that
activates and de-activates the entire grid elements during inundation and recession of the
coastal topography. The dry grid points becomes wet when balance is satisfied between
water level gradients and bottom friction relative to the neighboring wet grid points on a
triangular element. Likewise, the wet grid point becomes dry when the total water depth
decreases below the minimum wetness height. For a triangular element, if all the vertices
are wet, then the elements is considered as wet, and dry otherwise. The iteration of wet
and dry algorithm is performed once per time step. The GWCE can be solved implicitly
or explicitly. The implicit solution requires the application of Jacobi Conjugate Gradient
method which iterates to converge. The explicit solution utilizes the lumped diagonal
mass matrix method which is faster per time step compared to the implicit solution,
requiring smaller time step for stability. Once the new water levels are computed, wetting
and drying algorithm is activated and vertically integrated momentum equations are
solved explicitly for the currents. The latest version of ADCIRC model is fully parallel,
and in the parallel computing environment the ADCIRC solution algorithm requires local
and global communication between computational cores. Unlike the implicit solution of
GWCE, the explicit solution does not require global communication and is highly
scalable.
5.1 The SEDTRANS Model
The SEDTRANS is a sediment transport model to understand the transport mechanism in
continental shelf and estuaries. It simulates location specific sediment transport as
function of water depth, sediment type, currents and waves. The latest version
28
SEDTRANS05 (Neumeier et al., 2008) is used in the present study to understand the
sediment transport mechanism. The SEDTRANS05 computes the bottom boundary layer
parameters for specified currents, or combined wave-current conditions. The threshold
bed-load movement computed as function of grain size, sediment density, water salinity
and temperature. The evolution of bed forms can also be predicted taking into
consideration the prevailing hydrodynamic conditions. The activation of cohesive
sediment algorithm models the full cycle of bed erosion, transport in suspension
including flocculation and deposition. The computed time varying hydrodynamic
information from ADCIRC and wave characteristics from SWAN provided as input to
SEDTRANS05 to estimate the sedimentation characteristics around the jetty structure.
29
HYDRODYNAMICS FOR THE
MONTH OF DECEMBER 2013
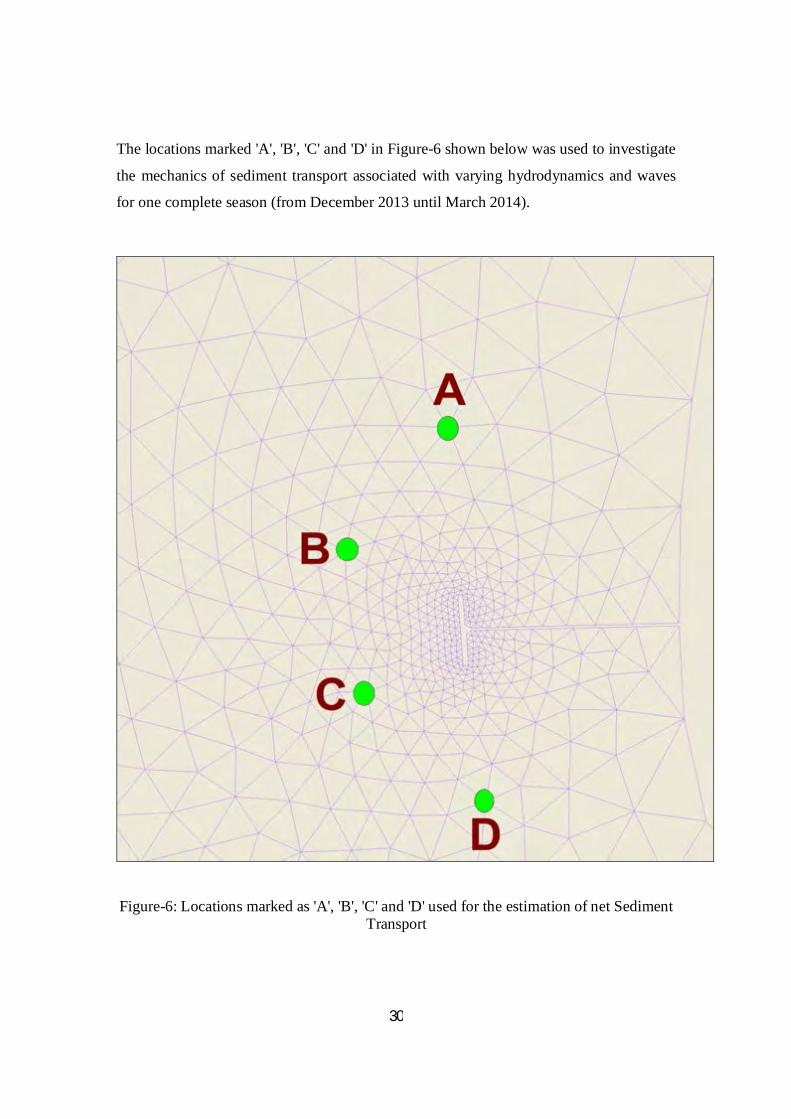
30
The locations marked 'A', 'B', 'C' and 'D' in Figure-6 shown below was used to investigate
the mechanics of sediment transport associated with varying hydrodynamics and waves
for one complete season (from December 2013 until March 2014).
Figure-6: Locations marked as 'A', 'B', 'C' and 'D' used for the estimation of net Sediment Transport
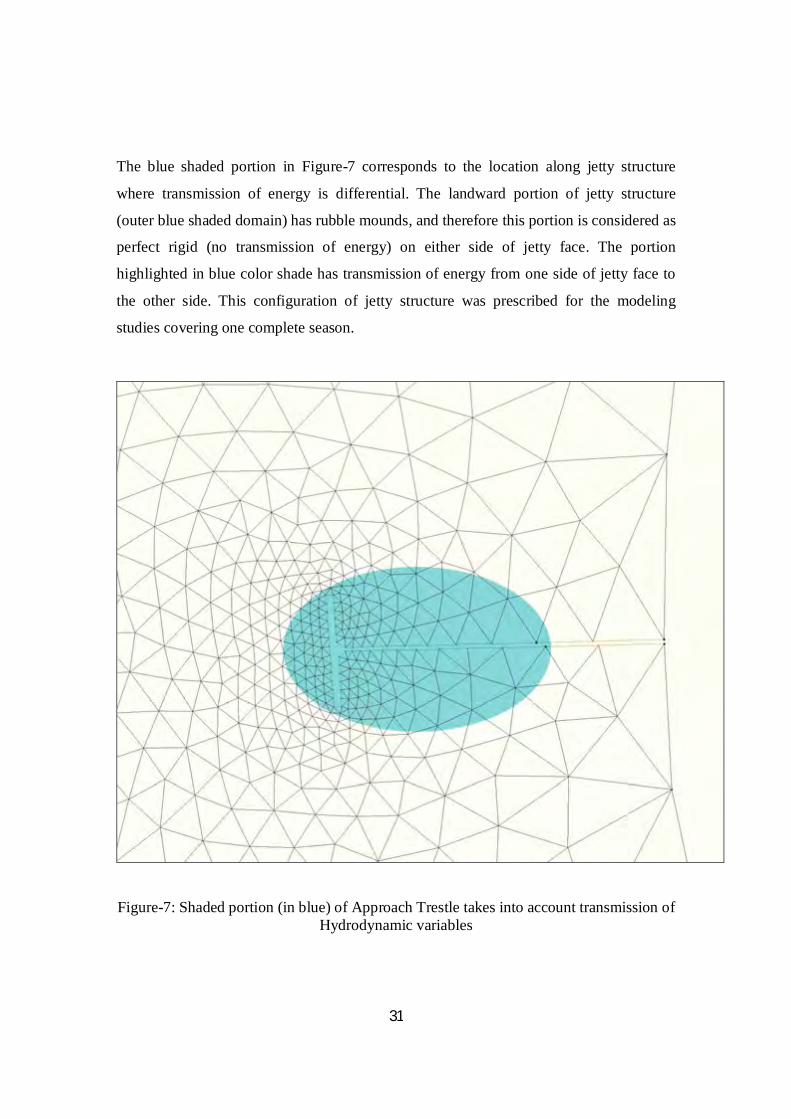
31
The blue shaded portion in Figure-7 corresponds to the location along jetty structure
where transmission of energy is differential. The landward portion of jetty structure
(outer blue shaded domain) has rubble mounds, and therefore this portion is considered as
perfect rigid (no transmission of energy) on either side of jetty face. The portion
highlighted in blue color shade has transmission of energy from one side of jetty face to
the other side. This configuration of jetty structure was prescribed for the modeling
studies covering one complete season.
Figure-7: Shaded portion (in blue) of Approach Trestle takes into account transmission of Hydrodynamic variables
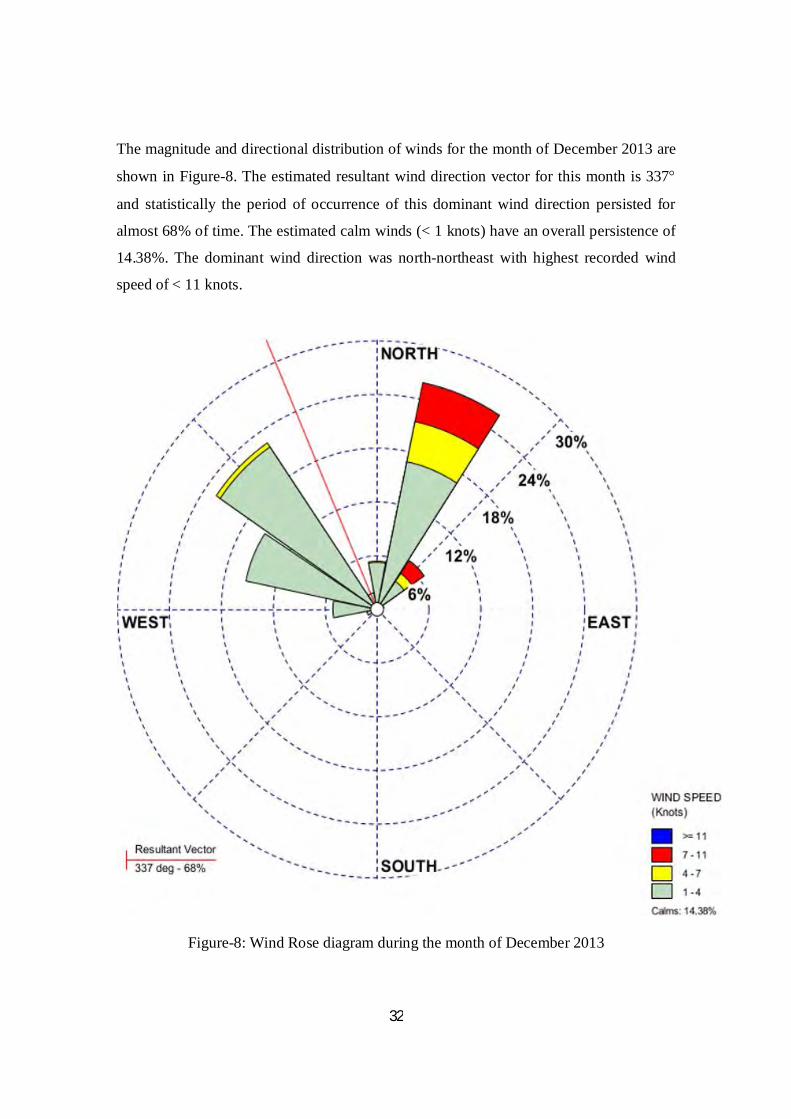
32
The magnitude and directional distribution of winds for the month of December 2013 are
shown in Figure-8. The estimated resultant wind direction vector for this month is 337
and statistically the period of occurrence of this dominant wind direction persisted for
almost 68% of time. The estimated calm winds (< 1 knots) have an overall persistence of
14.38%. The dominant wind direction was north-northeast with highest recorded wind
speed of < 11 knots.
Figure-8: Wind Rose diagram during the month of December 2013
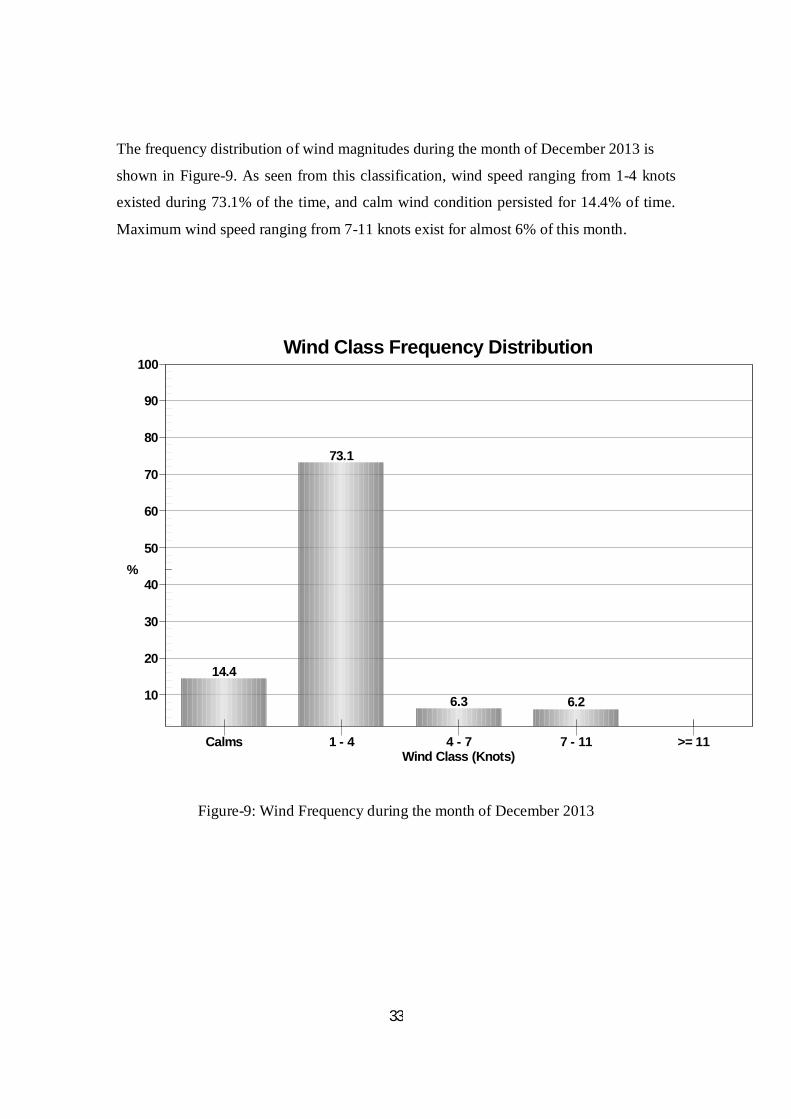
33
The frequency distribution of wind magnitudes during the month of December 2013 is
shown in Figure-9. As seen from this classification, wind speed ranging from 1-4 knots
existed during 73.1% of the time, and calm wind condition persisted for 14.4% of time.
Maximum wind speed ranging from 7-11 knots exist for almost 6% of this month.
14.4
73.1
6.3 6.210
20
30
40
50
60
70
80
90
100
%
Wind Class Frequency Distribution
Wind Class (Knots)Calms 1 - 4 4 - 7 7 - 11 >= 11
Figure-9: Wind Frequency during the month of December 2013
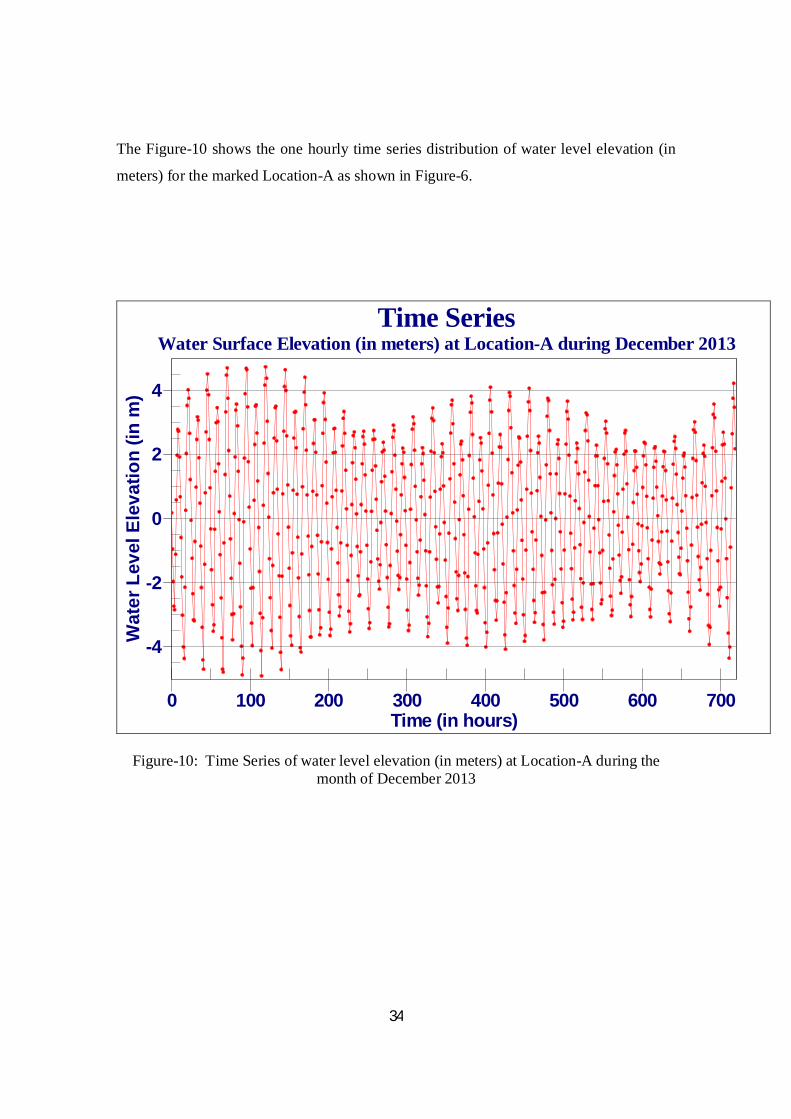
34
The Figure-10 shows the one hourly time series distribution of water level elevation (in
meters) for the marked Location-A as shown in Figure-6.
Time SeriesWater Surface Elevation (in meters) at Location-A during December 2013
Wat
er L
evel
Ele
vatio
n (in
m)
Time (in hours)0 100 200 300 400 500 600 700
-4
-2
0
2
4
Figure-10: Time Series of water level elevation (in meters) at Location-A during the month of December 2013
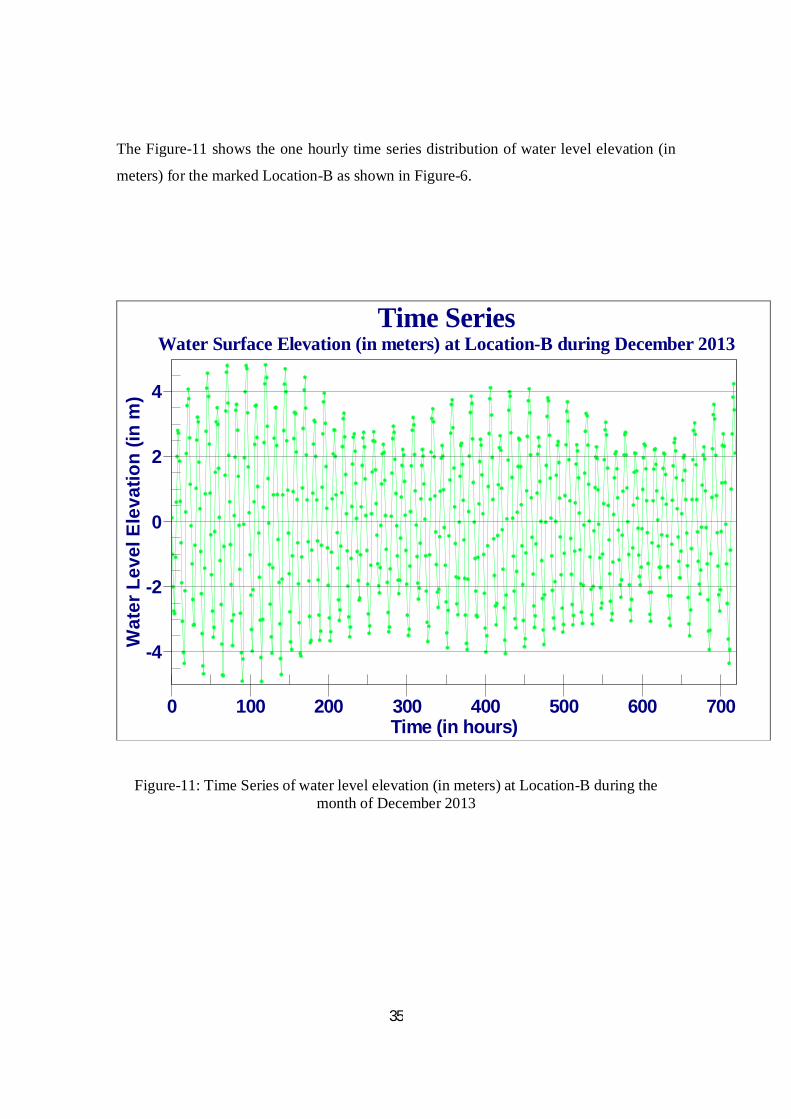
35
The Figure-11 shows the one hourly time series distribution of water level elevation (in
meters) for the marked Location-B as shown in Figure-6.
Time SeriesWater Surface Elevation (in meters) at Location-B during December 2013
Wat
er L
evel
Ele
vatio
n (in
m)
Time (in hours)0 100 200 300 400 500 600 700
-4
-2
0
2
4
Figure-11: Time Series of water level elevation (in meters) at Location-B during the month of December 2013
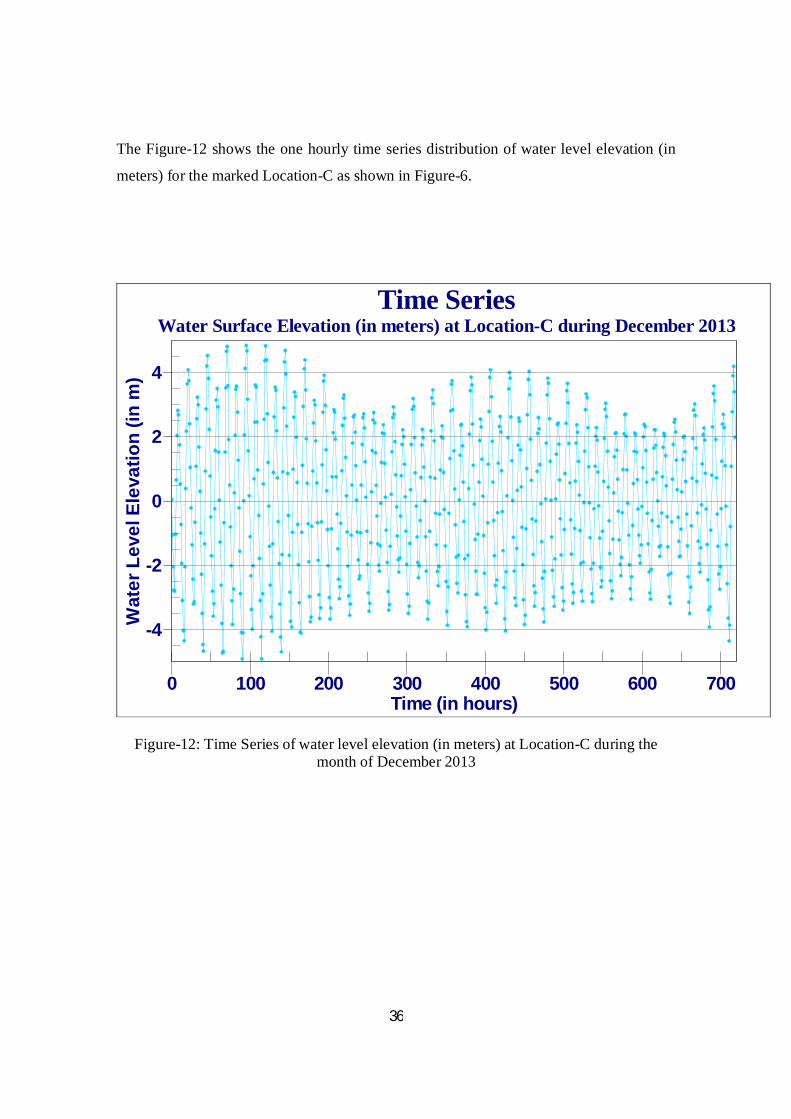
36
The Figure-12 shows the one hourly time series distribution of water level elevation (in
meters) for the marked Location-C as shown in Figure-6.
Time SeriesWater Surface Elevation (in meters) at Location-C during December 2013
Wat
er L
evel
Ele
vatio
n (in
m)
Time (in hours)0 100 200 300 400 500 600 700
-4
-2
0
2
4
Figure-12: Time Series of water level elevation (in meters) at Location-C during the month of December 2013
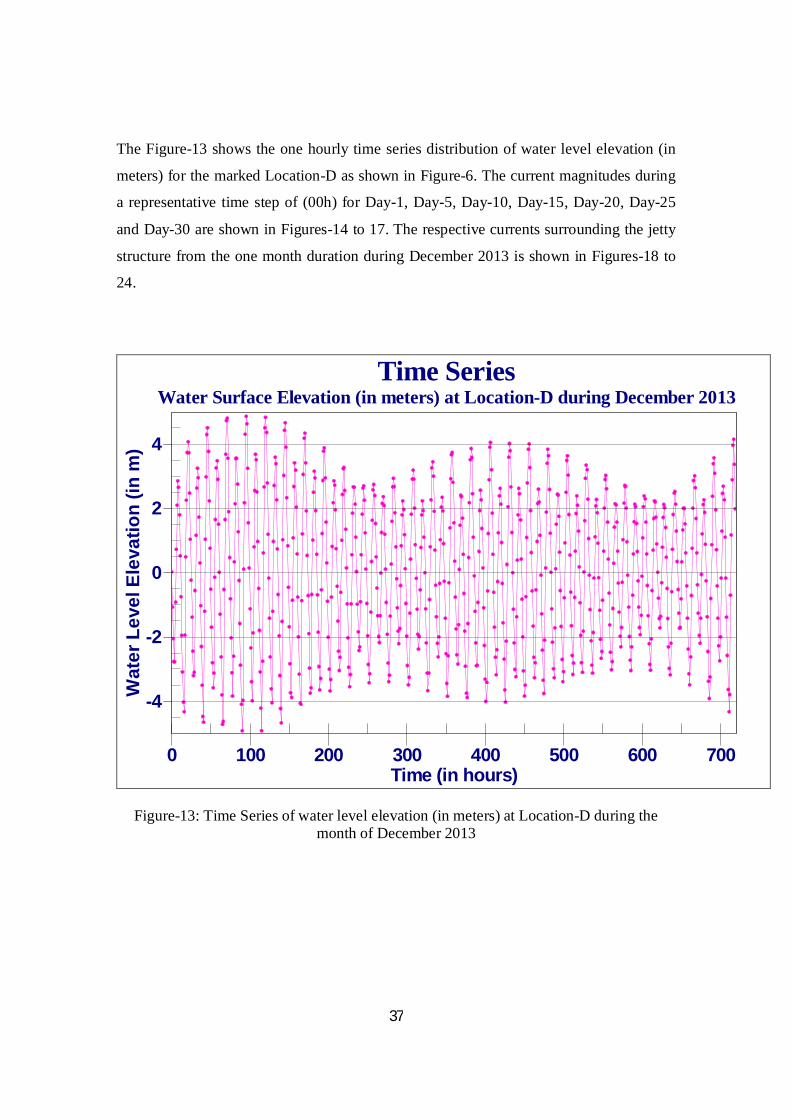
37
The Figure-13 shows the one hourly time series distribution of water level elevation (in
meters) for the marked Location-D as shown in Figure-6. The current magnitudes during
a representative time step of (00h) for Day-1, Day-5, Day-10, Day-15, Day-20, Day-25
and Day-30 are shown in Figures-14 to 17. The respective currents surrounding the jetty
structure from the one month duration during December 2013 is shown in Figures-18 to
24.
Time SeriesWater Surface Elevation (in meters) at Location-D during December 2013
Wat
er L
evel
Ele
vatio
n (in
m)
Time (in hours)0 100 200 300 400 500 600 700
-4
-2
0
2
4
Figure-13: Time Series of water level elevation (in meters) at Location-D during the month of December 2013
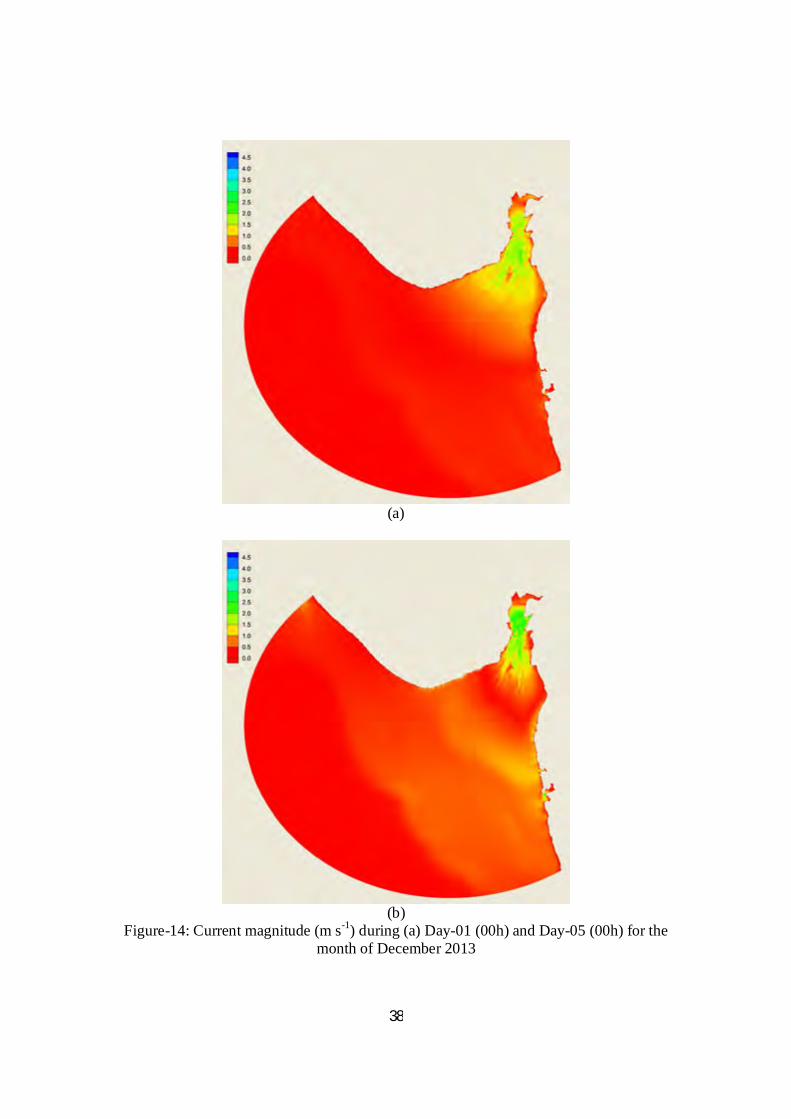
38
(a)
(b)
Figure-14: Current magnitude (m s-1) during (a) Day-01 (00h) and Day-05 (00h) for the month of December 2013
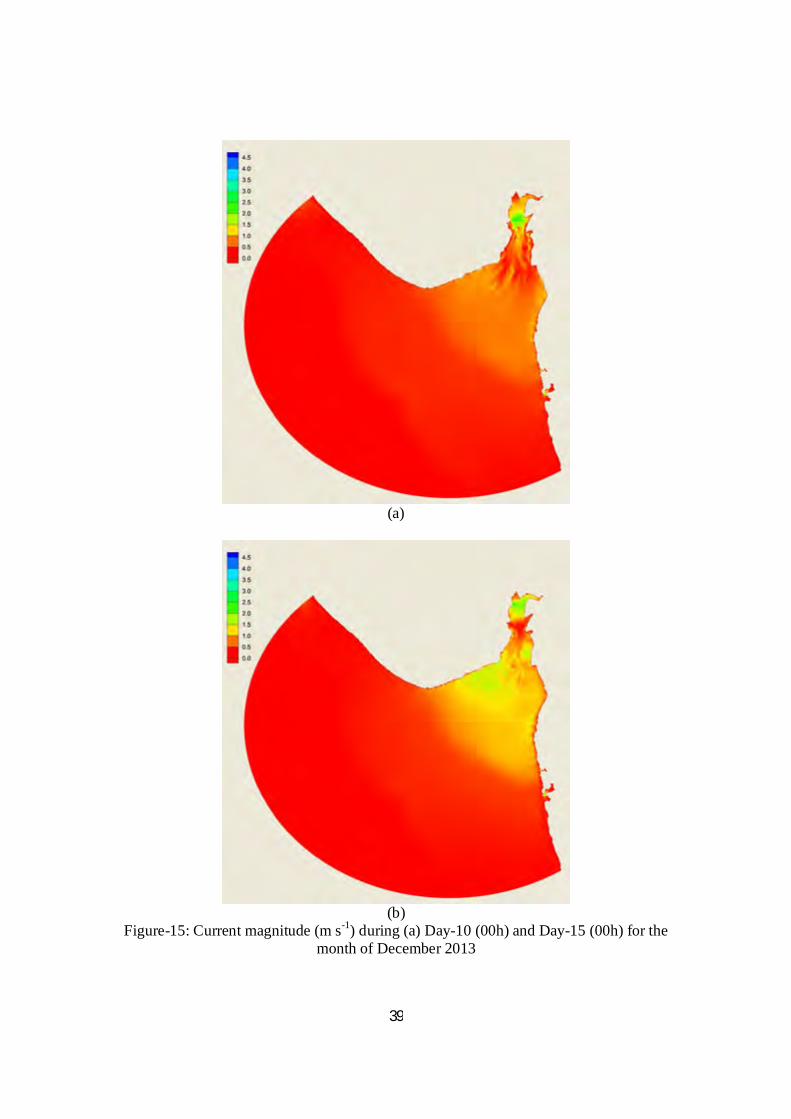
39
(a)
(b)
Figure-15: Current magnitude (m s-1) during (a) Day-10 (00h) and Day-15 (00h) for the month of December 2013
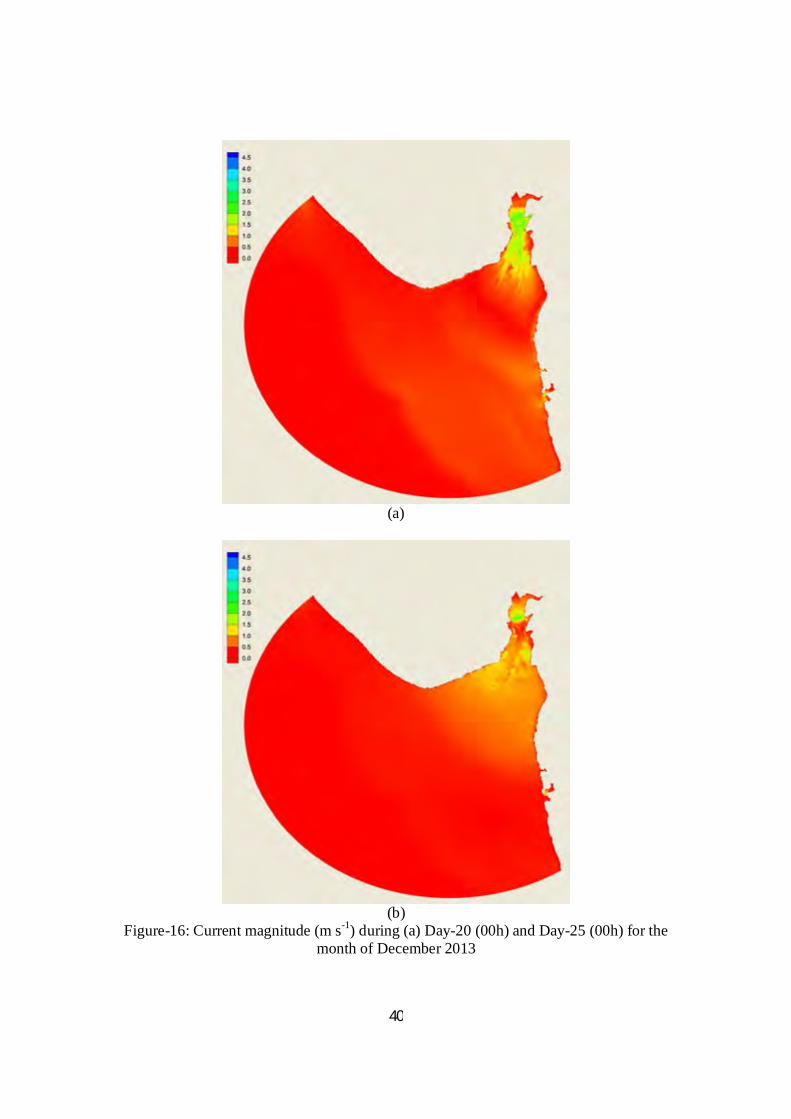
40
(a)
(b)
Figure-16: Current magnitude (m s-1) during (a) Day-20 (00h) and Day-25 (00h) for the month of December 2013
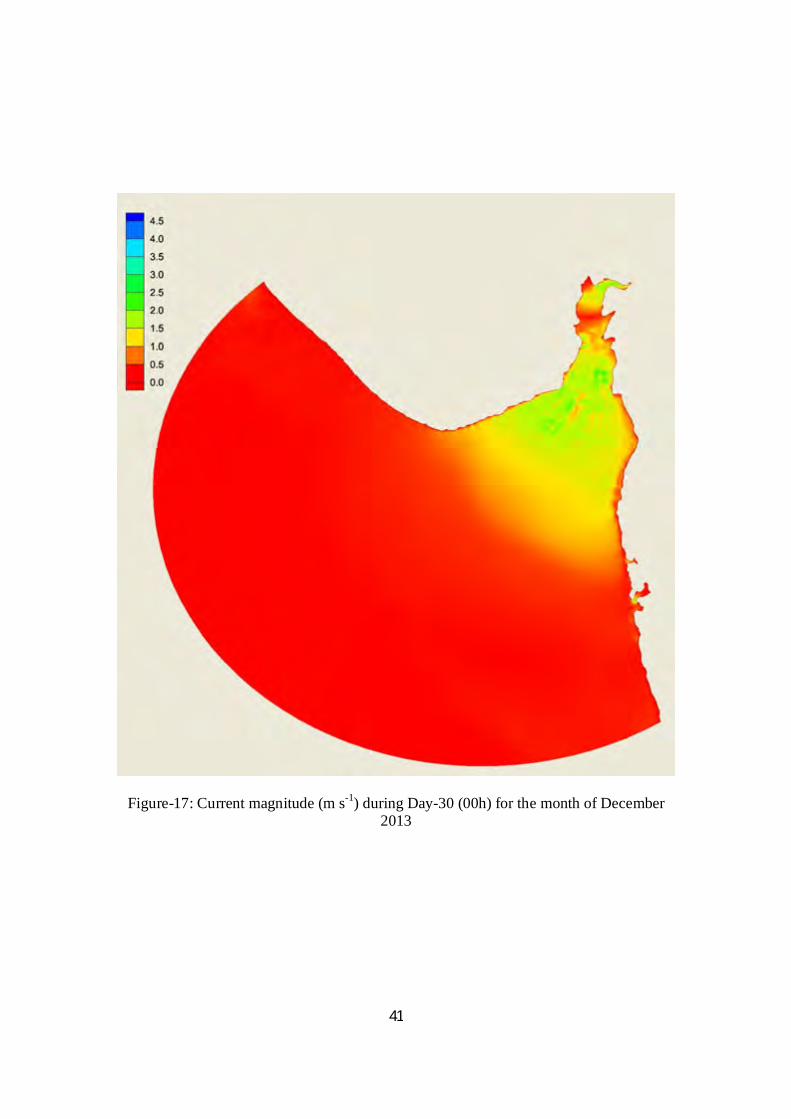
41
Figure-17: Current magnitude (m s-1) during Day-30 (00h) for the month of December 2013
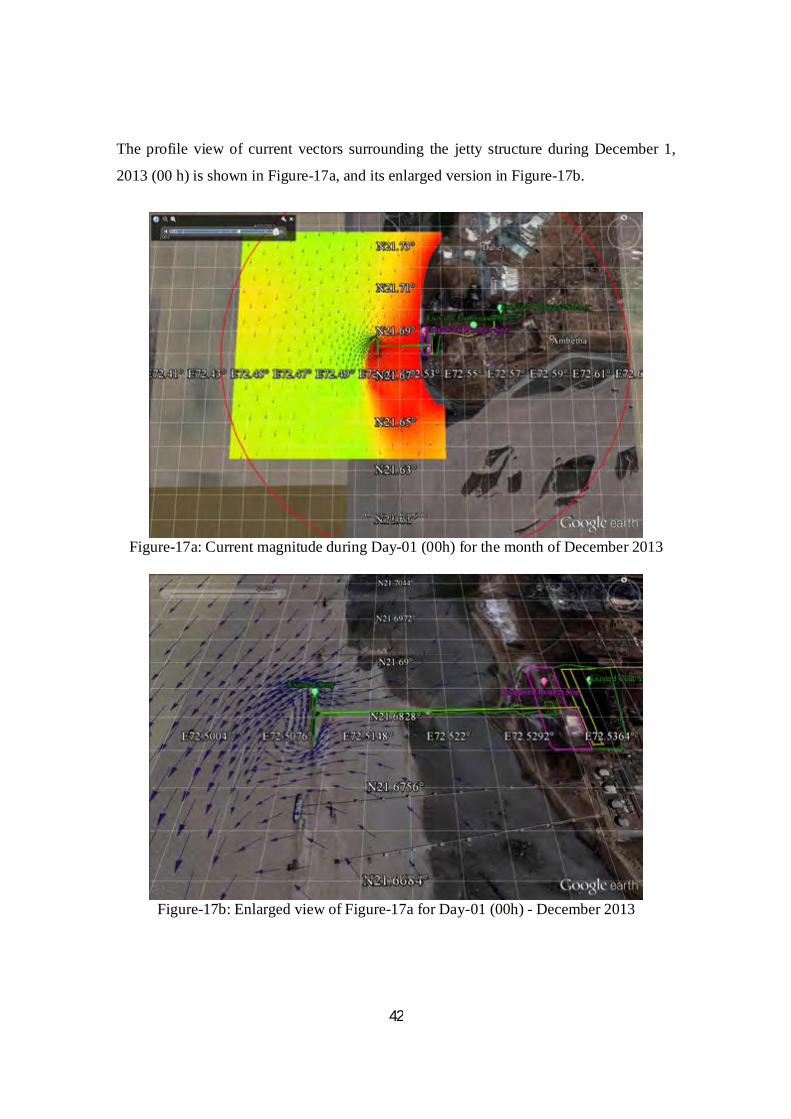
42
The profile view of current vectors surrounding the jetty structure during December 1,
2013 (00 h) is shown in Figure-17a, and its enlarged version in Figure-17b.
Figure-17a: Current magnitude during Day-01 (00h) for the month of December 2013
Figure-17b: Enlarged view of Figure-17a for Day-01 (00h) - December 2013
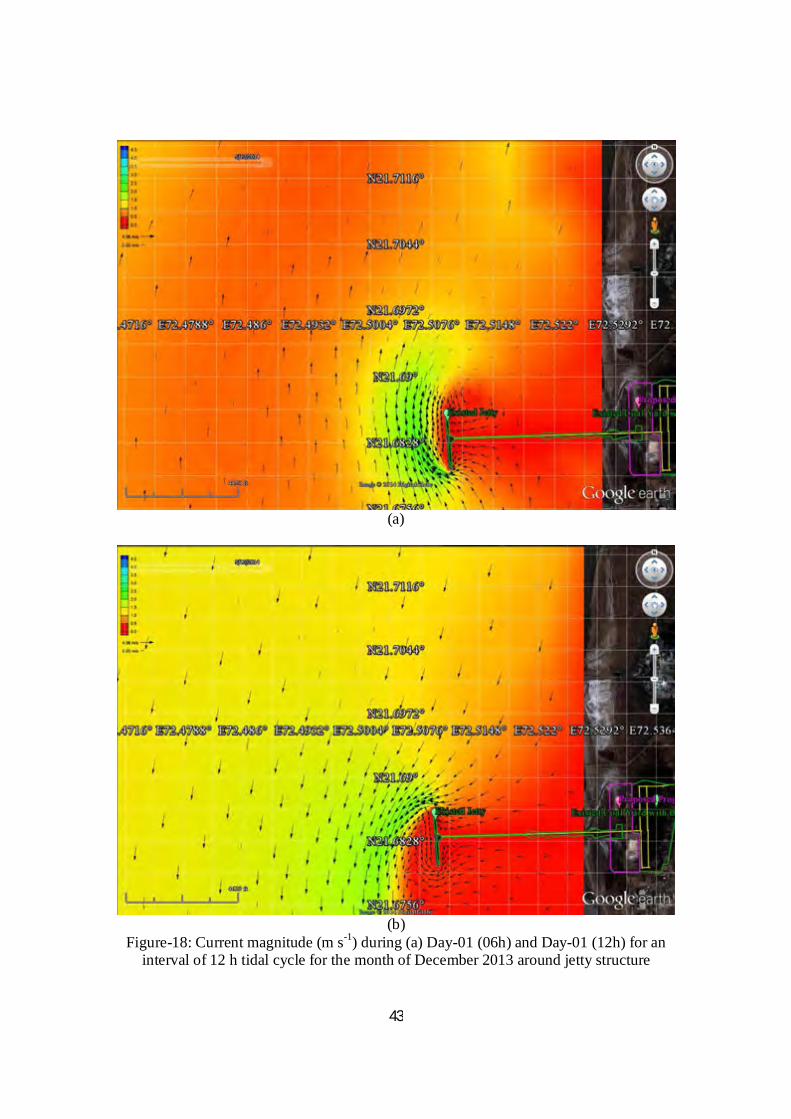
43
(a)
(b)
Figure-18: Current magnitude (m s-1) during (a) Day-01 (06h) and Day-01 (12h) for an interval of 12 h tidal cycle for the month of December 2013 around jetty structure
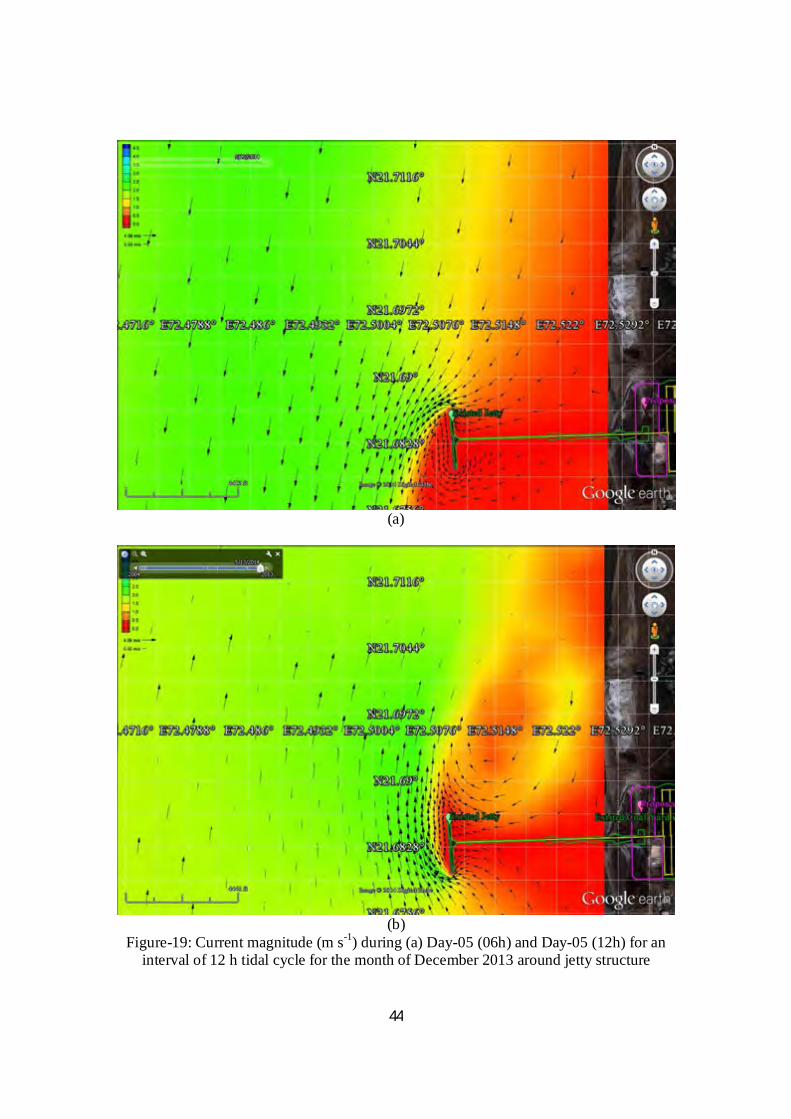
44
(a)
(b)
Figure-19: Current magnitude (m s-1) during (a) Day-05 (06h) and Day-05 (12h) for an interval of 12 h tidal cycle for the month of December 2013 around jetty structure
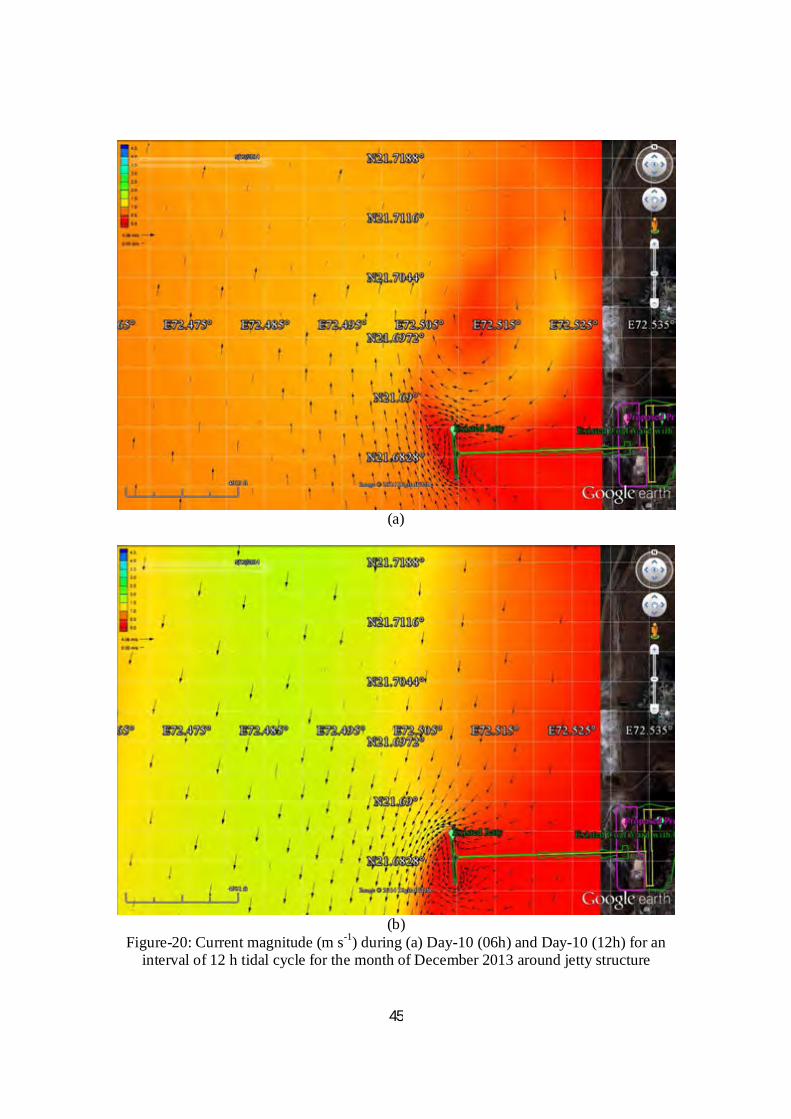
45
(a)
(b)
Figure-20: Current magnitude (m s-1) during (a) Day-10 (06h) and Day-10 (12h) for an interval of 12 h tidal cycle for the month of December 2013 around jetty structure
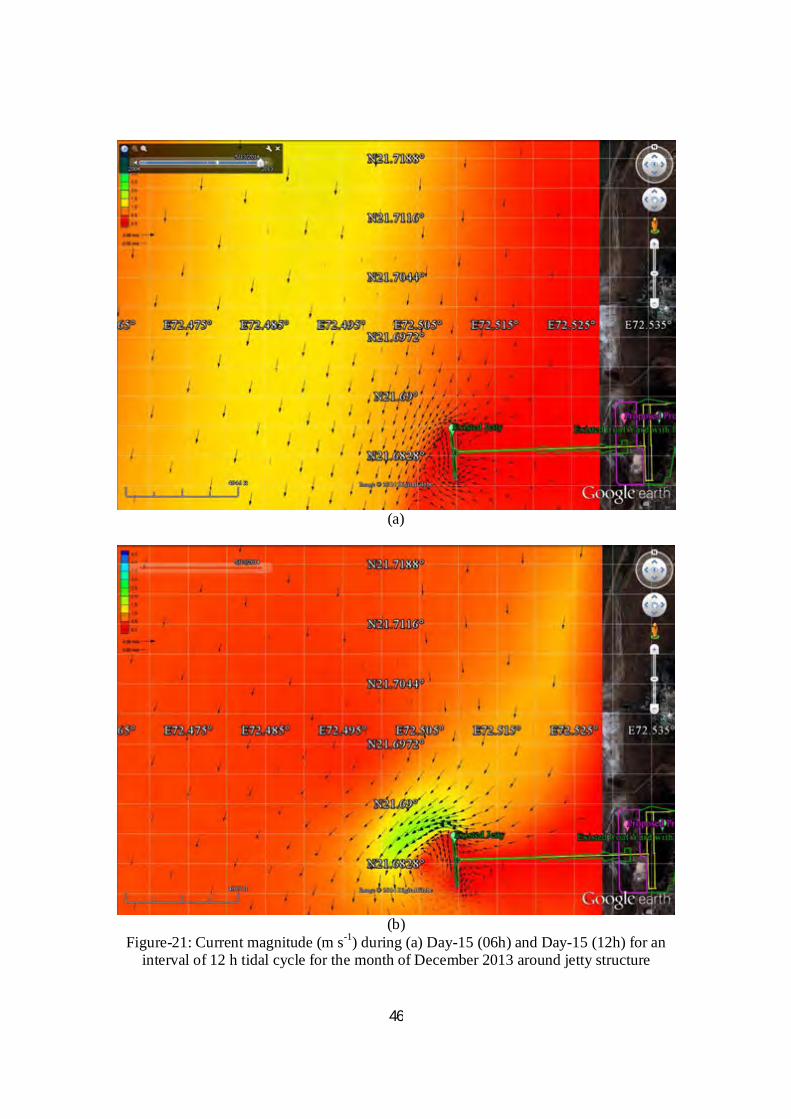
46
(a)
(b)
Figure-21: Current magnitude (m s-1) during (a) Day-15 (06h) and Day-15 (12h) for an interval of 12 h tidal cycle for the month of December 2013 around jetty structure
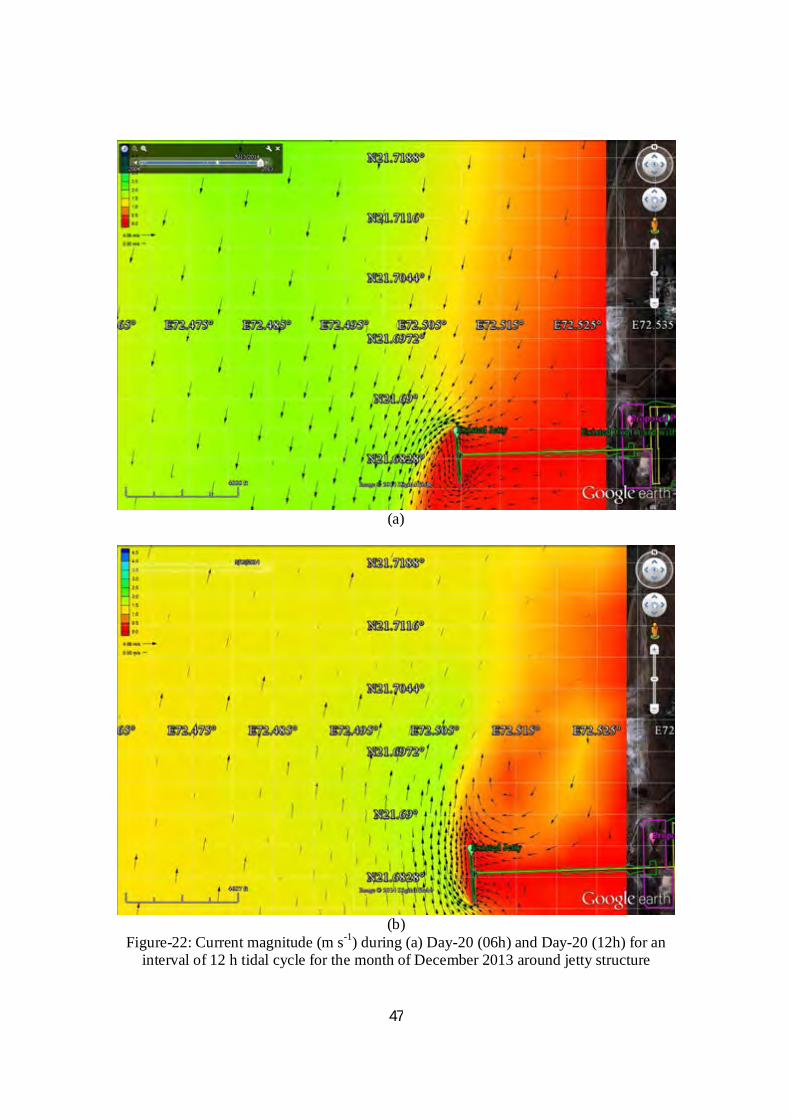
47
(a)
(b)
Figure-22: Current magnitude (m s-1) during (a) Day-20 (06h) and Day-20 (12h) for an interval of 12 h tidal cycle for the month of December 2013 around jetty structure
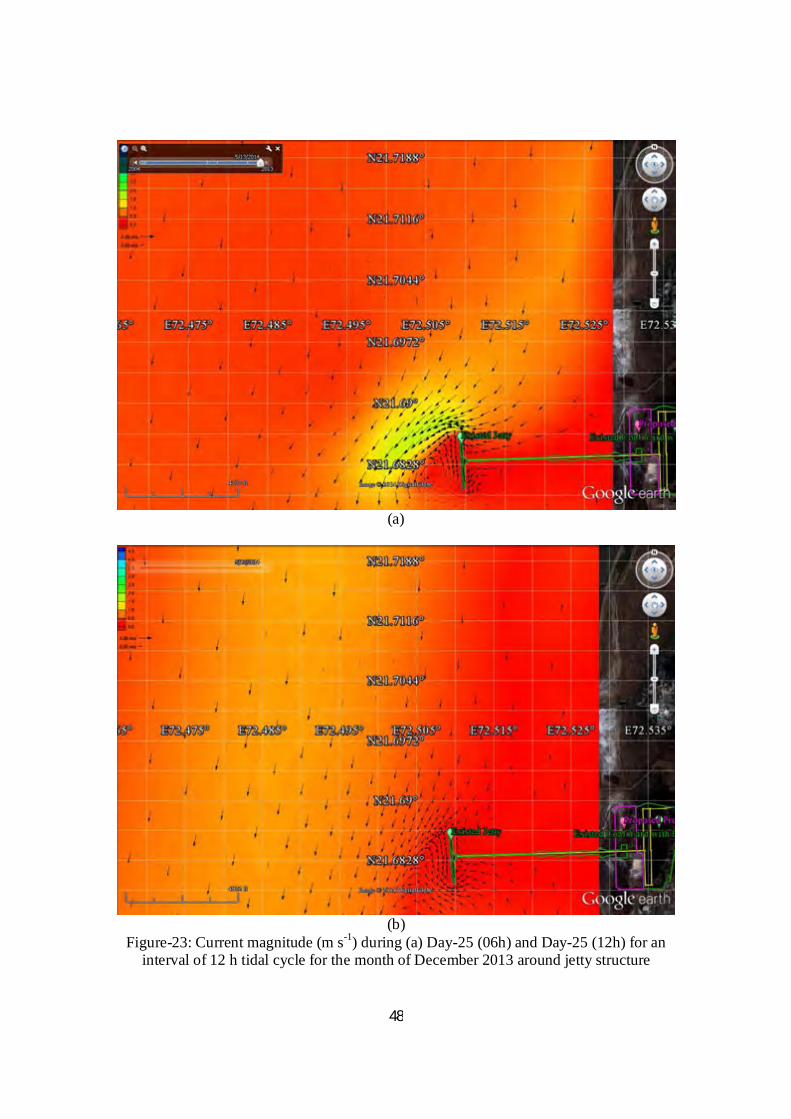
48
(a)
(b)
Figure-23: Current magnitude (m s-1) during (a) Day-25 (06h) and Day-25 (12h) for an interval of 12 h tidal cycle for the month of December 2013 around jetty structure
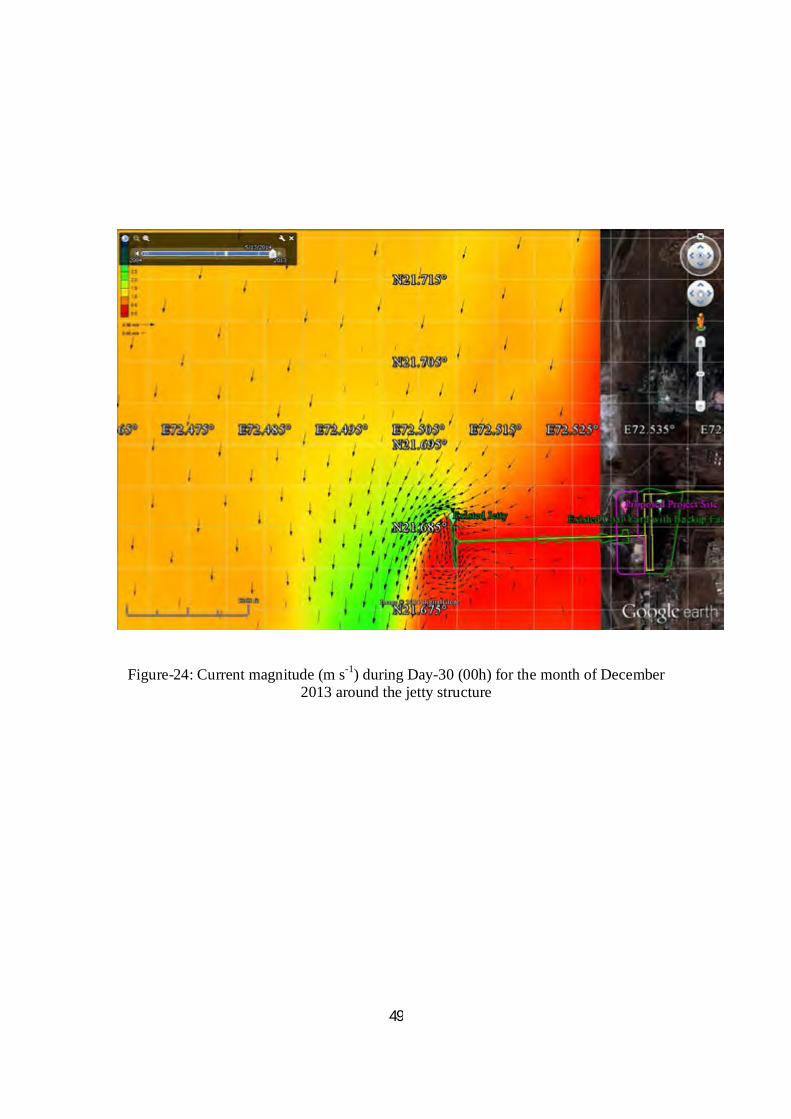
49
Figure-24: Current magnitude (m s-1) during Day-30 (00h) for the month of December 2013 around the jetty structure
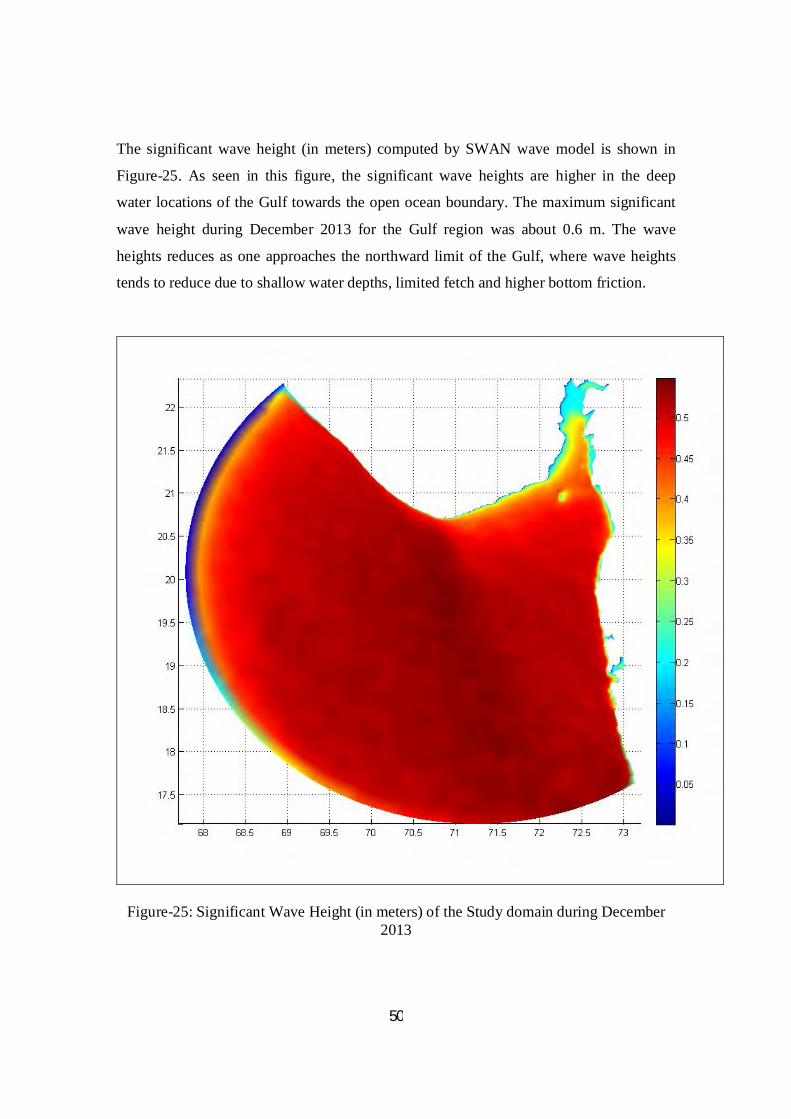
50
The significant wave height (in meters) computed by SWAN wave model is shown in
Figure-25. As seen in this figure, the significant wave heights are higher in the deep
water locations of the Gulf towards the open ocean boundary. The maximum significant
wave height during December 2013 for the Gulf region was about 0.6 m. The wave
heights reduces as one approaches the northward limit of the Gulf, where wave heights
tends to reduce due to shallow water depths, limited fetch and higher bottom friction.
Figure-25: Significant Wave Height (in meters) of the Study domain during December 2013
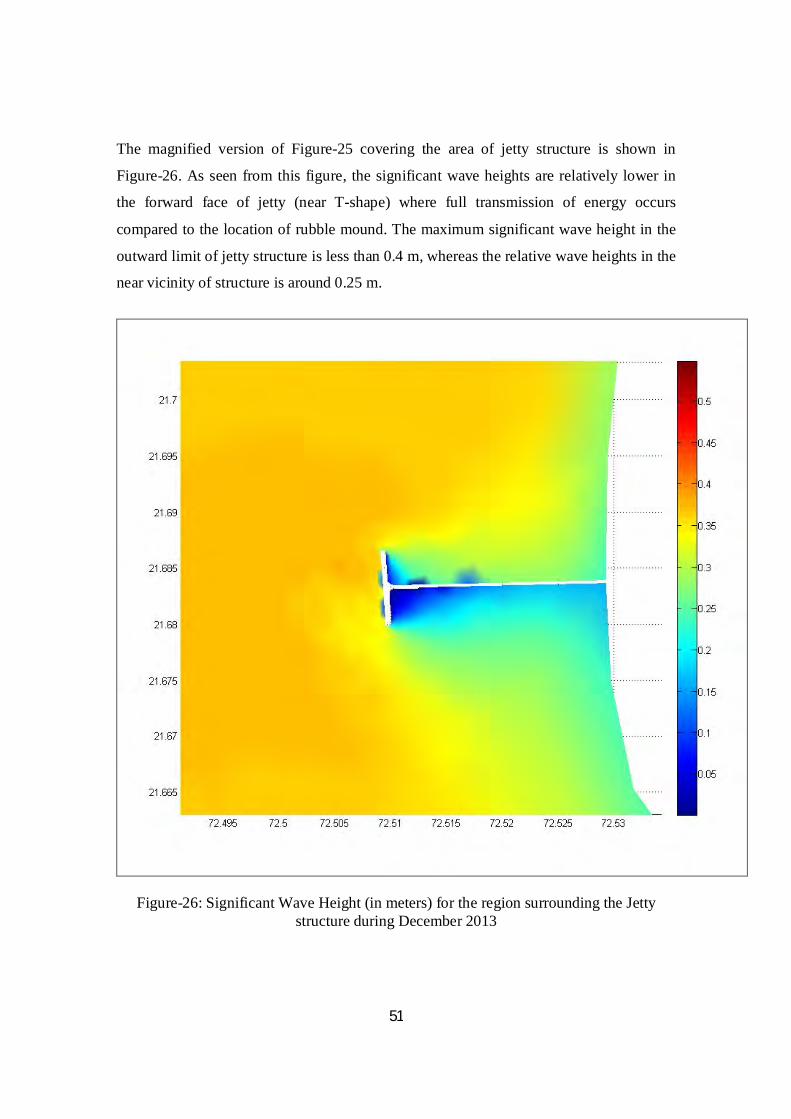
51
The magnified version of Figure-25 covering the area of jetty structure is shown in
Figure-26. As seen from this figure, the significant wave heights are relatively lower in
the forward face of jetty (near T-shape) where full transmission of energy occurs
compared to the location of rubble mound. The maximum significant wave height in the
outward limit of jetty structure is less than 0.4 m, whereas the relative wave heights in the
near vicinity of structure is around 0.25 m.
Figure-26: Significant Wave Height (in meters) for the region surrounding the Jetty structure during December 2013
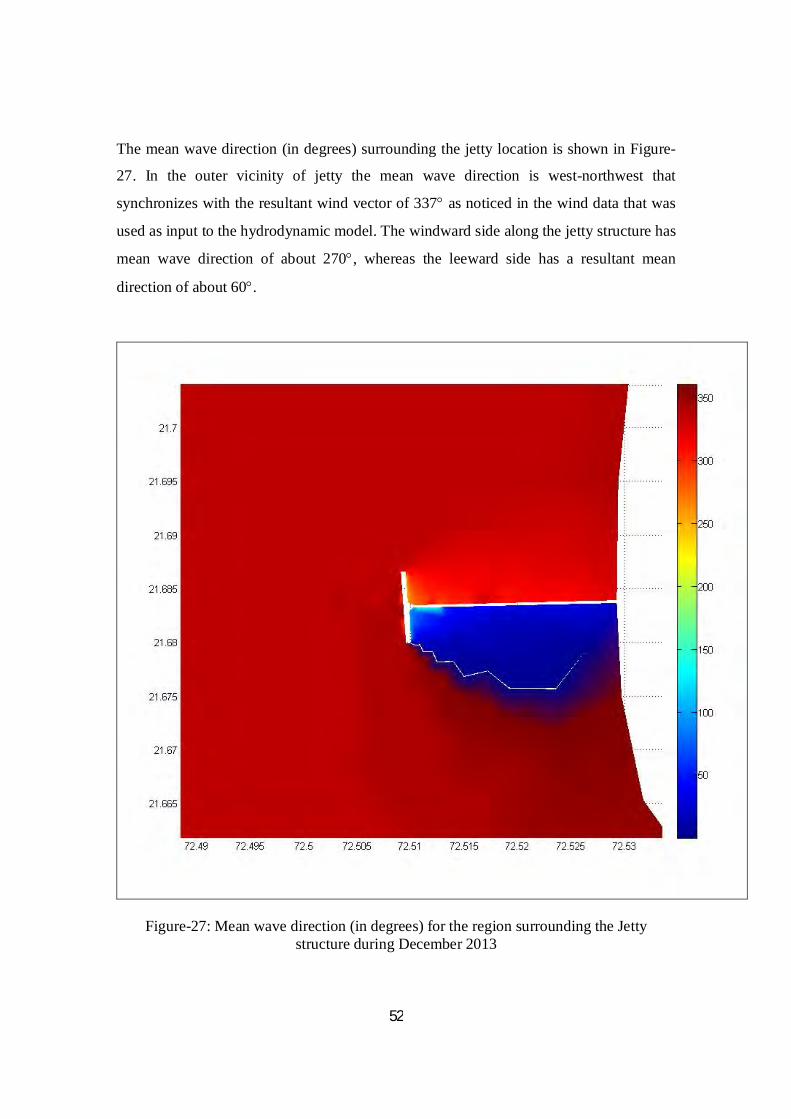
52
The mean wave direction (in degrees) surrounding the jetty location is shown in Figure-
27. In the outer vicinity of jetty the mean wave direction is west-northwest that
synchronizes with the resultant wind vector of 337 as noticed in the wind data that was
used as input to the hydrodynamic model. The windward side along the jetty structure has
mean wave direction of about 270, whereas the leeward side has a resultant mean
direction of about 60.
Figure-27: Mean wave direction (in degrees) for the region surrounding the Jetty structure during December 2013
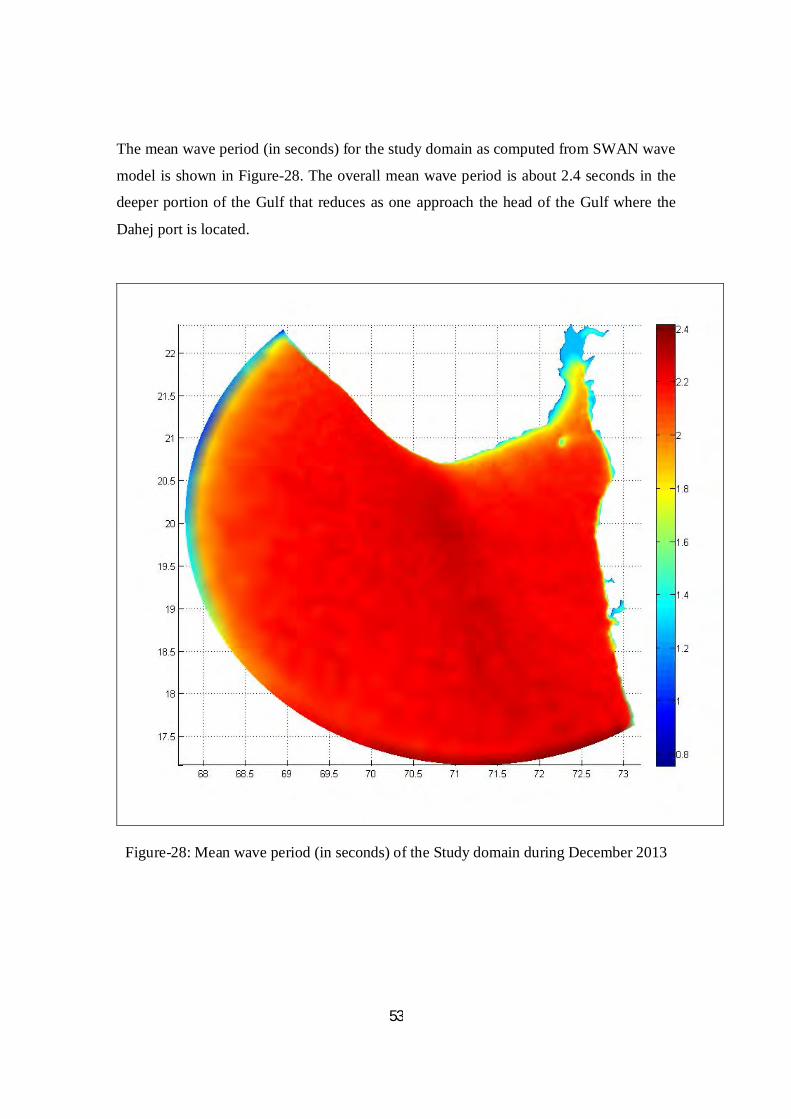
53
The mean wave period (in seconds) for the study domain as computed from SWAN wave
model is shown in Figure-28. The overall mean wave period is about 2.4 seconds in the
deeper portion of the Gulf that reduces as one approach the head of the Gulf where the
Dahej port is located.
Figure-28: Mean wave period (in seconds) of the Study domain during December 2013
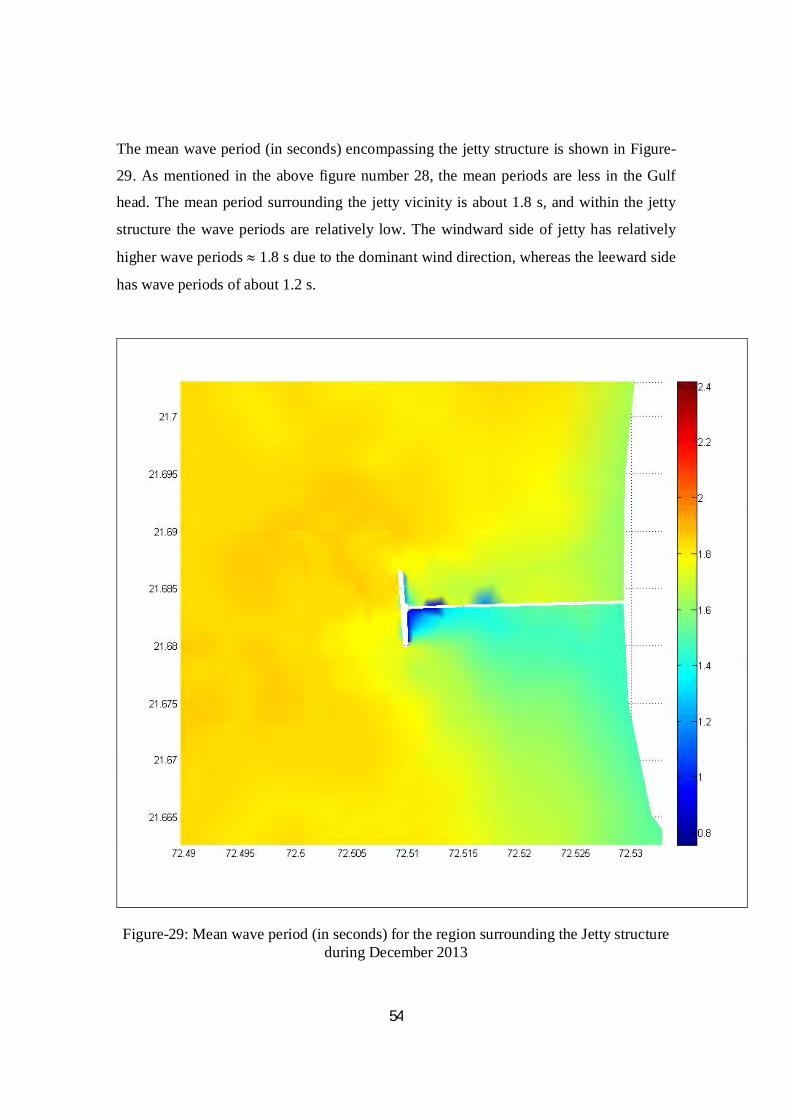
54
The mean wave period (in seconds) encompassing the jetty structure is shown in Figure-
29. As mentioned in the above figure number 28, the mean periods are less in the Gulf
head. The mean period surrounding the jetty vicinity is about 1.8 s, and within the jetty
structure the wave periods are relatively low. The windward side of jetty has relatively
higher wave periods 1.8 s due to the dominant wind direction, whereas the leeward side
has wave periods of about 1.2 s.
Figure-29: Mean wave period (in seconds) for the region surrounding the Jetty structure during December 2013
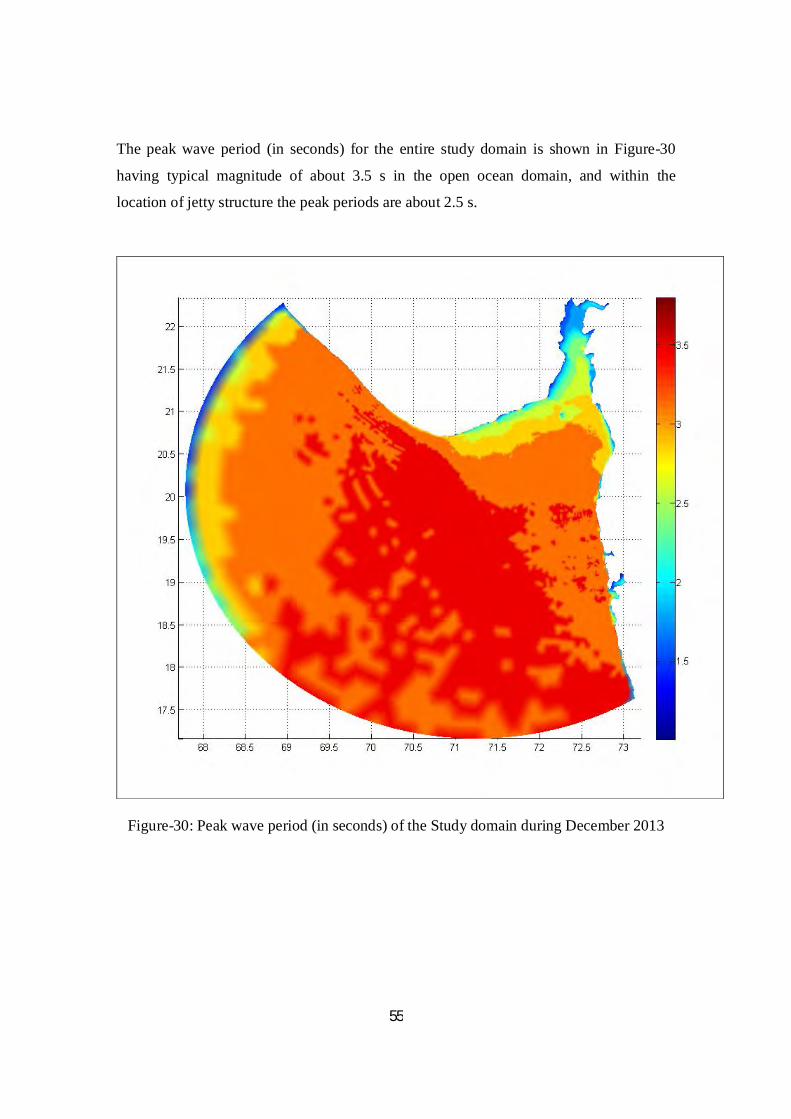
55
The peak wave period (in seconds) for the entire study domain is shown in Figure-30
having typical magnitude of about 3.5 s in the open ocean domain, and within the
location of jetty structure the peak periods are about 2.5 s.
Figure-30: Peak wave period (in seconds) of the Study domain during December 2013
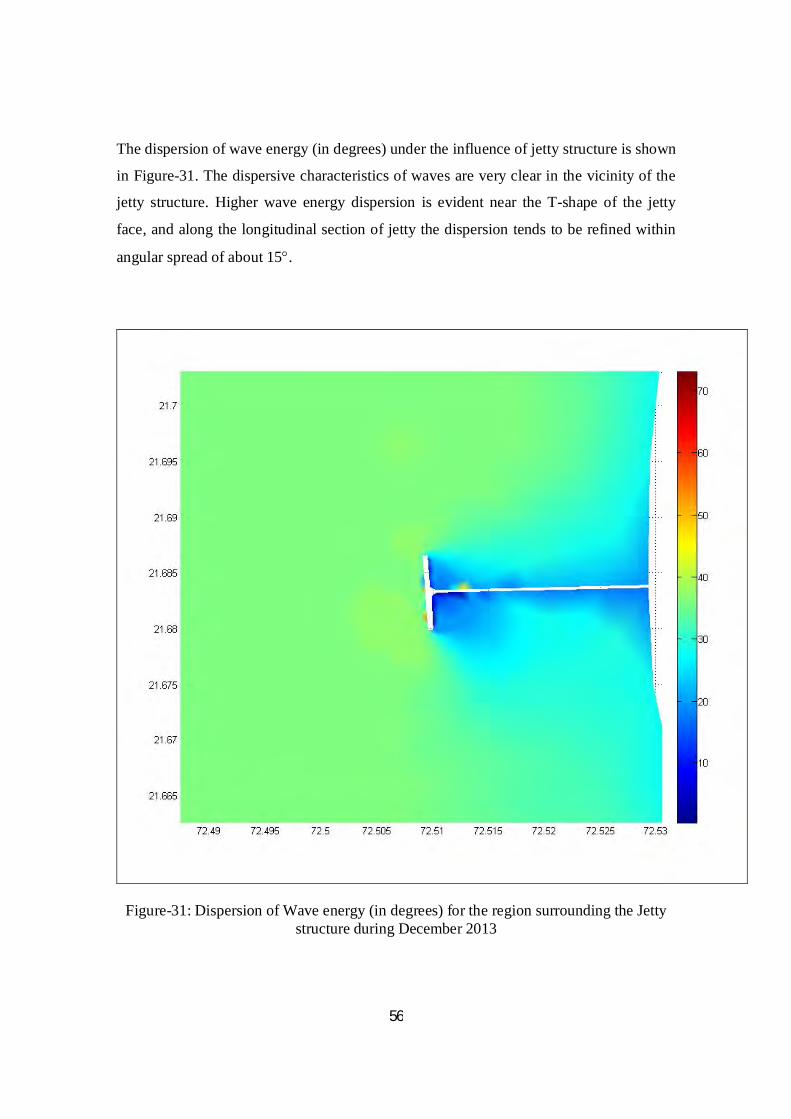
56
The dispersion of wave energy (in degrees) under the influence of jetty structure is shown
in Figure-31. The dispersive characteristics of waves are very clear in the vicinity of the
jetty structure. Higher wave energy dispersion is evident near the T-shape of the jetty
face, and along the longitudinal section of jetty the dispersion tends to be refined within
angular spread of about 15.
Figure-31: Dispersion of Wave energy (in degrees) for the region surrounding the Jetty structure during December 2013

57
HYDRODYNAMICS FOR THE
MONTH OF JANUARY 2014
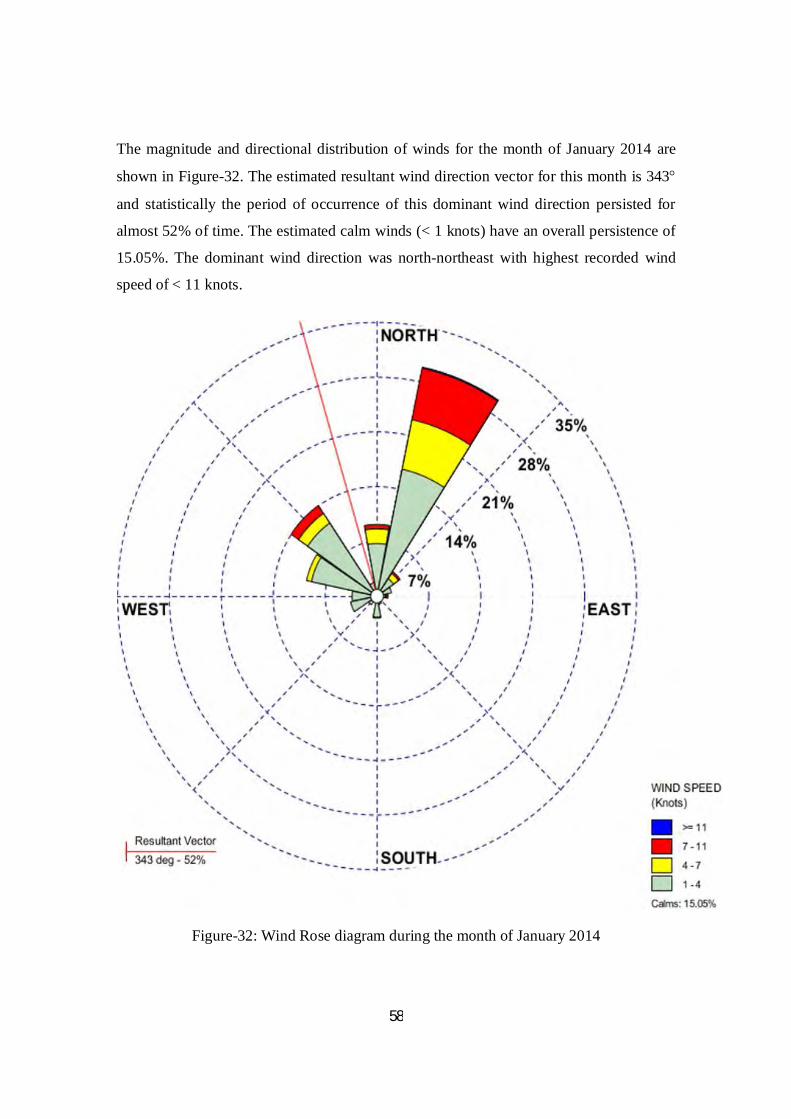
58
The magnitude and directional distribution of winds for the month of January 2014 are
shown in Figure-32. The estimated resultant wind direction vector for this month is 343
and statistically the period of occurrence of this dominant wind direction persisted for
almost 52% of time. The estimated calm winds (< 1 knots) have an overall persistence of
15.05%. The dominant wind direction was north-northeast with highest recorded wind
speed of < 11 knots.
Figure-32: Wind Rose diagram during the month of January 2014
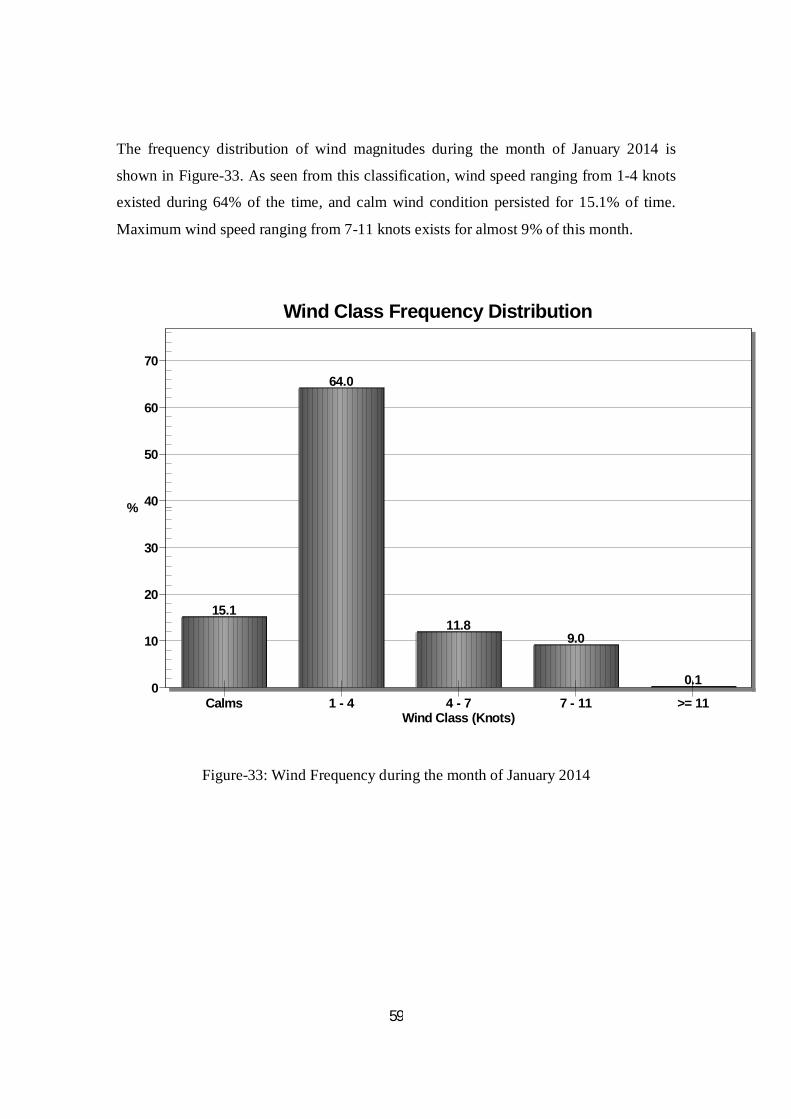
59
The frequency distribution of wind magnitudes during the month of January 2014 is
shown in Figure-33. As seen from this classification, wind speed ranging from 1-4 knots
existed during 64% of the time, and calm wind condition persisted for 15.1% of time.
Maximum wind speed ranging from 7-11 knots exists for almost 9% of this month.
15.1
64.0
11.89.0
0.10
10
20
30
40
50
60
70
%
Wind Class Frequency Distribution
Wind Class (Knots)Calms 1 - 4 4 - 7 7 - 11 >= 11
Figure-33: Wind Frequency during the month of January 2014

60
The Figure-34 shows the one hourly time series distribution of water level elevation (in
meters) for the marked Location-A as shown in Figure-6.
Time SeriesWater Surface Elevation (in meters) at Location-A during January 2014
Wat
er L
evel
Ele
vatio
n (in
m)
Time (in hours)0 100 200 300 400 500 600 700
-4
-2
0
2
4
Figure-34: Time Series of water level elevation (in meters) at Location-A during the month of January 2014
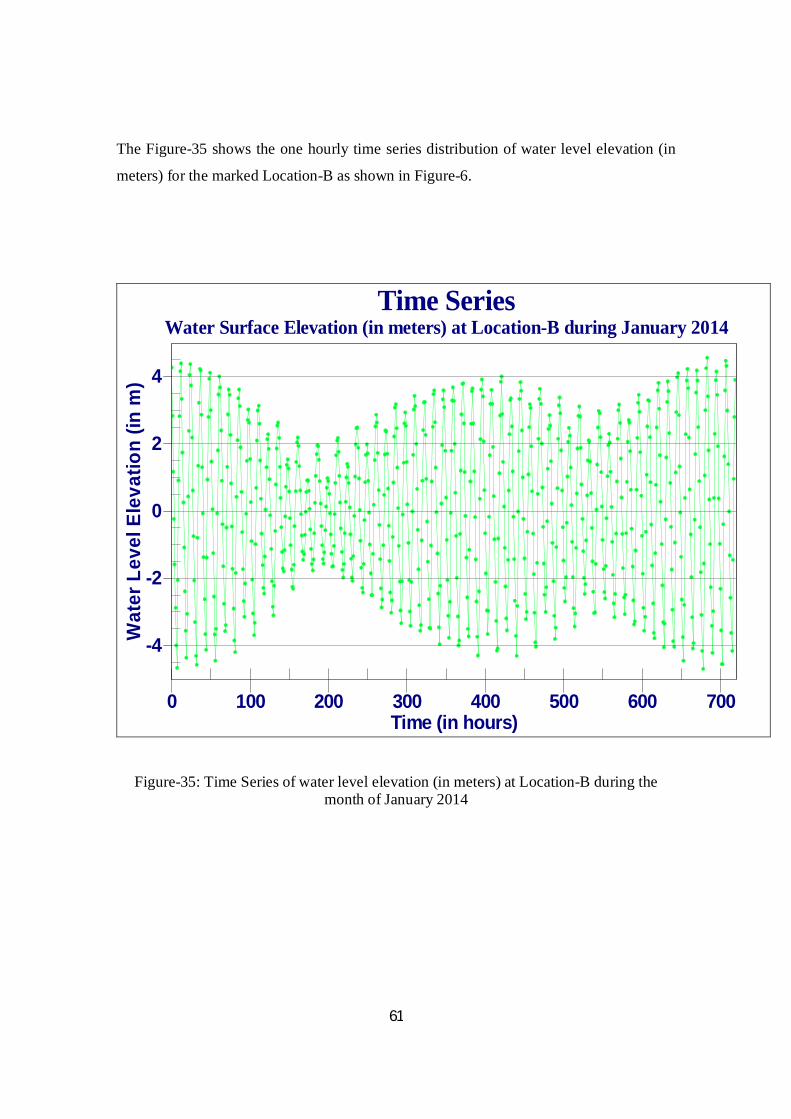
61
The Figure-35 shows the one hourly time series distribution of water level elevation (in
meters) for the marked Location-B as shown in Figure-6.
Time SeriesWater Surface Elevation (in meters) at Location-B during January 2014
Wat
er L
evel
Ele
vatio
n (in
m)
Time (in hours)0 100 200 300 400 500 600 700
-4
-2
0
2
4
Figure-35: Time Series of water level elevation (in meters) at Location-B during the month of January 2014
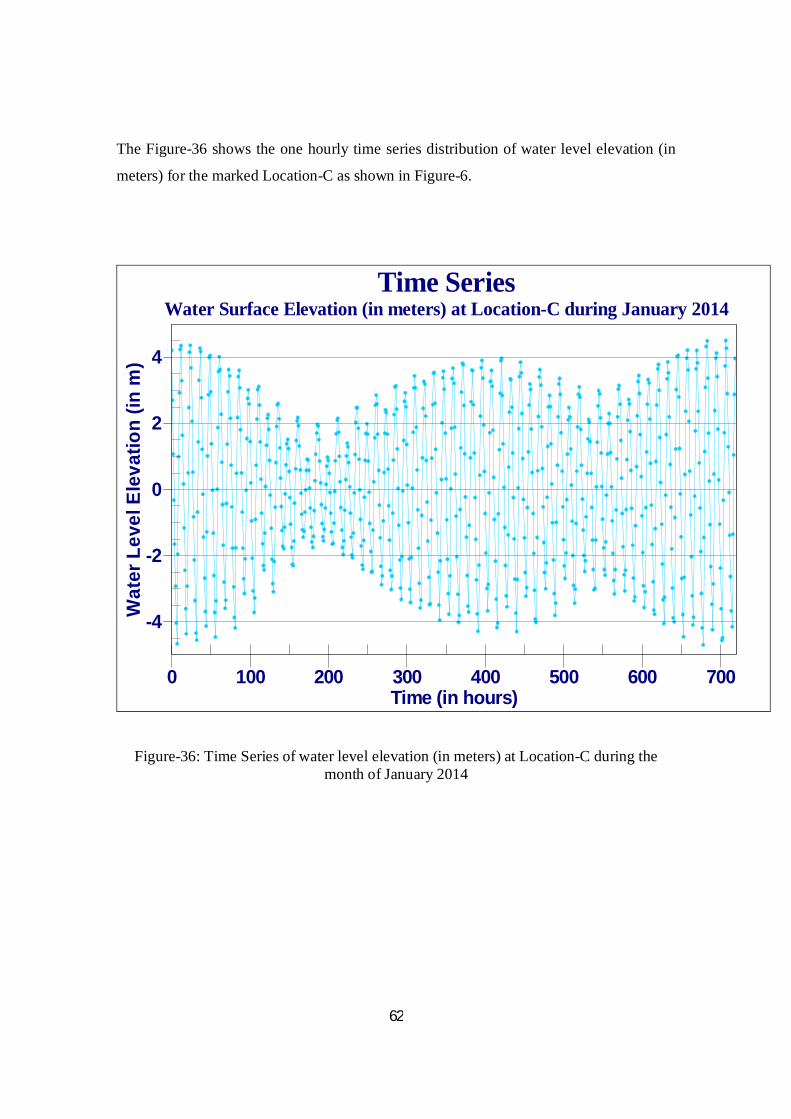
62
The Figure-36 shows the one hourly time series distribution of water level elevation (in
meters) for the marked Location-C as shown in Figure-6.
Time SeriesWater Surface Elevation (in meters) at Location-C during January 2014
Wat
er L
evel
Ele
vatio
n (in
m)
Time (in hours)0 100 200 300 400 500 600 700
-4
-2
0
2
4
Figure-36: Time Series of water level elevation (in meters) at Location-C during the month of January 2014

63
The Figure-37 shows the one hourly time series distribution of water level elevation (in
meters) for the marked Location-D as shown in Figure-6. The current magnitudes during
a representative time step of (00h) for Day-1, Day-5, Day-10, Day-15, Day-20, Day-25
and Day-30 are shown in Figures-38 to 41. The respective currents surrounding the jetty
structure from the one month duration during January 2014 is shown in Figures-42 to 48.
Time SeriesWater Surface Elevation (in meters) at Location-D during January 2014
Wat
er L
evel
Ele
vatio
n (in
m)
Time (in hours)0 100 200 300 400 500 600 700
-4
-2
0
2
4
Figure-37: Time Series of water level elevation (in meters) at Location-D during the month of January 2014
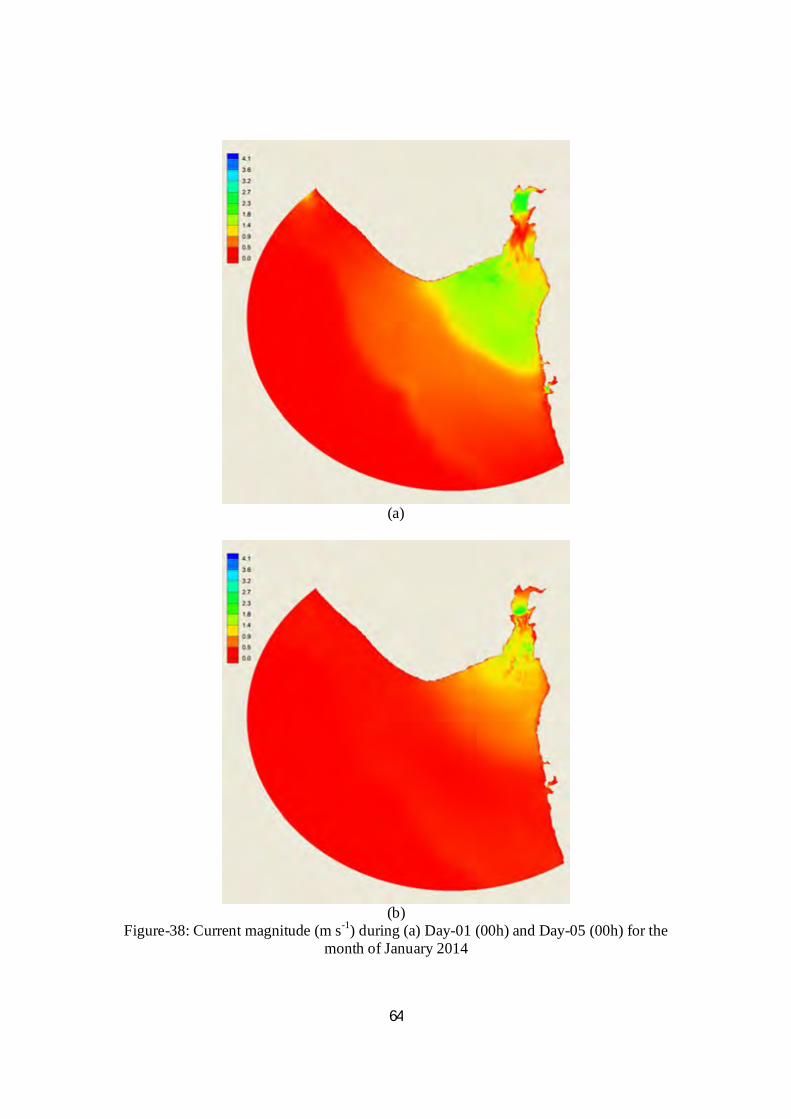
64
(a)
(b)
Figure-38: Current magnitude (m s-1) during (a) Day-01 (00h) and Day-05 (00h) for the month of January 2014
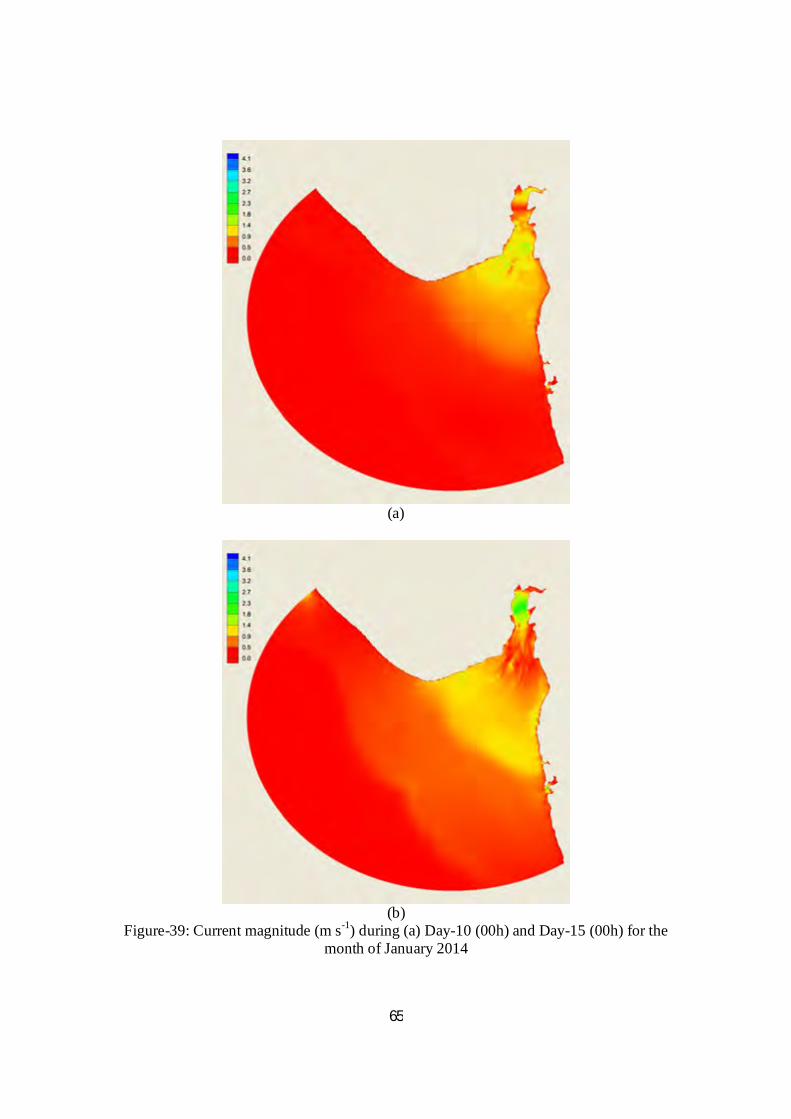
65
(a)
(b)
Figure-39: Current magnitude (m s-1) during (a) Day-10 (00h) and Day-15 (00h) for the month of January 2014
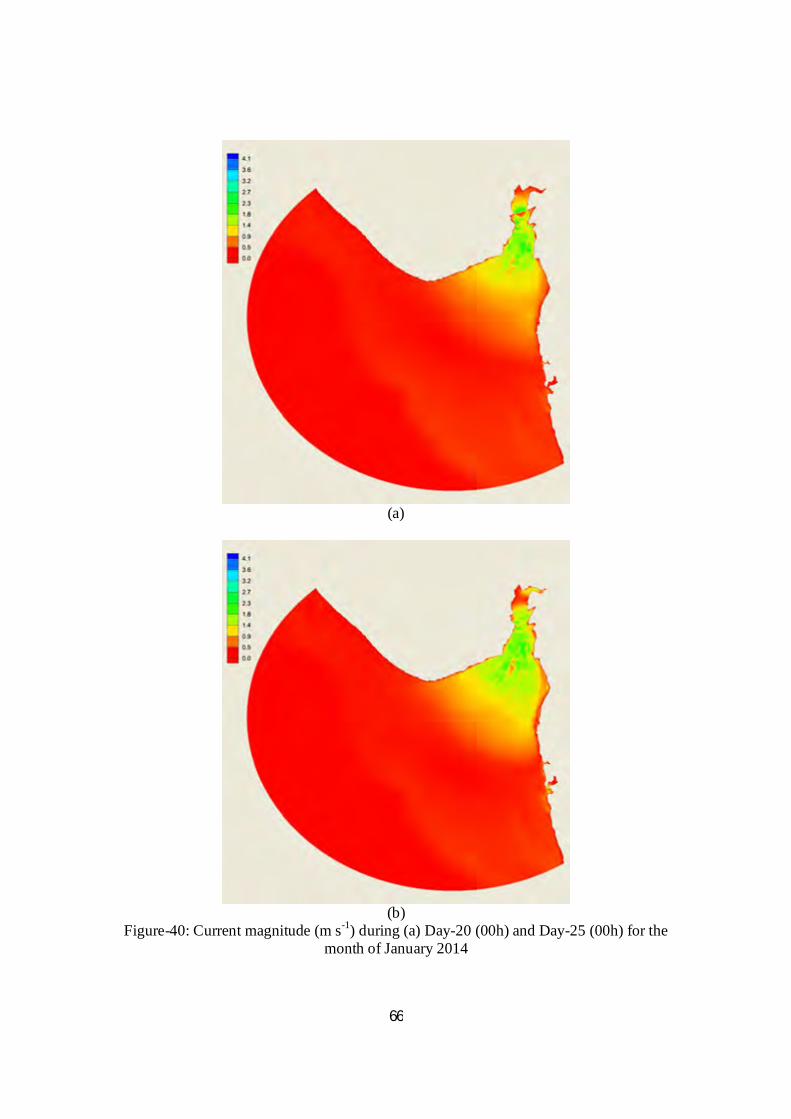
66
(a)
(b)
Figure-40: Current magnitude (m s-1) during (a) Day-20 (00h) and Day-25 (00h) for the month of January 2014
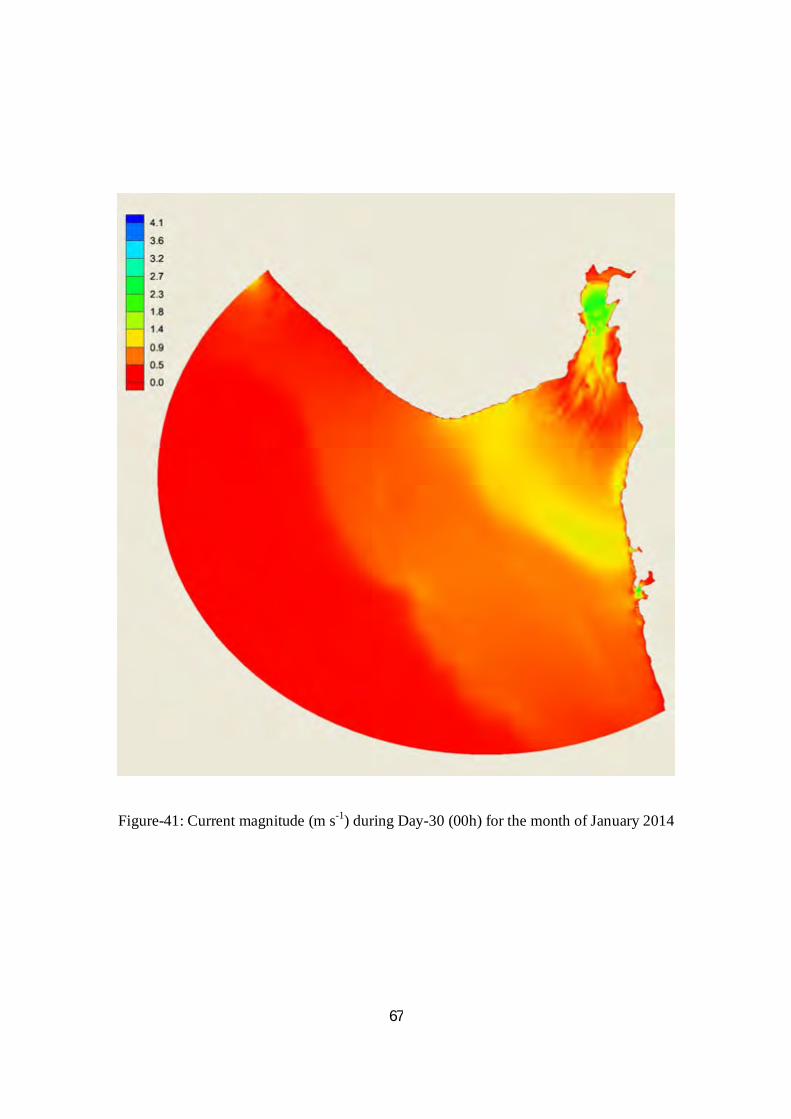
67
Figure-41: Current magnitude (m s-1) during Day-30 (00h) for the month of January 2014
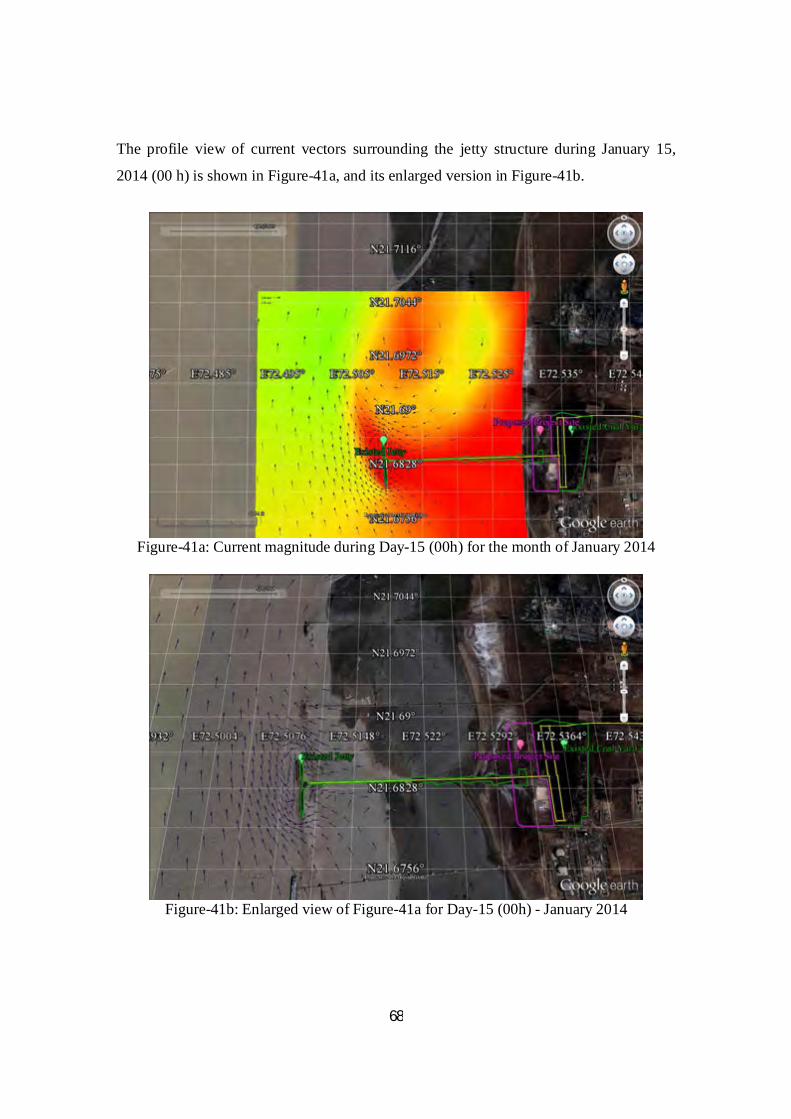
68
The profile view of current vectors surrounding the jetty structure during January 15,
2014 (00 h) is shown in Figure-41a, and its enlarged version in Figure-41b.
Figure-41a: Current magnitude during Day-15 (00h) for the month of January 2014
Figure-41b: Enlarged view of Figure-41a for Day-15 (00h) - January 2014
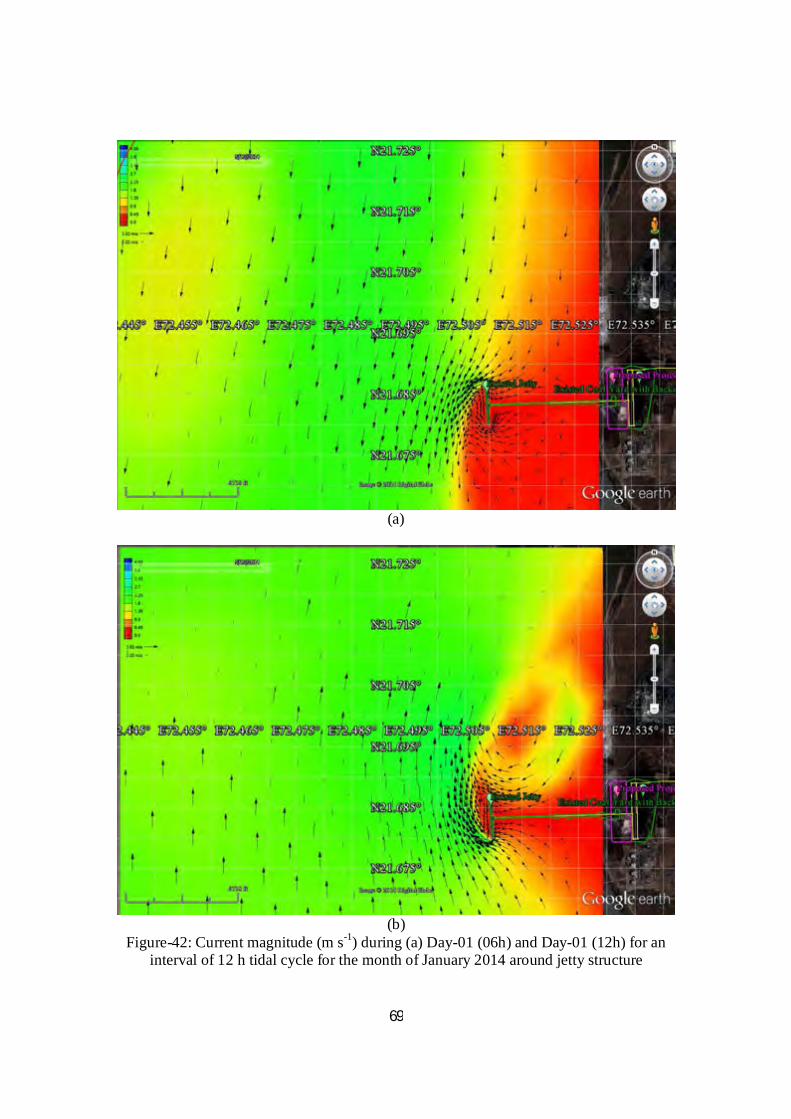
69
(a)
(b)
Figure-42: Current magnitude (m s-1) during (a) Day-01 (06h) and Day-01 (12h) for an interval of 12 h tidal cycle for the month of January 2014 around jetty structure
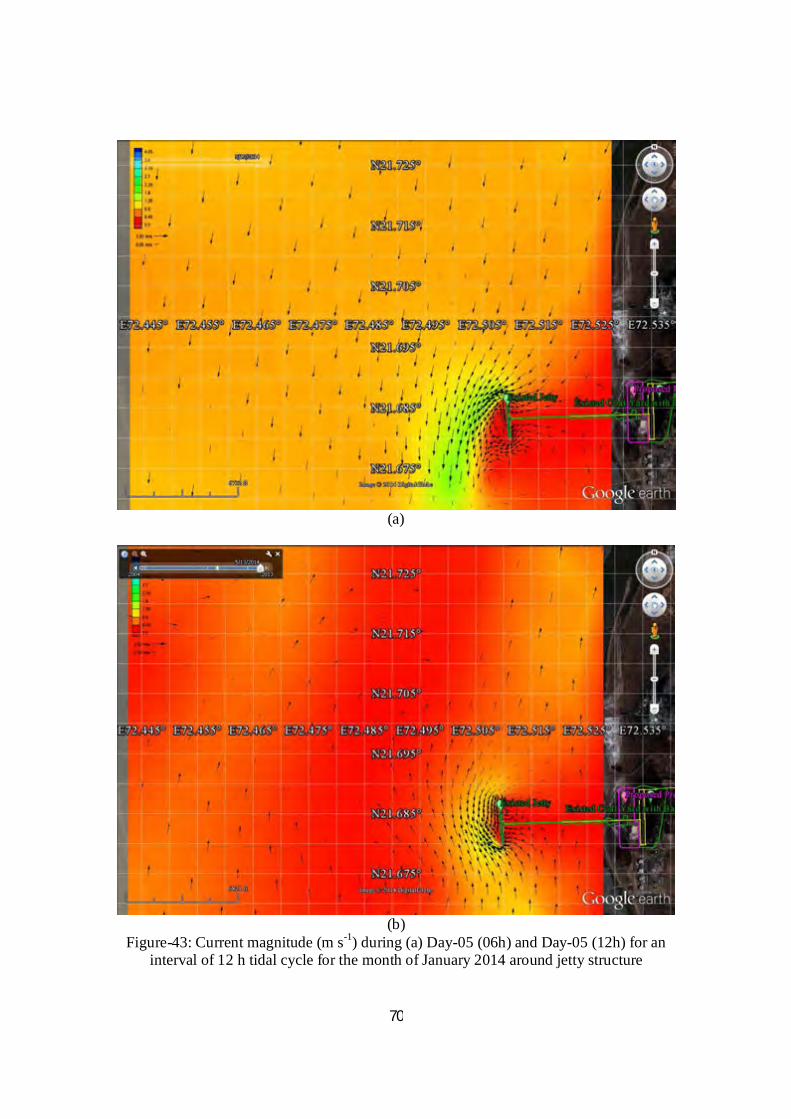
70
(a)
(b)
Figure-43: Current magnitude (m s-1) during (a) Day-05 (06h) and Day-05 (12h) for an interval of 12 h tidal cycle for the month of January 2014 around jetty structure
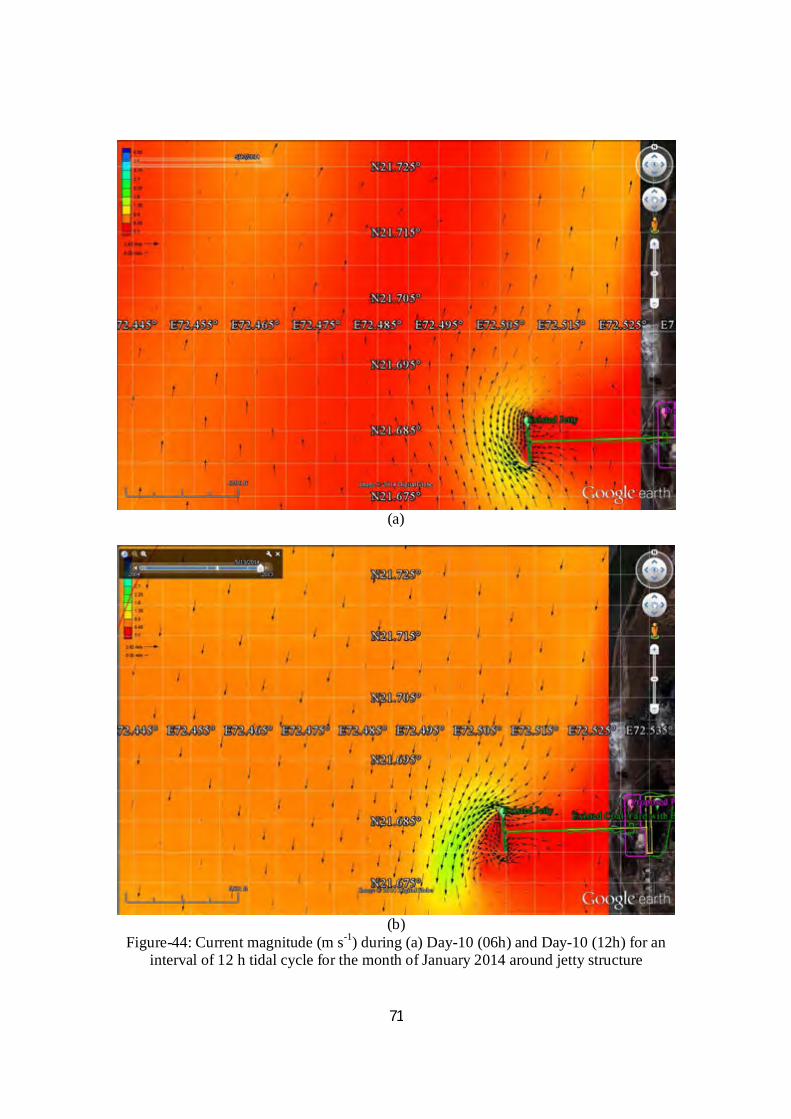
71
(a)
(b)
Figure-44: Current magnitude (m s-1) during (a) Day-10 (06h) and Day-10 (12h) for an interval of 12 h tidal cycle for the month of January 2014 around jetty structure
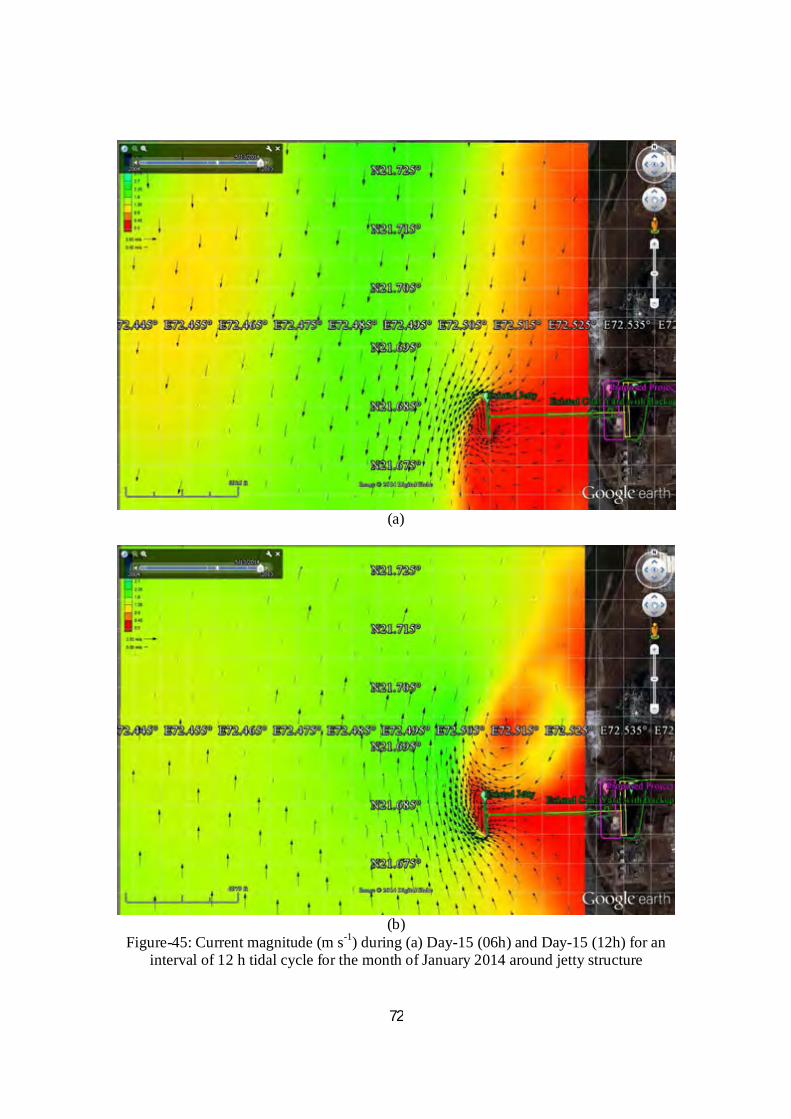
72
(a)
(b)
Figure-45: Current magnitude (m s-1) during (a) Day-15 (06h) and Day-15 (12h) for an interval of 12 h tidal cycle for the month of January 2014 around jetty structure
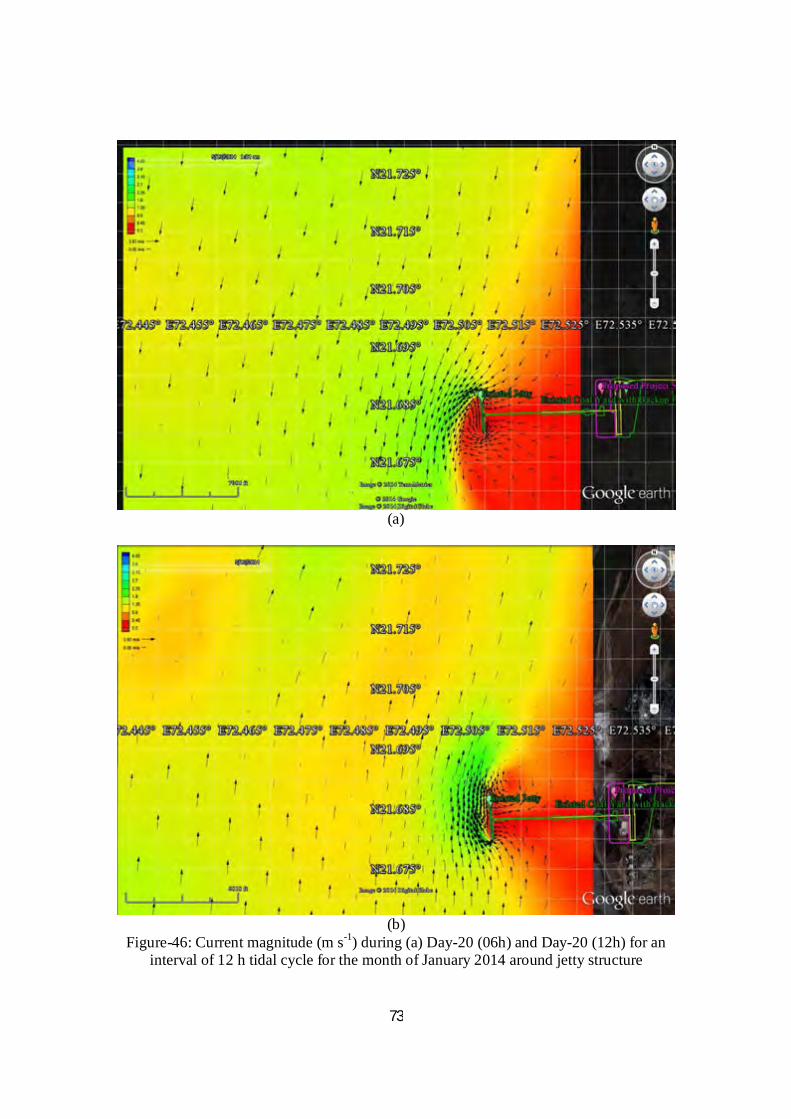
73
(a)
(b)
Figure-46: Current magnitude (m s-1) during (a) Day-20 (06h) and Day-20 (12h) for an interval of 12 h tidal cycle for the month of January 2014 around jetty structure
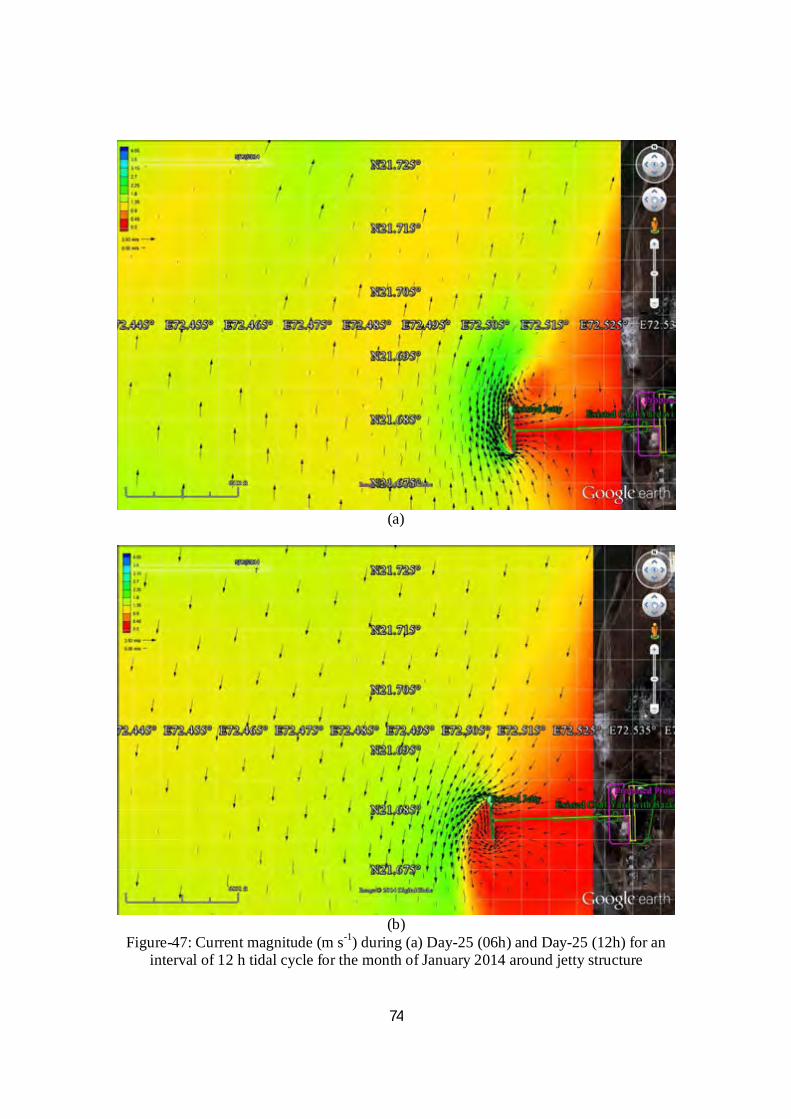
74
(a)
(b)
Figure-47: Current magnitude (m s-1) during (a) Day-25 (06h) and Day-25 (12h) for an interval of 12 h tidal cycle for the month of January 2014 around jetty structure
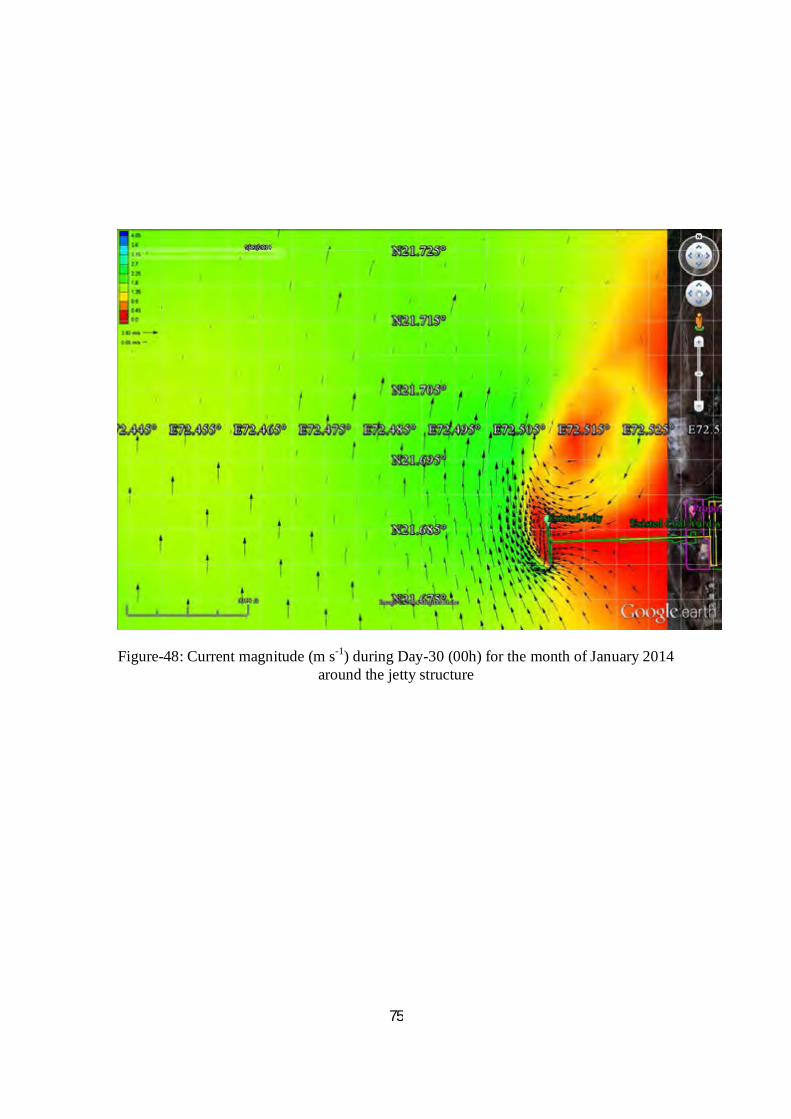
75
Figure-48: Current magnitude (m s-1) during Day-30 (00h) for the month of January 2014 around the jetty structure
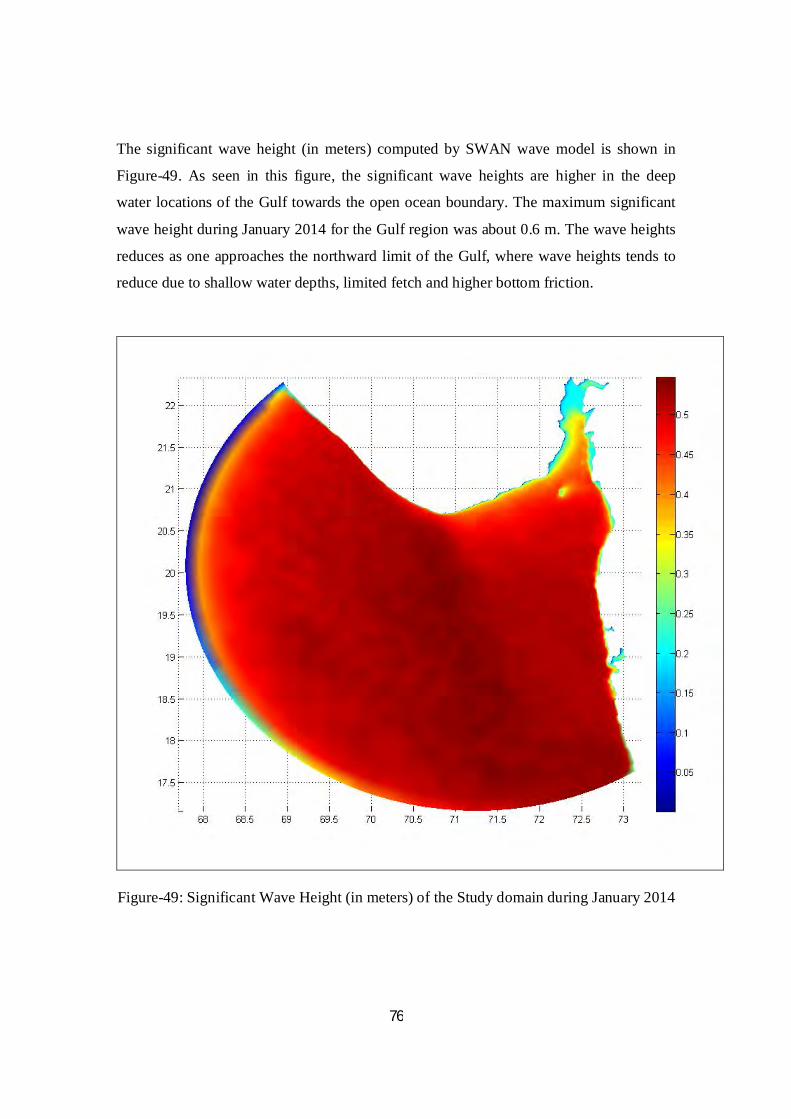
76
The significant wave height (in meters) computed by SWAN wave model is shown in
Figure-49. As seen in this figure, the significant wave heights are higher in the deep
water locations of the Gulf towards the open ocean boundary. The maximum significant
wave height during January 2014 for the Gulf region was about 0.6 m. The wave heights
reduces as one approaches the northward limit of the Gulf, where wave heights tends to
reduce due to shallow water depths, limited fetch and higher bottom friction.
Figure-49: Significant Wave Height (in meters) of the Study domain during January 2014
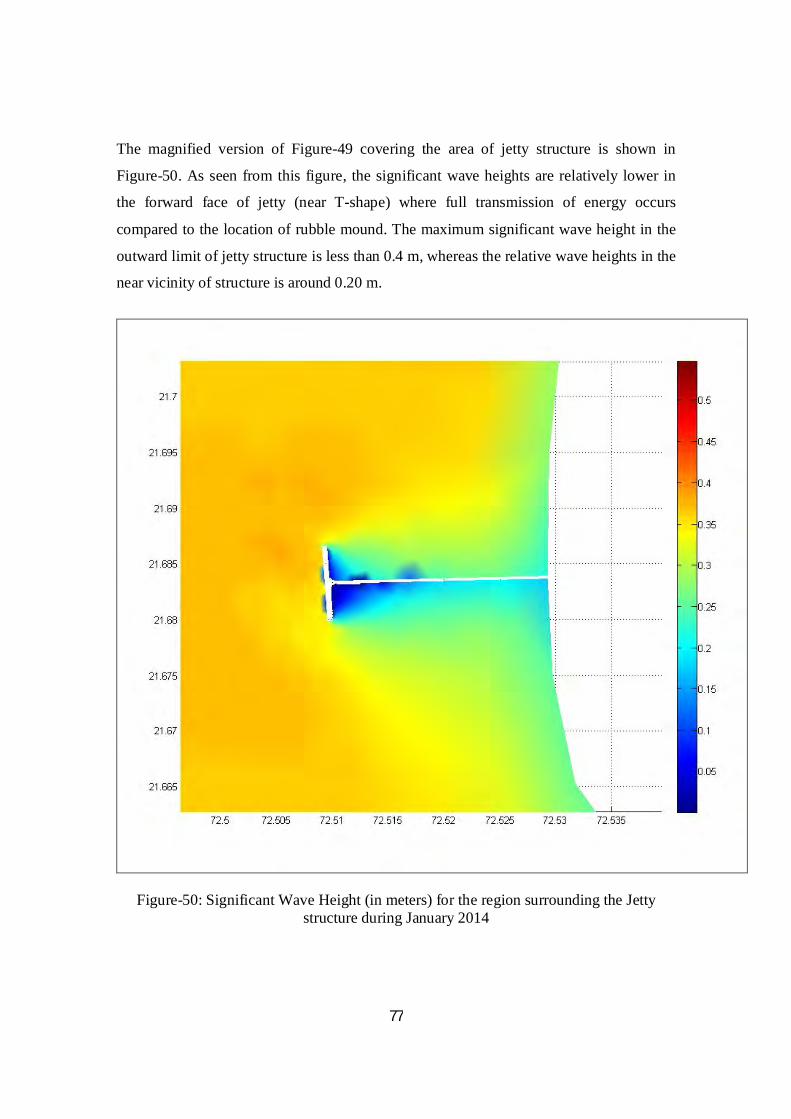
77
The magnified version of Figure-49 covering the area of jetty structure is shown in
Figure-50. As seen from this figure, the significant wave heights are relatively lower in
the forward face of jetty (near T-shape) where full transmission of energy occurs
compared to the location of rubble mound. The maximum significant wave height in the
outward limit of jetty structure is less than 0.4 m, whereas the relative wave heights in the
near vicinity of structure is around 0.20 m.
Figure-50: Significant Wave Height (in meters) for the region surrounding the Jetty structure during January 2014
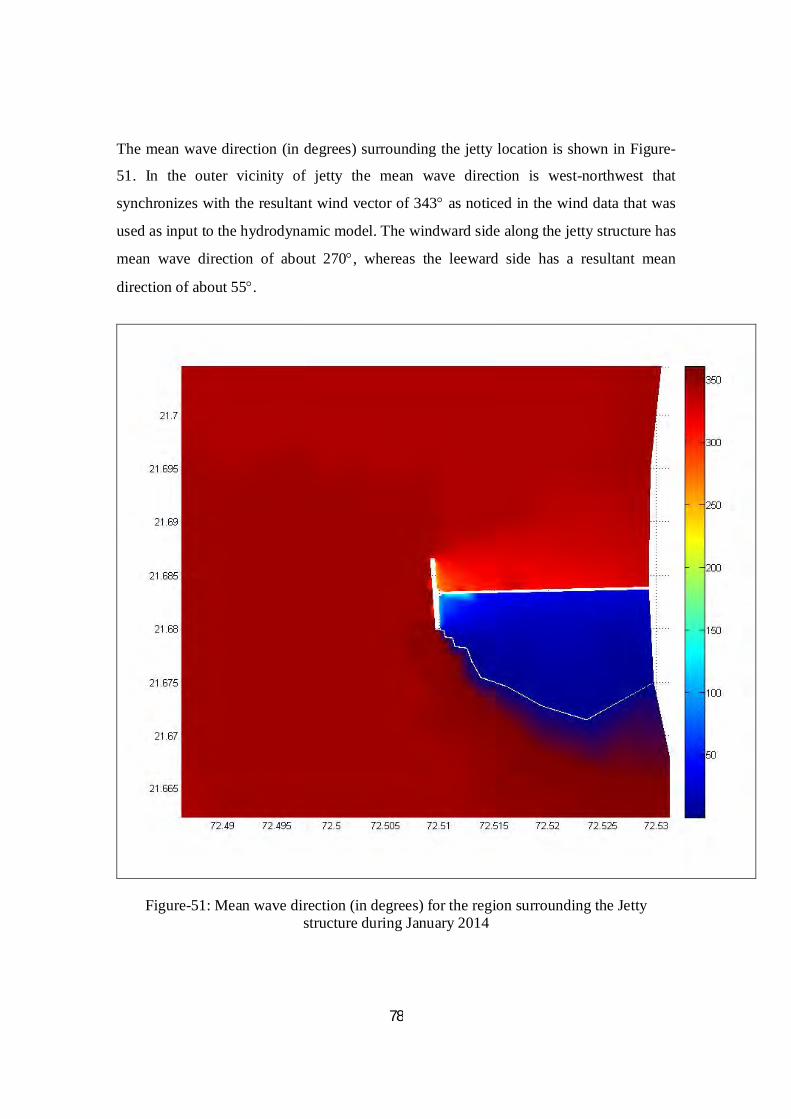
78
The mean wave direction (in degrees) surrounding the jetty location is shown in Figure-
51. In the outer vicinity of jetty the mean wave direction is west-northwest that
synchronizes with the resultant wind vector of 343 as noticed in the wind data that was
used as input to the hydrodynamic model. The windward side along the jetty structure has
mean wave direction of about 270, whereas the leeward side has a resultant mean
direction of about 55.
Figure-51: Mean wave direction (in degrees) for the region surrounding the Jetty structure during January 2014
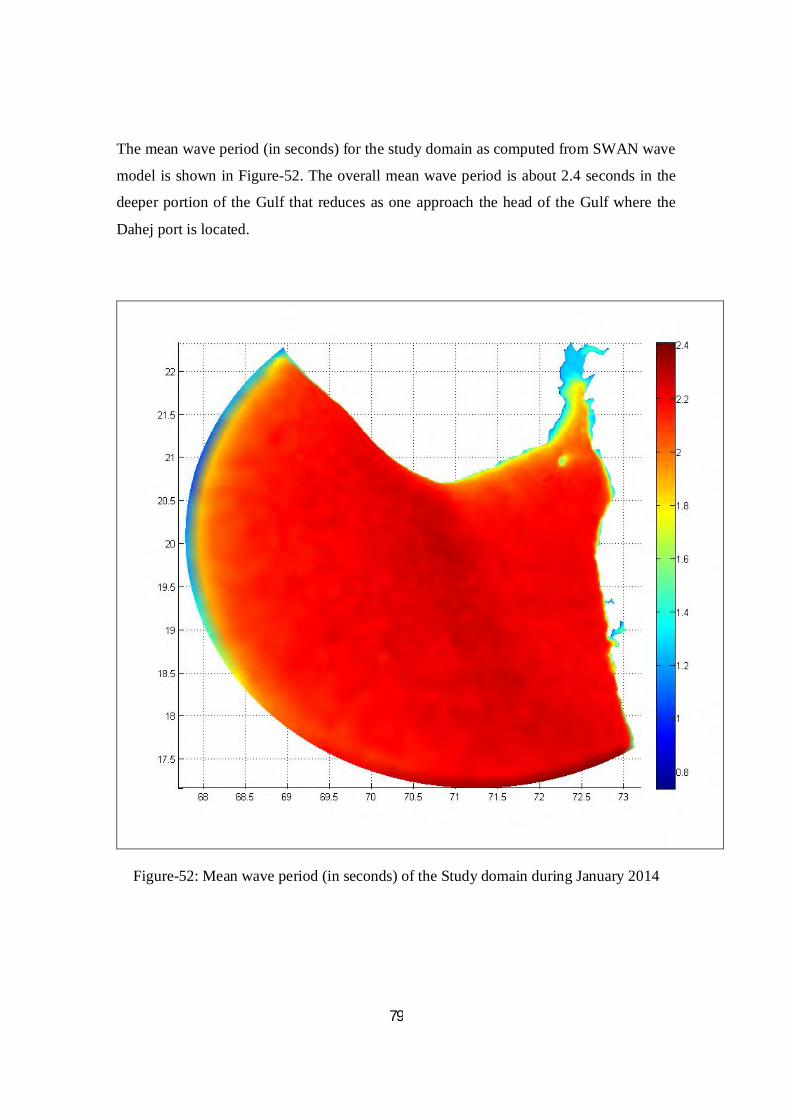
79
The mean wave period (in seconds) for the study domain as computed from SWAN wave
model is shown in Figure-52. The overall mean wave period is about 2.4 seconds in the
deeper portion of the Gulf that reduces as one approach the head of the Gulf where the
Dahej port is located.
Figure-52: Mean wave period (in seconds) of the Study domain during January 2014
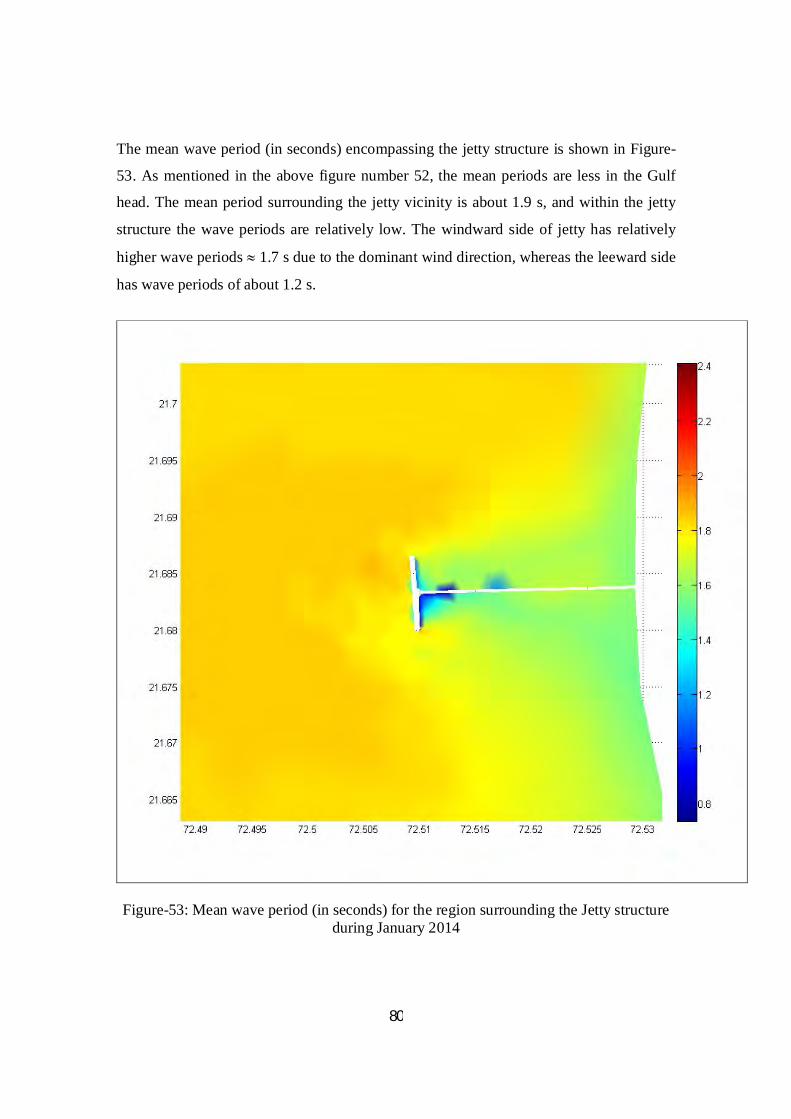
80
The mean wave period (in seconds) encompassing the jetty structure is shown in Figure-
53. As mentioned in the above figure number 52, the mean periods are less in the Gulf
head. The mean period surrounding the jetty vicinity is about 1.9 s, and within the jetty
structure the wave periods are relatively low. The windward side of jetty has relatively
higher wave periods 1.7 s due to the dominant wind direction, whereas the leeward side
has wave periods of about 1.2 s.
Figure-53: Mean wave period (in seconds) for the region surrounding the Jetty structure during January 2014
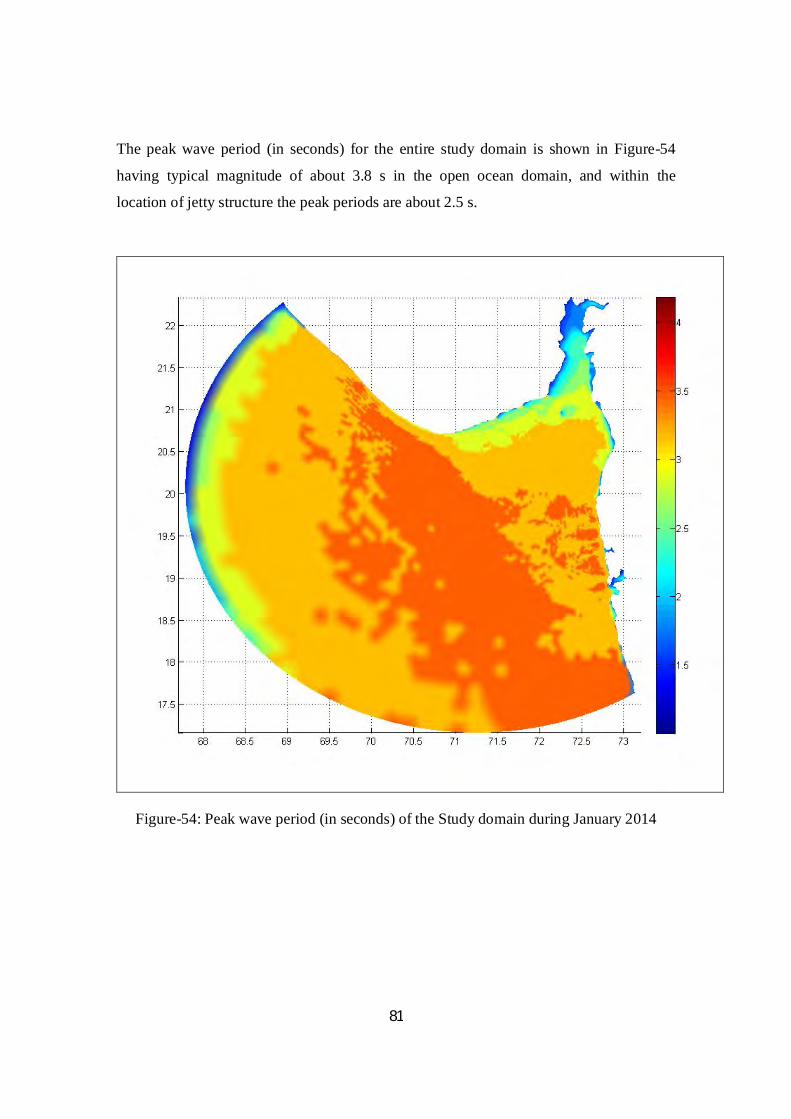
81
The peak wave period (in seconds) for the entire study domain is shown in Figure-54
having typical magnitude of about 3.8 s in the open ocean domain, and within the
location of jetty structure the peak periods are about 2.5 s.
Figure-54: Peak wave period (in seconds) of the Study domain during January 2014
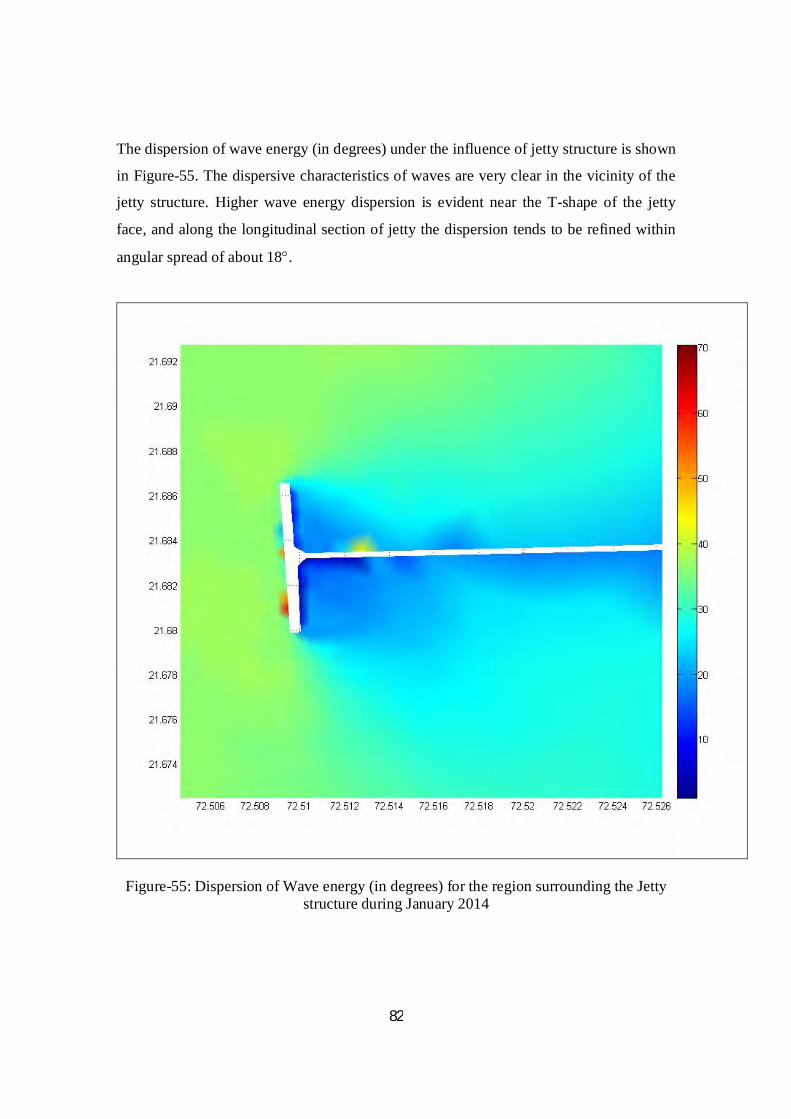
82
The dispersion of wave energy (in degrees) under the influence of jetty structure is shown
in Figure-55. The dispersive characteristics of waves are very clear in the vicinity of the
jetty structure. Higher wave energy dispersion is evident near the T-shape of the jetty
face, and along the longitudinal section of jetty the dispersion tends to be refined within
angular spread of about 18.
Figure-55: Dispersion of Wave energy (in degrees) for the region surrounding the Jetty structure during January 2014

83
HYDRODYNAMICS
FOR THE MONTH OF
FEBRUARY 2014
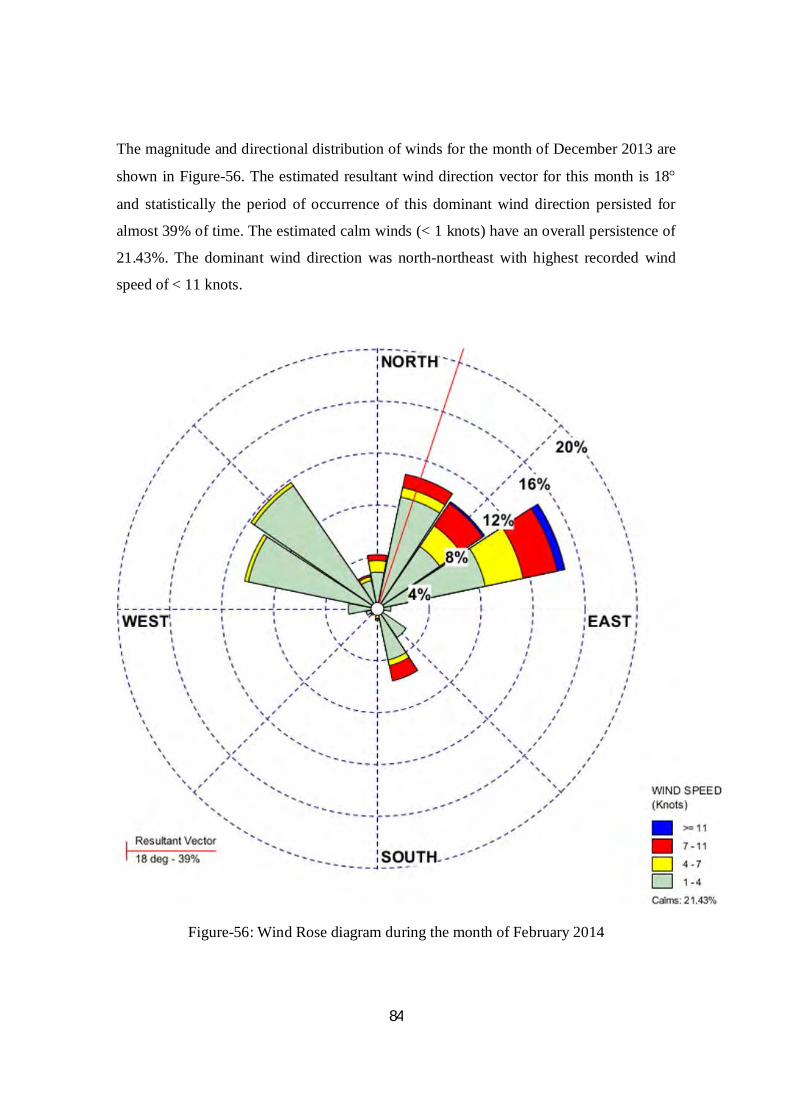
84
The magnitude and directional distribution of winds for the month of December 2013 are
shown in Figure-56. The estimated resultant wind direction vector for this month is 18
and statistically the period of occurrence of this dominant wind direction persisted for
almost 39% of time. The estimated calm winds (< 1 knots) have an overall persistence of
21.43%. The dominant wind direction was north-northeast with highest recorded wind
speed of < 11 knots.
Figure-56: Wind Rose diagram during the month of February 2014
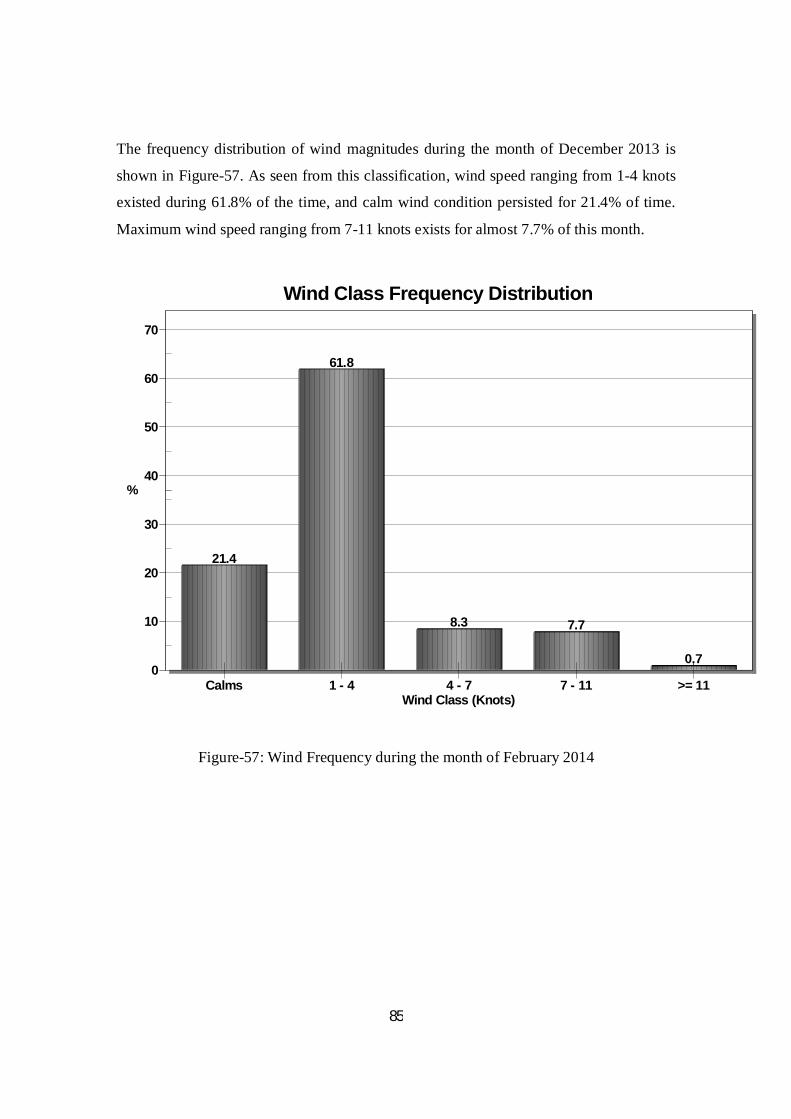
85
The frequency distribution of wind magnitudes during the month of December 2013 is
shown in Figure-57. As seen from this classification, wind speed ranging from 1-4 knots
existed during 61.8% of the time, and calm wind condition persisted for 21.4% of time.
Maximum wind speed ranging from 7-11 knots exists for almost 7.7% of this month.
21.4
61.8
8.3 7.7
0.70
10
20
30
40
50
60
70
%
Wind Class Frequency Distribution
Wind Class (Knots)Calms 1 - 4 4 - 7 7 - 11 >= 11
Figure-57: Wind Frequency during the month of February 2014
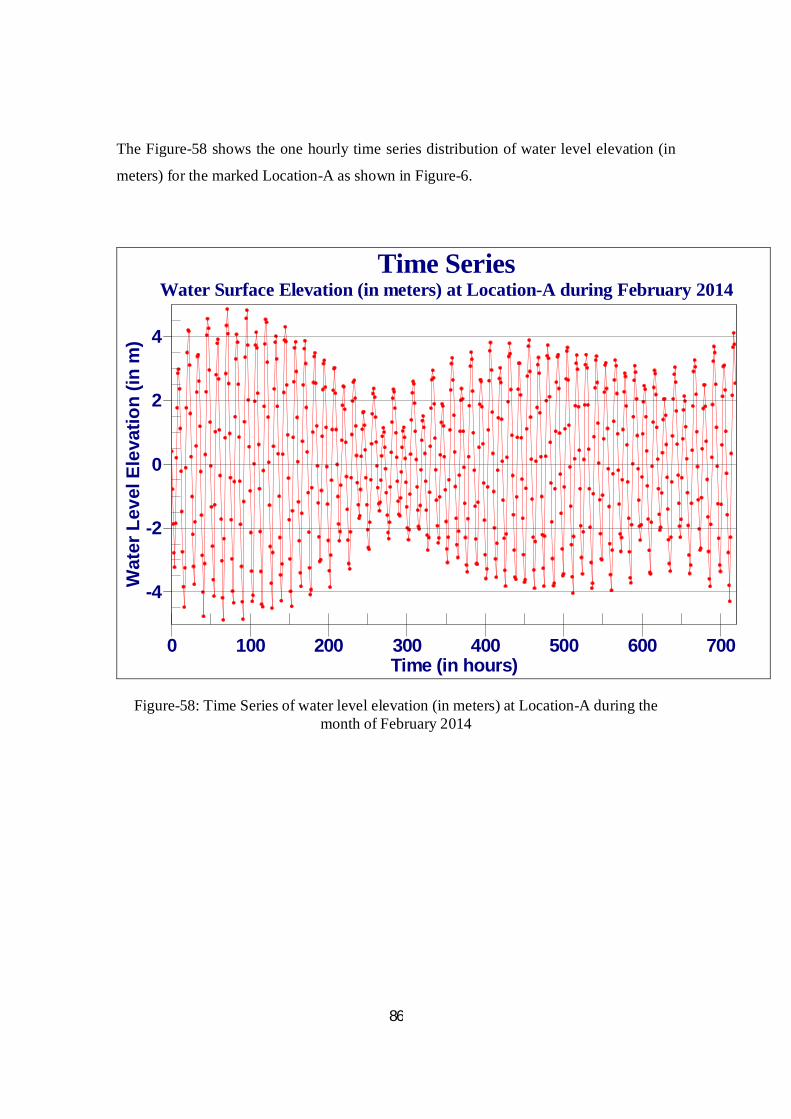
86
The Figure-58 shows the one hourly time series distribution of water level elevation (in
meters) for the marked Location-A as shown in Figure-6.
Time SeriesWater Surface Elevation (in meters) at Location-A during February 2014
Wat
er L
evel
Ele
vatio
n (in
m)
Time (in hours)0 100 200 300 400 500 600 700
-4
-2
0
2
4
Figure-58: Time Series of water level elevation (in meters) at Location-A during the month of February 2014
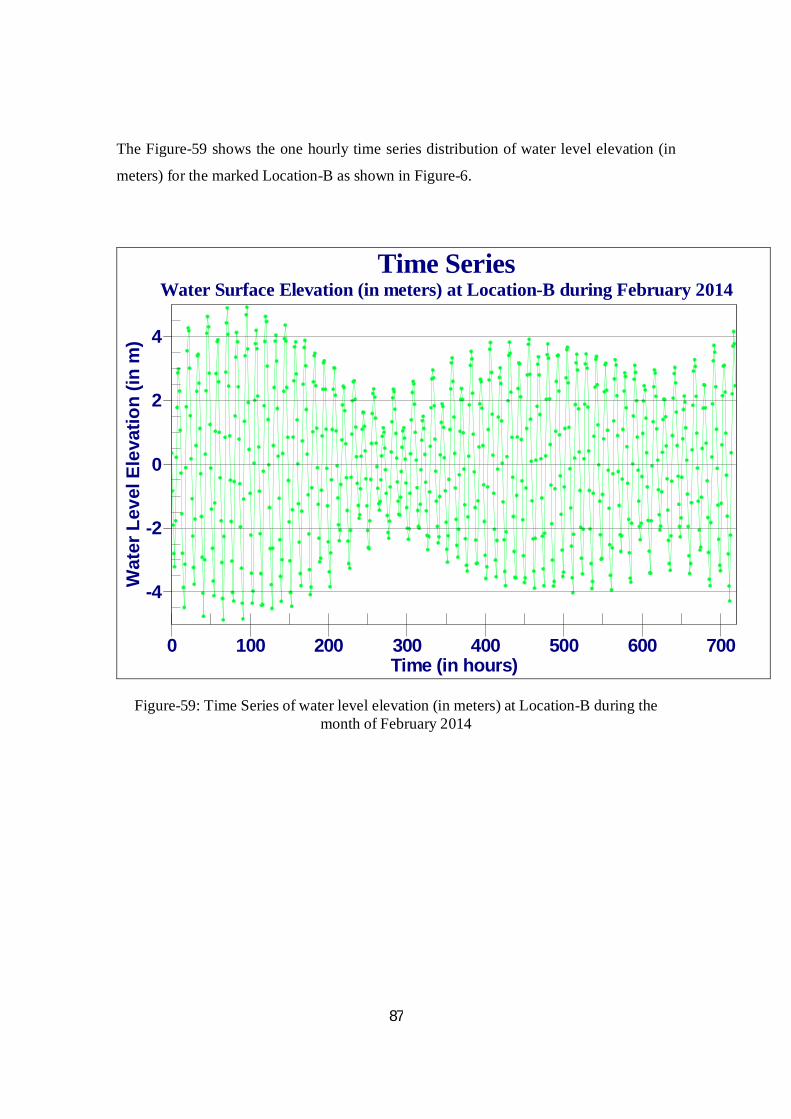
87
The Figure-59 shows the one hourly time series distribution of water level elevation (in
meters) for the marked Location-B as shown in Figure-6.
Time SeriesWater Surface Elevation (in meters) at Location-B during February 2014
Wat
er L
evel
Ele
vatio
n (in
m)
Time (in hours)0 100 200 300 400 500 600 700
-4
-2
0
2
4
Figure-59: Time Series of water level elevation (in meters) at Location-B during the month of February 2014
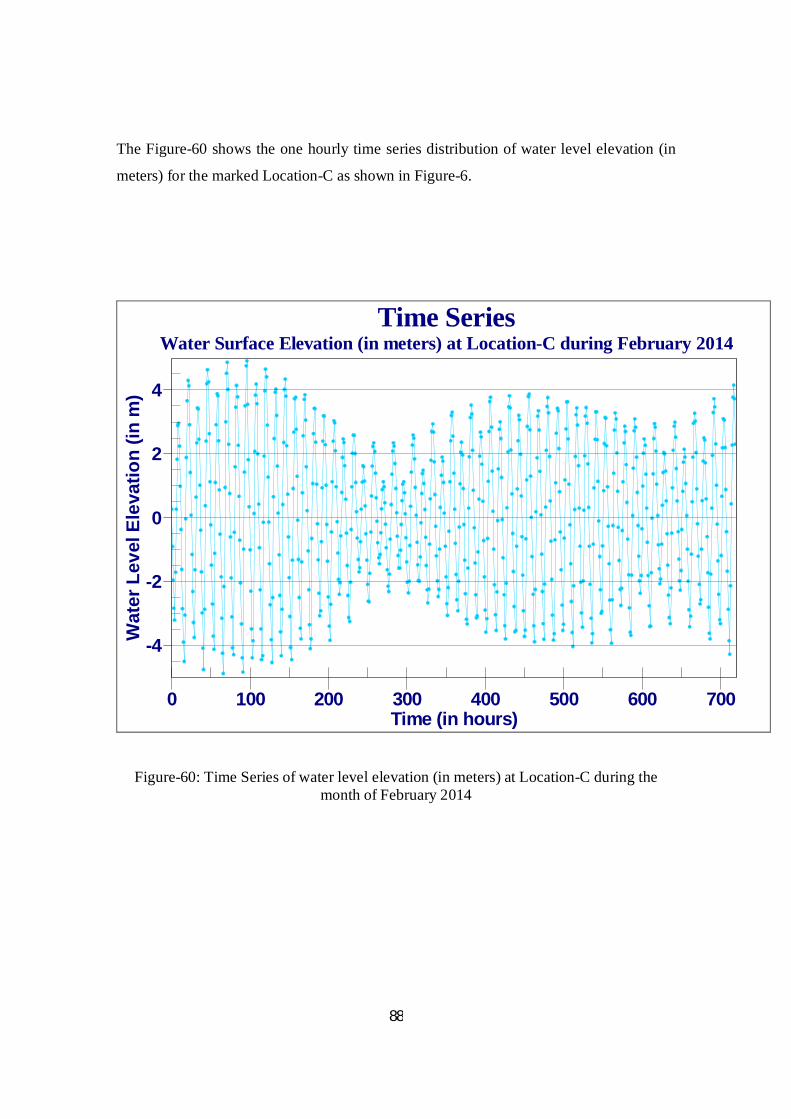
88
The Figure-60 shows the one hourly time series distribution of water level elevation (in
meters) for the marked Location-C as shown in Figure-6.
Time SeriesWater Surface Elevation (in meters) at Location-C during February 2014
Wat
er L
evel
Ele
vatio
n (in
m)
Time (in hours)0 100 200 300 400 500 600 700
-4
-2
0
2
4
Figure-60: Time Series of water level elevation (in meters) at Location-C during the month of February 2014
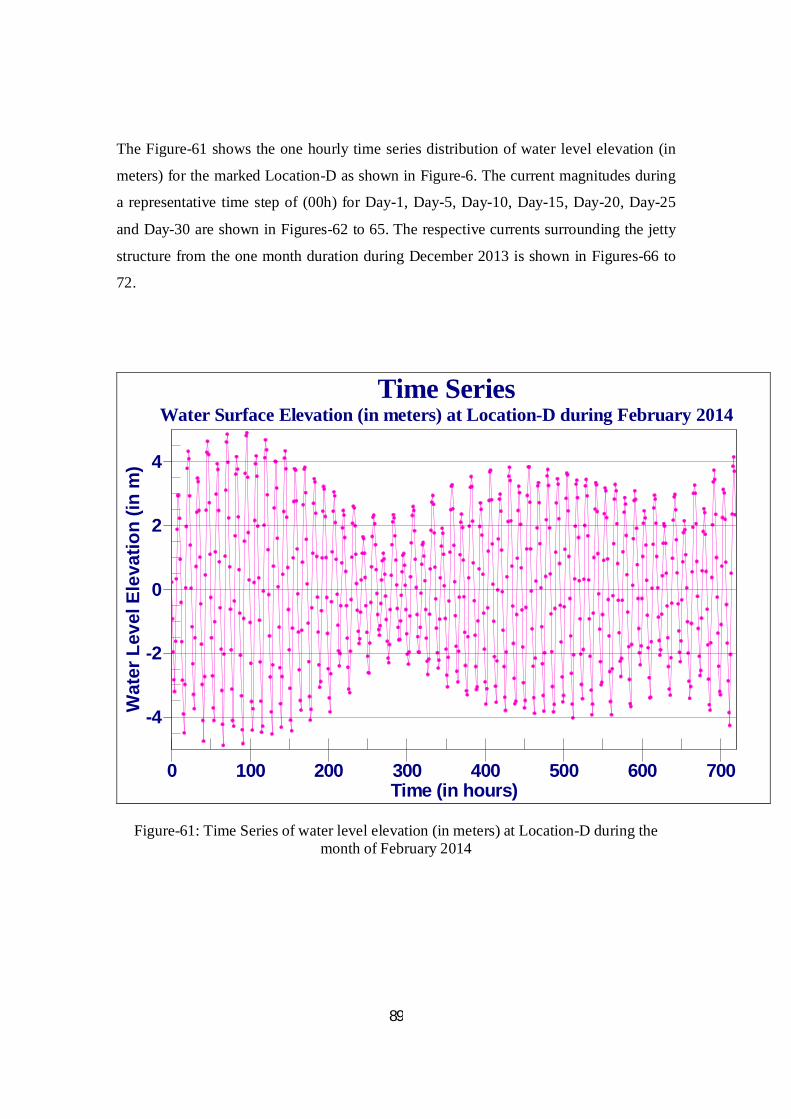
89
The Figure-61 shows the one hourly time series distribution of water level elevation (in
meters) for the marked Location-D as shown in Figure-6. The current magnitudes during
a representative time step of (00h) for Day-1, Day-5, Day-10, Day-15, Day-20, Day-25
and Day-30 are shown in Figures-62 to 65. The respective currents surrounding the jetty
structure from the one month duration during December 2013 is shown in Figures-66 to
72.
Time SeriesWater Surface Elevation (in meters) at Location-D during February 2014
Wat
er L
evel
Ele
vatio
n (in
m)
Time (in hours)0 100 200 300 400 500 600 700
-4
-2
0
2
4
Figure-61: Time Series of water level elevation (in meters) at Location-D during the month of February 2014
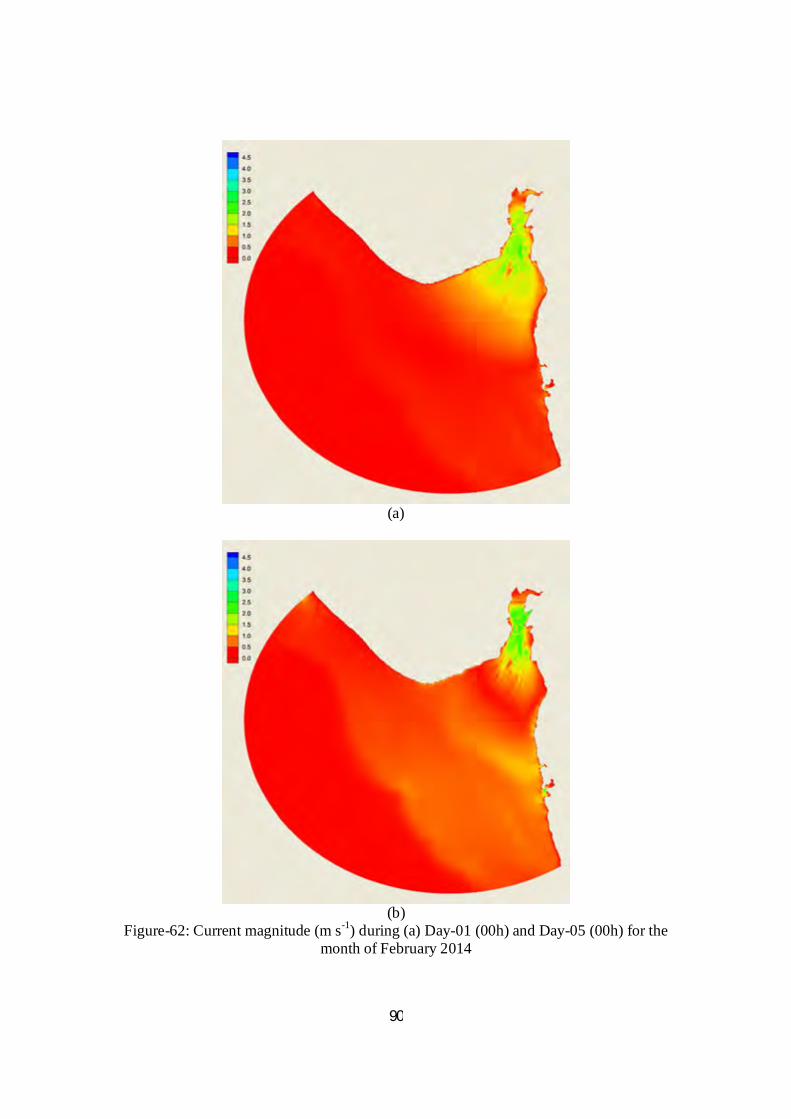
90
(a)
(b)
Figure-62: Current magnitude (m s-1) during (a) Day-01 (00h) and Day-05 (00h) for the month of February 2014
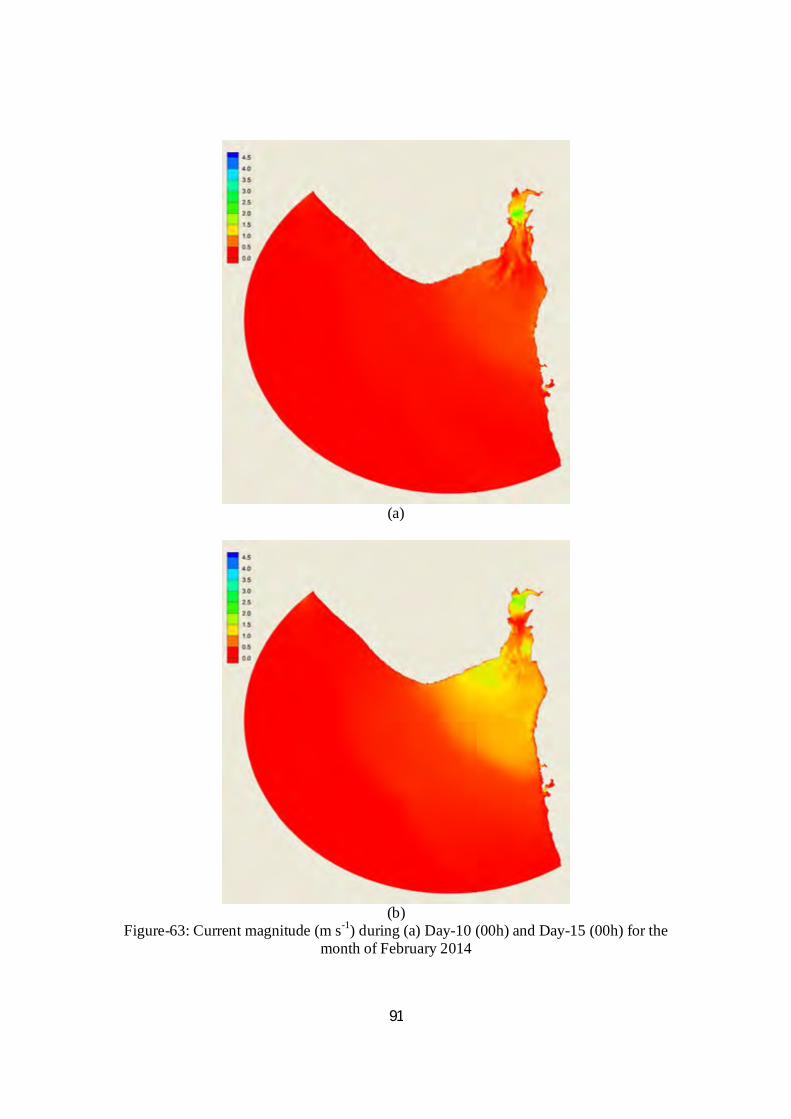
91
(a)
(b)
Figure-63: Current magnitude (m s-1) during (a) Day-10 (00h) and Day-15 (00h) for the month of February 2014
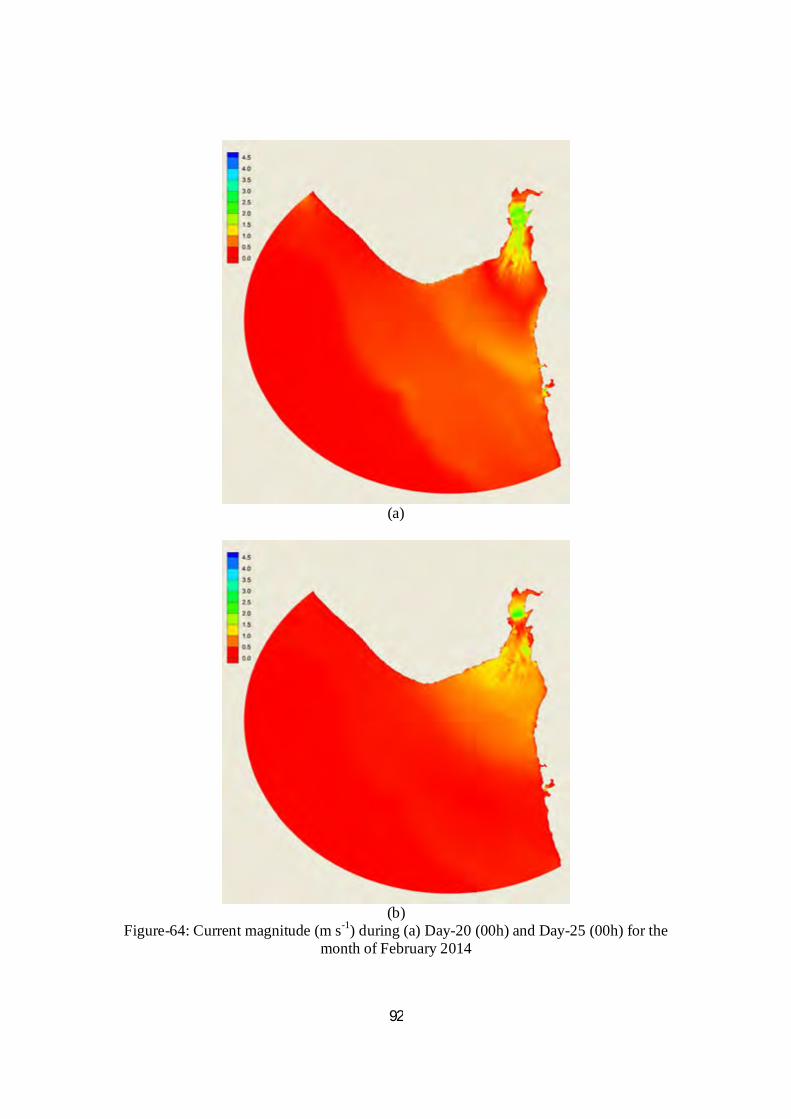
92
(a)
(b)
Figure-64: Current magnitude (m s-1) during (a) Day-20 (00h) and Day-25 (00h) for the month of February 2014
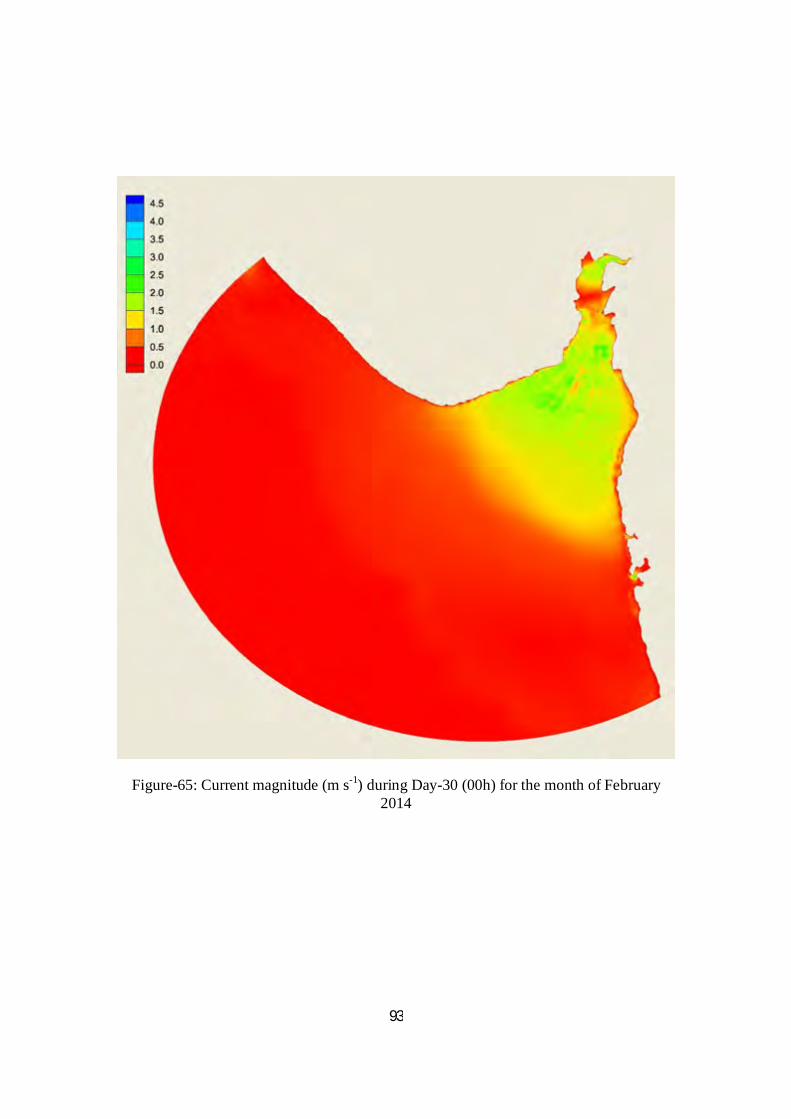
93
Figure-65: Current magnitude (m s-1) during Day-30 (00h) for the month of February 2014
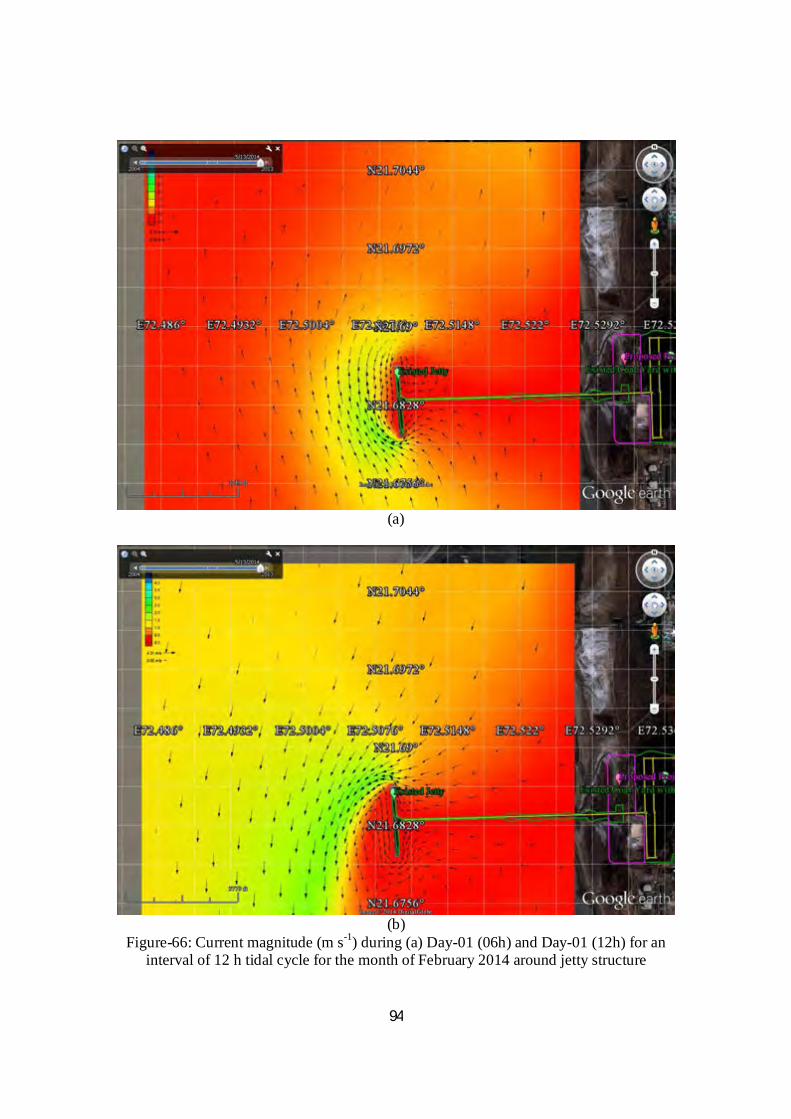
94
(a)
(b)
Figure-66: Current magnitude (m s-1) during (a) Day-01 (06h) and Day-01 (12h) for an interval of 12 h tidal cycle for the month of February 2014 around jetty structure
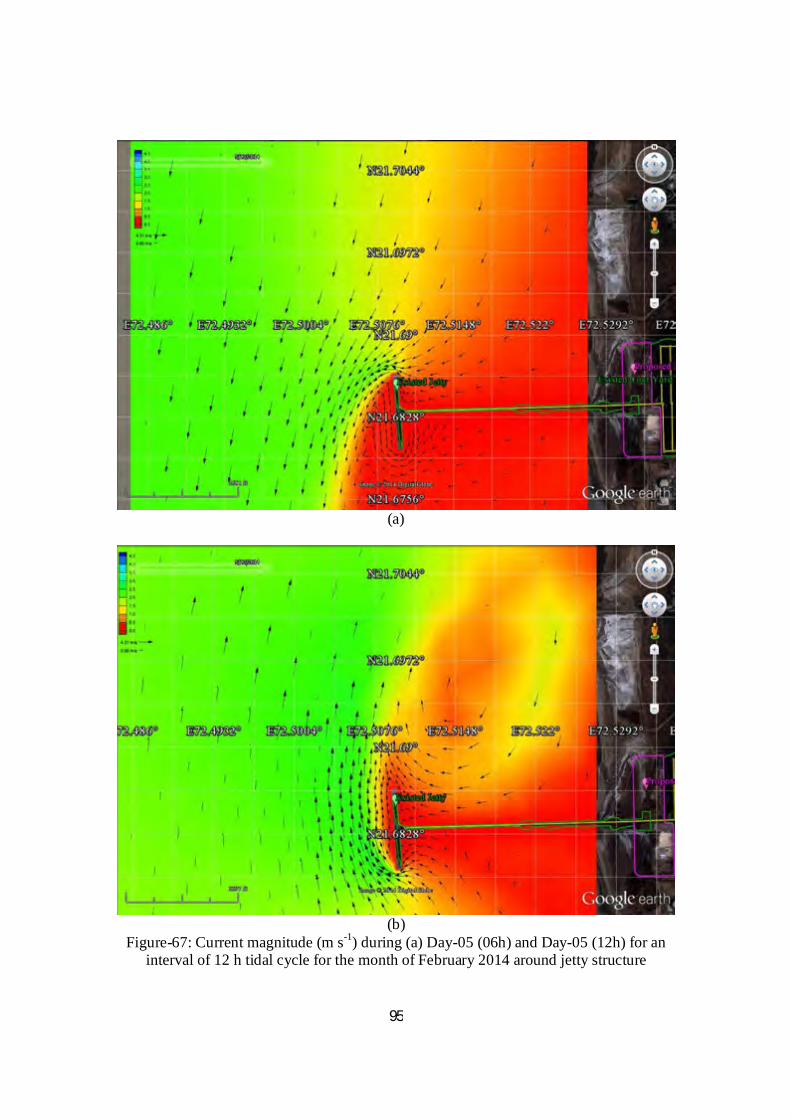
95
(a)
(b)
Figure-67: Current magnitude (m s-1) during (a) Day-05 (06h) and Day-05 (12h) for an interval of 12 h tidal cycle for the month of February 2014 around jetty structure
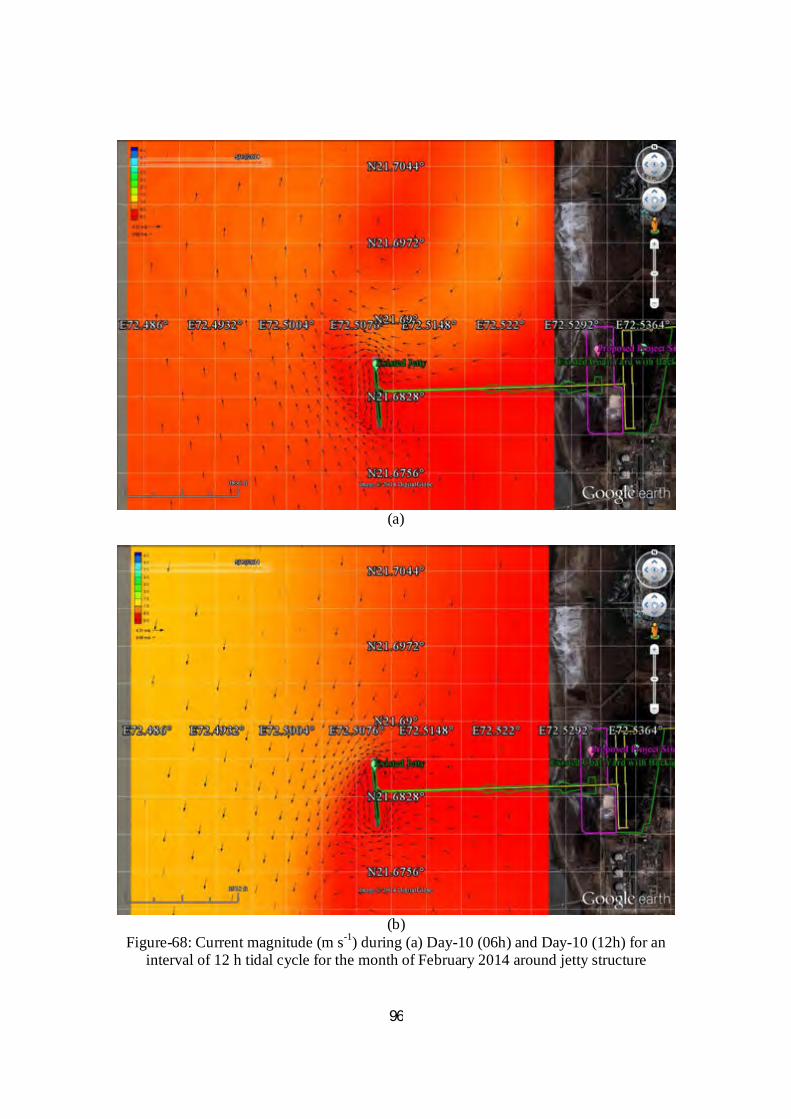
96
(a)
(b)
Figure-68: Current magnitude (m s-1) during (a) Day-10 (06h) and Day-10 (12h) for an interval of 12 h tidal cycle for the month of February 2014 around jetty structure
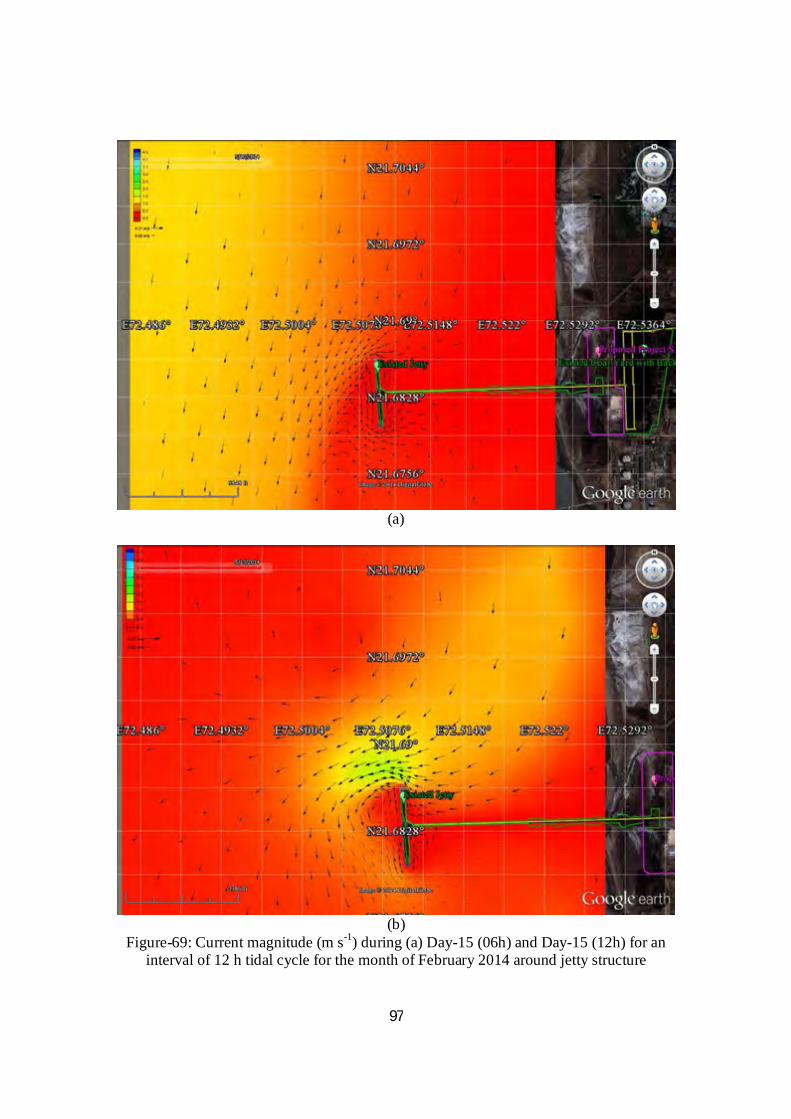
97
(a)
(b)
Figure-69: Current magnitude (m s-1) during (a) Day-15 (06h) and Day-15 (12h) for an interval of 12 h tidal cycle for the month of February 2014 around jetty structure

98
(a)
(b)
Figure-70: Current magnitude (m s-1) during (a) Day-20 (06h) and Day-20 (12h) for an interval of 12 h tidal cycle for the month of February 2014 around jetty structure
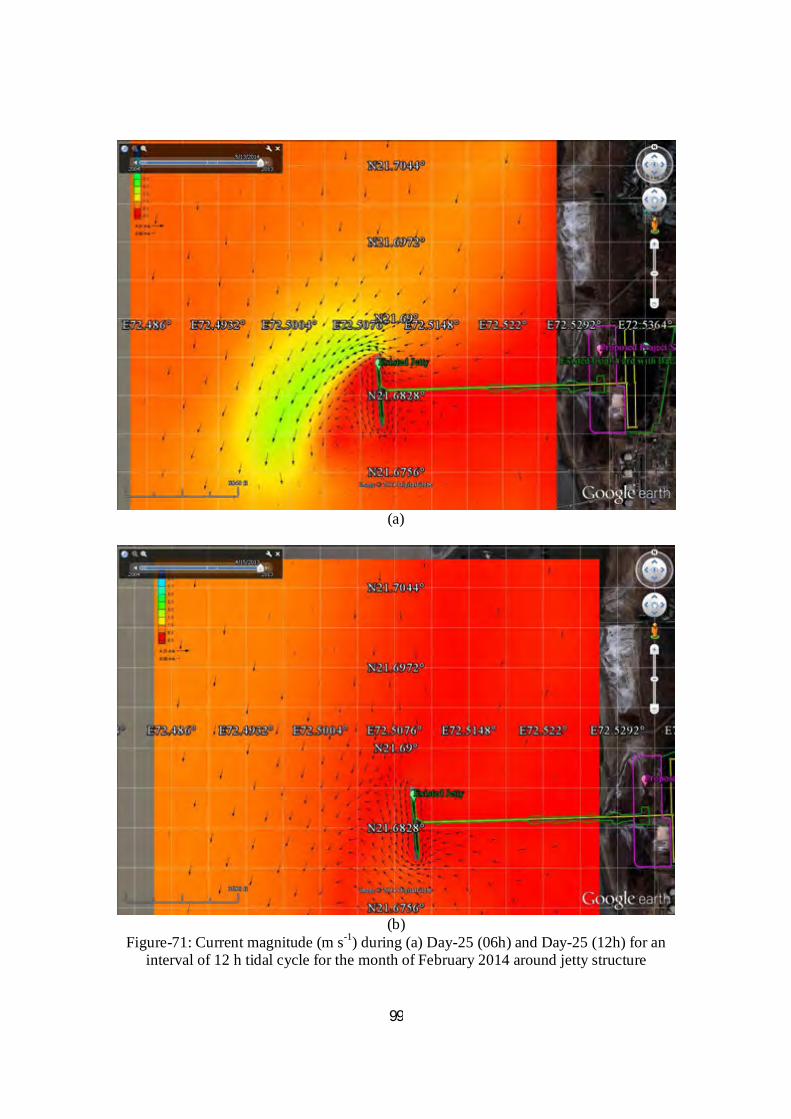
99
(a)
(b)
Figure-71: Current magnitude (m s-1) during (a) Day-25 (06h) and Day-25 (12h) for an interval of 12 h tidal cycle for the month of February 2014 around jetty structure
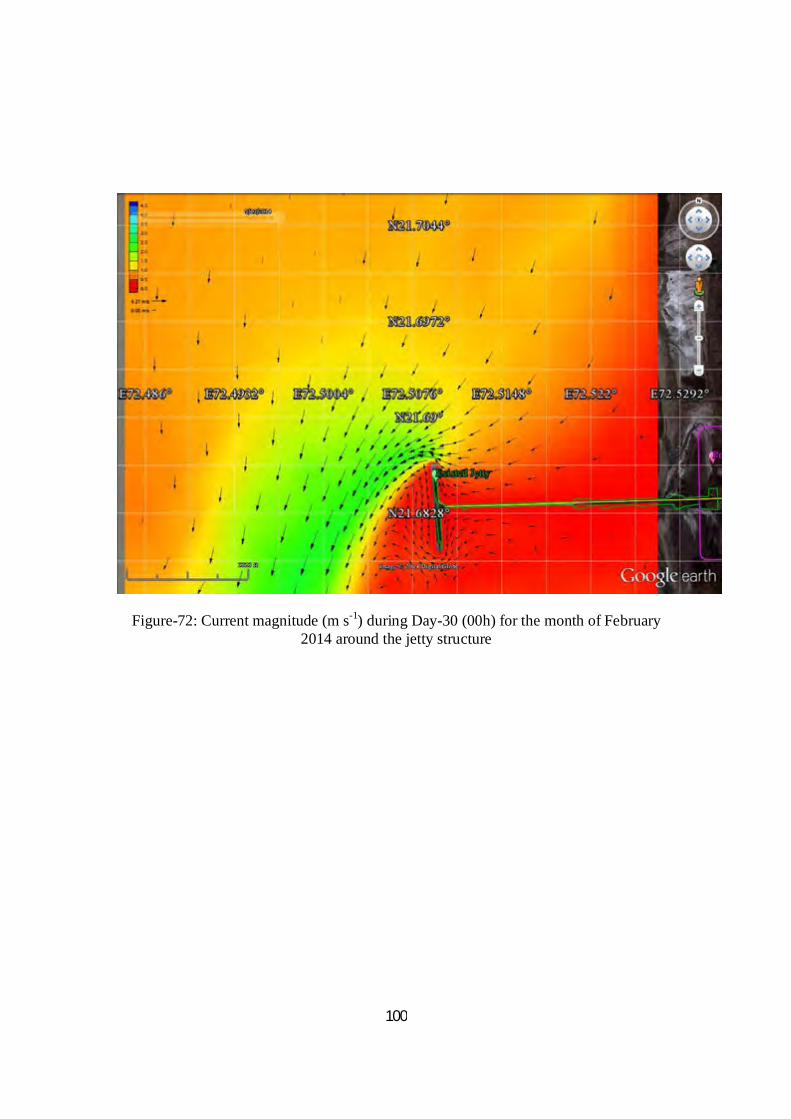
100
Figure-72: Current magnitude (m s-1) during Day-30 (00h) for the month of February 2014 around the jetty structure
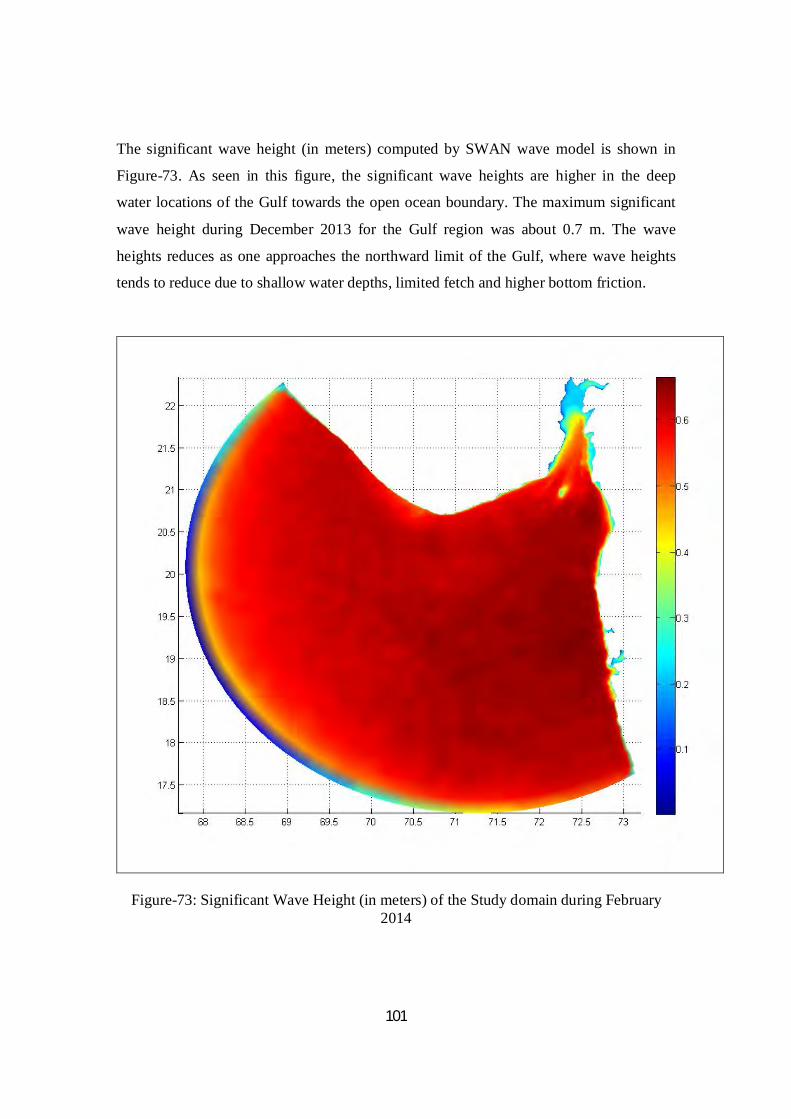
101
The significant wave height (in meters) computed by SWAN wave model is shown in
Figure-73. As seen in this figure, the significant wave heights are higher in the deep
water locations of the Gulf towards the open ocean boundary. The maximum significant
wave height during December 2013 for the Gulf region was about 0.7 m. The wave
heights reduces as one approaches the northward limit of the Gulf, where wave heights
tends to reduce due to shallow water depths, limited fetch and higher bottom friction.
Figure-73: Significant Wave Height (in meters) of the Study domain during February 2014
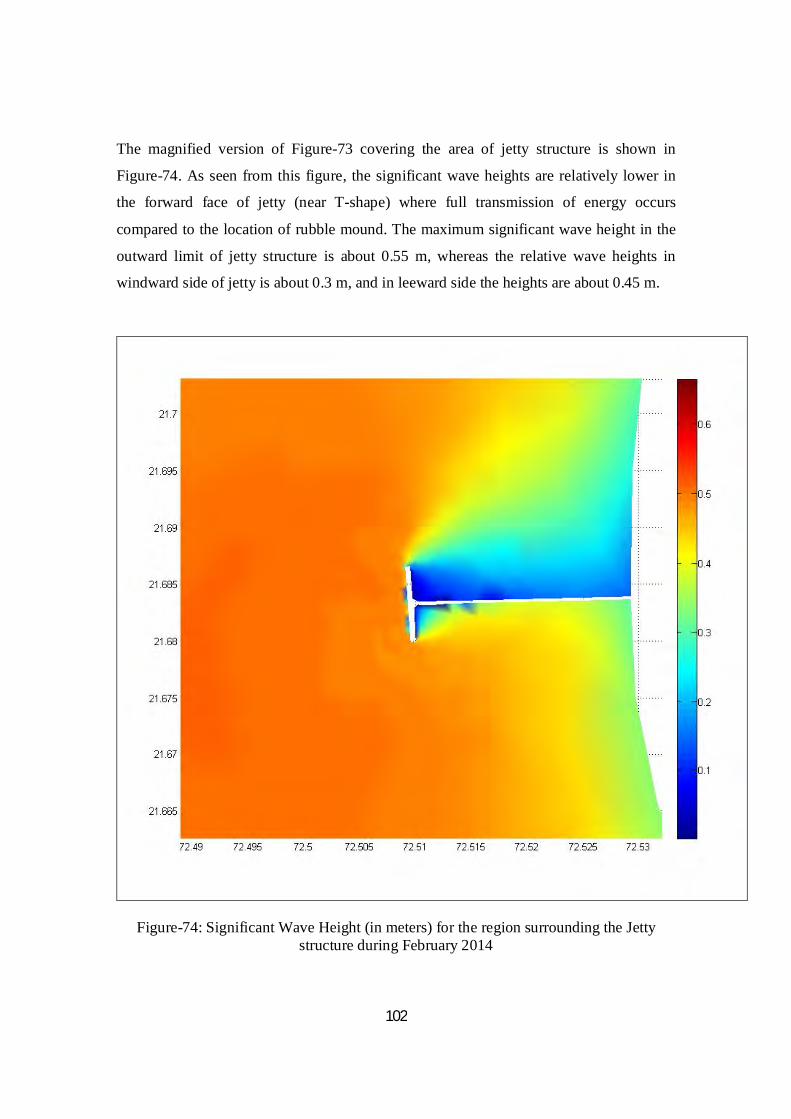
102
The magnified version of Figure-73 covering the area of jetty structure is shown in
Figure-74. As seen from this figure, the significant wave heights are relatively lower in
the forward face of jetty (near T-shape) where full transmission of energy occurs
compared to the location of rubble mound. The maximum significant wave height in the
outward limit of jetty structure is about 0.55 m, whereas the relative wave heights in
windward side of jetty is about 0.3 m, and in leeward side the heights are about 0.45 m.
Figure-74: Significant Wave Height (in meters) for the region surrounding the Jetty structure during February 2014
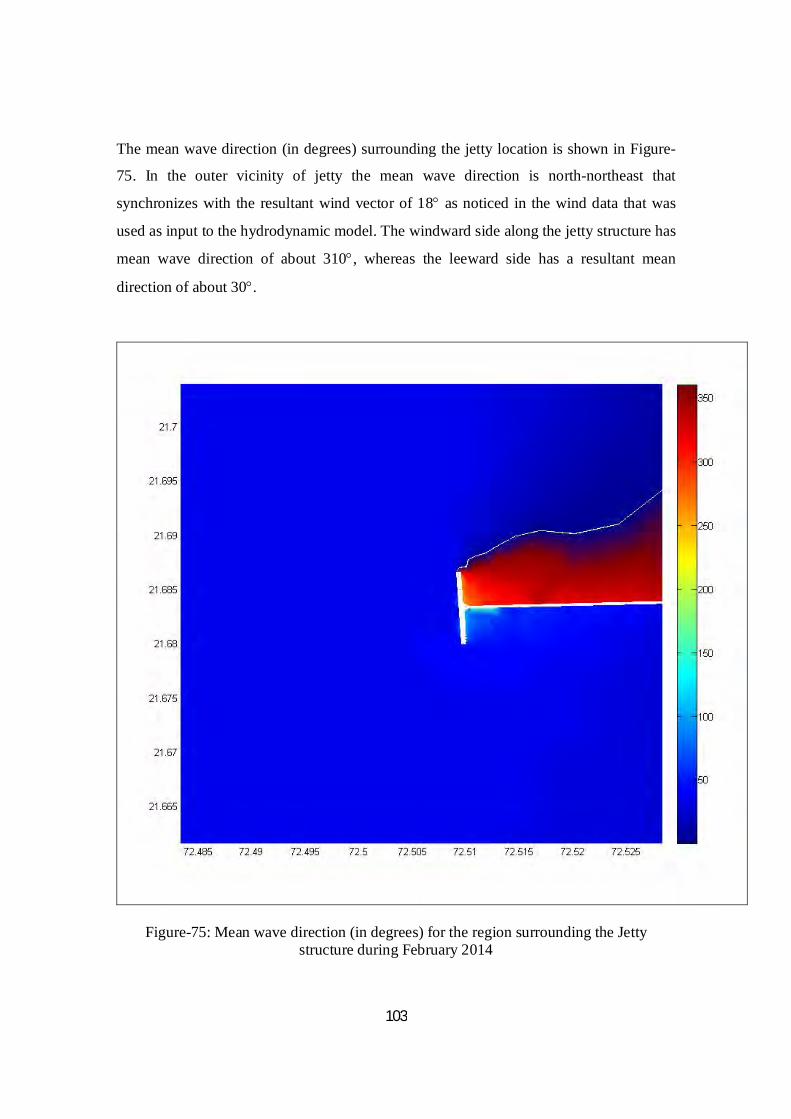
103
The mean wave direction (in degrees) surrounding the jetty location is shown in Figure-
75. In the outer vicinity of jetty the mean wave direction is north-northeast that
synchronizes with the resultant wind vector of 18 as noticed in the wind data that was
used as input to the hydrodynamic model. The windward side along the jetty structure has
mean wave direction of about 310, whereas the leeward side has a resultant mean
direction of about 30.
Figure-75: Mean wave direction (in degrees) for the region surrounding the Jetty structure during February 2014
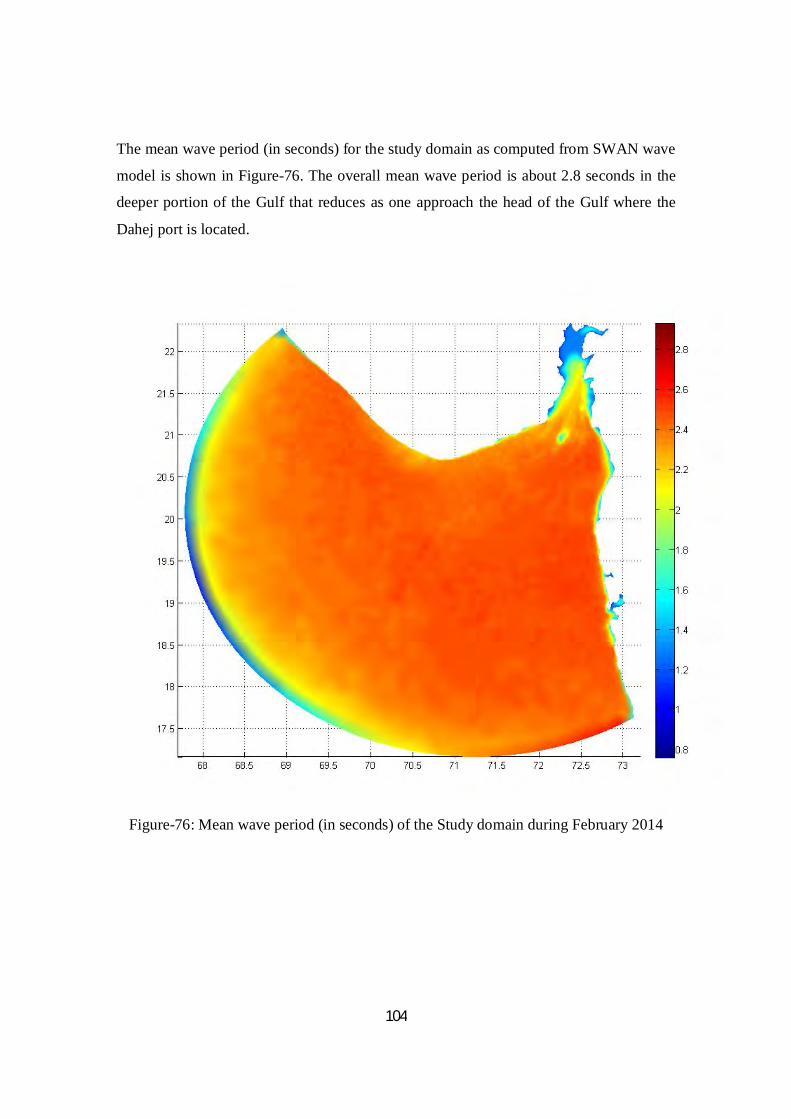
104
The mean wave period (in seconds) for the study domain as computed from SWAN wave
model is shown in Figure-76. The overall mean wave period is about 2.8 seconds in the
deeper portion of the Gulf that reduces as one approach the head of the Gulf where the
Dahej port is located.
Figure-76: Mean wave period (in seconds) of the Study domain during February 2014
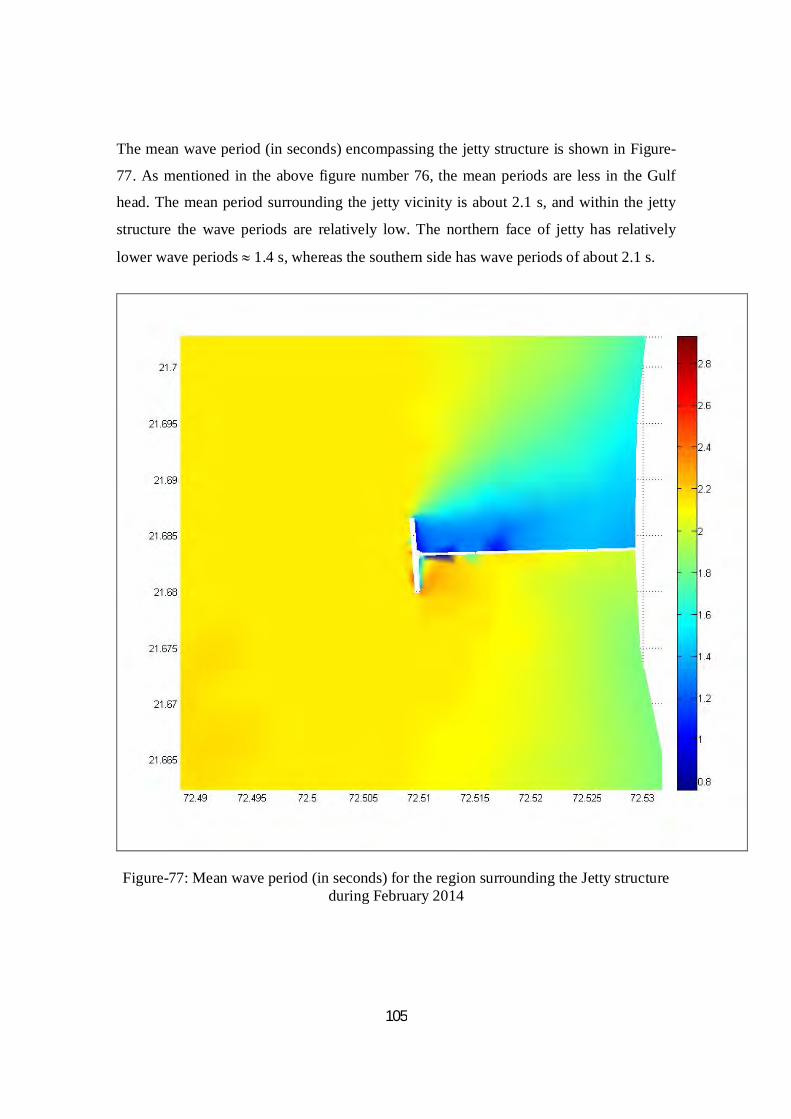
105
The mean wave period (in seconds) encompassing the jetty structure is shown in Figure-
77. As mentioned in the above figure number 76, the mean periods are less in the Gulf
head. The mean period surrounding the jetty vicinity is about 2.1 s, and within the jetty
structure the wave periods are relatively low. The northern face of jetty has relatively
lower wave periods 1.4 s, whereas the southern side has wave periods of about 2.1 s.
Figure-77: Mean wave period (in seconds) for the region surrounding the Jetty structure during February 2014
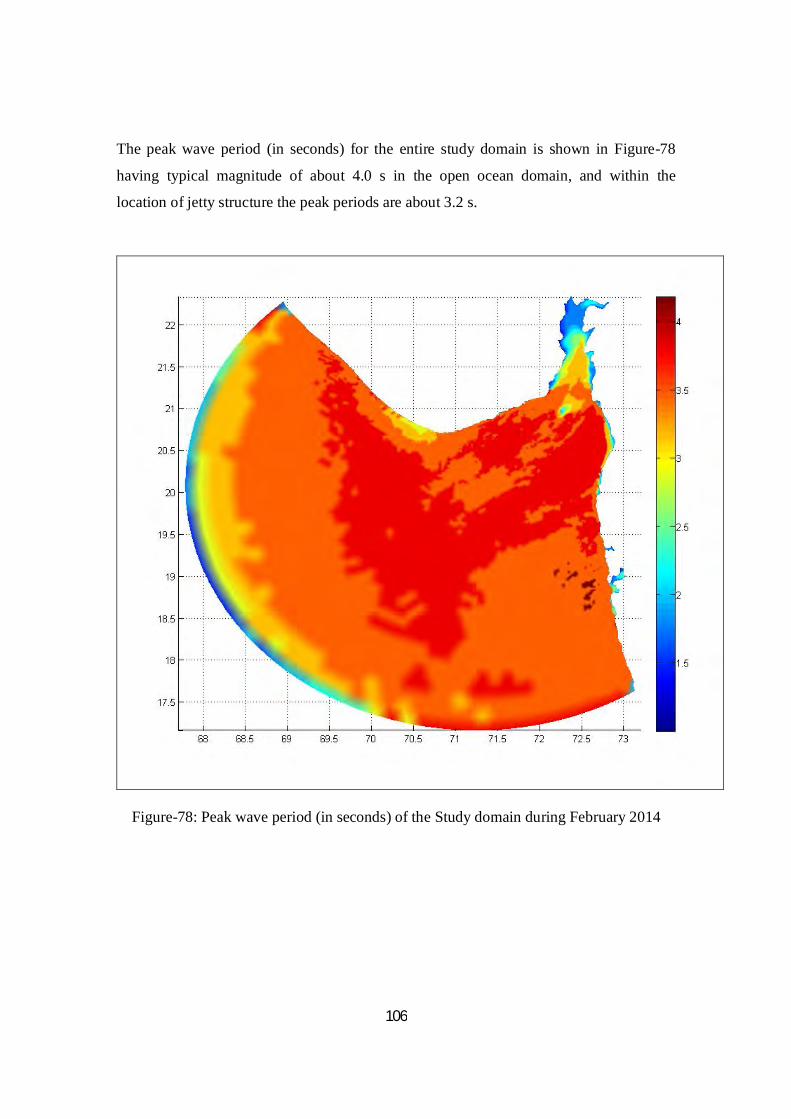
106
The peak wave period (in seconds) for the entire study domain is shown in Figure-78
having typical magnitude of about 4.0 s in the open ocean domain, and within the
location of jetty structure the peak periods are about 3.2 s.
Figure-78: Peak wave period (in seconds) of the Study domain during February 2014
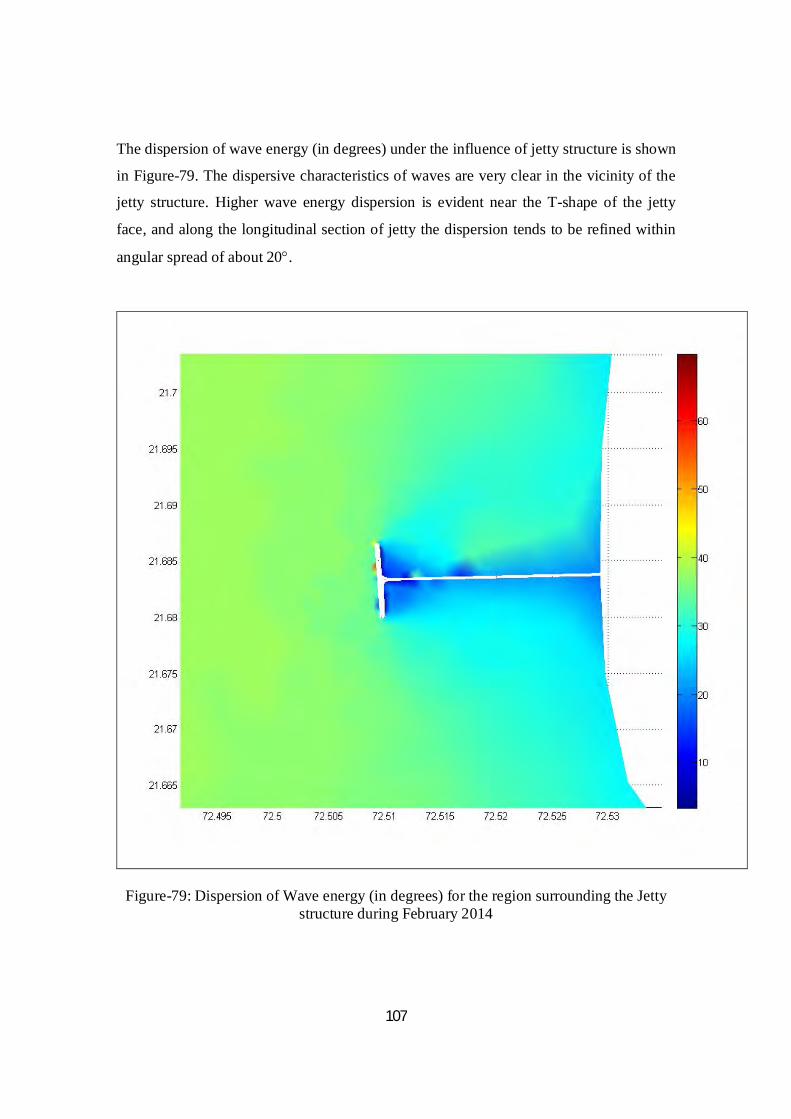
107
The dispersion of wave energy (in degrees) under the influence of jetty structure is shown
in Figure-79. The dispersive characteristics of waves are very clear in the vicinity of the
jetty structure. Higher wave energy dispersion is evident near the T-shape of the jetty
face, and along the longitudinal section of jetty the dispersion tends to be refined within
angular spread of about 20.
Figure-79: Dispersion of Wave energy (in degrees) for the region surrounding the Jetty structure during February 2014

108
HYDRODYNAMICS FOR THE
MONTH OF MARCH 2014
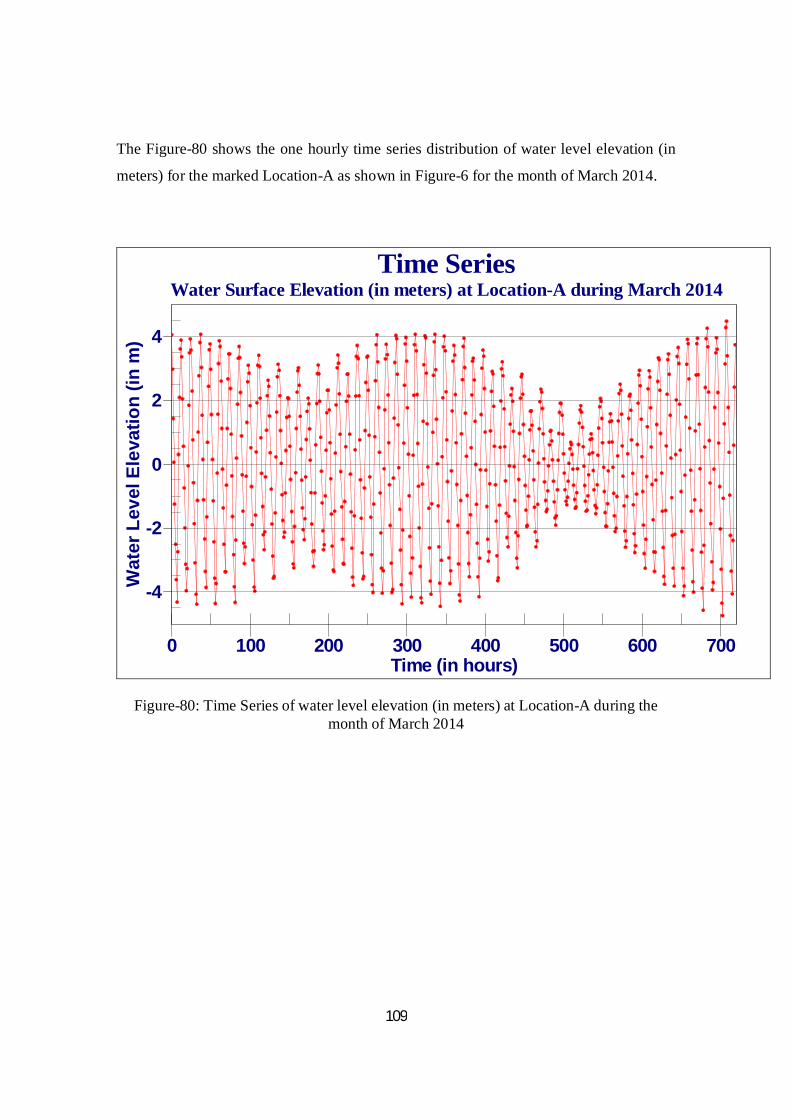
109
The Figure-80 shows the one hourly time series distribution of water level elevation (in
meters) for the marked Location-A as shown in Figure-6 for the month of March 2014.
Time SeriesWater Surface Elevation (in meters) at Location-A during March 2014
Wat
er L
evel
Ele
vatio
n (in
m)
Time (in hours)0 100 200 300 400 500 600 700
-4
-2
0
2
4
Figure-80: Time Series of water level elevation (in meters) at Location-A during the month of March 2014
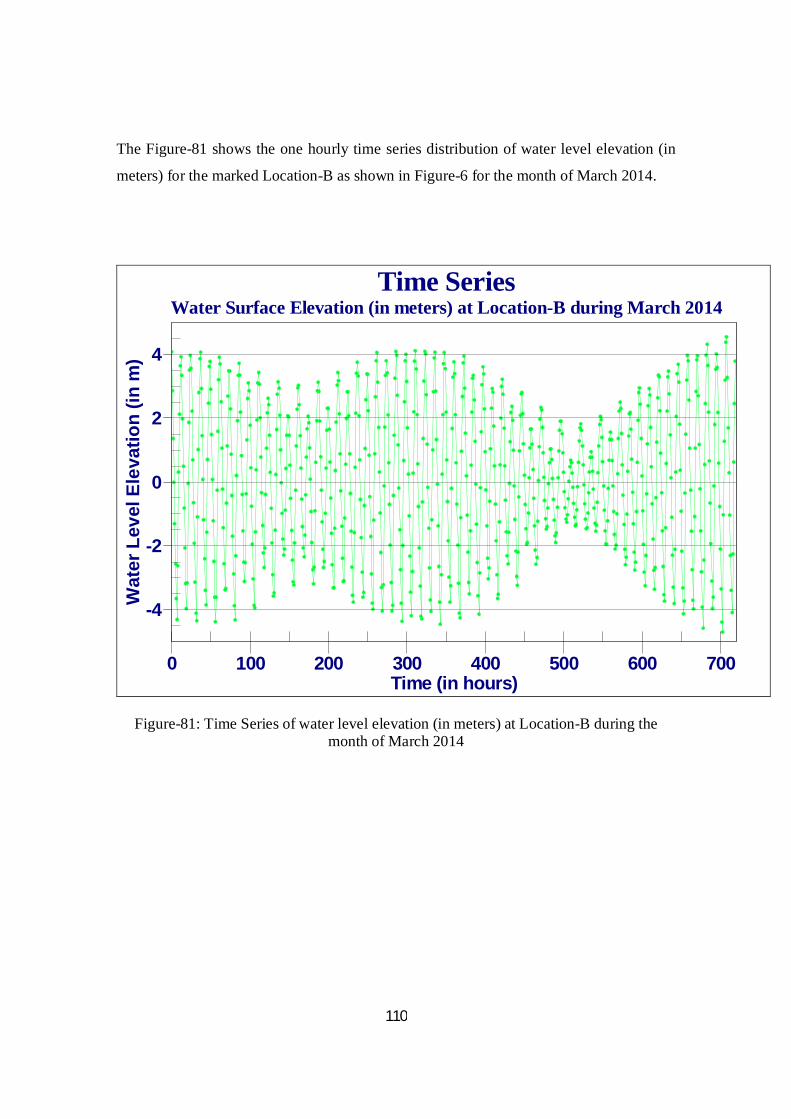
110
The Figure-81 shows the one hourly time series distribution of water level elevation (in
meters) for the marked Location-B as shown in Figure-6 for the month of March 2014.
Time SeriesWater Surface Elevation (in meters) at Location-B during March 2014
Wat
er L
evel
Ele
vatio
n (in
m)
Time (in hours)0 100 200 300 400 500 600 700
-4
-2
0
2
4
Figure-81: Time Series of water level elevation (in meters) at Location-B during the month of March 2014
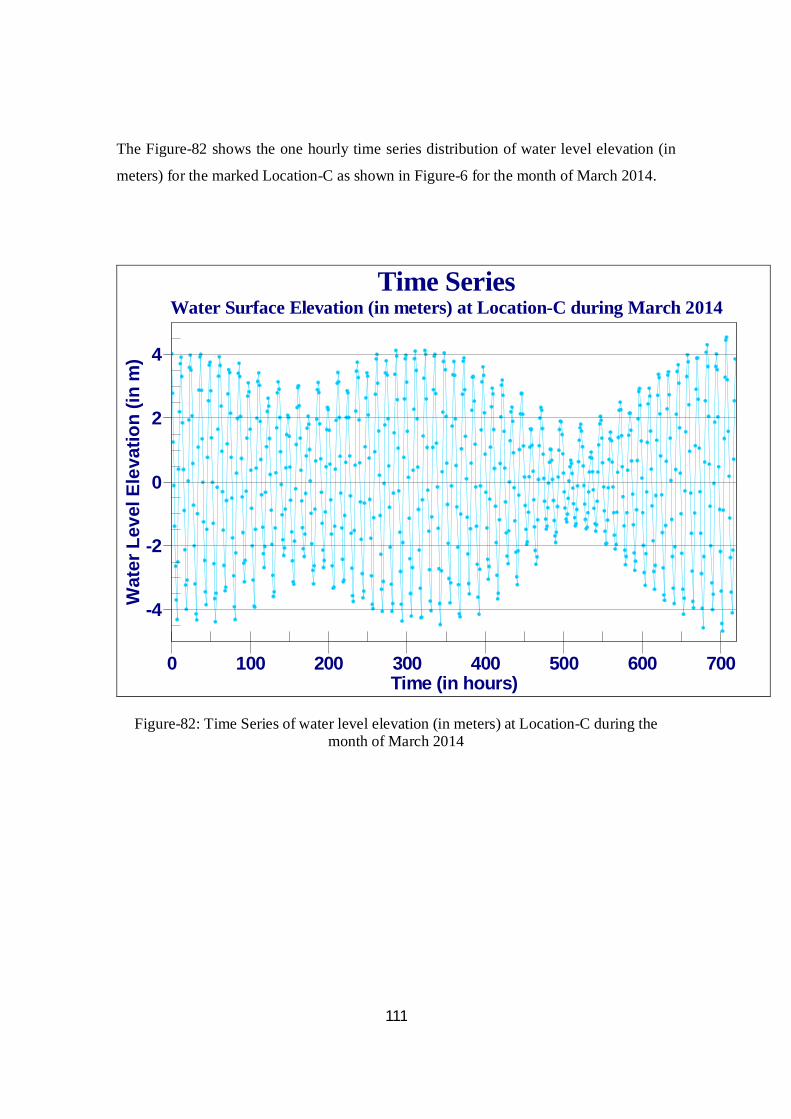
111
The Figure-82 shows the one hourly time series distribution of water level elevation (in
meters) for the marked Location-C as shown in Figure-6 for the month of March 2014.
Time SeriesWater Surface Elevation (in meters) at Location-C during March 2014
Wat
er L
evel
Ele
vatio
n (in
m)
Time (in hours)0 100 200 300 400 500 600 700
-4
-2
0
2
4
Figure-82: Time Series of water level elevation (in meters) at Location-C during the month of March 2014
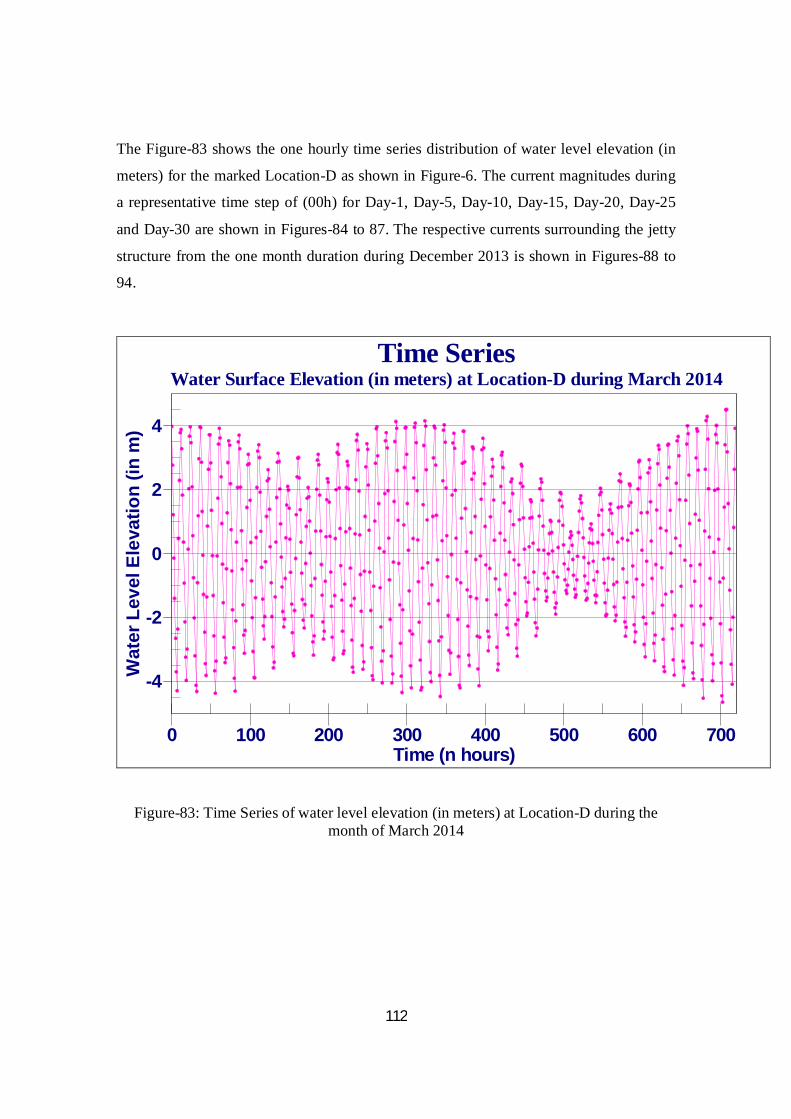
112
The Figure-83 shows the one hourly time series distribution of water level elevation (in
meters) for the marked Location-D as shown in Figure-6. The current magnitudes during
a representative time step of (00h) for Day-1, Day-5, Day-10, Day-15, Day-20, Day-25
and Day-30 are shown in Figures-84 to 87. The respective currents surrounding the jetty
structure from the one month duration during December 2013 is shown in Figures-88 to
94.
Time SeriesWater Surface Elevation (in meters) at Location-D during March 2014
Wat
er L
evel
Ele
vatio
n (in
m)
Time (n hours)0 100 200 300 400 500 600 700
-4
-2
0
2
4
Figure-83: Time Series of water level elevation (in meters) at Location-D during the month of March 2014

113
(a)
(b)
Figure-84: Current magnitude (m s-1) during (a) Day-01 (00h) and Day-05 (00h) for the month of March 2014

114
(a)
(b)
Figure-85: Current magnitude (m s-1) during (a) Day-10 (00h) and Day-15 (00h) for the month of March 2014
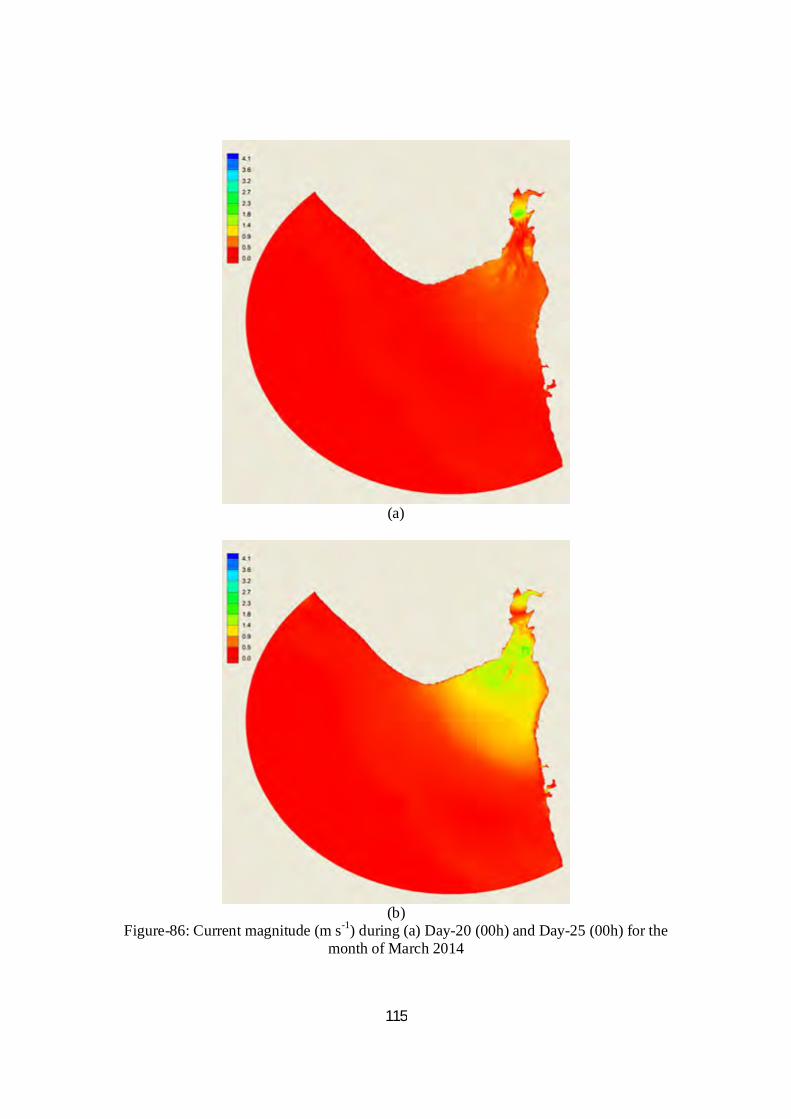
115
(a)
(b)
Figure-86: Current magnitude (m s-1) during (a) Day-20 (00h) and Day-25 (00h) for the month of March 2014
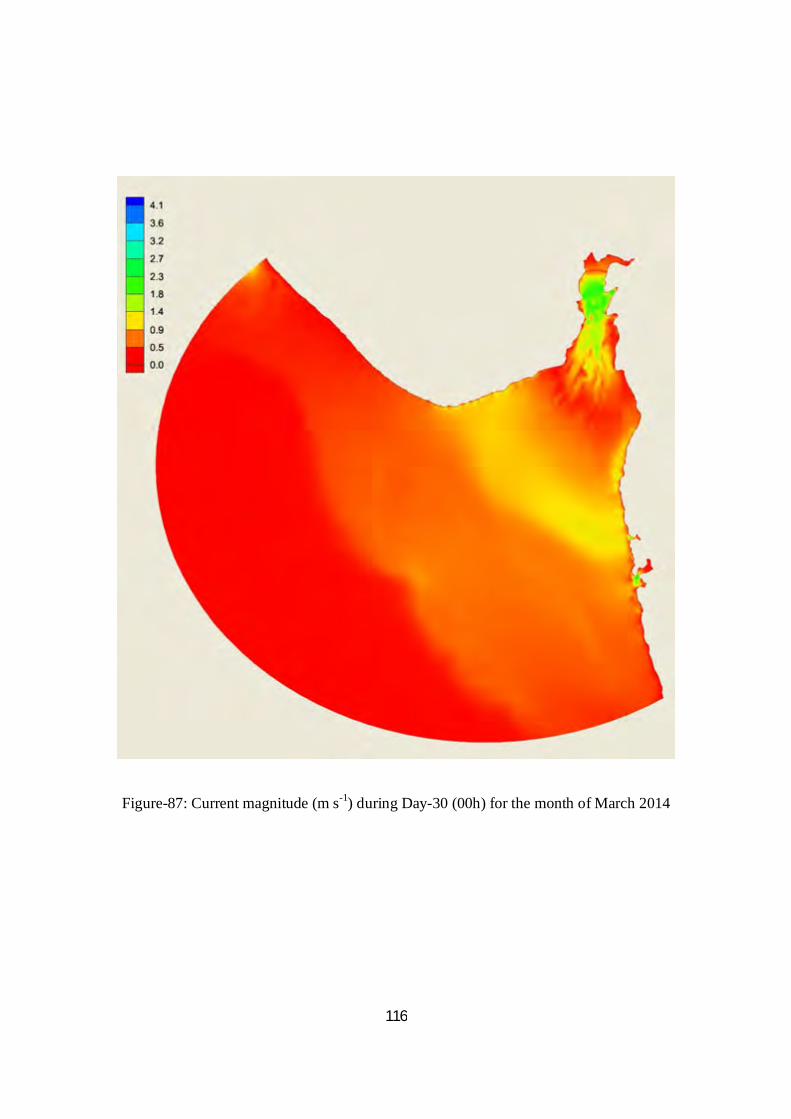
116
Figure-87: Current magnitude (m s-1) during Day-30 (00h) for the month of March 2014
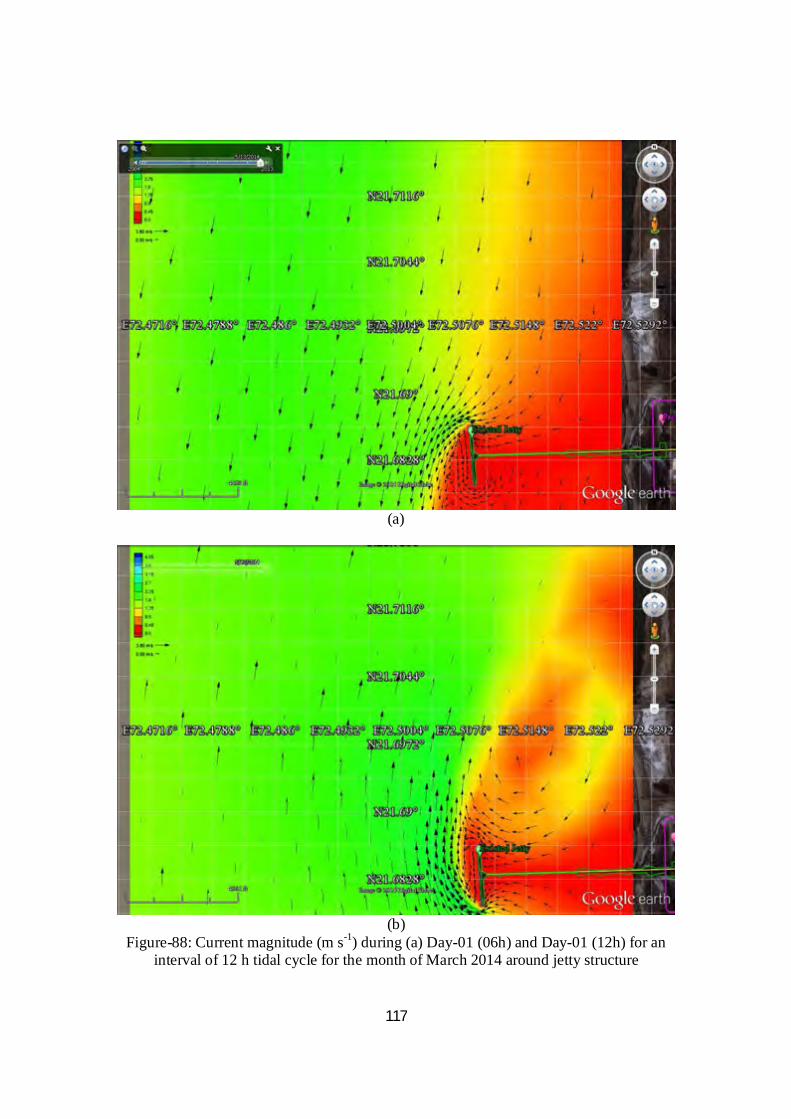
117
(a)
(b)
Figure-88: Current magnitude (m s-1) during (a) Day-01 (06h) and Day-01 (12h) for an interval of 12 h tidal cycle for the month of March 2014 around jetty structure
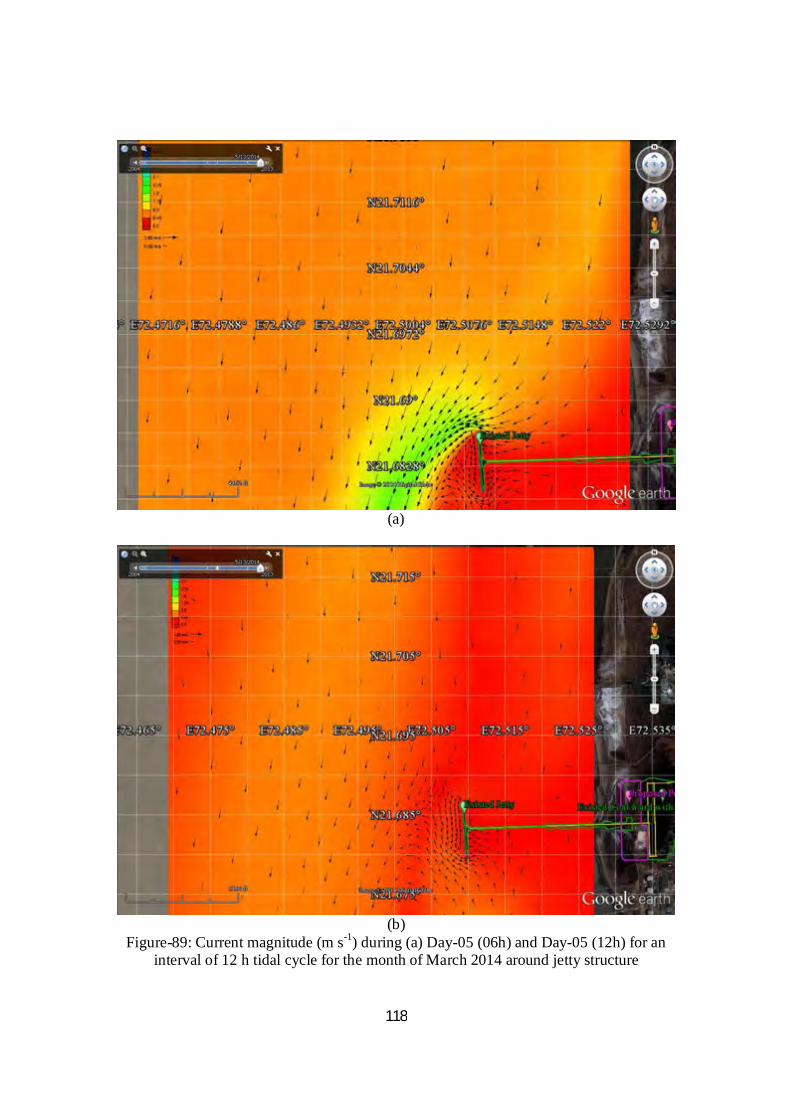
118
(a)
(b)
Figure-89: Current magnitude (m s-1) during (a) Day-05 (06h) and Day-05 (12h) for an interval of 12 h tidal cycle for the month of March 2014 around jetty structure
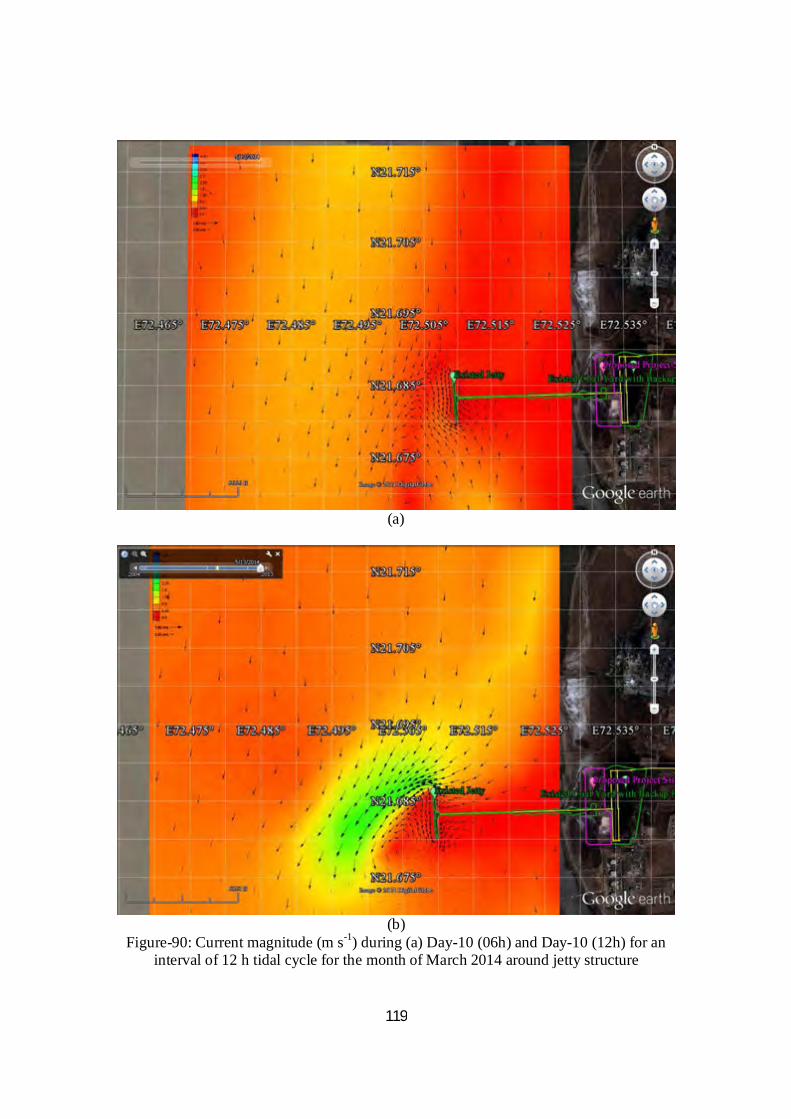
119
(a)
(b)
Figure-90: Current magnitude (m s-1) during (a) Day-10 (06h) and Day-10 (12h) for an interval of 12 h tidal cycle for the month of March 2014 around jetty structure
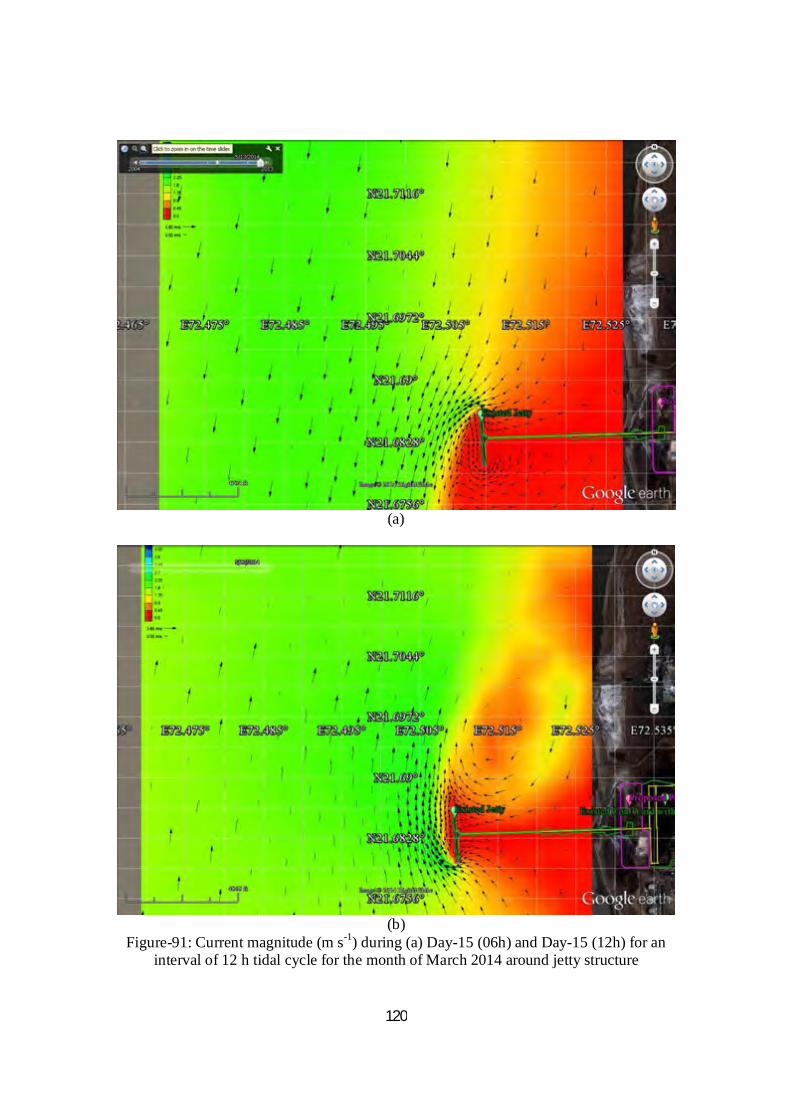
120
(a)
(b)
Figure-91: Current magnitude (m s-1) during (a) Day-15 (06h) and Day-15 (12h) for an interval of 12 h tidal cycle for the month of March 2014 around jetty structure
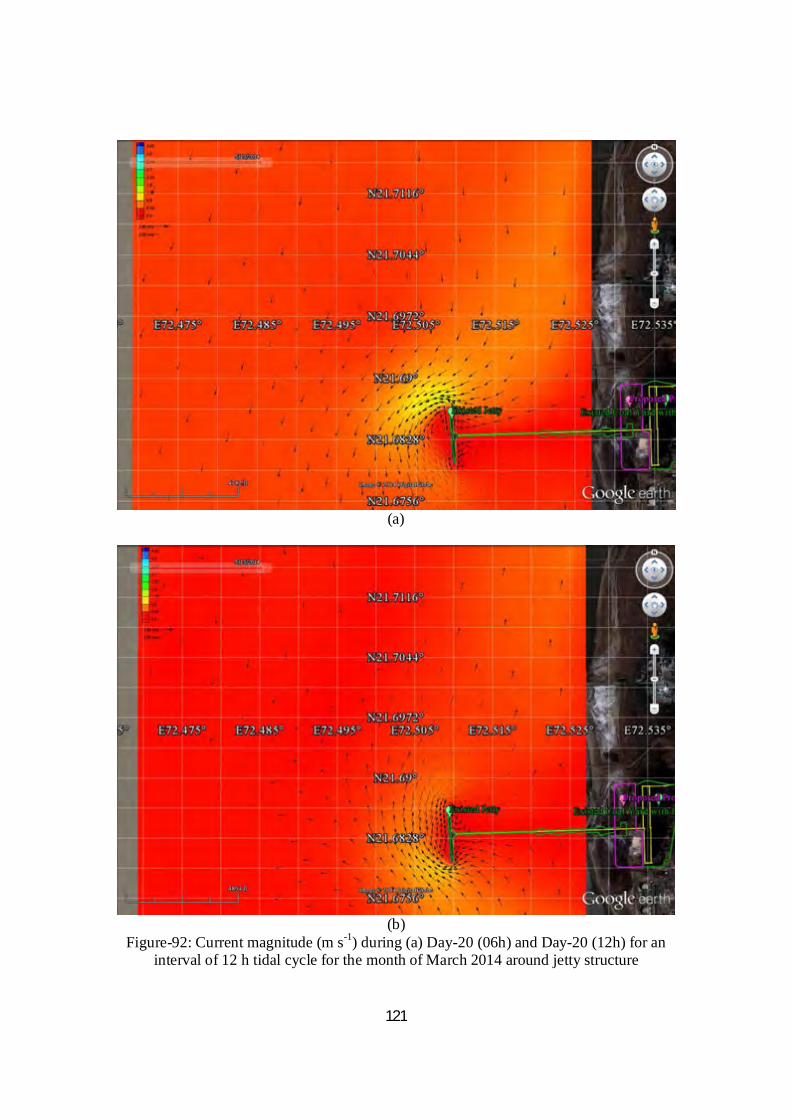
121
(a)
(b)
Figure-92: Current magnitude (m s-1) during (a) Day-20 (06h) and Day-20 (12h) for an interval of 12 h tidal cycle for the month of March 2014 around jetty structure
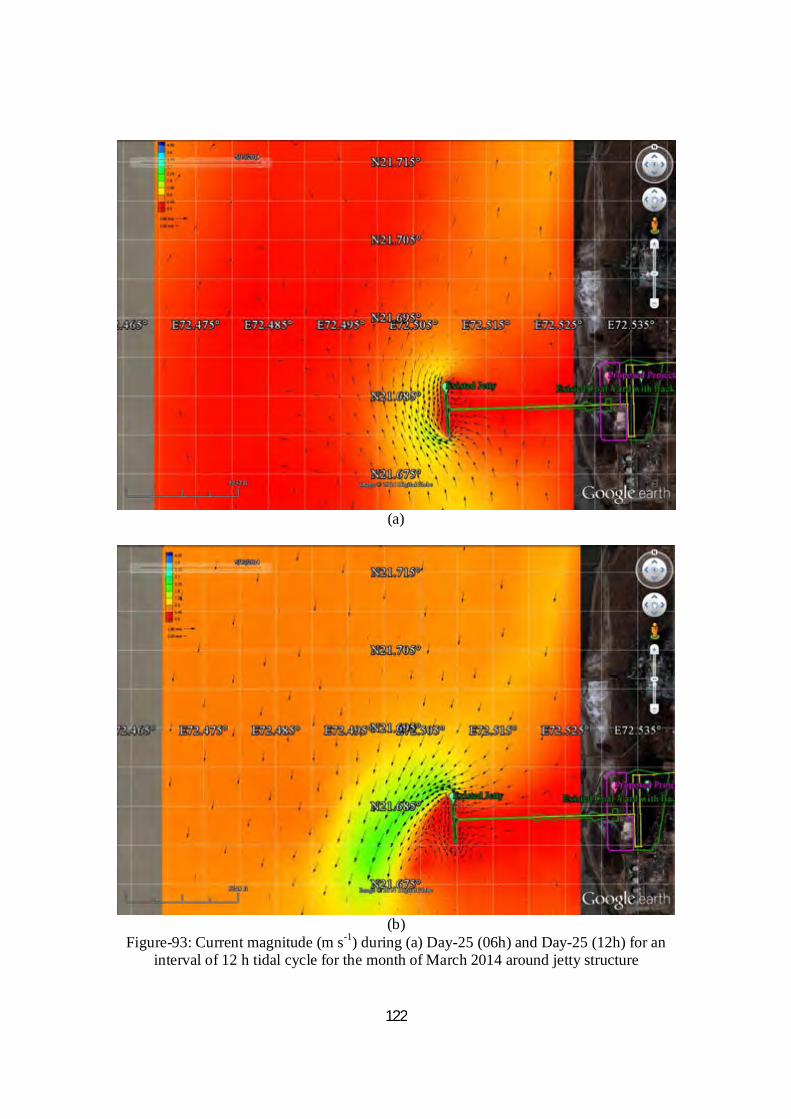
122
(a)
(b)
Figure-93: Current magnitude (m s-1) during (a) Day-25 (06h) and Day-25 (12h) for an interval of 12 h tidal cycle for the month of March 2014 around jetty structure
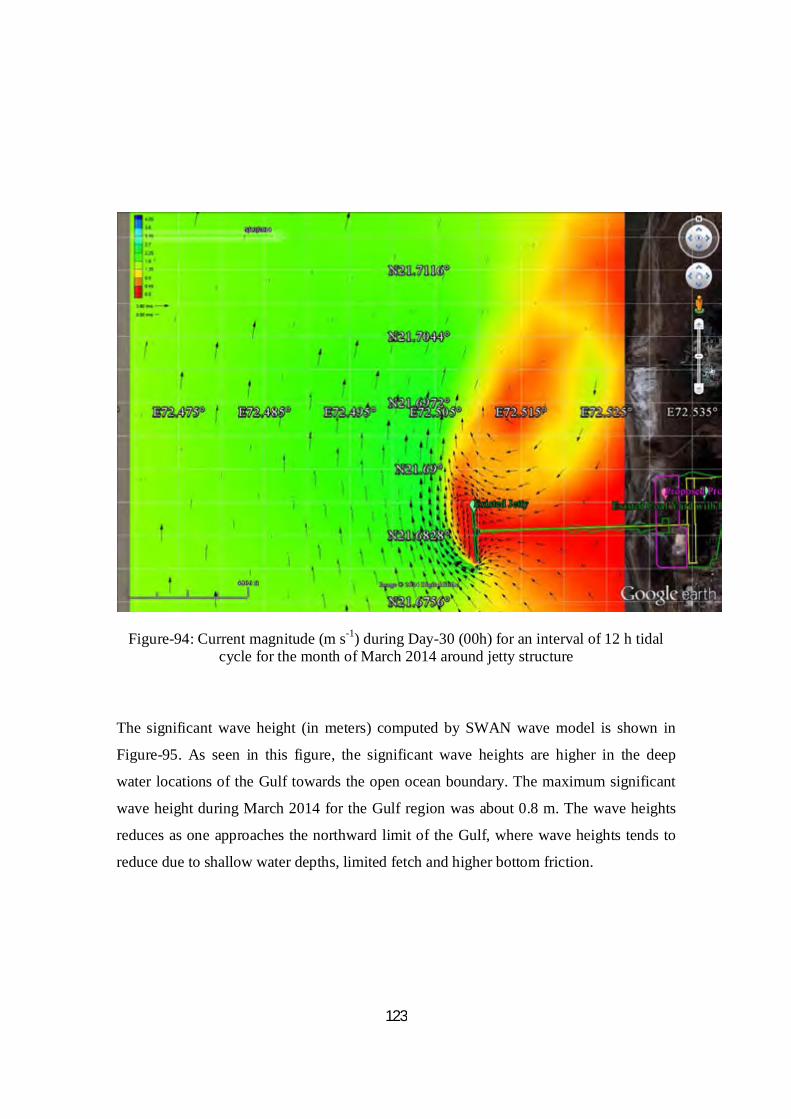
123
Figure-94: Current magnitude (m s-1) during Day-30 (00h) for an interval of 12 h tidal cycle for the month of March 2014 around jetty structure
The significant wave height (in meters) computed by SWAN wave model is shown in
Figure-95. As seen in this figure, the significant wave heights are higher in the deep
water locations of the Gulf towards the open ocean boundary. The maximum significant
wave height during March 2014 for the Gulf region was about 0.8 m. The wave heights
reduces as one approaches the northward limit of the Gulf, where wave heights tends to
reduce due to shallow water depths, limited fetch and higher bottom friction.
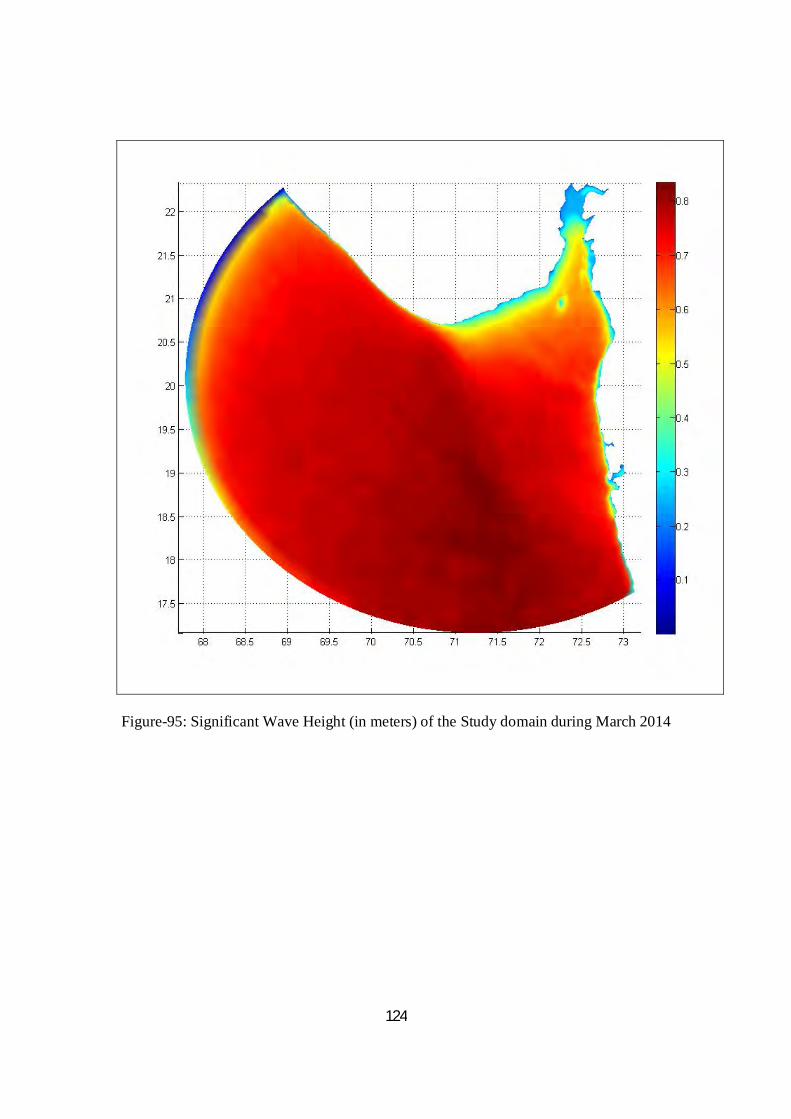
124
Figure-95: Significant Wave Height (in meters) of the Study domain during March 2014
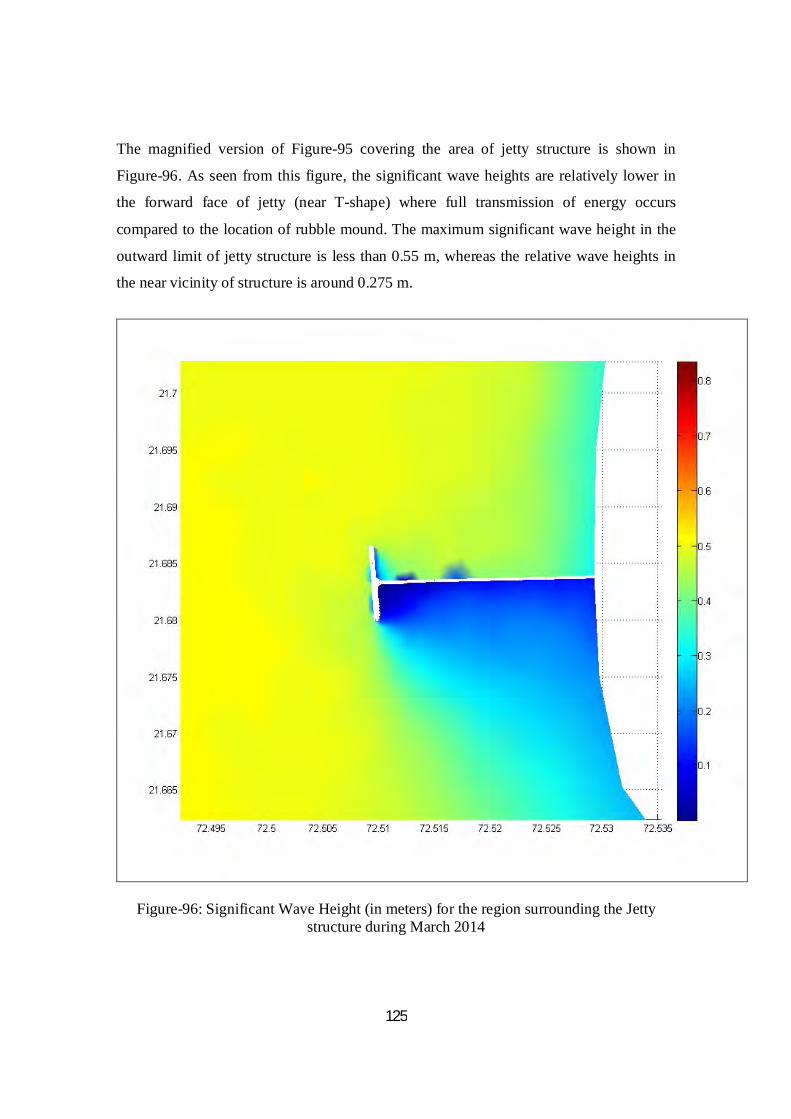
125
The magnified version of Figure-95 covering the area of jetty structure is shown in
Figure-96. As seen from this figure, the significant wave heights are relatively lower in
the forward face of jetty (near T-shape) where full transmission of energy occurs
compared to the location of rubble mound. The maximum significant wave height in the
outward limit of jetty structure is less than 0.55 m, whereas the relative wave heights in
the near vicinity of structure is around 0.275 m.
Figure-96: Significant Wave Height (in meters) for the region surrounding the Jetty structure during March 2014
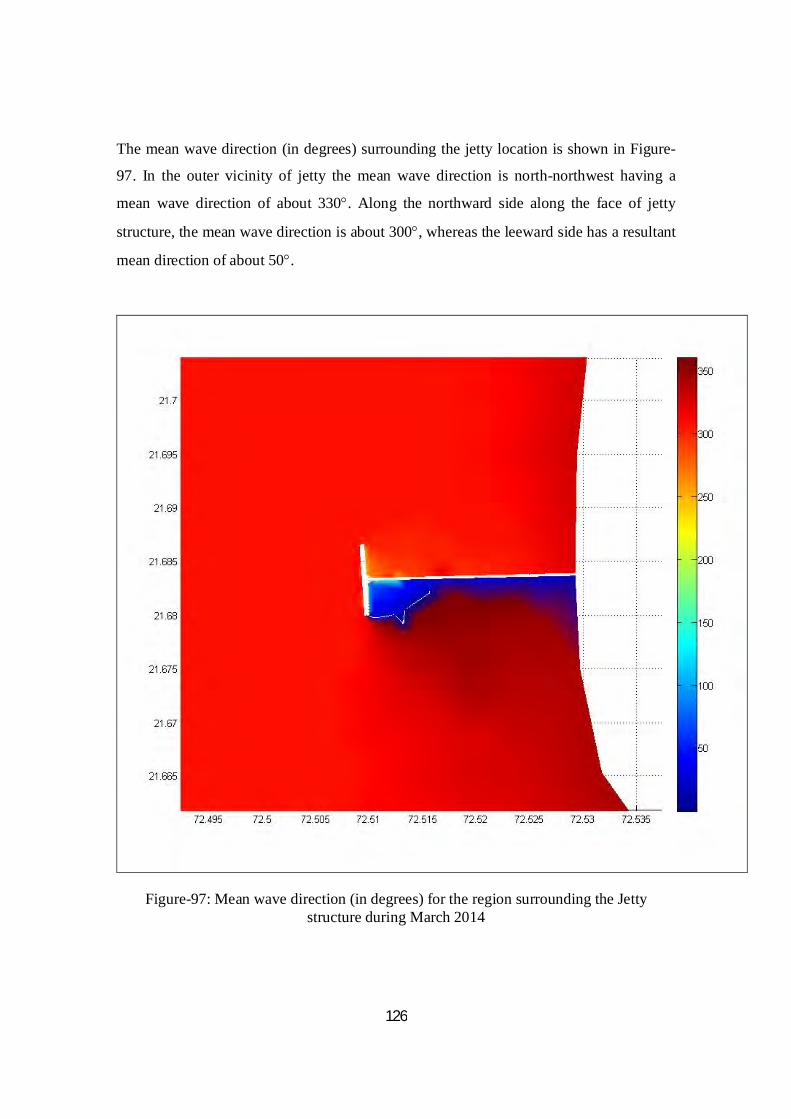
126
The mean wave direction (in degrees) surrounding the jetty location is shown in Figure-
97. In the outer vicinity of jetty the mean wave direction is north-northwest having a
mean wave direction of about 330. Along the northward side along the face of jetty
structure, the mean wave direction is about 300, whereas the leeward side has a resultant
mean direction of about 50.
Figure-97: Mean wave direction (in degrees) for the region surrounding the Jetty structure during March 2014
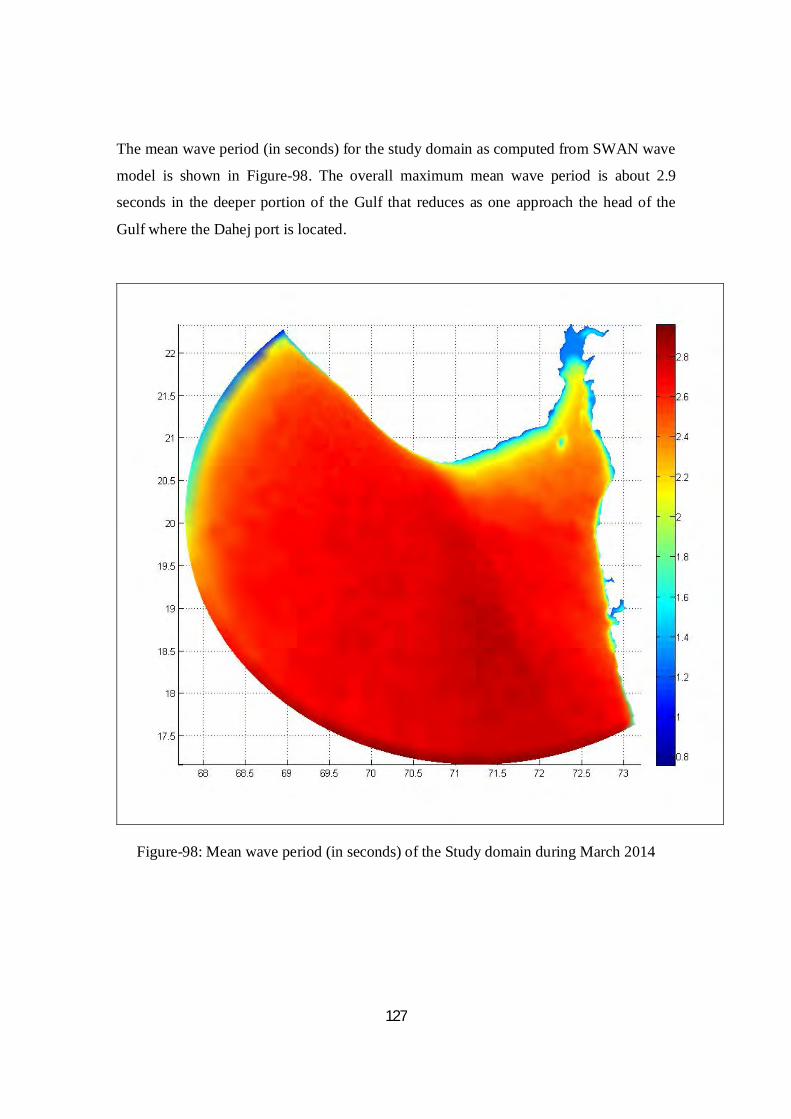
127
The mean wave period (in seconds) for the study domain as computed from SWAN wave
model is shown in Figure-98. The overall maximum mean wave period is about 2.9
seconds in the deeper portion of the Gulf that reduces as one approach the head of the
Gulf where the Dahej port is located.
Figure-98: Mean wave period (in seconds) of the Study domain during March 2014
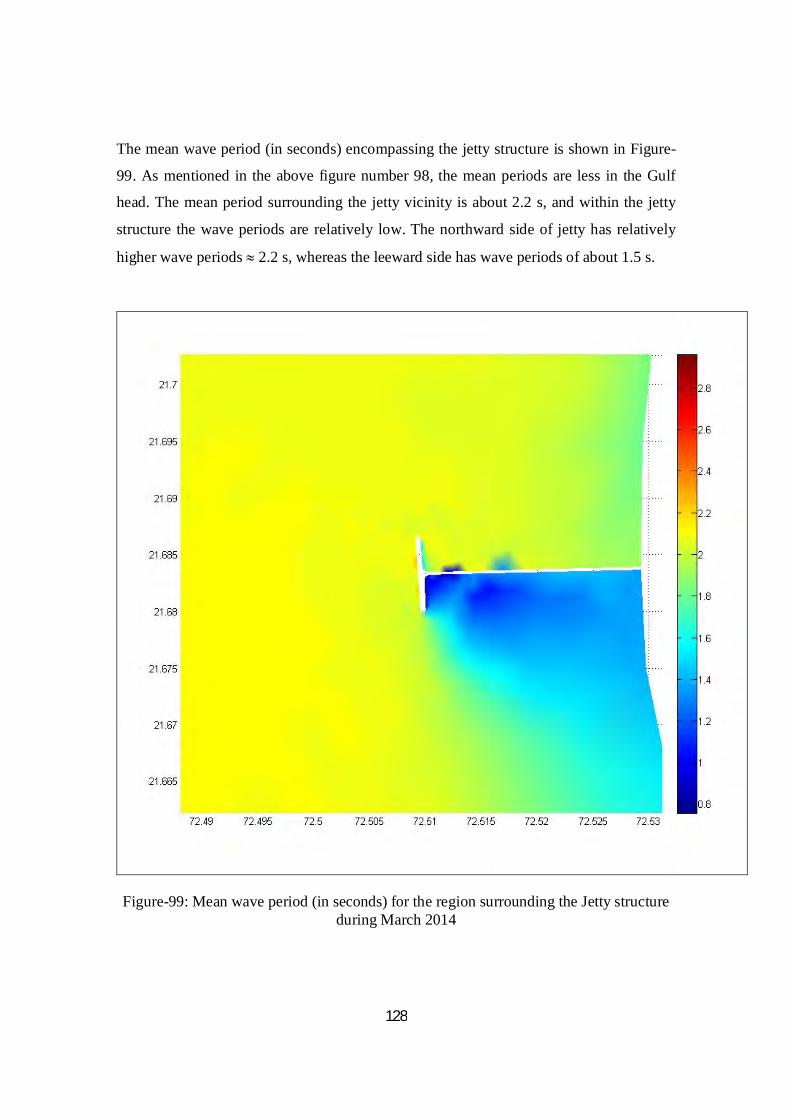
128
The mean wave period (in seconds) encompassing the jetty structure is shown in Figure-
99. As mentioned in the above figure number 98, the mean periods are less in the Gulf
head. The mean period surrounding the jetty vicinity is about 2.2 s, and within the jetty
structure the wave periods are relatively low. The northward side of jetty has relatively
higher wave periods 2.2 s, whereas the leeward side has wave periods of about 1.5 s.
Figure-99: Mean wave period (in seconds) for the region surrounding the Jetty structure during March 2014
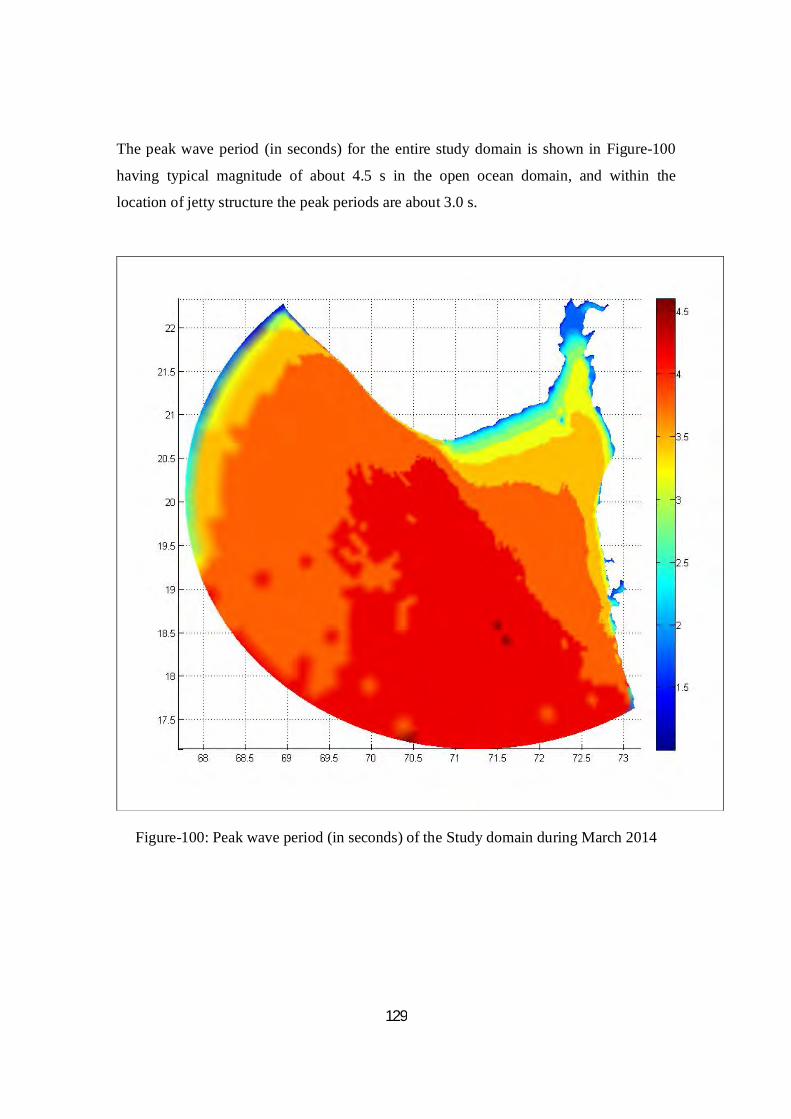
129
The peak wave period (in seconds) for the entire study domain is shown in Figure-100
having typical magnitude of about 4.5 s in the open ocean domain, and within the
location of jetty structure the peak periods are about 3.0 s.
Figure-100: Peak wave period (in seconds) of the Study domain during March 2014
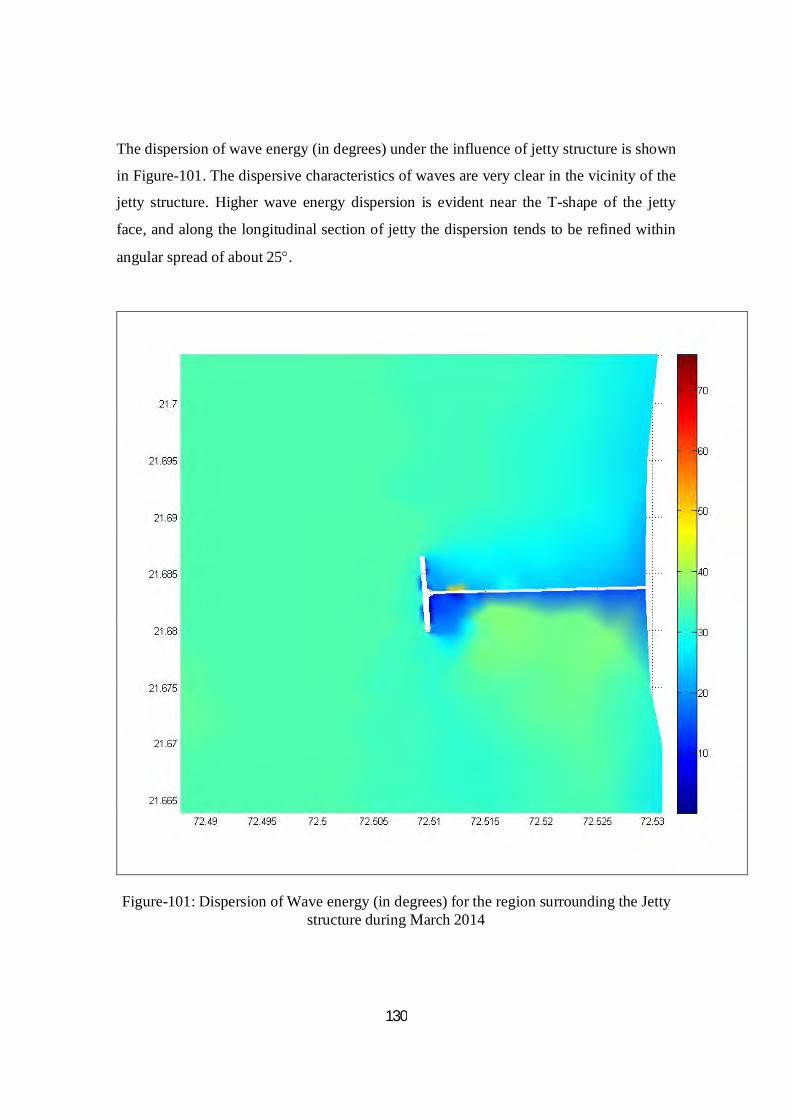
130
The dispersion of wave energy (in degrees) under the influence of jetty structure is shown
in Figure-101. The dispersive characteristics of waves are very clear in the vicinity of the
jetty structure. Higher wave energy dispersion is evident near the T-shape of the jetty
face, and along the longitudinal section of jetty the dispersion tends to be refined within
angular spread of about 25.
Figure-101: Dispersion of Wave energy (in degrees) for the region surrounding the Jetty structure during March 2014

131
SEDIMENT TRANSPORT MODELING

132
List of Abbreviations and Elaboration of their values
A list of the commonly used terminology in sediment transport studies and their
elaboration is provided below:
UB: This parameter is the maximum wave induced orbital velocity at the bottom. In
context to surface gravity waves, the water particle motion is circular in deep waters that
transforms to flat ellipses with an increased major axis and thinning of minor axis as one
approaches the sea bottom. This concept is based on the classical wave theory. The
region of interest in this study is coastal waters; hence, water particle motion is elliptical.
The maximum wave induced orbital velocity motion expressed in m s-1 is represented by
the parameter UB and this value has relevance to suspension of bottom materials
important for sediment transport studies.
FCW: This parameter is the bottom friction factor. The coefficient is relevant for tidal
propagation studies and depends on the characteristics of bottom material. The value of
FCW used in the present study is for bottom material dominated by sandy particles.
UA and its derivatives: This parameter refers to the current speed as calculated from
ADCIRC model. The ADCIRC model used for the present study is executed in barotropic
mode because of shallow water depths. In other words, the depth averaged values of
current are denoted by the term UA and its derivatives.
Z0: This parameter refers to the bed roughness length expressed in meters. This is
important in context to bottom boundary layer that is a combination of wave- and current
induced boundary layers. The wave boundary layer extends to few centimeters above the
sea-bed whereas the current boundary layer can extend to scale of meters. The bed
roughness length depends on the ripple geometry due to excursion by wave and current
activity.
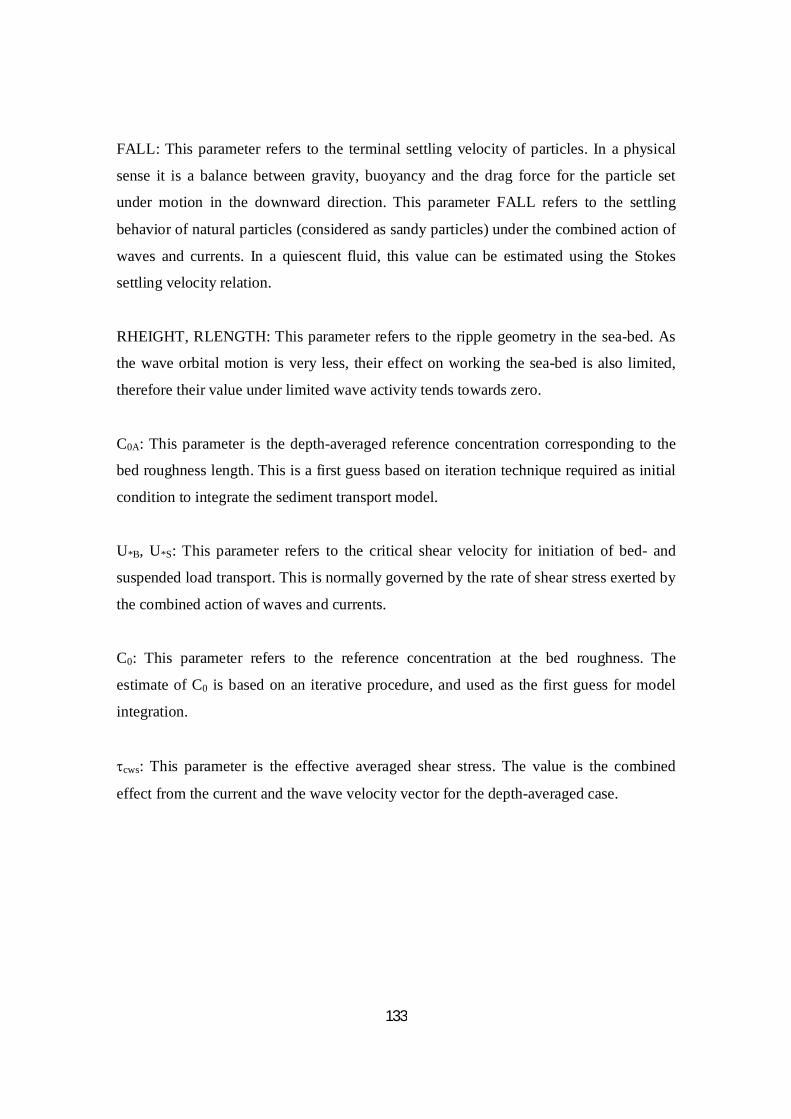
133
FALL: This parameter refers to the terminal settling velocity of particles. In a physical
sense it is a balance between gravity, buoyancy and the drag force for the particle set
under motion in the downward direction. This parameter FALL refers to the settling
behavior of natural particles (considered as sandy particles) under the combined action of
waves and currents. In a quiescent fluid, this value can be estimated using the Stokes
settling velocity relation.
RHEIGHT, RLENGTH: This parameter refers to the ripple geometry in the sea-bed. As
the wave orbital motion is very less, their effect on working the sea-bed is also limited,
therefore their value under limited wave activity tends towards zero.
C0A: This parameter is the depth-averaged reference concentration corresponding to the
bed roughness length. This is a first guess based on iteration technique required as initial
condition to integrate the sediment transport model.
U*B, U*S: This parameter refers to the critical shear velocity for initiation of bed- and
suspended load transport. This is normally governed by the rate of shear stress exerted by
the combined action of waves and currents.
C0: This parameter refers to the reference concentration at the bed roughness. The
estimate of C0 is based on an iterative procedure, and used as the first guess for model
integration.
cws: This parameter is the effective averaged shear stress. The value is the combined
effect from the current and the wave velocity vector for the depth-averaged case.
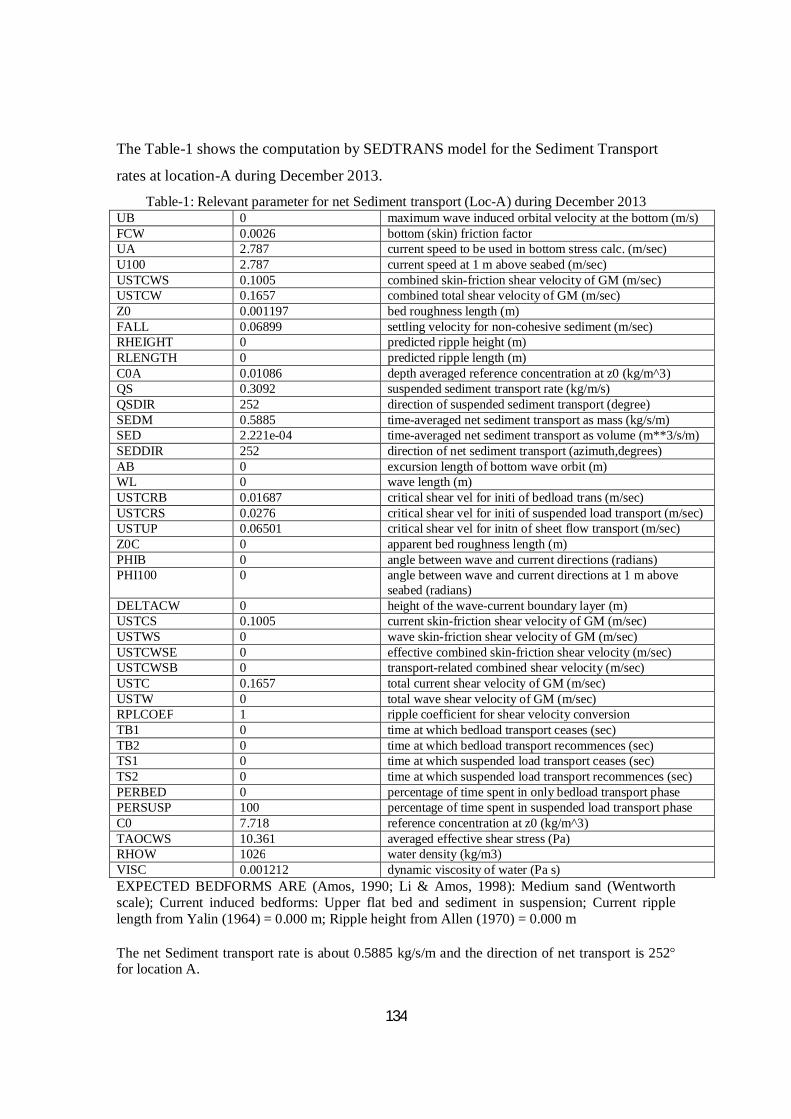
134
The Table-1 shows the computation by SEDTRANS model for the Sediment Transport
rates at location-A during December 2013.
Table-1: Relevant parameter for net Sediment transport (Loc-A) during December 2013 UB 0 maximum wave induced orbital velocity at the bottom (m/s) FCW 0.0026 bottom (skin) friction factor UA 2.787 current speed to be used in bottom stress calc. (m/sec) U100 2.787 current speed at 1 m above seabed (m/sec) USTCWS 0.1005 combined skin-friction shear velocity of GM (m/sec) USTCW 0.1657 combined total shear velocity of GM (m/sec) Z0 0.001197 bed roughness length (m) FALL 0.06899 settling velocity for non-cohesive sediment (m/sec) RHEIGHT 0 predicted ripple height (m) RLENGTH 0 predicted ripple length (m) C0A 0.01086 depth averaged reference concentration at z0 (kg/m^3) QS 0.3092 suspended sediment transport rate (kg/m/s) QSDIR 252 direction of suspended sediment transport (degree) SEDM 0.5885 time-averaged net sediment transport as mass (kg/s/m) SED 2.221e-04 time-averaged net sediment transport as volume (m**3/s/m) SEDDIR 252 direction of net sediment transport (azimuth,degrees) AB 0 excursion length of bottom wave orbit (m) WL 0 wave length (m) USTCRB 0.01687 critical shear vel for initi of bedload trans (m/sec) USTCRS 0.0276 critical shear vel for initi of suspended load transport (m/sec) USTUP 0.06501 critical shear vel for initn of sheet flow transport (m/sec) Z0C 0 apparent bed roughness length (m) PHIB 0 angle between wave and current directions (radians) PHI100 0 angle between wave and current directions at 1 m above
seabed (radians) DELTACW 0 height of the wave-current boundary layer (m) USTCS 0.1005 current skin-friction shear velocity of GM (m/sec) USTWS 0 wave skin-friction shear velocity of GM (m/sec) USTCWSE 0 effective combined skin-friction shear velocity (m/sec) USTCWSB 0 transport-related combined shear velocity (m/sec) USTC 0.1657 total current shear velocity of GM (m/sec) USTW 0 total wave shear velocity of GM (m/sec) RPLCOEF 1 ripple coefficient for shear velocity conversion TB1 0 time at which bedload transport ceases (sec) TB2 0 time at which bedload transport recommences (sec) TS1 0 time at which suspended load transport ceases (sec) TS2 0 time at which suspended load transport recommences (sec) PERBED 0 percentage of time spent in only bedload transport phase PERSUSP 100 percentage of time spent in suspended load transport phase C0 7.718 reference concentration at z0 (kg/m^3) TAOCWS 10.361 averaged effective shear stress (Pa) RHOW 1026 water density (kg/m3) VISC 0.001212 dynamic viscosity of water (Pa s) EXPECTED BEDFORMS ARE (Amos, 1990; Li & Amos, 1998): Medium sand (Wentworth scale); Current induced bedforms: Upper flat bed and sediment in suspension; Current ripple length from Yalin (1964) = 0.000 m; Ripple height from Allen (1970) = 0.000 m The net Sediment transport rate is about 0.5885 kg/s/m and the direction of net transport is 252 for location A.

135
The Table-2 shows the computation by SEDTRANS model for the Sediment Transport
rates at location-B during December 2013.
Table-2: Relevant parameter for net Sediment transport (Loc-B) during December 2013 UB 0 maximum wave induced orbital velocity at the bottom (m/s) FCW 0.0026 bottom (skin) friction factor UA 2.787 current speed to be used in bottom stress calc. (m/sec) U100 2.787 current speed at 1 m above seabed (m/sec) USTCWS 0.1005 combined skin-friction shear velocity of GM (m/sec) USTCW 0.1657 combined total shear velocity of GM (m/sec) Z0 0.001197 bed roughness length (m) FALL 0.06899 settling velocity for non-cohesive sediment (m/sec) RHEIGHT 0 predicted ripple height (m) RLENGTH 0 predicted ripple length (m) C0A 0.01086 depth averaged reference concentration at z0 (kg/m^3) QS 0.3092 suspended sediment transport rate (kg/m/s) QSDIR 255 direction of suspended sediment transport (degree) SEDM 0.5885 time-averaged net sediment transport as mass (kg/s/m) SED 2.221e-04 time-averaged net sediment transport as volume (m**3/s/m) SEDDIR 255 direction of net sediment transport (azimuth,degrees) AB 0 excursion length of bottom wave orbit (m) WL 0 wave length (m) USTCRB 0.01687 critical shear vel for initi of bedload trans (m/sec) USTCRS 0.0276 critical shear vel for initi of suspended load transport (m/sec) USTUP 0.06501 critical shear vel for initn of sheet flow transport (m/sec) Z0C 0 apparent bed roughness length (m) PHIB 0 angle between wave and current directions (radians) PHI100 0 angle between wave and current directions at 1 m above
seabed (radians) DELTACW 0 height of the wave-current boundary layer (m) USTCS 0.1005 current skin-friction shear velocity of GM (m/sec) USTWS 0 wave skin-friction shear velocity of GM (m/sec) USTCWSE 0 effective combined skin-friction shear velocity (m/sec) USTCWSB 0 transport-related combined shear velocity (m/sec) USTC 0.1657 total current shear velocity of GM (m/sec) USTW 0 total wave shear velocity of GM (m/sec) RPLCOEF 1 ripple coefficient for shear velocity conversion TB1 0 time at which bedload transport ceases (sec) TB2 0 time at which bedload transport recommences (sec) TS1 0 time at which suspended load transport ceases (sec) TS2 0 time at which suspended load transport recommences (sec) PERBED 0 percentage of time spent in only bedload transport phase PERSUSP 100 percentage of time spent in suspended load transport phase C0 7.718 reference concentration at z0 (kg/m^3) TAOCWS 10.361 averaged effective shear stress (Pa) RHOW 1026 water density (kg/m3) VISC 0.001212 dynamic viscosity of water (Pa s) EXPECTED BEDFORMS ARE (Amos, 1990; Li & Amos, 1998): Medium sand (Wentworth scale); Current induced bedforms: upper flat bed and sediment in suspension; current ripple length from Yalin (1964) = 0.000 m; ripple height from Allen (1970) = 0.000 m. The net Sediment transport rate is about 0.5885 kg/s/m and the direction of net transport is 255 for location B.
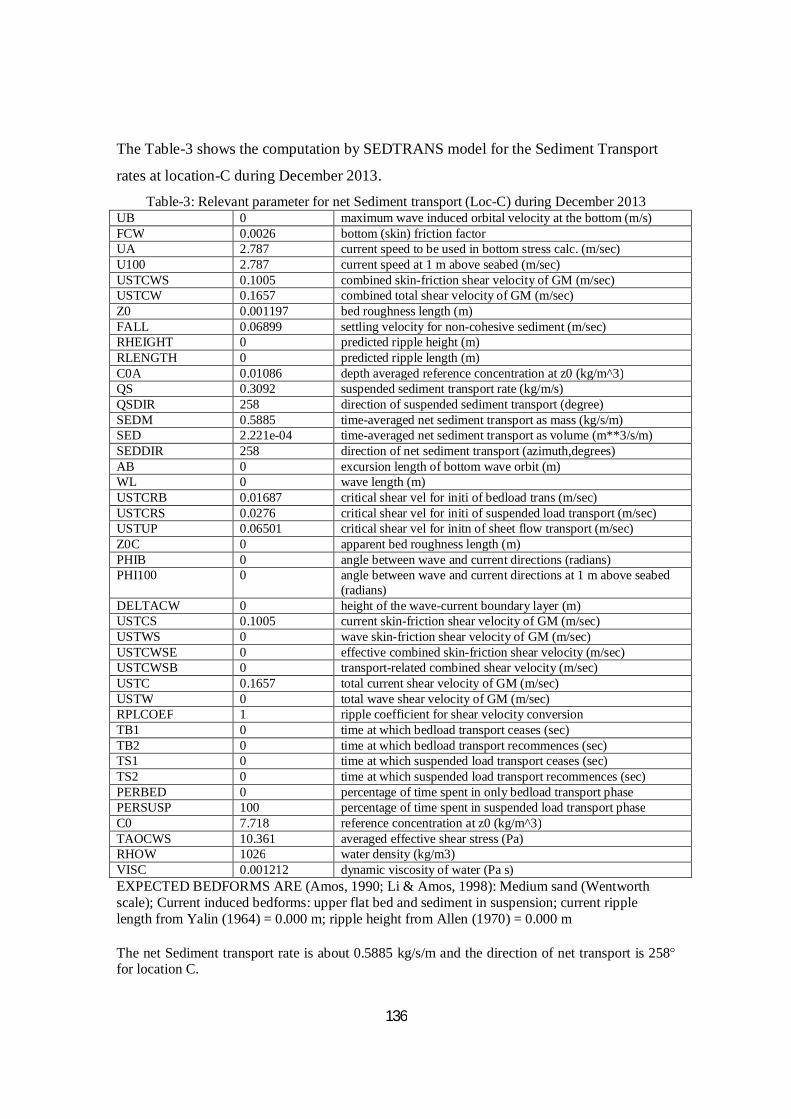
136
The Table-3 shows the computation by SEDTRANS model for the Sediment Transport
rates at location-C during December 2013.
Table-3: Relevant parameter for net Sediment transport (Loc-C) during December 2013 UB 0 maximum wave induced orbital velocity at the bottom (m/s) FCW 0.0026 bottom (skin) friction factor UA 2.787 current speed to be used in bottom stress calc. (m/sec) U100 2.787 current speed at 1 m above seabed (m/sec) USTCWS 0.1005 combined skin-friction shear velocity of GM (m/sec) USTCW 0.1657 combined total shear velocity of GM (m/sec) Z0 0.001197 bed roughness length (m) FALL 0.06899 settling velocity for non-cohesive sediment (m/sec) RHEIGHT 0 predicted ripple height (m) RLENGTH 0 predicted ripple length (m) C0A 0.01086 depth averaged reference concentration at z0 (kg/m^3) QS 0.3092 suspended sediment transport rate (kg/m/s) QSDIR 258 direction of suspended sediment transport (degree) SEDM 0.5885 time-averaged net sediment transport as mass (kg/s/m) SED 2.221e-04 time-averaged net sediment transport as volume (m**3/s/m) SEDDIR 258 direction of net sediment transport (azimuth,degrees) AB 0 excursion length of bottom wave orbit (m) WL 0 wave length (m) USTCRB 0.01687 critical shear vel for initi of bedload trans (m/sec) USTCRS 0.0276 critical shear vel for initi of suspended load transport (m/sec) USTUP 0.06501 critical shear vel for initn of sheet flow transport (m/sec) Z0C 0 apparent bed roughness length (m) PHIB 0 angle between wave and current directions (radians) PHI100 0 angle between wave and current directions at 1 m above seabed
(radians) DELTACW 0 height of the wave-current boundary layer (m) USTCS 0.1005 current skin-friction shear velocity of GM (m/sec) USTWS 0 wave skin-friction shear velocity of GM (m/sec) USTCWSE 0 effective combined skin-friction shear velocity (m/sec) USTCWSB 0 transport-related combined shear velocity (m/sec) USTC 0.1657 total current shear velocity of GM (m/sec) USTW 0 total wave shear velocity of GM (m/sec) RPLCOEF 1 ripple coefficient for shear velocity conversion TB1 0 time at which bedload transport ceases (sec) TB2 0 time at which bedload transport recommences (sec) TS1 0 time at which suspended load transport ceases (sec) TS2 0 time at which suspended load transport recommences (sec) PERBED 0 percentage of time spent in only bedload transport phase PERSUSP 100 percentage of time spent in suspended load transport phase C0 7.718 reference concentration at z0 (kg/m^3) TAOCWS 10.361 averaged effective shear stress (Pa) RHOW 1026 water density (kg/m3) VISC 0.001212 dynamic viscosity of water (Pa s) EXPECTED BEDFORMS ARE (Amos, 1990; Li & Amos, 1998): Medium sand (Wentworth scale); Current induced bedforms: upper flat bed and sediment in suspension; current ripple length from Yalin (1964) = 0.000 m; ripple height from Allen (1970) = 0.000 m The net Sediment transport rate is about 0.5885 kg/s/m and the direction of net transport is 258 for location C.
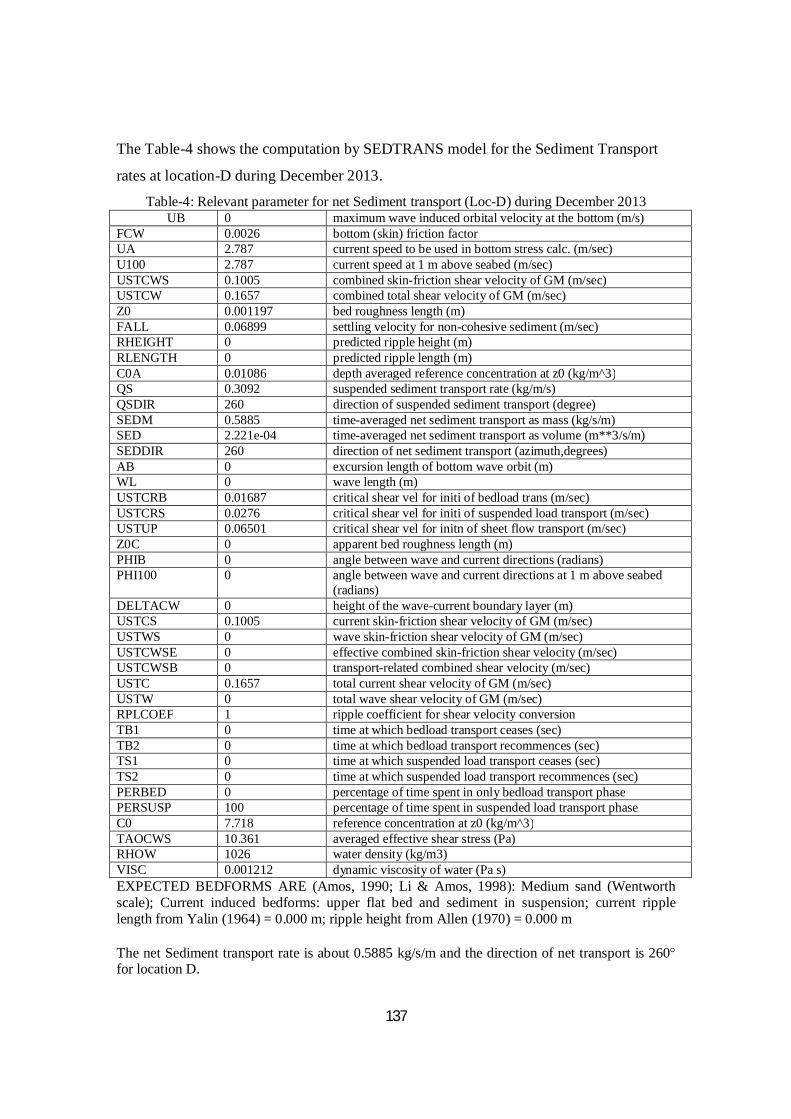
137
The Table-4 shows the computation by SEDTRANS model for the Sediment Transport
rates at location-D during December 2013.
Table-4: Relevant parameter for net Sediment transport (Loc-D) during December 2013 UB 0 maximum wave induced orbital velocity at the bottom (m/s) FCW 0.0026 bottom (skin) friction factor UA 2.787 current speed to be used in bottom stress calc. (m/sec) U100 2.787 current speed at 1 m above seabed (m/sec) USTCWS 0.1005 combined skin-friction shear velocity of GM (m/sec) USTCW 0.1657 combined total shear velocity of GM (m/sec) Z0 0.001197 bed roughness length (m) FALL 0.06899 settling velocity for non-cohesive sediment (m/sec) RHEIGHT 0 predicted ripple height (m) RLENGTH 0 predicted ripple length (m) C0A 0.01086 depth averaged reference concentration at z0 (kg/m^3) QS 0.3092 suspended sediment transport rate (kg/m/s) QSDIR 260 direction of suspended sediment transport (degree) SEDM 0.5885 time-averaged net sediment transport as mass (kg/s/m) SED 2.221e-04 time-averaged net sediment transport as volume (m**3/s/m) SEDDIR 260 direction of net sediment transport (azimuth,degrees) AB 0 excursion length of bottom wave orbit (m) WL 0 wave length (m) USTCRB 0.01687 critical shear vel for initi of bedload trans (m/sec) USTCRS 0.0276 critical shear vel for initi of suspended load transport (m/sec) USTUP 0.06501 critical shear vel for initn of sheet flow transport (m/sec) Z0C 0 apparent bed roughness length (m) PHIB 0 angle between wave and current directions (radians) PHI100 0 angle between wave and current directions at 1 m above seabed
(radians) DELTACW 0 height of the wave-current boundary layer (m) USTCS 0.1005 current skin-friction shear velocity of GM (m/sec) USTWS 0 wave skin-friction shear velocity of GM (m/sec) USTCWSE 0 effective combined skin-friction shear velocity (m/sec) USTCWSB 0 transport-related combined shear velocity (m/sec) USTC 0.1657 total current shear velocity of GM (m/sec) USTW 0 total wave shear velocity of GM (m/sec) RPLCOEF 1 ripple coefficient for shear velocity conversion TB1 0 time at which bedload transport ceases (sec) TB2 0 time at which bedload transport recommences (sec) TS1 0 time at which suspended load transport ceases (sec) TS2 0 time at which suspended load transport recommences (sec) PERBED 0 percentage of time spent in only bedload transport phase PERSUSP 100 percentage of time spent in suspended load transport phase C0 7.718 reference concentration at z0 (kg/m^3) TAOCWS 10.361 averaged effective shear stress (Pa) RHOW 1026 water density (kg/m3) VISC 0.001212 dynamic viscosity of water (Pa s) EXPECTED BEDFORMS ARE (Amos, 1990; Li & Amos, 1998): Medium sand (Wentworth scale); Current induced bedforms: upper flat bed and sediment in suspension; current ripple length from Yalin (1964) = 0.000 m; ripple height from Allen (1970) = 0.000 m The net Sediment transport rate is about 0.5885 kg/s/m and the direction of net transport is 260 for location D.

138
The Table-5 shows the computation by SEDTRANS model for the Sediment Transport
rates at location-A during January 2014.
Table-5: Relevant parameter for net Sediment transport (Loc-A) during January 2014 UB
0 maximum wave induced orbital velocity at the bottom (m/s)
FCW 0.006 bottom (skin) friction factor UA 1.5962 current speed to be used in bottom stress calc. (m/sec) U100 1.5962 current speed at 1 m above seabed (m/sec) USTCWS 0.08743 combined skin-friction shear velocity of GM (m/sec) USTCW 0.1421 combined total shear velocity of GM (m/sec) Z0 0.01118 bed roughness length (m) FALL 0.06899 settling velocity for non-cohesive sediment (m/sec) RHEIGHT 0.0778 predicted ripple height (m) RLENGTH 0.5 predicted ripple length (m) C0A 0.02619 depth averaged reference concentration at z0 (kg/m^3) QS 0.3873 suspended sediment transport rate (kg/m/s) QSDIR 264 direction of suspended sediment transport (degree) SEDM 0.3821 time-averaged net sediment transport as mass (kg/s/m) SED 1.442e-04 time-averaged net sediment transport as volume (m**3/s/m) SEDDIR 264 direction of net sediment transport (azimuth,degrees) AB 0 excursion length of bottom wave orbit (m) WL 0 wave length (m) USTCRB 0.01687 critical shear vel for initi of bedload trans (m/sec) USTCRS 0.0276 critical shear vel for initi of suspended load transport (m/sec) USTUP 0.06501 critical shear vel for initn of sheet flow transport (m/sec) Z0C 0 apparent bed roughness length (m) PHIB 0 angle between wave and current directions (radians) PHI100 0 angle between wave and current directions at 1 m above seabed (radians) DELTACW 0 height of the wave-current boundary layer (m) USTCS 0.08743 current skin-friction shear velocity of GM (m/sec) USTWS 0 wave skin-friction shear velocity of GM (m/sec) USTCWSE 0 effective combined skin-friction shear velocity (m/sec) USTCWSB 0 transport-related combined shear velocity (m/sec) USTC 0.1421 total current shear velocity of GM (m/sec) USTW 0 total wave shear velocity of GM (m/sec) RPLCOEF 1 ripple coefficient for shear velocity conversion TB1 0 time at which bedload transport ceases (sec) TB2 0 time at which bedload transport recommences (sec) TS1 0 time at which suspended load transport ceases (sec) TS2 0 time at which suspended load transport recommences (sec) PERBED 0 percentage of time spent in only bedload transport phase PERSUSP 100 percentage of time spent in suspended load transport phase C0 5.787 reference concentration at z0 (kg/m^3) TAOCWS 7.842 averaged effective shear stress (Pa) RHOW 1026 water density (kg/m3) VISC 0.001212 dynamic viscosity of water (Pa s) EXPECTED BEDFORMS ARE (Amos, 1990; Li & Amos, 1998): Medium sand (Wentworth scale) Current induced bedforms: flat bed (upper) and sand ribbons current ripple length from Yalin (1964) = 0.500 m ripple height from Allen (1970) = 0.078 m The net Sediment transport rate is about 0.3821 kg/s/m and the direction of net transport is 264 for location A.
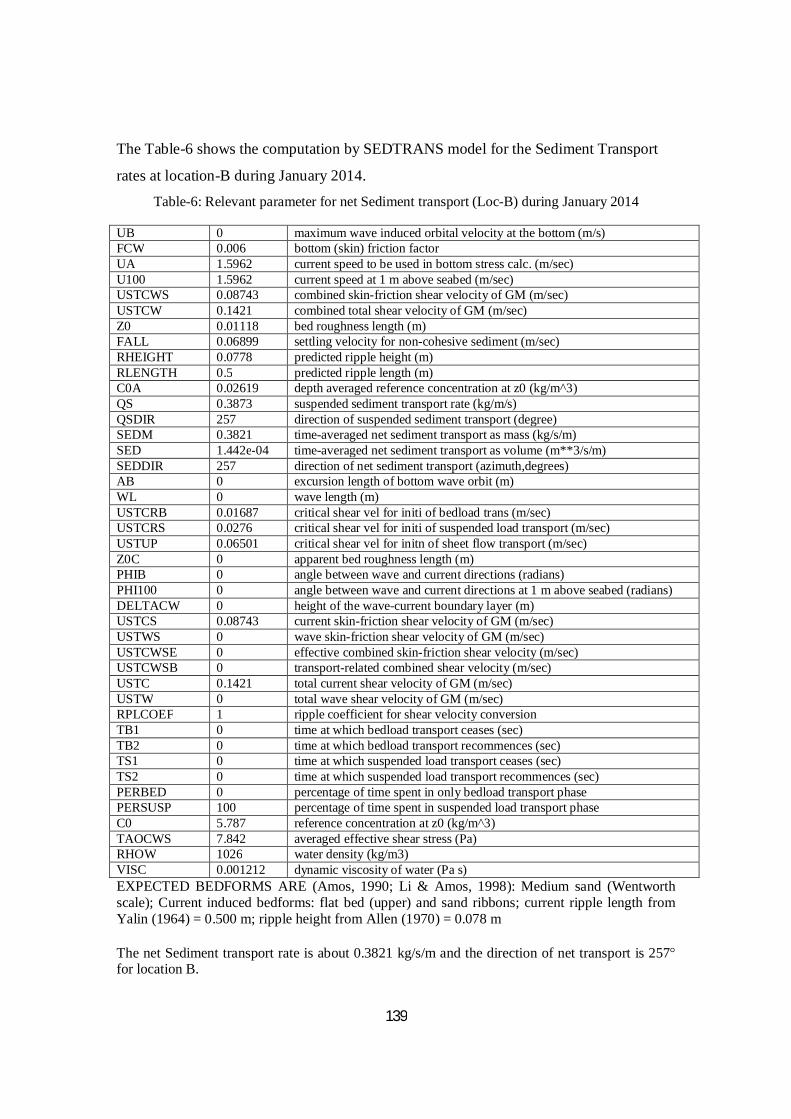
139
The Table-6 shows the computation by SEDTRANS model for the Sediment Transport
rates at location-B during January 2014.
Table-6: Relevant parameter for net Sediment transport (Loc-B) during January 2014 UB 0 maximum wave induced orbital velocity at the bottom (m/s) FCW 0.006 bottom (skin) friction factor UA 1.5962 current speed to be used in bottom stress calc. (m/sec) U100 1.5962 current speed at 1 m above seabed (m/sec) USTCWS 0.08743 combined skin-friction shear velocity of GM (m/sec) USTCW 0.1421 combined total shear velocity of GM (m/sec) Z0 0.01118 bed roughness length (m) FALL 0.06899 settling velocity for non-cohesive sediment (m/sec) RHEIGHT 0.0778 predicted ripple height (m) RLENGTH 0.5 predicted ripple length (m) C0A 0.02619 depth averaged reference concentration at z0 (kg/m^3) QS 0.3873 suspended sediment transport rate (kg/m/s) QSDIR 257 direction of suspended sediment transport (degree) SEDM 0.3821 time-averaged net sediment transport as mass (kg/s/m) SED 1.442e-04 time-averaged net sediment transport as volume (m**3/s/m) SEDDIR 257 direction of net sediment transport (azimuth,degrees) AB 0 excursion length of bottom wave orbit (m) WL 0 wave length (m) USTCRB 0.01687 critical shear vel for initi of bedload trans (m/sec) USTCRS 0.0276 critical shear vel for initi of suspended load transport (m/sec) USTUP 0.06501 critical shear vel for initn of sheet flow transport (m/sec) Z0C 0 apparent bed roughness length (m) PHIB 0 angle between wave and current directions (radians) PHI100 0 angle between wave and current directions at 1 m above seabed (radians) DELTACW 0 height of the wave-current boundary layer (m) USTCS 0.08743 current skin-friction shear velocity of GM (m/sec) USTWS 0 wave skin-friction shear velocity of GM (m/sec) USTCWSE 0 effective combined skin-friction shear velocity (m/sec) USTCWSB 0 transport-related combined shear velocity (m/sec) USTC 0.1421 total current shear velocity of GM (m/sec) USTW 0 total wave shear velocity of GM (m/sec) RPLCOEF 1 ripple coefficient for shear velocity conversion TB1 0 time at which bedload transport ceases (sec) TB2 0 time at which bedload transport recommences (sec) TS1 0 time at which suspended load transport ceases (sec) TS2 0 time at which suspended load transport recommences (sec) PERBED 0 percentage of time spent in only bedload transport phase PERSUSP 100 percentage of time spent in suspended load transport phase C0 5.787 reference concentration at z0 (kg/m^3) TAOCWS 7.842 averaged effective shear stress (Pa) RHOW 1026 water density (kg/m3) VISC 0.001212 dynamic viscosity of water (Pa s) EXPECTED BEDFORMS ARE (Amos, 1990; Li & Amos, 1998): Medium sand (Wentworth scale); Current induced bedforms: flat bed (upper) and sand ribbons; current ripple length from Yalin (1964) = 0.500 m; ripple height from Allen (1970) = 0.078 m The net Sediment transport rate is about 0.3821 kg/s/m and the direction of net transport is 257 for location B.
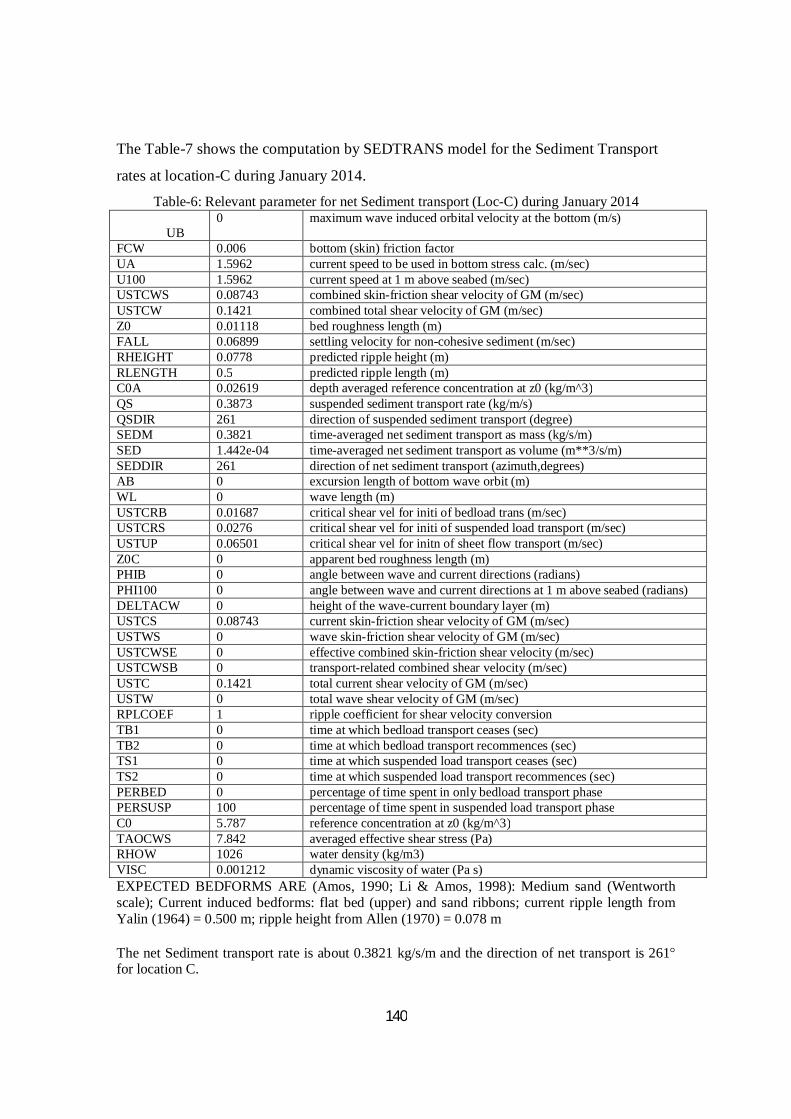
140
The Table-7 shows the computation by SEDTRANS model for the Sediment Transport
rates at location-C during January 2014.
Table-6: Relevant parameter for net Sediment transport (Loc-C) during January 2014 UB
0 maximum wave induced orbital velocity at the bottom (m/s)
FCW 0.006 bottom (skin) friction factor UA 1.5962 current speed to be used in bottom stress calc. (m/sec) U100 1.5962 current speed at 1 m above seabed (m/sec) USTCWS 0.08743 combined skin-friction shear velocity of GM (m/sec) USTCW 0.1421 combined total shear velocity of GM (m/sec) Z0 0.01118 bed roughness length (m) FALL 0.06899 settling velocity for non-cohesive sediment (m/sec) RHEIGHT 0.0778 predicted ripple height (m) RLENGTH 0.5 predicted ripple length (m) C0A 0.02619 depth averaged reference concentration at z0 (kg/m^3) QS 0.3873 suspended sediment transport rate (kg/m/s) QSDIR 261 direction of suspended sediment transport (degree) SEDM 0.3821 time-averaged net sediment transport as mass (kg/s/m) SED 1.442e-04 time-averaged net sediment transport as volume (m**3/s/m) SEDDIR 261 direction of net sediment transport (azimuth,degrees) AB 0 excursion length of bottom wave orbit (m) WL 0 wave length (m) USTCRB 0.01687 critical shear vel for initi of bedload trans (m/sec) USTCRS 0.0276 critical shear vel for initi of suspended load transport (m/sec) USTUP 0.06501 critical shear vel for initn of sheet flow transport (m/sec) Z0C 0 apparent bed roughness length (m) PHIB 0 angle between wave and current directions (radians) PHI100 0 angle between wave and current directions at 1 m above seabed (radians) DELTACW 0 height of the wave-current boundary layer (m) USTCS 0.08743 current skin-friction shear velocity of GM (m/sec) USTWS 0 wave skin-friction shear velocity of GM (m/sec) USTCWSE 0 effective combined skin-friction shear velocity (m/sec) USTCWSB 0 transport-related combined shear velocity (m/sec) USTC 0.1421 total current shear velocity of GM (m/sec) USTW 0 total wave shear velocity of GM (m/sec) RPLCOEF 1 ripple coefficient for shear velocity conversion TB1 0 time at which bedload transport ceases (sec) TB2 0 time at which bedload transport recommences (sec) TS1 0 time at which suspended load transport ceases (sec) TS2 0 time at which suspended load transport recommences (sec) PERBED 0 percentage of time spent in only bedload transport phase PERSUSP 100 percentage of time spent in suspended load transport phase C0 5.787 reference concentration at z0 (kg/m^3) TAOCWS 7.842 averaged effective shear stress (Pa) RHOW 1026 water density (kg/m3) VISC 0.001212 dynamic viscosity of water (Pa s) EXPECTED BEDFORMS ARE (Amos, 1990; Li & Amos, 1998): Medium sand (Wentworth scale); Current induced bedforms: flat bed (upper) and sand ribbons; current ripple length from Yalin (1964) = 0.500 m; ripple height from Allen (1970) = 0.078 m The net Sediment transport rate is about 0.3821 kg/s/m and the direction of net transport is 261 for location C.
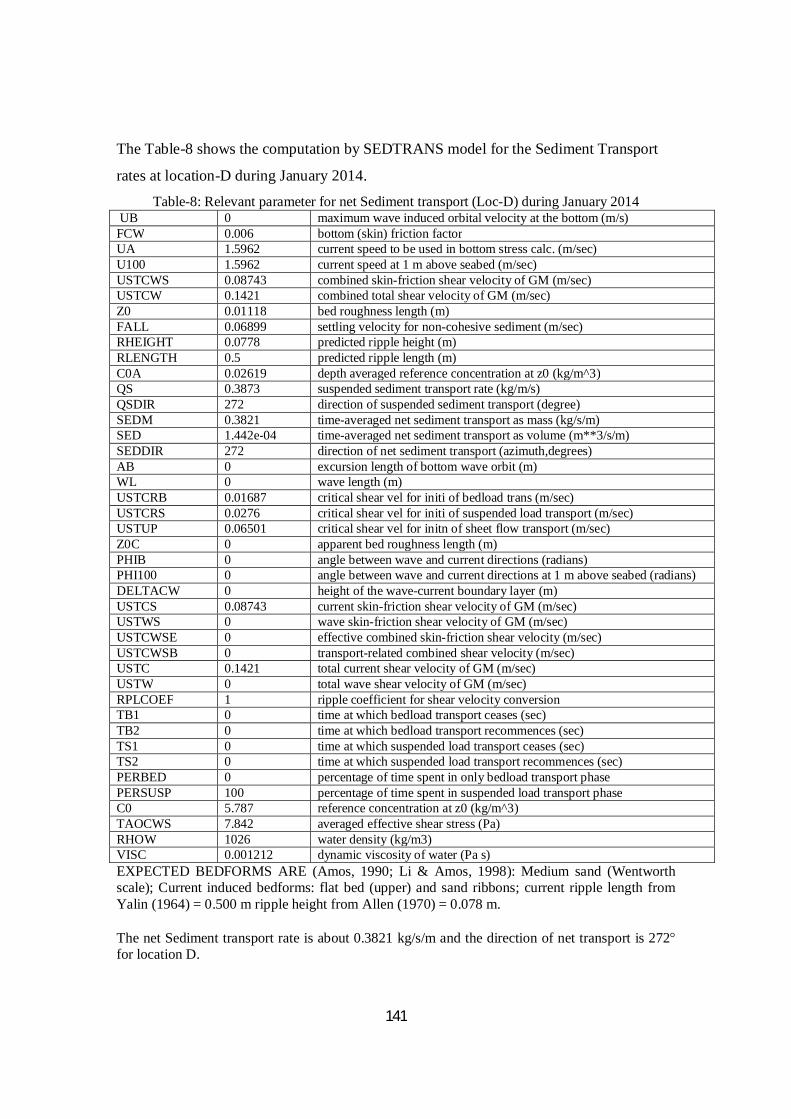
141
The Table-8 shows the computation by SEDTRANS model for the Sediment Transport
rates at location-D during January 2014.
Table-8: Relevant parameter for net Sediment transport (Loc-D) during January 2014 UB 0 maximum wave induced orbital velocity at the bottom (m/s) FCW 0.006 bottom (skin) friction factor UA 1.5962 current speed to be used in bottom stress calc. (m/sec) U100 1.5962 current speed at 1 m above seabed (m/sec) USTCWS 0.08743 combined skin-friction shear velocity of GM (m/sec) USTCW 0.1421 combined total shear velocity of GM (m/sec) Z0 0.01118 bed roughness length (m) FALL 0.06899 settling velocity for non-cohesive sediment (m/sec) RHEIGHT 0.0778 predicted ripple height (m) RLENGTH 0.5 predicted ripple length (m) C0A 0.02619 depth averaged reference concentration at z0 (kg/m^3) QS 0.3873 suspended sediment transport rate (kg/m/s) QSDIR 272 direction of suspended sediment transport (degree) SEDM 0.3821 time-averaged net sediment transport as mass (kg/s/m) SED 1.442e-04 time-averaged net sediment transport as volume (m**3/s/m) SEDDIR 272 direction of net sediment transport (azimuth,degrees) AB 0 excursion length of bottom wave orbit (m) WL 0 wave length (m) USTCRB 0.01687 critical shear vel for initi of bedload trans (m/sec) USTCRS 0.0276 critical shear vel for initi of suspended load transport (m/sec) USTUP 0.06501 critical shear vel for initn of sheet flow transport (m/sec) Z0C 0 apparent bed roughness length (m) PHIB 0 angle between wave and current directions (radians) PHI100 0 angle between wave and current directions at 1 m above seabed (radians) DELTACW 0 height of the wave-current boundary layer (m) USTCS 0.08743 current skin-friction shear velocity of GM (m/sec) USTWS 0 wave skin-friction shear velocity of GM (m/sec) USTCWSE 0 effective combined skin-friction shear velocity (m/sec) USTCWSB 0 transport-related combined shear velocity (m/sec) USTC 0.1421 total current shear velocity of GM (m/sec) USTW 0 total wave shear velocity of GM (m/sec) RPLCOEF 1 ripple coefficient for shear velocity conversion TB1 0 time at which bedload transport ceases (sec) TB2 0 time at which bedload transport recommences (sec) TS1 0 time at which suspended load transport ceases (sec) TS2 0 time at which suspended load transport recommences (sec) PERBED 0 percentage of time spent in only bedload transport phase PERSUSP 100 percentage of time spent in suspended load transport phase C0 5.787 reference concentration at z0 (kg/m^3) TAOCWS 7.842 averaged effective shear stress (Pa) RHOW 1026 water density (kg/m3) VISC 0.001212 dynamic viscosity of water (Pa s) EXPECTED BEDFORMS ARE (Amos, 1990; Li & Amos, 1998): Medium sand (Wentworth scale); Current induced bedforms: flat bed (upper) and sand ribbons; current ripple length from Yalin (1964) = 0.500 m ripple height from Allen (1970) = 0.078 m. The net Sediment transport rate is about 0.3821 kg/s/m and the direction of net transport is 272 for location D.

142
The Table-9 shows the computation by SEDTRANS model for the Sediment Transport
rates at location-A during February 2014.
Table-9: Relevant parameter for net Sediment transport (Loc-A) during February 2014 UB
0 maximum wave induced orbital velocity at the bottom (m/s)
FCW 0.0026 bottom (skin) friction factor UA 2.787 current speed to be used in bottom stress calc. (m/sec) U100 2.787 current speed at 1 m above seabed (m/sec) USTCWS 0.1005 combined skin-friction shear velocity of GM (m/sec) USTCW 0.1657 combined total shear velocity of GM (m/sec) Z0 0.001197 bed roughness length (m) FALL 0.06899 settling velocity for non-cohesive sediment (m/sec) RHEIGHT 0 predicted ripple height (m) RLENGTH 0 predicted ripple length (m) C0A 0.008709 depth averaged reference concentration at z0 (kg/m^3) QS 0.3092 suspended sediment transport rate (kg/m/s) QSDIR 257 direction of suspended sediment transport (degree) SEDM 0.5885 time-averaged net sediment transport as mass (kg/s/m) SED 2.221e-04 time-averaged net sediment transport as volume (m**3/s/m) SEDDIR 257 direction of net sediment transport (azimuth,degrees) AB 0 excursion length of bottom wave orbit (m) WL 0 wave length (m) USTCRB 0.01687 critical shear vel for initi of bedload trans (m/sec) USTCRS 0.0276 critical shear vel for initi of suspended load transport (m/sec) USTUP 0.06501 critical shear vel for initn of sheet flow transport (m/sec) Z0C 0 apparent bed roughness length (m) PHIB 0 angle between wave and current directions (radians) PHI100 0 angle between wave and current directions at 1 m above seabed (radians) DELTACW 0 height of the wave-current boundary layer (m) USTCS 0.1005 current skin-friction shear velocity of GM (m/sec) USTWS 0 wave skin-friction shear velocity of GM (m/sec) USTCWSE 0 effective combined skin-friction shear velocity (m/sec) USTCWSB 0 transport-related combined shear velocity (m/sec) USTC 0.1657 total current shear velocity of GM (m/sec) USTW 0 total wave shear velocity of GM (m/sec) RPLCOEF 1 ripple coefficient for shear velocity conversion TB1 0 time at which bedload transport ceases (sec) TB2 0 time at which bedload transport recommences (sec) TS1 0 time at which suspended load transport ceases (sec) TS2 0 time at which suspended load transport recommences (sec) PERBED 0 percentage of time spent in only bedload transport phase PERSUSP 100 percentage of time spent in suspended load transport phase C0 7.718 reference concentration at z0 (kg/m^3) TAOCWS 10.361 averaged effective shear stress (Pa) RHOW 1026 water density (kg/m3) VISC 0.001212 dynamic viscosity of water (Pa s) EXPECTED BEDFORMS ARE (Amos, 1990; Li & Amos, 1998): Medium sand (Wentworth scale); Current induced bedforms: upper flat bed and sediment in suspension; current ripple length from Yalin (1964) = 0.000 m; ripple height from Allen (1970) = 0.000 m The net Sediment transport rate is about 0.5885 kg/s/m and the direction of net transport is 257 for location A.
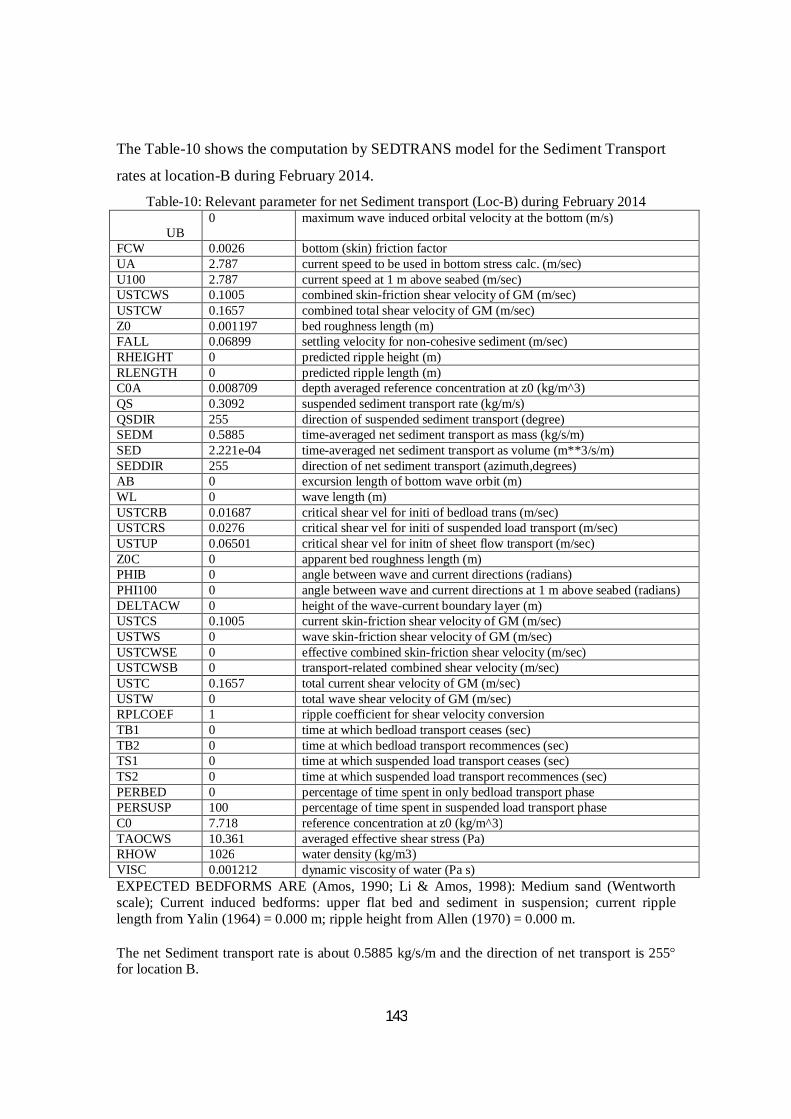
143
The Table-10 shows the computation by SEDTRANS model for the Sediment Transport
rates at location-B during February 2014.
Table-10: Relevant parameter for net Sediment transport (Loc-B) during February 2014 UB
0 maximum wave induced orbital velocity at the bottom (m/s)
FCW 0.0026 bottom (skin) friction factor UA 2.787 current speed to be used in bottom stress calc. (m/sec) U100 2.787 current speed at 1 m above seabed (m/sec) USTCWS 0.1005 combined skin-friction shear velocity of GM (m/sec) USTCW 0.1657 combined total shear velocity of GM (m/sec) Z0 0.001197 bed roughness length (m) FALL 0.06899 settling velocity for non-cohesive sediment (m/sec) RHEIGHT 0 predicted ripple height (m) RLENGTH 0 predicted ripple length (m) C0A 0.008709 depth averaged reference concentration at z0 (kg/m^3) QS 0.3092 suspended sediment transport rate (kg/m/s) QSDIR 255 direction of suspended sediment transport (degree) SEDM 0.5885 time-averaged net sediment transport as mass (kg/s/m) SED 2.221e-04 time-averaged net sediment transport as volume (m**3/s/m) SEDDIR 255 direction of net sediment transport (azimuth,degrees) AB 0 excursion length of bottom wave orbit (m) WL 0 wave length (m) USTCRB 0.01687 critical shear vel for initi of bedload trans (m/sec) USTCRS 0.0276 critical shear vel for initi of suspended load transport (m/sec) USTUP 0.06501 critical shear vel for initn of sheet flow transport (m/sec) Z0C 0 apparent bed roughness length (m) PHIB 0 angle between wave and current directions (radians) PHI100 0 angle between wave and current directions at 1 m above seabed (radians) DELTACW 0 height of the wave-current boundary layer (m) USTCS 0.1005 current skin-friction shear velocity of GM (m/sec) USTWS 0 wave skin-friction shear velocity of GM (m/sec) USTCWSE 0 effective combined skin-friction shear velocity (m/sec) USTCWSB 0 transport-related combined shear velocity (m/sec) USTC 0.1657 total current shear velocity of GM (m/sec) USTW 0 total wave shear velocity of GM (m/sec) RPLCOEF 1 ripple coefficient for shear velocity conversion TB1 0 time at which bedload transport ceases (sec) TB2 0 time at which bedload transport recommences (sec) TS1 0 time at which suspended load transport ceases (sec) TS2 0 time at which suspended load transport recommences (sec) PERBED 0 percentage of time spent in only bedload transport phase PERSUSP 100 percentage of time spent in suspended load transport phase C0 7.718 reference concentration at z0 (kg/m^3) TAOCWS 10.361 averaged effective shear stress (Pa) RHOW 1026 water density (kg/m3) VISC 0.001212 dynamic viscosity of water (Pa s) EXPECTED BEDFORMS ARE (Amos, 1990; Li & Amos, 1998): Medium sand (Wentworth scale); Current induced bedforms: upper flat bed and sediment in suspension; current ripple length from Yalin (1964) = 0.000 m; ripple height from Allen (1970) = 0.000 m. The net Sediment transport rate is about 0.5885 kg/s/m and the direction of net transport is 255 for location B.

144
The Table-11 shows the computation by SEDTRANS model for the Sediment Transport
rates at location-C during February 2014.
Table-11: Relevant parameter for net Sediment transport (Loc-C) during February 2014 UB
0 maximum wave induced orbital velocity at the bottom (m/s)
FCW 0.0026 bottom (skin) friction factor UA 2.787 current speed to be used in bottom stress calc. (m/sec) U100 2.787 current speed at 1 m above seabed (m/sec) USTCWS 0.1005 combined skin-friction shear velocity of GM (m/sec) USTCW 0.1657 combined total shear velocity of GM (m/sec) Z0 0.001197 bed roughness length (m) FALL 0.06899 settling velocity for non-cohesive sediment (m/sec) RHEIGHT 0 predicted ripple height (m) RLENGTH 0 predicted ripple length (m) C0A 0.008709 depth averaged reference concentration at z0 (kg/m^3) QS 0.3092 suspended sediment transport rate (kg/m/s) QSDIR 271 direction of suspended sediment transport (degree) SEDM 0.5885 time-averaged net sediment transport as mass (kg/s/m) SED 2.221e-04 time-averaged net sediment transport as volume (m**3/s/m) SEDDIR 271 direction of net sediment transport (azimuth,degrees) AB 0 excursion length of bottom wave orbit (m) WL 0 wave length (m) USTCRB 0.01687 critical shear vel for initi of bedload trans (m/sec) USTCRS 0.0276 critical shear vel for initi of suspended load transport (m/sec) USTUP 0.06501 critical shear vel for initn of sheet flow transport (m/sec) Z0C 0 apparent bed roughness length (m) PHIB 0 angle between wave and current directions (radians) PHI100 0 angle between wave and current directions at 1 m above seabed (radians) DELTACW 0 height of the wave-current boundary layer (m) USTCS 0.1005 current skin-friction shear velocity of GM (m/sec) USTWS 0 wave skin-friction shear velocity of GM (m/sec) USTCWSE 0 effective combined skin-friction shear velocity (m/sec) USTCWSB 0 transport-related combined shear velocity (m/sec) USTC 0.1657 total current shear velocity of GM (m/sec) USTW 0 total wave shear velocity of GM (m/sec) RPLCOEF 1 ripple coefficient for shear velocity conversion TB1 0 time at which bedload transport ceases (sec) TB2 0 time at which bedload transport recommences (sec) TS1 0 time at which suspended load transport ceases (sec) TS2 0 time at which suspended load transport recommences (sec) PERBED 0 percentage of time spent in only bedload transport phase PERSUSP 100 percentage of time spent in suspended load transport phase C0 7.718 reference concentration at z0 (kg/m^3) TAOCWS 10.361 averaged effective shear stress (Pa) RHOW 1026 water density (kg/m3) VISC 0.001212 dynamic viscosity of water (Pa s) EXPECTED BEDFORMS ARE (Amos, 1990; Li & Amos, 1998): Medium sand (Wentworth scale); Current induced bedforms: upper flat bed and sediment in suspension; current ripple length from Yalin (1964) = 0.000 m; ripple height from Allen (1970) = 0.000 m The net Sediment transport rate is about 0.5885 kg/s/m and the direction of net transport is 271 for location C.
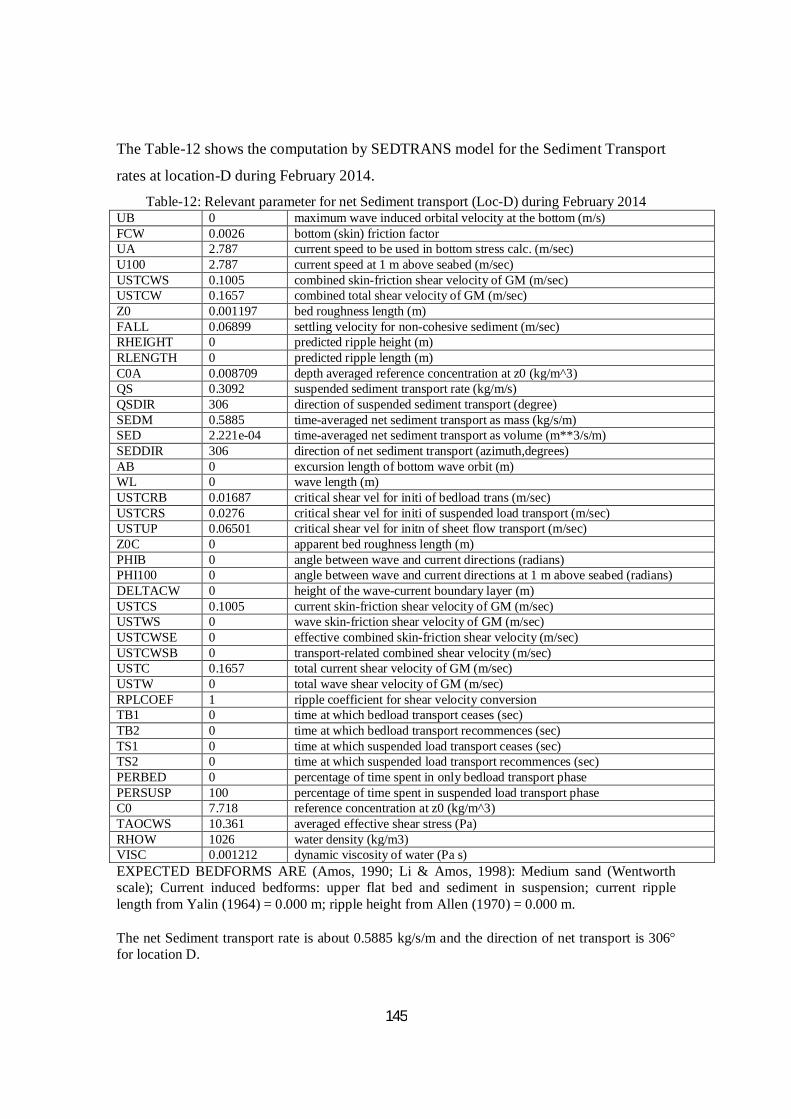
145
The Table-12 shows the computation by SEDTRANS model for the Sediment Transport
rates at location-D during February 2014.
Table-12: Relevant parameter for net Sediment transport (Loc-D) during February 2014 UB 0 maximum wave induced orbital velocity at the bottom (m/s) FCW 0.0026 bottom (skin) friction factor UA 2.787 current speed to be used in bottom stress calc. (m/sec) U100 2.787 current speed at 1 m above seabed (m/sec) USTCWS 0.1005 combined skin-friction shear velocity of GM (m/sec) USTCW 0.1657 combined total shear velocity of GM (m/sec) Z0 0.001197 bed roughness length (m) FALL 0.06899 settling velocity for non-cohesive sediment (m/sec) RHEIGHT 0 predicted ripple height (m) RLENGTH 0 predicted ripple length (m) C0A 0.008709 depth averaged reference concentration at z0 (kg/m^3) QS 0.3092 suspended sediment transport rate (kg/m/s) QSDIR 306 direction of suspended sediment transport (degree) SEDM 0.5885 time-averaged net sediment transport as mass (kg/s/m) SED 2.221e-04 time-averaged net sediment transport as volume (m**3/s/m) SEDDIR 306 direction of net sediment transport (azimuth,degrees) AB 0 excursion length of bottom wave orbit (m) WL 0 wave length (m) USTCRB 0.01687 critical shear vel for initi of bedload trans (m/sec) USTCRS 0.0276 critical shear vel for initi of suspended load transport (m/sec) USTUP 0.06501 critical shear vel for initn of sheet flow transport (m/sec) Z0C 0 apparent bed roughness length (m) PHIB 0 angle between wave and current directions (radians) PHI100 0 angle between wave and current directions at 1 m above seabed (radians) DELTACW 0 height of the wave-current boundary layer (m) USTCS 0.1005 current skin-friction shear velocity of GM (m/sec) USTWS 0 wave skin-friction shear velocity of GM (m/sec) USTCWSE 0 effective combined skin-friction shear velocity (m/sec) USTCWSB 0 transport-related combined shear velocity (m/sec) USTC 0.1657 total current shear velocity of GM (m/sec) USTW 0 total wave shear velocity of GM (m/sec) RPLCOEF 1 ripple coefficient for shear velocity conversion TB1 0 time at which bedload transport ceases (sec) TB2 0 time at which bedload transport recommences (sec) TS1 0 time at which suspended load transport ceases (sec) TS2 0 time at which suspended load transport recommences (sec) PERBED 0 percentage of time spent in only bedload transport phase PERSUSP 100 percentage of time spent in suspended load transport phase C0 7.718 reference concentration at z0 (kg/m^3) TAOCWS 10.361 averaged effective shear stress (Pa) RHOW 1026 water density (kg/m3) VISC 0.001212 dynamic viscosity of water (Pa s) EXPECTED BEDFORMS ARE (Amos, 1990; Li & Amos, 1998): Medium sand (Wentworth scale); Current induced bedforms: upper flat bed and sediment in suspension; current ripple length from Yalin (1964) = 0.000 m; ripple height from Allen (1970) = 0.000 m. The net Sediment transport rate is about 0.5885 kg/s/m and the direction of net transport is 306 for location D.

146
The Table-13 shows the computation by SEDTRANS model for the Sediment Transport
rates at location-A during March 2014.
Table-13: Relevant parameter for net Sediment transport (Loc-A) during March 2014 UB 3.572e-04 maximum wave induced orbital velocity at the bottom (m/s) FCW 0.0026 bottom (skin) friction factor UA 3.01 current speed to be used in bottom stress calc. (m/sec) U100 3.01 current speed at 1 m above seabed (m/sec) USTCWS 0.1085 combined skin-friction shear velocity of GM (m/sec) USTCW 0.179 combined total shear velocity of GM (m/sec) Z0 0.001197 bed roughness length (m) FALL 0.06899 settling velocity for non-cohesive sediment (m/sec) RHEIGHT 0 predicted ripple height (m) RLENGTH 0 predicted ripple length (m) C0A 0.02483 depth averaged reference concentration at z0 (kg/m^3) QS 0.5455 suspended sediment transport rate (kg/m/s) QSDIR 263 direction of suspended sediment transport (degree) SEDM 0.746 time-averaged net sediment transport as mass (kg/s/m) SED 2.815e-04 time-averaged net sediment transport as volume (m**3/s/m) SEDDIR 263 direction of net sediment transport (azimuth,degrees) AB 1.194e-04 excursion length of bottom wave orbit (m) WL 6.878 wave length (m) USTCRB 0.01687 critical shear vel for initi of bedload trans (m/sec) USTCRS 0.0276 critical shear vel for initi of suspended load transport (m/sec) USTUP 0.06501 critical shear vel for initn of sheet flow transport (m/sec) Z0C 0 apparent bed roughness length (m) PHIB 0 angle between wave and current directions (radians) PHI100 0 angle between wave and current directions at 1 m above seabed (radians) DELTACW 0 height of the wave-current boundary layer (m) USTCS 0.1085 current skin-friction shear velocity of GM (m/sec) USTWS 0 wave skin-friction shear velocity of GM (m/sec) USTCWSE 0 effective combined skin-friction shear velocity (m/sec) USTCWSB 0 transport-related combined shear velocity (m/sec) USTC 0.179 total current shear velocity of GM (m/sec) USTW 0 total wave shear velocity of GM (m/sec) RPLCOEF 1 ripple coefficient for shear velocity conversion TB1 0 time at which bedload transport ceases (sec) TB2 0 time at which bedload transport recommences (sec) TS1 0 time at which suspended load transport ceases (sec) TS2 0 time at which suspended load transport recommences (sec) PERBED 0 percentage of time spent in only bedload transport phase PERSUSP 100 percentage of time spent in suspended load transport phase C0 9.039 reference concentration at z0 (kg/m^3) TAOCWS 12.085 averaged effective shear stress (Pa) RHOW 1026 water density (kg/m3) VISC 0.001212 dynamic viscosity of water (Pa s) EXPECTED BEDFORMS ARE (Amos, 1990; Li & Amos, 1998): Medium sand (Wentworth scale) bedform types predicted based on SIB data of Li and Amos (1998); No transport and ripple height= 0.000 m, ripple length= 0.000 m. The net Sediment transport rate is about 0.746 kg/s/m and the direction of net transport is 263 for location A.
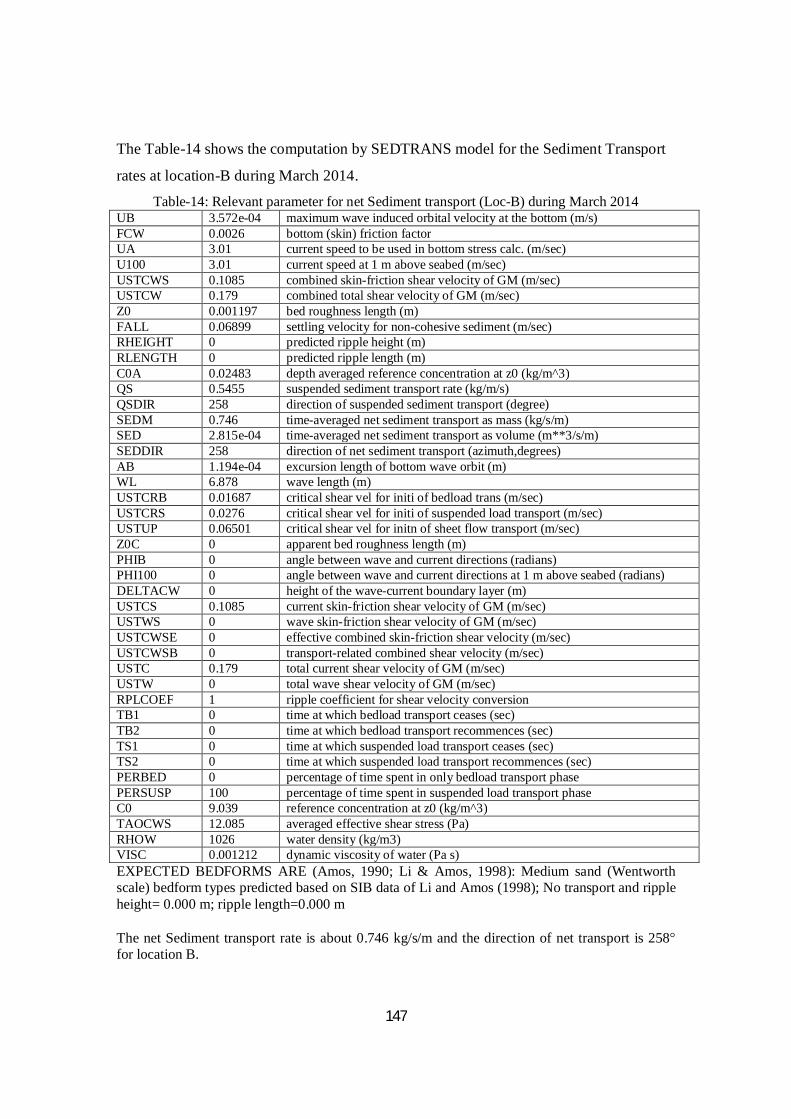
147
The Table-14 shows the computation by SEDTRANS model for the Sediment Transport
rates at location-B during March 2014.
Table-14: Relevant parameter for net Sediment transport (Loc-B) during March 2014 UB 3.572e-04 maximum wave induced orbital velocity at the bottom (m/s) FCW 0.0026 bottom (skin) friction factor UA 3.01 current speed to be used in bottom stress calc. (m/sec) U100 3.01 current speed at 1 m above seabed (m/sec) USTCWS 0.1085 combined skin-friction shear velocity of GM (m/sec) USTCW 0.179 combined total shear velocity of GM (m/sec) Z0 0.001197 bed roughness length (m) FALL 0.06899 settling velocity for non-cohesive sediment (m/sec) RHEIGHT 0 predicted ripple height (m) RLENGTH 0 predicted ripple length (m) C0A 0.02483 depth averaged reference concentration at z0 (kg/m^3) QS 0.5455 suspended sediment transport rate (kg/m/s) QSDIR 258 direction of suspended sediment transport (degree) SEDM 0.746 time-averaged net sediment transport as mass (kg/s/m) SED 2.815e-04 time-averaged net sediment transport as volume (m**3/s/m) SEDDIR 258 direction of net sediment transport (azimuth,degrees) AB 1.194e-04 excursion length of bottom wave orbit (m) WL 6.878 wave length (m) USTCRB 0.01687 critical shear vel for initi of bedload trans (m/sec) USTCRS 0.0276 critical shear vel for initi of suspended load transport (m/sec) USTUP 0.06501 critical shear vel for initn of sheet flow transport (m/sec) Z0C 0 apparent bed roughness length (m) PHIB 0 angle between wave and current directions (radians) PHI100 0 angle between wave and current directions at 1 m above seabed (radians) DELTACW 0 height of the wave-current boundary layer (m) USTCS 0.1085 current skin-friction shear velocity of GM (m/sec) USTWS 0 wave skin-friction shear velocity of GM (m/sec) USTCWSE 0 effective combined skin-friction shear velocity (m/sec) USTCWSB 0 transport-related combined shear velocity (m/sec) USTC 0.179 total current shear velocity of GM (m/sec) USTW 0 total wave shear velocity of GM (m/sec) RPLCOEF 1 ripple coefficient for shear velocity conversion TB1 0 time at which bedload transport ceases (sec) TB2 0 time at which bedload transport recommences (sec) TS1 0 time at which suspended load transport ceases (sec) TS2 0 time at which suspended load transport recommences (sec) PERBED 0 percentage of time spent in only bedload transport phase PERSUSP 100 percentage of time spent in suspended load transport phase C0 9.039 reference concentration at z0 (kg/m^3) TAOCWS 12.085 averaged effective shear stress (Pa) RHOW 1026 water density (kg/m3) VISC 0.001212 dynamic viscosity of water (Pa s) EXPECTED BEDFORMS ARE (Amos, 1990; Li & Amos, 1998): Medium sand (Wentworth scale) bedform types predicted based on SIB data of Li and Amos (1998); No transport and ripple height= 0.000 m; ripple length=0.000 m The net Sediment transport rate is about 0.746 kg/s/m and the direction of net transport is 258 for location B.
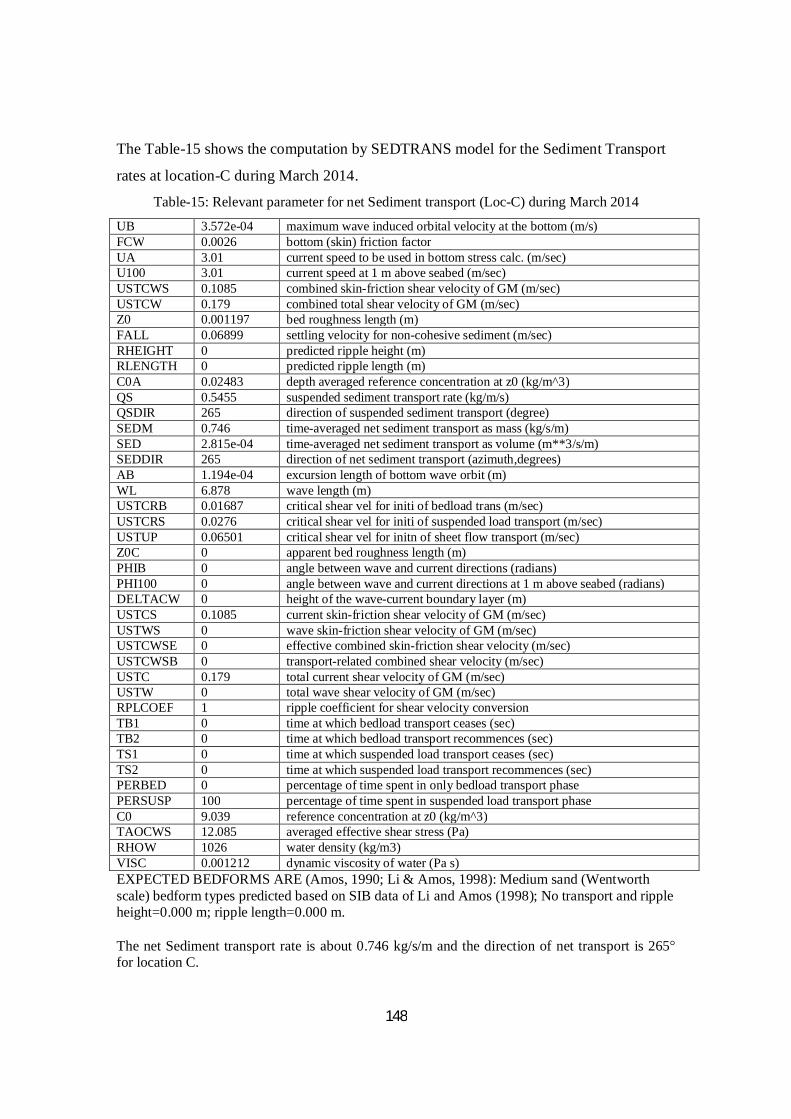
148
The Table-15 shows the computation by SEDTRANS model for the Sediment Transport
rates at location-C during March 2014.
Table-15: Relevant parameter for net Sediment transport (Loc-C) during March 2014
UB 3.572e-04 maximum wave induced orbital velocity at the bottom (m/s) FCW 0.0026 bottom (skin) friction factor UA 3.01 current speed to be used in bottom stress calc. (m/sec) U100 3.01 current speed at 1 m above seabed (m/sec) USTCWS 0.1085 combined skin-friction shear velocity of GM (m/sec) USTCW 0.179 combined total shear velocity of GM (m/sec) Z0 0.001197 bed roughness length (m) FALL 0.06899 settling velocity for non-cohesive sediment (m/sec) RHEIGHT 0 predicted ripple height (m) RLENGTH 0 predicted ripple length (m) C0A 0.02483 depth averaged reference concentration at z0 (kg/m^3) QS 0.5455 suspended sediment transport rate (kg/m/s) QSDIR 265 direction of suspended sediment transport (degree) SEDM 0.746 time-averaged net sediment transport as mass (kg/s/m) SED 2.815e-04 time-averaged net sediment transport as volume (m**3/s/m) SEDDIR 265 direction of net sediment transport (azimuth,degrees) AB 1.194e-04 excursion length of bottom wave orbit (m) WL 6.878 wave length (m) USTCRB 0.01687 critical shear vel for initi of bedload trans (m/sec) USTCRS 0.0276 critical shear vel for initi of suspended load transport (m/sec) USTUP 0.06501 critical shear vel for initn of sheet flow transport (m/sec) Z0C 0 apparent bed roughness length (m) PHIB 0 angle between wave and current directions (radians) PHI100 0 angle between wave and current directions at 1 m above seabed (radians) DELTACW 0 height of the wave-current boundary layer (m) USTCS 0.1085 current skin-friction shear velocity of GM (m/sec) USTWS 0 wave skin-friction shear velocity of GM (m/sec) USTCWSE 0 effective combined skin-friction shear velocity (m/sec) USTCWSB 0 transport-related combined shear velocity (m/sec) USTC 0.179 total current shear velocity of GM (m/sec) USTW 0 total wave shear velocity of GM (m/sec) RPLCOEF 1 ripple coefficient for shear velocity conversion TB1 0 time at which bedload transport ceases (sec) TB2 0 time at which bedload transport recommences (sec) TS1 0 time at which suspended load transport ceases (sec) TS2 0 time at which suspended load transport recommences (sec) PERBED 0 percentage of time spent in only bedload transport phase PERSUSP 100 percentage of time spent in suspended load transport phase C0 9.039 reference concentration at z0 (kg/m^3) TAOCWS 12.085 averaged effective shear stress (Pa) RHOW 1026 water density (kg/m3) VISC 0.001212 dynamic viscosity of water (Pa s) EXPECTED BEDFORMS ARE (Amos, 1990; Li & Amos, 1998): Medium sand (Wentworth scale) bedform types predicted based on SIB data of Li and Amos (1998); No transport and ripple height=0.000 m; ripple length=0.000 m. The net Sediment transport rate is about 0.746 kg/s/m and the direction of net transport is 265 for location C.

149
The Table-16 shows the computation by SEDTRANS model for the Sediment Transport
rates at location-D during March 2014.
Table-16: Relevant parameter for net Sediment transport (Loc-D) during March 2014
UB 3.572e-04 maximum wave induced orbital velocity at the bottom (m/s) FCW 0.0026 bottom (skin) friction factor UA 3.01 current speed to be used in bottom stress calc. (m/sec) U100 3.01 current speed at 1 m above seabed (m/sec) USTCWS 0.1085 combined skin-friction shear velocity of GM (m/sec) USTCW 0.179 combined total shear velocity of GM (m/sec) Z0 0.001197 bed roughness length (m) FALL 0.06899 settling velocity for non-cohesive sediment (m/sec) RHEIGHT 0 predicted ripple height (m) RLENGTH 0 predicted ripple length (m) C0A 0.02483 depth averaged reference concentration at z0 (kg/m^3) QS 0.5455 suspended sediment transport rate (kg/m/s) QSDIR 248 direction of suspended sediment transport (degree) SEDM 0.746 time-averaged net sediment transport as mass (kg/s/m) SED 2.815e-04 time-averaged net sediment transport as volume (m**3/s/m) SEDDIR 248 direction of net sediment transport (azimuth,degrees) AB 1.194e-04 excursion length of bottom wave orbit (m) WL 6.878 wave length (m) USTCRB 0.01687 critical shear vel for initi of bedload trans (m/sec) USTCRS 0.0276 critical shear vel for initi of suspended load transport (m/sec) USTUP 0.06501 critical shear vel for initn of sheet flow transport (m/sec) Z0C 0 apparent bed roughness length (m) PHIB 0 angle between wave and current directions (radians) PHI100 0 angle between wave and current directions at 1 m above seabed (radians) DELTACW 0 height of the wave-current boundary layer (m) USTCS 0.1085 current skin-friction shear velocity of GM (m/sec) USTWS 0 wave skin-friction shear velocity of GM (m/sec) USTCWSE 0 effective combined skin-friction shear velocity (m/sec) USTCWSB 0 transport-related combined shear velocity (m/sec) USTC 0.179 total current shear velocity of GM (m/sec) USTW 0 total wave shear velocity of GM (m/sec) RPLCOEF 1 ripple coefficient for shear velocity conversion TB1 0 time at which bedload transport ceases (sec) TB2 0 time at which bedload transport recommences (sec) TS1 0 time at which suspended load transport ceases (sec) TS2 0 time at which suspended load transport recommences (sec) PERBED 0 percentage of time spent in only bedload transport phase PERSUSP 100 percentage of time spent in suspended load transport phase C0 9.039 reference concentration at z0 (kg/m^3) TAOCWS 12.085 averaged effective shear stress (Pa) RHOW 1026 water density (kg/m3) VISC 0.001212 dynamic viscosity of water (Pa s) EXPECTED BEDFORMS ARE (Amos, 1990; Li & Amos, 1998): Medium sand (Wentworth scale) bedform types predicted based on SIB data of Li and Amos (1998); No transport and ripple height=0.000 m ripple length=0.000 m. The net Sediment transport rate is about 0.746 kg/s/m and the direction of net transport is 248 for location D.
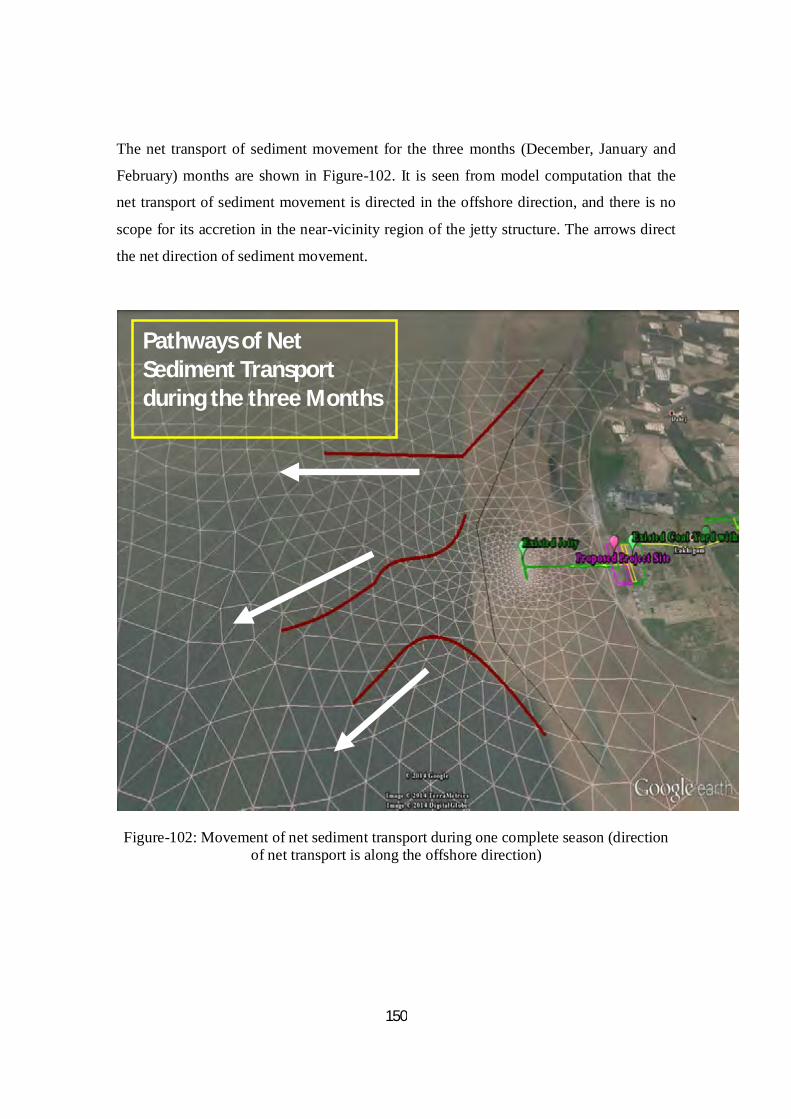
150
The net transport of sediment movement for the three months (December, January and
February) months are shown in Figure-102. It is seen from model computation that the
net transport of sediment movement is directed in the offshore direction, and there is no
scope for its accretion in the near-vicinity region of the jetty structure. The arrows direct
the net direction of sediment movement.
Figure-102: Movement of net sediment transport during one complete season (direction
of net transport is along the offshore direction)
Pathways of Net Sediment Transport during the three Months
151
COMMENTS AND RECOMMENDATIONS A comprehensive study was performed to assess and evaluate the hydrodynamics and
sediment transport modeling for Adani Petronet (Dahej) Port Private Limited for one
complete season. This study is a part of the capacity expansion for cargo handling that
includes additional storage area for stockpiles, new backup equipments and other
infrastructure facilities. Therefore, the modeling study incorporates this expansion plan
taking into account the area of reclaimed land and proposed expansion plan for the rubble
bund in the jetty structure. The dimension of approach trestle and rubble bund considered
in this study has a length of 1270 m and 1240 m respectively. This study considers the
proposed dimension of 60 m bund widening in the existing jetty structure. Hence, the
scope of this work includes hydrodynamic modeling to assess the changes in current
pattern, sediment transport due to proposed reclamation and bund widening, and changes
in shoreline associated with erosion and accretion.
This modeling study uses three state-of-art numerical models viz; ADCIRC (Advanced
Circulation), SWAN (Simulating Waves Nearshore) and SEDTRANS (Sediment
Transport) models. The ADCIRC model performs the hydrodynamic computation of
water level elevation and time varying current patterns associated with wind and tidal
forcing (along open ocean boundary). In the present study, all 13 tidal constituents is
prescribed along the open ocean boundary for the Gulf of Khambhat in order to achieve
free tidal propagation along the nearshore areas and the region of interest (Dahej Port).
The ADCIRC model was run for a period of 45 days to reach the spin-up time, and
thereafter this spin-up state was used as initial condition for the study domain used to
compute the net water level elevation and current pattern for one complete season. The
study was performed for the months of December 2013, January-March, 2014 that covers
one complete season to assess and evaluate the hydrodynamic conditions in the area of
interest. The SWAN model was used to assess and evaluate the wave conditions using
wind field and bathymetry as the primary input in stationary mode. Both ADCIRC and
SWAN were run in the same finite element grid structure, and resultant wave parameters
such as significant wave height, mean and peak wave period, mean wave direction was
used to understand the wave characteristics surrounding the jetty structure. The resultant

152
inputs from ADCIRC and SWAN models for one complete season was used in
SEDTRANS to evaluate the net sediment transport load and resultant transport direction
in the near vicinity of the jetty structure. The SEDTRANS model uses the hydrodynamic
and wave field parameters such as current speed and direction, wave height, period and
direction along with the bottom boundary layer parameters such as roughness length and
height and sediment characteristics. The resultant net sediment transport computed by
SEDTRANS was used to evaluate the effect of port expansion for one complete season.
Based on this study the following recommendations are made:
The area of interest near the jetty structure is strongly influenced by tidal action. The tidal
current exhibits a strong semi-diurnal pattern, and the relative magnitude of tidal flow is
quite strong both during the flood and the ebb phases of the tidal cycle. The relative
magnitude of ebb flow is stronger compared to the flood cycle. The study region being
strongly influenced by tidal action results in higher flushing of particulate matter
including suspended sediment loads. Taking into consideration the geometry of the study
domain and the area of interest due to limited fetch and shallow bathymetry, the wave
conditions that exist around the jetty location is relatively lower compared to the open
ocean boundary. The wave heights in the area of interest seldom exceeds 0.5 m. Due to
limited wave activity and shorter time periods the effect of suspension and transport by
waves are quite limited compared to the tidal action. In other words, the effect of waves
has marginal effect on the mechanics of sediment transport as compared to tidal currents.
The peak wave periods surrounding the jetty structure rarely exceeds 3.5 seconds. The
effect of long swells that travels from the open ocean boundary has hardly any effect in
the near vicinity of the jetty structure. This brings to light that the mechanics of sediment
transport in the near vicinity of jetty structure is dominated by tidal action, the dominant
environmental forcing responsible for net sediment transport and associated changes in
shoreline.
The computation from SEDTRANS using inputs from ADCIRC and SWAN models
show that the net sediment transport load vary from 0.3821 kg/s/m to 0.746 kg/s/m for
the period from December 2013 until March 2014. The resultant direction of net sediment

153
transport is directed in the range 248 - 306 which is between west-southwest and west-
northwest directions and directed in the offshore direction from the jetty structure. The
ebb phase of tidal cycle being stronger than the flood phase and that coupled with the net
offshore transport of sediments do not result in substantial variation in the shoreline due
to the expansion of port facility such as land reclamation and widening of the rubble
bund.