oil and gas: seacor holdings inc. annual report · seacor holdings inc. 2015 annual report industry...
TRANSCRIPT
SEACOR Holdings Inc.
2015 Annual Report
Industry Annual Report 1983
“Dramatic declines in drill rig utilization, combined with substantial vessel oversupply continue to curtail U.S. Gulf market opportunities. During the year, the company layed off 368 area employees, closed its Cameron, Louisiana office and transferred 24 vessels to more profitable foreign markets.”
Oil and gas: Debt fears
flare up “…potential losses are lurking in some of the large state-controlled
national oil companies in emerging economies,
including PDVSA of Venezuela and Petrobras
of Brazil, according to Moody’s, another rating agency. Both
companies have large debt maturities looming
in 2016-17: $12.6bn for PDVSA and $23bn
for Petrobras.”
Debt fuelled the US oil boom“The surge in US crude production since 2009 has been accompanied by a sharp rise in oil companies’ debts”
Financial TimesMarch 21, 2016
Fed Still Waving Caution Flag on Resuming Interest Rate Increases
The New York TimesApril 6, 2016
Net lending set to fall over next three years for offshoreBanks are recoiling from the offshore carnage and only long-term relations may make the difference for owners“In terms of consolidation, some of the banks are willing to force it but about two-thirds say they ‘would rather leave the consolidation initiative to the sector players than be the driving force’. ”
TradewindsMarch 3, 2016
Fears grow over effect of negative rates on economy
Financial TimesApril 11, 2016
Crises converge in Iraq
cash squeeze“Some 3.3m displaced people have found themselves squeezed between humanitarian and security crises as falling oil prices mean Baghdad runs out of cash while the west is slow to cough up more.”
Financial Times, Asia EditionApril 4, 2016
MEXICO Smog
Chokes Capital
“Authorities ordered more than a fifth of
private vehicles off the road in the capital and offered free subway and light-train rides
to clear the air on the third straight day
of emergency pollution measures.”
Wall Street JournalMarch 18, 2016
Updating Offshore Drillers and OSVs Estimates and PTs“While the equities have already lost significant value during this downturn, we see oversupply for offshore rigs and vessels lasting through 2018 or perhaps longer if commodities remain depressed..."
COWEN AND COMPANYMarch 21, 2016
Flood Spreads Through the
St. Louis Region“It has been more than
20 years since such extensive flooding
has hit the St. Louis region…The Mississippi
River was expected to crest Thursday in
downtown St. Louis at 43.7 feet, nearly 14 feet over flood stage. That would be the second
highest crest on record, nudging aside the April 1973 flood of 43.2 feet. The forecast crest still would be about 6 feet lower than the record from Aug. 1, 1993.”
St. Louis Post-DispatchDecember 30, 2015
ASG report dives deep into
bizav data“...‘we’re dealing with
first-time sellers that we once dealt with as first-time buyers.’… ‘When
oil hit $50 [a barrel] there was a dramatic effect and it became a buyer’s market.’ ”
AINonlineApril 12, 2016
After Record Year, Shanghai Hawker Pacific
Looks to ExpandAINonline
April 11, 2016
Venezuela teeters on the edge of chaos
“Venezuela has the world’s fastest inflation and its dire recession is worsening. Mr Maduro
last week declared every Friday a holiday for the next two months to save electricity as a prolonged drought
has exacerbated power shortages. There is a lack of basic goods. Analysts warn that the economic
crisis risks turning into a humanitarian one.”
Financial TimesApril 10, 2016
Peabody, world’s
top private coal miner,
files for bankruptcy
St. Louis Post-DispatchApril 13, 2016
2200 Eller DriveP.O. Box 13038Fort Lauderdale, Florida 33316(954) 523 2200
www.seacorholdings.com
China Deploys Fighters to S.
China Sea IslandThe Maritime Executive
April 12, 2016
“Ten commandments – 179 words. Gettysburg address – 286 words.
US Declaration of Independence – 1,300 words. EU regulations
on the sale of cabbage – 26,911 words”
Financial TimesApril 14, 2016
Big US banks pump up provisions for
energy lossesFinancial Times
April 15, 2016
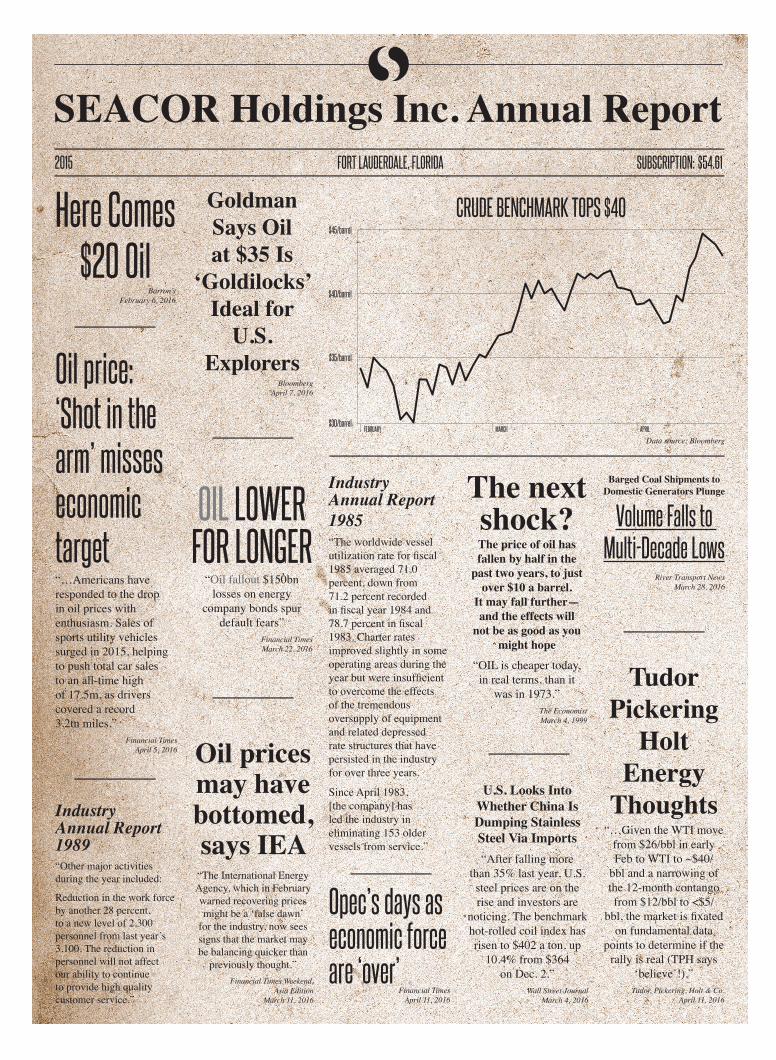
Here Comes $20 Oil
Barron’sFebruary 6, 2016
U.S. Looks Into Whether China Is Dumping Stainless Steel Via Imports“After falling more
than 35% last year, U.S. steel prices are on the rise and investors are
noticing. The benchmark hot-rolled coil index has risen to $402 a ton, up
10.4% from $364 on Dec. 2.”
Wall Street JournalMarch 4, 2016
Industry Annual Report 1985 “The worldwide vessel utilization rate for fiscal 1985 averaged 71.0 percent, down from 71.2 percent recorded in fiscal year 1984 and 78.7 percent in fiscal 1983. Charter rates improved slightly in some operating areas during the year but were insufficient to overcome the effects of the tremendous oversupply of equipment and related depressed rate structures that have persisted in the industry for over three years.
Since April 1983, [the company] has led the industry in eliminating 153 older vessels from service.”
OIL LOWER FOR LONGER
“Oil fallout $150bn losses on energy
company bonds spur default fears”
Financial Times March 22, 2016
The next shock?The price of oil has fallen by half in the
past two years, to just over $10 a barrel.
It may fall further—and the effects will
not be as good as you might hope
“OIL is cheaper today, in real terms, than it
was in 1973.” The EconomistMarch 4, 1999
Industry Annual Report 1989
“Other major activities during the year included:
Reduction in the work force by another 28 percent, to a new level of 2,300 personnel from last year’s 3,100. The reduction in personnel will not affect our ability to continue to provide high quality customer service.”
Oil prices may have bottomed, says IEA
“The International Energy Agency, which in February warned recovering prices might be a ‘false dawn’
for the industry, now sees signs that the market may be balancing quicker than
previously thought.”Financial Times Weekend,
Asia EditionMarch 11, 2016
Tudor Pickering
Holt Energy
Thoughts“…Given the WTI move
from $26/bbl in early Feb to WTI to ~$40/
bbl and a narrowing of the 12-month contango from $12/bbl to <$5/
bbl, the market is fixated on fundamental data
points to determine if the rally is real (TPH says
‘believe’!).”Tudor, Pickering, Holt & Co.
April 11, 2016
Oil price: ‘Shot in the arm’ misses economic target“…Americans have responded to the drop in oil prices with enthusiasm. Sales of sports utility vehicles surged in 2015, helping to push total car sales to an all-time high of 17.5m, as drivers covered a record 3.2tn miles.”
Financial TimesApril 5, 2016
Goldman Says Oil at $35 Is
‘Goldilocks’ Ideal for
U.S. Explorers
BloombergApril 7, 2016
SEACOR Holdings Inc. Annual Report2015 SUBSCRIPTION: $54.61FORT LAUDERDALE, FLORIDA
$30/barrel
$40/barrel
$45/barrel
$35/barrel
FEBRUARY MARCH APRIL
CRUDE BENCHMARK TOPS $40
Data source: Bloomberg
Opec’s days as economic force are ‘over’
Financial TimesApril 11, 2016
Barged Coal Shipments to Domestic Generators Plunge
Volume Falls to Multi-Decade Lows
River Transport NewsMarch 28, 2016
SHAREHOLDER INFORMATION PRINCIPAL EXECUTIVE OFFICE SEACOR Holdings Inc. 2200 Eller Drive P.O. Box 13038 Fort Lauderdale, Florida 33316www.seacorholdings.com
MARKET INFORMATION The Company’s stock trades on the NYSE under the ticker symbol CKH.
TRANSFER AGENT AND REGISTRAR American Stock Transfer & Trust Company 6201 15th Avenue Brooklyn, New York 11219www.amstock.com
INDEPENDENT REGISTEREDCERTIFIED PUBLIC ACCOUNTING FIRM Ernst & Young LLP 5100 Town Center Circle Suite 500 Boca Raton, Florida 33486www.ey.com
COUNSEL Milbank, Tweed, Hadley & McCloy LLP 28 Liberty Street New York, New York 10005www.milbank.com
ANNUAL MEETING The 2016 Annual Meeting of Stockholders will be held at the Ritz-Carlton – Fort Lauderdale,1 N Fort Lauderdale Beach Blvd., Fort Lauderdale, FL 33304, on Wednesday, June 1, 2016, at 9:00 a.m. Eastern Time.
ADDITIONAL INFORMATION SEACOR’s Annual Report on Form 10-K and other Company SEC filings can be accessed on the SEACOR Holdings Inc. website, www.seacorholdings.com, in the “Investors” section.
© 2016 SEACOR Holdings Inc.
BOARD OF DIRECTORS
CHARLES FABRIKANT*Executive Chairman and Chief Executive OfficerSEACOR Holdings Inc.
OIVIND LORENTZENVice ChairmanSEACOR Holdings Inc.
DAVID R. BERZRetired PartnerWeil, Gotshal & Manges LLP
PIERRE DE DEMANDOLXGeneral PartnerDPH Conseils
ANDREW R. MORSE 1
Managing Director andSenior Portfolio ManagerMorse, Towey and White
R. CHRISTOPHER REGANCo-Founder and Managing DirectorThe Chartis Group
DAVID M. SCHIZERDean Emeritus and The Harvey R. Miller Professor of Law and EconomicsColumbia Law School
STEVEN J. WISCHChairmanChannel Control Merchants, LLC
SENIOR MANAGEMENT
CORPORATE
EVAN BEHRENSSenior Vice PresidentBusiness DevelopmentSEACOR Holdings Inc.
MAX BUIRSKIVice PresidentSEACOR Holdings Inc.
MATTHEW R. CENAC* Executive Vice President and Chief Financial OfficerSEACOR Holdings Inc.
ERIC FABRIKANT*Chief Operating OfficerSEACOR Holdings Inc.
Chief Executive OfficerSEACOR Ocean Transport Inc.
WILLIAM C. LONG*Executive Vice PresidentChief Legal Officer and Corporate SecretarySEACOR Holdings Inc.
LISA MANEKINTreasurerSEACOR Holdings Inc.
SCOTT WEBERVice PresidentFinanceSEACOR Holdings Inc.
BRUCE WEINS*Senior Vice President and Chief Accounting OfficerSEACOR Holdings Inc.
OFFSHORE MARINE SERVICES
JOHN GELLERT*Chief Operating OfficerSEACOR Holdings Inc.
PresidentSEACOR Marine Holdings Inc.
ROBERT CLEMONSVice PresidentSEACOR Marine Holdings Inc.
JESÚS LLORCAVice PresidentSEACOR Holdings Inc.
Executive Vice PresidentSEACOR Marine Holdings Inc.
ANTHONY WELLERManaging DirectorSEACOR Offshore Dubai (L.L.C.)
INLAND RIVER SERVICES
TIMOTHY POWERPresidentSCF Marine Inc.
SHIPPING SERVICES
DANIEL J. THOROGOODVice PresidentSEACOR Holdings Inc.
President SEACOR Ocean Transport Inc.
*Executive Officer1Lead Director
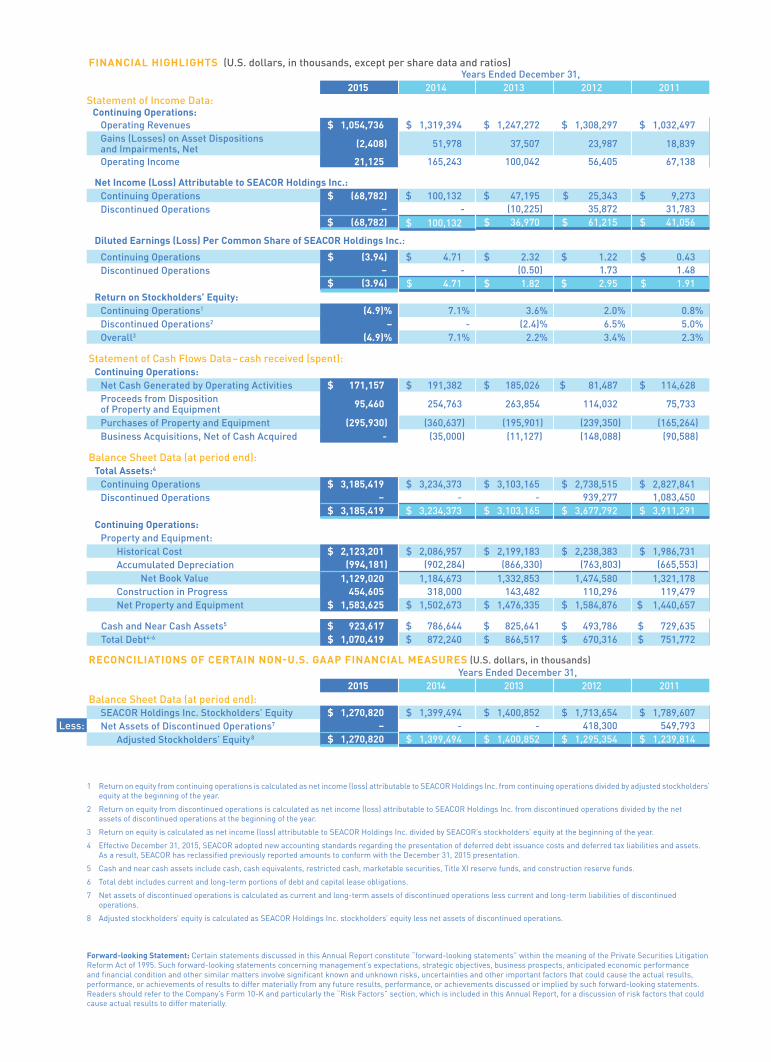
FINANCIAL HIGHLIGHTS (U.S. dollars, in thousands, except per share data and ratios)Years Ended December 31,
2015 2014 2013 2012 2011Statement of Income Data:
Continuing Operations:Operating Revenues $ 1,054,736 $ 1,319,394 $ 1,247,272 $ 1,308,297 $ 1,032,497 Gains (Losses) on Asset Dispositions and Impairments, Net (2,408) 51,978 37,507 23,987 18,839
Operating Income 21,125 165,243 100,042 56,405 67,138
Net Income (Loss) Attributable to SEACOR Holdings Inc.:Continuing Operations $ (68,782) $ 100,132 $ 47,195 $ 25,343 $ 9,273 Discontinued Operations – - (10,225) 35,872 31,783
$ (68,782) $ 100,132 $ 36,970 $ 61,215 $ 41,056
Diluted Earnings (Loss) Per Common Share of SEACOR Holdings Inc.:
Continuing Operations $ (3.94) $ 4.71 $ 2.32 $ 1.22 $ 0.43Discontinued Operations – - (0.50) 1.73 1.48
$ (3.94) $ 4.71 $ 1.82 $ 2.95 $ 1.91Return on Stockholders’ Equity:
Continuing Operations1 (4.9)% 7.1% 3.6% 2.0% 0.8%Discontinued Operations2 – - (2.4)% 6.5% 5.0%Overall3 (4.9)% 7.1% 2.2% 3.4% 2.3%
Statement of Cash Flows Data–cash received (spent):Continuing Operations:
Net Cash Generated by Operating Activities $ 171,157 $ 191,382 $ 185,026 $ 81,487 $ 114,628Proceeds from Disposition of Property and Equipment 95,460 254,763 263,854 114,032 75,733
Purchases of Property and Equipment (295,930) (360,637) (195,901) (239,350) (165,264)Business Acquisitions, Net of Cash Acquired - (35,000) (11,127) (148,088) (90,588)
Balance Sheet Data (at period end):Total Assets:4
Continuing Operations $ 3,185,419 $ 3,234,373 $ 3,103,165 $ 2,738,515 $ 2,827,841 Discontinued Operations – - - 939,277 1,083,450
$ 3,185,419 $ 3,234,373 $ 3,103,165 $ 3,677,792 $ 3,911,291 Continuing Operations:
Property and Equipment:Historical Cost $ 2,123,201 $ 2,086,957 $ 2,199,183 $ 2,238,383 $ 1,986,731 Accumulated Depreciation (994,181) (902,284) (866,330) (763,803) (665,553)
Net Book Value 1,129,020 1,184,673 1,332,853 1,474,580 1,321,178 Construction in Progress 454,605 318,000 143,482 110,296 119,479 Net Property and Equipment $ 1,583,625 $ 1,502,673 $ 1,476,335 $ 1,584,876 $ 1,440,657
Cash and Near Cash Assets5 $ 923,617 $ 786,644 $ 825,641 $ 493,786 $ 729,635 Total Debt4-6 $ 1,070,419 $ 872,240 $ 866,517 $ 670,316 $ 751,772
RECONCILIATIONS OF CERTAIN NON-U.S. GAAP FINANCIAL MEASURES (U.S. dollars, in thousands)Years Ended December 31,
2015 2014 2013 2012 2011Balance Sheet Data (at period end):
SEACOR Holdings Inc. Stockholders’ Equity $ 1,270,820 $ 1,399,494 $ 1,400,852 $ 1,713,654 $ 1,789,607 Net Assets of Discontinued Operations7 – - - 418,300 549,793
Adjusted Stockholders’ Equity 8 $ 1,270,820 $ 1,399,494 $ 1,400,852 $ 1,295,354 $ 1,239,814
1 Return on equity from continuing operations is calculated as net income (loss) attributable to SEACOR Holdings Inc. from continuing operations divided by adjusted stockholders’ equity at the beginning of the year.
2 Return on equity from discontinued operations is calculated as net income (loss) attributable to SEACOR Holdings Inc. from discontinued operations divided by the net assets of discontinued operations at the beginning of the year.
3 Return on equity is calculated as net income (loss) attributable to SEACOR Holdings Inc. divided by SEACOR’s stockholders’ equity at the beginning of the year.
4 Effective December 31, 2015, SEACOR adopted new accounting standards regarding the presentation of deferred debt issuance costs and deferred tax liabilities and assets. As a result, SEACOR has reclassified previously reported amounts to conform with the December 31, 2015 presentation.
5 Cash and near cash assets include cash, cash equivalents, restricted cash, marketable securities, Title XI reserve funds, and construction reserve funds.
6 Total debt includes current and long-term portions of debt and capital lease obligations.
7 Net assets of discontinued operations is calculated as current and long-term assets of discontinued operations less current and long-term liabilities of discontinued operations.
8 Adjusted stockholders’ equity is calculated as SEACOR Holdings Inc. stockholders’ equity less net assets of discontinued operations.
Forward-looking Statement: Certain statements discussed in this Annual Report constitute “forward-looking statements” within the meaning of the Private Securities Litigation Reform Act of 1995. Such forward-looking statements concerning management’s expectations, strategic objectives, business prospects, anticipated economic performance and financial condition and other similar matters involve significant known and unknown risks, uncertainties and other important factors that could cause the actual results, performance, or achievements of results to differ materially from any future results, performance, or achievements discussed or implied by such forward-looking statements. Readers should refer to the Company’s Form 10-K and particularly the “Risk Factors” section, which is included in this Annual Report, for a discussion of risk factors that could cause actual results to differ materially.
Less:
SEACOR Holdings Inc. (“SEACOR”) for the first time in its history did not make a profit last year. Our operations did generate positive cash, although this is minimal solace. We incurred unusual expenses, $9.6 million, net of non-controlling interests and tax, for redeeming notes issued by our shipping business, and $32.3 million, net of tax, for the reclassification of our equity investment in Dorian LPG Ltd. (“Dorian”) as an investment in marketable securities.1 We also recognized impairment charges. We recorded a $9.4 million impairment charge, net of tax, for goodwill that was carried as an asset on our offshore marine segment’s balance sheet. We also recorded a $21.5 million impairment charge for SCFCo Holdings LLC (“SCFCo”), marking its equity investment to “fair value,” reflecting a recent history of operating losses and expectations of a continued weak market for barge demand in the Parana-Paraguay Waterway in South America. The aggregate cost of these charges was $72.8 million, or $4.17 per diluted share net of non-controlling interests and tax. We hope not to book additional write-downs of assets, but given the business environment, I make no promises.
Unfortunately, the severe and precipitous drop in the price of oil and natural gas, and the excessive order book for support vessels highlighted in our letters dating back to 2013, have impaled the offshore business. The 2013 letter warned of a “storm” on the horizon. Last year’s letter sounded a klaxon for a Category 4 hurricane. It turns out that our boats are sailing through a Category 5 storm. (If there were a Category 6 classification for hurricanes, it would apply to the storm pounding our business!) Last year’s characterization of the outlook for inland river transportation as “overcast” also underestimated the severity of the “weather system.” The barge industry is pushing against a strong current—Latin American grain exports. It is experiencing a difficult period, albeit not as bad as offshore.
The facts follow.
THE YEAR IN REVIEW: FINANCIAL HIGHLIGHTS
In 2015, SEACOR suffered a loss of $68.8 million, or $3.94 diluted loss per share, for a negative 4.9% return on beginning
1 The GAAP requirement to treat our ownership of Dorian as an equity method investment was a frustration about which I “vented” last year. As noted, had we been free to choose a reporting format, Dorian would have been carried as a marketable security at fair value. It is listed on the New York Stock Exchange. Due to SEACOR’s board representation dropping to less than 20%, we are now allowed to treat Dorian as an investment in a marketable security with the difference between our carrying value under the equity method of accounting and the price of Dorian’s listed shares at year end being reflected as a loss. It is more relevant that Dorian’s share price has drifted down, so our shares today would fetch $40 million less than when I signed last year’s letter. For information, our cost basis (including cash plus contributed net assets) in Dorian is about $125 million.
stockholders’ equity of almost $1.4 billion.2 This compares with last year’s profit in 2014 of slightly more than $100 million, or $4.71 diluted earnings per share, for a 7.1% return on beginning stockholders’ equity.
SEACOR's operations, including the non-controlling interest of partners, did manage to eke out slightly more than $171 million in cash.3 This cash and $95.5 million realized from sales of equipment, covered 90% of almost $296 million in capital expenditures for construction in progress and final payments for equipment delivered during 2015. The preponderance of our 2015 capital expenditures, approximately $125 million, and over 40% of our capital commitments, $172 million out of $412 million, relate to four Jones Act tank vessels. These outlays have been and continue to be funded by SEA-Vista, a venture in which we own 51%. SEA-Vista has a line of credit for this purpose (which required the redemption of the Title XI bonds referred to above).4
THE CARLYLE GROUP (“Carlyle”) TRANSACTION
The “highlight of the year” was the formation of our partnership with Carlyle. That transaction was described in our press release and 8-K filed on November 30, 2015. In summary, Carlyle invested in our offshore marine subsidiary, SEACOR Marine Holdings Inc. (“SMH”), via a convertible note. That note bears interest of 3.75 percent. As the press release noted, the transaction contemplates separating our businesses. SMH now operates within our holding company as a separate group, although it still relies on its parent company for financial and legal services, much as it would in a transition were it to be spun out as a dividend to shareholders. What we contemplate and what we do are different matters. Consummating a spinoff of SMH should not be considered a foregone conclusion.
The charts on the next page illustrate SEACOR’s transformation during the last five years. Serving offshore energy is a much smaller component of our business today. The book value of our assets in the offshore marine segment is now less than the book value of our other businesses, as well as its operating income before depreciation and amortization.
2 For details on the computation, see the Financial Highlights page. For additional corporate performance information, see Appendix I. At year-end there were 17,154,900 shares outstanding. Average shares outstanding for the year were 17,446,137. In most instances in this letter, numbers in excess of $100 million have been rounded to the nearest million.
3 Cash from operating activities and capital expenditures related to our non-controlling interest partners’ portion of SEA-Vista and Illinois Corn Processing was $25.4 million and $80.5 million, respectively. Our share of cash from operations and sales of assets covered 100% of capital expenditures. For additional information, see the Financial Highlights page.
4 The borrowing under this line of credit shows up on our consolidated balance sheet, but it carries no guarantee from our parent corporation or any of our subsidiaries other than SEA-Vista and its subsidiaries. Appendix II provides a schedule of all our capital commitments and construction in progress.
LETTER TO STOCKHOLDERS
Dear Fellow Stockholder,
APRIL 15, 2016
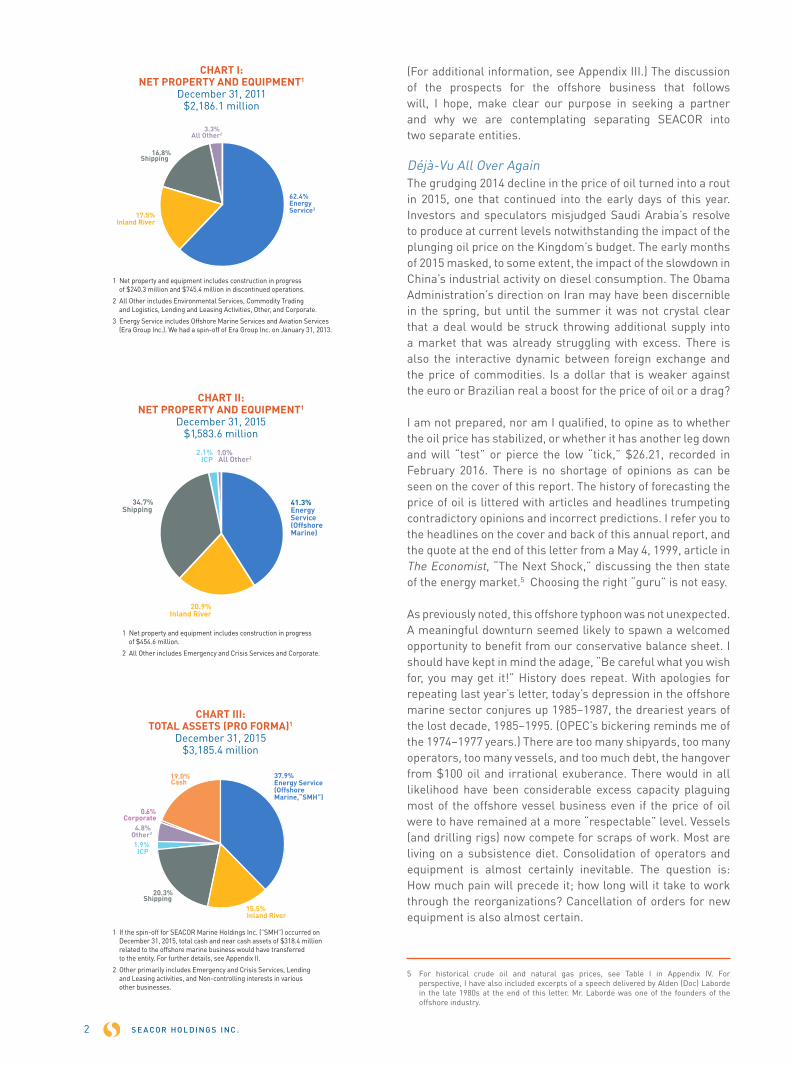
(For additional information, see Appendix III.) The discussion of the prospects for the offshore business that follows will, I hope, make clear our purpose in seeking a partner and why we are contemplating separating SEACOR into two separate entities.
Déjà-Vu All Over AgainThe grudging 2014 decline in the price of oil turned into a rout in 2015, one that continued into the early days of this year. Investors and speculators misjudged Saudi Arabia’s resolve to produce at current levels notwithstanding the impact of the plunging oil price on the Kingdom’s budget. The early months of 2015 masked, to some extent, the impact of the slowdown in China’s industrial activity on diesel consumption. The Obama Administration’s direction on Iran may have been discernible in the spring, but until the summer it was not crystal clear that a deal would be struck throwing additional supply into a market that was already struggling with excess. There is also the interactive dynamic between foreign exchange and the price of commodities. Is a dollar that is weaker against the euro or Brazilian real a boost for the price of oil or a drag?
I am not prepared, nor am I qualified, to opine as to whether the oil price has stabilized, or whether it has another leg down and will “test” or pierce the low “tick,” $26.21, recorded in February 2016. There is no shortage of opinions as can be seen on the cover of this report. The history of forecasting the price of oil is littered with articles and headlines trumpeting contradictory opinions and incorrect predictions. I refer you to the headlines on the cover and back of this annual report, and the quote at the end of this letter from a May 4, 1999, article in The Economist, “The Next Shock,” discussing the then state of the energy market.5 Choosing the right “guru” is not easy.
As previously noted, this offshore typhoon was not unexpected. A meaningful downturn seemed likely to spawn a welcomed opportunity to benefit from our conservative balance sheet. I should have kept in mind the adage, “Be careful what you wish for, you may get it!” History does repeat. With apologies for repeating last year’s letter, today’s depression in the offshore marine sector conjures up 1985–1987, the dreariest years of the lost decade, 1985–1995. (OPEC’s bickering reminds me of the 1974–1977 years.) There are too many shipyards, too many operators, too many vessels, and too much debt, the hangover from $100 oil and irrational exuberance. There would in all likelihood have been considerable excess capacity plaguing most of the offshore vessel business even if the price of oil were to have remained at a more “respectable” level. Vessels (and drilling rigs) now compete for scraps of work. Most are living on a subsistence diet. Consolidation of operators and equipment is almost certainly inevitable. The question is: How much pain will precede it; how long will it take to work through the reorganizations? Cancellation of orders for new equipment is also almost certain.
5 For historical crude oil and natural gas prices, see Table I in Appendix IV. For perspective, I have also included excerpts of a speech delivered by Alden (Doc) Laborde in the late 1980s at the end of this letter. Mr. Laborde was one of the founders of the offshore industry.
S E A COR HO L DI NG S I NC .2
62.4%EnergyService3
17.5%Inland River
16.8%Shipping
3.3%All Other2
CHART I: NET PROPERTY AND EQUIPMENT1
December 31, 2011$2,186.1 million
1 Net property and equipment includes construction in progress of $240.3 million and $745.4 million in discontinued operations.
2 All Other includes Environmental Services, Commodity Trading and Logistics, Lending and Leasing Activities, Other, and Corporate.
3 Energy Service includes Offshore Marine Services and Aviation Services (Era Group Inc.). We had a spin-off of Era Group Inc. on January 31, 2013.
CHART II: NET PROPERTY AND EQUIPMENT1
December 31, 2015$1,583.6 million
41.3%Energy Service(OffshoreMarine)
20.9%Inland River
2.1%ICP
34.7%Shipping
1.0%All Other2
1 Net property and equipment includes construction in progress of $454.6 million.
2 All Other includes Emergency and Crisis Services and Corporate.
37.9%Energy Service(OffshoreMarine,“SMH”)
15.5%Inland River
1.9%ICP
4.8%Other2
20.3%Shipping
19.0%Cash
0.6%Corporate
CHART III: TOTAL ASSETS (PRO FORMA)1
December 31, 2015$3,185.4 million
1 If the spin-off for SEACOR Marine Holdings Inc. (”SMH”) occurred on December 31, 2015, total cash and near cash assets of $318.4 million related to the offshore marine business would have transferred to the entity. For further details, see Appendix II.
2 Other primarily includes Emergency and Crisis Services, Lending and Leasing activities, and Non-controlling interests in various other businesses.
2015 A N N U A L R E P O R T 3
I would like to believe SEACOR prepared for the worst. Our balance sheet is strong. Fortunately, we abstained from purchasing expensive deep water support vessels, and, except for our standby safety business, we do not operate in the North Sea today, although we had a presence there 15 years ago. We have been deploying relatively small sums of capital. Over the past years most of our offshore group’s capital expenditures have been funded with proceeds from sales of equipment and cash flow from operations, or with tax deferred dollar reserves. Of course, owning any equipment at times like these is excruciatingly painful!
How to profit from this downturn? One option is to wait for better times and enjoy them when they arrive; they will arrive; the only question is “when”? Our Offshore Marine fleet, which last year produced an anemic $22.8 million of operating income before depreciation and amortization (“OIBDA”), has in prior years had much better yields, $102 million as the average for the past five. In order to provide some perspective, Table II in Appendix IV sets forth earnings by our different classes of vessels for the last five years. We have tried to adjust for differences in the fleet mix as it has shifted over time. When You Come To A Fork In The Road, Take It!”Doing nothing,” sitting back, and waiting for the upturn (and, when advantageous, shrinking our capital base), should eventually provide good (perhaps very good) returns on SMH’s almost $654 million net book value of equipment. (Insured value is just shy of $900 million.) We believe, however, that using our global presence and financial strength to participate in the consolidation of the industry should reward stockholders even more handsomely.
Offshore marine assets over the years have tended to change hands via corporate transactions rather than one-off sales or auctions at heavily discounted prices. Of course, we would welcome snatching assets at bargain basement levels, but owners or lenders who will sell for desperate consideration are rare. It is difficult for us to justify paying more than a token price for an asset—however intriguing its long-term potential—which could be idle for an indeterminate period, years during which it will consume cash. On the other hand, unless prodded by lenders, owners are reluctant to sell, and lenders are loath to liquidate loans, which, in better times, would in all likelihood recoup more of their principal. (The availability of cheap capital from central banks is a counterbalance to the pressure from regulators.) We believe transactions are likely to involve equity consideration, or equity-like securities (warrants or convertibles), or transfer of debt, rather than outright sales for cash.
With the foregoing in mind, we teamed up with Carlyle, adding cash and liquidity to an already strong SMH balance sheet, and an ally, in preparation for a possible spin-off of our offshore business. SMH, if spun out, would be one of a few, if not the only, publicly listed operator in the offshore boat sector, with a solid, liquid balance sheet, and a relationship with a strong financial partner. Our ideal opportunities would
be fleets, or parts of fleets, that overlap geographically with our operations. Such combinations should afford the chance to reduce operating overhead, and, if equipment were a match with our fleet profile, allow us to rationalize asset deployment. Having for the most part eschewed assets serving deepwater, now would be the time to add them to the fleet.6
Based on our experience from 1989–2005, consolidation should lead to improved margins. What we hope to do—and, what we can accomplish, are different matters. “It takes two to tango!” Quite often the equity owners, and holders of public debt, are beholden to lenders, banks, or insurance companies, which have priority claims on the asset or business. Sorting through the capital structure of a distressed situation takes time. As we embark on this journey, we will remember to temper ambition with discipline, protect our holding company and SMH’s balance sheets, and not sacrifice our own liquidity.7
OFFSHORE MARINE SERVICES (“SMH”)
In 2015, SMH incurred a segment loss of $32.7 million, a negative 4.1% return on average segment assets of almost $800 million, adjusted to eliminate $96.3 million of capital tied up in deposits for equipment and construction in progress (“CIP”).8 OIBDA was $22.8 million, including a $13.4 million goodwill impairment charge.9 This represented a 4.1% return on average net book value of almost $554 million and an extremely subpar 2.2% return on the average insured value of the owned fleet of $1,058 million.10 Over the last five years, OIBDA has ranged from $22.8 million to almost $154 million and, as previously noted, averaged $102 million, a return on net book value of equipment of 16.2% and 9.6% on insured value. Segment profit (loss) in the same time frame varied
6 A recent survey by a Norwegian broker estimated that over $12 billion of bank debt is outstanding on the Norwegian-owned supply boat fleet, covering approximately 630 vessels.
7 Looking back, from the 1980s through 2014, I and others have estimated that over 50 acquisitions and mergers involving companies operating workboats took place. SEACOR has been a party to many of these transactions and is one of twelve companies to have survived and prospered from the era of “Offshore Pac-Man.” I estimate that over 20 U.S.- based offshore boat companies succumbed to the ravages of the last bear market, and about 58 in the North Sea. If our count is not 100% accurate, it is more likely than not understating the casualties and numbers of combinations. Today, there are approximately 400 companies operating offshore marine vessels. The universe of “offshore marine vessels” (typically referred to as “work boats”) is nuanced. For some it includes seismic vessels, construction support vessels, pipe-laying vessels, as well as supply boats, crew boats, utility boats, liftboats, and other “varietals.” Table III in Appendix IV provides our best estimate of the number of vessels per location. Our table also highlights the number of production and drilling equipment per location. Please note, that there is no source that compiles this data for all our vessel types.
8 For details on the computations, see Appendix III. In discussing and attempting to measure the results of our business units, we adjust segment assets to eliminate construction in progress. Construction in progress varies year-to-year, and the capital doesn’t produce revenue until the equipment delivers. We calculate the returns on the adjusted segment assets by averaging the beginning and ending quarterly asset values during the period.
9 As of December 31, 2015, SMH, post-impairment, carried no goodwill as an asset. In addition to the $13.4 million impairment charge for goodwill, we had $7.1 million of impairment charges related to the suspended construction of two offshore support vessels, the removal from service of one leased-in offshore support vessel, and other marine equipment spares.
10 Insured value is not necessarily reflective of a price that could be realized by selling the assets. The difference between the current insured value of the fleet reported in last year’s letter of $1,009.9 million and the current insured value of $899.7 million reflects $165.5 million for depreciation and adjustments for changes in market circumstance, which was offset by the net boat additions of $55.4 million. As always, I caution that the insured value of our fleet is not indicative of what assets would realize if offered for sale in the market. In all of our segments, our calculation “averages” insured value at the beginning and end of each quarter during the year in order to reflect changes in fleet composition. We also calculate returns on net book value for every business based on averages.
from the 2015 loss of $32.7 million to a profit of $99.6 million and averaged $52.4 million.
As of December 31, 2015, SMH had $130 million committed to 15 joint ventures. These joint ventures control $602.8 million of net property and equipment at book value and contributed $8.8 million to SMH segment profit. The joint ventures collectively produced $84 million of OIBDA, our share being $32.9 million. The largest is Mantenimiento Express Maritimo, S.A.P.I. de C.V. (“MexMar”) that operates twelve vessels under Mexican flag.
In 2015, SMH laid out $87.8 million for capital expenditures, $17.5 million as final payment for equipment that delivered during the year and the balance for progress payments for vessels that it expects to place in service through 2019. We sold two vessels for $15.4 million (resulting in a modest $0.9 million gain). At year-end, the SMH balance sheet included approximately $95 million in construction in progress covering an order book of approximately $245 million for 17 new vessels.11
The SMH fleet is comprised of nine broad classes of assets as detailed in Charts IV to Chart VI and Table IV in Appendix IV. It is important to keep in mind that boats, even though essentially identical, for marketing purposes are different “SKUs” (stock keeping units, for those not familiar with retail jargon) if operating under different flags of registry or managed by local joint ventures. Table V in Appendix IV provides data on average rates per day worked and utilization statistics for our fleet by asset type for the last five years.
John Gellert and his team have worked hard to reduce expenses. In times such as our business now confronts, slashing costs begins with idling vessels or postponing surveys. In 2015, we expensed $17.8 million in survey and docking charges; this covered 33 dockings. Our vessels spent almost 942 days in repair facilities. Given limited prospects for employment, we deferred eleven dockings, and, in other instances, restricted work to only that essential to maintain certificates for trading. In addition to holding off on dockings, we have reduced headcount of our marine staff, shore-based supervisors, and administrative personnel. We have also stretched crew rotations and are implementing a reduction in wages in order to conserve dollars. Taking steps such as these is never easy, but it had to be done. During the first quarter of this year we have, unfortunately, had to make additional reductions to the work force, and more cuts are likely to come. Laying off personnel conserves cash and is necessary, but it is wrenching.
As of March 31, 2016, we had 26 vessels “stacked” (parked). Table VI in Appendix IV provides detail. Twelve of our idle vessels retain certification, but as surveys fall due we will have to decide whether to spend cash to maintain them in
11 The equipment on order includes eight U.S.-flag, DP-2 fast support vessels (“FSVs”), one of which was committed to purchase after December 31, 2015; four U.S.-flag, DP-2 supply vessels; two foreign-flag specialty vessels; and three foreign-flag wind farm utility vessels.
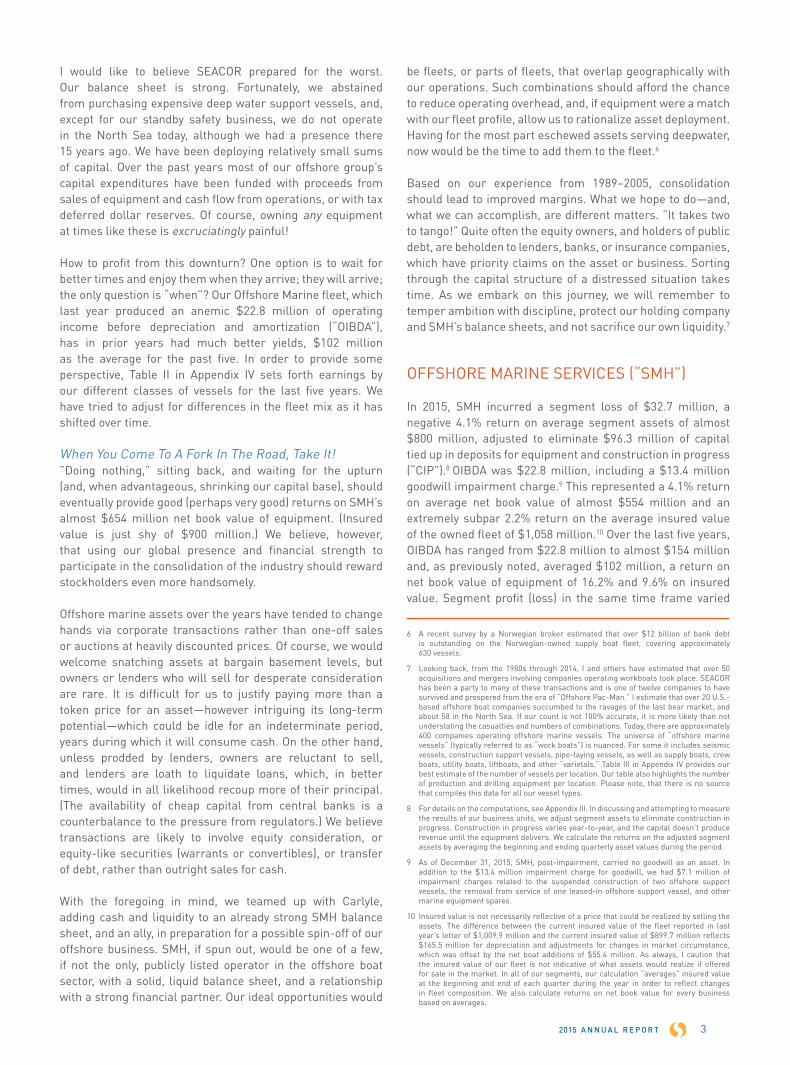
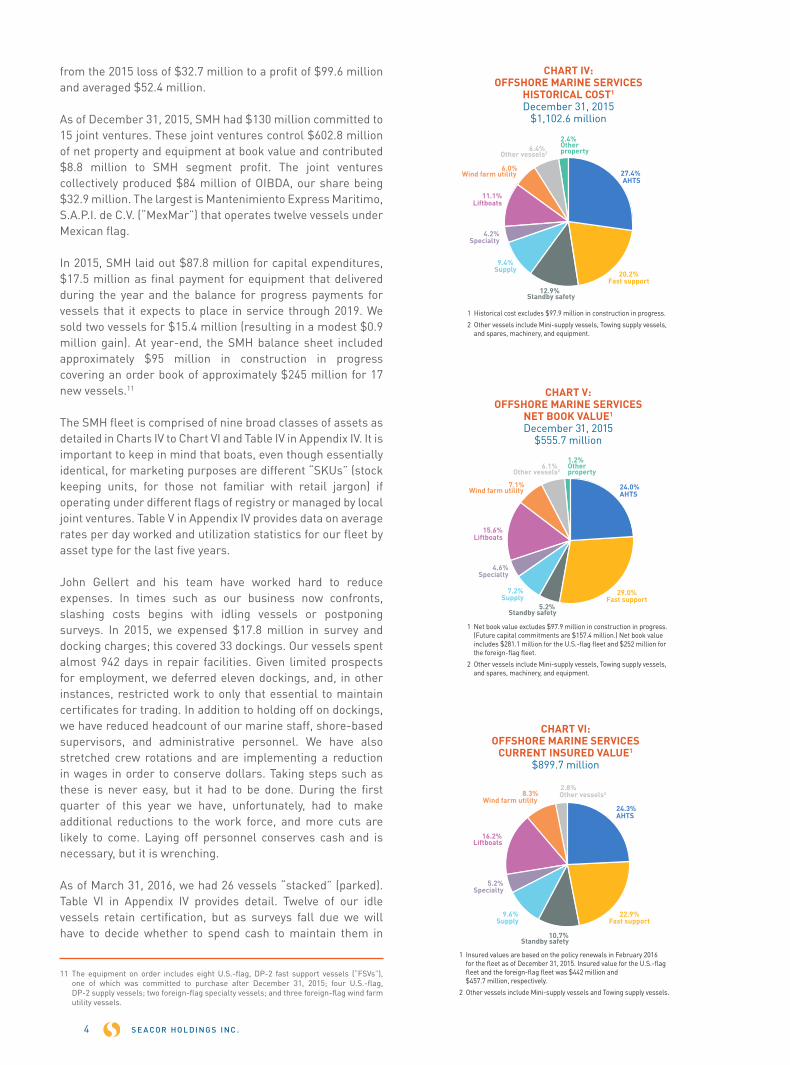
CHART VI: OFFSHORE MARINE SERVICES
CURRENT INSURED VALUE1
$899.7 million
24.3%AHTS
22.9%Fast support
9.6%Supply
5.2%Specialty
10.7%Standby safety
2.8%Other vessels28.3%
Wind farm utility
16.2%Liftboats
1 Insured values are based on the policy renewals in February 2016 for the fleet as of December 31, 2015. Insured value for the U.S.-flag fleet and the foreign-flag fleet was $442 million and $457.7 million, respectively.
2 Other vessels include Mini-supply vessels and Towing supply vessels.
CHART V: OFFSHORE MARINE SERVICES
NET BOOK VALUE1
December 31, 2015$555.7 million
24.0%AHTS
29.0%Fast support
7.2%Supply
4.6%Specialty
5.2%Standby safety
6.1% Other vessels2
1.2%Other property
7.1%Wind farm utility
15.6%Liftboats
1 Net book value excludes $97.9 million in construction in progress. (Future capital commitments are $157.4 million.) Net book value includes $281.1 million for the U.S.-flag fleet and $252 million for the foreign-flag fleet.
2 Other vessels include Mini-supply vessels, Towing supply vessels, and spares, machinery, and equipment.
27.4%AHTS
20.2%Fast support
9.4%Supply
4.2%Specialty
12.9%Standby safety
6.4% Other vessels2
2.4%Other property
6.0%Wind farm utility
11.1%Liftboats
1 Historical cost excludes $97.9 million in construction in progress.
2 Other vessels include Mini-supply vessels, Towing supply vessels, and spares, machinery, and equipment.
S E A COR HO L DI NG S I NC .4
ready state when there is no visible prospect for employment. We estimate that the cost for keeping a vessel in reasonable condition while idle ranges from $10,000 to $200,000 per year depending on location and timing of required surveys and magnitude of work necessary. Some vessels have the potential to earn back this kind of expense quickly, when demand improves, and some will be wallflowers. We do our best to pick and choose those in which dollars will most quickly be returned. In prior downturns, allowing certification to lapse was an obvious decision; today it is more complicated. Classification societies, the overseers of vessel condition, no longer “toll” days out of service when determining required dates for a “survey.” Whether operating or idle, the clock runs. Vessels must undergo a special survey every five years. This entails an inspection of the hull (structural members and shell) and machinery. During the 60-month period at an interval of no more than 36 months, an inspection of bottom plate and critical underwater elements (propeller and tail shaft) must also be carried out. A survey for a vessel working in humid climates in regions such as Asia, the Gulf of Mexico, Caribbean, or West Africa, tends to be quite expensive. Even idle, dollars must be spent. It can be expensive to lay up and maintain equipment when not in active service, particularly in remote regions, such as West Africa. I would anticipate getting vessels back into the market after extended “rest periods” will be quite costly. Table III in Appendix IV summarizes the global fleet and provides data reflecting our estimates of vessels laid-up in the United States and North Sea. Information relating to boats in West Africa, Middle East, and Asia is more difficult to assemble. Also note that there may well be more vessels idle than we report. In the aggregate, we believe that 385 of roughly 717 vessels (of all types) in the U.S. Gulf are stacked. I have heard others estimate 450-500. Finding a safe berth or tie up space is not easy and “free parking” is only available on the “Monopoly” board.
The competition in some regions for jobs has become so keen that some operators are willing to take multi-year contracts at day rates that appear, to us, to be below actual running costs, particularly when factoring in surveys that will have to be undertaken during the contract term. Our focus is on cash, but we will not scrounge for business at marginal rates and take jobs requiring us to offer options that could forego dollars in the future for pennies today. (Nickels and dimes are a different story.)
The Outlook: DismalMy skepticism was not sufficient to cause me to buy a bulletproof vest to protect against sub $30 per barrel oil. State-owned oil companies are scrambling to deliver cash to prop up national treasuries. “Super majors” have been forced to rein in expenditures to protect dividends and balance sheets. The money that customers can afford to spend appears to be earmarked for completing projects, which, for relatively little incremental cash, can be turned into current revenue. Seismic surveys, drilling, end-of-life decommissioning, and construction projects are, for the most part, on hold. The challenge in finding work today is even greater than in the
1980s, because our customer base has consolidated. As if the foregoing worries were not sufficient to cause a migraine, customers such as PEMEX are stretching payment terms. Effectively, boat owners are being pushed to fund their clients, an additional strain on our balance sheets. It is expensive to carry customer receivables for months and another reason to maintain liquidity.
Much as optimism is abundant in good times, pessimism is fashionable when times are tough. Some may credit incorrect forecasts due to excessive pessimism as sage and judicious, and judge those who miss the mark due to undue optimism as naïve or foolish. As far as I am concerned: “wrong” is “wrong,” although the consequence of missed opportunity is rarely as dire as that of betting aggressively when outcomes are worse than anticipated. As I stated at the outset of this letter, I have no predictions. I will, however, “stick my neck out” and offer scenarios, some mentioned in last year’s letter, and new “fantasies” that could eventually improve our business, even if the price of oil were to remain “weak” (whatever “weak” means).
Countries that depend on revenues from oil production appear to me to be caught between the proverbial "rock and a hard place." I wonder for how long state-owned oil companies can hold off spending money and opt to ignore depletion and favor national treasuries. They are caught in a vicious circle. The instinct of producers, whether “for profit” businesses or national oil companies, has been to trim investment in drilling for development and exploration, and to skimp on maintenance. If money is not reinvested the oil eventually runs out, although that could take many years. An investor-owned enterprise can liquidate. That does not seem to be a good option for a national government. If oil prices do not rebound, state-owned oil companies must ultimately sell more barrels to generate revenue, or increase borrowing, or their national shareholders will be obliged to cut back on essential spending. The choice is to allow a state-owned company to reinvest, reducing funds available to fund government programs (and maybe add to a glut), or, continue to restrict investment possibly allowing output, and revenues, to embark on a long-term death spiral. A Hobson's choice. The $64,000 questions are: What is the cost of finding a new barrel of oil in Brazil, West Africa, Mexico, and the deep waters of the Gulf of Mexico; and, how long can national oil companies divert cash flow to government coffers without killing the goose?
I also wonder if Iran can increase its output without upgrading its equipment. (As Americans, we cannot work there, but increased activity anywhere is a plus.) I believe Venezuela is one year closer to chaos, and new leadership will eventually invite international oil companies to help restore production. Cuba is also likely to be a different place in five years, and India appears to be using more energy, as are some African countries. Brazil has to work through a political quagmire, but it will probably follow Mexico and open up acreage to international oil companies. With a particularly cheap
2015 A N N U A L R E P O R T 5
currency and a large labor force, is Brazil likely to permit production to drop significantly requiring it to use foreign exchange reserves to import crude?12
Even prior to an increase in activity, I would expect there will be some improvement in rates and margins for those vessels that are available and are certificated for work, particularly in regions such as West Africa. (Utilization is a different matter.) Investing cash to keep vessels in ready state without work is a luxury few in our industry can afford. Once idle, spending sacred dollars to return a vessel to active service has to be weighed against the prospects for work and probable rate and mobilizing vessels for short-term work usually does not pay. As more equipment is withdrawn from service, actively marketed vessels, and demand, as minimal as it may be, should come into balance. This should be the case particularly for “spot” jobs of short duration. Drilling, whether exploratory or developmental, may have all but ceased, but production continues. Personnel have to be transported. Fields have to be secured. Safety rules have to be met. Supplies must be carried to fixed platforms and floating production storage and offloading units ("FSPOs"). Our fleet is well-suited for these missions. Of course, boats that were preferred for supporting drilling operations are now scrambling for work in production. However, there are limits to the fungibility of boats. For example, large platform supply vessels (“PSVs”) with high freeboard and thirsty main engines do not adapt well to standby safety duties in the North Sea. They are also less than ideal for delivering cargo to older platforms or jack-up rigs, which can be more easily damaged than would be the case if struck by a smaller vessel. Large PSVs also tend to pay higher fees when entering ports which often charge by gross registered ton.
Notwithstanding the grim prognosis for 2016, John Gellert hopes (no promises) to squeeze cash out of operations. Our geographical reach is mirrored by only one competitor; we can operate everywhere with the exception of Iran. SMH’s fleet is among the most diverse in the industry, if not the most diverse. We, together with our joint venture partners, operate vessels documented under U.S., Brazilian, or Mexican flag.13
About 20 years ago an investor asked me: “What keeps you up at night?” I worry about China’s economy. I ponder electric cars taking market share from internal combustion models. I think about the eventual impact of cheaper solar energy and wind, particularly when harnessed to batteries. I wonder how much capital investment shale will grab from offshore Gulf of Mexico. Juxtaposed to these concerns is a belief that, for the foreseeable future, the number of cars that use gasoline will increase, that natural gas will be a preferred input for electricity, and that over time more kilowatts will be needed. Shale drilling is not alone in benefitting from improved technology.
12 According to the U.S. Energy Information Administration, Brazil consumed slightly more barrels than it produced in 2014. It is the ninth largest producer of oil in the world.
13 Appendix VI provides a global fleet profile by year of delivery for anchor handling towing supply vessels and platform supply vessels as well as a profile of the U.S.-flag offshore vessels in service by year of delivery.
We have highlighted in Table I of Appendix IV those years since 1984 in which the price of oil has had an almost 100% variation. There have been seven years, about 20%.
In a speech about the war of attrition being waged on service providers a colleague, who has participated in the industry almost from its inception, concluded a recent speech with a wry comment: “40 years of experience [in the industry] are inadequate. I don’t know how long the road to recovery [is]! Try to enjoy the roller coaster ride!” Not many experts, if any, anticipated the virility of this downturn three years ago. Few now are ready to debunk the consensus of “lower for longer”? A friend recently reminded me of an aphorism by Miles Kington: “Knowledge is knowing that a tomato is a fruit, wisdom is not putting it in fruit salad.”
INLAND RIVER SERVICES (“SCF”)
In 2015, SCF recorded a segment loss of $1.5 million, a lame negative 0.3% return on adjusted segment assets of slightly more than $505 million. The $21.5 million impairment charge for SCFCo marred what would otherwise have been a satisfactory year. Without this charge, SCF would have contributed a segment profit of $20 million. OIBDA was $61.8 million, which is a 12.4% return on the approximately $499 million of insured value of its assets and a 19.3% return on about $320 million of net book value.14 For the last five years, OIBDA ranged from $54.2 million to $92.0 million and averaged $65.5 million, effectively a 19.1% return on net book value and an 11.9% return on insured value. Segment results for the five years ranged from this year’s loss of $1.5 million to a profit of $65.8 million and averaged $30.2 million.
SCF has $81.4 million invested in joint ventures.15 They collectively produced $18.8 million of OIBDA and carry equipment on their books for slightly less than $200 million.Our share is 50%. SCF’s largest commitment of $57.4 million is in SCFCo, which operates barges in South America.16
During 2015, SCF sold 35 10,000 barrel liquid tank barges for $37.7 million recognizing a gain of $11 million. It also disposed of twelve deck barges for $6.6 million recognizing a small gain, and sold and leased back four towboats generating
14 For details on the computations, see Appendix III. The current insured value for the owned fleet is just under $470 million.
15 For further details about our inland joint ventures, see Appendix V.
16 Inland River’s joint ventures collectively carry $63.6 million of debt. SCFCo has modest third party debt, $20.7 million to commercial banks as of December 31, 2015. It is cash flow positive, but struggling in a market that has too many operators and too many barges. SCFCo owns 258 barges, average age of 13 years, net book value of $114.2 million and insured value of $113.4 million, and 13 towboats with an average book value of $54.7 million and insured value of $54.3 million. These assets operate on the Hidrovia Parana-Paraguay Waterway, which touches Bolivia, Brazil, Paraguay, Uruguay, and Argentina. The dry-cargo fleet in the Hidrovia system includes approximately 2,300 barges operated by 15 different owners. More than 50% of the fleet, apart from InterBarge’s equipment, is more than 25 years old. The primary cargoes moving on this river system today are iron ore that feeds Argentina’s steel mills or is transshipped for export to Europe, grain originating in Paraguay and Bolivia, and refined petroleum products imported for local consumption. We are focused on reducing costs and improving operating efficiency. As in the offshore business, consolidation is necessary and, if effected, it should improve the outlook, but there is no immediate relief in sight. One of our larger competitors is undergoing a financial restructuring. It operates a very old fleet, and hopefully these assets will retire. Taking a longer view, I expect the Hidrovia to be a major water highway for moving exports and imports into the southern countries of Latin America.
S E A COR HO L DI NG S I NC .6
2015 A N N U A L R E P O R T 7
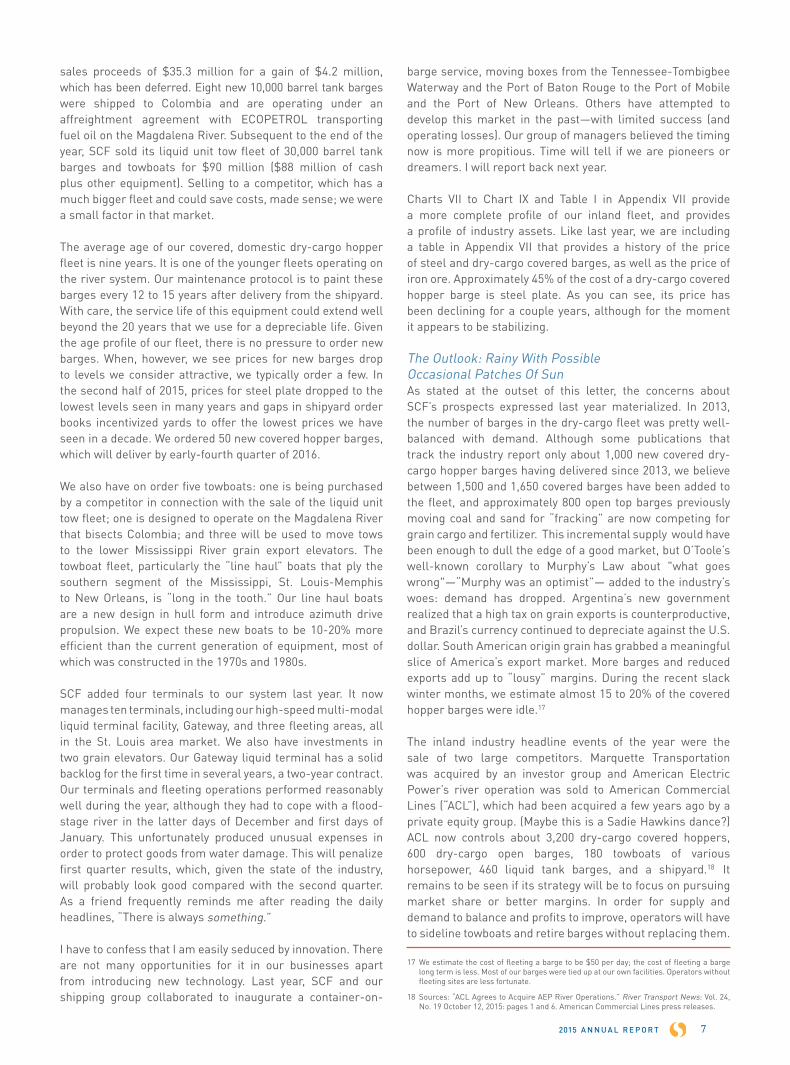
sales proceeds of $35.3 million for a gain of $4.2 million, which has been deferred. Eight new 10,000 barrel tank barges were shipped to Colombia and are operating under an affreightment agreement with ECOPETROL transporting fuel oil on the Magdalena River. Subsequent to the end of the year, SCF sold its liquid unit tow fleet of 30,000 barrel tank barges and towboats for $90 million ($88 million of cash plus other equipment). Selling to a competitor, which has a much bigger fleet and could save costs, made sense; we were a small factor in that market.
The average age of our covered, domestic dry-cargo hopper fleet is nine years. It is one of the younger fleets operating on the river system. Our maintenance protocol is to paint these barges every 12 to 15 years after delivery from the shipyard. With care, the service life of this equipment could extend well beyond the 20 years that we use for a depreciable life. Given the age profile of our fleet, there is no pressure to order new barges. When, however, we see prices for new barges drop to levels we consider attractive, we typically order a few. In the second half of 2015, prices for steel plate dropped to the lowest levels seen in many years and gaps in shipyard order books incentivized yards to offer the lowest prices we have seen in a decade. We ordered 50 new covered hopper barges, which will deliver by early-fourth quarter of 2016.
We also have on order five towboats: one is being purchased by a competitor in connection with the sale of the liquid unit tow fleet; one is designed to operate on the Magdalena River that bisects Colombia; and three will be used to move tows to the lower Mississippi River grain export elevators. The towboat fleet, particularly the “line haul” boats that ply the southern segment of the Mississippi, St. Louis-Memphis to New Orleans, is “long in the tooth.” Our line haul boats are a new design in hull form and introduce azimuth drive propulsion. We expect these new boats to be 10-20% more efficient than the current generation of equipment, most of which was constructed in the 1970s and 1980s.
SCF added four terminals to our system last year. It now manages ten terminals, including our high-speed multi-modal liquid terminal facility, Gateway, and three fleeting areas, all in the St. Louis area market. We also have investments in two grain elevators. Our Gateway liquid terminal has a solid backlog for the first time in several years, a two-year contract. Our terminals and fleeting operations performed reasonably well during the year, although they had to cope with a flood-stage river in the latter days of December and first days of January. This unfortunately produced unusual expenses in order to protect goods from water damage. This will penalize first quarter results, which, given the state of the industry, will probably look good compared with the second quarter. As a friend frequently reminds me after reading the daily headlines, “There is always something.”
I have to confess that I am easily seduced by innovation. There are not many opportunities for it in our businesses apart from introducing new technology. Last year, SCF and our shipping group collaborated to inaugurate a container-on-
barge service, moving boxes from the Tennessee-Tombigbee Waterway and the Port of Baton Rouge to the Port of Mobile and the Port of New Orleans. Others have attempted to develop this market in the past—with limited success (and operating losses). Our group of managers believed the timing now is more propitious. Time will tell if we are pioneers or dreamers. I will report back next year.
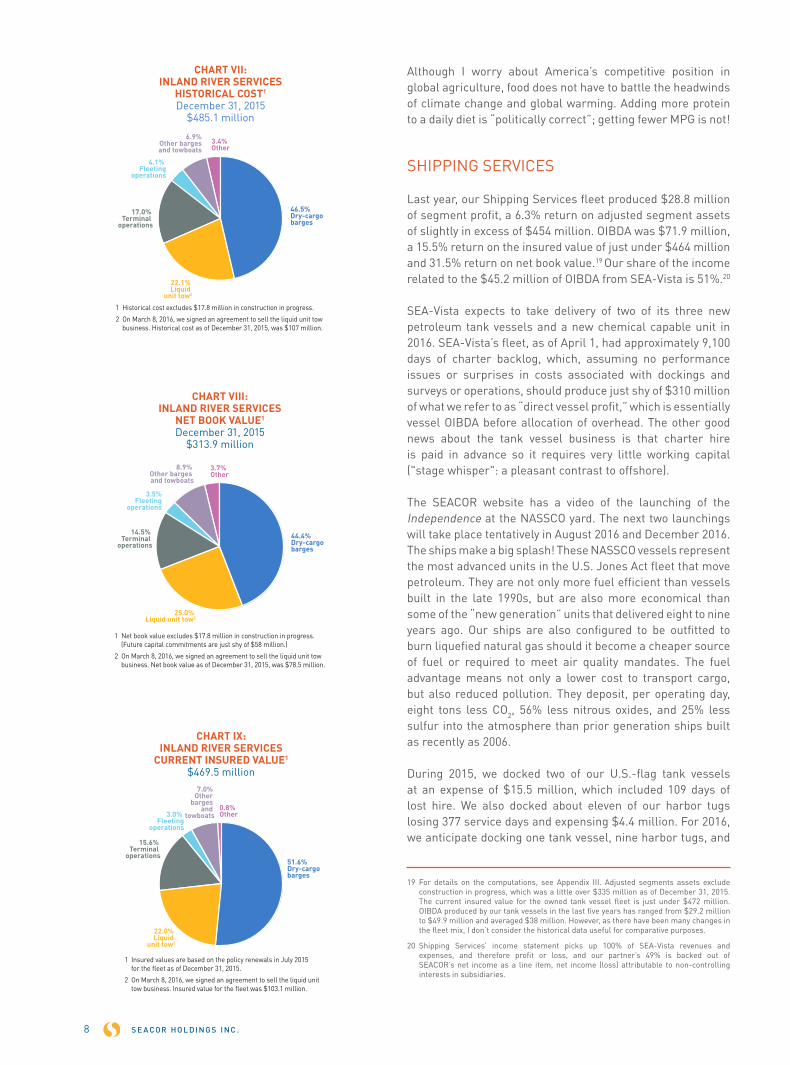
Charts VII to Chart IX and Table I in Appendix VII provide a more complete profile of our inland fleet, and provides a profile of industry assets. Like last year, we are including a table in Appendix VII that provides a history of the price of steel and dry-cargo covered barges, as well as the price of iron ore. Approximately 45% of the cost of a dry-cargo covered hopper barge is steel plate. As you can see, its price has been declining for a couple years, although for the moment it appears to be stabilizing.
The Outlook: Rainy With Possible Occasional Patches Of SunAs stated at the outset of this letter, the concerns about SCF’s prospects expressed last year materialized. In 2013, the number of barges in the dry-cargo fleet was pretty well-balanced with demand. Although some publications that track the industry report only about 1,000 new covered dry-cargo hopper barges having delivered since 2013, we believe between 1,500 and 1,650 covered barges have been added to the fleet, and approximately 800 open top barges previously moving coal and sand for “fracking” are now competing for grain cargo and fertilizer. This incremental supply would have been enough to dull the edge of a good market, but O’Toole’s well-known corollary to Murphy’s Law about "what goes wrong"—“Murphy was an optimist”— added to the industry’s woes: demand has dropped. Argentina’s new government realized that a high tax on grain exports is counterproductive, and Brazil’s currency continued to depreciate against the U.S. dollar. South American origin grain has grabbed a meaningful slice of America’s export market. More barges and reduced exports add up to “lousy” margins. During the recent slack winter months, we estimate almost 15 to 20% of the covered hopper barges were idle.17
The inland industry headline events of the year were the sale of two large competitors. Marquette Transportation was acquired by an investor group and American Electric Power’s river operation was sold to American Commercial Lines (“ACL”), which had been acquired a few years ago by a private equity group. (Maybe this is a Sadie Hawkins dance?) ACL now controls about 3,200 dry-cargo covered hoppers, 600 dry-cargo open barges, 180 towboats of various horsepower, 460 liquid tank barges, and a shipyard.18 It remains to be seen if its strategy will be to focus on pursuing market share or better margins. In order for supply and demand to balance and profits to improve, operators will have to sideline towboats and retire barges without replacing them.
17 We estimate the cost of fleeting a barge to be $50 per day; the cost of fleeting a barge long term is less. Most of our barges were tied up at our own facilities. Operators without fleeting sites are less fortunate.
18 Sources: “ACL Agrees to Acquire AEP River Operations.” River Transport News: Vol. 24, No. 19 October 12, 2015: pages 1 and 6. American Commercial Lines press releases.
Although I worry about America’s competitive position in global agriculture, food does not have to battle the headwinds of climate change and global warming. Adding more protein to a daily diet is “politically correct”; getting fewer MPG is not!
SHIPPING SERVICES
Last year, our Shipping Services fleet produced $28.8 million of segment profit, a 6.3% return on adjusted segment assets of slightly in excess of $454 million. OIBDA was $71.9 million, a 15.5% return on the insured value of just under $464 million and 31.5% return on net book value.19 Our share of the income related to the $45.2 million of OIBDA from SEA-Vista is 51%.20
SEA-Vista expects to take delivery of two of its three new petroleum tank vessels and a new chemical capable unit in 2016. SEA-Vista’s fleet, as of April 1, had approximately 9,100 days of charter backlog, which, assuming no performance issues or surprises in costs associated with dockings and surveys or operations, should produce just shy of $310 million of what we refer to as “direct vessel profit,” which is essentially vessel OIBDA before allocation of overhead. The other good news about the tank vessel business is that charter hire is paid in advance so it requires very little working capital ("stage whisper": a pleasant contrast to offshore).
The SEACOR website has a video of the launching of the Independence at the NASSCO yard. The next two launchings will take place tentatively in August 2016 and December 2016. The ships make a big splash! These NASSCO vessels represent the most advanced units in the U.S. Jones Act fleet that move petroleum. They are not only more fuel efficient than vessels built in the late 1990s, but are also more economical than some of the “new generation” units that delivered eight to nine years ago. Our ships are also configured to be outfitted to burn liquefied natural gas should it become a cheaper source of fuel or required to meet air quality mandates. The fuel advantage means not only a lower cost to transport cargo, but also reduced pollution. They deposit, per operating day, eight tons less CO2, 56% less nitrous oxides, and 25% less sulfur into the atmosphere than prior generation ships built as recently as 2006.
During 2015, we docked two of our U.S.-flag tank vessels at an expense of $15.5 million, which included 109 days of lost hire. We also docked about eleven of our harbor tugs losing 377 service days and expensing $4.4 million. For 2016, we anticipate docking one tank vessel, nine harbor tugs, and
19 For details on the computations, see Appendix III. Adjusted segments assets exclude construction in progress, which was a little over $335 million as of December 31, 2015. The current insured value for the owned tank vessel fleet is just under $472 million. OIBDA produced by our tank vessels in the last five years has ranged from $29.2 million to $49.9 million and averaged $38 million. However, as there have been many changes in the fleet mix, I don’t consider the historical data useful for comparative purposes.
20 Shipping Services’ income statement picks up 100% of SEA-Vista revenues and expenses, and therefore profit or loss, and our partner’s 49% is backed out of SEACOR’s net income as a line item, net income (loss) attributable to non-controlling interests in subsidiaries.
CHART IX: INLAND RIVER SERVICES
CURRENT INSURED VALUE1
$469.5 million
0.8% Other
7.0% Other
barges and
towboats3.0% Fleeting
operations
15.6% Terminal
operations
22.0% Liquid
unit tow2
51.6% Dry-cargobarges
1 Insured values are based on the policy renewals in July 2015 for the fleet as of December 31, 2015.
2 On March 8, 2016, we signed an agreement to sell the liquid unit tow business. Insured value for the fleet was $103.1 million.
S E A COR HO L DI NG S I NC .8
CHART VII: INLAND RIVER SERVICES
HISTORICAL COST1
December 31, 2015$485.1 million
3.4% Other
6.9%Other bargesand towboats
4.1% Fleeting
operations
17.0% Terminal
operations
22.1% Liquid
unit tow2
46.5% Dry-cargobarges
1 Historical cost excludes $17.8 million in construction in progress.
2 On March 8, 2016, we signed an agreement to sell the liquid unit tow business. Historical cost as of December 31, 2015, was $107 million.
CHART VIII: INLAND RIVER SERVICES
NET BOOK VALUE1
December 31, 2015$313.9 million
3.7% Other
8.9% Other barges and towboats
3.5%Fleeting
operations
14.5% Terminal
operations
25.0% Liquid unit tow2
44.4% Dry-cargobarges
1 Net book value excludes $17.8 million in construction in progress. (Future capital commitments are just shy of $58 million.)
2 On March 8, 2016, we signed an agreement to sell the liquid unit tow business. Net book value as of December 31, 2015, was $78.5 million.
2015 A N N U A L R E P O R T 9
two RORO vessels. We estimate, if all goes well, an aggregate out-of-pocket cost of about $7.0 million and lost revenue of $2.3 million for the tank vessel.
Both our harbor towing and bunkering service and Caribbean liner service had a good year.21 Between them they generated $26.5 million OIBDA.22 We have two harbor tugs on order. Our joint venture interest in Trailer Bridge delivered its best performance in years, $24.9 million of OIBDA. We own 47.3% percent of Trailer Bridge and have $41.7 million to the investment.23
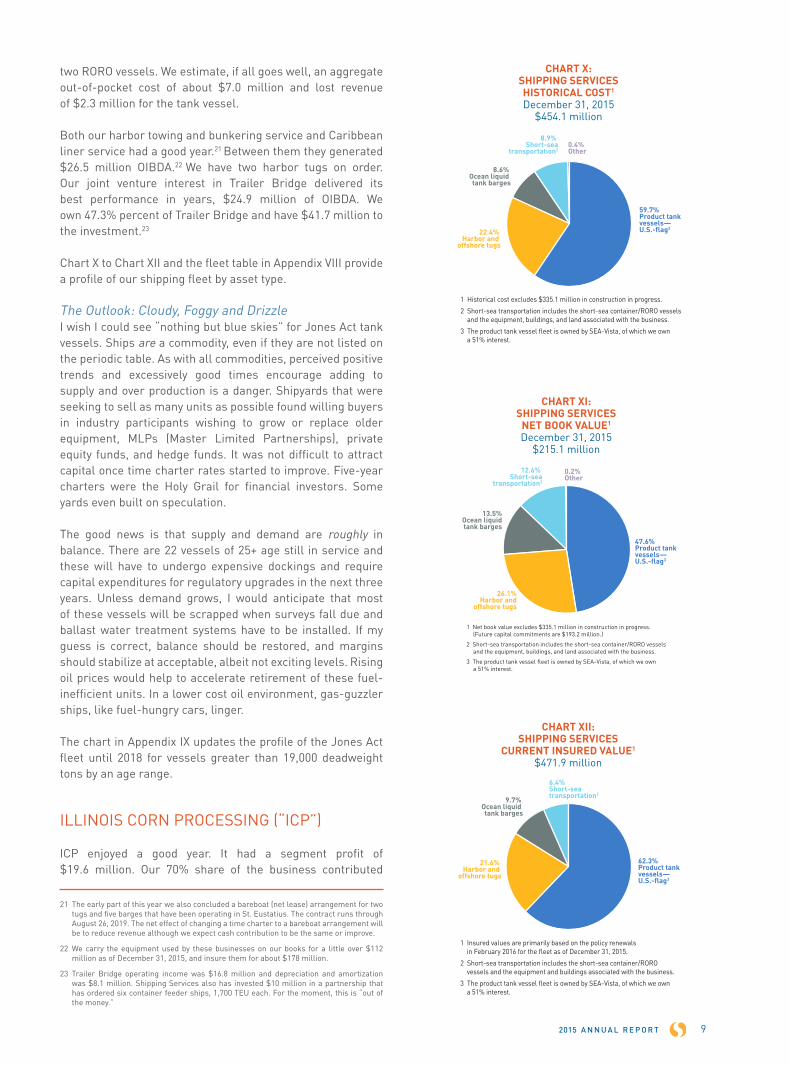
Chart X to Chart XII and the fleet table in Appendix VIII provide a profile of our shipping fleet by asset type.
The Outlook: Cloudy, Foggy and DrizzleI wish I could see “nothing but blue skies” for Jones Act tank vessels. Ships are a commodity, even if they are not listed on the periodic table. As with all commodities, perceived positive trends and excessively good times encourage adding to supply and over production is a danger. Shipyards that were seeking to sell as many units as possible found willing buyers in industry participants wishing to grow or replace older equipment, MLPs (Master Limited Partnerships), private equity funds, and hedge funds. It was not difficult to attract capital once time charter rates started to improve. Five-year charters were the Holy Grail for financial investors. Some yards even built on speculation.
The good news is that supply and demand are roughly in balance. There are 22 vessels of 25+ age still in service and these will have to undergo expensive dockings and require capital expenditures for regulatory upgrades in the next three years. Unless demand grows, I would anticipate that most of these vessels will be scrapped when surveys fall due and ballast water treatment systems have to be installed. If my guess is correct, balance should be restored, and margins should stabilize at acceptable, albeit not exciting levels. Rising oil prices would help to accelerate retirement of these fuel-inefficient units. In a lower cost oil environment, gas-guzzler ships, like fuel-hungry cars, linger.
The chart in Appendix IX updates the profile of the Jones Act fleet until 2018 for vessels greater than 19,000 deadweight tons by an age range.
ILLINOIS CORN PROCESSING (“ICP”)
ICP enjoyed a good year. It had a segment profit of $19.6 million. Our 70% share of the business contributed
21 The early part of this year we also concluded a bareboat (net lease) arrangement for two tugs and five barges that have been operating in St. Eustatius. The contract runs through August 26, 2019. The net effect of changing a time charter to a bareboat arrangement will be to reduce revenue although we expect cash contribution to be the same or improve.
22 We carry the equipment used by these businesses on our books for a little over $112 million as of December 31, 2015, and insure them for about $178 million.
23 Trailer Bridge operating income was $16.8 million and depreciation and amortization was $8.1 million. Shipping Services also has invested $10 million in a partnership that has ordered six container feeder ships, 1,700 TEU each. For the moment, this is “out of the money.”
CHART XII: SHIPPING SERVICES
CURRENT INSURED VALUE1
$471.9 million
6.4% Short-seatransportation2
9.7% Ocean liquid tank barges
21.6% Harbor and
offshore tugs
62.3% Product tank vessels—U.S.-flag3
1 Insured values are primarily based on the policy renewals in February 2016 for the fleet as of December 31, 2015.
2 Short-sea transportation includes the short-sea container/RORO vessels and the equipment and buildings associated with the business.
3 The product tank vessel fleet is owned by SEA-Vista, of which we own a 51% interest.
CHART XI: SHIPPING SERVICES
NET BOOK VALUE1
December 31, 2015$215.1 million
0.2% Other
12.6% Short-sea
transportation2
13.5%Ocean liquidtank barges
26.1%Harbor and
offshore tugs
47.6% Product tank vessels—U.S.-flag3
1 Net book value excludes $335.1 million in construction in progress. (Future capital commitments are $193.2 million.)
2 Short-sea transportation includes the short-sea container/RORO vessels and the equipment, buildings, and land associated with the business.
3 The product tank vessel fleet is owned by SEA-Vista, of which we own a 51% interest.
CHART X: SHIPPING SERVICES HISTORICAL COST1
December 31, 2015$454.1 million
0.4% Other
8.9% Short-sea
transportation2
8.6% Ocean liquid tank barges
22.4% Harbor and
offshore tugs
59.7% Product tank vessels—U.S.-flag3
1 Historical cost excludes $335.1 million in construction in progress.
2 Short-sea transportation includes the short-sea container/RORO vessels and the equipment, buildings, and land associated with the business.
3 The product tank vessel fleet is owned by SEA-Vista, of which we own a 51% interest.
$13.7 million. This was just over a 32% return on the $42.7 million at which we carried our investment at the beginning of 2015.24 ICP’s primary product is high-grade alcohol used in chemicals and pharmaceuticals. The plant also enjoys the benefit of being situated in a major corn growing region, close in proximity to natural gas production, and access to the Illinois River, which is ideal for reaching the export market. “Location, Location, Location,” as the saying goes in real estate. We are evaluating a capital expenditure program to improve process flows, and also reduce energy consumption. Since we increased our ownership in the plant to 70% its total annual segment results have ranged between a loss of $0.9 million and a profit of $39 million and averaged $15.1 million.
The Outlook: Cooler TemperaturesThe price of fuel grade ethanol has trended down following the price of gasoline. Even though the specialty products are the key output and contributor to profitability, lower prices for fuel grade ethanol will impact overall margins. ICP’s position as one of a very few suppliers of high-grade product is also being challenged as other facilities are now upgrading to compete. Pressure on the price of corn also hurts margins on the sale of ICP corn oil and “DDG” (dried distiller grain).
“OTHER” AND MARKETABLE SECURITIES
Our 10-K includes a section not so usefully described as “Other.” Apart from our reporting segments and our cash, SEACOR’s assets include investments in public equities and notes, a consulting business, interests in joint ventures, and a lease portfolio.
The most sizable investment is Dorian, which is the second largest owner-operator of “VLGCs” (Very Large Gas Carriers). Dorian has ships which transport propane and butane, and in some circumstances, ammonia. Dorian’s business enjoyed a good year. Unfortunately, Dorian’s share price did not! The prospects for the business still appear good over the longer term. Dorian has the most modern fleet in the industry, and the demand for propane seems to be growing. The near-term outlook is clouded by a large order book for new vessels, apprehension about a slowdown in the Chinese economy, and concerns over a reduction of product available for export from the U.S. due to cutbacks in shale drilling. Fear as to the potential impact of these negative developments slaughtered Dorian’s shares. Based on Dorian’s closing price today of $9.99 investors in Dorian’s public securities, after taking into account its debt obligations, are pricing its new vessels at approximately $61 million. This seems to me well below the price that even the most desperate shipyard would today quote. Dorian has no need for additional capital and appears well-positioned to survive a market downturn, one that might
24 Our cash investment in ICP since 2009 was slightly more than $24 million. On February 1, 2012, we received a 70% controlling interest in the business. As of December 31, 2015, we carry our 70% interest in ICP on our books for $52 million, which includes our share of the undistributed profits earned by the venture. ICP typically requires between $15 million and $30 million in working capital including cash, receivables, product, raw materials, and deposits with brokers to cover hedge positions. It has an undrawn line of credit for $30 million.
be cushioned if consolidation in the niche were to take place. Our investment is now worth $91.7 million, $16.3 million less than reflected on our balance sheet as of December 31, 2015. I personally believe this undervalues the shares, and at this time SEACOR has no need for cash.25
Our second largest “non-core” investment is Witt O’Brien’s (“WO”). WO is a professional services business specializing in crisis and emergency management. In 2015, it recorded $2.4 million in segment profit. WO has recently had a leadership change, with Ken Burris retiring after ten years at the company. Tim Whipple joined as the new CEO in January 2016, with deep experience in risk management and leadership credentials from Andersen, Kroll, and SAI Global. Tim is currently completing a strategic review, focusing on both operational effectiveness and growth opportunities. WO has leadership positions in three core markets: oil and gas, shipping, and government. We believe it is well-positioned to capitalize on the burgeoning need for sophisticated solutions that help organizations prepare for, respond to, and recover from the variety of crises that can threaten a company’s viability, from natural disasters to terrorism, cyber-attacks, or product recalls.
Our 34.2% ownership investment in Hawker Pacific is finally bearing fruit. Hawker’s fiscal year-end is March 31. It produced a 2016 fiscal year profit of approximately $4 million. Aggregate sales were approximately $220 million. Our equity interest as of December 31, 2015, in Hawker is reflected on our books for $21 million.26
GAAP, ASSET VALUES, IMPAIRMENT: A CONUNDRUM
When business conditions are very poor, we consider “impairment” and test the integrity of carrying values of equipment, goodwill, and investments in joint ventures. The tests for evaluating impairment under GAAP in almost all situations are dependent on management’s “best estimates,” (a more elegant—reassuring?—way to say informed “guesses”).
The examination as to whether a tangible asset, such as an offshore vessel, barge, ship, tug, or similar equipment, is impaired requires us to consider whether their carrying value on our books is “recoverable.” If the aggregate undiscounted future cash flows will recoup a sum equal to the carrying cost of the asset book value, original cost less depreciation, no impairment charge has occurred. If the projected cash flows do not add up to carrying value, the asset is “impaired” and its book value must be written down to “fair value.”27
25 At Dorian’s current price, SEACOR would realize a tax loss were we to dispose of our shares, either via a sale or distributing them as a dividend to shareholders. The capital loss would be offset by taxable gains, if any were realized, from sales of other investments.
26 We also have our equipment leasing activities and our joint venture in Avion Pacific accounts for $17.8 million at book value.
27 There are different impairment tests for goodwill, equity ownership interests in joint ventures (some of which could be publicly traded), and tangible assets, which, in SEACOR’s world, constitute the bedrock of our largest reporting segments and the core assets in most of our joint ventures.
S E A COR HO L DI NG S I NC .10
2015 A N N U A L R E P O R T 11
"Remaining life” and future cash flow depend on many variables. Historical data provides a set of goalposts, but there is no guarantee that the equipment will not be rendered obsolete in the future by technology or changes in industry dynamics. Service longevity and profitability are determined by market forces. If asked three or four years ago whether our older tank vessels would still be in service now, I would have said “no.” I would not have then predicted that U.S.-flag tank vessels built in 1981, or in the 1970s for that matter, would be operating and profitable today. (I should have consulted “Watson” or “Siri.) I envisioned difficult times for our offshore business, but did not correctly forecast the depths to which activity has deteriorated, although I expected a significant number of vessels to go into lay-up. I am no smarter about the offshore or inland business than I am about the tank vessel business. Our estimates are "just that."
That there is no impairment charge according to GAAP does not mean that book value represents an achievable price were the asset today offered for sale. I would be happier if GAAP would, like international accounting rules, allow “mark-to-market” accounting for our fleet and permit me to delegate to a broker, or an appraiser, the responsibility for periodically determining a “clearing price” for our assets.28
In the past, I have steadfastly refused to provide a SEACOR view of the value of our assets. There are many reasons for not doing so, apart from the army of lawyers who counsel reticence. My preference is to provide SEACOR stockholders information to reach independent conclusions. In this letter you can find the original cost of equipment, current insured values, book carrying costs, and historical information about earnings of different classes of equipment. The ability of our management group to divine the future is not necessarily much better, if indeed at all better, than that of our stockholders, journalists, “sell side” analysts, or palm readers.
In the absence of willing buyers and willing sellers for secondhand equipment, I generally default to replacement cost as the most useful point of departure. Manufacturers (shipyards in our business) are always willing sellers. Of course, the real cost can be elusive. Without a transaction born out of the crucible of negotiation, a shipyard’s list price is an “ask.”29 From replacement cost it is feasible to extrapolate an approximate value range for secondhand equipment, even if there are no “willing buyers” or “willing seller.” There are, of course, other factors that should be considered. The cost of capital, tax benefits, and relative access to credit are all
28 In normal times, mark-to-market accounting strikes me as more sensible than historical cost subjected to periodic testing of recoverability of carrying cost. In times such as these, when there are few with resources or courage to be buyers, and unwilling sellers, determining “market” value for equipment is almost as quixotic as attempting to project undiscounted future cash flow.
29 Under pressure, shipyards and suppliers of components will often discount price simply to avoid shutting down. (There is often a cost to releasing a work force and re-starting a facility once mothballed.) Second, margins at shipyards and those of suppliers of components and steel vary over time. Recently, they have been under pressure due to lack of demand. Third, the quoted (apparent) price may be in reality less than publicized due to unreported discounts, or benefits such as options, financing, extended warranties, flexible delivery, or favorable payment terms. Fourth, the value of an asset in our businesses is almost invariably related to the timing of its availability and delivery location. When existing assets are idle and burn money, a vessel delivered in the future can be worth a premium. Fifth, a new asset may improve on prior generations of similar equipment.
relevant when comparing values of an asset already in service with one that is contracted for future delivery. One must also be cognizant if the cost for new equipment is getting cheaper or becoming more expensive.
As noted at the outset of this letter, we booked an impairment charge related to goodwill carried by our offshore business. We take all impairments personally. Were it up to me, I would not record goodwill as an asset for a business that earns its money by buying, selling, and renting equipment. This does not mean that there is no value to long-term contracts for shipping grain at market, an engineering and product development group, which has designed specialty boats, or our investment in joint ventures that have opened up regional markets that are otherwise shut or difficult to access. Placing a value on these intangibles is difficult; they are stockholders’ “lagniappe” (New Orleans jargon for “a little something extra”). For those who like brick, mortar, steel, and machinery, SEACOR’s tangible book value (book value excluding goodwill and intangibles) is $1.2 billion.30
Notwithstanding my reservations about GAAP’s approach to impairment, we adhere to its dictates and perform the ritual of evaluating the carrying value of our assets. We do our best to forecast future cash flows. When, as is the situation now, the offshore and inland barging business is subpar, we attempt to project when markets will turn, margins will improve, or what we could realize were we to sell our interest in a business such as that we have in South America. As already noted, but worth stressing, it is uncertain when offshore drilling will resume and activity will pick up, or movement of grain in the Mississippi River will increase. Experience is useful but it is not a GPS for such predictions. My advice is download a financial version of “Waze.” For those not familiar with Waze, it provides alternative routes and is interactive, adjusting for hazards as reported by others who are traveling the same roads.
CAPITAL ALLOCATION: SHARE REPURCHASES: THE NEXT CHAPTER
In the last few months, there have been quite a few articles in the financial press discussing the “pros” and “cons” of share repurchases, whether they enhance or diminish stockholder value is best determined case by case. Sweeping rules rarely suit all situations. Our criterion for repurchasing shares focuses on our perceived value of our assets. We do not subscribe to repurchase “programs.” We also do not repurchase stock to boost “EPS.” In thinking about our decisions on share repurchases, I should have been more cognizant of the likely direction of our share price considering
30 Although I would not have recorded this goodwill in our offshore group in the first place, that the trigger for embarking on an impairment inquiry would be the decline in SEACOR’s share price seems quixotic in an era of “risk-on and risk-off” trading when share prices lunge and plunge and seem mostly to cling to the price of crude oil in SEACOR’s case. At year-end SEACOR’s closing price was $52.56. On January 20, 2016, our stock price hit a 52-week low of $41.24. The Friday before we filed our earnings and 10-K it was $46.65. A few weeks later it was $53.35, nearly a 30% round trip in two months. We still carry $52.3 million of goodwill on our books and $26.4 million of “intangible assets,” mostly associated with Witt O’Brien’s, our Emergency and Crisis Services business.
my own forecast of declining oil prices and overcapacity of offshore vessels. In 2015 we repurchased 1.2 million shares for $75.3 million at an average price of $62.56 per share, which is a 15.5% discount to our year-end book value, but a 12.7% premium to today’s price at $54.61.31 A friend asked me how I felt about repurchasing shares at prices that were significantly higher than recent trading levels. The short answer: I feel terrible, although I feel even worse about the shares we purchased at higher prices in 2014!32 I will not apply for a position as a trader. Our share price imputed a significant discount to our net assets. Today that discount is even steeper. Equipment has to be very attractively priced to be more compelling than using spare cash to buy assets we already own at a discount.33
I can’t resist remarking that 2016 is both an election year and a leap year. Clearly there is a benefit from the extra day; we need all the help we can get. The benefit from an election is more problematic. Let’s hope that Winston Churchill’s sarcastic remark holds true that the world “can count on America to do the right thing after it has exhausted all the alternatives.”
Last year one of America’s icons, Yogi Berra, passed away. As a tribute I have sprinkled some of his better known witticisms throughout the letter and will sign off with one of his most frequently quoted quips, “It ‘ain’t’ over till it’s over.” SEACOR had a terrible year in 2015. As of today, 2016 doesn’t look much better, but we step to the “plate” with an excellent bat, our strong balance sheet. We are waiting for a “fat pitch.” If necessary to protect our balance sheet we will step out of the batter’s box.
Sincerely,
Charles FabrikantExecutive Chairman and Chief Executive Officer
31 During 2015, we also repurchased $37.6 million in principal of our 7.375% senior notes due October 1, 2019, and $65.5 million in principal of our 2.5% convertible debt, which can be “put” to SEACOR on September 15, 2017.
32 In 2014 we repurchased 2.6 million shares for $197.3 million at an average price per share of $77.12.
33 I struggle in trying to determine the real liability in deferred tax and also how much of the discount should be imputed to equipment considering how much cash we have on our balance sheet. We do have debt.
S E A COR HO L DI NG S I NC .12
2015 A N N U A L R E P O R T 13
An excerpt from an article in "The Economist" on May 4, 1999:
“THE NEXT SHOCK?"The price of oil has fallen by half in the past two years, to just over $10 a bar-rel. It may fall further—and the effects will not be as good as you might hope[.]
OIL is cheaper today, in real terms, than it was in 1973. After two OPEC-in-duced decades of expensive oil, oil producers and the oil industry as a whole have more or less given up hope that prices might rebound soon…
Consumers everywhere will rejoice at the prospect of cheap, plentiful oil for the foreseeable future. Policymakers who remember the pain of responding to oil shocks in 1973 and in 1979–80 will also be pleased. But the oilmen’s musings will not be popular with their fellows. For if oil prices remain around
$10, every oil firm will have to slash its exploration budget. Few investments outside the Middle East will any longer make sense.
Cheap oil will also mean that most oil-producing countries, many of them run by benighted governments that are already flirting with financial collapse, are likely to see their economies deteriorate further. And it might also encourage more emissions of carbon dioxide at just the moment when the world is trying to do something about global warming.
Yet here is a thought: $10 might actually be too optimistic. We may be heading for $5…Thanks to new technology and productivity gains, you might expect the price of oil, like that of most other commodities, to fall slowly over the years. Judging by the oil market in the pre-OPEC era, a “normal” market price might now be in the $5–10 range. Factor in the current slow growth of the world economy and the normal price drops to the bottom of that range…”
An excerpt from a speech presented by Alden J. Laborde at the Offshore Technology Conference on April 27, 1987:
"THE OFFSHORE SERVICE INDUSTRY—WHAT HAPPENED? WHAT NOW?"…My title is not unlike the epitaph on the tombstone which read, “I told you I was sick.” Like us in the service industry, the guy under that stone got the world’s attention after it was too late… The main thing on the minds of service people these days is whether or not the oil and gas business, and therefore our business, will recover, and if so, when might it happen. First I’ll give you a few reasons why it must recover, perhaps not to the wild days of the early eighties, but to return as a viable, significant industry going about the business of supporting our customers as they supply the [world] with all-important energy products, perhaps about the level we enjoyed [in] the mid-1970’s before the price of oil skyrocketed and our wisest planners and forecasters in industry…said it was headed to $75 or $100; that we’d run out of oil early in the next century.
Was it any wonder, then, that the service industry went into a…[party] of expan-sion…[B]anks came along with easy credit—in many cases with government guarantees, asking few questions. The oil companies told us to hurry—there was no end in sight. Operators…signed long-term contracts before [equipment was] ordered…Even with warning signals…in the form of oil price softness in the early eighties, down to $30 a barrel…none thought it would go below $25…
But lo and behold, the price kept falling—all the way down to $10, and panic set in. Operators all but ceased exploration, cut to the bone on development, cut staffs dramatically, and went into hibernation, where we still find most of them, marking time, depleting their precious reserves, their life’s blood without replacement. Surely they don’t need me to tell them what they are doing and the consequences—what with their sophisticated managements and the economists and planners they all have in abundance. They are like the grocer who would sell all the groceries off his shelves, thinking business was great—until he had to replenish his inventory. I repeat that surely they know better [than that]…, and must even now be working on plans to replace their stocks and get moving again.
Unfortunately, though, most [U.S.]…corporations are driven by concern for short term profits—next quarter, this year, next year at the latest— preserving that bottom line is the first priority—protecting that dividend comes right behind…
Further unfortunately, the conventional manner in which oil companies keep their accounts and report results to shareholders allows and encourages curtailment of activities such as exploratory drilling to protect earnings. Under the reporting system the real values, those of reserves in the ground, the groceries on the shelves, so to speak, don’t
show up on the balance sheet and don’t affect the income statement, although they are the inventory just as surely as the groceries are… These are facts that we must consider in trying to understand our customers’ behavior, in order to plan our business around them we must fit our business into the cracks in theirs. We can’t expect from them help or charity or even sympathy. But I am sure they will not indefinitely remain in this liquidating mode…Oil and gas are still indispensable commodities in our economy…Judging by all the automobiles [we sold in the last few years]…we’ll still be needing a lot of gasoline for a [few years.]…[N]atural gas has no peer as to convenience, cleanliness, and even price in many applications…
…I had hoped that they might blow the time whistle on me by now and I wouldn’t have to tackle the second part of my assignment, leaving the time forecast to those following me on the program. The timing of the recovery I am promising is quite difficult to predict because the business has never operated in a free market in my fairly long memory. And therefore economic models based on free supply and demand just do not work…
Of the 16 odd million barrels of oil which we consumed each day at the beginning of 1986, some nine million were produced domestically and seven million were imported. After the terrible year of attrition, we had by the end of that year lost almost a million barrels a day domestically from shut in wells, uneconomic ones like heavy oil producers, strippers, wells in remote areas and the like, plus the normal decline of existing producers, usually 10% to 12% per year for wells going flat out as we are pulling them. Meanwhile, consumption has gone up 2% to 3% in response to lower prices and industrial growth…Oil company staffs are decimated, the service infrastructure is dismantled, rigs and boats have been scrapped to the tune of half the fleets, fabrication yards are closed, technicians gone to other fields, rig manufactures, mud companies, supply stores and the rest have left the territory.
We’ll…likely see a replay of the…story. Prices will rise sharply…The mad scramble for the existing equipment and services will begin…[M]emories are short…and history will repeat itself.
When will all of this happen, you repeat? I’d say when domestic production goes down another million barrels a day to 7 million and we are importing 9 plus million or so…my bracket—18 months to two years, give or take a few [1989–1990].
…So there you have it—I’ve stuck my neck out—it may not make much difference when it happens to those…who have already bitten the dust… Others hanging on by their fingernails may find the time quite long, too; too long perhaps for their bankers. But those who manage to tough it out for another year or two will be glad they did.”

A P P E N D I X I : Corporate PerformanceSEACOR Holdings Inc.
Return onEquity1
Total Debt to Total Capital2
Net Debt to Total
Capital3-4Book Value Per Share5
Market Price Per
Share6
Market High Price Per Share7
Market Low Price Per Share8
Book Value Per Share with Dividends Included9
Market Price Per
Share with Dividends Included
S&P 500 Index with Dividends Included
Annual Percentage Change
1992 - - - $ 7.84 $ 9.50 $ 9.67 $ 9.50 - - -
1993 11.0% 51.6% 31.9% 8.72 15.33 18.50 8.67 11.2% 61.4% 10.1%
1994 10.4% 47.3% 22.4% 9.81 13.00 15.83 11.83 12.5% (15.2)% 1.3%
1995 11.9% 40.9% 31.6% 12.27 18.00 18.17 12.08 25.1% 38.5% 37.5%
1996 21.8% 38.5% 12.4% 16.92 42.00 43.50 17.58 37.9% 133.3% 22.9%
1997 33.9% 41.5% (2.6)% 22.74 40.17 47.25 26.67 34.4% (4.4)% 33.3%
1998 26.6% 45.2% 3.4% 28.55 32.96 41.29 21.50 25.5% (17.9)% 28.5%
1999 5.7% 46.2% 19.2% 29.97 34.50 37.71 26.25 5.0% 4.7% 21.0%
2000 6.7% 40.7% 3.6% 32.28 52.63 54.00 29.59 7.7% 52.5% (9.1)%
2001 12.8% 28.0% 3.1% 37.03 46.40 54.00 35.10 14.7% (11.8)% (11.9)%
2002 6.3% 33.3% (10.2)% 40.41 44.50 50.80 37.11 9.1% (4.1)% (22.1)%
2003 1.5% 30.1% (9.6)% 41.46 42.03 44.20 33.95 2.6% (5.6)% 28.7%
2004 2.6% 39.4% 3.4% 45.20 53.40 55.75 37.35 9.0% 27.1% 10.9%
2005 20.1% 40.3% 11.4% 56.04 68.10 73.90 52.90 24.0% 27.5% 4.9%
2006 16.5% 37.0% 0.3% 64.52 99.14 101.48 68.11 15.1% 45.6% 15.8%
2007 15.0% 35.7% (3.4)% 72.73 92.74 102.81 81.60 12.7% (6.5)% 5.6%
2008 13.3% 36.4% 10.9% 81.44 66.65 97.35 53.40 12.0% (28.1)% (37.0)%
2009 8.8% 28.7% (2.4)% 86.56 76.25 91.09 53.72 6.3% 14.4% 26.4%
2010 12.5% 28.6% (5.4)% 83.52 101.09 114.80 67.59 13.8% 52.5% 15.1%
2011 2.3% 36.6% 7.9% 85.49 88.96 112.43 78.31 2.0% (12.0)% 2.1%
2012 3.4% 35.5% 16.8% 86.17 83.80 99.31 82.11 5.7% (0.1)% 16.0%
2013 2.2% 38.2% 2.3% 68.73 91.20 98.45 68.17 3.2% 40.3% 32.4%
2014 7.1% 36.8% 4.0% 77.15 73.81 90.05 68.56 7.7% (19.1)% 13.5%
2015 (4.9)% 43.5% 6.0% 74.08 52.56 77.65 50.40 (2.6)% (28.8)% 1.4%
Compounded Annual Growth Rate (“CAGR”)
CAGR (1992-2015) 12.4% 9.8% 9.0%
CAGR (2005-2015) 7.4% 1.9% 7.2%
CAGR (2010-2015) 3.1% (6.6)% 12.4%
1 Return on equity is calculated as net income (loss) attributable to SEACOR Holdings Inc. divided by SEACOR Holdings Inc. stockholders’ equity at the beginning of the year.
2 Total debt to total capital is calculated as total debt divided by the sum of total debt, including capital leases, and total equity. Total equity is defined as SEACOR Holdings Inc. stockholders’ equity plus noncontrolling interests in subsidiaries. Amounts presented do not exclude discontinued operations of National Response Corporation and certain affiliates, SEACOR Energy Inc., and Era Group Inc. prior to 2013. Amounts presented for total debt in 2015 include debt issuance costs.
3 Net debt to total capital is calculated as total debt less cash and near cash assets divided by the sum of total debt and total equity. Total equity is defined as SEACOR Holdings Inc. stockholders’ equity plus noncontrolling interests in subsidiaries. Amounts presented do not exclude discontinued operations of National Response Corporation and certain affiliates, SEACOR Energy Inc., and Era Group Inc. prior to 2013. Amounts presented for total debt in 2015 include debt issuance costs.
4 The off-balance sheet undiscounted minimum payments on future lease obligations (in excess of one year) net of non-cancellable subleases (a.k.a. future operating lease obligations) was $236.8 million as of December 31, 2015. If we include future lease obligations to the net debt to total capital computation, the percentage changes to 14.2% for 2015. For additional information on operating leases, see Note 16 to our Consolidated Financial Statements in our 2015 Annual Report on Form 10-K.
5 Total book value per common share is calculated as SEACOR Holdings Inc. stockholders’ equity divided by common shares outstanding at the end of the period. Amounts presented from 1992 to 1999 have been adjusted for the three-for-two stock split effective June 15, 2000. Book value per share from 2010 to 2015 was impacted by the Special Cash Dividends of $15.00 per common share and $5.00 per common share paid to stockholders on December 14, 2010, and December 17, 2012, respectively. Book value per share from 2013 to 2015 was also impacted by the spin-off of Era Group Inc. on January 31, 2013, amounting to $20.88 per common share.
6 This represents closing prices at December 31. Amounts presented from 1992 to 1999 have been adjusted for the three-for-two stock split effective June 15, 2000. Market price per share was impacted by the Special Cash Dividends of 2010 and 2012 as well as the spin-off of Era Group Inc. on January 31, 2013.
7 This represents the high closing prices during the period. Amounts presented from 1992 to 2000 have been adjusted for the three-for-two stock split effective June 15, 2000. Market price per share was impacted by the Special Cash Dividends of 2010 and 2012 as well as the spin-off of Era Group Inc. on January 31, 2013.
8 This represents the low closing prices during the period. Amounts presented from 1992 to 2000 have been adjusted for the three-for-two stock split effective June 15, 2000. Market price per share was impacted by the Special Cash Dividends of 2010 and 2012 as well as the spin-off of Era Group Inc. on January 31, 2013.
9 The annual percentage changes from 2009 to 2015 were adjusted to add back the Special Cash Dividends of 2010 and 2012. The annual percentage change from 2012 to 2015 was adjusted to add back the spin-off of Era Group Inc. of $20.88 per common share of 2013. The compounded annual growth rate has also been adjusted to include the Special Cash Dividends and the spin-off of Era Group Inc. in the 2014 and 2015 amounts.
S E A COR HO L DI NG S I NC .14
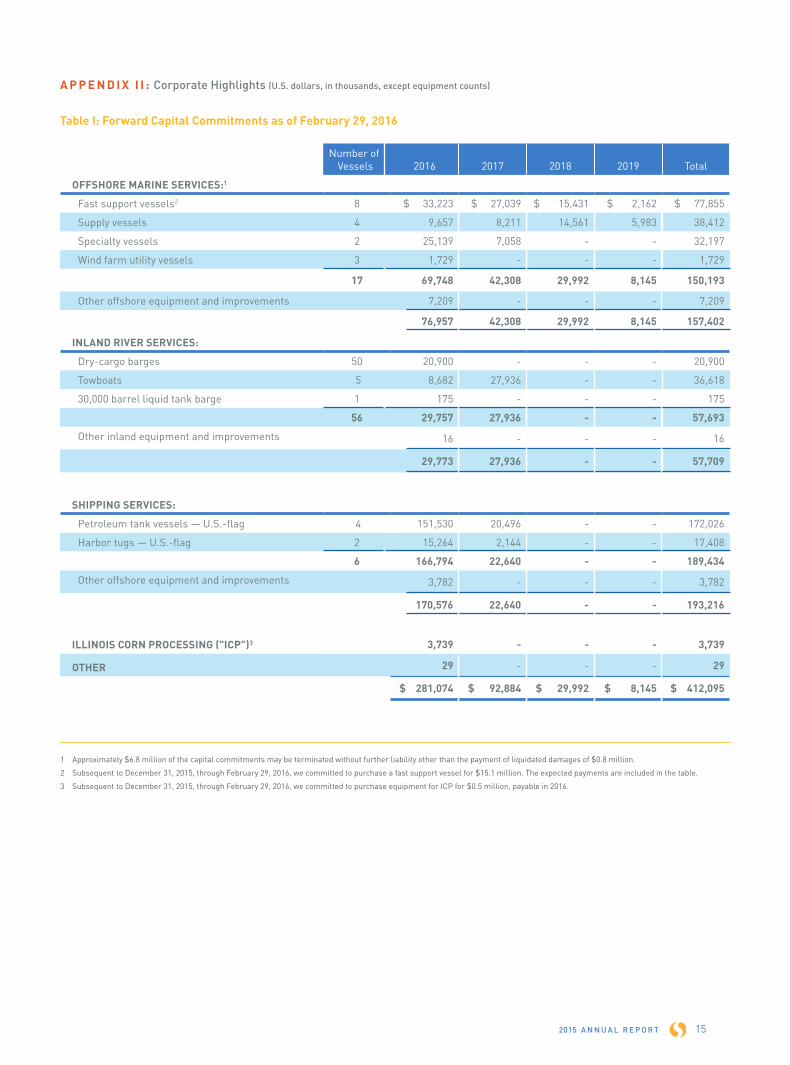
A P P E N D I X I I : Corporate Highlights (U.S. dollars, in thousands, except equipment counts)
Table I: Forward Capital Commitments as of February 29, 2016
Number of Vessels 2016 2017 2018 2019 Total
OFFSHORE MARINE SERVICES:1
Fast support vessels2 8 $ 33,223 $ 27,039 $ 15,431 $ 2,162 $ 77,855
Supply vessels 4 9,657 8,211 14,561 5,983 38,412
Specialty vessels 2 25,139 7,058 - - 32,197
Wind farm utility vessels 3 1,729 - - - 1,729
17 69,748 42,308 29,992 8,145 150,193
Other offshore equipment and improvements 7,209 - - - 7,209
76,957 42,308 29,992 8,145 157,402
INLAND RIVER SERVICES:
Dry-cargo barges 50 20,900 - - - 20,900
Towboats 5 8,682 27,936 - - 36,618
30,000 barrel liquid tank barge 1 175 - - - 175
56 29,757 27,936 - - 57,693
Other inland equipment and improvements 16 - - - 16
29,773 27,936 - - 57,709
SHIPPING SERVICES:
Petroleum tank vessels — U.S.-flag 4 151,530 20,496 - - 172,026
Harbor tugs — U.S.-flag 2 15,264 2,144 - - 17,408
6 166,794 22,640 - - 189,434
Other offshore equipment and improvements 3,782 - - - 3,782
170,576 22,640 - - 193,216
ILLINOIS CORN PROCESSING ("ICP")3 3,739 - - - 3,739
OTHER 29 - - - 29
$ 281,074 $ 92,884 $ 29,992 $ 8,145 $ 412,095
1 Approximately $6.8 million of the capital commitments may be terminated without further liability other than the payment of liquidated damages of $0.8 million.
2 Subsequent to December 31, 2015, through February 29, 2016, we committed to purchase a fast support vessel for $15.1 million. The expected payments are included in the table.
3 Subsequent to December 31, 2015, through February 29, 2016, we committed to purchase equipment for ICP for $0.5 million, payable in 2016.
2015 A N N U A L R E P O R T 15
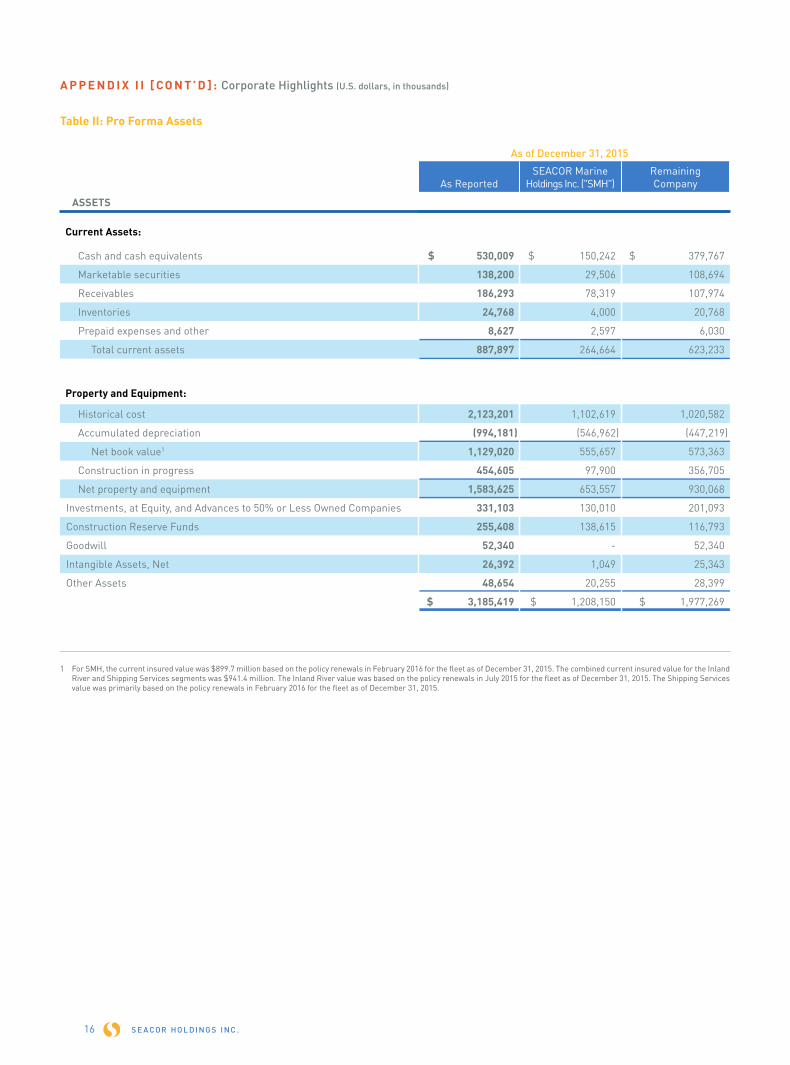
A P P E N D I X I I [ CO N T ’ D ] : Corporate Highlights (U.S. dollars, in thousands)
Table II: Pro Forma Assets
As ReportedSEACOR Marine
Holdings Inc. ("SMH")RemainingCompany
ASSETS
Current Assets:
Cash and cash equivalents $ 530,009 $ 150,242 $ 379,767
Marketable securities 138,200 29,506 108,694
Receivables 186,293 78,319 107,974
Inventories 24,768 4,000 20,768
Prepaid expenses and other 8,627 2,597 6,030
Total current assets 887,897 264,664 623,233
Property and Equipment:
Historical cost 2,123,201 1,102,619 1,020,582
Accumulated depreciation (994,181) (546,962) (447,219)
Net book value1 1,129,020 555,657 573,363
Construction in progress 454,605 97,900 356,705
Net property and equipment 1,583,625 653,557 930,068
Investments, at Equity, and Advances to 50% or Less Owned Companies 331,103 130,010 201,093
Construction Reserve Funds 255,408 138,615 116,793
Goodwill 52,340 - 52,340
Intangible Assets, Net 26,392 1,049 25,343
Other Assets 48,654 20,255 28,399
$ 3,185,419 $ 1,208,150 $ 1,977,269
As of December 31, 2015
1 For SMH, the current insured value was $899.7 million based on the policy renewals in February 2016 for the fleet as of December 31, 2015. The combined current insured value for the Inland River and Shipping Services segments was $941.4 million. The Inland River value was based on the policy renewals in July 2015 for the fleet as of December 31, 2015. The Shipping Services value was primarily based on the policy renewals in February 2016 for the fleet as of December 31, 2015.
S E A COR HO L DI NG S I NC .16
INLAND RIVER SERVICES:
Operating Revenues $ 230,482 $ 253,150 $ 215,613 $ 226,561 $ 187,657
Gains on Asset Dispositions 14,868 29,657 6,555 7,666 2,964
Segment Profit (Loss)2 (1,496) 65,817 17,977 28,210 40,429
Equity in Earnings (Losses) of 50% or Less Owned Companies, Net of Tax (31,200) 6,673 (7,626) (3,310) 4,136
Capital Expenditures 69,736 58,481 37,360 28,818 44,693
Reconciliations of Certain Non-U.S. GAAP Financial Measures
Average Segment Assets3 $ 529,879 $ 523,822 $ 480,163 $ 504,308 $ 448,200
Less: Average Construction in Progress4 24,694 31,112 19,209 11,815 10,329
Average Adjusted Segment Assets5 $ 505,185 $ 492,710 $ 460,954 $ 492,493 $ 437,871
Return on Average Segment Assets6 (0.3)% 12.6% 3.7% 5.6% 9.0%
Return on Average Adjusted Segment Assets7 (0.3)% 13.4% 3.9% 5.7% 9.2%
Operating Income $ 33,136 $ 62,517 $ 25,770 $ 31,437 $ 36,289
Plus: Depreciation and Amortization 28,632 29,435 28,461 28,270 23,494
Operating Income Before Depreciation and Amortization8 $ 61,768 $ 91,952 $ 54,231 $ 59,707 $ 59,783
Average Historical Cost9 $ 485,916 $ 500,698 $ 479,895 $ 481,716 $ 432,482
Return on Average Historical Cost10 12.7% 18.4% 11.3% 12.4% 13.8%
Average Net Book Value11 $ 320,380 $ 344,094 $ 343,341 $ 365,926 $ 338,142
Return on Average Net Book Value12 19.3% 26.7% 15.8% 16.3% 17.7%
Average Insured Value of Owned Fleet13 $ 499,258 $ 550,696 $ 602,177
Return on Average Insured Value14 12.4% 16.7% 9.0%

A P P E N D I X I I I : Business Segments Financial Highlights1 (U.S. dollars, in thousands, except ratios)
Years Ended December 31,
2015 2014 2013 2012 2011
OFFSHORE MARINE SERVICES:
Operating Revenues $ 368,868 $ 529,944 $ 567,263 $ 519,817 $ 376,788
Gains (Losses) on Asset Dispositions and Impairments, Net (17,017) 26,545 28,664 14,876 14,661
Segment Profit (Loss) 2 (32,710) 92,022 99,578 70,268 32,933
Equity in Earnings of 50% or Less Owned Companies, Net of Tax 8,757 10,468 13,522 5,214 9,189
Capital Expenditures 87,765 83,513 111,517 168,778 88,248
Reconciliations of Certain Non-U.S. GAAP Financial Measures
Average Segment Assets3 $ 896,253 $ 1,013,417 $ 1,041,799 $ 1,028,495 $ 824,424
Less: Average Construction in Progress4 96,335 91,442 83,029 97,684 64,237
Average Adjusted Segment Assets5 $ 799,918 $ 921,975 $ 958,770 $ 930,811 $ 760,187
Return on Average Segment Assets6 (3.6)% 9.1% 9.6% 6.8% 4.0%
Return on Average Adjusted Segment Assets7 (4.1)% 10.0% 10.4% 7.5% 4.3%
Operating Income (Loss) $ (38,935) $ 68,429 $ 88,179 $ 64,218 $ 26,568
Plus: Depreciation and Amortization 61,729 64,615 65,424 61,542 48,477
Operating Income Before Depreciation and Amortization8 $ 22,794 $ 133,044 $ 153,603 $ 125,760 $ 75,045
Average Historical Cost9 $1,076,068 $ 1,133,347 $ 1,142,867 $ 1,091,592 $ 923,714
Return on Average Historical Cost10 2.1% 11.7% 13.4% 11.5% 8.1%
Average Net Book Value11 $ 553,587 $ 642,499 $ 699,740 $ 693,990 $ 556,147
Return on Average Net Book Value12 4.1% 20.7% 22.0% 18.1% 13.5%
Average Insured Value of Owned Fleet13 $1,057,884 $ 1,270,120 $ 1,368,586
Return on Average Insured Value14 2.2% 10.5% 11.2%
2015 A N N U A L R E P O R T 17
INLAND RIVER SERVICES:
Operating Revenues $ 230,482 $ 253,150 $ 215,613 $ 226,561 $ 187,657
Gains on Asset Dispositions 14,868 29,657 6,555 7,666 2,964
Segment Profit (Loss)2 (1,496) 65,817 17,977 28,210 40,429
Equity in Earnings (Losses) of 50% or Less Owned Companies, Net of Tax (31,200) 6,673 (7,626) (3,310) 4,136
Capital Expenditures 69,736 58,481 37,360 28,818 44,693
Reconciliations of Certain Non-U.S. GAAP Financial Measures
Average Segment Assets3 $ 529,879 $ 523,822 $ 480,163 $ 504,308 $ 448,200
Less: Average Construction in Progress4 24,694 31,112 19,209 11,815 10,329
Average Adjusted Segment Assets5 $ 505,185 $ 492,710 $ 460,954 $ 492,493 $ 437,871
Return on Average Segment Assets6 (0.3)% 12.6% 3.7% 5.6% 9.0%
Return on Average Adjusted Segment Assets7 (0.3)% 13.4% 3.9% 5.7% 9.2%
Operating Income $ 33,136 $ 62,517 $ 25,770 $ 31,437 $ 36,289
Plus: Depreciation and Amortization 28,632 29,435 28,461 28,270 23,494
Operating Income Before Depreciation and Amortization8 $ 61,768 $ 91,952 $ 54,231 $ 59,707 $ 59,783
Average Historical Cost9 $ 485,916 $ 500,698 $ 479,895 $ 481,716 $ 432,482
Return on Average Historical Cost10 12.7% 18.4% 11.3% 12.4% 13.8%
Average Net Book Value11 $ 320,380 $ 344,094 $ 343,341 $ 365,926 $ 338,142
Return on Average Net Book Value12 19.3% 26.7% 15.8% 16.3% 17.7%
Average Insured Value of Owned Fleet13 $ 499,258 $ 550,696 $ 602,177
Return on Average Insured Value14 12.4% 16.7% 9.0%
Footnotes for Appendix III can be found on page 18
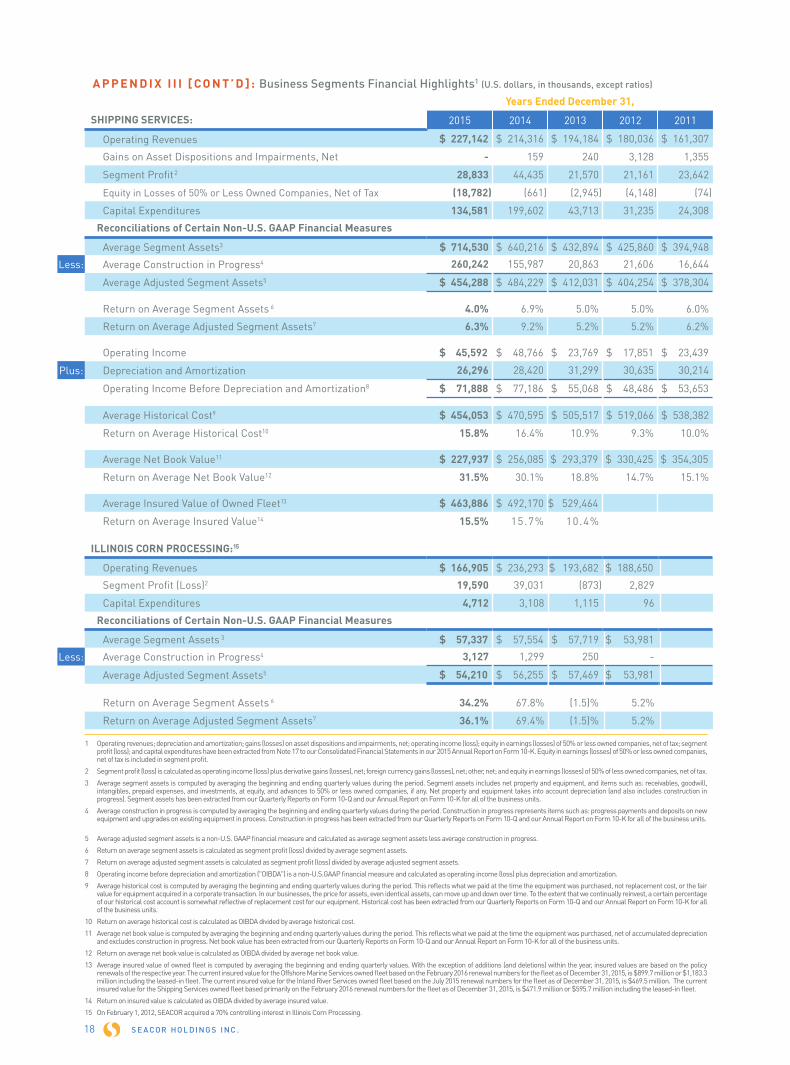
S E A COR HO L DI NG S I NC .18
Years Ended December 31,
SHIPPING SERVICES: 2015 2014 2013 2012 2011
Operating Revenues $ 227,142 $ 214,316 $ 194,184 $ 180,036 $ 161,307
Gains on Asset Dispositions and Impairments, Net - 159 240 3,128 1,355
Segment Profit2 28,833 44,435 21,570 21,161 23,642
Equity in Losses of 50% or Less Owned Companies, Net of Tax (18,782) (661) (2,945) (4,148) (74)
Capital Expenditures 134,581 199,602 43,713 31,235 24,308
Reconciliations of Certain Non-U.S. GAAP Financial Measures
Average Segment Assets3 $ 714,530 $ 640,216 $ 432,894 $ 425,860 $ 394,948
Less: Average Construction in Progress4 260,242 155,987 20,863 21,606 16,644
Average Adjusted Segment Assets5 $ 454,288 $ 484,229 $ 412,031 $ 404,254 $ 378,304
Return on Average Segment Assets 6 4.0% 6.9% 5.0% 5.0% 6.0%
Return on Average Adjusted Segment Assets7 6.3% 9.2% 5.2% 5.2% 6.2%
Operating Income $ 45,592 $ 48,766 $ 23,769 $ 17,851 $ 23,439
Plus: Depreciation and Amortization 26,296 28,420 31,299 30,635 30,214
Operating Income Before Depreciation and Amortization8 $ 71,888 $ 77,186 $ 55,068 $ 48,486 $ 53,653
Average Historical Cost9 $ 454,053 $ 470,595 $ 505,517 $ 519,066 $ 538,382
Return on Average Historical Cost10 15.8% 16.4% 10.9% 9.3% 10.0%
Average Net Book Value11 $ 227,937 $ 256,085 $ 293,379 $ 330,425 $ 354,305
Return on Average Net Book Value12 31.5% 30.1% 18.8% 14.7% 15.1%
Average Insured Value of Owned Fleet13 $ 463,886 $ 492,170 $ 529,464
Return on Average Insured Value14 15.5% 15.7% 10.4%
A P P E N D I X I I I [ CO N T ’ D ] : Business Segments Financial Highlights1 (U.S. dollars, in thousands, except ratios)
ILLINOIS CORN PROCESSING:15
Operating Revenues $ 166,905 $ 236,293 $ 193,682 $ 188,650
Segment Profit (Loss)2 19,590 39,031 (873) 2,829
Capital Expenditures 4,712 3,108 1,115 96
Reconciliations of Certain Non-U.S. GAAP Financial Measures
Average Segment Assets 3 $ 57,337 $ 57,554 $ 57,719 $ 53,981
Less: Average Construction in Progress4 3,127 1,299 250 -
Average Adjusted Segment Assets5 $ 54,210 $ 56,255 $ 57,469 $ 53,981
Return on Average Segment Assets 6 34.2% 67.8% (1.5)% 5.2%
Return on Average Adjusted Segment Assets7 36.1% 69.4% (1.5)% 5.2%
1 Operating revenues; depreciation and amortization; gains (losses) on asset dispositions and impairments, net; operating income (loss); equity in earnings (losses) of 50% or less owned companies, net of tax; segment profit (loss); and capital expenditures have been extracted from Note 17 to our Consolidated Financial Statements in our 2015 Annual Report on Form 10-K. Equity in earnings (losses) of 50% or less owned companies, net of tax is included in segment profit.
2 Segment profit (loss) is calculated as operating income (loss) plus derivative gains (losses), net; foreign currency gains (losses), net; other, net; and equity in earnings (losses) of 50% of less owned companies, net of tax.
3 Average segment assets is computed by averaging the beginning and ending quarterly values during the period. Segment assets includes net property and equipment, and items such as: receivables, goodwill, intangibles, prepaid expenses, and investments, at equity, and advances to 50% or less owned companies, if any. Net property and equipment takes into account depreciation (and also includes construction in progress). Segment assets has been extracted from our Quarterly Reports on Form 10-Q and our Annual Report on Form 10-K for all of the business units.
4 Average construction in progress is computed by averaging the beginning and ending quarterly values during the period. Construction in progress represents items such as: progress payments and deposits on new equipment and upgrades on existing equipment in process. Construction in progress has been extracted from our Quarterly Reports on Form 10-Q and our Annual Report on Form 10-K for all of the business units.
5 Average adjusted segment assets is a non-U.S. GAAP financial measure and calculated as average segment assets less average construction in progress.
6 Return on average segment assets is calculated as segment profit (loss) divided by average segment assets.
7 Return on average adjusted segment assets is calculated as segment profit (loss) divided by average adjusted segment assets.
8 Operating income before depreciation and amortization ("OIBDA") is a non-U.S.GAAP financial measure and calculated as operating income (loss) plus depreciation and amortization.
9 Average historical cost is computed by averaging the beginning and ending quarterly values during the period. This reflects what we paid at the time the equipment was purchased, not replacement cost, or the fair value for equipment acquired in a corporate transaction. In our businesses, the price for assets, even identical assets, can move up and down over time. To the extent that we continually reinvest, a certain percentage of our historical cost account is somewhat reflective of replacement cost for our equipment. Historical cost has been extracted from our Quarterly Reports on Form 10-Q and our Annual Report on Form 10-K for all of the business units.
10 Return on average historical cost is calculated as OIBDA divided by average historical cost.
11 Average net book value is computed by averaging the beginning and ending quarterly values during the period. This reflects what we paid at the time the equipment was purchased, net of accumulated depreciation and excludes construction in progress. Net book value has been extracted from our Quarterly Reports on Form 10-Q and our Annual Report on Form 10-K for all of the business units.
12 Return on average net book value is calculated as OIBDA divided by average net book value.
13 Average insured value of owned fleet is computed by averaging the beginning and ending quarterly values. With the exception of additions (and deletions) within the year, insured values are based on the policy renewals of the respective year. The current insured value for the Offshore Marine Services owned fleet based on the February 2016 renewal numbers for the fleet as of December 31, 2015, is $899.7 million or $1,183.3 million including the leased-in fleet. The current insured value for the Inland River Services owned fleet based on the July 2015 renewal numbers for the fleet as of December 31, 2015, is $469.5 million. The current insured value for the Shipping Services owned fleet based primarily on the February 2016 renewal numbers for the fleet as of December 31, 2015, is $471.9 million or $595.7 million including the leased-in fleet.
14 Return on insured value is calculated as OIBDA divided by average insured value.
15 On February 1, 2012, SEACOR acquired a 70% controlling interest in Illinois Corn Processing.
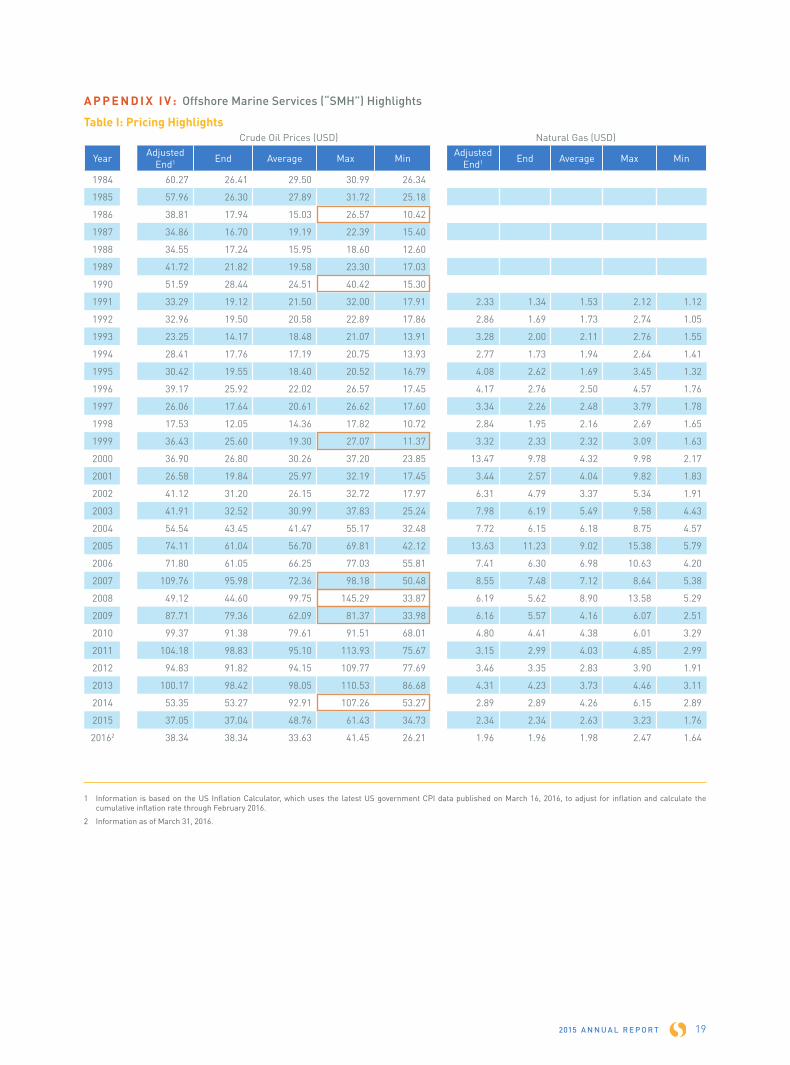
Year AdjustedEnd1 End Average Max Min Adjusted
End1 End Average Max Min
1984 60.27 26.41 29.50 30.99 26.34
1985 57.96 26.30 27.89 31.72 25.18
1986 38.81 17.94 15.03 26.57 10.42
1987 34.86 16.70 19.19 22.39 15.40
1988 34.55 17.24 15.95 18.60 12.60
1989 41.72 21.82 19.58 23.30 17.03
1990 51.59 28.44 24.51 40.42 15.30
1991 33.29 19.12 21.50 32.00 17.91 2.33 1.34 1.53 2.12 1.12
1992 32.96 19.50 20.58 22.89 17.86 2.86 1.69 1.73 2.74 1.05
1993 23.25 14.17 18.48 21.07 13.91 3.28 2.00 2.11 2.76 1.55
1994 28.41 17.76 17.19 20.75 13.93 2.77 1.73 1.94 2.64 1.41
1995 30.42 19.55 18.40 20.52 16.79 4.08 2.62 1.69 3.45 1.32
1996 39.17 25.92 22.02 26.57 17.45 4.17 2.76 2.50 4.57 1.76
1997 26.06 17.64 20.61 26.62 17.60 3.34 2.26 2.48 3.79 1.78
1998 17.53 12.05 14.36 17.82 10.72 2.84 1.95 2.16 2.69 1.65
1999 36.43 25.60 19.30 27.07 11.37 3.32 2.33 2.32 3.09 1.63
2000 36.90 26.80 30.26 37.20 23.85 13.47 9.78 4.32 9.98 2.17
2001 26.58 19.84 25.97 32.19 17.45 3.44 2.57 4.04 9.82 1.83
2002 41.12 31.20 26.15 32.72 17.97 6.31 4.79 3.37 5.34 1.91
2003 41.91 32.52 30.99 37.83 25.24 7.98 6.19 5.49 9.58 4.43
2004 54.54 43.45 41.47 55.17 32.48 7.72 6.15 6.18 8.75 4.57
2005 74.11 61.04 56.70 69.81 42.12 13.63 11.23 9.02 15.38 5.79
2006 71.80 61.05 66.25 77.03 55.81 7.41 6.30 6.98 10.63 4.20
2007 109.76 95.98 72.36 98.18 50.48 8.55 7.48 7.12 8.64 5.38
2008 49.12 44.60 99.75 145.29 33.87 6.19 5.62 8.90 13.58 5.29
2009 87.71 79.36 62.09 81.37 33.98 6.16 5.57 4.16 6.07 2.51
2010 99.37 91.38 79.61 91.51 68.01 4.80 4.41 4.38 6.01 3.29
2011 104.18 98.83 95.10 113.93 75.67 3.15 2.99 4.03 4.85 2.99
2012 94.83 91.82 94.15 109.77 77.69 3.46 3.35 2.83 3.90 1.91
2013 100.17 98.42 98.05 110.53 86.68 4.31 4.23 3.73 4.46 3.11
2014 53.35 53.27 92.91 107.26 53.27 2.89 2.89 4.26 6.15 2.89
2015 37.05 37.04 48.76 61.43 34.73 2.34 2.34 2.63 3.23 1.76
20162 38.34 38.34 33.63 41.45 26.21 1.96 1.96 1.98 2.47 1.64
A P P E N D I X I V : Offshore Marine Services (“SMH”) Highlights
Table I: Pricing Highlights
1 Information is based on the US Inflation Calculator, which uses the latest US government CPI data published on March 16, 2016, to adjust for inflation and calculate the cumulative inflation rate through February 2016.
2 Information as of March 31, 2016.
2015 A N N U A L R E P O R T 19
Natural Gas (USD)Crude Oil Prices (USD)
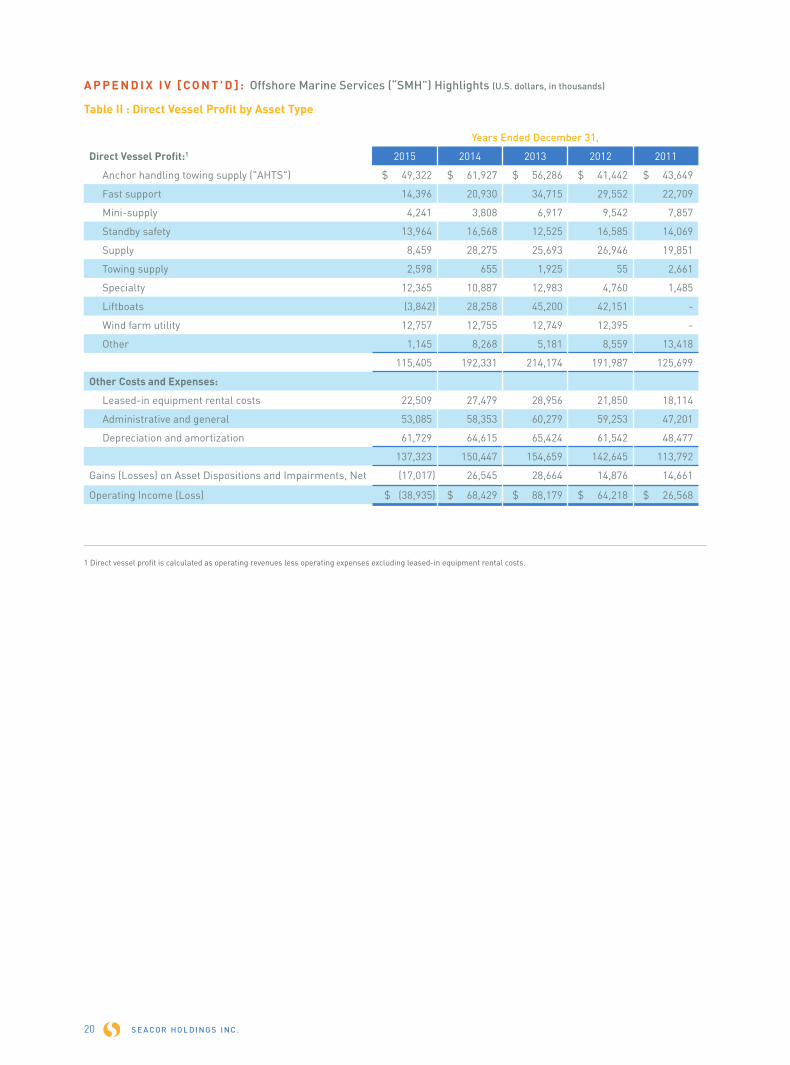
A P P E N D I X I V [ CO N T ' D ] : Offshore Marine Services (“SMH”) Highlights (U.S. dollars, in thousands)
Table II : Direct Vessel Profit by Asset Type
Years Ended December 31,
Direct Vessel Profit:1 2015 2014 2013 2012 2011
Anchor handling towing supply ("AHTS") $ 49,322 $ 61,927 $ 56,286 $ 41,442 $ 43,649
Fast support 14,396 20,930 34,715 29,552 22,709
Mini-supply 4,241 3,808 6,917 9,542 7,857
Standby safety 13,964 16,568 12,525 16,585 14,069
Supply 8,459 28,275 25,693 26,946 19,851
Towing supply 2,598 655 1,925 55 2,661
Specialty 12,365 10,887 12,983 4,760 1,485
Liftboats (3,842) 28,258 45,200 42,151 -
Wind farm utility 12,757 12,755 12,749 12,395 -
Other 1,145 8,268 5,181 8,559 13,418
115,405 192,331 214,174 191,987 125,699
Other Costs and Expenses:
Leased-in equipment rental costs 22,509 27,479 28,956 21,850 18,114
Administrative and general 53,085 58,353 60,279 59,253 47,201
Depreciation and amortization 61,729 64,615 65,424 61,542 48,477
137,323 150,447 154,659 142,645 113,792
Gains (Losses) on Asset Dispositions and Impairments, Net (17,017) 26,545 28,664 14,876 14,661
Operating Income (Loss) $ (38,935) $ 68,429 $ 88,179 $ 64,218 $ 26,568
S E A COR HO L DI NG S I NC .20
1 Direct vessel profit is calculated as operating revenues less operating expenses excluding leased-in equipment rental costs.
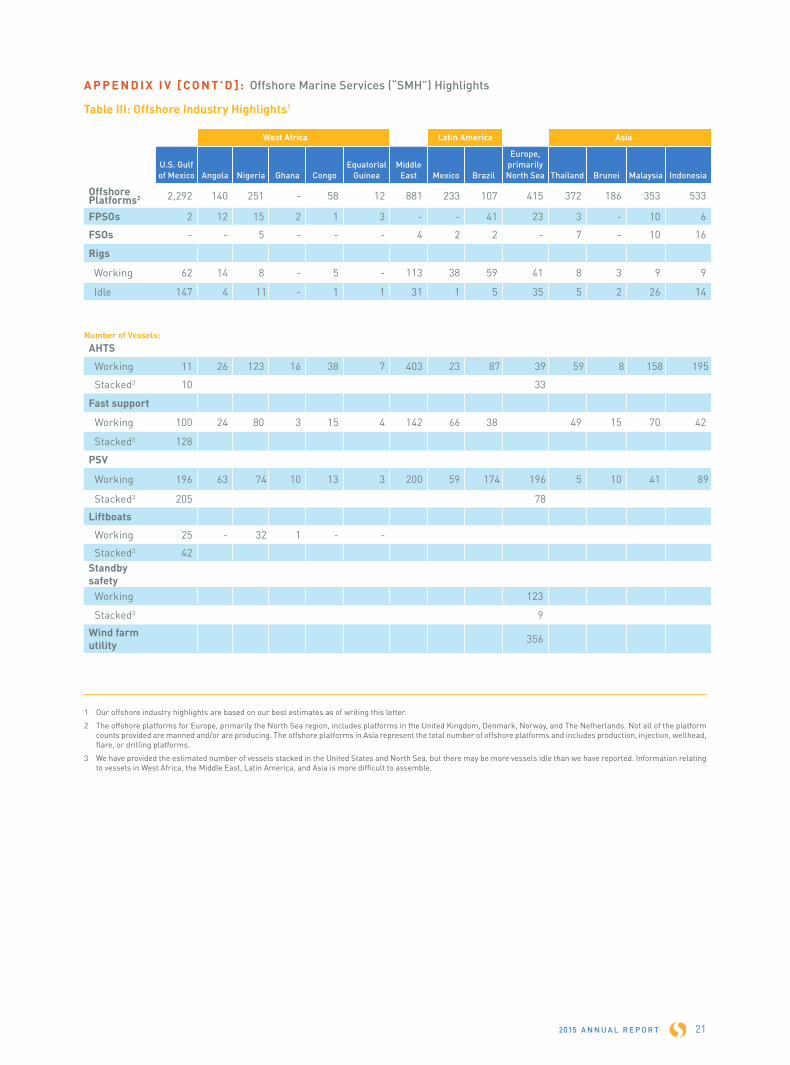
A P P E N D I X I V [ CO N T ' D ] : Offshore Marine Services (“SMH”) Highlights
Table III: Offshore Industry Highlights1
U.S. Gulf of Mexico Angola Nigeria Ghana Congo
Equatorial Guinea
Middle East Mexico Brazil
Europe, primarily North Sea Thailand Brunei Malaysia Indonesia
Offshore Platforms2 2,292 140 251 - 58 12 881 233 107 415 372 186 353 533
FPSOs 2 12 15 2 1 3 - - 41 23 3 - 10 6
FSOs - - 5 - - - 4 2 2 - 7 - 10 16
Rigs
Working 62 14 8 - 5 - 113 38 59 41 8 3 9 9
Idle 147 4 11 - 1 1 31 1 5 35 5 2 26 14
AHTS
Working 11 26 123 16 38 7 403 23 87 39 59 8 158 195
Stacked3 10 33
Fast support
Working 100 24 80 3 15 4 142 66 38 49 15 70 42
Stacked3 128
PSV
Working 196 63 74 10 13 3 200 59 174 196 5 10 41 89
Stacked3 205 78
Liftboats
Working 25 - 32 1 - -
Stacked3 42 Standby safety
Working 123
Stacked3 9
Wind farm utility 356
Number of Vessels:
West Africa Latin America Asia
1 Our offshore industry highlights are based on our best estimates as of writing this letter.
2 The offshore platforms for Europe, primarily the North Sea region, includes platforms in the United Kingdom, Denmark, Norway, and The Netherlands. Not all of the platform counts provided are manned and/or are producing. The offshore platforms in Asia represent the total number of offshore platforms and includes production, injection, wellhead, flare, or drilling platforms.
3 We have provided the estimated number of vessels stacked in the United States and North Sea, but there may be more vessels idle than we have reported. Information relating to vessels in West Africa, the Middle East, Latin America, and Asia is more difficult to assemble.
2015 A N N U A L R E P O R T 21

A P P E N D I X I V [ CO N T ' D ] : Offshore Marine Services (“SMH”) Highlights
Table IV: Fleet Summary
December 31,
2011 2012 2013 2014 2015 On Order1
By Asset Type:
Anchor handling towing supply 19 19 18 18 18 -
Fast support 49 47 42 35 34 8
Mini-supply 8 9 8 7 7 -
Standby safety 26 25 25 25 25 -
Supply 30 26 27 25 24 4
Towing supply 5 3 3 3 3 -
Specialty 9 10 12 9 9 2
Liftboats 2 20 15 15 15 -
Wind farm utility 29 30 34 36 38 3
177 189 184 173 173 17
By Ownership:
Owned:
U.S.-flag 36 50 40 32 32 12
Foreign-flag 83 86 87 88 92 5
Joint ventured 17 20 24 29 32 -
Leased-in 25 22 22 16 9 -
Pooled or Managed 16 11 11 8 8 -
177 189 184 173 173 17
1 Of the 17 vessels on order, eight are expected to deliver in 2016, four in 2017, three in 2018, and two in 2019. We committed to purchase one of the U.S.-flag fast support vessels after December 31, 2015.
S E A COR HO L DI NG S I NC .22
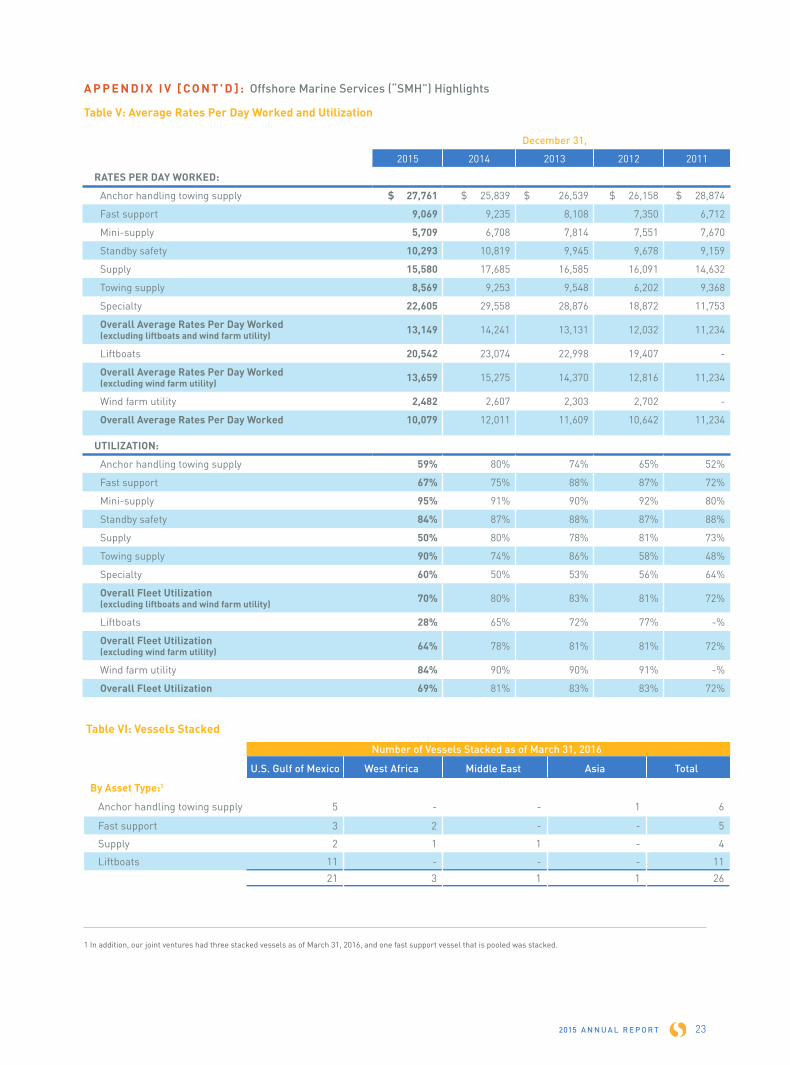
December 31,
2015 2014 2013 2012 2011
RATES PER DAY WORKED:
Anchor handling towing supply $ 27,761 $ 25,839 $ 26,539 $ 26,158 $ 28,874
Fast support 9,069 9,235 8,108 7,350 6,712
Mini-supply 5,709 6,708 7,814 7,551 7,670
Standby safety 10,293 10,819 9,945 9,678 9,159
Supply 15,580 17,685 16,585 16,091 14,632
Towing supply 8,569 9,253 9,548 6,202 9,368
Specialty 22,605 29,558 28,876 18,872 11,753
Overall Average Rates Per Day Worked (excluding liftboats and wind farm utility) 13,149 14,241 13,131 12,032 11,234
Liftboats 20,542 23,074 22,998 19,407 -
Overall Average Rates Per Day Worked (excluding wind farm utility) 13,659 15,275 14,370 12,816 11,234
Wind farm utility 2,482 2,607 2,303 2,702 -
Overall Average Rates Per Day Worked 10,079 12,011 11,609 10,642 11,234
UTILIZATION:
Anchor handling towing supply 59% 80% 74% 65% 52%
Fast support 67% 75% 88% 87% 72%
Mini-supply 95% 91% 90% 92% 80%
Standby safety 84% 87% 88% 87% 88%
Supply 50% 80% 78% 81% 73%
Towing supply 90% 74% 86% 58% 48%
Specialty 60% 50% 53% 56% 64%
Overall Fleet Utilization (excluding liftboats and wind farm utility) 70% 80% 83% 81% 72%
Liftboats 28% 65% 72% 77% -%
Overall Fleet Utilization (excluding wind farm utility) 64% 78% 81% 81% 72%
Wind farm utility 84% 90% 90% 91% -%
Overall Fleet Utilization 69% 81% 83% 83% 72%
Table VI: Vessels Stacked
Number of Vessels Stacked as of March 31, 2016
U.S. Gulf of Mexico West Africa Middle East Asia Total
By Asset Type:1
Anchor handling towing supply 5 - - 1 6
Fast support 3 2 - - 5
Supply 2 1 1 - 4
Liftboats 11 - - - 11 21 3 1 1 26
1 In addition, our joint ventures had three stacked vessels as of March 31, 2016, and one fast support vessel that is pooled was stacked.
2015 A N N U A L R E P O R T 23
A P P E N D I X I V [ CO N T ' D ] : Offshore Marine Services (“SMH”) Highlights
Table V: Average Rates Per Day Worked and Utilization
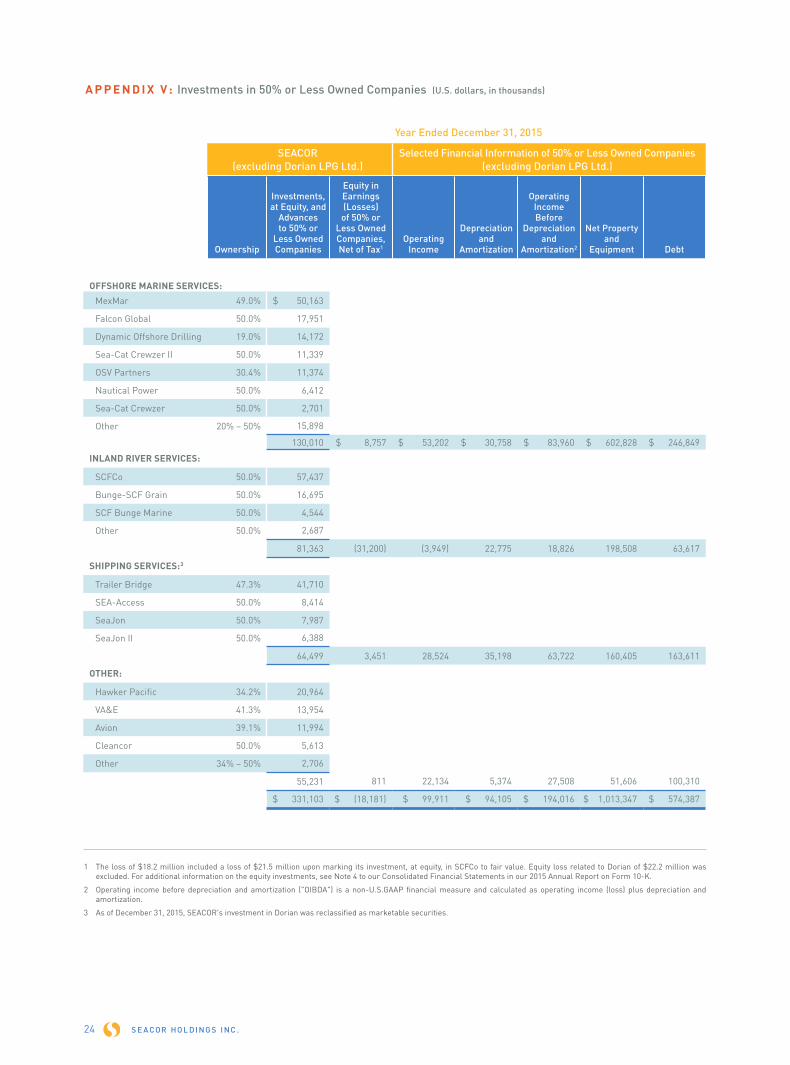
A P P E N D I X V : Investments in 50% or Less Owned Companies (U.S. dollars, in thousands)
SEACOR (excluding Dorian LPG Ltd.)
Selected Financial Information of 50% or Less Owned Companies (excluding Dorian LPG Ltd.)
Ownership
Investments, at Equity, and
Advances to 50% or
Less Owned Companies
Equity in Earnings (Losses) of 50% or
Less Owned Companies, Net of Tax1
OperatingIncome
Depreciationand
Amortization
Operating Income Before
Depreciation and
Amortization2
Net Property and
Equipment Debt
OFFSHORE MARINE SERVICES:
MexMar 49.0% $ 50,163
Falcon Global 50.0% 17,951
Dynamic Offshore Drilling 19.0% 14,172
Sea-Cat Crewzer II 50.0% 11,339
OSV Partners 30.4% 11,374
Nautical Power 50.0% 6,412
Sea-Cat Crewzer 50.0% 2,701
Other 20% – 50% 15,898
130,010 $ 8,757 $ 53,202 $ 30,758 $ 83,960 $ 602,828 $ 246,849
INLAND RIVER SERVICES:
SCFCo 50.0% 57,437
Bunge-SCF Grain 50.0% 16,695
SCF Bunge Marine 50.0% 4,544
Other 50.0% 2,687
81,363 (31,200) (3,949) 22,775 18,826 198,508 63,617
SHIPPING SERVICES:3
Trailer Bridge 47.3% 41,710
SEA-Access 50.0% 8,414
SeaJon 50.0% 7,987
SeaJon II 50.0% 6,388
64,499 3,451 28,524 35,198 63,722 160,405 163,611
OTHER:
Hawker Pacific 34.2% 20,964
VA&E 41.3% 13,954
Avion 39.1% 11,994
Cleancor 50.0% 5,613
Other 34% – 50% 2,706
55,231 811 22,134 5,374 27,508 51,606 100,310
$ 331,103 $ (18,181) $ 99,911 $ 94,105 $ 194,016 $ 1,013,347 $ 574,387
1 The loss of $18.2 million included a loss of $21.5 million upon marking its investment, at equity, in SCFCo to fair value. Equity loss related to Dorian of $22.2 million was excluded. For additional information on the equity investments, see Note 4 to our Consolidated Financial Statements in our 2015 Annual Report on Form 10-K.
2 Operating income before depreciation and amortization ("OIBDA") is a non-U.S.GAAP financial measure and calculated as operating income (loss) plus depreciation and amortization.
3 As of December 31, 2015, SEACOR's investment in Dorian was reclassified as marketable securities.
S E A COR HO L DI NG S I NC .24
Year Ended December 31, 2015
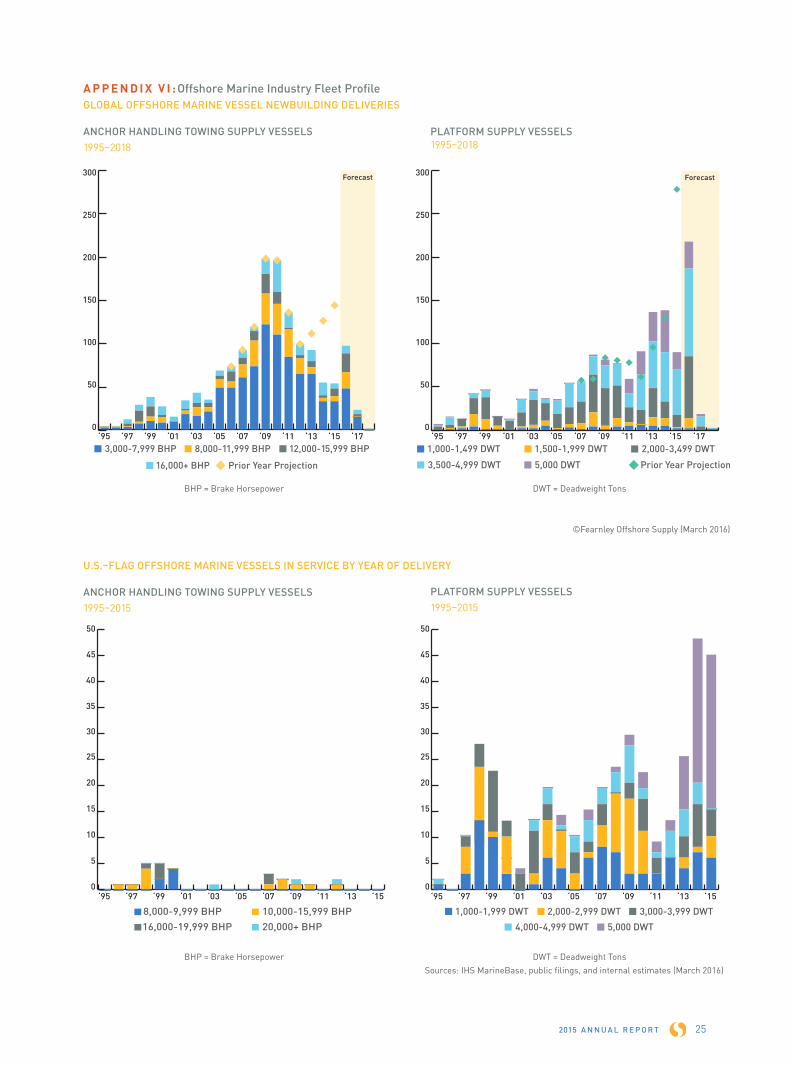
Forecast
0
50
100
150
200
250
300
0
50
100
150
200
250
300Forecast
8,000-9,999 BHP 10,000-15,999 BHP16,000-19,999 BHP 20,000+ BHP
00
5
10
15
20
25
30
35
40
45
50
5
10
15
20
25
30
35
40
45
50
‘95 ‘97 ‘99 ‘01 ‘03 ‘05 ‘07 ‘09 ‘11 ‘13 ‘15 ‘17 ‘95 ‘97 ‘99 ‘01 ‘03 ‘05 ‘07 ‘09 ‘11 ‘13 ‘15 ‘17
‘95 ‘97 ‘99 ‘01 ‘03 ‘05 ‘07 ‘09 ‘11 ‘13 ‘15 ‘95 ‘97 ‘99 ‘01 ‘03 ‘05 ‘07 ‘09 ‘11 ‘13 ‘15
A P P E N D I X V I : Offshore Marine Industry Fleet ProfileGLOBAL OFFSHORE MARINE VESSEL NEWBUILDING DELIVERIES
ANCHOR HANDLING TOWING SUPPLY VESSELS1995–2018
U.S.–FLAG OFFSHORE MARINE VESSELS IN SERVICE BY YEAR OF DELIVERY
ANCHOR HANDLING TOWING SUPPLY VESSELS1995–2015
PLATFORM SUPPLY VESSELS1995–2018
BHP = Brake Horsepower
BHP = Brake Horsepower
©Fearnley Offshore Supply (March 2016)
Sources: IHS MarineBase, public filings, and internal estimates (March 2016)
DWT = Deadweight Tons
DWT = Deadweight Tons
2015 A N N U A L R E P O R T 25
PLATFORM SUPPLY VESSELS1995–2015

By Market:
U.S. Inland River Waterways 1,433 1,383 1,338 1,301 1,229 55
Magdalena River 10 12 12 12 20 1
Parana-Paraguay River Waterway3 182 182 182 271 271 -
1,625 1,577 1,532 1,584 1,520 56
December 31,
2011 2012 2013 2014 20151 On Order2
By Asset Type:
Dry-cargo barges 1,496 1,444 1,405 1,455 1,430 50
Liquid tank barges:
10,000 barrel 50 52 40 44 18 -
30,000 barrel 27 29 27 27 27 1
Specialty barges - - 7 7 11 -
Deck barges 20 20 20 20 - -
Towboats:
4,000 hp - 6,600 hp 16 16 17 17 17 3
3,300 hp - 3,900 hp 1 1 1 - - 1
Less than 3,200 hp 14 14 14 14 17 1
Dry-cargo vessel 1 1 1 - - -
1,625 1,577 1,532 1,584 1,520 56
By Ownership:
Owned 794 792 769 748 710 56
Joint ventured 188 188 188 277 271 -
Leased-in 2 2 10 10 12 -
Pooled or Managed 641 595 565 549 527 -
1,625 1,577 1,532 1,584 1,520 56
A P P E N D I X V I I : Inland River Services ("SCF") HighlightsTable I: Fleet Summary
S E A COR HO L DI NG S I NC .26
1 In 2015, the 18 10,000 barrel liquid tank barges operated along the Magdalena River (Colombia).
2 Equipment is expected to deliver in 2016 and 2017. The 30,000 barrel liquid tank barge and the less than 3,200 hp towboat on order are part of the sale of the liquid unit tow fleet, which was signed on March 8, 2016.
3 Assets operating along the Parana-Paraguay River Waterway are operated by a joint venture, SCFCo.
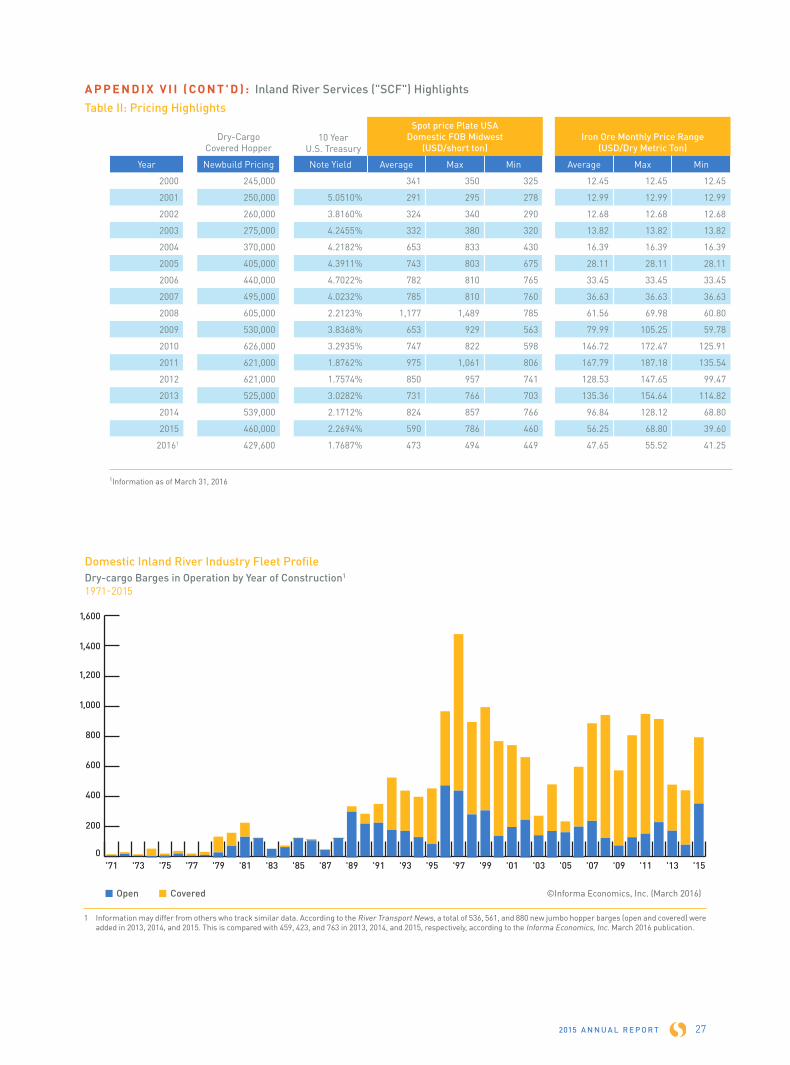
Dry-Cargo Covered Hopper
Spot price Plate USA Domestic FOB Midwest
(USD/short ton)Iron Ore Monthly Price Range
(USD/Dry Metric Ton)
Year Newbuild Pricing Note Yield Average Max Min Average Max Min
2000 245,000 341 350 325 12.45 12.45 12.45
2001 250,000 5.0510% 291 295 278 12.99 12.99 12.99
2002 260,000 3.8160% 324 340 290 12.68 12.68 12.68
2003 275,000 4.2455% 332 380 320 13.82 13.82 13.82
2004 370,000 4.2182% 653 833 430 16.39 16.39 16.39
2005 405,000 4.3911% 743 803 675 28.11 28.11 28.11
2006 440,000 4.7022% 782 810 765 33.45 33.45 33.45
2007 495,000 4.0232% 785 810 760 36.63 36.63 36.63
2008 605,000 2.2123% 1,177 1,489 785 61.56 69.98 60.80
2009 530,000 3.8368% 653 929 563 79.99 105.25 59.78
2010 626,000 3.2935% 747 822 598 146.72 172.47 125.91
2011 621,000 1.8762% 975 1,061 806 167.79 187.18 135.54
2012 621,000 1.7574% 850 957 741 128.53 147.65 99.47
2013 525,000 3.0282% 731 766 703 135.36 154.64 114.82
2014 539,000 2.1712% 824 857 766 96.84 128.12 68.80
2015 460,000 2.2694% 590 786 460 56.25 68.80 39.60
20161 429,600 1.7687% 473 494 449 47.65 55.52 41.25
A P P E N D I X V I I ( CO N T ' D ) : Inland River Services ("SCF") HighlightsTable II: Pricing Highlights
2015 A N N U A L R E P O R T 27
Open Covered
0
200
400
600
800
1,000
1,200
1,400
1,600
'15'13'11'09'07'05'03'01'99'97'95'93'91'89'87'85'83'81'79'77'75'73'71
©Informa Economics, Inc. (March 2016)
1 Information may differ from others who track similar data. According to the River Transport News, a total of 536, 561, and 880 new jumbo hopper barges (open and covered) were added in 2013, 2014, and 2015. This is compared with 459, 423, and 763 in 2013, 2014, and 2015, respectively, according to the Informa Economics, Inc. March 2016 publication.
1Information as of March 31, 2016
Domestic Inland River Industry Fleet ProfileDry-cargo Barges in Operation by Year of Construction1
1971-2015
10 YearU.S. Treasury
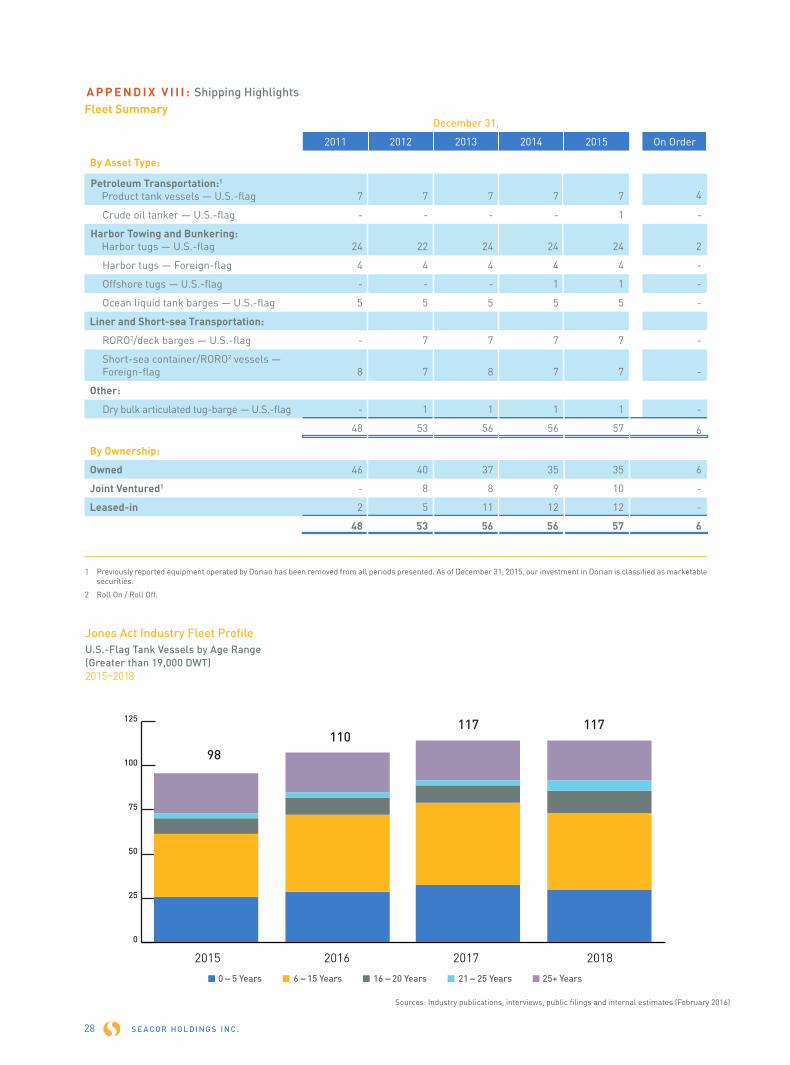
A P P E N D I X V I I I : Shipping HighlightsFleet Summary
December 31,
2011 2012 2013 2014 2015 On Order
By Asset Type:
Petroleum Transportation:1
Product tank vessels — U.S.-flag 7
7
7 7
7
4
Crude oil tanker — U.S.-flag - - - - 1 -
Harbor Towing and Bunkering: Harbor tugs — U.S.-flag
24
22
24 24
24 2
Harbor tugs — Foreign-flag 4 4 4 4 4 -
Offshore tugs — U.S.-flag - - - 1 1 -
Ocean liquid tank barges — U.S.-flag 5 5 5 5 5 -
Liner and Short-sea Transportation:
RORO2/deck barges — U.S.-flag - 7 7 7 7 -
Short-sea container/RORO2 vessels — Foreign-flag 8 7 8 7 7 -
Other:
Dry bulk articulated tug-barge — U.S.-flag - 1 1 1 1 -
48 53 56 56 57 6
By Ownership:
Owned 46 40 37 35 35 6
Joint Ventured1 - 8 8 9 10 -
Leased-in 2 5 11 12 12 -
48 53 56 56 57 6
1 Previously reported equipment operated by Dorian has been removed from all periods presented. As of December 31, 2015, our investment in Dorian is classified as marketable securities.
2 Roll On / Roll Off.
S E A COR HO L DI NG S I NC .28
Sources: Industry publications, interviews, public filings and internal estimates (February 2016)
0
25
50
75
100
125
98110
117117
2015 2016 2017 2018
Jones Act Industry Fleet ProfileU.S.-Flag Tank Vessels by Age Range(Greater than 19,000 DWT)2015–2018
SHAREHOLDER INFORMATION PRINCIPAL EXECUTIVE OFFICE SEACOR Holdings Inc. 2200 Eller Drive P.O. Box 13038 Fort Lauderdale, Florida 33316www.seacorholdings.com
MARKET INFORMATION The Company’s stock trades on the NYSE under the ticker symbol CKH.
TRANSFER AGENT AND REGISTRAR American Stock Transfer & Trust Company 6201 15th Avenue Brooklyn, New York 11219www.amstock.com
INDEPENDENT REGISTEREDCERTIFIED PUBLIC ACCOUNTING FIRM Ernst & Young LLP 5100 Town Center Circle Suite 500 Boca Raton, Florida 33486www.ey.com
COUNSEL Milbank, Tweed, Hadley & McCloy LLP 28 Liberty Street New York, New York 10005www.milbank.com
ANNUAL MEETING The 2016 Annual Meeting of Stockholders will be held at the Ritz-Carlton – Fort Lauderdale,1 N Fort Lauderdale Beach Blvd., Fort Lauderdale, FL 33304, on Wednesday, June 1, 2016, at 9:00 a.m. Eastern Time.
ADDITIONAL INFORMATION SEACOR’s Annual Report on Form 10-K and other Company SEC filings can be accessed on the SEACOR Holdings Inc. website, www.seacorholdings.com, in the “Investors” section.
© 2016 SEACOR Holdings Inc.
BOARD OF DIRECTORS
CHARLES FABRIKANT*Executive Chairman and Chief Executive OfficerSEACOR Holdings Inc.
OIVIND LORENTZENVice ChairmanSEACOR Holdings Inc.
DAVID R. BERZRetired PartnerWeil, Gotshal & Manges LLP
PIERRE DE DEMANDOLXGeneral PartnerDPH Conseils
ANDREW R. MORSE 1
Managing Director andSenior Portfolio ManagerMorse, Towey and White
R. CHRISTOPHER REGANCo-Founder and Managing DirectorThe Chartis Group
DAVID M. SCHIZERDean Emeritus and The Harvey R. Miller Professor of Law and EconomicsColumbia Law School
STEVEN J. WISCHChairmanChannel Control Merchants, LLC
SENIOR MANAGEMENT
CORPORATE
EVAN BEHRENSSenior Vice PresidentBusiness DevelopmentSEACOR Holdings Inc.
MAX BUIRSKIVice PresidentSEACOR Holdings Inc.
MATTHEW R. CENAC* Executive Vice President and Chief Financial OfficerSEACOR Holdings Inc.
ERIC FABRIKANT*Chief Operating OfficerSEACOR Holdings Inc.
Chief Executive OfficerSEACOR Ocean Transport Inc.
WILLIAM C. LONG*Executive Vice PresidentChief Legal Officer and Corporate SecretarySEACOR Holdings Inc.
LISA MANEKINTreasurerSEACOR Holdings Inc.
SCOTT WEBERVice PresidentFinanceSEACOR Holdings Inc.
BRUCE WEINS*Senior Vice President and Chief Accounting OfficerSEACOR Holdings Inc.
OFFSHORE MARINE SERVICES
JOHN GELLERT*Chief Operating OfficerSEACOR Holdings Inc.
PresidentSEACOR Marine Holdings Inc.
ROBERT CLEMONSVice PresidentSEACOR Marine Holdings Inc.
JESÚS LLORCAVice PresidentSEACOR Holdings Inc.
Executive Vice PresidentSEACOR Marine Holdings Inc.
ANTHONY WELLERManaging DirectorSEACOR Offshore Dubai (L.L.C.)
INLAND RIVER SERVICES
TIMOTHY POWERPresidentSCF Marine Inc.
SHIPPING SERVICES
DANIEL J. THOROGOODVice PresidentSEACOR Holdings Inc.
President SEACOR Ocean Transport Inc.
*Executive Officer1Lead Director
FINANCIAL HIGHLIGHTS (U.S. dollars, in thousands, except per share data and ratios)Years Ended December 31,
2015 2014 2013 2012 2011Statement of Income Data:
Continuing Operations:Operating Revenues $ 1,054,736 $ 1,319,394 $ 1,247,272 $ 1,308,297 $ 1,032,497 Gains (Losses) on Asset Dispositions and Impairments, Net (2,408) 51,978 37,507 23,987 18,839
Operating Income 21,125 165,243 100,042 56,405 67,138
Net Income (Loss) Attributable to SEACOR Holdings Inc.:Continuing Operations $ (68,782) $ 100,132 $ 47,195 $ 25,343 $ 9,273 Discontinued Operations – - (10,225) 35,872 31,783
$ (68,782) $ 100,132 $ 36,970 $ 61,215 $ 41,056
Diluted Earnings (Loss) Per Common Share of SEACOR Holdings Inc.:
Continuing Operations $ (3.94) $ 4.71 $ 2.32 $ 1.22 $ 0.43Discontinued Operations – - (0.50) 1.73 1.48
$ (3.94) $ 4.71 $ 1.82 $ 2.95 $ 1.91Return on Stockholders’ Equity:
Continuing Operations1 (4.9)% 7.1% 3.6% 2.0% 0.8%Discontinued Operations2 – - (2.4)% 6.5% 5.0%Overall3 (4.9)% 7.1% 2.2% 3.4% 2.3%
Statement of Cash Flows Data–cash received (spent):Continuing Operations:
Net Cash Generated by Operating Activities $ 171,157 $ 191,382 $ 185,026 $ 81,487 $ 114,628Proceeds from Disposition of Property and Equipment 95,460 254,763 263,854 114,032 75,733
Purchases of Property and Equipment (295,930) (360,637) (195,901) (239,350) (165,264)Business Acquisitions, Net of Cash Acquired - (35,000) (11,127) (148,088) (90,588)
Balance Sheet Data (at period end):Total Assets:4
Continuing Operations $ 3,185,419 $ 3,234,373 $ 3,103,165 $ 2,738,515 $ 2,827,841 Discontinued Operations – - - 939,277 1,083,450
$ 3,185,419 $ 3,234,373 $ 3,103,165 $ 3,677,792 $ 3,911,291 Continuing Operations:
Property and Equipment:Historical Cost $ 2,123,201 $ 2,086,957 $ 2,199,183 $ 2,238,383 $ 1,986,731 Accumulated Depreciation (994,181) (902,284) (866,330) (763,803) (665,553)
Net Book Value 1,129,020 1,184,673 1,332,853 1,474,580 1,321,178 Construction in Progress 454,605 318,000 143,482 110,296 119,479 Net Property and Equipment $ 1,583,625 $ 1,502,673 $ 1,476,335 $ 1,584,876 $ 1,440,657
Cash and Near Cash Assets5 $ 923,617 $ 786,644 $ 825,641 $ 493,786 $ 729,635 Total Debt4-6 $ 1,070,419 $ 872,240 $ 866,517 $ 670,316 $ 751,772
RECONCILIATIONS OF CERTAIN NON-U.S. GAAP FINANCIAL MEASURES (U.S. dollars, in thousands)Years Ended December 31,
2015 2014 2013 2012 2011Balance Sheet Data (at period end):
SEACOR Holdings Inc. Stockholders’ Equity $ 1,270,820 $ 1,399,494 $ 1,400,852 $ 1,713,654 $ 1,789,607 Net Assets of Discontinued Operations7 – - - 418,300 549,793
Adjusted Stockholders’ Equity 8 $ 1,270,820 $ 1,399,494 $ 1,400,852 $ 1,295,354 $ 1,239,814
1 Return on equity from continuing operations is calculated as net income (loss) attributable to SEACOR Holdings Inc. from continuing operations divided by adjusted stockholders’ equity at the beginning of the year.
2 Return on equity from discontinued operations is calculated as net income (loss) attributable to SEACOR Holdings Inc. from discontinued operations divided by the net assets of discontinued operations at the beginning of the year.
3 Return on equity is calculated as net income (loss) attributable to SEACOR Holdings Inc. divided by SEACOR’s stockholders’ equity at the beginning of the year.
4 Effective December 31, 2015, SEACOR adopted new accounting standards regarding the presentation of deferred debt issuance costs and deferred tax liabilities and assets. As a result, SEACOR has reclassified previously reported amounts to conform with the December 31, 2015 presentation.
5 Cash and near cash assets include cash, cash equivalents, restricted cash, marketable securities, Title XI reserve funds, and construction reserve funds.
6 Total debt includes current and long-term portions of debt and capital lease obligations.
7 Net assets of discontinued operations is calculated as current and long-term assets of discontinued operations less current and long-term liabilities of discontinued operations.
8 Adjusted stockholders’ equity is calculated as SEACOR Holdings Inc. stockholders’ equity less net assets of discontinued operations.
Forward-looking Statement: Certain statements discussed in this Annual Report constitute “forward-looking statements” within the meaning of the Private Securities Litigation Reform Act of 1995. Such forward-looking statements concerning management’s expectations, strategic objectives, business prospects, anticipated economic performance and financial condition and other similar matters involve significant known and unknown risks, uncertainties and other important factors that could cause the actual results, performance, or achievements of results to differ materially from any future results, performance, or achievements discussed or implied by such forward-looking statements. Readers should refer to the Company’s Form 10-K and particularly the “Risk Factors” section, which is included in this Annual Report, for a discussion of risk factors that could cause actual results to differ materially.
Less:
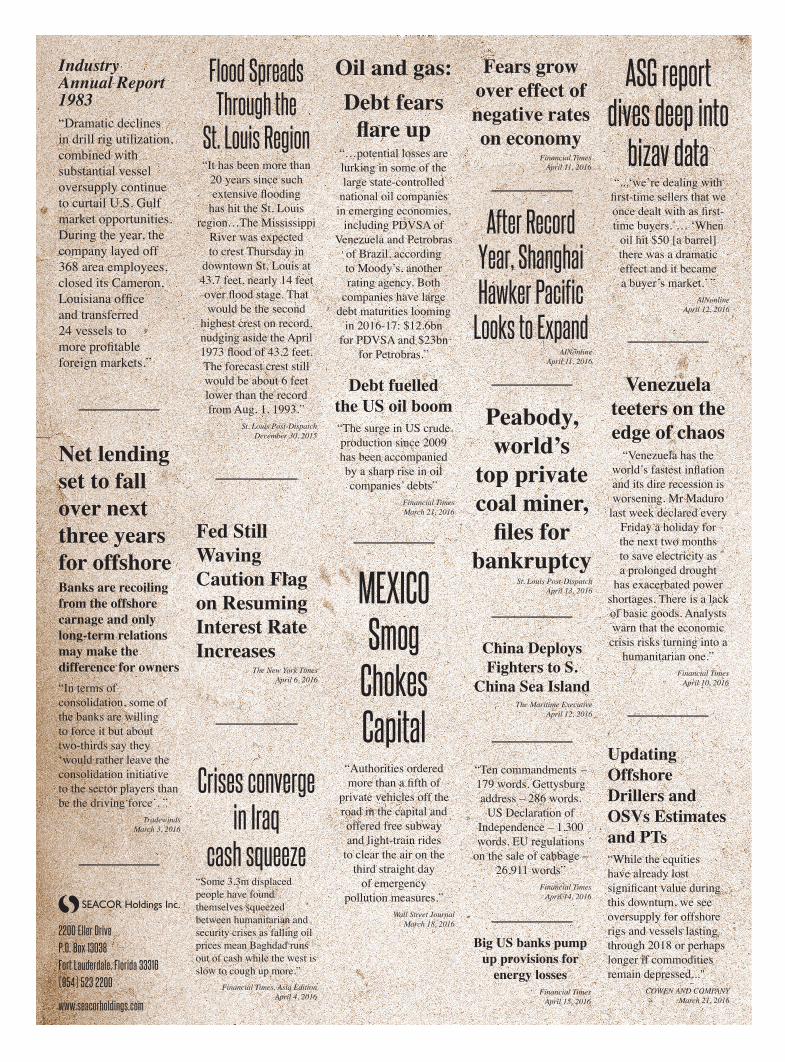
SEACOR Holdings Inc.
2015 Annual Report
Industry Annual Report 1983
“Dramatic declines in drill rig utilization, combined with substantial vessel oversupply continue to curtail U.S. Gulf market opportunities. During the year, the company layed off 368 area employees, closed its Cameron, Louisiana office and transferred 24 vessels to more profitable foreign markets.”
Oil and gas: Debt fears
flare up “…potential losses are lurking in some of the large state-controlled
national oil companies in emerging economies,
including PDVSA of Venezuela and Petrobras
of Brazil, according to Moody’s, another rating agency. Both
companies have large debt maturities looming
in 2016-17: $12.6bn for PDVSA and $23bn
for Petrobras.”
Debt fuelled the US oil boom“The surge in US crude production since 2009 has been accompanied by a sharp rise in oil companies’ debts”
Financial TimesMarch 21, 2016
Fed Still Waving Caution Flag on Resuming Interest Rate Increases
The New York TimesApril 6, 2016
Net lending set to fall over next three years for offshoreBanks are recoiling from the offshore carnage and only long-term relations may make the difference for owners“In terms of consolidation, some of the banks are willing to force it but about two-thirds say they ‘would rather leave the consolidation initiative to the sector players than be the driving force’. ”
TradewindsMarch 3, 2016
Fears grow over effect of negative rates on economy
Financial TimesApril 11, 2016
Crises converge in Iraq
cash squeeze“Some 3.3m displaced people have found themselves squeezed between humanitarian and security crises as falling oil prices mean Baghdad runs out of cash while the west is slow to cough up more.”
Financial Times, Asia EditionApril 4, 2016
MEXICO Smog
Chokes Capital
“Authorities ordered more than a fifth of
private vehicles off the road in the capital and offered free subway and light-train rides
to clear the air on the third straight day
of emergency pollution measures.”
Wall Street JournalMarch 18, 2016
Updating Offshore Drillers and OSVs Estimates and PTs“While the equities have already lost significant value during this downturn, we see oversupply for offshore rigs and vessels lasting through 2018 or perhaps longer if commodities remain depressed..."
COWEN AND COMPANYMarch 21, 2016
Flood Spreads Through the
St. Louis Region“It has been more than
20 years since such extensive flooding
has hit the St. Louis region…The Mississippi
River was expected to crest Thursday in
downtown St. Louis at 43.7 feet, nearly 14 feet over flood stage. That would be the second
highest crest on record, nudging aside the April 1973 flood of 43.2 feet. The forecast crest still would be about 6 feet lower than the record from Aug. 1, 1993.”
St. Louis Post-DispatchDecember 30, 2015
ASG report dives deep into
bizav data“...‘we’re dealing with
first-time sellers that we once dealt with as first-time buyers.’… ‘When
oil hit $50 [a barrel] there was a dramatic effect and it became a buyer’s market.’ ”
AINonlineApril 12, 2016
After Record Year, Shanghai Hawker Pacific
Looks to ExpandAINonline
April 11, 2016
Venezuela teeters on the edge of chaos
“Venezuela has the world’s fastest inflation and its dire recession is worsening. Mr Maduro
last week declared every Friday a holiday for the next two months to save electricity as a prolonged drought
has exacerbated power shortages. There is a lack of basic goods. Analysts warn that the economic
crisis risks turning into a humanitarian one.”
Financial TimesApril 10, 2016
Peabody, world’s
top private coal miner,
files for bankruptcy
St. Louis Post-DispatchApril 13, 2016
2200 Eller DriveP.O. Box 13038Fort Lauderdale, Florida 33316(954) 523 2200
www.seacorholdings.com
China Deploys Fighters to S.
China Sea IslandThe Maritime Executive
April 12, 2016
“Ten commandments – 179 words. Gettysburg address – 286 words.
US Declaration of Independence – 1,300 words. EU regulations
on the sale of cabbage – 26,911 words”
Financial TimesApril 14, 2016
Big US banks pump up provisions for
energy lossesFinancial Times
April 15, 2016
Here Comes $20 Oil
Barron’sFebruary 6, 2016
U.S. Looks Into Whether China Is Dumping Stainless Steel Via Imports“After falling more
than 35% last year, U.S. steel prices are on the rise and investors are
noticing. The benchmark hot-rolled coil index has risen to $402 a ton, up
10.4% from $364 on Dec. 2.”
Wall Street JournalMarch 4, 2016
Industry Annual Report 1985 “The worldwide vessel utilization rate for fiscal 1985 averaged 71.0 percent, down from 71.2 percent recorded in fiscal year 1984 and 78.7 percent in fiscal 1983. Charter rates improved slightly in some operating areas during the year but were insufficient to overcome the effects of the tremendous oversupply of equipment and related depressed rate structures that have persisted in the industry for over three years.
Since April 1983, [the company] has led the industry in eliminating 153 older vessels from service.”
OIL LOWER FOR LONGER
“Oil fallout $150bn losses on energy
company bonds spur default fears”
Financial Times March 22, 2016
The next shock?The price of oil has fallen by half in the
past two years, to just over $10 a barrel.
It may fall further—and the effects will
not be as good as you might hope
“OIL is cheaper today, in real terms, than it
was in 1973.” The EconomistMarch 4, 1999
Industry Annual Report 1989
“Other major activities during the year included:
Reduction in the work force by another 28 percent, to a new level of 2,300 personnel from last year’s 3,100. The reduction in personnel will not affect our ability to continue to provide high quality customer service.”
Oil prices may have bottomed, says IEA
“The International Energy Agency, which in February warned recovering prices might be a ‘false dawn’
for the industry, now sees signs that the market may be balancing quicker than
previously thought.”Financial Times Weekend,
Asia EditionMarch 11, 2016
Tudor Pickering
Holt Energy
Thoughts“…Given the WTI move
from $26/bbl in early Feb to WTI to ~$40/
bbl and a narrowing of the 12-month contango from $12/bbl to <$5/
bbl, the market is fixated on fundamental data
points to determine if the rally is real (TPH says
‘believe’!).”Tudor, Pickering, Holt & Co.
April 11, 2016
Oil price: ‘Shot in the arm’ misses economic target“…Americans have responded to the drop in oil prices with enthusiasm. Sales of sports utility vehicles surged in 2015, helping to push total car sales to an all-time high of 17.5m, as drivers covered a record 3.2tn miles.”
Financial TimesApril 5, 2016
Goldman Says Oil at $35 Is
‘Goldilocks’ Ideal for
U.S. Explorers
BloombergApril 7, 2016
SEACOR Holdings Inc. Annual Report2015 SUBSCRIPTION: $54.61FORT LAUDERDALE, FLORIDA
$30/barrel
$40/barrel
$45/barrel
$35/barrel
FEBRUARY MARCH APRIL
CRUDE BENCHMARK TOPS $40
Data source: Bloomberg
Opec’s days as economic force are ‘over’
Financial TimesApril 11, 2016
Barged Coal Shipments to Domestic Generators Plunge
Volume Falls to Multi-Decade Lows
River Transport NewsMarch 28, 2016