offline network intrusion detection:...
TRANSCRIPT

Offline Network Intrusion Detection: MINING TCPDUMP Data to Identify Suspicious ActivityPresented at the AFCEA Federal Database Colloquium
San Diego, CA 21-23Sept1999
1
OFFLINE NETWORK INTRUSION DETECTION: MINING TCPDUMP DATA TO IDENTIFYSUSPICIOUS ACTIVITY
KRISTIN R. NAUTA AND FRANK LIEBLE
Abstract
With the boom in electronic commerce and the increasing global interconnectedness of computer systems,infrastructure protection has quickly become the ’next big problem’ after Year 2000 preparedness. Publicand private sector organizations have a created a multi-billion dollar market demand for tools to protectthemselves against cyber attacks. System administrators are scrambling to find in-line and off-line solutionsfor detecting network vulnerabilities, and to understand the behavior of network resource consumers.
This paper will provide an introduction to the intricacies of reconciling TCPDUMP packet flow data in aneffort to construct IP conversation behavior profiles. The resulting behavior profiles are warehoused forreporting and trend analysis. The behavioral data is mined to identify potential suspicious or intrusivenetwork activity. Finally, by applying the patterns discovered through mining to the randomly timedsamples of TCP packet flow data, systems administrators can monitor behavior exception reports forinfrastructure vulnerabilities.
OVERVIEW OF OFFLINE INTRUSION DETECTION
With the boom in electronic commerce and the increasing global interconnectedness of computer systems,infrastructure protection has quickly become the ’next big problem’ after Year 2000 preparedness. Publicand private sector organizations have a created a multi-billion dollar market demand for tools to protectthemselves against cyber attacks. These organizations hope to protect the consumer information found intransaction systems; employee data stored in newly implemented ERP systems; and intellectual propertystored in their internal knowledge bases, data warehouses, and decision support systems. It is estimated thata full 80% of an organizations’ intellectual assets are in digital form. Table 1 displays the Gartner Group’ssuggested information security hierarchy.
Information Security Hierarchy
Level 6Validation
Level 5Auditing, Monitoring, Investigating
Level 4Information Security Technologies and Products
Level 3Information Security Awareness and Training
Level 2Information Security Architecture and Processes
Level 1Information Security Policy and Standards
Table 1: Information Assurance Hierarchy, Gartner Group

Offline Network Intrusion Detection: MINING TCPDUMP Data to Identify Suspicious ActivityPresented at the AFCEA Federal Database Colloquium
San Diego, CA 21-23Sept1999
2
Often, network security violations originate within the network itself, coming from disgruntled or otherwiseill-motivated employees; or from external individuals who have gained access to internal accounts. Theirbehaviors may involve disruption of services; or the theft or destruction of important files. The fear ofgaining a bad reputation through public exposure often prevents attacked organizations from revealingattacks. Thus, although it is difficult to track the losses associated with intrusive acts, system administratorsare scrambling to find in-line and off-line solutions for detecting network vulnerabilities, and to understandthe behavior of network resource consumers.
There are two types of software solutions available to aid in this quest:
“Intrusion detection systems collect information from variousvantage points within a computer system or network, and analyze thatinformation for symptoms of system breaches.”
“Vulnerability systems check the network and hosts for configurationproblems that could give rise to security vulnerabilities.”
This paper will discuss implementing an off-line network intrusion detection system to periodically analyzeor audit batches of TCP/IP network log data. Further we will discuss how to apply an initial analysis to datacollected in future periods so that systems administrators can use exception reports to identify suspectedintrusions. It is important to note that no software can monitor all network traffic because the dataprocessing becomes prohibitive. By including network intrusion detection into the comprehensive securityinfrastructure, system administrators can provide the organization with a more secure computingenvironment.
USING SAS SOFTWARE FOR OFFLINE INTRUSION DETECTION
To solve the complex issues involved in turning TCP/IP network transactions into data suitable forwarehousing, mining, and exception reporting we utilized a synergistic combination of products, namelySAS Enterprise Miner and SAS IT Service Vision to attack the problem.
The SAS Enterprise Miner package can be used to analyze incoming TCP/IP traffic data, analyze the datafor unauthorized activities and notify system administrators of identified threats. SAS Enterprise Minerincludes the Base SAS software package along with its 4th generation data manipulation language whichcan be used to re-construct TCP/IP conversations in whole, and to create data content features relevant tothe behavior of non-normal network activity. Once the appropriate data structure is created, SAS EnterpriseMiner provides a full suite of supervised and unsupervised data mining algorithms, which can be used toformulate intrusion detection models. In the initial stages of intrusion detection system implementation thestatus of current network activity is often unknown making unsupervised models required to provide thecategorization of conversations as normal or non-normal. Non-normal categorization can be specific, i.e.,denial of service, port scanning probes, and super user access. SAS Enterprise Miner includes tools tovisualize data and model results. These models can be applied in a near real time scenario against incomingTCP/IP data to detect unauthorized activity.

Offline Network Intrusion Detection: MINING TCPDUMP Data to Identify Suspicious ActivityPresented at the AFCEA Federal Database Colloquium
San Diego, CA 21-23Sept1999
3
In addition, SAS IT Service Vision will allow administrators to build a read-only, analytical datawarehouse, which will be used as the foundation for managing large quantities of incoming TCP/IP trafficdata. This data warehouse, known as the performance database (PDB), will provide the ability store datainto five levels, Detail - cleansed, transformed data in a non-aggregated format, and Day, Week, Month,and Year - detail data summarized into specific descriptive statistics by different time intervals for longterm historical reporting and analysis. Once the TCP/IP traffic data is loaded into a PDB it can accessedusing any of the SAS Software tools.
SAS IT Service Vision can be used to identify and monitor simple relationships in the TCP/IP networklogs. With SAS Enterprise Miner, complex multivariate models can be created to profile intrusivebehaviors.
DATA COLLECTION AND ENHANCEMENT
TCP/IP traffic data is generated using a data collection application, which is referred to as a collector. Acollector can be a "home grown" application or purchased from one of many network performance vendorsavailable in the market. When network data is generated it is stored in files commonly known as networkdata logs. These data logs can be represented in a wide variety of formats, i.e. ASCII, binary, RDBMStables which can pose as a problem in reporting and analysis. Also pre-processing of the network datawithin the logs is usually required so that the data can be standardized. This will ensure that the data isprocessed correctly and that there are no discrepancies in the representation of the data.
PERFORMANCE DATA WAREHOUSE
Due to the sheer volume of data a methodology needs to be implemented to organize and manage thenetwork data. The performance data warehouse (PDB) provides the ability to filter and store the TCP/IPdata into a multilevel repository utilizing three major principals:
1) Data Filtering - defining what performance metrics are to be kept in the PDB. This will allow for theloading of useful data in the PDB and discard unwanted performance metrics,
2) Data Aging - defining how long performance data are to be kept in the PDB before it is deleted orarchived. This will manage the size of the PDB and manage data dormancy, and
3) Data Aggregation - defining summary statistics the detail data will be reduced by, i.e., mean,maximum, minimum.
This will allow for easier reporting by reducing machine cycles and run time. With these three principalslarge amounts of TCP/IP traffic data can be managed and organized for reporting and analysis.
Once the traffic data has been cleansed, loaded, and reduced into a PDB it can be used for a wide variety ofreporting and analysis. For example, exception reporting, once data mining determines the unauthorizedactivities and threats within the TCP/IP data they can be fed back into the PDB as exception rules. Theseexception rules can be applied against the PDB’s detail and/or summarized data allowing for the ability toidentify intrusions over a wider span of time.

Offline Network Intrusion Detection: MINING TCPDUMP Data to Identify Suspicious ActivityPresented at the AFCEA Federal Database Colloquium
San Diego, CA 21-23Sept1999
4
DATA MINING
Data mining strategies fall into two broad categories: supervised learning and unsupervised learning.Supervised learning methods are deployed when there exists a field or variable (target) with known valuesand about which predictions will be made by using the values of other fields or variables (inputs).Unsupervised learning methods tend to be deployed on data for which there does not exist a field orvariable (target) with known values, while fields or variables do exist for other fields or variables (inputs).Unsupervised learning methods while more frequently used in cases where a target field does not exist, canbe deployed on data for which a target field exists. Table 2 breaks down data mining techniques bymodeling objective and supervised/unsupervised distinctions.
ModelingObjective Supervised UnsupervisedPrediction Regression and
Logistic regressionNeural NetworksDecision Trees
Note targets can be binary,interval, nominal, or ordinal.
Not feasible
Classification Decision TreesNeural NetworksDiscriminant Analysis
Note targets can be binary,nominal, or ordinal.
Clustering (K-means, etc)Neural NetworksKohonen NetworksSelf Organizing Maps
Exploration Decision Trees
Note targets can be binary,nominal, or ordinal.
Principal ComponentsClustering (K-means, etc)
Affinity AssociationsSequencesFactor Analysis
Table 2: Modeling Objectives and Data Mining Techniques
Table 1 displays four modeling objectives: prediction; classification; exploration; and affinity. Predictionalgorithms determine models or rules to predict continuous or discrete target values given input data. Forexample, a prediction problem could attempt to predict the value of the S&P 500 Index given some inputdata (e.g. economic crash in Asia, trade balances, etc.).
Classification algorithms determine models to predict discrete values given input data. A classificationproblem might involve trying to determine if transactions represents anomalous behavior based on someindicators (if the purchase was made at a pawn shop, amount of purchase, type of purchase, etc.).
Exploration uncovers dimensionality in input data. Trying to uncover groups of similar customers based onspending habits for a large, targeted mailing is an exploration problem. Affinity analysis determines whichevents are likely to occur in conjunction with one another. Retailers use affinity analysis to analyze productpurchase combinations in grocery stores.
Both supervised and unsupervised learning methods are useful for classification purposes. In a particularbusiness problem involving anomaly detection, the objective may be to establish a classification scheme foranomalies. Regression, decision trees, neural networks and clustering can all address this problem.Decision trees and neural networks build classification rules and other mechanisms for detecting anomalies.Clustering would indicate what types of groupings (based on a number of inputs) in a given population aremore at risk for exhibiting anomalies, with the grouping membership of a transaction classifying if atransaction were at greater risk of being anomalous.

Offline Network Intrusion Detection: MINING TCPDUMP Data to Identify Suspicious ActivityPresented at the AFCEA Federal Database Colloquium
San Diego, CA 21-23Sept1999
5
CASE STUDY: TCPDUMP HEADER DATA
In this case study we used data provided on the Internet at http://iris.cs.uml.edu:8080/ . Raw TCPDUMPdata was collected under a simulated network environment. The network simulated a baseline environmentwithout intrusions and four types of intrusions. Each simulation was approximately 10 minutes of real time.The intrusion simulations were:
• IP Spoofing - With IP spoofing an intruder attempts to busy out the system by creating numerous halfopen connections, often within a small period of time.
• Rlogin - The RLOGIN attack is characterized by a high rate of connections from one node to another,often within a small period of time. In this attack, the intruder is attempting to gain access to thesystem.
• Network Scanning - Network scans are used to determine vulnerable ports. The attack is oftencharacterized by accessing a high number of ports on limited set of addresses.
• Network Hopping - Network hopping is used to cover the trail of an intruder on your network,making it more difficult to pinpoint the original vulnerability that allowed access to the systems. Ahopping attack appears as a chain of subsequent logins to various networked machines.
The goal of the analysis is to create descriptive information from the raw TCPDUMP header files, then tomine the data in order to determine likely intrusive TCP/IP connections.
Data Collection and Enhancement
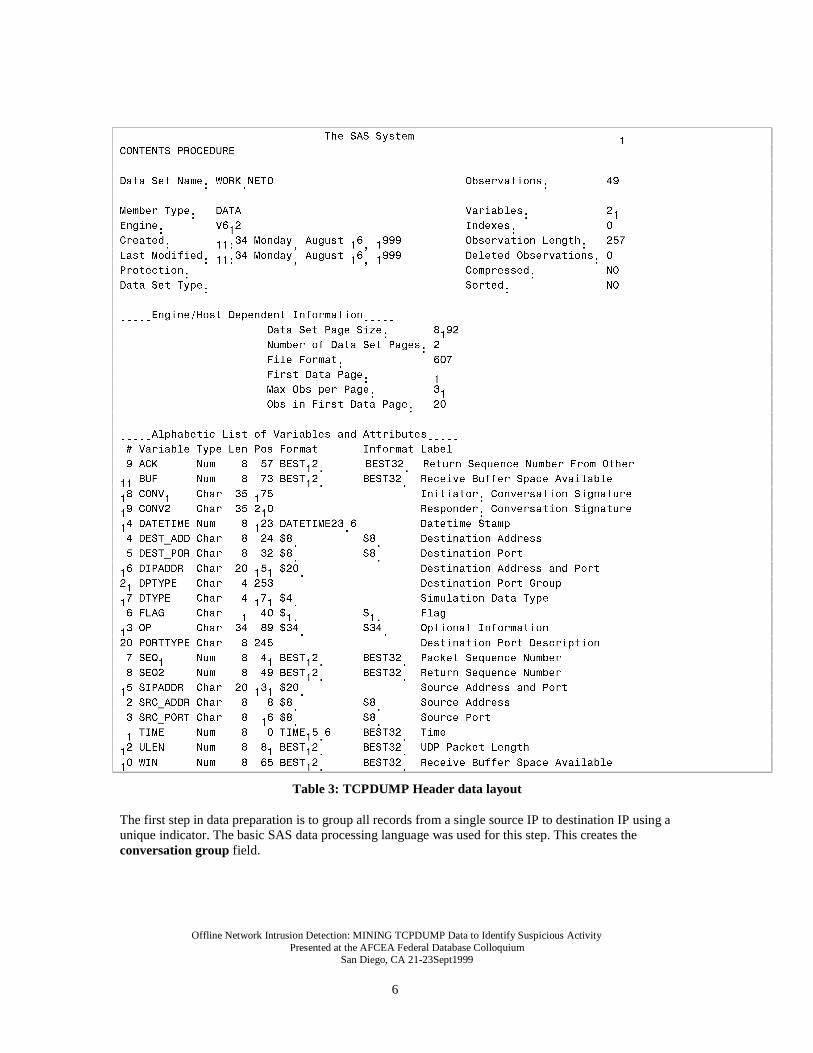
The raw data consisted of packet level transmission data including source and destination IP address andports; flags, acknowledgements and packet sequence numbers; and window, buffer and optionalinformation. Table 3 displays the full TCPDUMP header data layout.
Data analysts often recognize the fact that 80% to 90% of their works is really data preparation. With theintrusion simulation data, this was certainly the case. Upon inspection of the data, you find that no singlerecord represents a complete conversation between two IP addresses. In fact, each record is only a portionof the conversation: the source sending information to the destination, or vice versa. In order to createuseful inputs for data mining, we must first determine which records are part of the same conversation.After the conversation reconciliation, we can compute meaningful variables such as the number ofconnections made to a one or more destination IP addresses within a two-second time window.
For data mining then, the data preparation goals is to establish the final state of a conversation; then tounderstand the behavior of each source IP address on the network in relation to destination IP addresses anddestination ports. Steps in the data processing are discussed in the remainder of this section.
Offline Network Intrusion Detection: MINING TCPDUMP Data to Identify Suspicious ActivityPresented at the AFCEA Federal Database Colloquium
San Diego, CA 21-23Sept1999
6
��������������������������������7KH�6$6�6\VWHP���������������������������������
&217(176�352&('85(
'DWD�6HW�1DPH��:25.�1(7�������������������������������2EVHUYDWLRQV������������
0HPEHU�7\SH����'$7$�����������������������������������9DULDEOHV���������������
(QJLQH���������9��������������������������������������,QGH[HV����������������
&UHDWHG��������������0RQGD\��$XJXVW�������������������2EVHUYDWLRQ�/HQJWK�������
/DVW�0RGLILHG��������0RQGD\��$XJXVW�������������������'HOHWHG�2EVHUYDWLRQV���
3URWHFWLRQ��������������������������������������������&RPSUHVVHG������������12
'DWD�6HW�7\SH�����������������������������������������6RUWHG����������������12
�����(QJLQH�+RVW�'HSHQGHQW�,QIRUPDWLRQ�����
�����������������������'DWD�6HW�3DJH�6L]H������������
�����������������������1XPEHU�RI�'DWD�6HW�3DJHV���
�����������������������)LOH�)RUPDW������������������
�����������������������)LUVW�'DWD�3DJH������������
�����������������������0D[�2EV�SHU�3DJH������������
�����������������������2EV�LQ�)LUVW�'DWD�3DJH������
�����$OSKDEHWLF�/LVW�RI�9DULDEOHV�DQG�$WWULEXWHV�����
���9DULDEOH�7\SH�/HQ�3RV�)RUPDW�������,QIRUPDW�/DEHO
���$&.������1XP����������%(67������� �%(67�����5HWXUQ�6HTXHQFH�1XPEHU�)URP�2WKHU
���%8)������1XP����������%(67���������%(67�����5HFHLYH�%XIIHU�6SDFH�$YDLODEOH
���&219�����&KDU�������������������������������,QLWLDWRU��&RQYHUVDWLRQ�6LJQDWXUH
���&219�����&KDU�������������������������������5HVSRQGHU��&RQYHUVDWLRQ�6LJQDWXUH
���'$7(7,0(�1XP����������'$7(7,0(��������������'DWHWLPH�6WDPS
���'(67B$''�&KDU�������������������������������'HVWLQDWLRQ�$GGUHVV
���'(67B325�&KDU�������������������������������'HVWLQDWLRQ�3RUW
���',3$''5��&KDU�������������������������������'HVWLQDWLRQ�$GGUHVV�DQG�3RUW
���'37<3(���&KDU�������������������������������'HVWLQDWLRQ�3RUW�*URXS
���'7<3(����&KDU�������������������������������6LPXODWLRQ�'DWD�7\SH
���)/$*�����&KDU�������������������������������)ODJ
���23�������&KDU�������������������������������2SWLRQDO�,QIRUPDWLRQ
���32577<3(�&KDU�������������������������������'HVWLQDWLRQ�3RUW�'HVFULSWLRQ
���6(4������1XP����������%(67���������%(67�����3DFNHW�6HTXHQFH�1XPEHU
���6(4������1XP����������%(67���������%(67�����5HWXUQ�6HTXHQFH�1XPEHU
���6,3$''5��&KDU�������������������������������6RXUFH�$GGUHVV�DQG�3RUW
���65&B$''5�&KDU�������������������������������6RXUFH�$GGUHVV
���65&B3257�&KDU�������������������������������6RXUFH�3RUW
���7,0(�����1XP����������7,0(���������%(67�����7LPH
���8/(1�����1XP����������%(67���������%(67�����8'3�3DFNHW�/HQJWK
���:,1������1XP����������%(67���������%(67�����5HFHLYH�%XIIHU�6SDFH�$YDLODEOH
Table 3: TCPDUMP Header data layout
The first step in data preparation is to group all records from a single source IP to destination IP using aunique indicator. The basic SAS data processing language was used for this step. This creates theconversation group field.
Offline Network Intrusion Detection: MINING TCPDUMP Data to Identify Suspicious ActivityPresented at the AFCEA Federal Database Colloquium
San Diego, CA 21-23Sept1999
7
Next, we used the packet flags and acknowledgements to determine the current status of a connection. Forexample, is the connection currently being opened, is already opened, is being closed, is completely closed.Once the records are grouped from the preceding step, the data is sorted by conversation grouping and timeof connection. We then retain the flag across each record, compare with the current flag, and determine theconnection state. We applied simple logic such as, if a conversation has three records with a SYN flag, thenassume a conversation is opened. This step could be improved by refining the logic to determineconversation status. This creates the final state field.
To get information on what action the user was attempting, we mapped the destination ports to specific useractions. The destination port determines the function the user is trying to access, while the source port isassigned randomly. Most network administrators use a common set of port mappings. By transforming portnumbers into action types, we can determine basic information about what a user was attempting. For thiscase study, we created high level groupings of the port types as login, email, system status check, SNMP,date, who, chat, and other. This creates the destination port type filed.
In order to consider automated versus manual input stream, we needed to determine the amount timeelapsed between connections to different destination IP addresses from a single IP source address, and todifferent destination ports on a single destination IP address from a single IP Source address. We thencreated indicators for elapsed time within specific ranges. For example we indicated if the elapsed time wasless than 5 seconds, between 5 and 30 seconds, greater than 30 seconds, or undeterminable. This creates thetime difference to destination address and time difference to destination port fields.
Exploring Conversation Data for Simple Relationships
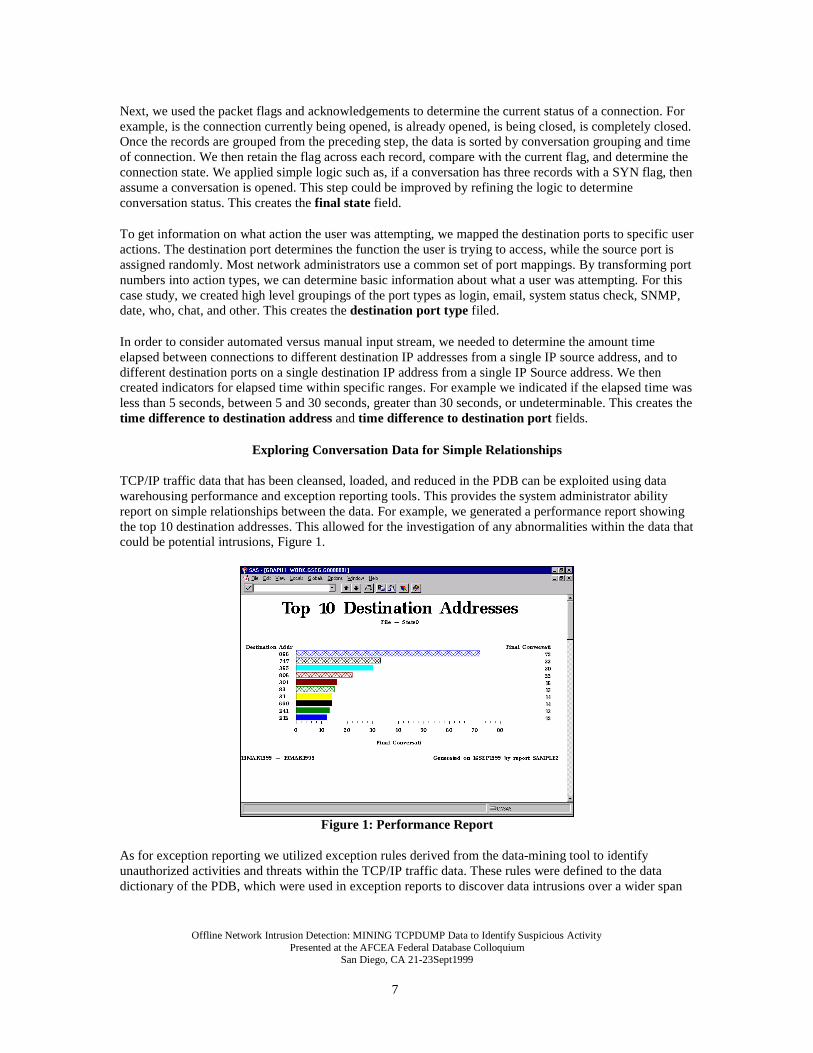
TCP/IP traffic data that has been cleansed, loaded, and reduced in the PDB can be exploited using datawarehousing performance and exception reporting tools. This provides the system administrator abilityreport on simple relationships between the data. For example, we generated a performance report showingthe top 10 destination addresses. This allowed for the investigation of any abnormalities within the data thatcould be potential intrusions, Figure 1.
Figure 1: Performance Report
As for exception reporting we utilized exception rules derived from the data-mining tool to identifyunauthorized activities and threats within the TCP/IP traffic data. These rules were defined to the datadictionary of the PDB, which were used in exception reports to discover data intrusions over a wider span

Offline Network Intrusion Detection: MINING TCPDUMP Data to Identify Suspicious ActivityPresented at the AFCEA Federal Database Colloquium
San Diego, CA 21-23Sept1999
8
of time. For example, the destination address times for connections less then 5 seconds, less then 30seconds, greater then 30 seconds, and unknown.
By applying the exception rules to the TCP/IP traffic data stored in the PDB an exception report wasgenerated, Figure 2. We can clearly identify that for this specified period time 5422 connections are lessthan 5 seconds. This would alert the administrator to investigate this potential anomaly further.
Figure 2: Exception Report
Mining Behavior Data for Complex Relationships
For data mining, we wanted to create a single record for each source IP address describing its behavior onthe network. We summarized the final states, number of destination IP addresses, and time differences todestination address fields by the source IP address. This provides, for each source IP address, counts of thenumber of times each final state occurred, to how many IP addresses were connections made, and counts ofthe time difference groupings. We also summarized the destination port types and time differences todestination ports by the combined source and destination IP addresses. This provides, for each unique IPsource to destination IP connection, the number of times each specific action was attempted, and thenumber of times port hits occurred within the specified intervals.
To create a single analysis file, we merged the two summary files by source IP address. This results in onefile containing the behavior of each source IP with respect to the various destination IP addresses and portsfor the given time period. The resulting file layout is displayed in Table 4.

Offline Network Intrusion Detection: MINING TCPDUMP Data to Identify Suspicious ActivityPresented at the AFCEA Federal Database Colloquium
San Diego, CA 21-23Sept1999
9
���������������������������������7KH�6$6�6\VWHP���������������������������������
&217(176�352&('85(
'DWD�6HW�1DPH��,1758'(5�0,1($//����������������������2EVHUYDWLRQV���������������
0HPEHU�7\SH����'$7$����������������������������������9DULDEOHV���������������
(QJLQH���������9�������������������������������������,QGH[HV����������������
&UHDWHG��������������:HGQHVGD\��0DUFK����������������2EVHUYDWLRQ�/HQJWK�������
/DVW�0RGLILHG��������:HGQHVGD\��0DUFK����������������'HOHWHG�2EVHUYDWLRQV���
3URWHFWLRQ�������������������������������������������&RPSUHVVHG������������12
'DWD�6HW�7\SH����������������������������������������6RUWHG����������������12
�����������������������(QJLQH�+RVW�'HSHQGHQW�,QIRUPDWLRQ�����
�����������������������'DWD�6HW�3DJH�6L]H������������
�����������������������1XPEHU�RI�'DWD�6HW�3DJHV�����
�����������������������)LOH�)RUPDW������������������
�����������������������)LUVW�'DWD�3DJH������������
�����������������������0D[�2EV�SHU�3DJH������������
�����������������������2EV�LQ�)LUVW�'DWD�3DJH������
�����$OSKDEHWLF�/LVW�RI�9DULDEOHV�DQG�$WWULEXWHV�����
�����9DULDEOH�7\SH�/HQ�3RV�)RUPDW�,QIRUPDW�/DEHO
�����&/26('���1XP����������������������������)LQDO�6WDWHV��&ORVHG
�����'$7$:$6��&KDU�������������������������2ULJLQ�RI�,QWUXVLRQ�'DWD
�����'$7(�����1XP����������������������������'DWH�3RUW�5HTXHVWV
�����'16������1XP����������������������������)LQDO�6WDWHV��'16
�����)73������1XP����������������������������)73�3RUW�5HTXHVWV
�����*15/�����1XP����������������������������*HQHUDO�3RUW�5HTXHVWV
�����*7��'$���1XP����������������������������7LPHV�%HWZ�'HVW�$GGU�*7����6HF
�����*7��'3���1XP����������������������������7LPHV�%HWZ�'HVW�3RUW�*7����6HF
�����/(��'$���1XP����������������������������7LPHV�%HWZ�'HVW�$GGU�/(���6HF
�����/(��'3���1XP����������������������������7LPHV�%HWZ�'HVW�3RUW�/(���6HF
�����/(��'$���1XP����������������������������7LPHV�%HWZ�'HVW�$GGU�/(����6HF
�����/(��'3���1XP����������������������������7LPHV�%HWZ�'HVW�3RUW�/(����6HF
�����/2*������1XP����������������������������/RJLQ���3RUW�5HTXHVWV
�����/2*������1XP����������������������������/RJLQ���3RUW�5HTXHVWV
�����0$,/�����1XP����������������������������0DLO�3RUW�5HTXHVWV
�����1'$''5���1XP����������������������������'HVW�$GGU�IURP�6UF�$GGU
�����1'3257���1XP����������������������������'HVW�3RUWV�IRU�6$__'$
�����1(:������1XP����������������������������)LQDO�6WDWHV��1HZ
�����16$''5���1XP����������������������������6UF�$GGU�LI�WKLV�ZDV�'HVW�$GGU
�����23(1('���1XP����������������������������)LQDO�6WDWHV��2SHQHG
�����65&B$''5�&KDU�������������������������6RXUFH�$GGUHVV
�����65&B'(67�&KDU�������������������������6RXUFH�$GGUHVV__'HVWLQDWLRQ�$GGUHVV
�����81.'$����1XP����������������������������7LPHV�%HWZ�'HVW�$GGU�8QNQRZQ
�����81.'3����1XP����������������������������7LPHV�%HWZ�'HVW�3RUW�8QNQRZQ
�����:+2������1XP����������������������������:KR�3RUW�5HTXHVWV
Table 4: TCPDUMP Data Prepared for Mining
Offline Network Intrusion Detection: MINING TCPDUMP Data to Identify Suspicious ActivityPresented at the AFCEA Federal Database Colloquium
San Diego, CA 21-23Sept1999
10
Mining the Data
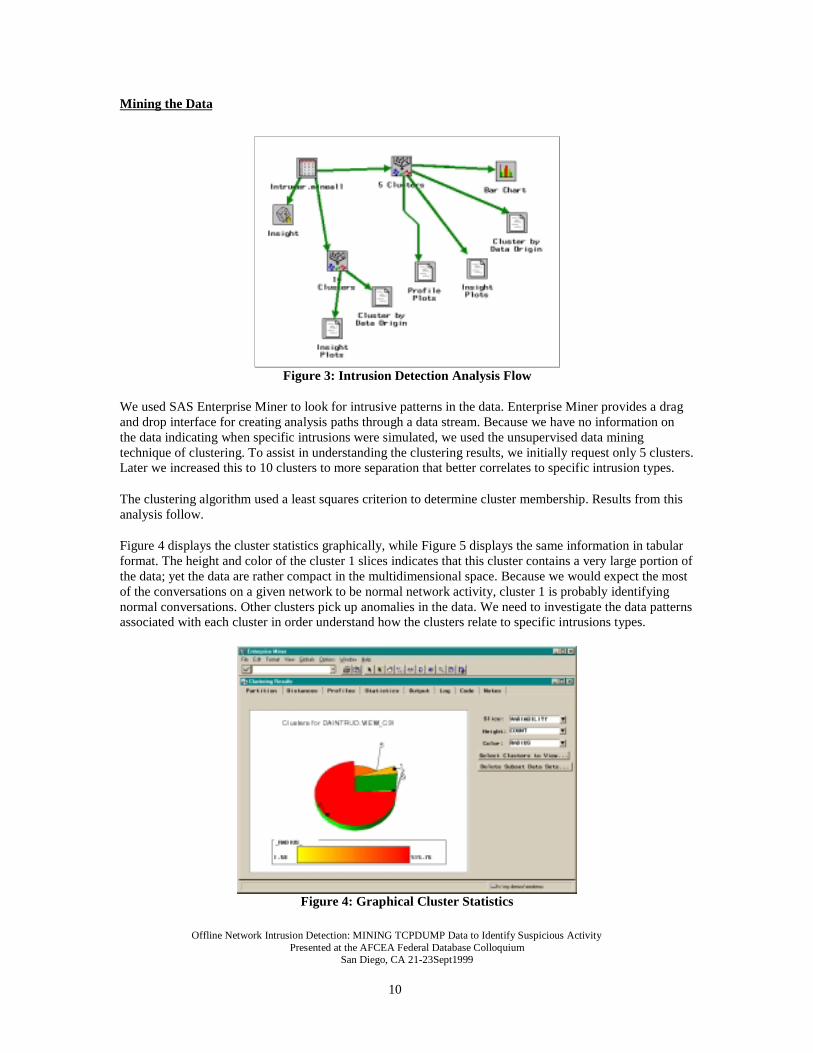
Figure 3: Intrusion Detection Analysis Flow
We used SAS Enterprise Miner to look for intrusive patterns in the data. Enterprise Miner provides a dragand drop interface for creating analysis paths through a data stream. Because we have no information onthe data indicating when specific intrusions were simulated, we used the unsupervised data miningtechnique of clustering. To assist in understanding the clustering results, we initially request only 5 clusters.Later we increased this to 10 clusters to more separation that better correlates to specific intrusion types.
The clustering algorithm used a least squares criterion to determine cluster membership. Results from thisanalysis follow.
Figure 4 displays the cluster statistics graphically, while Figure 5 displays the same information in tabularformat. The height and color of the cluster 1 slices indicates that this cluster contains a very large portion ofthe data; yet the data are rather compact in the multidimensional space. Because we would expect the mostof the conversations on a given network to be normal network activity, cluster 1 is probably identifyingnormal conversations. Other clusters pick up anomalies in the data. We need to investigate the data patternsassociated with each cluster in order understand how the clusters relate to specific intrusions types.
Figure 4: Graphical Cluster Statistics

Offline Network Intrusion Detection: MINING TCPDUMP Data to Identify Suspicious ActivityPresented at the AFCEA Federal Database Colloquium
San Diego, CA 21-23Sept1999
11
Figure 5: Tabular Cluster Statistics
Cluster 4 appears to be the second largest grouping of data points; and to have large variability in the multi-dimensional space. Cluster 5 is rather small, both in membership and radius. Clusters 2 and 3 are alsorelatively small. In fact cluster 3 has only 2 observations. We need to determine if these two small clustersare really identifying intrusions, or are just picking up outliers in the data.
Figure 6: Cluster Proximities
Figure 6 displays the clusters on the principal component axes of the multi-dimensional space we analyzed.Each cluster mean is surrounded by a circle indicating the cluster radius. From this graphic it is obviousthat the observations in clusters 1 and 5 have similar raw data (network behaviors); and the same is true forclusters 2, 3 and 4.
To associate the cluster values with specific intrusion types, we need to explore the data further. When wemanipulated the data for mining, we created groups of variables that inherently make sense to evaluatetogether. For example, we counted the number of different connection final states for each source IPaddress. These final states counts were represented as unique independent variables in our analysis. Tounderstand which clusters may represent RLOGIN attacks, we need to compare the average number ofLOGIN attempts versus other port related activities, across the clusters.

Offline Network Intrusion Detection: MINING TCPDUMP Data to Identify Suspicious ActivityPresented at the AFCEA Federal Database Colloquium
San Diego, CA 21-23Sept1999
12
Figures 7 through 11 display profile plots of the appropriate groups of variables. Figure displays the profileplot for port types by cluster. In figure 7 we see that cluster 3 as a high number of login attempts relative toother clusters, implying that this cluster could be segmenting out RLOGIN attacks. The observation thatthere are a large number of general ports for clusters 3 and 5 is probably no interesting. However we mayneed to break the general port category into other more meaningful groupings to find interestingrelationships in the data.
Figure 7: Port Types Profile Plot
Figure 8 displays the profile plot for numbers of destination addresses, destination ports, and source ports.In this plot, the high number of addresses associated with clusters 2, 3, and 4 is not necessarily interesting;and cluster 1 again seems to be picking up normal, light network activity. However the activity of cluster 5is very interesting. Cluster 5 shows very few addresses connecting to a relatively high number of ports.This behavior is indicative of network hopping.
Figure 8: Address and Ports Profile Plot
The profile plot for the final conversation states is displayed in figure 9. This plots reveals that clusters 3and 4 each have high number of connections left open, and large numbers of connections not fullyestablished (NEW) which could indicate IP Spoofing Activity.

Offline Network Intrusion Detection: MINING TCPDUMP Data to Identify Suspicious ActivityPresented at the AFCEA Federal Database Colloquium
San Diego, CA 21-23Sept1999
13
Figure 9: Final State Profile Plot
Finally, figure 10 and 11 display the profile plots for the number of destinations addresses and portsaccessed within specific time duration. Again clusters 3 and 4 have a large number of addresses and portsbeing accessed in less that 5 seconds, as does cluster 5.
Figure 10: Destination Address Profile Plot
Figure 11: Destination Port Profile Plot

Offline Network Intrusion Detection: MINING TCPDUMP Data to Identify Suspicious ActivityPresented at the AFCEA Federal Database Colloquium
San Diego, CA 21-23Sept1999
14
Table 5 pulls together the interpretations from all the profile plots and indicates the cluster size. We usedthis chart to help relate clusters to intrusion types.
Table 5: Relating Clusters to Intrusion Types
Cluster 3 has only two IP conversations in it, and for each the source and destination IP addresses are thesame. Based on the activity displayed we suspect this cluster is finding the server for each simulation file.However, we would then expect to see 5 observations in the cluster - one for each simulation. To isolatethis activity, we added a new variable to the data to indicate same source and destination addresses and re-ran the analysis. These results will be discussed later.
In an effort to understand the remaining segment, cluster 2, we used visualization software included withEnterprise Miner. Figures 12 and 13 display scatter plots of the variable combinations used for the profileplots earlier. The points in the plots are colored according to cluster membership. Notice that these plotsreveal the same multi-dimensional spacing as figure x did, with clusters 1 and 5 being similar and clusters2,3,and 4 being similar.
Figure 12: Exploring the Clusters Interactively, Part I

Offline Network Intrusion Detection: MINING TCPDUMP Data to Identify Suspicious ActivityPresented at the AFCEA Federal Database Colloquium
San Diego, CA 21-23Sept1999
15
Figure 13: Exploring the Clusters Interactively, Part II
Using the dynamic linking capabilities of these charts, we can highlight all the observations in cluster 2.We can the extract them into their own data table for further investigation. Figure 14 displays the data forcluster 2 along with a bar chart for the source addresses present in the table. Cluster 2 is comprised ofvarious conversations originating from source address 2 (note the IP addresses were cleansed in the rawdata). Further, all the records in this cluster originated from the Hopping and IP Spoofing simulations. Thiscluster has found some behavior that is similar among activities in these two files.
Figure 14: Isolating Cluster 2 Records
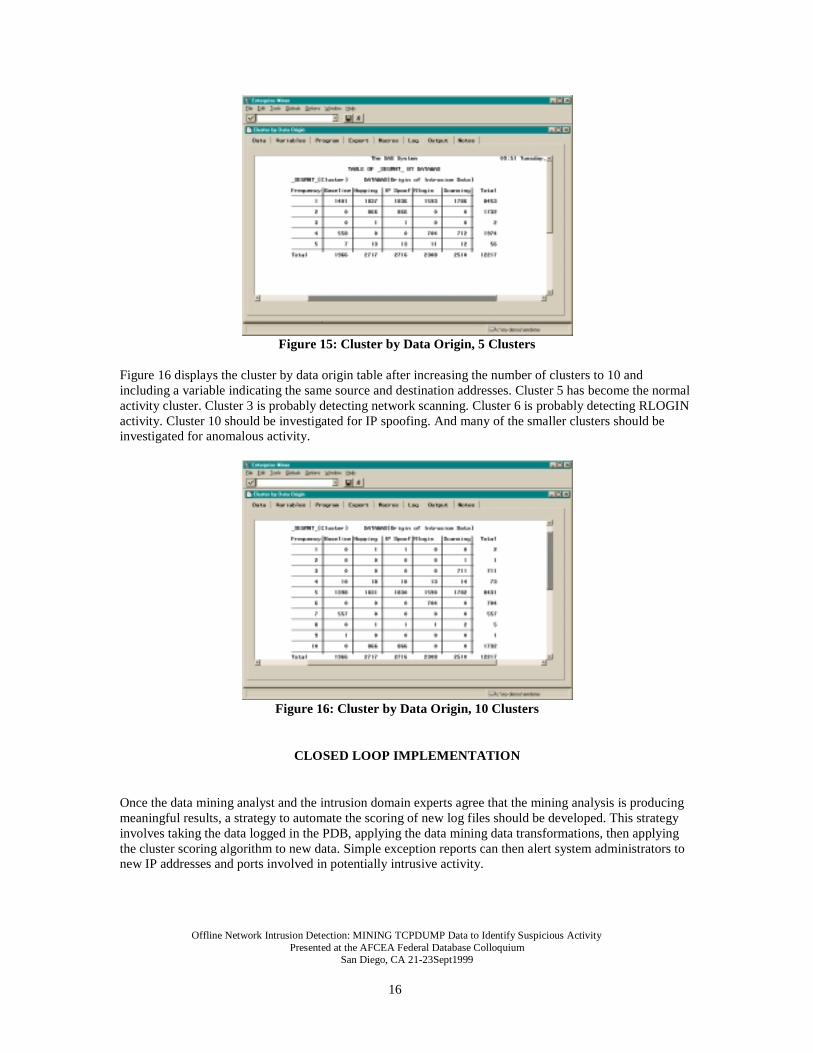
As a final check on the appropriateness of our analysis, we investigated how our clusters mapped to theoriginal data sources. If the clusters were effectively mapping to different intrusion types, we would expectto see high counts in only 1 DATWAS category, with the exception on the normal activity cluster. Fromfigure 15 it appears that we are isolating some specific intrusions, however increasing the number ofclusters could improve the results.
Offline Network Intrusion Detection: MINING TCPDUMP Data to Identify Suspicious ActivityPresented at the AFCEA Federal Database Colloquium
San Diego, CA 21-23Sept1999
16
Figure 15: Cluster by Data Origin, 5 Clusters
Figure 16 displays the cluster by data origin table after increasing the number of clusters to 10 andincluding a variable indicating the same source and destination addresses. Cluster 5 has become the normalactivity cluster. Cluster 3 is probably detecting network scanning. Cluster 6 is probably detecting RLOGINactivity. Cluster 10 should be investigated for IP spoofing. And many of the smaller clusters should beinvestigated for anomalous activity.
Figure 16: Cluster by Data Origin, 10 Clusters
CLOSED LOOP IMPLEMENTATION
Once the data mining analyst and the intrusion domain experts agree that the mining analysis is producingmeaningful results, a strategy to automate the scoring of new log files should be developed. This strategyinvolves taking the data logged in the PDB, applying the data mining data transformations, then applyingthe cluster scoring algorithm to new data. Simple exception reports can then alert system administrators tonew IP addresses and ports involved in potentially intrusive activity.

Offline Network Intrusion Detection: MINING TCPDUMP Data to Identify Suspicious ActivityPresented at the AFCEA Federal Database Colloquium
San Diego, CA 21-23Sept1999
17
Building from Unsupervised to Supervised Learning
To further validity of the data mining results, investigators should also build a knowledge base ofinvestigated records. This knowledge base should include not only confirmed intrusion, but also suspectedintrusions that were not proved. The knowledge base can be used to validate the cluster model by feedingthe known cases into a predictive model. Should investigation show the predictive model’s judgment to beerroneous, the cluster analysis would need to be revisited.
The validated cluster model will continue to be applied to new data, producing cases to be investigated. Inturn the knowledge base will accumulate known intrusive activity.
CONCLUSIONS
A combination of unsupervised data mining, data warehousing, and exception reporting allows systemadministrators to identify suspicious network activity, track intrusion occurrences, and automate the off-line intrusion detection process. If actual intrusive events are tracked in a warehouse, the intrusion team canbuild predictive models that validate unsupervised results.
As we move forward in this research we hope to address the following issues:
• Improve the logic used for determining the final conversation states.• Explore methods of applying data mining models created for summarized data, to the raw transaction
data.• Explore how the mining results are affected by the choice of time period for data summarization and
the effects of conversation censoring at beginning and end of the selected time periods.• Add more descriptive variables to the mining data in an effort to achieve a fuller range of behavioral
descriptors.• Experiment with other clustering algorithms.
REFERENCES
An Introduction to Intrusion Detection and Assessment, Rebecca Bace,www.iss.net/prod/whitepapers/intrusion.pdf
Intrusion Detection: Network Security Beyond the Firewall, Terry Escamilla, ISBN: 0-471-29000-9
Information Insecurity, Government Executive, April 1999, www.govexec.com/features/0499/0499s1.htm
12 Mistakes to Avoid for Managing Web Security, CIO Institute, [email protected]
A Perspective on New and Different Threats to Information Security, Intelligent Enterprise, Feb 1999
National Infrastructure Protection Center, www.fbi.gov/nipc/Impdd-63.htm
DARPA Intrusion Detection Evaluation, www.ll.mit.edu/IST/ideval/index.html

Offline Network Intrusion Detection: MINING TCPDUMP Data to Identify Suspicious ActivityPresented at the AFCEA Federal Database Colloquium
San Diego, CA 21-23Sept1999
18
ABOUT THE AUTHORS
Kristin NautaManager, Government Technology CenterProgram Manager, Data MiningSAS Institute Inc.SAS Campus DriveCary, NC [email protected]: 919-677-8000, x4346
As manager of the Government Technology Center at SAS Institute Inc., Kristin Nauta is the federalprogram manager for data mining. Formerly SAS Institute’s data mining program manager for Canada andthe analytical products marketing manager for the US, Kristin has a BS in mathematics from ClemsonUniversity and a Masters of Statistics from North Carolina State University. Kristin has consulted in avariety of fields including pharmaceutical drug research and design, pharmaceutical NDA submissions,database marketing and customer relationship management.
Frank LiebleProgram Manager, IT Service VisionGovernment Technology CenterSAS Institute Inc.1900 Summit Tower BlvdSuite 850Orlando, FL [email protected]: 407-661-1711, x237
Frank Lieble is the program manager for the IT Service Vision solution at SAS Institute's GovernmentTechnology Center. His previous position was product manager for IT Service Vision at SAS Institute'sBusiness Solutions Division. Frank has several years of experience in IT performance data warehousingwhich includes the management, reporting, and analysis of system and network performance data. He has aBachelor of Science degree in Computer Science and a Master of Science degree in Statistical Computingfrom the University of Central Florida.

Offline Network Intrusion Detection: MINING TCPDUMP Data to Identify Suspicious ActivityPresented at the AFCEA Federal Database Colloquium
San Diego, CA 21-23Sept1999
19