oerlikon a global leader in surface solutions and advanced ... oerlikon... · materials (scoperta...
TRANSCRIPT

It's not allowed to change the master It's not allowed to change the master
8,6
4,7
8,0
9,1
6,6
8,3
0,9
0,5
Version September 2012
Oerlikon a global leader in surface
solutions and advanced materials
Jefferies 2017 Industrials Conference
Andreas Schwarzwälder
Senior Vice President, Head of Investor Relations
New York, August 09, 2017

It's not allowed to change the master It's not allowed to change the master
8,6
4,7
8,0
9,1
6,6
8,3
0,9
0,5
Version September 2012
Key facts Oerlikon Group FY 2016
20170809_Oerlikon presentation_Jefferies 2017 Industrials ConferencePage 2
>13 500 employees
2.3 CHF billion sales
>180 locations
37 countries
3 segments

It's not allowed to change the master It's not allowed to change the master
8,6
4,7
8,0
9,1
6,6
8,3
0,9
0,5
Version September 2012
Oerlikon’s strategic priorities confirmed –
focus on execution / operational performance
20170809_Oerlikon presentation_Jefferies 2017 Industrials ConferencePage 3
Creating a global
surface solutions
and advanced
materials
powerhouse
Organic investments:
innovation, markets
and technologies
Additive
Manufacturing
M&A
Surface
Solutions
Manmade
Fibers
Drive
Systems
Repositioning to
allow for value-
creating options
Remaining end
market challenges
Drive innovation
and market share
Manage market cycle
Execution of structural
adoptions concluded
Readiness for post-
trough period
• Strengthen technological leadership (Innovation, expansion, collaboration)
• Grow existing business (Penetration, new markets/applications, service)
• Identify and develop new opportunities – organic and inorganic
• Further develop organization (Structure, capabilities, capacity, footprint)
Group 2017: Enlarge platform for mid-term growth

It's not allowed to change the master It's not allowed to change the master
8,6
4,7
8,0
9,1
6,6
8,3
0,9
0,5
Version September 2012
Surface Solutions Segment
20170809_Oerlikon presentation_Jefferies 2017 Industrials ConferencePage 4

It's not allowed to change the master It's not allowed to change the master
8,6
4,7
8,0
9,1
6,6
8,3
0,9
0,5
Version September 2012
Oerlikon covers a broad range of
complementary surface technologies
20170809_Oerlikon presentation_Jefferies 2017 Industrials ConferencePage 5
Surface
treatment
THIN-FILM COATING
PVD
PECVD (PACVD)
THICK-FILM COATING
Thermal spray
NITRIDING
Plasma nitriding
Bulk
treatment
HARDENING
It's not allowed to change the master It's not allowed to change the master
8,6
4,7
8,0
9,1
6,6
8,3
0,9
0,5
Version September 2012
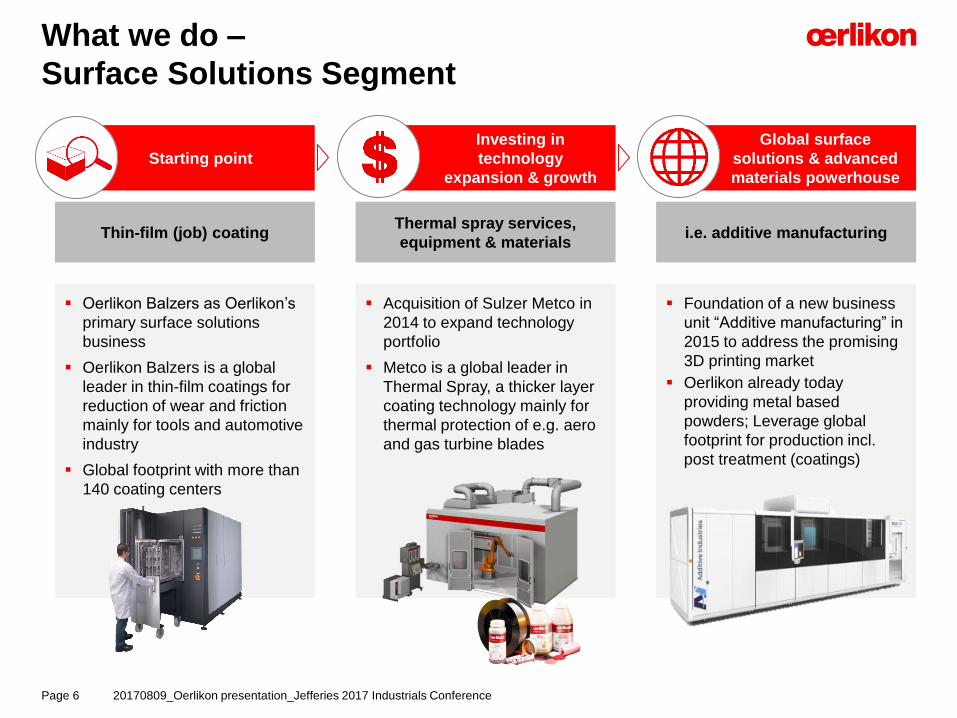
What we do –
Surface Solutions Segment
20170809_Oerlikon presentation_Jefferies 2017 Industrials ConferencePage 6
Starting point
Thin-film (job) coating
Investing in
technology
expansion & growth
Thermal spray services,
equipment & materials
Global surface
solutions & advanced
materials powerhouse
i.e. additive manufacturing
Oerlikon Balzers as Oerlikon’s
primary surface solutions
business
Oerlikon Balzers is a global
leader in thin-film coatings for
reduction of wear and friction
mainly for tools and automotive
industry
Global footprint with more than
140 coating centers
Acquisition of Sulzer Metco in
2014 to expand technology
portfolio
Metco is a global leader in
Thermal Spray, a thicker layer
coating technology mainly for
thermal protection of e.g. aero
and gas turbine blades
Foundation of a new business
unit “Additive manufacturing” in
2015 to address the promising
3D printing market
Oerlikon already today
providing metal based
powders; Leverage global
footprint for production incl.
post treatment (coatings)

It's not allowed to change the master It's not allowed to change the master
8,6
4,7
8,0
9,1
6,6
8,3
0,9
0,5
Version September 2012
Grow additive manufacturing
business (powders & post-
treatment)
Complement technology
portfolio
Develop new products /
applications / end markets /
regions
Grow service businessGrow equipment &
materials businessBusiness development
Continue expansion of
thin-film and thermal spray
service business
Increase number of thermal
spray powders
Continue expansion of thermal
spray equipment
We will grow the Segment along three
strategic directions – organic and inorganic
Page 7 20160810_Oerlikon presentation_Jefferies 2016 Industrials Conference
Leverage combined strength and interdependencies between
coating services, equipment & materials
It's not allowed to change the master It's not allowed to change the master
8,6
4,7
8,0
9,1
6,6
8,3
0,9
0,5
Version September 2012
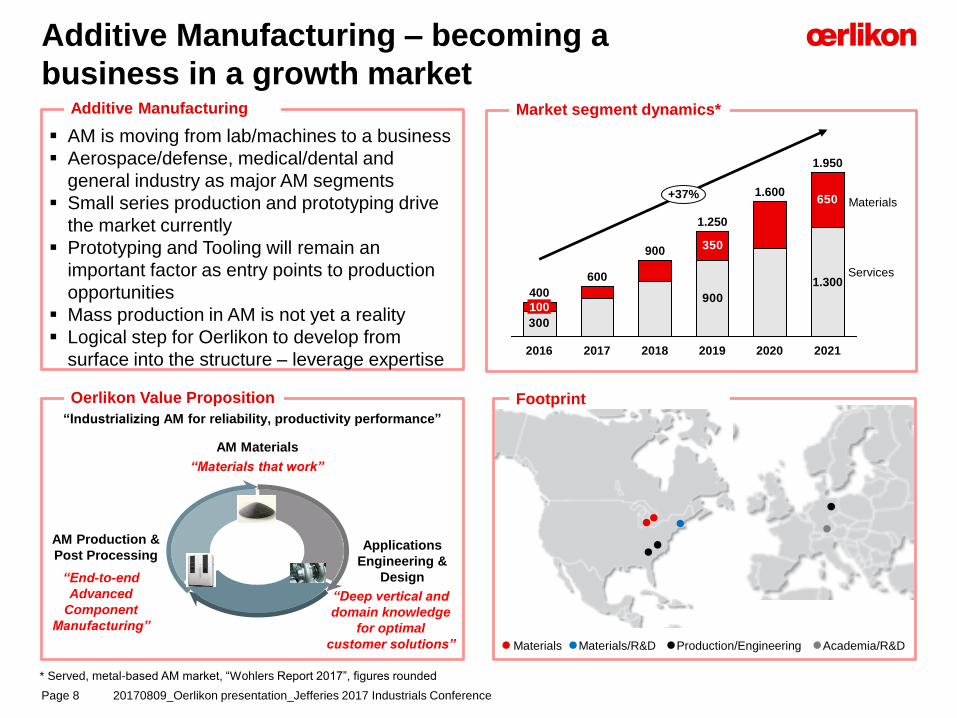
Market segment dynamics*
Materials
Services
Additive Manufacturing – becoming a
business in a growth market
20170809_Oerlikon presentation_Jefferies 2017 Industrials ConferencePage 8
300
900
350
650
2018
600
2016
400
1.250
100
2017
900
1.950
2019
+37%
2021
1.300
2020
1.600
* Served, metal-based AM market, “Wohlers Report 2017”, figures rounded
AM is moving from lab/machines to a business
Aerospace/defense, medical/dental and
general industry as major AM segments
Small series production and prototyping drive
the market currently
Prototyping and Tooling will remain an
important factor as entry points to production
opportunities
Mass production in AM is not yet a reality
Logical step for Oerlikon to develop from
surface into the structure – leverage expertise
Additive Manufacturing
Oerlikon Value Proposition
AM Production &
Post Processing
“End-to-end
Advanced
Component
Manufacturing”
Applications
Engineering &
Design
“Deep vertical and
domain knowledge
for optimal
customer solutions”
AM Materials
“Materials that work”
“Industrializing AM for reliability, productivity performance”
Footprint
Materials Production/Engineering Academia/R&DMaterials/R&D

It's not allowed to change the master It's not allowed to change the master
8,6
4,7
8,0
9,1
6,6
8,3
0,9
0,5
Version September 2012
Oerlikon driving additive manufacturing
development
Production services
Application
engineering
Production
processes
Development and certification
of additive manufacturing
(AM) tailored materials
Complete powder portfolio in
large & small batch sizes
Distribution competence
serving different routes to
market
Strong material handling
competence
Product design engineering
for AM (design for function)
Application engineering
competence
Optimized production
process chain through
end-to-end management
Customer understanding
through partnerships
Optimized machine
parameters and software
solutions
End-to-end coverage of
digital process parameters
Automation of process
(linkage of hardware and
software tools)
Conventional and tailored AM
finishing technologies
Materials
1 3
Value proposition: End-to-end offering
with strong interface management
Industrialization of AM value chain is key
to reach series production level
Systems
Software Hardware
2
20170809_Oerlikon presentation_Jefferies 2017 Industrials ConferencePage 9

It's not allowed to change the master It's not allowed to change the master
8,6
4,7
8,0
9,1
6,6
8,3
0,9
0,5
Version September 2012
Strategic AM investment with impacts on
Group in 2017 and beyond
20170809_Oerlikon presentation_Jefferies 2017 Industrials ConferencePage 10
AM
Inve
stm
en
t C
as
e
Industrialize AM – become an integrated service player and a leading materials manufacturer:
Expand in high volume manufacturing of specialized powders/alloys (CapEx & M&A)
Enlarge service market shares gaining economies of scale and scope (CapEx & M&A)
Increase applications engineering & design (Organic & M&A)
AM
Inve
stm
en
ts
Sales (incl. M&A)
CHF M
2017E 2019E
~20
>100
2021E
<10
~300
2016
CapEx
CHF M
EBITDA margin
In %
3
2019E
~170
cum.
~300
cum.
2021E2017E2016
70-75
2016 2017 2018 2019 2020 2021
>20%
Invest
Deliver

It's not allowed to change the master It's not allowed to change the master
8,6
4,7
8,0
9,1
6,6
8,3
0,9
0,5
Version September 2012
Surface Solutions Segment – Strong underlying
profitable growth
RoW
5%Asia /
Pacific
33%
North America
18%
Europe44%
Power Generation
7%
25%
General
Industry
Aviation
13%
Automotive
23%
Tooling
32%
1 IP = Industrial Production 2 MRO = Maintenance, Repair & Overhaul;
Sales
Q2 17
Sales
Q2 17
20170809_Oerlikon presentation_Jefferies 2017 Industrials ConferencePage 11
Market development:
Strong tooling market in all
regions, especially strong
demand from Asia/Japan
Noticeable uptake in general
industries (IP1)
Stable upward trend in
automotive; Asia in particular
Aerospace market remains
healthy driven by new engine
programs and MRO2 business
Power generation with slight
industry growth
Some recovery in oil & gas
Operational performance:
Profitable growth in orders and
sales across all industries
Acquisitions and material
surcharges in total added
~CHF 6m to top-line in Q2
Solid growth trends in coating
services for tooling and
automotive/friction systems
EBITDA profitability above
20% incl. AM ramp up costs
Key partnership agreement
with GE Additive signed
Technology acquisition in
materials (Scoperta Inc.)
in CHF million Q2 17 Q2 16 y-o-yy-o-y
ex FXH1 17 y-o-y
y-o-y
ex FX
Order intake 342 311 10.0% 10.5% 694 12.5% 13.3%
Sales (3rd parties) 340 315 7.9% 8.5% 672 10.3% 11.2%
EBITDA 70 71 -1.4% – 141 6.0% –
In % of sales 20.6% 22.4% -1.8 pp – 20.8% -0.9 pp –
EBIT 40 43 -7.0% – 80 5.3% –
In % of sales 11.6% 13.4% -1.8 pp – 11.8% -0.6 pp –

It's not allowed to change the master It's not allowed to change the master
8,6
4,7
8,0
9,1
6,6
8,3
0,9
0,5
Version September 2012
Manmade Fibers Segment
20170809_Oerlikon presentation_Jefferies 2017 Industrials ConferencePage 12

It's not allowed to change the master It's not allowed to change the master
8,6
4,7
8,0
9,1
6,6
8,3
0,9
0,5
Version September 2012
What we do –
Manmade Fibers Segment
20170809_Oerlikon presentation_Jefferies 2017 Industrials ConferencePage 13
Main business
Filament spinning equipment
Value chain
expansion
Polycondensation
Reducing filament
equipment exposure
i.e. staple fiber equipment
Global market and technology
leader in filament spinning
equipment
Project business with average
order size of CHF 20-50 million
(up to CHF 200 million)
Key markets are China, India,
US and Turkey
“From melt to yarn” strategy
Joint venture with Huitong
Chemical to provide
polycondensation plants for
either direct spinning process
or PET production
Leading market and technology
position in BCF (carpet yarn)
Acquisition of Trützschler’s
staple fiber technology portfolio
to strengthen areas outside
Chinese filament business
Business opportunities in
nonwovens area

It's not allowed to change the master It's not allowed to change the master
8,6
4,7
8,0
9,1
6,6
8,3
0,9
0,5
Version September 2012
Manmade Fibers Segment – Market recovery
continues / order book is translating into sales
Filament
spinning/
Texturing
17%
67%
16%
20170809_Oerlikon presentation_Jefferies 2017 Industrials ConferencePage 14
1 Bulked continuous filament (carpet yarn) 2Continous Polymerization
BCF carpet
yarn/
Polymer
processing
Staple fiber/Nonwoven
Market development:
Continued project activities by
Tier 1 customers in Filament
market in China
Pricing improving, but remains
challenging
Positive market sentiment in
staple fibers maintains
Activities in BCF1 (US / Turkey)
exceeding expectations
Positive trend in texturing
continues
Increased interest in Melt-to-
Yarn / Fiber solutions
Operational performance:
Large filament project orders
from China, India, Turkey and
South America.
Orders in CP², texturing, staple
fibers, BCF1
Sales pick up as a result of
order book execution and
project timings
Ongoing ramp-up in production
capacities with focus on quality
of work, processes and costs
EBITDA margin impacted by
ramp up and project profiles
improvement in H2
RoW
6%
Asia /
Pacific63%
North
America5%
Europe
26%
Sales
Q2 17
Sales
Q2 17
in CHF million Q2 17 Q2 16 y-o-yy-o-y
ex FXH1 17 y-o-y
y-o-y
ex FX
Order intake 198 125 58.4% 61.0% 377 51.4% 54.5%
Sales (3rd parties) 173 98 76.5% 79.4% 279 17.7% 20.0%
EBITDA 4 -2 >100% – 4 -42.9% –
In % of sales 2.3% -1.6% 3.9 pp – 1.5% -1.5 pp –
EBIT -1 -6 83.3% – -6 <-100% –
In % of sales -0.6% -6.1% 5.5 pp – -2.2% -1.4 pp –
It's not allowed to change the master It's not allowed to change the master
8,6
4,7
8,0
9,1
6,6
8,3
0,9
0,5
Version September 2012
20170809_Oerlikon presentation_Jefferies 2017 Industrials ConferencePage 15
Drive Systems Segment

It's not allowed to change the master It's not allowed to change the master
8,6
4,7
8,0
9,1
6,6
8,3
0,9
0,5
Version September 2012
What we do –
Drive Systems Segment
20170809_Oerlikon presentation_Jefferies 2017 Industrials ConferencePage 16
Drive Systems
Segment
Broad technology portfolio for
attractive end-markets
Streamlined
product portfolio
Gears, shifting solutions
& planetary drives
Business
opportunities
i.e. e-drives/hybrids
Agriculture Machinery
Constructions Machinery
Transportation
Energy and Mining
Automotive
(Sports Cars and e-mobility)
Streamlining of product
portfolio with main focus on
product lines gears, shifting
solutions and planetary drives
The Segment’s latest
innovations for electric and
hybrid vehicles are targeted
at reducing emissions and
environmental pollution

It's not allowed to change the master It's not allowed to change the master
8,6
4,7
8,0
9,1
6,6
8,3
0,9
0,5
Version September 2012
Drive Systems Segment – Reshaping initiatives
and end-markets drive top line and profitability
Europe
Asia/Pacific RoW
48%
North
America
35%
14%
Agriculture
Construction
15%
3%
27%
19%
Automotive
Transportation
36%
Energy/Mining
Sales
Q2 17
Sales
Q2 17
20170809_Oerlikon presentation_Jefferies 2017 Industrials ConferencePage 17
3%
Operational performance:
New customers and projects in
the agriculture, construction,
automotive and transportation
markets
Sales growth mainly driven by
agricultural, construction and
automotive (incl. e-mobility)
All regions contributing to
sales growth
Higher volumes and reshaping
measure lead to an improved
EBITDA margin of 10.8%
Market development:
Agricultural overall improving;
with exception of 100+ HPT1
and large combines in the US
Construction recuperated with
growth in the US and Europe
and notably higher investments
in China and India
Transportation market mixed
A slight increase in the US
energy market through shale
oil and gas
Automotive with increasing
activities in e-vehicles, good
demand for high-perform. cars
in CHF million Q2 17 Q2 16 y-o-yy-o-y
ex FXH1 17 y-o-y
y-o-y
ex FX
Order intake 184 158 16.5% 16.1% 365 15.9% 16.2%
Sales (3rd parties) 176 164 7.3% 7.0% 346 7.1% 7.5%
EBITDA 19 12 58.3% – 33 57.1% –
In % of sales 10.8% 7.1% 3.7 pp – 9.6% 3.2 pp –
EBIT 8 1 >100% – 11 >100% –
In % of sales 4.5% 0.6% 3.9 pp – 3.3% 3.5 pp –
1 HPT = horsepower tractors
It's not allowed to change the master It's not allowed to change the master
8,6
4,7
8,0
9,1
6,6
8,3
0,9
0,5
Version September 2012
20170809_Oerlikon presentation_Jefferies 2017 Industrials ConferencePage 18
Oerlikon Group Q2 and Outlook
It's not allowed to change the master It's not allowed to change the master
8,6
4,7
8,0
9,1
6,6
8,3
0,9
0,5
Version September 2012
Sales growthQ2 17 vs. Q2 16
(y-o-y)
Q2 17 vs. Q1 17
(q-o-q)
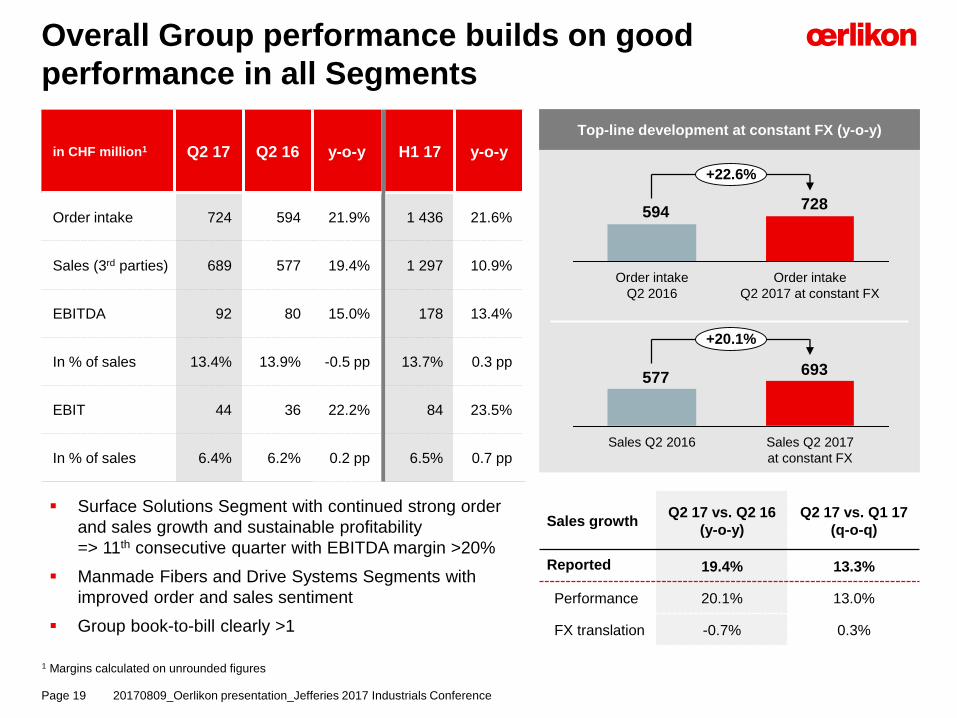
Reported 19.4% 13.3%
Performance 20.1% 13.0%
FX translation -0.7% 0.3%
Overall Group performance builds on good
performance in all Segments
20170809_Oerlikon presentation_Jefferies 2017 Industrials ConferencePage 19
Surface Solutions Segment with continued strong order
and sales growth and sustainable profitability
=> 11th consecutive quarter with EBITDA margin >20%
Manmade Fibers and Drive Systems Segments with
improved order and sales sentiment
Group book-to-bill clearly >1
728594
+22.6%
Order intake
Q2 2017 at constant FX
Order intake
Q2 2016
693577
Sales Q2 2016
+20.1%
Sales Q2 2017
at constant FX
Top-line development at constant FX (y-o-y)
1 Margins calculated on unrounded figures
in CHF million1 Q2 17 Q2 16 y-o-y H1 17 y-o-y
Order intake 724 594 21.9% 1 436 21.6%
Sales (3rd parties) 689 577 19.4% 1 297 10.9%
EBITDA 92 80 15.0% 178 13.4%
In % of sales 13.4% 13.9% -0.5 pp 13.7% 0.3 pp
EBIT 44 36 22.2% 84 23.5%
In % of sales 6.4% 6.2% 0.2 pp 6.5% 0.7 pp
It's not allowed to change the master It's not allowed to change the master
8,6
4,7
8,0
9,1
6,6
8,3
0,9
0,5
Version September 2012
CapEX
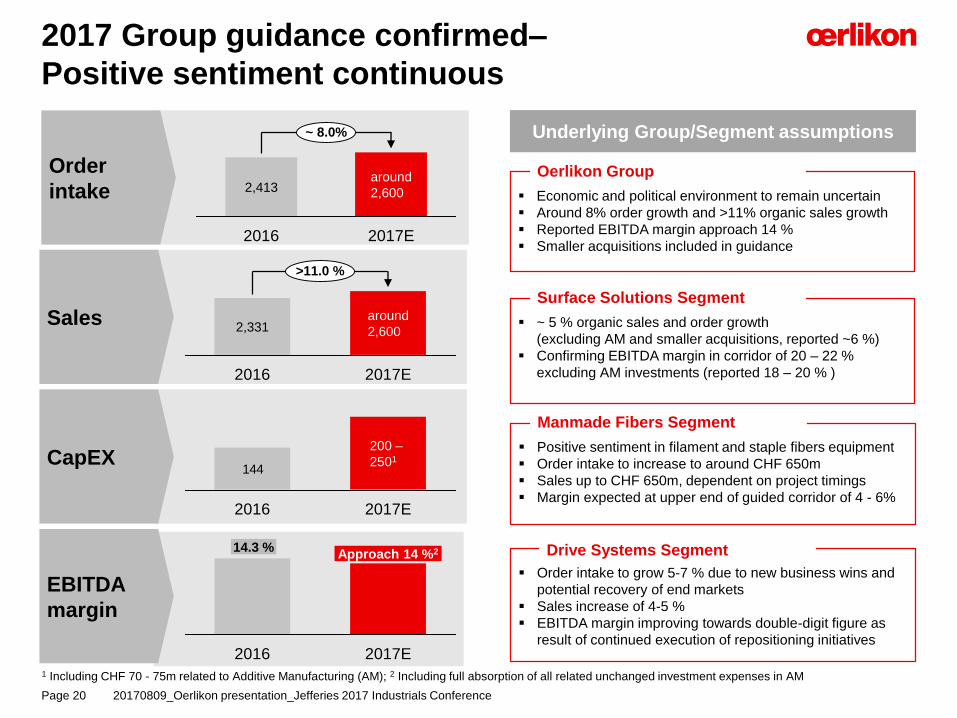
2017 Group guidance confirmed–
Positive sentiment continuous
20170809_Oerlikon presentation_Jefferies 2017 Industrials ConferencePage 20
Order
intake
EBITDA
margin
Sales
1 Including CHF 70 - 75m related to Additive Manufacturing (AM); 2 Including full absorption of all related unchanged investment expenses in AM
2016 2017E
around
2,6002,413
~ 8.0%
2016 2017E
Economic and political environment to remain uncertain
Around 8% order growth and >11% organic sales growth
Reported EBITDA margin approach 14 %
Smaller acquisitions included in guidance
Oerlikon Group
Positive sentiment in filament and staple fibers equipment
Order intake to increase to around CHF 650m
Sales up to CHF 650m, dependent on project timings
Margin expected at upper end of guided corridor of 4 - 6%
Manmade Fibers Segment
Order intake to grow 5-7 % due to new business wins and
potential recovery of end markets
Sales increase of 4-5 %
EBITDA margin improving towards double-digit figure as
result of continued execution of repositioning initiatives
Drive Systems Segment
Underlying Group/Segment assumptions
2017E2016
around
2,600
>11.0 %
2,331
144
2017E2016
200 –
2501
Approach 14 %214.3 %
~ 5 % organic sales and order growth
(excluding AM and smaller acquisitions, reported ~6 %)
Confirming EBITDA margin in corridor of 20 – 22 %
excluding AM investments (reported 18 – 20 % )
Surface Solutions Segment

It's not allowed to change the master It's not allowed to change the master
8,6
4,7
8,0
9,1
6,6
8,3
0,9
0,5
Version September 2012
Summary –
3 key messages of today’s presentation
20170809_Oerlikon presentation_Jefferies 2017 Industrials ConferencePage 21
1
Clear priorities for the portfolio
with focus on profitable growth
in Surface Solutions – organic
and M&A
2Q2 with strong operational
performance in all Segments
3Full-year guidance for
2017 confirmed

It's not allowed to change the master It's not allowed to change the master
8,6
4,7
8,0
9,1
6,6
8,3
0,9
0,5
Version September 2012
Thank you.
20170809_Oerlikon presentation_Jefferies 2017 Industrials ConferencePage 22

It's not allowed to change the master It's not allowed to change the master
8,6
4,7
8,0
9,1
6,6
8,3
0,9
0,5
Version September 2012
Investor Relations Contact
20170809_Oerlikon presentation_Jefferies 2017 Industrials ConferencePage 23
OC Oerlikon Management AG, Pfäffikon
Churerstrasse 120
CH – 8808 Pfäffikon SZ
Switzerland
Andreas Schwarzwälder
Head of Investor Relations
Senior Vive President
Phone: +41-58-360-9622
Mobile: +41-79-810-8211
E-mail: [email protected]

It's not allowed to change the master It's not allowed to change the master
8,6
4,7
8,0
9,1
6,6
8,3
0,9
0,5
Version September 2012
OC Oerlikon Corporation AG, Pfäffikon, (together with its affiliates hereinafter referred to as “Oerlikon”) hasmade great efforts to include accurate and up-to-date information in this document. However, Oerlikonmakes no representation or warranties, expressed or implied, as to the truth, accuracy or completeness ofthe information provided in this document, Neither Oerlikon nor any of its directors, officers, employees oradvisors, nor any other person connected or otherwise associated with Oerlikon, shall have any liabilitywhatsoever for loss howsoever arising, directly or indirectly, from any use of this document.
The contents of this document, including all statements made therein, is based on estimates, assumptionsand other information currently available to the management of Oerlikon. This document contains certainstatements related to the future business and financial performance or future events involving Oerlikonthat may constitute forward-looking statements. The forward-looking statements contained herein could besubstantially impacted by risks, influences and other factors, many of which are not foreseeable at presentand/or are beyond Oerlikon’s control, so that the actual results, including Oerlikon’s financial results andoperational results, may vary materially from and differ than those, expressly or implicitly, provided in theforward-looking statements, be they anticipated, expected or projected. Oerlikon does not give anyassurance, representation or warranty, expressed or implied, that such forward-looking statements will berealized. Oerlikon is under no obligation to, and explicitly disclaims any obligation to, update or otherwisereview its forward-looking statements, whether as a result of new information, future events or otherwise.
This document, including any and all information contained therein, is not intended as, and may not beconstrued as, an offer or solicitation by Oerlikon for the purchase or disposal of, trading or any transactionin any Oerlikon securities. Investors must not rely on this information for investment decisions and aresolely responsible for forming their own investment decisions.
Disclaimer
20170809_Oerlikon presentation_Jefferies 2017 Industrials ConferencePage 24