oecd price volatility
TRANSCRIPT
Please cite this paper as:
Huchet-Bourdon, M. (2011), “Agricultural Commodity PriceVolatility: An Overview”, OECD Food, Agriculture andFisheries Working Papers, No. 52, OECD Publishing.http://dx.doi.org/10.1787/5kg0t00nrthc-en
OECD Food, Agriculture and FisheriesWorking Papers No. 52
Agricultural CommodityPrice Volatility
AN OVERVIEW
Marilyne Huchet-Bourdon
OECD FOOD, AGRICULTURE AND FISHERIES
WORKING PAPERS
The working paper series is designed to make available to a wide readership selected studies by
OECD staff or by outside consultants and are generally available only in their original language.
This document and any map included herein are without prejudice to the status of or sovereignty
over any territory, to the delimitation of international frontiers and boundaries and to the name of any
territory, city or area.
The present document has been declassified by the Working Party on Agricultural Policies and
Markets of the OECD Committee for Agriculture [TAD/CA/APM/WP(2010)33/FINAL].
Comments on this series are welcome and should be sent to [email protected].
OECD FOOD, AGRICULTURE AND FISHERIES WORKING PAPERS
are published on www.oecd.org/agriculture
© OECD 2011
Applications for permission to reproduce or translate all or part of this material should be made to:
OECD Publishing, [email protected] or by fax 33 1 45 24 99 30.
OECD FOOD, AGRICULTURE AND FISHING WORKING PAPER N°52 © OECD 2011
Abstract
Agricultural Commodity Price Volatility: An Overview
by
Marilyne Huchet-Bourdon*
AgroCampus-Ouest, Rennes, France
Recent years have witnessed a sharp increase in many commodity prices. This report
examines the question of whether commodity price volatility has materially changed with
the rapid run up in world prices in 2006-09, followed by an equally sharp decline in many
commodity prices. The report analyses international price volatility for selected
agricultural commodities over the past half-century and their relationship with crude oil,
fertiliser and the euro-dollar exchange rates. The analysis utilises different data sources,
frequency of price observations, periods of observation, price volatility measures and a
number of statistical tests to examine the various dimensions of the issue.
Keywords: Price volatility, agricultural markets, correlation and causality.
Acknowledgements
The author would like to thank in particular Jesús Antón, Joe Dewbre, Céline Giner,
Pete Liapis, Claude Nenert, Garry Smith, as well as Christopher Gilbert and
Stefan Tangermann for helpful comments on earlier versions of this report.
* This report was prepared by the author whilst she was on secondement to the OECD
Trade and Agriculture Directorate from the Institut supérieur des sciences agronomiques,
agroalimentaires, horticoles et du paysage (AgroCampus-Ouest), Rennes, France.
AGRICULTURAL COMMODITY PRICE VOLATILITY: AN OVERVIEW – 3
Table of contents
Executive summary .......................................................................................................................... 5
I. Introduction .............................................................................................................................. 8
II. Definition and measurements of volatility ............................................................................. 10
III. World commodity price volatility: A range of comparisons .................................................. 13
IV. A correlation analysis between agricultural prices and input prices ...................................... 22
V. Conclusions ............................................................................................................................ 26
References ...................................................................................................................................... 29
Annex 1. Data .............................................................................................................................. 31
Annex 2. Volatility measures according to sources with monthly data: IMF vs UNCTAD ....... 33
Annex 3. Volatility measures for nominal and real prices with monthly IMF data .................... 34
Annex 4. Volatility measurements with monthly IMF or USDA data ........................................ 35
Annex 5. Volatility measures based on standard deviation in first differences with monthly
prices – US dollar prices vs Euros prices ....................................................................................... 36
Annex 6. Results with annual data .............................................................................................. 37
Annex 7. Results for Granger causality tests on monthly commodity prices in US dollar and
in Euros – Whole period ................................................................................................................ 45
Annex 8. Results for crude oil price and fertiliser price .............................................................. 46
Tables
Table 1. Tests of equality of means in volatility between the last decade or last years
and other periods (t-statistics and p-value in brackets ) .......................................... 18
Table 2. Synthesis of mean tests, average volatility of recent years (2001-10 or
2006-10) compared to the average volatility over the whole sample or over
the 1970s or the 1990s ............................................................................................ 19
Table 3. Tests of equality of variances between the recent years and other periods ............ 21
Table 4. Correlations matrix between agricultural products (with quarterly growth
rates in prices) ......................................................................................................... 25
Table A1.1 Data definitions and sources ................................................................................... 32
Table 5.1 Volatility measures – US dollar prices ................................................................... 36
Table A5.2 Volatility measures – Euros prices ......................................................................... 36
Table A6.1 Tests of equality of means in volatility between the last decade (2001-2009)
and other periods ..................................................................................................... 41
Table A6.2 Synthesis of mean tests ........................................................................................... 42
4 – AGRICULTURAL COMMODITY PRICE VOLATILITY: AN OVERVIEW
OECD FOOD, AGRICULTURE AND FISHING WORKING PAPER N°52 © OECD 2011
Table A6.3 Tests of equality of variances between the recent years and other periods –
Annual data ............................................................................................................. 42
Table A6.4 Correlation matrix between agricultural product prices ......................................... 44
Table A7.1 Causality tests (F-tests) ........................................................................................... 45
Table A8.1 Tests of equality of means in volatility between the last decade or last years
and other periods – Monthly data ........................................................................... 48
Table A8.2 Tests of equality of means in volatility between the last decade (2001-2009)
and other periods – Annual data ............................................................................. 48
Table A8.3 Synthesis of mean tests, average volatility of recent years (2001-2010 or
2006-2010) compared to the average volatility over the whole sample or
over the seventies or the nineties ............................................................................ 49
Table A8.4 Tests of variances - Monthly data ........................................................................... 50
Table A8.5 Tests of variances - Annual data ............................................................................. 51
Figures
Figure 1A. World nominal prices by group of commodities - price index or USD/barrel
for crude oil............................................................................................................. 13
Figure 1B. World nominal prices of agricultural commodities ................................................ 14
Figure 2. Average volatility computed as standard deviation of price in difference
(SDD) ...................................................................................................................... 15
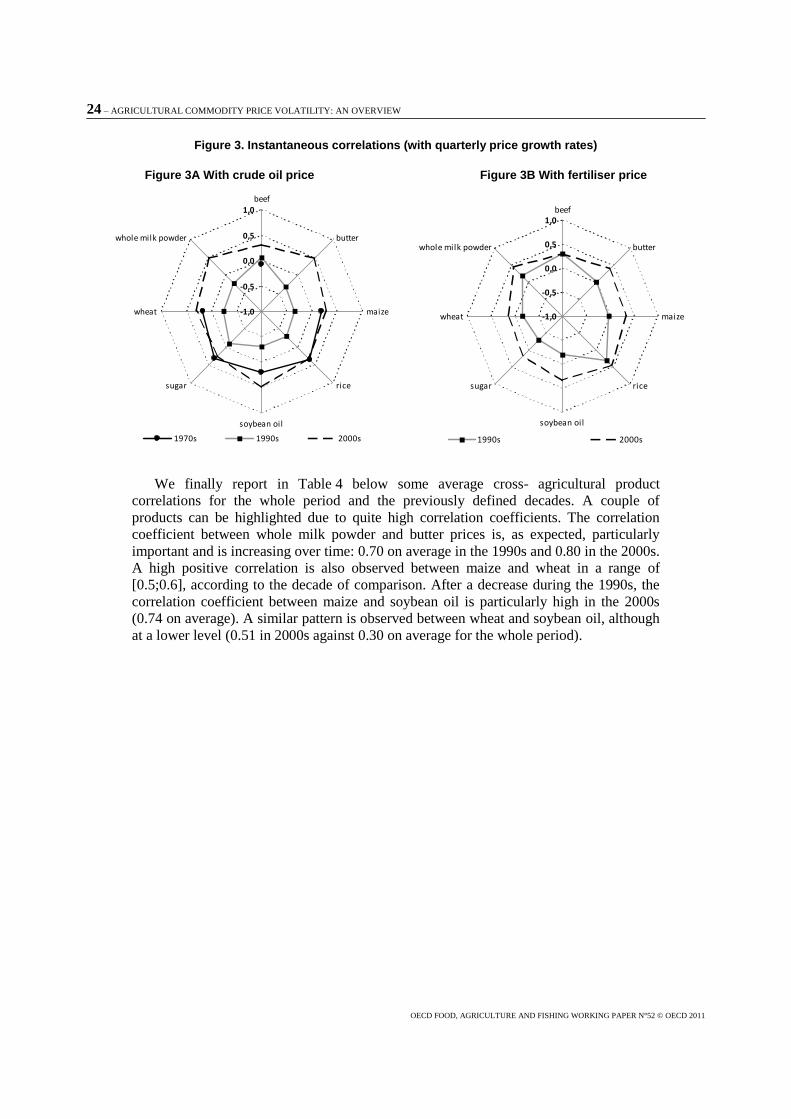
Figure 3. Instantaneous correlations (with quarterly price growth rates) ............................... 24
Figure A2.1 Rice price volatility, SDD and CV ......................................................................... 33
Figure A2.2 Soybean oil price volatility, SDD and CV .............................................................. 33
Figure A3.2 Rice price volatility, SDD and CV ......................................................................... 34
Figure A3.2 Soybean oil price volatility, SDD and CV .............................................................. 34
Figure A6.1 Average volatility computed as moving standard deviation (SDD) -
Annual data ............................................................................................................. 37
Figure A6.2 Soybean oil price volatility – Annual data .............................................................. 37
Figure A6.3. Rice price volatility – Annual data ......................................................................... 38
Figure A6.4 Comparisons of volatility measurements by product with annual data: IMF
or USDA data ......................................................................................................... 39
Figure A6.5 Instantaneous correlations (with first difference annual data) ................................ 43
Figure A5.6 Lagged correlations (one year lag ahead for crude oil or fertiliser -
with first difference annual data) ............................................................................ 43
Figure A8.1 World commodity prices – Annual data ................................................................. 46
Figure A8.2 World commodity prices – Annual data ................................................................. 46
Figure A8.3 Comparisons of price volatility measurements- Monthly data ............................... 47
Figure A8.4 Comparisons of price volatility measurements- Annual data ................................. 47
Figure A8.5 Average volatility computed as standard deviation in price differences (SDD) ..... 47
Boxes
Do data sources matter for evaluating volatility? .......................................................................... 16
Nominal versus real volatilities ..................................................................................................... 16
SDD vs CV vs CVV: some comparisons ....................................................................................... 16
AGRICULTURAL COMMODITY PRICE VOLATILITY: AN OVERVIEW – 5
Executive Summary
The high agricultural commodity prices in recent years have raised the question of
whether or not volatility is increasing and leading to more frequent extreme price swings.
This study is intended to contribute to the existing field of work on agricultural
commodity price volatility. It seeks to extend that research by undertaking an extensive
statistical analysis of price volatility over the last half century for an extended range of
agricultural commodities. Its purpose is two-fold: (a) to analyse the most recent price
changes (surge and decline) of 2006-09 in the context of a comprehensive historical
review of agricultural commodity price volatility for a range of crop and livestock
commodities; and, (b) to investigate the relationship with two critical input product
prices, namely the crude oil price and fertiliser price, and the impact of the US exchange
rate on the evolution of agricultural commodity prices during this period.
In this study, volatility is defined as the variation (amplitude and frequency) of
commodity price changes around their mean value. To meet the first objective, various
statistical analyses of historical commodity price volatility since the 1960s are
undertaken, making many comparisons according to the frequency of price observations,
the source of data, the period of observation, the price volatility measures examined, and
the range of agricultural products reviewed. It analyses international market price
volatility for individual commodity price series covering eight agricultural commodities
of crop, livestock and processed products for: beef, butter, maize, rice, soybean oil, sugar,
wheat and whole milk powder as well as two input prices of crude oil and fertilisers.
Volatility measures are also computed for the same commodity prices expressed in Euro
to see how the change in the value of the US dollar relative to the Euro affects the results.
In a second stage, correlation coefficients are computed to analyze the relationship
between each of these agricultural commodity prices and the input prices. Granger
causality tests are also performed to determine whether a causal effect exists between the
changes in crude oil price, fertiliser price or the Euro-US dollar exchange rate and the
changes of each of the agricultural commodity price series.
An examination of food and other agricultural commodity price indices confirms the
low level of world prices during the nineteen sixties. Further, that sharp increases in food
and agricultural raw material prices took place during the 2006-08 period, as well as
during earlier decades, being most pronounced in the nineteen seventies. The high price
events of the past fifty years have typically followed a similar pattern – a price hike in
one year followed by a sharp drop in the following year - for most commodities. In
addition, past surges in aggregate agricultural prices, as represented by an index of food
prices took place in the context of a general rise in almost all commodity prices, crude oil
and metals in particular.
The statistical analysis of volatility for the individual agricultural commodities and
two input price series demonstrated little difference between sources of price data (IMF,
UNCTAD, AGLINK). In general, there was also little difference exhibited for the

6 – AGRICULTURAL COMMODITY PRICE VOLATILITY: AN OVERVIEW
OECD FOOD, AGRICULTURE AND FISHING WORKING PAPER N°52 © OECD 2011
volatility measures employed in the analysis, based on the standard deviation of first
differences of price series, the corrected coefficient of variation and the coefficient of
variation. This finding of little difference in results equally applied whether the volatility
measures were computed on price series denominated in US dollars or for prices
denominated in Euros. The periodicity of world price observations was shown to be
important in terms of volatility measurement, with monthly price series exhibiting larger
volatility than annual series.
In terms of the volatility of individual agricultural product prices, the statistical
analyses suggest that there is no increasing tendency in price volatility over the past fifty
years from January 1957 to February 2010. The statistical analyses revealed that volatility
has been, on average, lowest for beef over the past 50 years. An analysis of volatility
comparing individual decades within the 50-year period, revealed that price volatility in
the recent period of 2006-10 was higher than in that in the nineteen nineties, but, in
general, not higher than that of the nineteen seventies with the major exception of wheat
and rice. This result is consistent with that found in much of the recent literature on
volatility (Balcombe (2009), Sumner (2009), Gilbert and Morgan (2010), OECD
(2010c)). Some advanced statistical tests (difference of means) revealed that price
volatility was found to be lower in 2006-10 when compared to the nineteen seventies for
beef and sugar. In the recent period of 2006-10 it was higher than both the nineteen
nineties for most products and nineteen seventies for cereals such as wheat and rice. For
the other products examined, the differences with the nineteen seventies were not found
to be significant. When the tests of volatility for the individual commodities was further
disaggregated from sub-periods of decades to individual years within the past 50 years,
this revealed, that world wheat prices displayed higher volatility in 2007 when compared
to past years (both of the 1970s and 1990s). However, many more products, and
particularly crop products other than sugar, experienced higher volatility in 2008, when
compared to all the past years examined. For 2009, when many product prices declined,
the volatility of the different commodity price series was about the same as in past years,
with the exception of dairy products and soybean oil. These latter commodities continued
to display higher volatility in 2009 than in individual years of the nineteen nineties.
The second objective of this study was to assess whether the crude oil price or
fertiliser price have important links with the agricultural commodity prices that were
analysed. The general presumption is that crude oil prices and agricultural product prices
should be related through production costs for high energy intensive agriculture and more
recently as a result of increasing use of agricultural feedstocks (cereals, oilseeds and
sugar crops) for biofuel production. Correlation coefficients between these products
suggest that product prices are more highly correlated over a period of twelve months
than within a shorter period of time. The analysis also revealed that all correlations
increase over time with the general rise in prices. For example, they are higher in the
nineteen seventies and the 2000s, than in the 1990s. In the current decade, the agricultural
products that are shown to be the most correlated with the crude oil price, based on
monthly data, are butter, whole milk powder and soybean oil. In the case of annual data,
products with the highest correlations are maize, whole milk powder, wheat and butter.
The least correlated are always beef and sugar. The correlation between the crude oil
price and the fertiliser price is shown to be particularly high in the 2000s. The study also
confirms some high correlations for price changes between some agricultural products
such as whole milk powder and butter, maize and wheat, maize and wheat with soybean
oil. Finally, the causality analysis over the whole period suggests that there are causal
effects, particularly from crude oil and the euro-dollar exchange rate to beef, butter and
AGRICULTURAL COMMODITY PRICE VOLATILITY: AN OVERVIEW – 7
sugar. However, no evidence was found that these factors were having a greater effect in
terms of leading to increasing volatility of the individual commodity prices studied over
time. No evidence was found that exchange rate effects on commodity price volatility
were significantly different with prices measured in Euros than in US dollars.
In conclusion, agricultural commodity price volatility has been shown to have been
high in the recent period of 2006-10. However, the perception that it may have been
increasing in comparison to previous periods of rapid price changes, has not been borne
out in the analysis of price volatility. This analysis, based on an assessment of different
factors and a battery of statistical tests, failed to find evidence of any general increase in
agricultural commodity price volatility over the past 50 years for the range of products
examined, with the major exception for wheat and rice. That is, the recent period of
enhanced volatility is not exceptional relative to the seventies for most products, other
than perhaps wheat and rice in specific years.
However, these statistical results must be interpreted with caution since the
international context has changed over the past 50 years. Indeed as markets
becomeincreasingly integrated around the world, economic shocks in the international
market place may be transmitted quicker than previously. In this context, domestic prices
may now experience a volatility that agricultural producers did not face in the past, with
low income countries suffering the most in this regard. Liberalisation of agricultural
products has especially increased since the Marrakech Agreement in 1994. Statistical
results reveal that price volatility is found to be higher than in the nineties for most
products. In this context, experience in recent years may suggest that authorities and
stakeholders face additional challenges with volatile prices and agricultural trade, and
should coordinate their policy responses.
Despite the absence of any general increasing tendency in overall volatility during the
past 50 years, high agricultural commodity price volatility, nevertheless, remains an
important policy concern. In terms of future work, one possibility could be to analyse the
relationship between price volatility and food security. In addition, it could be interesting
to measure the input usage of oil in the production and transportation cost of the eight
agricultural commodities to determine if this could explain, at least partially, the price
correlation between the crude oil price and those of agricultural products.
8 – AGRICULTURAL COMMODITY PRICE VOLATILITY: AN OVERVIEW
OECD FOOD, AGRICULTURE AND FISHING WORKING PAPER N°52 © OECD 2011
I. Introduction
Agricultural commodity price volatility is an ongoing concern. Policymakers as well
as all the participants along the food supply chain have an interest in the question of
agricultural price volatility and need to better understand the expected future evolution.
For example, farmers in some countries now face a number of risks that were formerly
absorbed by market and price support policies (Matthews, 2010). OECD (2009) has
emphasised that agriculture remains exposed to many risks like production, market,
institutional, personal and financial risks. Market risk, which is related to uncertainty
about the prices that farmers will obtain for their products or pay for their inputs, is
amongst the most important.
Previous analyses (Cashin and McDermott (2002), Deaton and Laroque (1992) for
instance) have tended to focus on the behaviour of commodity prices. However, the
observed variability of world agricultural prices over the period 2006-09 – comprising the
2006-08 food price spike followed by a sudden decline in some world food prices like
those of grains and dairy products after the middle of 2008, has revived the debate as to
the causes and consequences of such sharp and pronounced price variations.
A number of studies have discussed the factors which may explain the evolution of
recent price changes (Abbott and Borot de Battisti, 2009; Gilbert; 2010; Gilbert and
Morgan, 2010). The most often involved are changes in supply/demand factors. On the
demand side, the fast economic growth in Asian economies and particularly in China is
often emphasised. On the supply side, the underinvestment in agriculture as well as low
commodity inventory levels of recent years are often cited as contributory factors. In
addition, a new factor has emerged in the form of a change in the use of food crops with
the increasing production of biofuels. Other macroeconomic and financial factors apart
from specific commodity market fundamentals are considered to influence agricultural
commodity price volatility including: changes in oil prices, changes in world money
supply, changes in the value of the dollar since many agricultural commodity prices are
denominated in terms of the US dollar. Other factors which are often also quoted include
climate change, trade policies in exporting and importing countries, and the feedback
between price expectation and market responses. Finally, some factors remain
controversial. Gilbert and Morgan (2010) and De Schutter (2010) highlight the role of
speculation in futures and options trading on food commodity markets, while some others
do not support this view (Irwin and Sanders, 2010).
Movements in prices may have important implications for resource allocation as well
as consumer and producer welfare. First, volatility may have a negative impact at the
macroeconomic level on growth and poverty, which are the most damaging in poor
countries (e.g. Aizenman and Marion, 1993; Ramey and Ramey, 1995; Rodrick, 1999).
Some economists argue also that there are links between volatility and crises, higher
volatility leading to an economic crisis (Aizenman and Pinto, 2005; Acemoglu et al.,
2003). It is thus important to know the evolution of price volatility to help in the design of
appropriate policies and to help market participants to better accommodate these
phenomena. Some papers have thus investigated the impact of government attempts to
insulate their population from the harmful effects of food price variability. For further
details, a closer look should be devoted to the contributions of Galtier (2009), OECD
(2009) and Matthews (2010). These studies review policies that can help to mitigate the
risk of price volatility and which can help farmers to better cope with income instability.
They also discuss some market-based instruments to transfer risk or at least to lessen the
AGRICULTURAL COMMODITY PRICE VOLATILITY: AN OVERVIEW – 9
extent of world market price volatility. Galtier (2009) focuses on the management of food
price instability in developing countries. Second, commodity price volatility may also
impact household decisions, farmers and governments. Price risk is one of the most
important components of risk faced by rural households in particular, but not solely in
developing countries.1 Many governments also remain dependent on commodity export
earnings as sources of revenue (Dehn et al., 2005). Treatment of instability is not so
obvious since the perception may not be the same for a producer or a consumer. For
instance, from a producer’s view, only downward fluctuations in commodity prices could
be viewed as problematic because of their effects on farm revenue. However, from a
consumer’s perspective, upward price fluctuations may be worrying because of their
effects on their food expenditures. Of course, large movements in both directions do
matter for policy makers. In this paper, we consider the volatility of the markets as a
whole in either direction.
The purpose of this study is not to join the debate on the causes and consequences of
price volatility. Instead, the focus is more on a technical analysis of the extent of volatility
exhibited by agricultural commodity prices. Following the recent price surge events of
2006-08, a common presumption seems to be that food price volatility has increased over
time. In the past, periods of high volatility (especially the 1970s) have been rather short,
followed by two decades (1980s and 1990s) of low volatilities (Gilbert and Morgan
(2010)). This raises the question about the recent period of price volatility: is it higher
than in the past? Is it a transitory phenomena or can we expect it to continue in the future?
Some authors have already tried to measure agricultural price volatility. Gilbert
(2006) showed that agricultural price volatility was low in the 1960s, higher in the 1970s
and although it fell back in the second half of the 1980s and the 1990s, it remained above
the level of the sixties. Gilbert and Morgan (2010), studying 19 products over the period
1970-2009, conclude that volatility has generally been lower over the two last decades
than previously, except for rice. They also find that volatilities over the three year period
2006-08 are rather in line with historical experience. Balcombe (2009) finds a persistent
volatility in agricultural price series. On the contrary, Sumner (2009) who studied price
data for wheat and maize over an extended period from 1866-2008, found that the three-
years 2006-2008 represents one of only a handful of periods when prices have been above
the post-war trend, the last being that of the 1970s.
However, the findings of these studies are often shown to be heavily influenced by a
number of criteria specific to each analysis such as the choice of the period of
examination, the frequency of price observations analysed, the measure of volatility used
and so forth. A short review of the literature reveals a lack of complete consensus on the
conclusions about the evolution of agricultural commodity price volatility.
The analysis reported in this paper is intended to contribute to this existing field of
work on agricultural commodity price volatility. However this study attempts to extend
that research by undertaking a battery of statistical analyses of price volatility over the
last half century for an extended range of commodities making many comparisons
according to the frequency of price observations, the source of data, the period of review,
the denomination of prices (US dollar or euro) and the influence of key input prices. The
aim is thus to provide the most robust as well as the clearest assessment of what has
happened to agricultural price volatility over the past fifty year period. The purpose of
1. Policy responses in Emerging Economies to agricultural price changes are examined in OECD
(2010).
10 – AGRICULTURAL COMMODITY PRICE VOLATILITY: AN OVERVIEW
OECD FOOD, AGRICULTURE AND FISHING WORKING PAPER N°52 © OECD 2011
this technical analysis is to answer the question: “Is agricultural price volatility increasing
in the last few years relative to past years?”
This analysis of price volatility examines world price changes for eight agricultural
commodities, classified into crop, livestock and processed products of: beef, butter,
maize, rice, soybean oil, sugar, wheat, whole milk powder. In addition, the paper
investigates the interrelationships or link with two input product prices comprising the
crude oil price and fertiliser price in the evolution of agricultural commodity prices under
review. The presumption is that a close link exists between crude oil prices and
agricultural commodity prices, through the impact of energy prices on the costs of
production. This relationship is likely to have been strengthened with the development of
alternative use of some crops for biofuel production (Balcombe, 2009).2
This study focuses on the volatility of agricultural commodity prices for several
reasons. Price volatility is a fundamental feature of agricultural markets and probably one
of the main sources of risk in international agricultural trade. Many production decisions
are taken well in advance of product sales, and there generally exists a certain amount of
uncertainty about the price that will be received for final products (OECD, 2009). In the
same vein, food price volatility is one of the main risks which can damage food security
in many poor countries, particularly in the developing world, affecting access to food by
the poor. This analysis is expected to contribute to other work underway such as the
aggregate model analysis of price variability, to the study on risk management in
agriculture as well as on-going food security and commodity outlook related projects in
the PWB.
The study is organised as follows. Section II presents the definition of volatility and
some price volatility measures. Section III discusses the evolution of selected aggregate
world price series and presents an analysis of the evolution of volatilities for the
individual commodities being examined. Some correlation analyses and causal relations
with input prices and the exchange rate are undertaken in section IV and the final section
V draws together the main findings of the different analyses and makes some suggestions
for further research.
II. Definition and measurements of volatility
Volatility in this study is concerned with the variability of the price series around its
central value i.e. the tendency for individual price observations to vary far from its mean
value. Thus volatility is often defined as high deviations from a global tendency.
However, a large part of the variation in commodity prices is also attributable to
variations of the trend itself rather than variations around the trend according to some
researchers (e.g. Dehn et al., 2005). This study focuses on the extent of observed
fluctuations in international agricultural commodity prices. In that sense, it is sometimes
confounded with risk.3
2. Gohin and Chantret (2010) examine long run relationship between energy prices and food prices
using a world Computable General Equilibrium model. They find that the introduction of the real
income effect may indeed imply a negative relationship between world food and energy prices.
3. However, the content of risk, unlike uncertainty, is supposed to allow for the assignment of
probabilities to the outcomes (Aizenman and Pinto, 2005; Labys, 2006, p.30; Frank Knight,
1921) was the first to make this distinction between risk and uncertainty based on the probability
distribution governing outcomes.
AGRICULTURAL COMMODITY PRICE VOLATILITY: AN OVERVIEW – 11
Two kinds of volatility are found in the literature (European Commission, 2009,
Matthews (2010) for instance): an historical (realised) volatility and an implicit future
volatility. The historical volatility is based on observed past prices. It reveals how volatile
a price has been in the past. As for the implicit volatility, it corresponds to the markets’
expectation on how volatile a price will be in the future as measured by the value of price
options. In this paper we are interested in measuring only the realised volatility based on
observed world market prices.
Several historical volatility measurements have been used in the literature.
Economists have employed measures based on the price levels.4 They have focused on
the standard deviation of prices or of logarithmic prices or on the coefficient of variation
which expresses the standard deviation as a percentage of the sample mean. The main
advantage of the latter is that it does not depend on the unit of measurement.
Second, some measures take into account the fact that most economic series exhibit
some form of trend, and permit the removal of trend movements in the volatility
measures.5 In that context, some authors use the standard deviation of the first difference
in the logarithmic value of prices6 (e.g. Clem, 1985; Gilbert, 2006; European
Commission, 2009; Jacks et al., 2009; OECD, 2009; Gilbert and Morgan, 2010) and
some others recommend the use of “de-trended” series to compute volatility measures
(e.g. Cuddy and Della Valle, 1978; Matthews, 2010). The advantage of the first
computation is its simplicity while using de-trended series means that a model is required
to take into account or approximate the nature of the underlying trend. In that way, the
main drawback is that the volatility measure may depend on the choice of the de-trending
technique. For instance, Cuddy and Della Valle (1978) proposed a corrected coefficient
of variation, based on linear and log-linear trend.
Third, other authors also estimate a volatility model. Gilbert and Morgan (2010), for
example, estimate a GARCH (Generalized AutoREgressive Conditional
Heteroscedasticity) model which is often used for modeling volatility in financial markets
(Bollerslev, 1986). The idea is to estimate the conditional variance of innovation from the
auto-regressive process followed by a time series. However, the interpretation of the
volatilities computed with such a measure poses some questions. Besides, parameters
underlying this kind of model are not always well determined.7
Finally, the question is whether to compute the volatility on nominal or real prices.
However, in the case of real prices, it means that we have to deflate a series and this
4. Some examples are found in OECD (1991).
5. Few other methods have been employed. For instance, Balcombe (2009) uses two econometric
methods to explore the nature and the causes of volatility in agricultural price commodities over
time. The first decomposes the price in level, seasonal and cyclical components. The second is a
panel approach in order to explain volatility by a number of key variables. In Chapter 2 of the
2010 edition of the OECD-FAO Agricultural Outlook, the standard deviation of the
unpredictable part of price variation is used (OECD, 2010c).
6. It is also quite conventional to annualize volatility measure when it is based on other frequencies
than annual data: that implies that monthly volatilities can be annualized by multiplying by the
factor √12 for instance.
7. Gilbert and Morgan (2010) do not really justify the use of a GARCH model to estimate price
volatility, and show that parameters can be poorly determined.
12 – AGRICULTURAL COMMODITY PRICE VOLATILITY: AN OVERVIEW
OECD FOOD, AGRICULTURE AND FISHING WORKING PAPER N°52 © OECD 2011
introduces another uncertainty in the measure of volatility. Indeed there is no consensus
on the best deflator to use and the choice is always constrained by the availability of data.
We thus decided to work on nominal data in this study.
In what follows, we evaluate volatilities by three measures8, two in levels and one in
difference:
- the coefficient of variation of the level of prices (CV),
P
n
PP
mean
deviationdardsCV
n
i
i
1
2)(
tan
- the corrected coefficient of variation (CCV) of the same level of prices (using a
linear trend),
R2 comes from a regression of the price on a linear trend
and the standard deviations of the logarithm of prices in differences (SDD).9
More precisely, we use a moving average/window to conduct the statistical analysis
of the three indicators of volatility. This method is chosen for at least two reasons. First, it
is more relevant in such an analysis conducted over a long history of price changes.
Second it permits a homogenous analysis whatever the observation frequency (monthly or
annual). Indeed, as one of the objectives of this study is to make comparisons between
frequencies, using a moving window is the most relevant way to compute volatility with
both monthly and annual data. When annual data are examined, we compute volatility
over five years. In the case of monthly data, the basis is a twelve month moving
average.10
8. We focus here on the total variability. Some studies consider rather the standard deviation of
pure risk, which can be obtained as the residuals from a regression (Aizenman and Pinto, 2004).
9. We also computed annualized volatilities from monthly data but we do not report them since
they are always well above the other measurements. Results are of course unaffected since the
annualization of monthly data consists only of multiplying the variance by a constant factor.
10. For instance, the volatility in 1990 corresponds to the changes in prices over 1986-1990 with
annual data. With monthly data, the volatility in 1990:12 is computed as the price fluctuations
over 1990:1-1990:12.
)1( 2RCVCCV
)(ln1
t
t
P
PVarianceSDD
AGRICULTURAL COMMODITY PRICE VOLATILITY: AN OVERVIEW – 13
III. World commodity price volatility: A range of comparisons
III.1. A general outlook
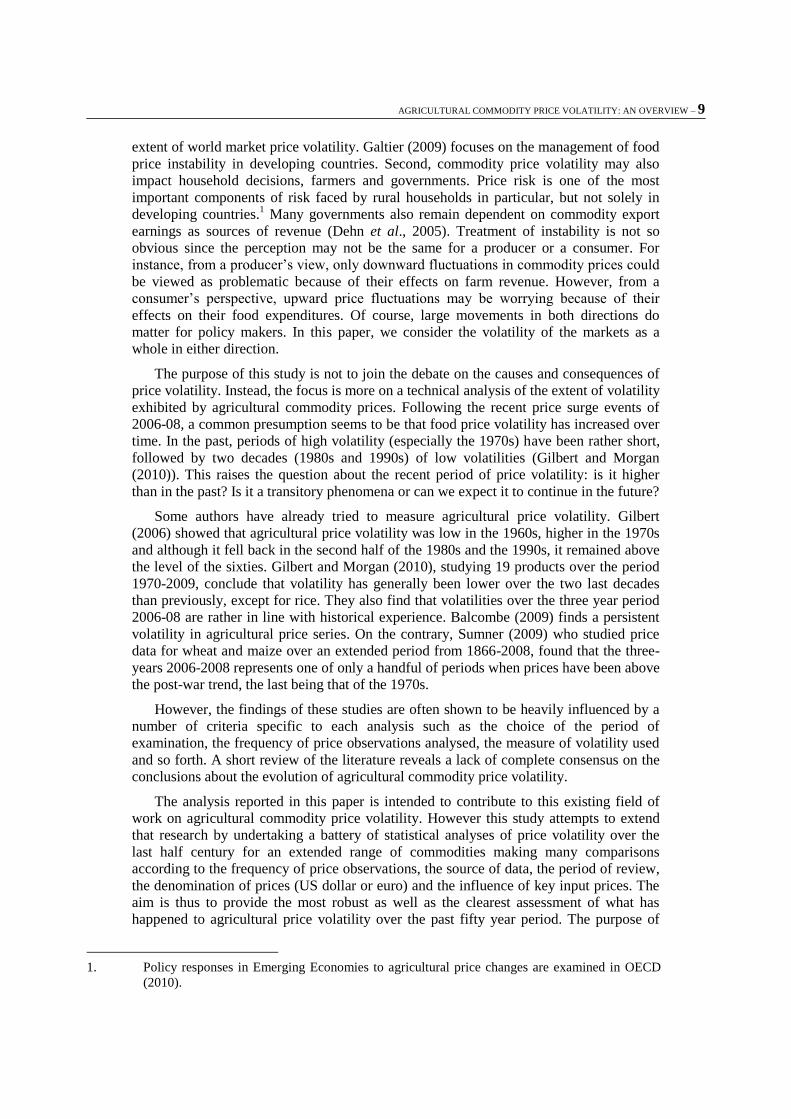
Before studying price volatility, a preliminary examination of commodity price levels
is made. Both aggregated commodity price series and disaggregated series – by individual
products prices are plotted in Figures 1A and 1B.
As expected, both figures highlight the rise in prices during the nineteen seventies and
for the recent 2006-08 price surge especially. They also show the low level of world
prices during the nineteen sixties as well as the typical pattern of price changes: a sharp
surge in one period followed by a decline and similar to what took place for a number of
commodities in 2009.
Figure 1A shows the evolutions of IMF indices of market prices for primary
commodities. The increase in food prices took place in the context of a general rise in
commodity prices led by crude oil and metals. However, the 42% rise in food prices and
in beverage prices over the period 2006-08 has been modest relative to crude oil prices
(51%) but large relative to metal prices (8%).11
Figure 1A. World nominal prices by group of commodities - price index or USD/barrel for crude oil
0,00
50,00
100,00
150,00
200,00
250,00
300,00
1957
1959
1961
1963
1965
1967
1969
1971
1973
1975
1977
1979
1981
1983
1985
1987
1989
1991
1993
1995
1997
1999
2001
2003
2005
2007
2009
Index
2005=100
0
10
20
30
40
50
60
70
80
90
100
$/barrel
food agricultural raw material metals beverages crude oil
Note: Indices of market prices for primary commodities are compiled as period averages in terms of U.S. dollars and expressed using a 2005=100 weights reference period in accordance with all indices published in IFS. The commodities covered are as follows. Food Commodities: bananas, cereals (maize, rice, and wheat), meat (beef, lamb, swine meat, and poultry), vegetable oils and protein meals (coconut oil, fishmeal, groundnuts, olive oil, palm oil, soybeans, soybean meal, soybean oil, and sunflower oil), seafood (fish and shrimp), oranges, and sugar. Beverages: cocoa beans, coffee, and tea. Agricultural Raw Materials: cotton, hides, rubber, timber, and wool (fine and coarse. Metals: aluminum, copper, iron ore, lead, nickel, tin, uranium, and zinc.
Source: IMF.
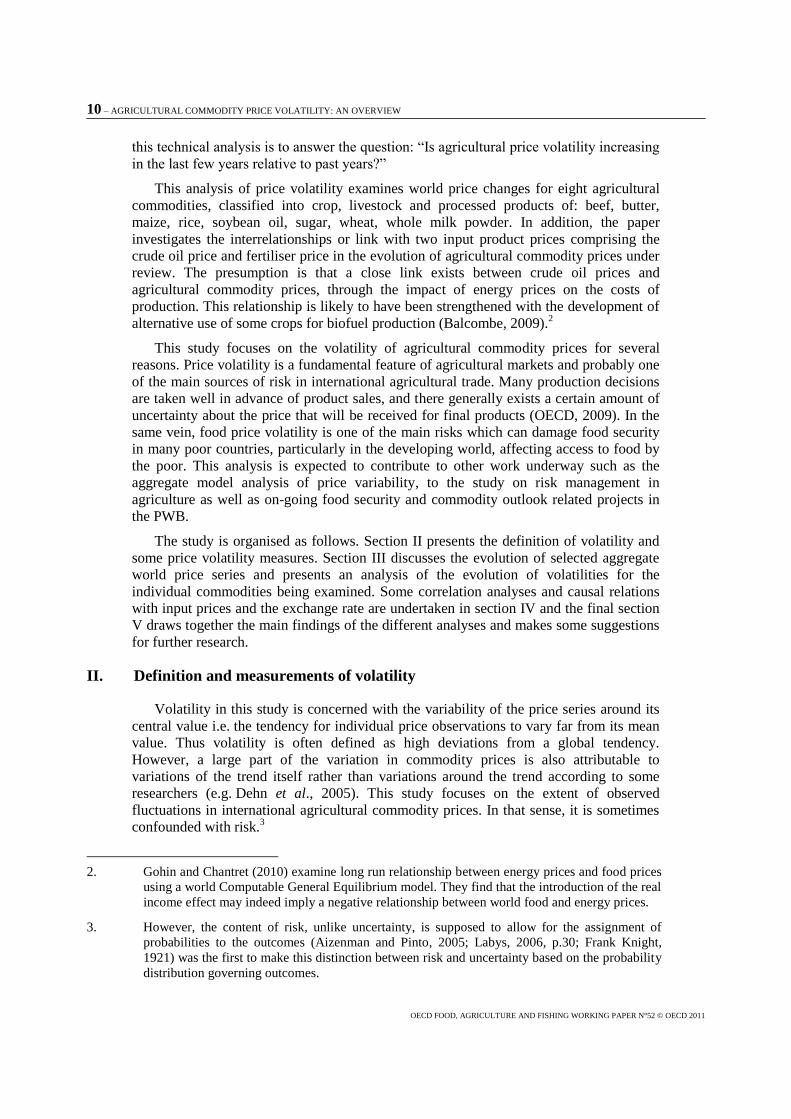
The prices of eight agricultural commodities are then plotted on Figure 1B.12
The
major price increases over the period 2006-08 were for rice (130%), butter (110%),
11
. Note that the corresponding rise for fertiliser (collected from FAO) is 170%. See Annex 1 for definition
and Annex 8 for figures.
12. All details about the data can be found in Annex 1.

14 – AGRICULTURAL COMMODITY PRICE VOLATILITY: AN OVERVIEW
OECD FOOD, AGRICULTURE AND FISHING WORKING PAPER N°52 © OECD 2011
soybean oil (105%), maize (83%) and whole milk powder (79%). Wheat follows these
with a 70% increase. Two agricultural commodities, beef and sugar, stand out from the
group with a particularly low price increase and even a decrease over 2006-08: +4% and -
15%, respectively.
Figure 1B. World nominal prices of agricultural commodities
0
500
1000
1500
2000
2500
3000
3500
4000
4500
19
57
19
59
19
61
19
63
19
65
19
67
19
69
19
71
19
73
19
75
19
77
19
79
19
81
19
83
19
85
19
87
19
89
19
91
19
93
19
95
19
97
19
99
20
01
20
03
20
05
20
07
20
09
$/ton
beef butter maize rice soybean oil sugar whole milk powder wheat
Source: IMF, FAO.
Volatility is thereafter computed for these eight world agricultural commodity prices,
both for the whole period which extends from 1957:1 to 2010:2 for most products13
and
selected sub-periods of a decade. The 1970s stand out in the long history of world
commodity prices. It is interesting to compare the recent price surge of 2006-08 with this
earlier period, in particular. In the same vein, it is also interesting to look at the 1990s
decade which is particularly known for its lower commodity prices. Hereafter the analysis
focuses on comparisons between the recent period and these past decades. We question
how volatility has evolved in recent years as compared with previous decades. For the
recent period, we examine the few last years (2006-2010) or the entire 2000s to make
close comparisons and also to be able to run statistical tests on annual data (in Annex 6).
As price volatility is greater for monthly data compared to annual price changes, only
results for monthly data (i.e. rolling estimates of annual volatility over the preceding
12 months) are reported throughout the main text of this study. A detailed data list is
reported in Annex 1. Results with annual data are reported in Annex 6.14
13 See Annex 1 for detailed database.
14 The same analysis is also undertaken for two input product prices, crude oil and fertiliser, for
comparisons. Results are reported in Annex 8 for monthly and annual data.
AGRICULTURAL COMMODITY PRICE VOLATILITY: AN OVERVIEW – 15
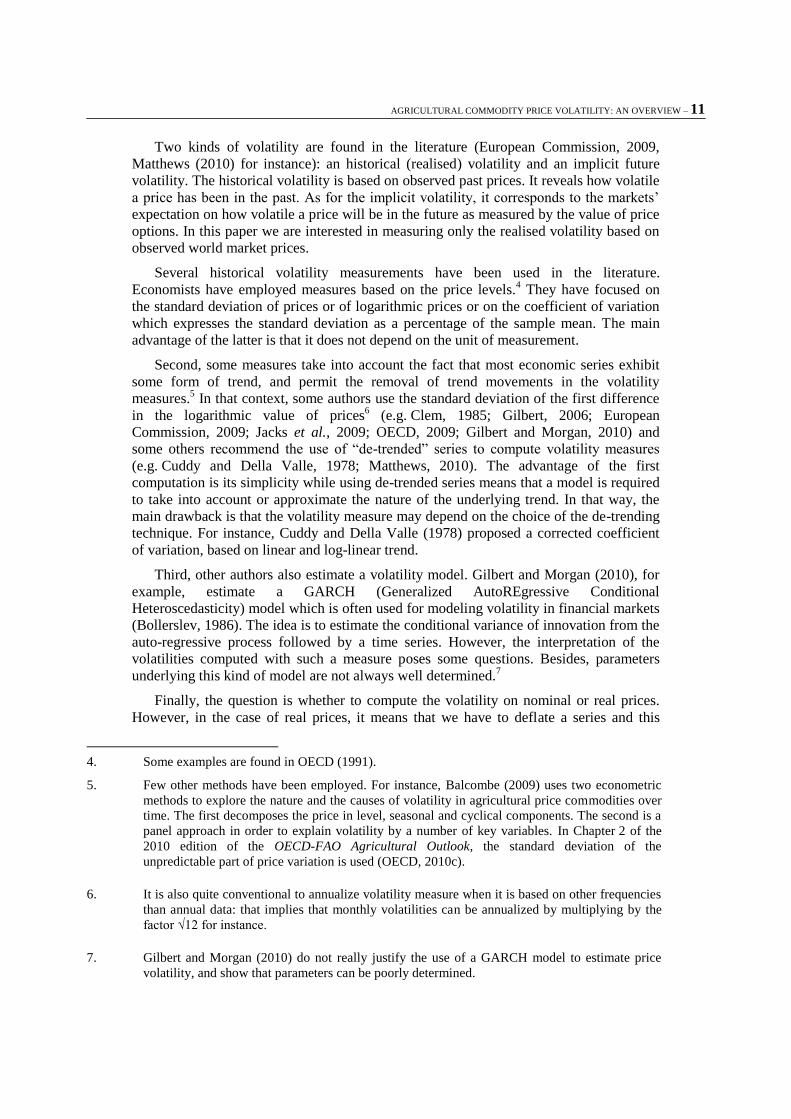
Figure 2. Average volatility computed as standard deviation of price in difference (SDD)
0,00%
2,00%
4,00%
6,00%
8,00%
10,00%
12,00%
Whole period 1970:1-1980:12 1990:1-2000:12 2001:1-2010:2 2006 :1-2010 :2
Beef Butter Maize Rice Soybean oil Sugar Wheat Whole milk powder
Note: Butter and whole milk powder prices are available only since 1995 with monthly data.
Source: IMF except for butter and whole milk powder (USDA).
In splitting the entire period into sub-periods of ten years, Figure 2 provides a
relatively crude visual indication of whether volatilities have been changing. It is arguable
from this figure that it is the high volatility levels of the most recent years (2006-10) that
are out of line with past experience. Indeed, there is a rise in volatility for most products
in recent years. By contrast, when we compare the longer period (2001-10) with other
sub-periods and particularly with the previous period of high volatility (1970s), a decline
in volatility can be seen for three products: beef, sugar and soybean oil.
A comparison over time reveals that with monthly data agricultural price volatilities
have been, on average, always lowest for meat and dairy products, and highest for rice,
sugar and soybean oil.15
These results are consistent with some other studies such as
Gilbert and Morgan (2010) who find the lowest price volatility for meats and the highest
for fresh fruits over the period 1970-2009.16
It is, however, difficult to judge the evolution of volatility with such a simple
comparison. One way of clarifying the question is to apply a battery of tests (by product,
by period, by database, by frequency, and by volatility measure), and then to run some
statistical tests of means and equality of variances to know whether the observed changes
are statistically significant.
15. With annual data, wheat price volatility can also be considered lower. The case of whole milk
powder amongst the lowest is in this case questionable. Note: Butter and whole milk powder
prices are available only since 1995 with monthly data.
16. Note that fertiliser price and crude oil price volatilities observed over the period 2006-10 with
monthly data are higher than those of agricultural commodities (Annex 8). Butter and whole
milk powder prices are available only since 1995 with monthly data.

16 – AGRICULTURAL COMMODITY PRICE VOLATILITY: AN OVERVIEW
OECD FOOD, AGRICULTURE AND FISHING WORKING PAPER N°52 © OECD 2011
Box 1. Do data sources matter for evaluating volatility?
Price volatility measurement has been computed with monthly data collected from IMF and UNCTAD (and USDA for dairy products). Annex 2 reports the results for the standard deviation and the coefficient of variation for soybean oil and rice prices, for example. Figures suggest that volatility measurements are very close, whatever the source of data. The same pattern is observed for other products. As for the specific measures of volatility such as the corrected coefficient of variation, this is not reported at this stage since by definition it is close to the coefficient of variation and its addition renders the figures too difficult to read. We can also note, as one would expect, that the extent of measured price volatility increases with the periodicity of the price observation i.e. it is higher with monthly data than with annual data (Annex 6).
* Results are available upon request. This observation is also correct with annual data using either IMF, UNCTAD or AGLINK data (see Annex 6).
At this stage, our computations would suggest that the different sources of primary
data (e.g. IMF,UNCTAD,USDA,AGLINK) are probably not a major cause of differences
in volatility, while the frequency of recorded price observations (monthly or annual) may
play a role.
Box 2. Nominal versus real volatilities
To test robustness of our computations, we deflate the nominal series by the US dollar consumer price index. Results for rice and soybean oil with monthly data are reported in Annex 3. Whatever measurement of volatility is employed, it is found to be very similar when prices are expressed in either nominal or real terms.
A second axis of comparisons is related to the measure of volatility itself. As
previously stated, the volatility of series of historical data collected from various
databases are closely connected. We thus choose to report in Annex 4 the different types
of volatility based on the IMF database only (or USDA for dairy products).
Box 3. SDD vs CV vs CVV: some comparisons
According to Annex 4, the coefficient of variation (CV) reveals some more pronounced peaks of volatility.* The volatility measure based on the corrected coefficient of variation (CCV) suggests a smoother pattern compared to the coefficient of variation. Note that the calculated standard deviation series based on prices in first differences (SDD) is very close to the evolution of the corrected coefficient of variation. It is also closely related to the coefficient of variation for low levels of volatility, as echoed elsewhere in the literature (Gilbert and Morgan, 2010).
* However, it is less obvious with annual data (Annex 6). Even if the spikes are more pronounced for the coefficient of variations, the differences are less important. The three volatility measures are relatively closely related. It may simply be explained by the low variability in volatility with annual data.
** Based on monthly data, the commodity price volatility defined as the annualised moving standard deviation presents a higher magnitude relative to the other measures. It renders comparisons difficult.
Finally, as world prices are expressed in US dollars, the effect of changes in the US
dollar exchange rate on the volatility of the commodity price series is shown in part by
calculating volatility measures for monthly price series denominated in Euros (converted
using euro-dollar exchange rate). Results reported in Annex 5 show the computed
volatilities – calculated with standard deviation in first differences - for both price series,
AGRICULTURAL COMMODITY PRICE VOLATILITY: AN OVERVIEW – 17
(in dollar and in Euros) for comparison. They suggest that there are no significant
differences between volatilities based on both currencies.17
In the following analyses, only statistical tests based on the standard deviation (SDD)
and/or the coefficient of variation (CV) measures for US dollar world commodity price
series are reported in the text.
III.2 Mean tests on volatility measurements
According to figures in Annex 4, a particularly high degree of volatility can be noted
in the nineteen seventies whatever the measure of price volatility that is used. However, it
is difficult to identify any pronounced tendency (up or down) in the calculated volatilities.
The most impressive features seem to be the following. First, the observed volatility
seems to be growing slowly for wheat over time. Volatility stands at 5-10%, on average,
since the end of 1980s against a range rather below 5% in the past (except for the surge of
1970s). Second, we can observe a decrease in the volatility for rice over the decade 2000,
which is followed by a huge spike in 2008-10, the largest observed for the past 50 years
for monthly data. Third, the peak of the recent years seems to be lower than past peaks for
beef, soybean oil, sugar and wheat, but higher for butter, maize, rice and whole milk
powder. Note, however, that monthly data for dairy products are available only since
1995 preventing comparisons with the nineteen seventies.18
Let us next add some tests of differences in means to determine if the mean in
volatility in the recent decade is statistically different from that in the other sub-periods.
The test under the null hypothesis is the following: H0: 1vol = 2vol
where 1vol and 2vol are the means of the volatility measurement for each period 1 and 2.
The computed statistic can be written:
2
2
2
1
2
1
21
n
s
n
s
volvolt
With s the standard deviation for the same periods respectively.
The computed t-statistic is compared to a Student with (n1 + n2 - 2) degrees of
freedom.
Test statistics and their p-values in brackets are summarised in the Table 1 below.19
Under the null hypothesis, we test the equality of the means of the two sub-periods
relative to the 2000s. In other words, if the result is significant (low p-value), the null
hypothesis can be rejected and the means are statistically different.
17. This conclusion stands also for volatilities computed with the coefficient of variation as well as
the corrected coefficient of variation.
18. In the case of rice, the recent peak is less obvious with annual data. Results are certainly
smoothed with moving computations over five years.
19. Corresponding results for agricultural commodity prices with annual data can be found in
Annex 6. In the same way, Annex 8 reports similar computations for crude oil price and
fertiliser.
18 – AGRICULTURAL COMMODITY PRICE VOLATILITY: AN OVERVIEW
OECD FOOD, AGRICULTURE AND FISHING WORKING PAPER N°52 © OECD 2011
First, it is worth noting that even if conclusions may sometimes depend both on the
measure of volatility and on the frequency of price observations, it is possible to identify
some common features through the synthesis proposed in Table 2 (and Table A6.2 in
Annex 6). This table classifies products according to the significance of mean tests. For
instance, in the case of beef (the first line of Table 1), making comparisons between the
recent years (either 2006-10 or for the entire 2000s decade) with the seventies reveal that
the t-statistic is statistically significant with a negative sign in both columns meaning that
the average volatility computed either over 2006-10, or over the entire 2000s, is
significantly lower than that observed in the 1970s. This result is found for both
measurements (SDD and CV). “Beef” is thus written in the sub-column “Lower mean
volatility” of the column “compared to the seventies” in Table 2.
Table 1. Tests of equality of means in volatility between the last decade or last years and other periods (t-statistics and p-value in brackets)
Average volatility 2001:1-2010:2 relative to Average volatility 2006:1-2010:2 relative to
Standard deviation (SDD) Standard deviation (SDD)
Whole period
1970: 1-1980:12
1990: 1-2000:12
Whole period 1970: 1-1980:12
1990: 1-2000:12
Beef -1.16 (0.24)
-4.85*** (0.00)
3.49*** (0.00)
0.15 (0.88)
-2.09** (0.03)
2.39** (0.02)
Buttera -0.09 (0.92)
- -0.46 (0.76)
6.20*** (0.00)
- 5.11*** (0.00)
Maize 4.69*** (0.00)
0.49 (0.62)
4.31*** (0.00)
10.55*** (0.00)
7.06*** (0.00)
9.83*** (0.00)
Rice 0.23 (0.85)
0.41 (0.68)
-2.16** (0.03)
3.25*** (0.00)
3.32*** (0.00)
1.95* (0.05)
Soybean oil 1.99* (0.05)
-3.58*** (0.00)
7.86*** (0.00)
2.43** (0.01)
-0.75 (0.45)
5.20*** (0.00)
Sugar -8.18*** (0.00)
-9.26*** (0.00)
1.65 (0.10)
-6.00*** (0.00)
-8.11*** (0.00)
1.74* (0.08)
Wheat 5.67*** (0.00)
0.37 (0.71)
3.22*** (0.00)
8.78*** (0.00)
3.88*** (0.00)
7.07*** (0.00)
Whole milk powder
2.54** (0.01)
- 6.54*** (0.00)
7.32*** (0.00)
- 10.77*** (0.00)
Coefficient of variation (CV) Coefficient of variation (CV)
Whole period
1970: 1-1980:12
1990: 1-2000:12
Whole period
1970: 1-1980:12
1990: 1-2000:12
Beef -1.77* (0.07)
-7.21*** (0.00)
2.08** (0.03)
-4.31*** (0.00)
-8.62*** (0.00))
-1.14 (0.26)
Butter 2.25** (0.02)
- 4.96*** (0.00)
5.46*** (0.00)
- 7.11*** (0.00)
Maize 2.76*** (0.00)
0.58 (0.56)
2.19** (0.03)
5.07*** (0.00)
3.55*** (0.00)
4.62*** (0.00)
Rice 0.00 (0.99)
-2.41** (0.02)
-0.09 (0.93)
1.93* (0.05)
0.55 (0.59)
1.86* (0.06)
Soybean oil 2.09** (0.04)
-2.38** (0.02)
7.31*** (0.00)
3.21*** (0.00)
0.03 (0.97)
6.37*** (0.00)
Sugar -4.20*** (0.00)
-5.45*** (0.00)
4.66*** (0.00)
-0.53 (0.59)
-3.00*** (0.00)
5.33*** (0.00)
Wheat 3.53*** (0.00)
-0.29 (0.77)
2.22** (0.03)
5.19*** (0.00)
2.34** (0.02)
4.35*** (0.00)
Whole milk powder
2.79*** (0.00)
- 7.12*** (0.00)
6.41*** (0.00)
- 9.40*** (0.00)
Note: monthly data for butter and whole milk powder are available only since January 1995. p-value in brackets (…). *, **, *** stands respectively for 10,5 and 1% significance level. Source: Author’s computations.
AGRICULTURAL COMMODITY PRICE VOLATILITY: AN OVERVIEW – 19
Table 2. Synthesis of mean tests , average volatility of recent years (2001-10 or 2006-10) compared to the average volatility over the whole sample or over the 1970s or the 1990s
2001-2010
Compared to the whole period Compared to the seventies Compared to the nineties
Lower mean volatility
Higher mean volatility
Lower mean volatility
Higher mean
volatility
Lower mean volatility
Higher mean volatility
Beef, sugar Butter, maize, soybean oil, wheat, whole milk powder
beef, rice, soybean oil, sugar
Rice Beef, butter, maize, soybean oil, sugar, wheat, whole milk powder
2006-2010
Compared to the whole period Compared to the seventies Compared to the nineties
Lower mean volatility
Higher mean volatility
Lower mean volatility
Higher mean volatility
Lower mean volatility
Higher mean volatility
Beef Butter, maize, soybean oil, rice, sugar, wheat, whole milk powder
Beef, sugar Maize, rice, wheat
Beef, butter, maize, rice, soybean oil, sugar, wheat, whole milk powder
Note: Products in italics means that the conclusion of the test is valid only for one of the measures (SDD or CV.)
Source: Author’s classification.
Several conclusions emerge
First, when combining both measures, the results reveal that agricultural volatilities
have been lowest, on average, for beef, and sugar for the whole period of 50 years with
monthly data.20
Second, the last decade has seen higher levels of agricultural volatility
than in the nineteen nineties but not higher than in the 1970s and even lower levels than
those of the 1970s for beef, rice, soybean oil and sugar. When we focus on the very recent
years (2006-10), the volatility seems higher than in the 1970s only for cereal products and
lower for beef and sugar. Our results suggest at this stage that there is no clear increasing
global tendency in commodity price volatility. The general conclusion is that price
volatility is higher in 2006-10 than in the nineties, but not necessarily higher than that of
the seventies.21
III.3 Tests of equality of variances for price differences
In order to improve the robustness of our results, we perform the standard F-test for
variance equality for price differences with IMF monthly data (or USDA monthly data for
butter and whole milk powder).22
20. Note that results with annual data (Annex 6) are quite close to those for the corresponding period
of 2001-10 with monthly data, suggesting that the choice of frequency may not disturb the main
findings for agricultural commodity prices.
21. Fertiliser and crude oil monthly prices exhibit higher volatilities than in the past (Annex 8).
22. A similar methodology is applied for theses agricultural products with annual data in Annex 6
and for input prices in Annex 8.
20 – AGRICULTURAL COMMODITY PRICE VOLATILITY: AN OVERVIEW
OECD FOOD, AGRICULTURE AND FISHING WORKING PAPER N°52 © OECD 2011
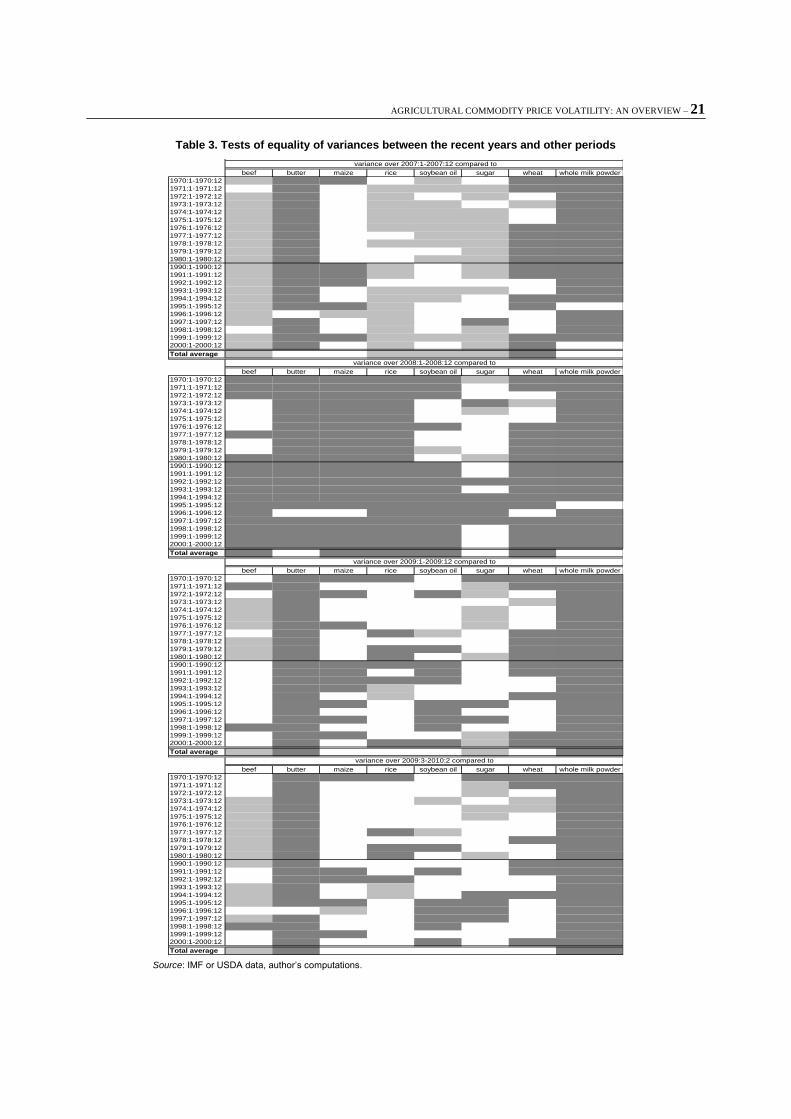
We run variance equality tests to make comparisons over time and to see if a clear
picture of the evolution of price volatility emerges. Again, the idea is to compare the last
few years relative to the seventies and the nineties. We report here variances tests for
each of the last few years, 2007:1-2007:12, 2008:1-2008:12, 2009:1-2009:12, and even
2009:3-2010:2 to analyse the most recent observations, relative to the variance of each
year over the nineteen seventies, the nineteen nineties and finally, relative to the volatility
of the whole sample (“total average”). Thus, we test if variances are statistically different
during the year 2007 relative to the year 1970, 1971, and so on.
We test the null hypothesis H0: 2
2
2
1 against an alternate hypothesis 2
2
2
1 .
We calculate the F-statistic as the ratio of the two variances 2
2
2
1
s
s where
2
1s 2
2s so that F
1.The degrees of freedom for the numerator and the denominator are n1-1 and n2-1. The
test outcome with 5% significance level is summarised in table 3 below.
Grey cells mean that the fall in volatility is statistically significant relative to the
tested periods (at 5 % level). Dark grey cells mean that the increase in volatility is
statistically significant relative to the tested periods. Cells are hatched when data are not
available. White cells mean that the variances are not statistically different.
In interpreting the results achieved, the main comments are the following. First, our
results suggest that volatility in the year 2007 was not, in general, higher than in previous
years. But volatility reported in 2008 is significantly higher than in the past for almost all
commodities. However, since January 2009, this volatility seems to have come down to
the similar level of previous decades, with the exception of dairy products and soybean
oil. For dairy products, volatility has been even higher than in the nineteen nineties.
Second, turning to specific products, the volatility observed in 2007 seems generally
lower at 5% level than that in the past with the exception of butter, wheat and whole milk
powder. The wheat price is even statistically higher than in the 1970s in 2007. The
volatility observed in 2008 is found to be higher for many commodities than that in the
past: it is particularly the case of grains such that maize, rice and wheat when we make
comparisons with the seventies but this conclusion stands for all products when we are
interested in the whole sample period, or simply in the nineteen nineties, with the
exception of sugar. Note that the volatility in prices of soybean oil and dairy products is
still statistically different from the nineteen nineties at the end of the period.23
23. Note that the volatility in monthly prices of crude oil is mostly statistically different from the
past (Annex 8).
AGRICULTURAL COMMODITY PRICE VOLATILITY: AN OVERVIEW – 21
Table 3. Tests of equality of variances between the recent years and other periods
beef butter maize rice soybean oil sugar wheat whole milk powder
1970:1-1970:12
1971:1-1971:12
1972:1-1972:12
1973:1-1973:12
1974:1-1974:12
1975:1-1975:12
1976:1-1976:12
1977:1-1977:12
1978:1-1978:12
1979:1-1979:12
1980:1-1980:12
1990:1-1990:12
1991:1-1991:12
1992:1-1992:12
1993:1-1993:12
1994:1-1994:12
1995:1-1995:12
1996:1-1996:12
1997:1-1997:12
1998:1-1998:12
1999:1-1999:12
2000:1-2000:12
Total average
variance over 2007:1-2007:12 compared to
variance over 2008:1-2008:12 compared to
variance over 2009:1-2009:12 compared to
variance over 2009:3-2010:2 compared to
Source: IMF or USDA data, author’s computations.

22 – AGRICULTURAL COMMODITY PRICE VOLATILITY: AN OVERVIEW
OECD FOOD, AGRICULTURE AND FISHING WORKING PAPER N°52 © OECD 2011
IV. A correlation analysis between agricultural prices and input prices
To go further and to improve the understanding of agricultural price volatility, we
assess whether the variation of crude oil price or fertiliser prices are related to agricultural
commodity prices. While several studies assert that crude oil price is a key factor,24
there
are no studies to our knowledge focusing on the linkage between the fertiliser price and
agricultural commodity prices. To this end, we first compute simple correlations
coefficients of changes in prices by decade and also for the whole period. Second, we
perform Granger causality tests to determine whether input prices and the euro-dollar
exchange rate are driving the volatility of the individual agricultural commodity prices.
IV.1 Correlation coefficients
The most familiar measure of dependence between two variables is the Pearson's
correlation coefficient. It is obtained by dividing the covariance of the two commodity
prices (X and Y) by the product of their standard deviations:
YX
YX
YXYXcorr
),cov(),(,
The value of YX , is such that 11 , YX . It is +1 in the case of a perfect positive
linear relationship (correlation), −1 in the case of a perfect negative linear relationship.
The closer the coefficient is to either −1 or 1, the stronger the correlation between the
variables.
Two levels of comparisons are employed. First we compute correlations between the
indicator world crude oil price or fertiliser price 25
and each of the agricultural price series
to be considered, over the whole 50 year period, but also within the different sub-periods
already noted (Figure 3). We propose both instantaneous and lagged correlations between
quarterly growth rates in prices (i.e. growth rate over the 3 past months). When lagged
correlations are considered, a quarter ahead for the oil price or the fertiliser price is
examined.26
Second, we also analyse cross-correlations between agricultural product
prices over the whole period and sub-periods.
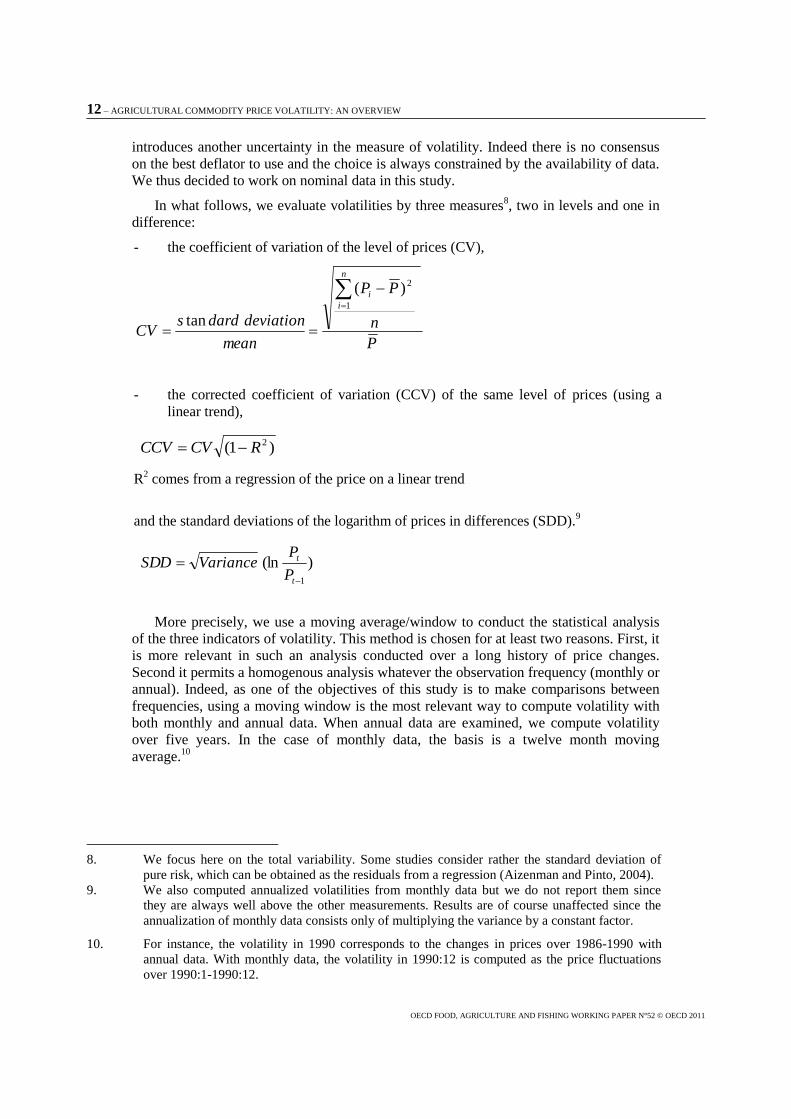
According to Figure 3, correlations between agricultural product prices and either
crude oil price or fertiliser price never exceed 0.5 with monthly data contrary to the
results obtained with annual data (Annex 6).27
Correlation between crude oil price and
fertiliser price is particularly high in the 2000s, 0.56, while it is only 0.13 in the 1990s
24. Balcombe (2009) using two different approaches tried to explain volatility by a number of key
variables. Especially, he finds that oil price volatility had a positive impact on commodity price
volatility.
25. See Annex 1 for detailed definitions and data.
26. Similar computations with annual data are undertaken. Results are reported in Annex 6. We
compute correlations between first-difference price series. The delay that is chosen for the
impact of crude oil/fertiliser price on other product prices is then one year.
27. Lagged correlations computed with monthly data are in general of the same order than
simultaneous ones. Results are available upon request. With annual data, correlations are higher
within the year rather than adding lagged effects (Annex 6) except for sugar.
AGRICULTURAL COMMODITY PRICE VOLATILITY: AN OVERVIEW – 23
with monthly data.28
These results suggest that agricultural product prices are more highly
correlated within twelve months than within a shorter period. This finding could be
explained by delays of transactions within contracts, for example.
It is also interesting to make a comparison over time and across products. First, it
seems that all correlations increase in a period of high prices: but they are higher in the
price surges of the nineteen seventies and the 2000s than in the 1990s.29
In the last
decade, products that are found to be most correlated with the crude oil price are butter
(0.46), whole milk powder (0.47) and, soybean oil (0.49), based on monthly data (Figure
3A). In the case of annual data (annex 6), the calculated correlation coefficients are 0.44
for maize, 0.49 for whole milk powder, 0.52 for wheat and 0.53 for butter. Products that
are less correlated with crude oil are beef and sugar: 0.30 (0.22) and 0.24 (0.06), for
monthly (annual) data respectively.
The correlation between commodity prices and the crude oil price is presumably due
to production and transport costs. Alternative use of some crops for biofuel production is
also a more recent possible explanation. For instance, maize being used as the main
ethanol feedstocks, we expect a positive correlation between oil prices and maize prices.
Oil and energy prices are more closely related to crop production costs than livestock,
which is affected indirectly through animal feed costs based in crop products (maize,
soybeans, wheat, etc).
One possible explanation for the correlation between sugar price and oil prices in the
past was the fact that bargasse (the waste from cane) is used to produce steam and
electricity for processing sugar rather than oil. However, with the growing importance of
biofuel ethanol made from sugarcane juice or molasses, the economics of this extraction
is more closely linked to oil prices. This is supported by our results: the correlation of
sugar price with oil price is increasing for 40 years with monthly data (0.24 in 2000s).
The low observed relationship with annual data is perhaps due to a lagged effect in this
particular case. Indeed, lagged correlation coefficients reveal a level by 0.5. Sugar is the
only product which shows a higher correlation with the oil price when this is lagged one
year.
In a similar vein, correlations of the different product prices with the fertiliser price
were also examined (figure 3B and annex 6). Results seem a bit different for some
products according to the data frequency. Correlations coefficients are broadly higher
with annual data (≥0.6 for six out of the eight products) while all coefficients are below
0.5 with monthly data. Products that appear to be the most correlated with the fertiliser
price are butter, whole milk powder and rice for both monthly and annual frequencies, but
we can also consider in this group maize, soybean oil and wheat, if we consider annual
data. The least correlated are always beef and sugar.
28. The corresponding features with annual data are 0.78 during the 2000s, 0.24 during the 1990s
and 0.79 during the 1970s.
29. It is also right if we look at the 1960s and the 1980s. Results for these decades are available upon
request. There are not reported to keep clear figures.
24 – AGRICULTURAL COMMODITY PRICE VOLATILITY: AN OVERVIEW
OECD FOOD, AGRICULTURE AND FISHING WORKING PAPER N°52 © OECD 2011
Figure 3. Instantaneous correlations (with quarterly price growth rates)
Figure 3A With crude oil price Figure 3B With fertiliser price
-1,0
-0,5
0,0
0,5
1,0beef
butter
maize
rice
soybean oil
sugar
wheat
whole milk powder
1970s 1990s 2000s
-1,0
-0,5
0,0
0,5
1,0beef
butter
maize
rice
soybean oil
sugar
wheat
whole milk powder
1990s 2000s
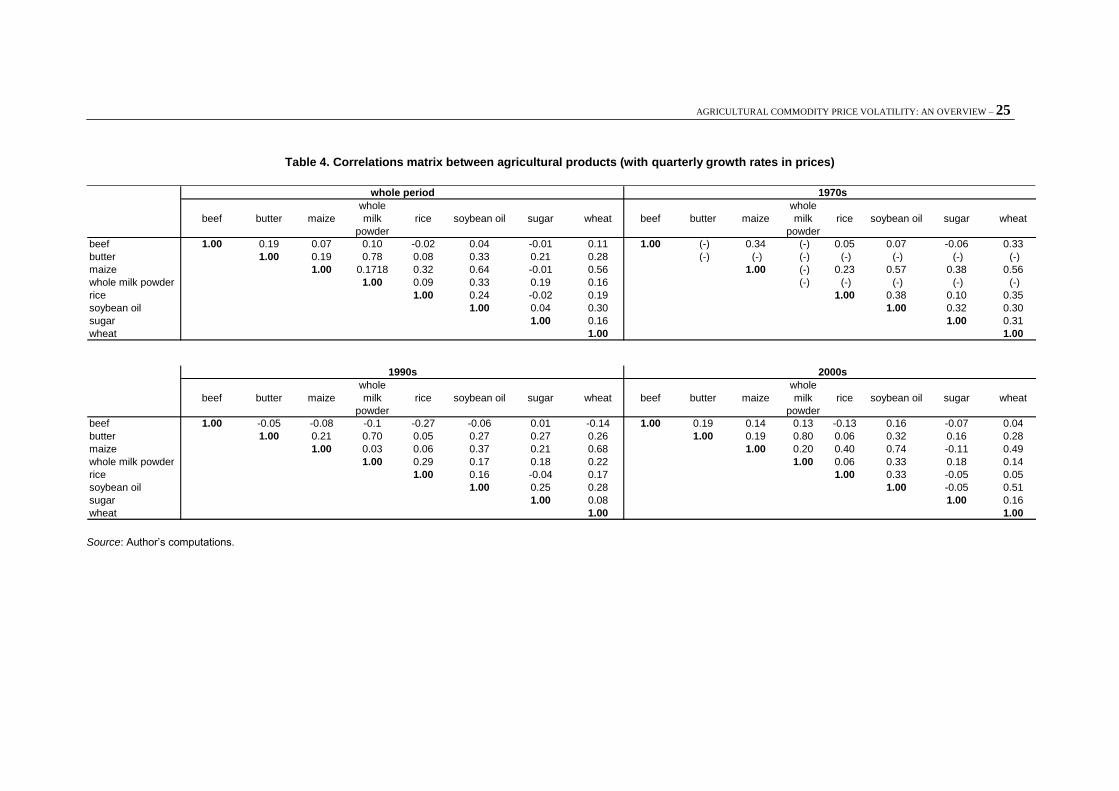
We finally report in Table 4 below some average cross- agricultural product
correlations for the whole period and the previously defined decades. A couple of
products can be highlighted due to quite high correlation coefficients. The correlation
coefficient between whole milk powder and butter prices is, as expected, particularly
important and is increasing over time: 0.70 on average in the 1990s and 0.80 in the 2000s.
A high positive correlation is also observed between maize and wheat in a range of
[0.5;0.6], according to the decade of comparison. After a decrease during the 1990s, the
correlation coefficient between maize and soybean oil is particularly high in the 2000s
(0.74 on average). A similar pattern is observed between wheat and soybean oil, although
at a lower level (0.51 in 2000s against 0.30 on average for the whole period).
AGRICULTURAL COMMODITY PRICE VOLATILITY: AN OVERVIEW – 25
Table 4. Correlations matrix between agricultural products (with quarterly growth rates in prices)
beef butter maize
whole
milk
powder
rice soybean oil sugar wheat beef butter maize
whole
milk
powder
rice soybean oil sugar wheat
beef 1.00 0.19 0.07 0.10 -0.02 0.04 -0.01 0.11 1.00 (-) 0.34 (-) 0.05 0.07 -0.06 0.33
butter 1.00 0.19 0.78 0.08 0.33 0.21 0.28 (-) (-) (-) (-) (-) (-) (-)
maize 1.00 0.1718 0.32 0.64 -0.01 0.56 1.00 (-) 0.23 0.57 0.38 0.56
whole milk powder 1.00 0.09 0.33 0.19 0.16 (-) (-) (-) (-) (-)
rice 1.00 0.24 -0.02 0.19 1.00 0.38 0.10 0.35
soybean oil 1.00 0.04 0.30 1.00 0.32 0.30
sugar 1.00 0.16 1.00 0.31
wheat 1.00 1.00
beef butter maize
whole
milk
powder
rice soybean oil sugar wheat beef butter maize
whole
milk
powder
rice soybean oil sugar wheat
beef 1.00 -0.05 -0.08 -0.1 -0.27 -0.06 0.01 -0.14 1.00 0.19 0.14 0.13 -0.13 0.16 -0.07 0.04
butter 1.00 0.21 0.70 0.05 0.27 0.27 0.26 1.00 0.19 0.80 0.06 0.32 0.16 0.28
maize 1.00 0.03 0.06 0.37 0.21 0.68 1.00 0.20 0.40 0.74 -0.11 0.49
whole milk powder 1.00 0.29 0.17 0.18 0.22 1.00 0.06 0.33 0.18 0.14
rice 1.00 0.16 -0.04 0.17 1.00 0.33 -0.05 0.05
soybean oil 1.00 0.25 0.28 1.00 -0.05 0.51
sugar 1.00 0.08 1.00 0.16
wheat 1.00 1.00
whole period 1970s
1990s 2000s
Source: Author’s computations.
26 – AGRICULTURAL COMMODITY PRICE VOLATILITY: AN OVERVIEW
OECD FOOD, AGRICULTURE AND FISHING WORKING PAPER N°52 © OECD 2011
IV.2. Some causality tests
While these correlation coefficients show the interrelations or linkages of observed
changes in commodity prices and those of crude oil and fertilizer prices, the question is to
what extent the underlying variability of these two input series plus exchange rates is
driving the observed variability in the different commodity price series. To determine
their contribution Granger causality tests are applied to the price series.
The Granger causality test is determining whether one time series is useful in
forecasting another. A time series X is said to Granger-cause Y if it can be shown, through
F-tests on lagged values of X, that those X values provide statistically significant
information about future values of Y. Thus we perform Granger causality tests over the
whole period between input prices as well as Euro-dollar exchange rate with each of the
agricultural commodity prices. We have tested the significance of quarterly growth in oil
prices or exchange rate or fertilizer prices on monthly commodity prices (with one lag i.e.
a quarter of the series). These tests are performed both for commodity prices denominated
in US dollar and for these prices transformed into Euros.30
According to Annex 7, results suggest that there are interlinked causal effects,
particularly from oil and the US/Euro exchange rate to agricultural commodities. This is
particularly true for beef, butter and sugar, but less the case for cereals. However, there is
no evidence of causality increasing over time31
and there is no evidence of exchange rate
causing more volatility in commodity prices when measured in Euros or in US dollars.
This, of course, could be different for some other currencies.
V. Conclusions
This study places recent commodity price spikes and changes in an historical context.
Indeed, there is a widely perceived view that because of recent price spikes and rapid
declines, commodity price volatility has increased over time. However, from this analysis
it is not clear that price volatility in the recent period is much different from price
volatility in earlier periods over the past 50 years exepting for wheat and rize. The
statistical analysis also demonstrated that conclusions drawn on volatility are robust in
terms of the data sources and, in general for volatility measures based on the standard
deviation of first difference of price series, the corrected coefficient of variation as well as
the coefficient of variation. There was also little difference in results whether the
volatility measures were computed on US dollar prices or on prices denominated in euro.
The evolution of world commodity price indices for food and agricultural raw
material and for each of the eight agricultural commodities examined confirms the higher
prices during the nineteen seventies and the recent 2006-08 period. The pattern of
observed price variation also illustrates the particularly low level of world prices during
the nineteen sixties and the sharp falls that took place in 2009.
However, the statistical analysis of the volatility of the individual agricultural
commodity price series has shown that there is no clear increasing global tendency in
30 We have run similar tests for annual data. Results (available upon request) show less significant
causality effects with yearly data.
31 Detailed results by decade are not reported but are available upon request.

AGRICULTURAL COMMODITY PRICE VOLATILITY: AN OVERVIEW – 27
price volatility over the past 50 years except for wheat and rice. In terms of the most
recent commodity price hike and collapse of 2006-09, the general finding seems to be that
price volatility is higher than in the nineties, but not necessarily higher than that of the
seventies, with the major exception of wheat and rice.
According to variance tests, volatility reported in 2008 is significantly higher than in
the past for almost all commodities. However, since January 2009, this volatility seems to
have returned to similar levels of previous decades, with the only exception of dairy
products. This confirms much of the existing literature in that the recent spike in price
volatility is rather transitory (Balcombe, 2009; Gilbert and Morgan, 2010; OECD, 2010c).
Our results are in line with Sumner (2009) who finds evidence from a long-term analysis
for maize and wheat prices that whenever prices have spiked up, they have soon fallen
sharply afterwards. Matthews (2010) finds higher volatility for six agricultural products
in the European Union using German prices, but his study does not consider the 1970s.
This study also provides some specific findings for individual agricultural products.
These indicate that agricultural price volatilities based on standard deviation of prices in
first differences have been on average always lowest for beef. Mean tests as well as
variance tests carried out on this type of measurement confirm that most recent years
have seen lower levels of agricultural price volatility than in the 1970s for beef and sugar.
According to tests of equality of variance, wheat price volatility observed in 2007
seems generally higher than that in the past (and particularly the 1970s) while price
volatility of other products is rather lower. On the contrary, the volatility observed in
2008 seems most often higher than that in the past: it is particularly the case of grains
such as maize, rice and wheat when we make comparisons with the seventies but this
conclusion stands for all products when we are interested in the whole sample period or
simply the sub period of the nineties, with the exception of sugar. The volatility in prices
of soybean oil and dairy products was found to be higher at the end of the period than in
the nineteen nineties.
The second objective of this study was to assess whether the crude oil price or
fertiliser price are closely related to the observed variations in agricultural commodity
prices. Correlation coefficients between the change in price of each input and in the price
of each agricultural product suggest that prices are more highly correlated within twelve
months than within a shorter period of time and increase during periods of higher prices.
In the last decade, products that are most correlated with the crude oil price based on
monthly data are butter, whole milk powder, soybean oil. In case of annual data, products
with the highest correlations are maize, whole milk powder, wheat and butter. The
products with the least correlation are always beef and sugar. Correlation between the
crude oil price and fertiliser price is particularly high in the 2000s, 0.56 (0.78), while it is
only 0.13 (0.24) in the 1990s, with monthly (annual) data. In addition, high correlations
are found between certain agricultural commodity prices themselves: whole milk powder
and butter prices, maize and wheat prices; maize and soybean oil prices; wheat and
soybean oil.
Finally, results of Granger causality tests suggest that there are causal effects,
particularly from crude oil and euro-dollar exchange rate to beef, butter and sugar.
However, there is no evidence of causality increasing over time and there is no evidence
of exchange rates causing more price volatility in Euros than in dollar. It would be
interesting to see whether these conclusions stand for prices expressed in “small
currencies” (in Australian or New Zealand dollar for instance) that are likely to be more
volatile.
28 – AGRICULTURAL COMMODITY PRICE VOLATILITY: AN OVERVIEW
OECD FOOD, AGRICULTURE AND FISHING WORKING PAPER N°52 © OECD 2011
Note that these statistical results of causality must be interpreted with caution since
the international context has changed over the last 50 years. It would be thus interesting
to extend the analysis into national prices in order to study the transmission of world
price volatility into domestic markets and the role of policies. The extent of transmission
would likely be affected by the liberalisation process and trade regional agreements, for
instance. Indeed as markets are increasingly integrated in the world, economic shocks in
the international markets may be transmitted much more rapidly than before. In this
context, domestic prices may now exhibit volatility that agricultural producers did not
face in the past, and with low income countries suffering the most.
Liberalisation of agricultural products has especially increased since the Marrakech
Agreement in 1994. Statistical results reveal that price volatility is found to be higher now
than in the nineties for most products. In this context, experience in recent years may
suggest that authorities and stakeholders now face additional challenges with volatile
prices and agricultural trade, and should coordinate their policy responses. Te high
correlation with crude oil price for some agricultural products during the 2000s may
confirm that biofuel products have played a role in the recent price surges.
Agricultural price volatility remains an important policy concern. Further periods of
sharp price surges and declines as occurred in 2006-09 cannot be ruled out with their
adverse implications for food prices, food security or farm incomes. In terms of future
work, a possible extension could be to analyse the relationship between price volatility
and food security. In addition, it could be interesting to measure the intensity of oil usage
in the production and transportation cost of the eight agricultural commodities to
determine if this can explain, at least partially, the correlation between crude oil and
agricultural product prices.
AGRICULTURAL COMMODITY PRICE VOLATILITY: AN OVERVIEW – 29
References
Abbott P. and Borot de Battisti A. (2009), Recent Global Food Price Shocks: Causes,
Consequences and Lessons for African Governments and Donors. Paper presented at the
International Agricultural Trade Research Consortium.
Acemoglu D., Johnson S., Robinson J.A. and Thaicharoen Y. (2003), Institutional causes,
macroeconomic symptoms: volatility, crises and growth. Journal of monetary economics. 50
(1). P. 49-123.
Aizenman J. and Marion N. (1993), Policy uncertainty, persistence and growth. Review of
international economics. 1 (9). p. 145-163.
Aizenman J. and Pinto B. (2005), Managing economic volatility and crises: a practitioner’s guide
overview. Cambridge University Press.
Balcombe K. (2009), The nature and determinants of volatility in agricultural prices: an empirical
study from 1962-2008. A report to the Food and Agriculture Organization of the United
Nations.
Bollerslev T. (1986), Generalized autoregressive conditional heteroscedasticity. Journal of
Econometrics. 31. p. 307-327.
Cashin P.C. and McDermott C.J. (2002), The long-run behavior of commodity prices: small trend
and big variability. IMF Staff Papers 49 (2). p175-199.
Clem A. (1985), Commodity price volatility: trends during 1975-84. Monthly labor review, June.
De Schutter O. (2010). Food commodities speculation and food price crises: regulation to reduce
the risks of price volatility. http://www.srfood.org/ United Nations Special Rapporteur on the
Right to Food. Briefing note 02. September.
Deaton A. and Laroque G. (1992), On the behavior of commodity prices. Review of economic
studies. 59. p.1-23.
European Commission (2009), Historical price volatility. Brussels. DG agriculture and rural
development.
Cuddy J.D.A. and Della Valle P.A. (1978), Measuring the instability of time series data. Oxford
Bulletin of Economics and Statistics. 40 (1). p. 79-85.
Dehn J.. Gilbert C. L. and Varangis P. (2005), Agricultural commodity price volatility. in
Managing Economic volatility and crises: a practitioner’s guide. eds Aizenman J. and Pinto B..
Cambridge University Press.
European Commission (2009), Historical price volatility. Directorate - general for agriculture and
rural development.
Galtier F. (2009), How to manage food price instability in developing countries? UMR Moisa.
Working paper n°5.
Gilbert C.L. (2006), Trends and volatility in agricultural commodity prices. In A. Sarris and D.
Hallam eds, Agricultural Commodity Markets and trade, Cheltenham, Edward Elgar.
30 – AGRICULTURAL COMMODITY PRICE VOLATILITY: AN OVERVIEW
OECD FOOD, AGRICULTURE AND FISHING WORKING PAPER N°52 © OECD 2011
Gilbert C.L. (2010), How to understand high food prices. Journal of Agricultural Economics.
61(2). p. 398-425.
Gilbert C.L. and Morgan C.W. (2010), Has food price volatility risen? revised version 8 April
2010. Workshop on Methods to Analyse price volatility. Seville. Spain. January 2010.
Gohin A. and Chantret F. (2010), The long run impact of energy prices on world food markets:
The role of macro-economic linkages. Energy Policy, 38(1), p. 333-339.
Irwin Scott H. and Sanders Dwight R. (2010), The Impact of Index and Swap Funds on
Commodity Futures Markets, OECD Food, Agriculture and Fisheries Working Papers, N° 27.
Jacks D.S., O’Rourke and Williamson J.G. (2009), Commodity price volatility and world market
integration since 1700. NBER Working paper series 14748.
Knight Frank H. (1921), Risk, Uncertainty and profit, Boston, MA: Hart, Schaffner & Marx;
Houghton Mifflin Co. , http://www.econlib.org/library/Knight/knRUP.html.
Labys W.C. (2006), Modeling and forecasting primary commodity prices. Ashgate. 239 pages.
Matthews A. (2010), Perspectives on addressing market instability and income risk for farmers.
Joint AES and SFER conference on The Common Agricultural policy post 2013. Edinburgh.
March 2010.
OECD (2009), Managing risk in Agriculture: a holistic approach. 168 pages.
OECD (2010a), Thematic Review on Risk Management: New Zealand.
TAD/CA/APM/WP(2010)16. 27th
April 2010.
OECD (2010b). Policy responses in emerging economies to international agricultural commodity
price Surges. TAD/CA/APM/WP(2010)13/FINAL
OECD (2010c), Price volatility and price transmission. Outlook. Chapter 2. TAD/CA/APM/WP
(2010)1.
Ramey G. and Ramey V.A. (1995). Cross-country evidence on the link between volatility and
growth. American Economic Review. 85 (5). p. 1138-1151.
Rodrick D. (1999), Where did all the growth go? External shocks. social conflict and growth
collapse. Journal of economic growth. 4 (4). 385-412.
Serra T. and Zilberman D. (2009), Price volatility in ethanol markets. Paper presented at the
Agricultural and applied economics associations, Milwaukee, USA, 2009
Sumner D.A. (2009), Recent commodity price movements in historical perspective. American
Journal of Agricultural Economics. 91 (5). p. 1250-1256.
AGRICULTURAL COMMODITY PRICE VOLATILITY: AN OVERVIEW – 31
Annex 1.
Data
The analysis of price volatility is based on ten products. Some agricultural products
on the one hand like beef, butter, maize, rice, soybean oil, sugar, wheat, and whole milk
powder and some input products on the other hand like crude oil price and fertiliser
prices.
Data are collected from three different databases to make useful comparisons: sources
used in Aglink, International Financial Statistics from the International Monetary Fund,
and UNCTAD database.
Nominal international price data1 are available since 1957 in IMF database and since
1960 in UNCTAD both in monthly and annual data. Some exceptions are listed below:
fertiliser, butter and whole milk powder price data come from USDA and are available
only since January 1995 with monthly data. Maize price data collected from UNCTAD
are available since July 1986.
In the AGLINK project, only annual data are available. The range of the period
depends on the products: data are available since 1970 for crude oil, rice, sugar; 1971 for
butter, maize and wheat; 1979 for whole milk powder; 1983 for Soybean oil and beef.
Bilateral Euro-dollar exchange rates are available since 1970 both in monthly and
annual data. They are collected from Eurostat.
Whatever the sources, the sample ends in 2009 with annual data and in February 2010
with monthly data, with the exception of fertiliser price with monthly data which ends in
2009:8.
1. Nominal and real prices are examined in the literature. However, in the case of real prices, it
means that we have to deflate series and this introduces another uncertainty in the measure of
volatility. Indeed there is no consensus on the better deflator to use and the choice is always
constrained by the availability of data.
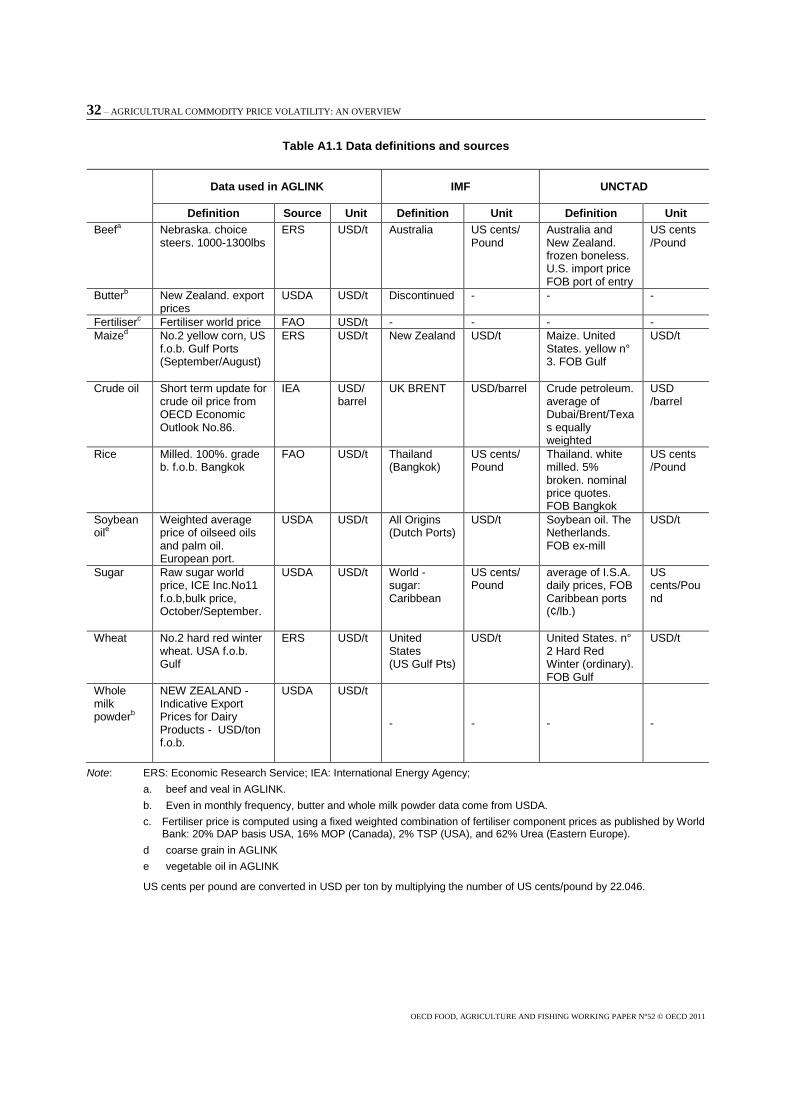
32 – AGRICULTURAL COMMODITY PRICE VOLATILITY: AN OVERVIEW
OECD FOOD, AGRICULTURE AND FISHING WORKING PAPER N°52 © OECD 2011
Table A1.1 Data definitions and sources
Data used in AGLINK IMF UNCTAD
Definition Source Unit Definition Unit Definition Unit
Beefa Nebraska. choice steers. 1000-1300lbs
ERS USD/t Australia
US cents/ Pound
Australia and New Zealand. frozen boneless. U.S. import price FOB port of entry
US cents /Pound
Butterb New Zealand. export prices
USDA USD/t Discontinued - - -
Fertiliserc Fertiliser world price FAO USD/t - - - -
Maized No.2 yellow corn, US f.o.b. Gulf Ports (September/August)
ERS USD/t New Zealand USD/t Maize. United States. yellow n° 3. FOB Gulf
USD/t
Crude oil Short term update for crude oil price from OECD Economic Outlook No.86.
IEA USD/ barrel
UK BRENT
USD/barrel Crude petroleum. average of Dubai/Brent/Texas equally weighted
USD /barrel
Rice Milled. 100%. grade b. f.o.b. Bangkok
FAO USD/t Thailand (Bangkok)
US cents/ Pound
Thailand. white milled. 5% broken. nominal price quotes. FOB Bangkok
US cents /Pound
Soybean oile
Weighted average price of oilseed oils and palm oil. European port.
USDA USD/t All Origins (Dutch Ports)
USD/t Soybean oil. The Netherlands. FOB ex-mill
USD/t
Sugar Raw sugar world price, ICE Inc.No11 f.o.b,bulk price, October/September.
USDA USD/t World - sugar: Caribbean
US cents/ Pound
average of I.S.A. daily prices, FOB Caribbean ports (¢/lb.)
US cents/Pound
Wheat No.2 hard red winter wheat. USA f.o.b. Gulf
ERS USD/t United States (US Gulf Pts)
USD/t United States. n° 2 Hard Red Winter (ordinary). FOB Gulf
USD/t
Whole milk powderb
NEW ZEALAND - Indicative Export Prices for Dairy Products - USD/ton f.o.b.
USDA USD/t
- - - -
Note: ERS: Economic Research Service; IEA: International Energy Agency;
a. beef and veal in AGLINK.
b. Even in monthly frequency, butter and whole milk powder data come from USDA.
c. Fertiliser price is computed using a fixed weighted combination of fertiliser component prices as published by World Bank: 20% DAP basis USA, 16% MOP (Canada), 2% TSP (USA), and 62% Urea (Eastern Europe).
d coarse grain in AGLINK
e vegetable oil in AGLINK
US cents per pound are converted in USD per ton by multiplying the number of US cents/pound by 22.046.
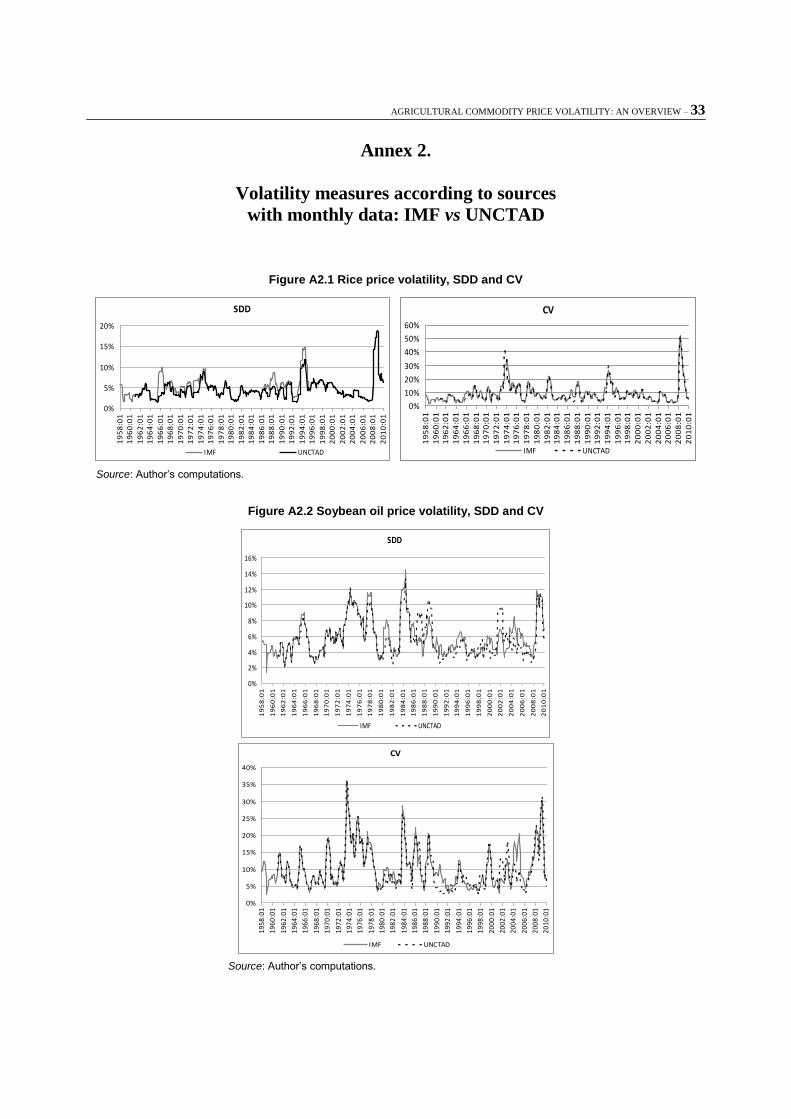
AGRICULTURAL COMMODITY PRICE VOLATILITY: AN OVERVIEW – 33
Annex 2.
Volatility measures according to sources
with monthly data: IMF vs UNCTAD
Figure A2.1 Rice price volatility, SDD and CV
SDD
0%
5%
10%
15%
20%
19
58
:01
19
60
:01
19
62
:01
19
64
:01
19
66
:01
19
68
:01
19
70
:01
19
72
:01
19
74
:01
19
76
:01
19
78
:01
19
80
:01
19
82
:01
19
84
:01
19
86
:01
19
88
:01
19
90
:01
19
92
:01
19
94
:01
19
96
:01
19
98
:01
20
00
:01
20
02
:01
20
04
:01
20
06
:01
20
08
:01
20
10
:01
IMF UNCTAD
CV
0%
10%
20%
30%
40%
50%
60%
19
58
:01
19
60
:01
19
62
:01
19
64
:01
19
66
:01
19
68
:01
19
70
:01
19
72
:01
19
74
:01
19
76
:01
19
78
:01
19
80
:01
19
82
:01
19
84
:01
19
86
:01
19
88
:01
19
90
:01
19
92
:01
19
94
:01
19
96
:01
19
98
:01
20
00
:01
20
02
:01
20
04
:01
20
06
:01
20
08
:01
20
10
:01
IMF UNCTAD
Source: Author’s computations.
Figure A2.2 Soybean oil price volatility, SDD and CV
SDD
0%
2%
4%
6%
8%
10%
12%
14%
16%
19
58
:01
19
60
:01
19
62
:01
19
64
:01
19
66
:01
19
68
:01
19
70
:01
19
72
:01
19
74
:01
19
76
:01
19
78
:01
19
80
:01
19
82
:01
19
84
:01
19
86
:01
19
88
:01
19
90
:01
19
92
:01
19
94
:01
19
96
:01
19
98
:01
20
00
:01
20
02
:01
20
04
:01
20
06
:01
20
08
:01
20
10
:01
IMF UNCTAD
CV
0%
5%
10%
15%
20%
25%
30%
35%
40%
19
58
:01
19
60
:01
19
62
:01
19
64
:01
19
66
:01
19
68
:01
19
70
:01
19
72
:01
19
74
:01
19
76
:01
19
78
:01
19
80
:01
19
82
:01
19
84
:01
19
86
:01
19
88
:01
19
90
:01
19
92
:01
19
94
:01
19
96
:01
19
98
:01
20
00
:01
20
02
:01
20
04
:01
20
06
:01
20
08
:01
20
10
:01
IMF UNCTAD
Source: Author’s computations.
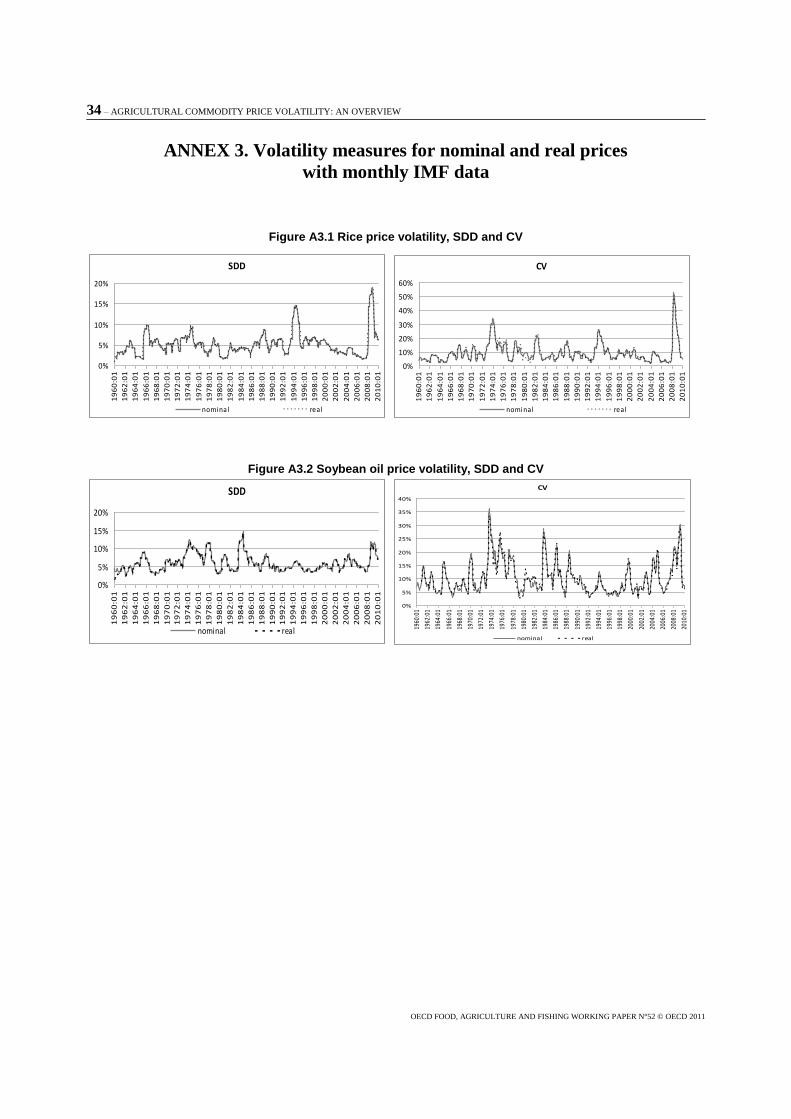
34 – AGRICULTURAL COMMODITY PRICE VOLATILITY: AN OVERVIEW
OECD FOOD, AGRICULTURE AND FISHING WORKING PAPER N°52 © OECD 2011
ANNEX 3. Volatility measures for nominal and real prices
with monthly IMF data
Figure A3.1 Rice price volatility, SDD and CV
SDD
0%
5%
10%
15%
20%
19
60
:01
19
62
:01
19
64
:01
19
66
:01
19
68
:01
19
70
:01
19
72
:01
19
74
:01
19
76
:01
19
78
:01
19
80
:01
19
82
:01
19
84
:01
19
86
:01
19
88
:01
19
90
:01
19
92
:01
19
94
:01
19
96
:01
19
98
:01
20
00
:01
20
02
:01
20
04
:01
20
06
:01
20
08
:01
20
10
:01
nominal real
CV
0%
10%
20%
30%
40%
50%
60%
19
60
:01
19
62
:01
19
64
:01
19
66
:01
19
68
:01
19
70
:01
19
72
:01
19
74
:01
19
76
:01
19
78
:01
19
80
:01
19
82
:01
19
84
:01
19
86
:01
19
88
:01
19
90
:01
19
92
:01
19
94
:01
19
96
:01
19
98
:01
20
00
:01
20
02
:01
20
04
:01
20
06
:01
20
08
:01
20
10
:01
nominal real
Figure A3.2 Soybean oil price volatility, SDD and CV
SDD
0%
5%
10%
15%
20%
19
60
:01
19
62
:01
19
64
:01
19
66
:01
19
68
:01
19
70
:01
19
72
:01
19
74
:01
19
76
:01
19
78
:01
19
80
:01
19
82
:01
19
84
:01
19
86
:01
19
88
:01
19
90
:01
19
92
:01
19
94
:01
19
96
:01
19
98
:01
20
00
:01
20
02
:01
20
04
:01
20
06
:01
20
08
:01
20
10
:01
nominal real
CV
0%
5%
10%
15%
20%
25%
30%
35%
40%
1960
:01
1962
:01
1964
:01
1966
:01
1968
:01
1970
:01
1972
:01
1974
:01
1976
:01
1978
:01
1980
:01
1982
:01
1984
:01
1986
:01
1988
:01
1990
:01
1992
:01
1994
:01
1996
:01
1998
:01
2000
:01
2002
:01
2004
:01
2006
:01
2008
:01
2010
:01
nominal real

AGRICULTURAL COMMODITY PRICE VOLATILITY: AN OVERVIEW – 35
Annex 4. Volatility measurements with monthly IMF or USDA data
beef
0%
2%
4%
6%
8%
10%
12%
14%
16%
18%
20%
19
58
:01
19
60
:01
19
62
:01
19
64
:01
19
66
:01
19
68
:01
19
70
:01
19
72
:01
19
74
:01
19
76
:01
19
78
:01
19
80
:01
19
82
:01
19
84
:01
19
86
:01
19
88
:01
19
90
:01
19
92
:01
19
94
:01
19
96
:01
19
98
:01
20
00
:01
20
02
:01
20
04
:01
20
06
:01
20
08
:01
20
10
:01
SDD CV CCV
butter
0%
5%
10%
15%
20%
25%
30%
35%
40%
19
96
:01
19
96
:07
19
97
:01
19
97
:07
19
98
:01
19
98
:07
19
99
:01
19
99
:07
20
00
:01
20
00
:07
20
01
:01
20
01
:07
20
02
:01
20
02
:07
20
03
:01
20
03
:07
20
04
:01
20
04
:07
20
05
:01
20
05
:07
20
06
:01
20
06
:07
20
07
:01
20
07
:07
20
08
:01
20
08
:07
20
09
:01
20
09
:07
20
10
:01
SDD CV CCV
maize
0%
5%
10%
15%
20%
25%
19
58
:01
19
60
:01
19
62
:01
19
64
:01
19
66
:01
19
68
:01
19
70
:01
19
72
:01
19
74
:01
19
76
:01
19
78
:01
19
80
:01
19
82
:01
19
84
:01
19
86
:01
19
88
:01
19
90
:01
19
92
:01
19
94
:01
19
96
:01
19
98
:01
20
00
:01
20
02
:01
20
04
:01
20
06
:01
20
08
:01
20
10
:01
SDD CV CCV
rice
0%
10%
20%
30%
40%
50%
60%1
95
8:0
1
19
60
:01
19
62
:01
19
64
:01
19
66
:01
19
68
:01
19
70
:01
19
72
:01
19
74
:01
19
76
:01
19
78
:01
19
80
:01
19
82
:01
19
84
:01
19
86
:01
19
88
:01
19
90
:01
19
92
:01
19
94
:01
19
96
:01
19
98
:01
20
00
:01
20
02
:01
20
04
:01
20
06
:01
20
08
:01
20
10
:01
SDD CV CCV
soybean oil
0%
5%
10%
15%
20%
25%
30%
35%
40%
19
58
:01
19
60
:01
19
62
:01
19
64
:01
19
66
:01
19
68
:01
19
70
:01
19
72
:01
19
74
:01
19
76
:01
19
78
:01
19
80
:01
19
82
:01
19
84
:01
19
86
:01
19
88
:01
19
90
:01
19
92
:01
19
94
:01
19
96
:01
19
98
:01
20
00
:01
20
02
:01
20
04
:01
20
06
:01
20
08
:01
20
10
:01
SDD CV CCV
sugar
0%
10%
20%
30%
40%
50%
60%
19
58
:01
19
60
:01
19
62
:01
19
64
:01
19
66
:01
19
68
:01
19
70
:01
19
72
:01
19
74
:01
19
76
:01
19
78
:01
19
80
:01
19
82
:01
19
84
:01
19
86
:01
19
88
:01
19
90
:01
19
92
:01
19
94
:01
19
96
:01
19
98
:01
20
00
:01
20
02
:01
20
04
:01
20
06
:01
20
08
:01
20
10
:01
SDD CV CCV
wheat
0%
5%
10%
15%
20%
25%
30%
35%
19
58
:01
19
60
:01
19
62
:01
19
64
:01
19
66
:01
19
68
:01
19
70
:01
19
72
:01
19
74
:01
19
76
:01
19
78
:01
19
80
:01
19
82
:01
19
84
:01
19
86
:01
19
88
:01
19
90
:01
19
92
:01
19
94
:01
19
96
:01
19
98
:01
20
00
:01
20
02
:01
20
04
:01
20
06
:01
20
08
:01
20
10
:01
SDD CV CCV
whole milk powder
0%
5%
10%
15%
20%
25%
30%
35%
40%
19
96
:01
19
96
:07
19
97
:01
19
97
:07
19
98
:01
19
98
:07
19
99
:01
19
99
:07
20
00
:01
20
00
:07
20
01
:01
20
01
:07
20
02
:01
20
02
:07
20
03
:01
20
03
:07
20
04
:01
20
04
:07
20
05
:01
20
05
:07
20
06
:01
20
06
:07
20
07
:01
20
07
:07
20
08
:01
20
08
:07
20
09
:01
20
09
:07
20
10
:01
SDD CV CCV
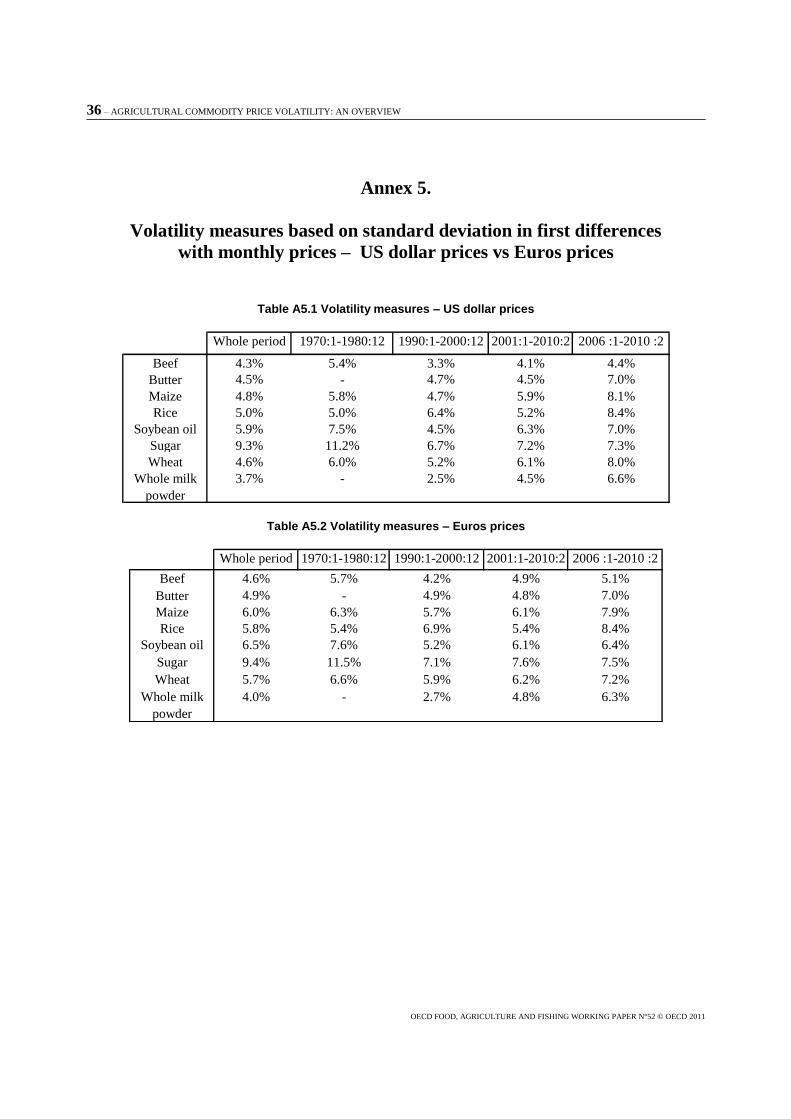
36 – AGRICULTURAL COMMODITY PRICE VOLATILITY: AN OVERVIEW
OECD FOOD, AGRICULTURE AND FISHING WORKING PAPER N°52 © OECD 2011
Annex 5.
Volatility measures based on standard deviation in first differences
with monthly prices – US dollar prices vs Euros prices
Table A5.1 Volatility measures – US dollar prices
Whole period 1970:1-1980:12 1990:1-2000:12 2001:1-2010:2 2006 :1-2010 :2
Beef 4.3% 5.4% 3.3% 4.1% 4.4%
Butter 4.5% - 4.7% 4.5% 7.0%
Maize 4.8% 5.8% 4.7% 5.9% 8.1%
Rice 5.0% 5.0% 6.4% 5.2% 8.4%
Soybean oil 5.9% 7.5% 4.5% 6.3% 7.0%
Sugar 9.3% 11.2% 6.7% 7.2% 7.3%
Wheat 4.6% 6.0% 5.2% 6.1% 8.0%
Whole milk
powder
3.7% - 2.5% 4.5% 6.6%
Table A5.2 Volatility measures – Euros prices
Whole period 1970:1-1980:12 1990:1-2000:12 2001:1-2010:2 2006 :1-2010 :2
Beef 4.6% 5.7% 4.2% 4.9% 5.1%
Butter 4.9% - 4.9% 4.8% 7.0%
Maize 6.0% 6.3% 5.7% 6.1% 7.9%
Rice 5.8% 5.4% 6.9% 5.4% 8.4%
Soybean oil 6.5% 7.6% 5.2% 6.1% 6.4%
Sugar 9.4% 11.5% 7.1% 7.6% 7.5%
Wheat 5.7% 6.6% 5.9% 6.2% 7.2%
Whole milk
powder
4.0% - 2.7% 4.8% 6.3%
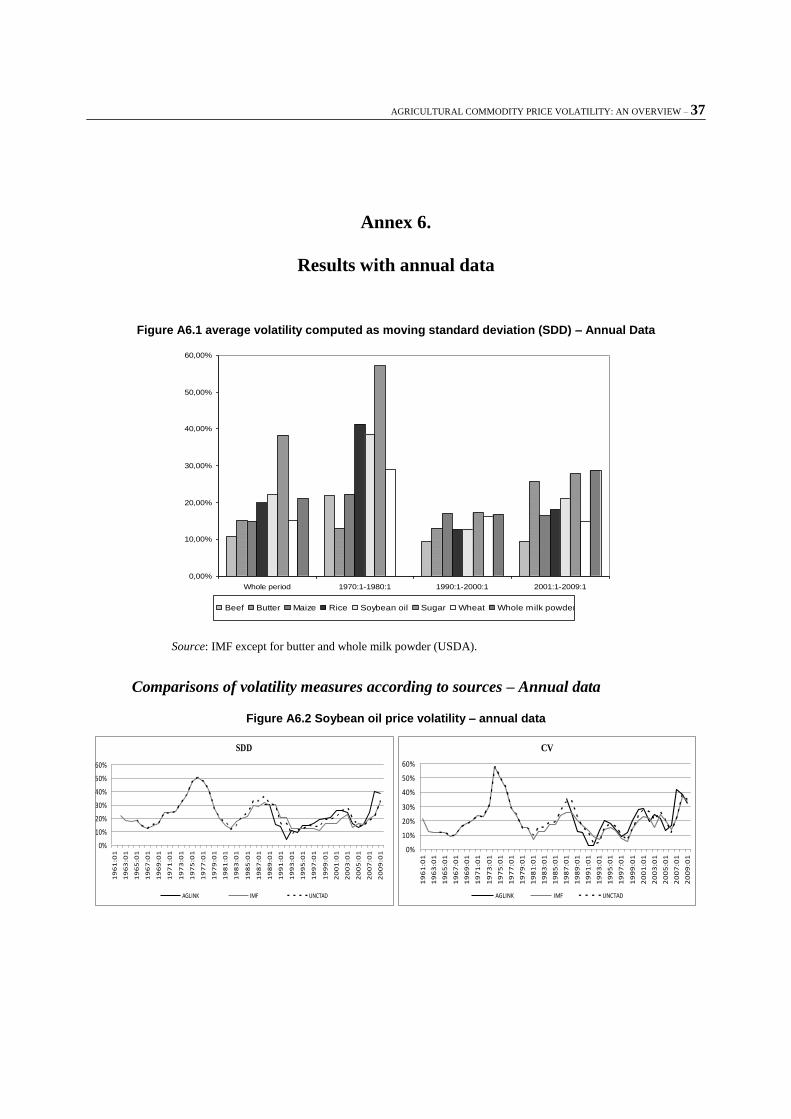
AGRICULTURAL COMMODITY PRICE VOLATILITY: AN OVERVIEW – 37
Annex 6.
Results with annual data
Figure A6.1 average volatility computed as moving standard deviation (SDD) – Annual Data
0,00%
10,00%
20,00%
30,00%
40,00%
50,00%
60,00%
Whole period 1970:1-1980:1 1990:1-2000:1 2001:1-2009:1
Beef Butter Maize Rice Soybean oil Sugar Wheat Whole milk powder
Source: IMF except for butter and whole milk powder (USDA).
Comparisons of volatility measures according to sources – Annual data
Figure A6.2 Soybean oil price volatility – annual data
SDD
0%
10%
20%
30%
40%
50%
60%
19
61
:01
19
63
:01
19
65
:01
19
67
:01
19
69
:01
19
71
:01
19
73
:01
19
75
:01
19
77
:01
19
79
:01
19
81
:01
19
83
:01
19
85
:01
19
87
:01
19
89
:01
19
91
:01
19
93
:01
19
95
:01
19
97
:01
19
99
:01
20
01
:01
20
03
:01
20
05
:01
20
07
:01
20
09
:01
AGLINK IMF UNCTAD
CV
0%
10%
20%
30%
40%
50%
60%
19
61
:01
19
63
:01
19
65
:01
19
67
:01
19
69
:01
19
71
:01
19
73
:01
19
75
:01
19
77
:01
19
79
:01
19
81
:01
19
83
:01
19
85
:01
19
87
:01
19
89
:01
19
91
:01
19
93
:01
19
95
:01
19
97
:01
19
99
:01
20
01
:01
20
03
:01
20
05
:01
20
07
:01
20
09
:01
AGLINK IMF UNCTAD
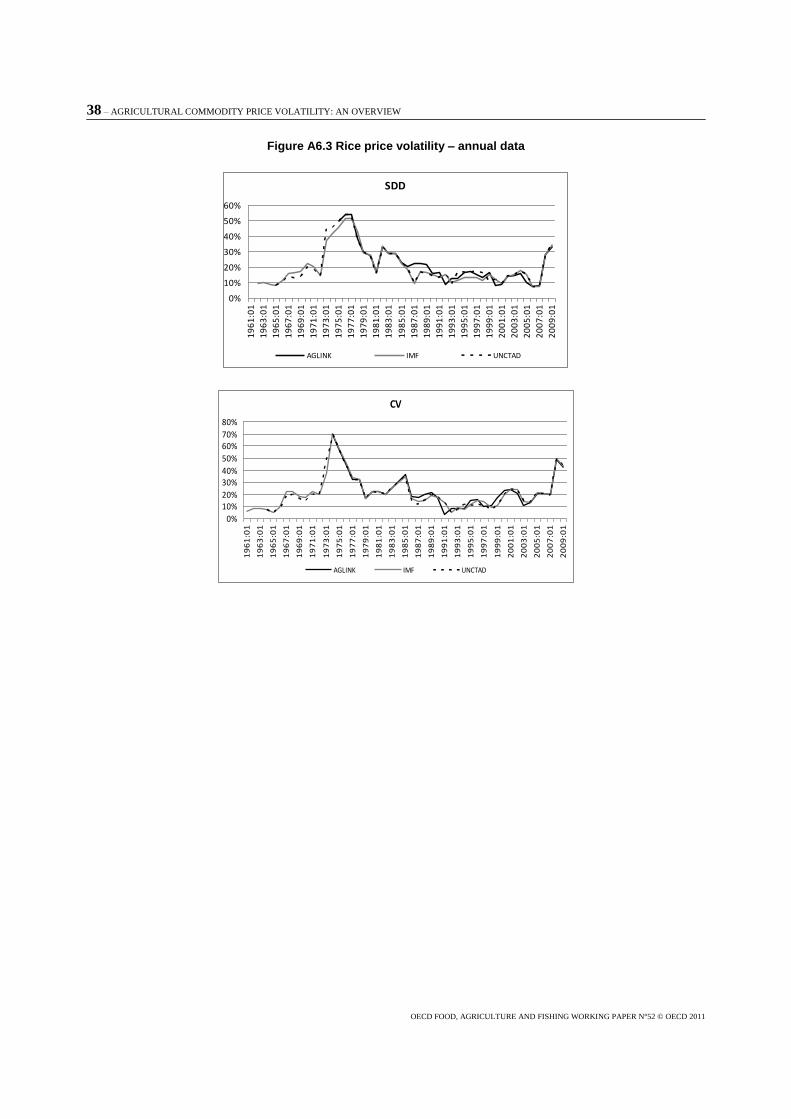
38 – AGRICULTURAL COMMODITY PRICE VOLATILITY: AN OVERVIEW
OECD FOOD, AGRICULTURE AND FISHING WORKING PAPER N°52 © OECD 2011
Figure A6.3 Rice price volatility – annual data
SDD
0%
10%
20%
30%
40%
50%
60%
19
61
:01
19
63
:01
19
65
:01
19
67
:01
19
69
:01
19
71
:01
19
73
:01
19
75
:01
19
77
:01
19
79
:01
19
81
:01
19
83
:01
19
85
:01
19
87
:01
19
89
:01
19
91
:01
19
93
:01
19
95
:01
19
97
:01
19
99
:01
20
01
:01
20
03
:01
20
05
:01
20
07
:01
20
09
:01
AGLINK IMF UNCTAD
CV
0%
10%20%
30%40%
50%
60%70%
80%
19
61
:01
19
63
:01
19
65
:01
19
67
:01
19
69
:01
19
71
:01
19
73
:01
19
75
:01
19
77
:01
19
79
:01
19
81
:01
19
83
:01
19
85
:01
19
87
:01
19
89
:01
19
91
:01
19
93
:01
19
95
:01
19
97
:01
19
99
:01
20
01
:01
20
03
:01
20
05
:01
20
07
:01
20
09
:01
AGLINK IMF UNCTAD
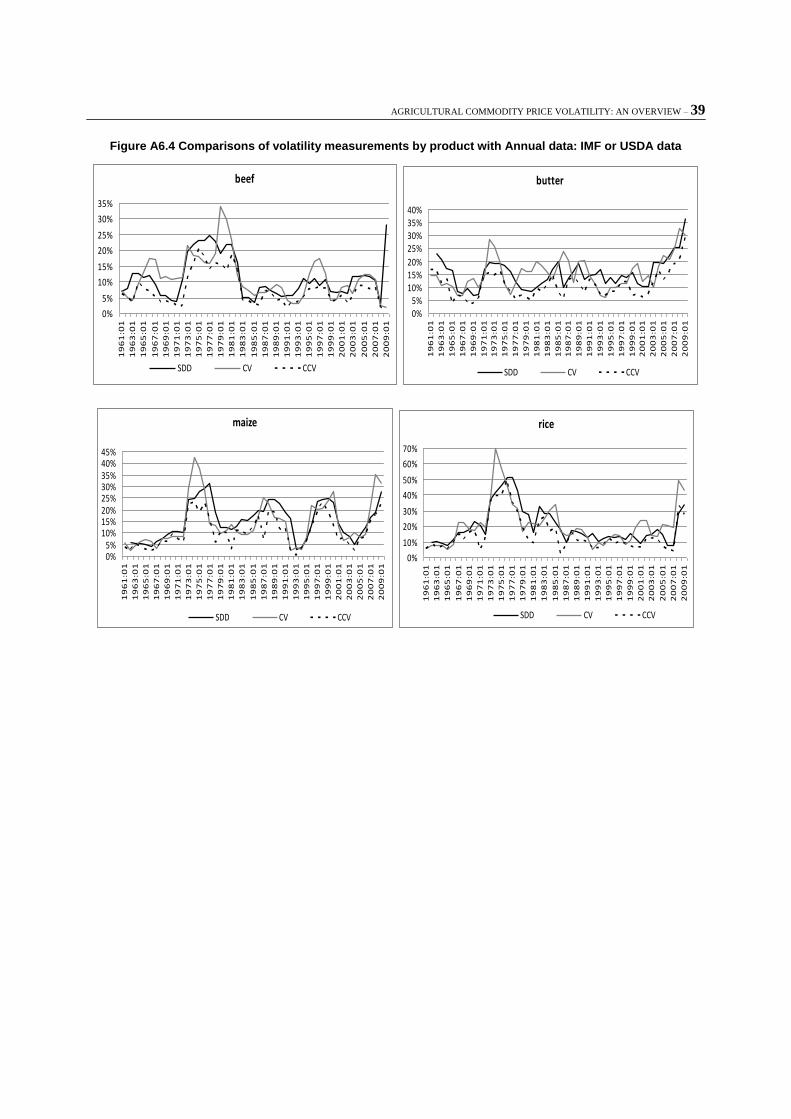
AGRICULTURAL COMMODITY PRICE VOLATILITY: AN OVERVIEW – 39
Figure A6.4 Comparisons of volatility measurements by product with Annual data: IMF or USDA data
beef
0%
5%
10%
15%
20%
25%
30%
35%
19
61
:01
19
63
:01
19
65
:01
19
67
:01
19
69
:01
19
71
:01
19
73
:01
19
75
:01
19
77
:01
19
79
:01
19
81
:01
19
83
:01
19
85
:01
19
87
:01
19
89
:01
19
91
:01
19
93
:01
19
95
:01
19
97
:01
19
99
:01
20
01
:01
20
03
:01
20
05
:01
20
07
:01
20
09
:01
SDD CV CCV
butter
0%5%
10%15%20%
25%30%35%40%
19
61
:01
19
63
:01
19
65
:01
19
67
:01
19
69
:01
19
71
:01
19
73
:01
19
75
:01
19
77
:01
19
79
:01
19
81
:01
19
83
:01
19
85
:01
19
87
:01
19
89
:01
19
91
:01
19
93
:01
19
95
:01
19
97
:01
19
99
:01
20
01
:01
20
03
:01
20
05
:01
20
07
:01
20
09
:01
SDD CV CCV
maize
0%5%
10%15%20%25%30%35%40%45%
19
61
:01
19
63
:01
19
65
:01
19
67
:01
19
69
:01
19
71
:01
19
73
:01
19
75
:01
19
77
:01
19
79
:01
19
81
:01
19
83
:01
19
85
:01
19
87
:01
19
89
:01
19
91
:01
19
93
:01
19
95
:01
19
97
:01
19
99
:01
20
01
:01
20
03
:01
20
05
:01
20
07
:01
20
09
:01
SDD CV CCV
rice
0%
10%
20%
30%
40%
50%
60%
70%
19
61
:01
19
63
:01
19
65
:01
19
67
:01
19
69
:01
19
71
:01
19
73
:01
19
75
:01
19
77
:01
19
79
:01
19
81
:01
19
83
:01
19
85
:01
19
87
:01
19
89
:01
19
91
:01
19
93
:01
19
95
:01
19
97
:01
19
99
:01
20
01
:01
20
03
:01
20
05
:01
20
07
:01
20
09
:01
SDD CV CCV
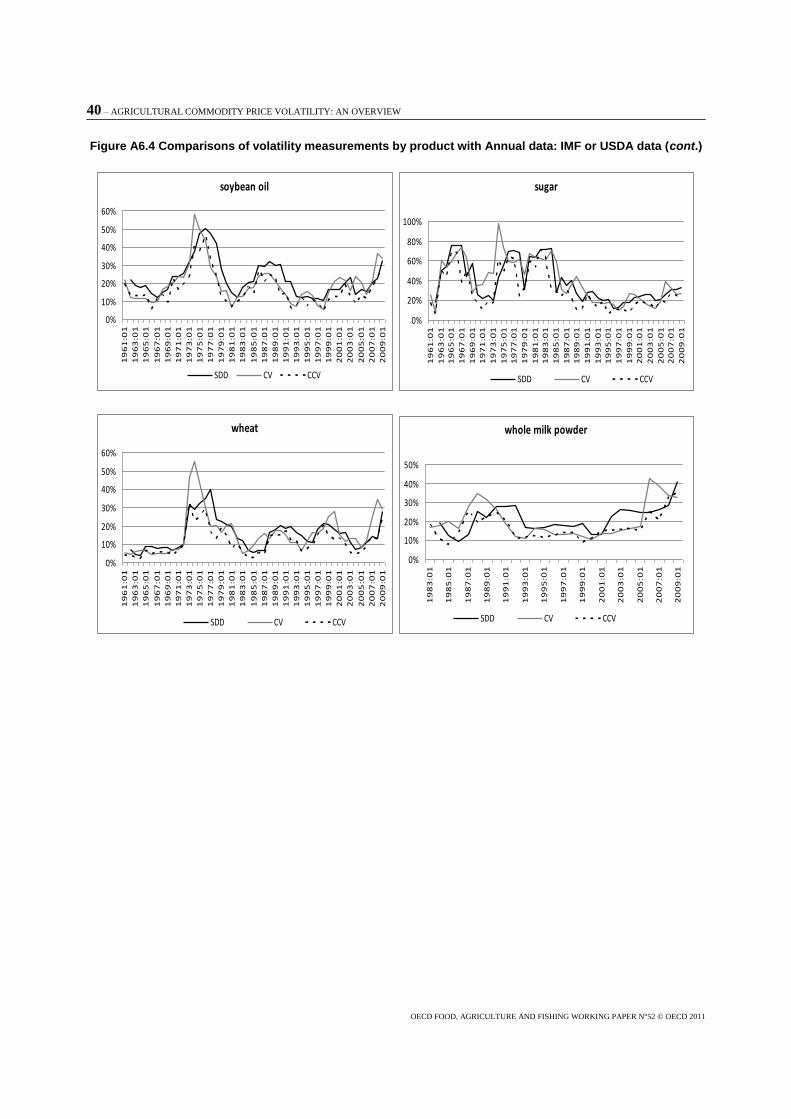
40 – AGRICULTURAL COMMODITY PRICE VOLATILITY: AN OVERVIEW
OECD FOOD, AGRICULTURE AND FISHING WORKING PAPER N°52 © OECD 2011
Figure A6.4 Comparisons of volatility measurements by product with Annual data: IMF or USDA data (cont.)
soybean oil
0%
10%
20%
30%
40%
50%
60%
19
61
:01
19
63
:01
19
65
:01
19
67
:01
19
69
:01
19
71
:01
19
73
:01
19
75
:01
19
77
:01
19
79
:01
19
81
:01
19
83
:01
19
85
:01
19
87
:01
19
89
:01
19
91
:01
19
93
:01
19
95
:01
19
97
:01
19
99
:01
20
01
:01
20
03
:01
20
05
:01
20
07
:01
20
09
:01
SDD CV CCV
sugar
0%
20%
40%
60%
80%
100%
19
61
:01
19
63
:01
19
65
:01
19
67
:01
19
69
:01
19
71
:01
19
73
:01
19
75
:01
19
77
:01
19
79
:01
19
81
:01
19
83
:01
19
85
:01
19
87
:01
19
89
:01
19
91
:01
19
93
:01
19
95
:01
19
97
:01
19
99
:01
20
01
:01
20
03
:01
20
05
:01
20
07
:01
20
09
:01
SDD CV CCV
wheat
0%
10%
20%
30%
40%
50%
60%
19
61
:01
19
63
:01
19
65
:01
19
67
:01
19
69
:01
19
71
:01
19
73
:01
19
75
:01
19
77
:01
19
79
:01
19
81
:01
19
83
:01
19
85
:01
19
87
:01
19
89
:01
19
91
:01
19
93
:01
19
95
:01
19
97
:01
19
99
:01
20
01
:01
20
03
:01
20
05
:01
20
07
:01
20
09
:01
SDD CV CCV
whole milk powder
0%
10%
20%
30%
40%
50%
19
83
:01
19
85
:01
19
87
:01
19
89
:01
19
91
:01
19
93
:01
19
95
:01
19
97
:01
19
99
:01
20
01
:01
20
03
:01
20
05
:01
20
07
:01
20
09
:01
SDD CV CCV

AGRICULTURAL COMMODITY PRICE VOLATILITY: AN OVERVIEW – 41
Table A6.1 Tests of equality of means in volatility between the last decade (2001-2009) and other periods
Moving standard deviation (MSD)
Whole period 1970-1980 1990-2000
Beef -0.58
(0.56)
-6.45***
(0.00)
0.18
(0.85)
Butter 3.42***
(0.00)
3.67***
(0.00)
4.20***
(0.00)
Maize 0,51
(0,60)
-1,27
(0,23)
-0,07
(0,95)
Rice -0.28
(0.77)
-3.47***
(0.00)
0.99
(0.34)
Soybean oil -0.31
(0.76)
-3.31***
(0.00)
2.60**
(0.02)
3.89***
(0.00) Sugar -2.80***
(0.00)
-4.74***
(0.00)
Wheat -0.07
(0.94)
-3.22***
(0.00)
-0.35
(0.73)
Whole milk powder 2.31**
(0.02)
- 3.85***
(0.00)
Coefficient of variation
Whole period 1970-1980 1990-2000
Beef -1.29
(0.20)
-3.71***
(0.00)
-0.72
(0.49)
Butter 4.20***
(0.00)
4.12***
(0.00)
4.84***
(0.00)
Maize 1.17
(0.24)
-0.17
(0.86)
0.49
(0.62)
Rice 1.39
(0.17)
-0.91
(0.38)
2.79**
(0.02)
Soybean oil 1.19
(0.24)
-1.07
(0.30)
2.56**
(0.02)
2.53**
(0.02)
0.71
(0.49)
4.37***
(0.00)
Sugar -2.59**
(0.01)
-5.39***
(0.00)
Wheat 1.11
(0.27)
-1.02
(0.33)
Whole milk powder 2.64**
(0.01)
-
p-value in brackets (…).
*, **, *** stand respectively for 10,5 and 1% significance level.
Source: Author’s computations.
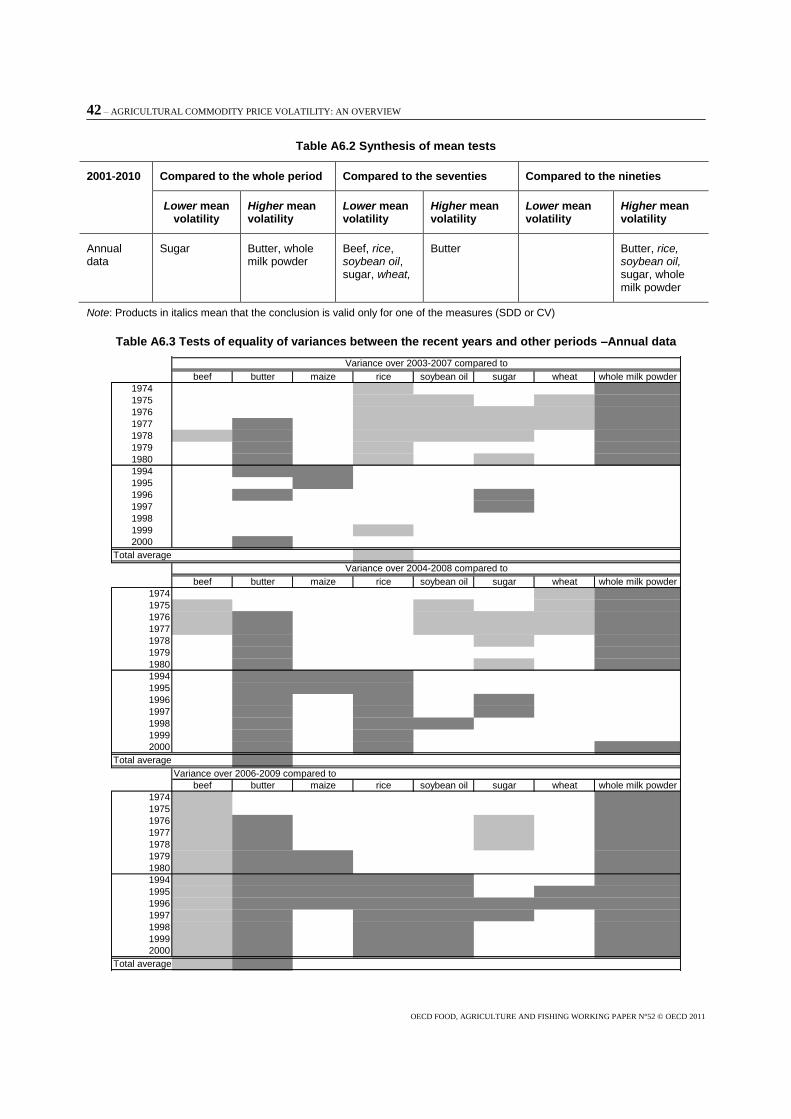
42 – AGRICULTURAL COMMODITY PRICE VOLATILITY: AN OVERVIEW
OECD FOOD, AGRICULTURE AND FISHING WORKING PAPER N°52 © OECD 2011
Table A6.2 Synthesis of mean tests
2001-2010 Compared to the whole period Compared to the seventies Compared to the nineties
Lower mean volatility
Higher mean volatility
Lower mean volatility
Higher mean volatility
Lower mean volatility
Higher mean volatility
Annual data
Sugar Butter, whole milk powder
Beef, rice, soybean oil, sugar, wheat,
Butter Butter, rice, soybean oil, sugar, whole milk powder
Note: Products in italics mean that the conclusion is valid only for one of the measures (SDD or CV)
Table A6.3 Tests of equality of variances between the recent years and other periods –Annual data
beef butter maize rice soybean oil sugar wheat whole milk powder
1974
1975
1976
1977
1978
1979
1980
1994
1995
1996
1997
1998
1999
2000
Total average
beef butter maize rice soybean oil sugar wheat whole milk powder
1974
1975
1976
1977
1978
1979
1980
1994
1995
1996
1997
1998
1999
2000
Total average
Variance over 2006-2009 compared to
beef butter maize rice soybean oil sugar wheat whole milk powder
1974
1975
1976
1977
1978
1979
1980
1994
1995
1996
1997
1998
1999
2000
Total average
Variance over 2003-2007 compared to
Variance over 2004-2008 compared to
AGRICULTURAL COMMODITY PRICE VOLATILITY: AN OVERVIEW – 43
Figure A6.5 Instantaneous correlations (with first difference annual data)
Figure A6.5a With crude oil price Figure A6.5b with fertiliser price
-1,0
-0,5
0,0
0,5
1,0
beef
butter
maize
rice
soybean oil
sugar
wheat
whole milk powder
1970s 1990s 2000s
-1,0
-0,5
0,0
0,5
1,0
beef
butter
maize
rice
soybean oil
sugar
wheat
whole milk powder
1970s 1990s 2000s
Figure A6.6 Lagged correlations (one year lag ahead for crude oil or fertiliser - with first difference annual data)
Figure A6.6a With crude oil price Figure A6.6b. with fertiliser price
-1,0
-0,5
0,0
0,5
1,0
beef
butter
maize
rice
soybean oil
sugar
wheat
whole milk powder
1970s 1990s 2000s
-1,0
-0,5
0,0
0,5
1,0
beef
butter
maize
rice
soybean oil
sugar
wheat
whole milk powder
1970s 1990s 2000s
44 – AGRICULTURAL COMMODITY PRICE VOLATILITY: AN OVERVIEW
OECD FOOD, AGRICULTURE AND FISHING WORKING PAPER N°52 © OECD 2011
Table A6.4 Correlation matrix between agricultural product prices
beef butter maize
whole
milk
powder
rice soybean oil sugar wheat beef butter maize
whole
milk
powder
rice soybean oil sugar wheat
beef 1.00 0.04 0.13 0.02 0.08 0.05 0.11 0.27 1.00 -0.21 0.27 (-) 0.13 -0.03 -0.21 0.49
butter 1.00 0.29 0.77 0.20 0.11 0.01 0.32 1.00 -0.69 (-) -0.26 -0.53 -0.04 -0.4
maize 1.00 0.39 0.60 0.69 0.12 0.83 1.00 (-) 0.73 0.74 0.58 0.90
whole milk powder 1.00 0.29 0.29 0.172 0.57 (-) (-) (-) (-) (-)
rice 1.00 0.54 0.39 0.65 1.00 0.71 0.67 0.78
soybean oil 1.00 -0.04 0.51 1.00 0.57 0.54
sugar 1.00 0.13 1.00 0.57
wheat 1.00 1.00
beef butter maize
whole
milk
powder
rice soybean oil sugar wheat beef butter maize
whole
milk
powder
rice soybean oil sugar wheat
beef 1.00 -0.88 -0.52 -0.72 -0.75 -0.28 -0.47 -0.63 1.00 0.23 -0.04 0.20 0.08 0.02 -0.05 0.08
butter 1.00 0.66 0.67 0.58 0.29 0.50 0.79 1.00 0.62 0.87 0.44 0.73 -0.47 0.57
maize 1.00 0.25 0.58 0.11 0.26 0.78 1.00 0.45 0.60 0.94 -0.45 0.94
whole milk powder 1.00 0.60 -0.01 0.30 0.67 1.00 0.02 0.48 -0.38 0.48
rice 1.00 0.34 0.28 0.53 1.00 0.62 -0.03 0.49
soybean oil 1.00 0.72 -0.02 1.00 -0.59 0.85
sugar 1.00 0.39 1.00 -0.5
wheat 1,00 1.00
whole period 1970s
1990s 2000s
Source: Author’s computations
AGRICULTURAL COMMODITY PRICE VOLATILITY: AN OVERVIEW – 45
OECD FOOD, AGRICULTURE AND FISHING WORKING PAPER N°52 © OECD 2011
Annex 7.
Results for Granger causality tests on monthly commodity prices
in US dollar and in Euros – Whole period
Table A7.1 Causality tests (F-tests)
Prices in US dollar Prices in Euro
Crude oil Exchange rate Fertilizer Crude oil Exchange rate Fertilizer
Beef ns ns ns 4.90**
(0.02) ns
2.82*
(0.09)
Buttera
5.09**
(0.02)
2.82*
(0.09) ns
3.85*
(0.05)
6.16**
(0.01) ns
Maize ns ns ns ns ns ns
Rice 3.17*
(0.07) ns
5.96**
(0.01) ns ns
4.89**
(0.02)
Soybean oil ns ns ns ns ns ns
Sugar 2.74*
(0.09) ns ns ns ns ns
Wheat ns 3.83*
(0.05) ns ns ns ns
Whole milk
powder ns ns ns ns ns ns
Crude oil - ns ns - ns ns
Fertilizer ns 8.20***
(0.00) - ns
9.77***
(0.00) -
ER 2.79*
(0.09) -
3.54*
(0.06)
2.78*
(0.09) -
3.54*
(0.06)
Note: p-value in brackets; *, **, *** significant at 10, 5 and 1% level
ns: not significant
Source; Author’s calculations.
46 – AGRICULTURAL COMMODITY PRICE VOLATILITY: AN OVERVIEW
OECD FOOD, AGRICULTURE AND FISHING WORKING PAPER N°52 © OECD 2011
Annex 8.
Results for crude oil price and fertiliser price
Figure A8.1 world commodity prices –annual data
0
500
1000
1500
2000
2500
3000
3500
4000
4500
1957
1960
1963
1966
1969
1972
1975
1978
1981
1984
1987
1990
1993
1996
1999
2002
2005
2008
$/ton
0
10
20
30
40
50
60
70
80
90
100
$/barrel
beef butter fertilizer w hole milk pow der soybean oil crude oil
Source: IMF, USDA, FAO.
Figure A8.2 World commodity prices – annual data
0
100
200
300
400
500
600
700
800
1957
1960
1963
1966
1969
1972
1975
1978
1981
1984
1987
1990
1993
1996
1999
2002
2005
2008
$/ton
0
10
20
30
40
50
60
70
80
90
100
$/barrel
fertilizer maize rice sugar wheat crude oil Source: IMF, FAO
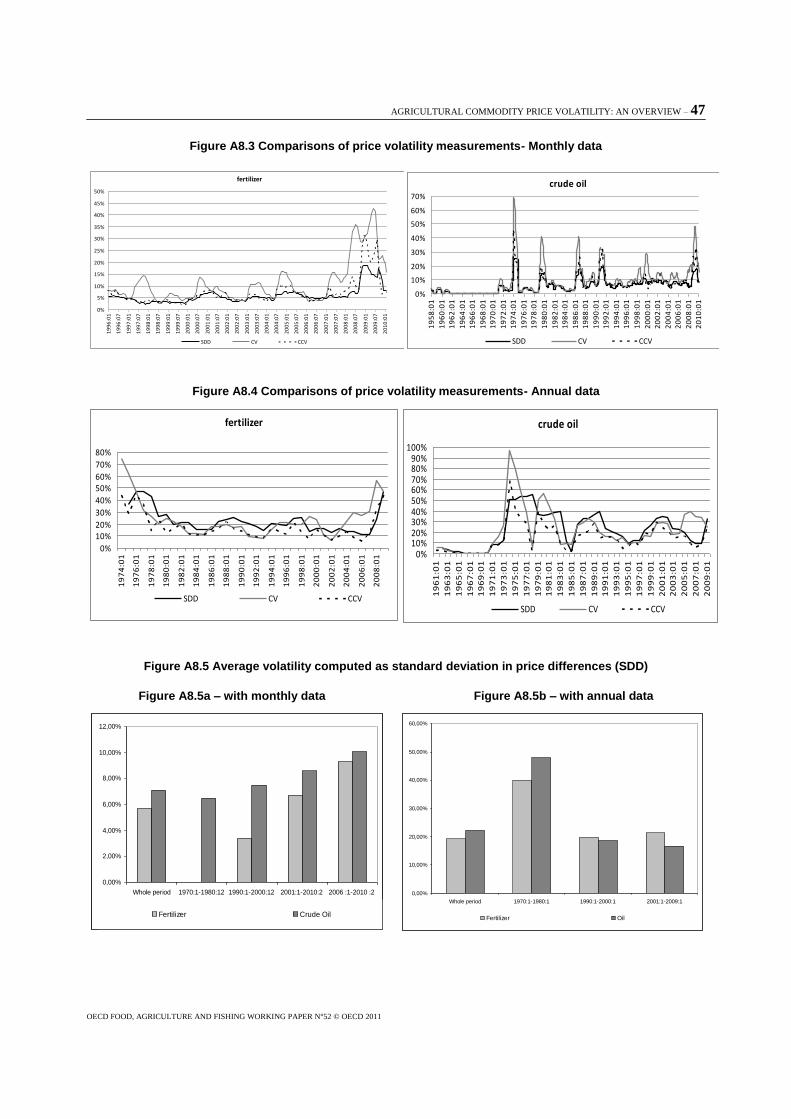
AGRICULTURAL COMMODITY PRICE VOLATILITY: AN OVERVIEW – 47
OECD FOOD, AGRICULTURE AND FISHING WORKING PAPER N°52 © OECD 2011
Figure A8.3 Comparisons of price volatility measurements- Monthly data
Figure A8.4 Comparisons of price volatility measurements- Annual data
Figure A8.5 Average volatility computed as standard deviation in price differences (SDD)
Figure A8.5a – with monthly data Figure A8.5b – with annual data
fertilizer
0%
5%
10%
15%
20%
25%
30%
35%
40%
45%
50%
19
96
:01
19
96
:07
19
97
:01
19
97
:07
19
98
:01
19
98
:07
19
99
:01
19
99
:07
20
00
:01
20
00
:07
20
01
:01
20
01
:07
20
02
:01
20
02
:07
20
03
:01
20
03
:07
20
04
:01
20
04
:07
20
05
:01
20
05
:07
20
06
:01
20
06
:07
20
07
:01
20
07
:07
20
08
:01
20
08
:07
20
09
:01
20
09
:07
20
10
:01
SDD CV CCV
crude oil
0%
10%
20%
30%
40%
50%
60%
70%
19
58
:01
19
60
:01
19
62
:01
19
64
:01
19
66
:01
19
68
:01
19
70
:01
19
72
:01
19
74
:01
19
76
:01
19
78
:01
19
80
:01
19
82
:01
19
84
:01
19
86
:01
19
88
:01
19
90
:01
19
92
:01
19
94
:01
19
96
:01
19
98
:01
20
00
:01
20
02
:01
20
04
:01
20
06
:01
20
08
:01
20
10
:01
SDD CV CCV
fertilizer
0%
10%20%
30%
40%
50%60%
70%
80%
19
74
:01
19
76
:01
19
78
:01
19
80
:01
19
82
:01
19
84
:01
19
86
:01
19
88
:01
19
90
:01
19
92
:01
19
94
:01
19
96
:01
19
98
:01
20
00
:01
20
02
:01
20
04
:01
20
06
:01
20
08
:01
SDD CV CCV
crude oil
0%10%20%30%40%50%60%70%80%90%
100%
19
61
:01
19
63
:01
19
65
:01
19
67
:01
19
69
:01
19
71
:01
19
73
:01
19
75
:01
19
77
:01
19
79
:01
19
81
:01
19
83
:01
19
85
:01
19
87
:01
19
89
:01
19
91
:01
19
93
:01
19
95
:01
19
97
:01
19
99
:01
20
01
:01
20
03
:01
20
05
:01
20
07
:01
20
09
:01
SDD CV CCV
0,00%
2,00%
4,00%
6,00%
8,00%
10,00%
12,00%
Whole period 1970:1-1980:12 1990:1-2000:12 2001:1-2010:2 2006 :1-2010 :2
Fertilizer Crude Oil
0,00%
10,00%
20,00%
30,00%
40,00%
50,00%
60,00%
Whole period 1970:1-1980:1 1990:1-2000:1 2001:1-2009:1
Fertilizer Oil
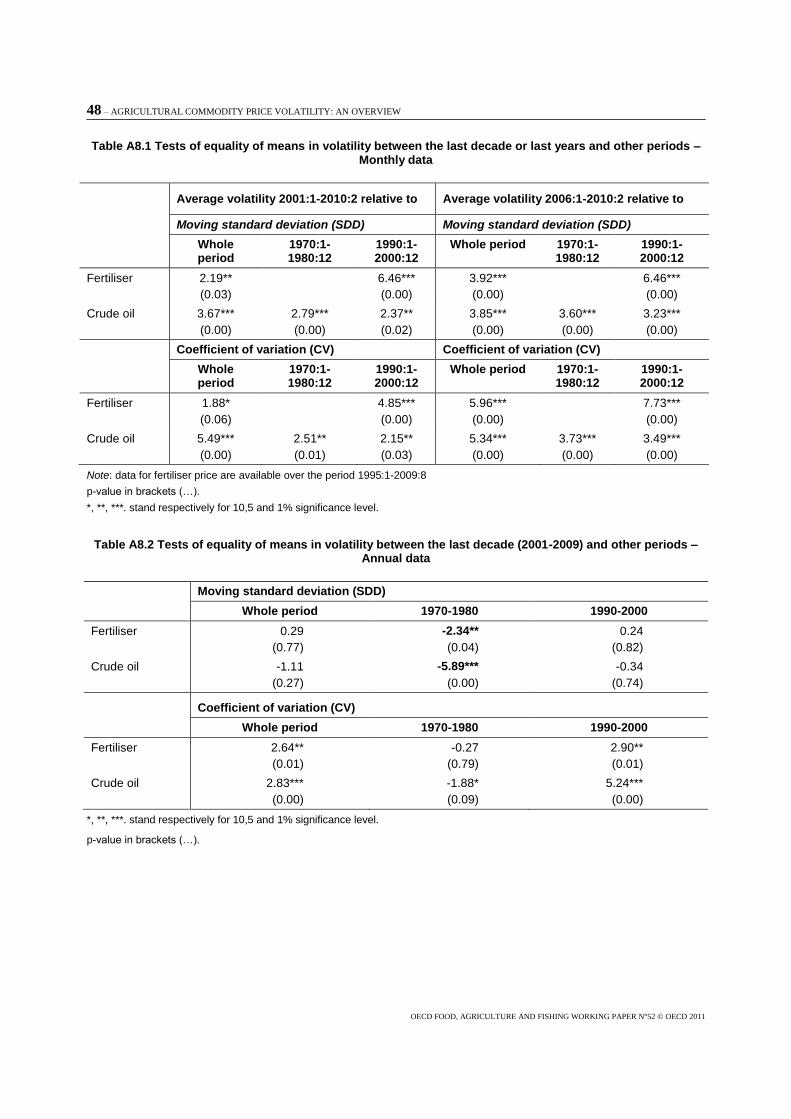
48 – AGRICULTURAL COMMODITY PRICE VOLATILITY: AN OVERVIEW
OECD FOOD, AGRICULTURE AND FISHING WORKING PAPER N°52 © OECD 2011
Table A8.1 Tests of equality of means in volatility between the last decade or last years and other periods – Monthly data
Average volatility 2001:1-2010:2 relative to Average volatility 2006:1-2010:2 relative to
Moving standard deviation (SDD) Moving standard deviation (SDD)
Whole period
1970:1-1980:12
1990:1-2000:12
Whole period 1970:1-
1980:12 1990:1- 2000:12
Fertiliser
2.19**
(0.03)
6.46***
(0.00)
3.92***
(0.00)
6.46***
(0.00)
Crude oil 3.67***
(0.00)
2.79***
(0.00)
2.37**
(0.02)
3.85***
(0.00)
3.60***
(0.00)
3.23***
(0.00)
Coefficient of variation (CV) Coefficient of variation (CV)
Whole period
1970:1-1980:12
1990:1-2000:12
Whole period 1970:1-1980:12
1990:1-2000:12
Fertiliser 1.88*
(0.06)
4.85***
(0.00)
5.96***
(0.00)
7.73***
(0.00)
Crude oil 5.49***
(0.00)
2.51**
(0.01)
2.15**
(0.03)
5.34***
(0.00)
3.73***
(0.00)
3.49***
(0.00)
Note: data for fertiliser price are available over the period 1995:1-2009:8
p-value in brackets (…).
*, **, ***. stand respectively for 10,5 and 1% significance level.
Table A8.2 Tests of equality of means in volatility between the last decade (2001-2009) and other periods – Annual data
Moving standard deviation (SDD)
Whole period 1970-1980 1990-2000
Fertiliser 0.29
(0.77)
-2.34**
(0.04)
0.24
(0.82)
Crude oil -1.11
(0.27)
-5.89***
(0.00)
-0.34
(0.74)
Coefficient of variation (CV)
Whole period 1970-1980 1990-2000
Fertiliser 2.64**
(0.01)
-0.27
(0.79)
2.90**
(0.01)
Crude oil 2.83***
(0.00)
-1.88*
(0.09)
5.24***
(0.00)
*, **, ***. stand respectively for 10,5 and 1% significance level.
p-value in brackets (…).
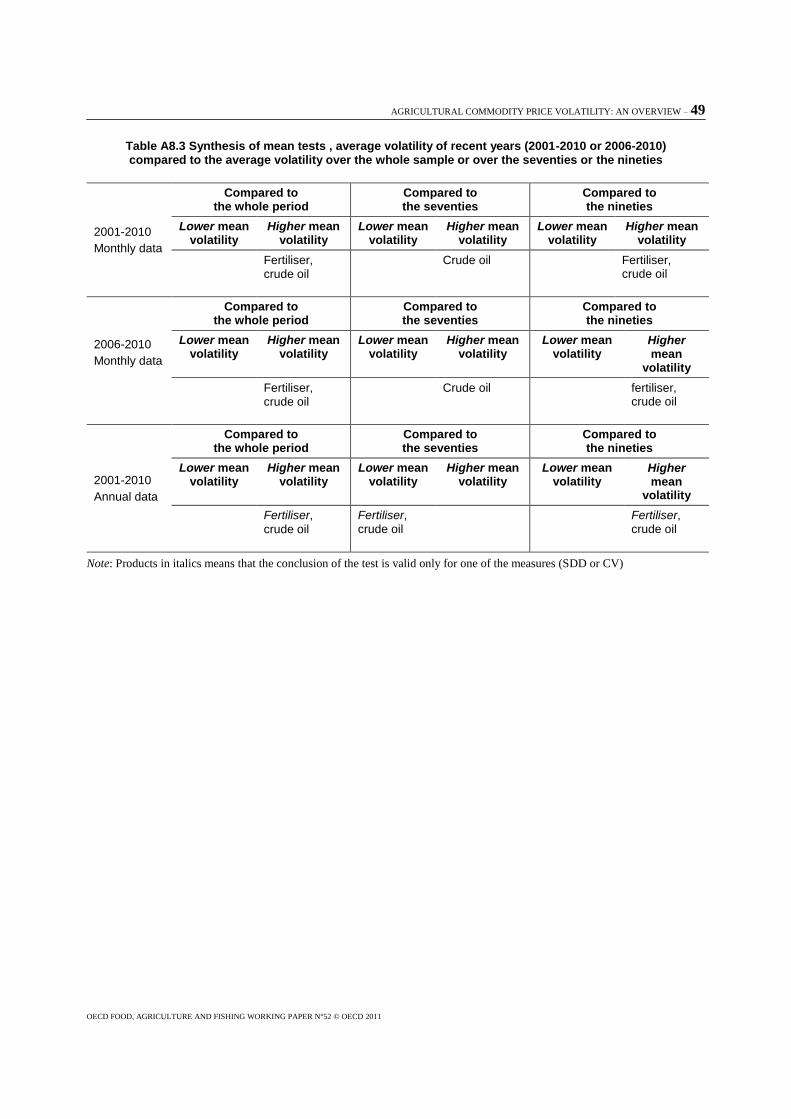
AGRICULTURAL COMMODITY PRICE VOLATILITY: AN OVERVIEW – 49
OECD FOOD, AGRICULTURE AND FISHING WORKING PAPER N°52 © OECD 2011
Table A8.3 Synthesis of mean tests , average volatility of recent years (2001-2010 or 2006-2010) compared to the average volatility over the whole sample or over the seventies or the nineties
2001-2010
Monthly data
Compared to the whole period
Compared to the seventies
Compared to the nineties
Lower mean volatility
Higher mean volatility
Lower mean volatility
Higher mean volatility
Lower mean volatility
Higher mean volatility
Fertiliser, crude oil
Crude oil Fertiliser, crude oil
2006-2010
Monthly data
Compared to the whole period
Compared to the seventies
Compared to the nineties
Lower mean volatility
Higher mean volatility
Lower mean volatility
Higher mean volatility
Lower mean volatility
Higher mean
volatility
Fertiliser, crude oil
Crude oil fertiliser, crude oil
2001-2010
Annual data
Compared to the whole period
Compared to the seventies
Compared to the nineties
Lower mean volatility
Higher mean volatility
Lower mean volatility
Higher mean volatility
Lower mean volatility
Higher mean
volatility
Fertiliser,
crude oil
Fertiliser, crude oil
Fertiliser, crude oil
Note: Products in italics means that the conclusion of the test is valid only for one of the measures (SDD or CV)

50 – AGRICULTURAL COMMODITY PRICE VOLATILITY: AN OVERVIEW
OECD FOOD, AGRICULTURE AND FISHING WORKING PAPER N°52 © OECD 2011
Table A8.4 Tests of variances -Monthly data
fertilizer oil
1970:1-1970:12
1971:1-1971:12
1972:1-1972:12
1973:1-1973:12
1974:1-1974:12
1975:1-1975:12
1976:1-1976:12
1977:1-1977:12
1978:1-1978:12
1979:1-1979:12
1980:1-1980:12
1990:1-1990:12
1991:1-1991:12
1992:1-1992:12
1993:1-1993:12
1994:1-1994:12
1995:1-1995:12
1996:1-1996:12
1997:1-1997:12
1998:1-1998:12
1999:1-1999:12
2000:1-2000:12
Total average
variance over 2007:1-2007:12 compared to
variance over 2008:1-2008:12 compared to
variance over 2009:1-2009:12 compared to
variance over 2009:3-2010:2 compared to
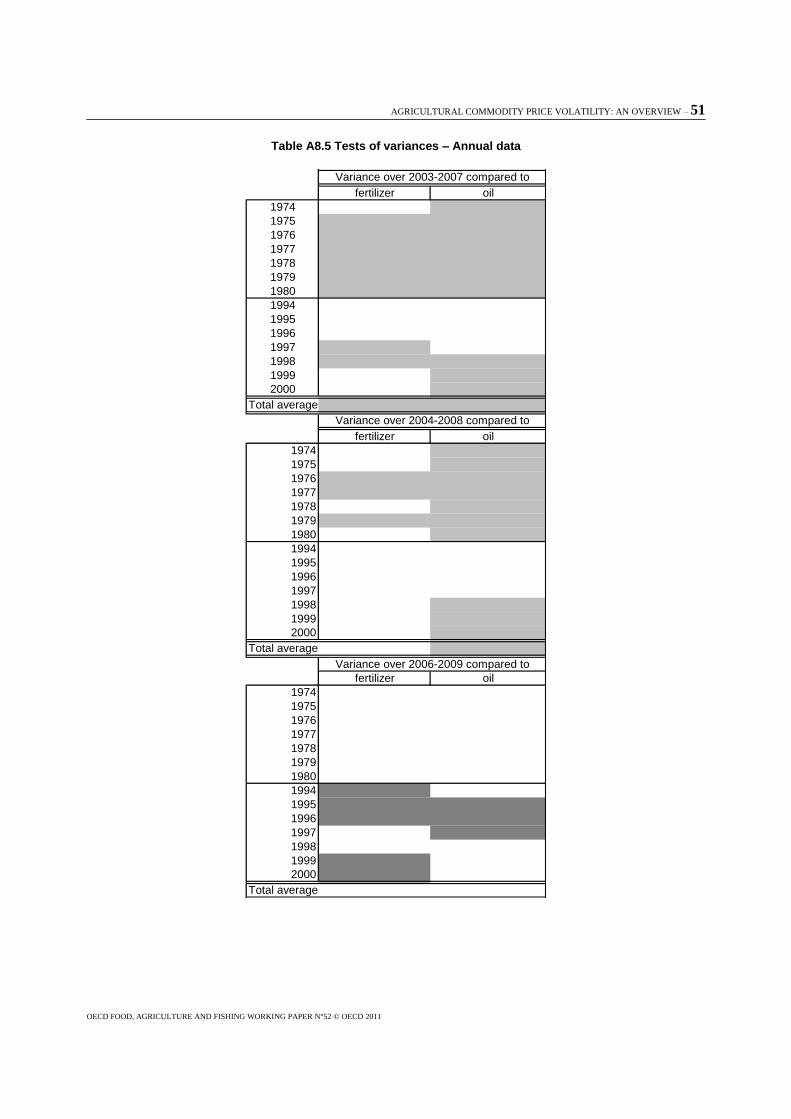
AGRICULTURAL COMMODITY PRICE VOLATILITY: AN OVERVIEW – 51
OECD FOOD, AGRICULTURE AND FISHING WORKING PAPER N°52 © OECD 2011
Table A8.5 Tests of variances – Annual data
fertilizer oil
1974
1975
1976
1977
1978
1979
1980
1994
1995
1996
1997
1998
1999
2000
Total average
fertilizer oil
1974
1975
1976
1977
1978
1979
1980
1994
1995
1996
1997
1998
1999
2000
Total average
fertilizer oil
1974
1975
1976
1977
1978
1979
1980
1994
1995
1996
1997
1998
1999
2000
Total average
Variance over 2004-2008 compared to
Variance over 2003-2007 compared to
Variance over 2006-2009 compared to