oct: new perspectives in neuro-ophthalmology · neuro-ophthalmology update oct: new perspectives in...
TRANSCRIPT
Saudi Journal of Ophthalmology (2015) 29, 9–25
Neuro-ophthalmology Update
OCT: New perspectives in neuro-ophthalmology
Peer review under responsibilityof Saudi Ophthalmological Society,King Saud University Production and hosting by Elsevier
Access this article onlinwww.saudiophthaljournwww.sciencedirect.com
Received 15 July 2014; accepted 9 September 2014; available online 5 October 2014.
Hospital Universitario Ramón y Cajal. IRYCIS, Ophthalmology Service, University of Alcala, Madrid, Spain
⇑ Corresponding author at: Hospital Universitario Ramón y Cajal. IRYCIS, Ophthalmology Service, Carretera Colmenar Viejo Km 9,1, 28034Spain. Tel./fax: +34 913368126.e-mail address: [email protected] (F.J. Muñoz-Negrete).
Gema Rebolleda, Laura Diez-Alvarez, Alfonso Casado, Carmen Sánchez-Sánchez, Elisabet de Dompablo,Julio J. González-López, Francisco J. Muñoz-Negrete ⇑
Abstract
Optical coherence tomography (OCT) has become essential to evaluate axonal/neuronal integrity, to assess disease progression inthe afferent visual pathway and to predict visual recovery after surgery in compressive optic neuropathies. Besides that OCTtesting is considered a powerful biomarker of neurodegeneration and a promising outcome measure for neuroprotective trialsin multiple sclerosis (MS).Currently, spectral-domain OCT (SD-OCT) technology allows quantification of retinal individual layers. The Ganglion Cell layer(GCL) investigation has become one of the most useful tools from a neuro-ophthalmic perspective. It has a high correlation withperimetry, is predictive of future progression and is a highly sensitive, specific of several neuro-ophthalmic pathologies. Moreoverthe superior correlation with clinical measures compared to peripapillary retinal nerve fiber layer (pRNFL) suggests that GCLanalysis might be a better approach to examine MS neurodegeneration.In disorders with optic disk edema, such as ischemic optic neuropathy, papillitis and papilledema, reduction in RNFL thicknesscaused by axonal atrophy is difficult to distinguish from a swelling resolution. In this setting, and in buried optic nerve head drusen(ONHD), GCL analysis may provide more accurate information than RNFL analysis and it might be an early structural indicator ofirreversible neuronal loss.Enhanced depth imaging OCT (EDI-OCT) provides in vivo detail of ONHD, allowing to evaluate and quantify the drusendimensions.OCT is improving our knowledge in hereditary optic neuropathies. Furthermore, there is growing evidence about the role of OCTas an adjunctive biomarker of disorders such as Alzheimer and Parkinson’s disease.
Keywords: Neuro-ophthalmology, Optical coherence tomography, Ganglion cell layer
� 2014 Production and hosting by Elsevier B.V. on behalf of Saudi Ophthalmological Society, King Saud University.http://dx.doi.org/10.1016/j.sjopt.2014.09.016
Introduction
Optical coherence tomography (OCT) has revolutionizedophthalmology and it has become one of the most importanttools in neuro-ophthalmic practice.
Time-domain OCT (TD-OCT) was widely used in clinicalpractice and currently replaced by the newer Spectral-Domain OCT (SD-OCT) technology that offers considerable
improvements. SD-OCT has faster acquisition time andhigher resolution than TD-OCT, providing high quality threedimensional images. Furthermore it can track eye movementsand it has eliminated operator bias with automatic centering.
OCT is a quick, sensitive, non-invasive, user-friendly devicethat provides high-resolution images of the peripapillary ret-inal nerve fiber layer (pRNFL), macular volume, macular gan-glion cell layer (GCL), and optic nerve head, yielding
e:al.com
Madrid,
10 G. Rebolleda et al.
reproducible and reliable measurements. OCT allows us tosearch about axonal-neuronal integrity in the afferent visualpathway and, compared with perimetry, is faster, morereproducible, precise and less dependent on patient.
Depending on the type of disorder, OCT provides datarelevant for diagnosis, follow-up, and prognosis. Althoughdiagnosis exclusively based on OCT is not possible, in somediseases there are pathognomonic findings leading to cor-rect diagnosis. This review gives an overview on currentapplications, typical changes, new perspectives and futuredirections of the OCT in the following diseases: optic neuritis(isolated or associated with multiple sclerosis or neuromyeli-tis optica), anterior ischemic optic neuropathy, papilledema,optic nerve head drusen, autosomal dominant optic atrophy,Leber hereditary optic neuropathy and neurodegenerativediseases.
Optic neuritis/multiple sclerosis
Multiple sclerosis (MS) is a disorder characterized byinflammation and neuro-axonal degeneration. Optic neuritis(ON) is one of the manifestations of MS and is the presentingevent in 25–50% of MS cases. Given its high degree of reli-ability, sensitivity and ease of use, OCT is an ideal methodfor assessing pathologic changes in the anterior visual path-way of patients with ON and MS.
Retinal nerve fiber layer thickness
Firstly reported by Parisi in 1999, thinning of pRNFL byOCT, is a well-documented structural marker of axonaldegeneration in MS, which occurs even in the absence ofoptic neuritis (ON).1–6
OCT confirms the presence of optic disk edema inanterior ON, and quantifies the severity of axonal loss thatfollows the acute episode. OCT can detect subclinicalaxonal loss in eyes with normal visual fields and normalvisual acuity (Figs. 1 and 3).7
Meta-analyses of data for TD-OCT show that RNFLthinning is milder in MS without ON (7.08 lm) than in eyesthat have suffered ON (20.38 lm) and it is more pronouncedin the temporal quadrant.4
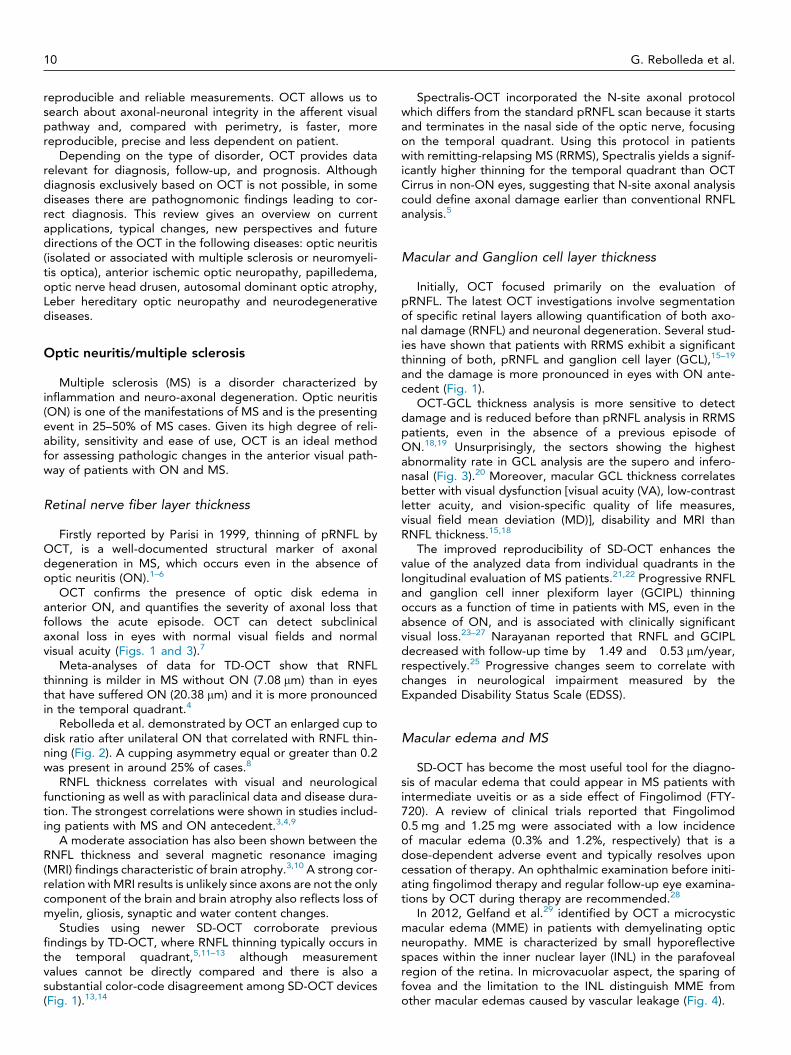
Rebolleda et al. demonstrated by OCT an enlarged cup todisk ratio after unilateral ON that correlated with RNFL thin-ning (Fig. 2). A cupping asymmetry equal or greater than 0.2was present in around 25% of cases.8
RNFL thickness correlates with visual and neurologicalfunctioning as well as with paraclinical data and disease dura-tion. The strongest correlations were shown in studies includ-ing patients with MS and ON antecedent.3,4,9
A moderate association has also been shown between theRNFL thickness and several magnetic resonance imaging(MRI) findings characteristic of brain atrophy.3,10 A strong cor-relation with MRI results is unlikely since axons are not the onlycomponent of the brain and brain atrophy also reflects loss ofmyelin, gliosis, synaptic and water content changes.
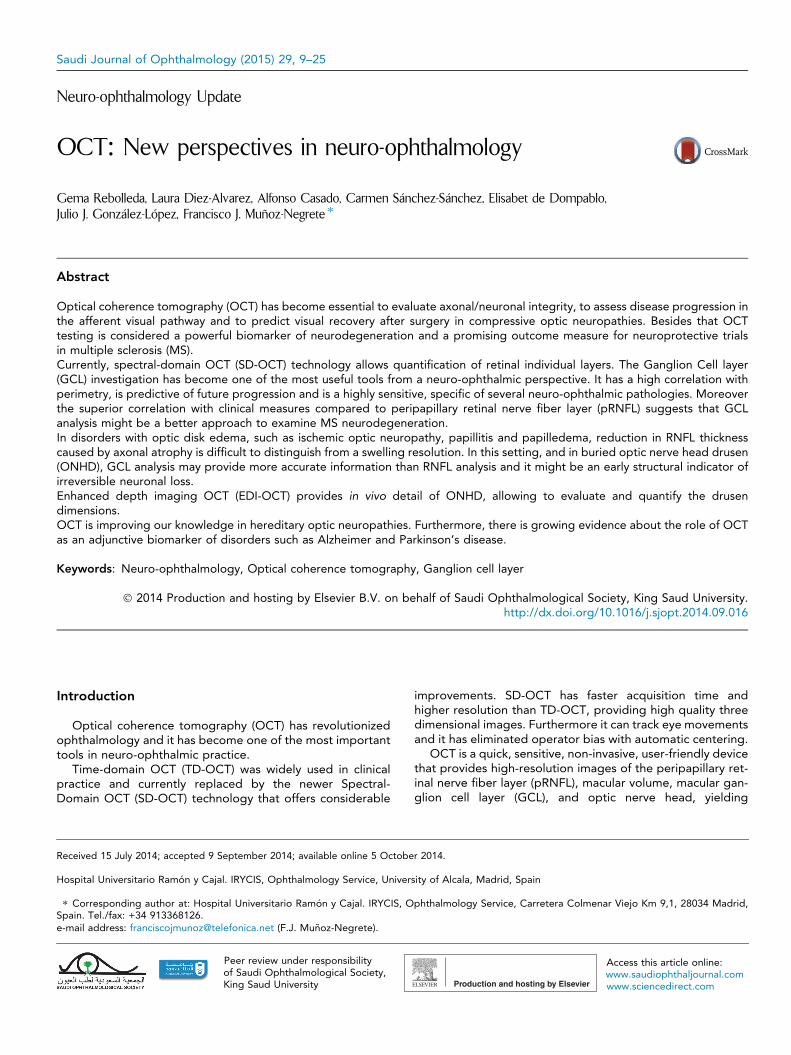
Studies using newer SD-OCT corroborate previousfindings by TD-OCT, where RNFL thinning typically occurs inthe temporal quadrant,5,11–13 although measurementvalues cannot be directly compared and there is also asubstantial color-code disagreement among SD-OCT devices(Fig. 1).13,14
Spectralis-OCT incorporated the N-site axonal protocolwhich differs from the standard pRNFL scan because it startsand terminates in the nasal side of the optic nerve, focusingon the temporal quadrant. Using this protocol in patientswith remitting-relapsing MS (RRMS), Spectralis yields a signif-icantly higher thinning for the temporal quadrant than OCTCirrus in non-ON eyes, suggesting that N-site axonal analysiscould define axonal damage earlier than conventional RNFLanalysis.5
Macular and Ganglion cell layer thickness
Initially, OCT focused primarily on the evaluation ofpRNFL. The latest OCT investigations involve segmentationof specific retinal layers allowing quantification of both axo-nal damage (RNFL) and neuronal degeneration. Several stud-ies have shown that patients with RRMS exhibit a significantthinning of both, pRNFL and ganglion cell layer (GCL),15–19
and the damage is more pronounced in eyes with ON ante-cedent (Fig. 1).
OCT-GCL thickness analysis is more sensitive to detectdamage and is reduced before than pRNFL analysis in RRMSpatients, even in the absence of a previous episode ofON.18,19 Unsurprisingly, the sectors showing the highestabnormality rate in GCL analysis are the supero and infero-nasal (Fig. 3).20 Moreover, macular GCL thickness correlatesbetter with visual dysfunction [visual acuity (VA), low-contrastletter acuity, and vision-specific quality of life measures,visual field mean deviation (MD)], disability and MRI thanRNFL thickness.15,18
The improved reproducibility of SD-OCT enhances thevalue of the analyzed data from individual quadrants in thelongitudinal evaluation of MS patients.21,22 Progressive RNFLand ganglion cell inner plexiform layer (GCIPL) thinningoccurs as a function of time in patients with MS, even in theabsence of ON, and is associated with clinically significantvisual loss.23–27 Narayanan reported that RNFL and GCIPLdecreased with follow-up time by �1.49 and �0.53 lm/year,respectively.25 Progressive changes seem to correlate withchanges in neurological impairment measured by theExpanded Disability Status Scale (EDSS).
Macular edema and MS
SD-OCT has become the most useful tool for the diagno-sis of macular edema that could appear in MS patients withintermediate uveitis or as a side effect of Fingolimod (FTY-720). A review of clinical trials reported that Fingolimod0.5 mg and 1.25 mg were associated with a low incidenceof macular edema (0.3% and 1.2%, respectively) that is adose-dependent adverse event and typically resolves uponcessation of therapy. An ophthalmic examination before initi-ating fingolimod therapy and regular follow-up eye examina-tions by OCT during therapy are recommended.28
In 2012, Gelfand et al.29 identified by OCT a microcysticmacular edema (MME) in patients with demyelinating opticneuropathy. MME is characterized by small hyporeflectivespaces within the inner nuclear layer (INL) in the parafovealregion of the retina. In microvacuolar aspect, the sparing offovea and the limitation to the INL distinguish MME fromother macular edemas caused by vascular leakage (Fig. 4).
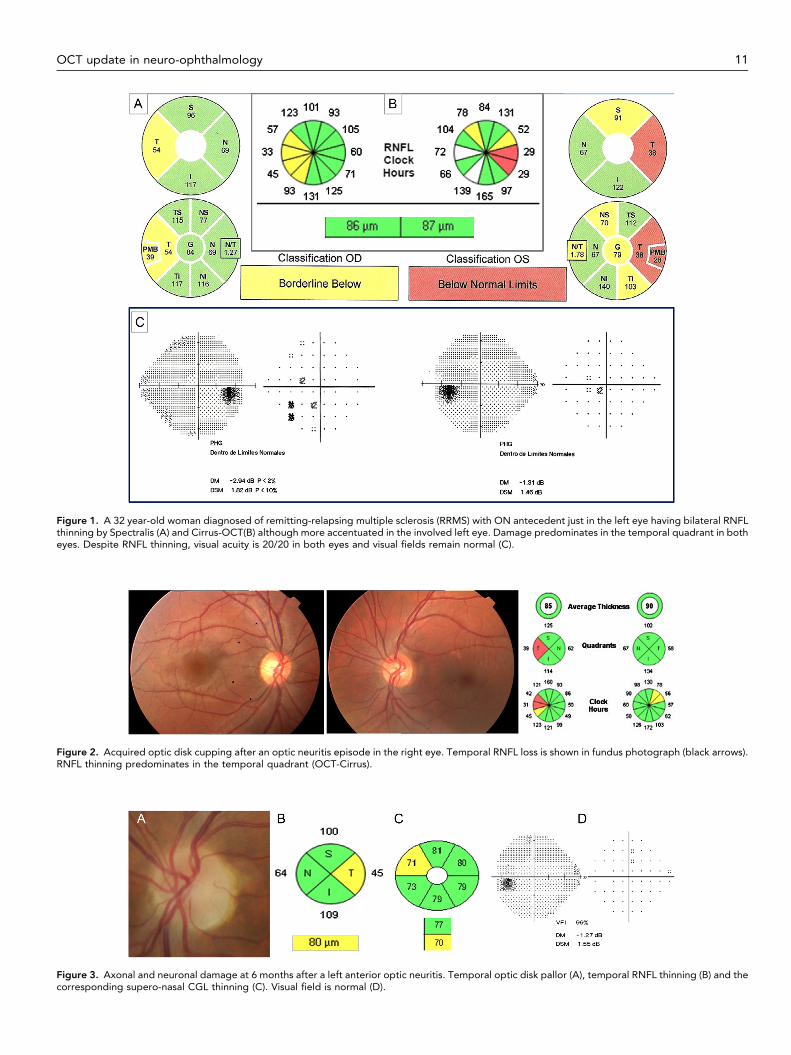
Figure 1. A 32 year-old woman diagnosed of remitting-relapsing multiple sclerosis (RRMS) with ON antecedent just in the left eye having bilateral RNFLthinning by Spectralis (A) and Cirrus-OCT(B) although more accentuated in the involved left eye. Damage predominates in the temporal quadrant in botheyes. Despite RNFL thinning, visual acuity is 20/20 in both eyes and visual fields remain normal (C).
Figure 2. Acquired optic disk cupping after an optic neuritis episode in the right eye. Temporal RNFL loss is shown in fundus photograph (black arrows).RNFL thinning predominates in the temporal quadrant (OCT-Cirrus).
Figure 3. Axonal and neuronal damage at 6 months after a left anterior optic neuritis. Temporal optic disk pallor (A), temporal RNFL thinning (B) and thecorresponding supero-nasal CGL thinning (C). Visual field is normal (D).
OCT update in neuro-ophthalmology 11
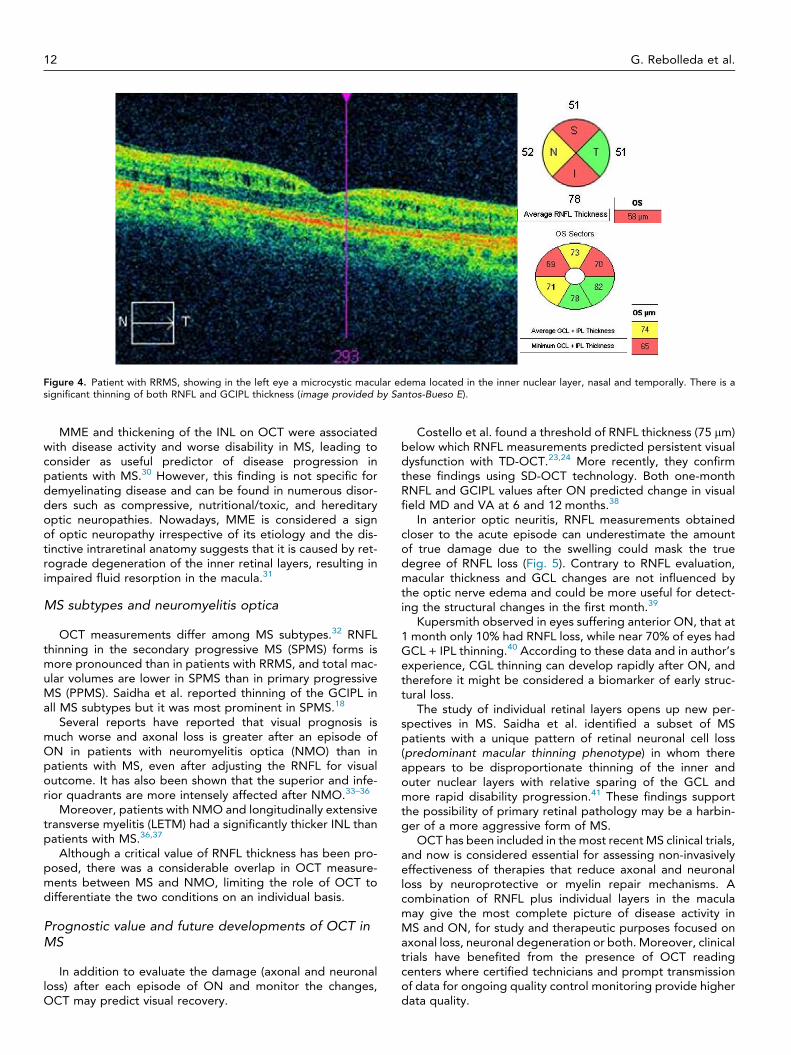
Figure 4. Patient with RRMS, showing in the left eye a microcystic macular edema located in the inner nuclear layer, nasal and temporally. There is asignificant thinning of both RNFL and GCIPL thickness (image provided by Santos-Bueso E).
12 G. Rebolleda et al.
MME and thickening of the INL on OCT were associatedwith disease activity and worse disability in MS, leading toconsider as useful predictor of disease progression inpatients with MS.30 However, this finding is not specific fordemyelinating disease and can be found in numerous disor-ders such as compressive, nutritional/toxic, and hereditaryoptic neuropathies. Nowadays, MME is considered a signof optic neuropathy irrespective of its etiology and the dis-tinctive intraretinal anatomy suggests that it is caused by ret-rograde degeneration of the inner retinal layers, resulting inimpaired fluid resorption in the macula.31
MS subtypes and neuromyelitis optica
OCT measurements differ among MS subtypes.32 RNFLthinning in the secondary progressive MS (SPMS) forms ismore pronounced than in patients with RRMS, and total mac-ular volumes are lower in SPMS than in primary progressiveMS (PPMS). Saidha et al. reported thinning of the GCIPL inall MS subtypes but it was most prominent in SPMS.18
Several reports have reported that visual prognosis ismuch worse and axonal loss is greater after an episode ofON in patients with neuromyelitis optica (NMO) than inpatients with MS, even after adjusting the RNFL for visualoutcome. It has also been shown that the superior and infe-rior quadrants are more intensely affected after NMO.33–36
Moreover, patients with NMO and longitudinally extensivetransverse myelitis (LETM) had a significantly thicker INL thanpatients with MS.36,37
Although a critical value of RNFL thickness has been pro-posed, there was a considerable overlap in OCT measure-ments between MS and NMO, limiting the role of OCT todifferentiate the two conditions on an individual basis.
Prognostic value and future developments of OCT inMS
In addition to evaluate the damage (axonal and neuronalloss) after each episode of ON and monitor the changes,OCT may predict visual recovery.
Costello et al. found a threshold of RNFL thickness (75 lm)below which RNFL measurements predicted persistent visualdysfunction with TD-OCT.23,24 More recently, they confirmthese findings using SD-OCT technology. Both one-monthRNFL and GCIPL values after ON predicted change in visualfield MD and VA at 6 and 12 months.38
In anterior optic neuritis, RNFL measurements obtainedcloser to the acute episode can underestimate the amountof true damage due to the swelling could mask the truedegree of RNFL loss (Fig. 5). Contrary to RNFL evaluation,macular thickness and GCL changes are not influenced bythe optic nerve edema and could be more useful for detect-ing the structural changes in the first month.39
Kupersmith observed in eyes suffering anterior ON, that at1 month only 10% had RNFL loss, while near 70% of eyes hadGCL + IPL thinning.40 According to these data and in author’sexperience, CGL thinning can develop rapidly after ON, andtherefore it might be considered a biomarker of early struc-tural loss.
The study of individual retinal layers opens up new per-spectives in MS. Saidha et al. identified a subset of MSpatients with a unique pattern of retinal neuronal cell loss(predominant macular thinning phenotype) in whom thereappears to be disproportionate thinning of the inner andouter nuclear layers with relative sparing of the GCL andmore rapid disability progression.41 These findings supportthe possibility of primary retinal pathology may be a harbin-ger of a more aggressive form of MS.
OCT has been included in the most recent MS clinical trials,and now is considered essential for assessing non-invasivelyeffectiveness of therapies that reduce axonal and neuronalloss by neuroprotective or myelin repair mechanisms. Acombination of RNFL plus individual layers in the maculamay give the most complete picture of disease activity inMS and ON, for study and therapeutic purposes focused onaxonal loss, neuronal degeneration or both. Moreover, clinicaltrials have benefited from the presence of OCT readingcenters where certified technicians and prompt transmissionof data for ongoing quality control monitoring provide higherdata quality.
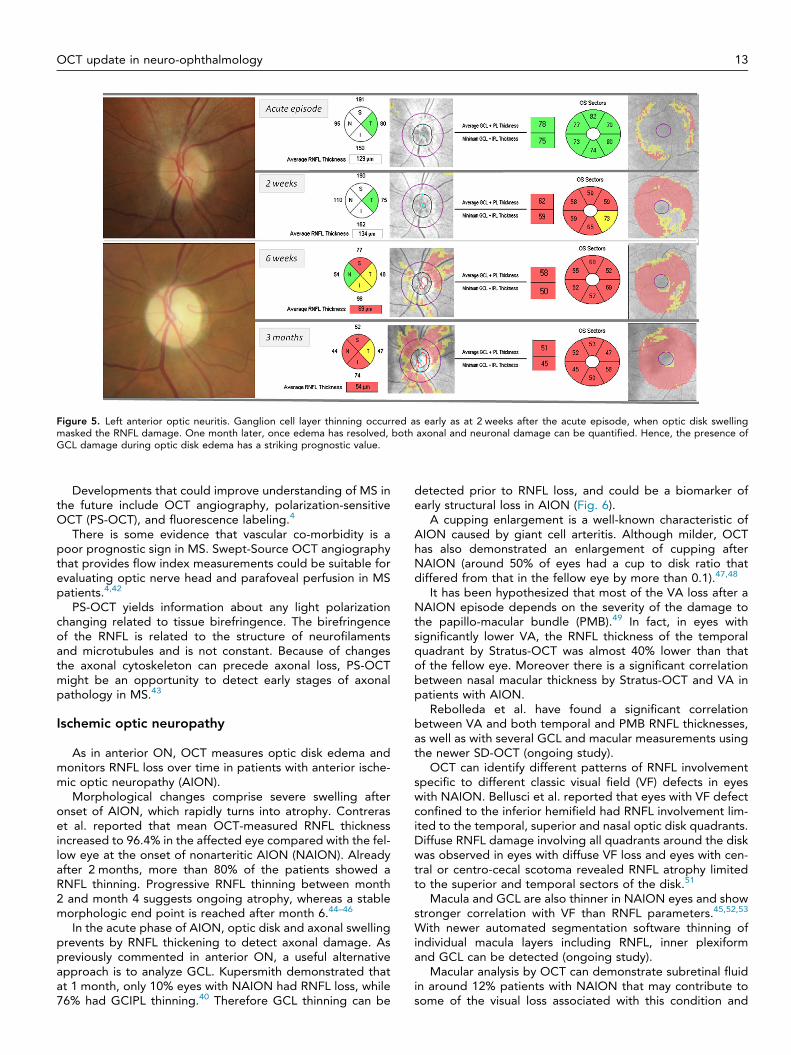
Figure 5. Left anterior optic neuritis. Ganglion cell layer thinning occurred as early as at 2 weeks after the acute episode, when optic disk swellingmasked the RNFL damage. One month later, once edema has resolved, both axonal and neuronal damage can be quantified. Hence, the presence ofGCL damage during optic disk edema has a striking prognostic value.
OCT update in neuro-ophthalmology 13
Developments that could improve understanding of MS inthe future include OCT angiography, polarization-sensitiveOCT (PS-OCT), and fluorescence labeling.4
There is some evidence that vascular co-morbidity is apoor prognostic sign in MS. Swept-Source OCT angiographythat provides flow index measurements could be suitable forevaluating optic nerve head and parafoveal perfusion in MSpatients.4,42
PS-OCT yields information about any light polarizationchanging related to tissue birefringence. The birefringenceof the RNFL is related to the structure of neurofilamentsand microtubules and is not constant. Because of changesthe axonal cytoskeleton can precede axonal loss, PS-OCTmight be an opportunity to detect early stages of axonalpathology in MS.43
Ischemic optic neuropathy
As in anterior ON, OCT measures optic disk edema andmonitors RNFL loss over time in patients with anterior ische-mic optic neuropathy (AION).
Morphological changes comprise severe swelling afteronset of AION, which rapidly turns into atrophy. Contreraset al. reported that mean OCT-measured RNFL thicknessincreased to 96.4% in the affected eye compared with the fel-low eye at the onset of nonarteritic AION (NAION). Alreadyafter 2 months, more than 80% of the patients showed aRNFL thinning. Progressive RNFL thinning between month2 and month 4 suggests ongoing atrophy, whereas a stablemorphologic end point is reached after month 6.44–46
In the acute phase of AION, optic disk and axonal swellingprevents by RNFL thickening to detect axonal damage. Aspreviously commented in anterior ON, a useful alternativeapproach is to analyze GCL. Kupersmith demonstrated thatat 1 month, only 10% eyes with NAION had RNFL loss, while76% had GCIPL thinning.40 Therefore GCL thinning can be
detected prior to RNFL loss, and could be a biomarker ofearly structural loss in AION (Fig. 6).
A cupping enlargement is a well-known characteristic ofAION caused by giant cell arteritis. Although milder, OCThas also demonstrated an enlargement of cupping afterNAION (around 50% of eyes had a cup to disk ratio thatdiffered from that in the fellow eye by more than 0.1).47,48
It has been hypothesized that most of the VA loss after aNAION episode depends on the severity of the damage tothe papillo-macular bundle (PMB).49 In fact, in eyes withsignificantly lower VA, the RNFL thickness of the temporalquadrant by Stratus-OCT was almost 40% lower than thatof the fellow eye. Moreover there is a significant correlationbetween nasal macular thickness by Stratus-OCT and VA inpatients with AION.
Rebolleda et al. have found a significant correlationbetween VA and both temporal and PMB RNFL thicknesses,as well as with several GCL and macular measurements usingthe newer SD-OCT (ongoing study).
OCT can identify different patterns of RNFL involvementspecific to different classic visual field (VF) defects in eyeswith NAION. Bellusci et al. reported that eyes with VF defectconfined to the inferior hemifield had RNFL involvement lim-ited to the temporal, superior and nasal optic disk quadrants.Diffuse RNFL damage involving all quadrants around the diskwas observed in eyes with diffuse VF loss and eyes with cen-tral or centro-cecal scotoma revealed RNFL atrophy limitedto the superior and temporal sectors of the disk.51
Macula and GCL are also thinner in NAION eyes and showstronger correlation with VF than RNFL parameters.45,52,53
With newer automated segmentation software thinning ofindividual macula layers including RNFL, inner plexiformand GCL can be detected (ongoing study).
Macular analysis by OCT can demonstrate subretinal fluidin around 12% patients with NAION that may contribute tosome of the visual loss associated with this condition and
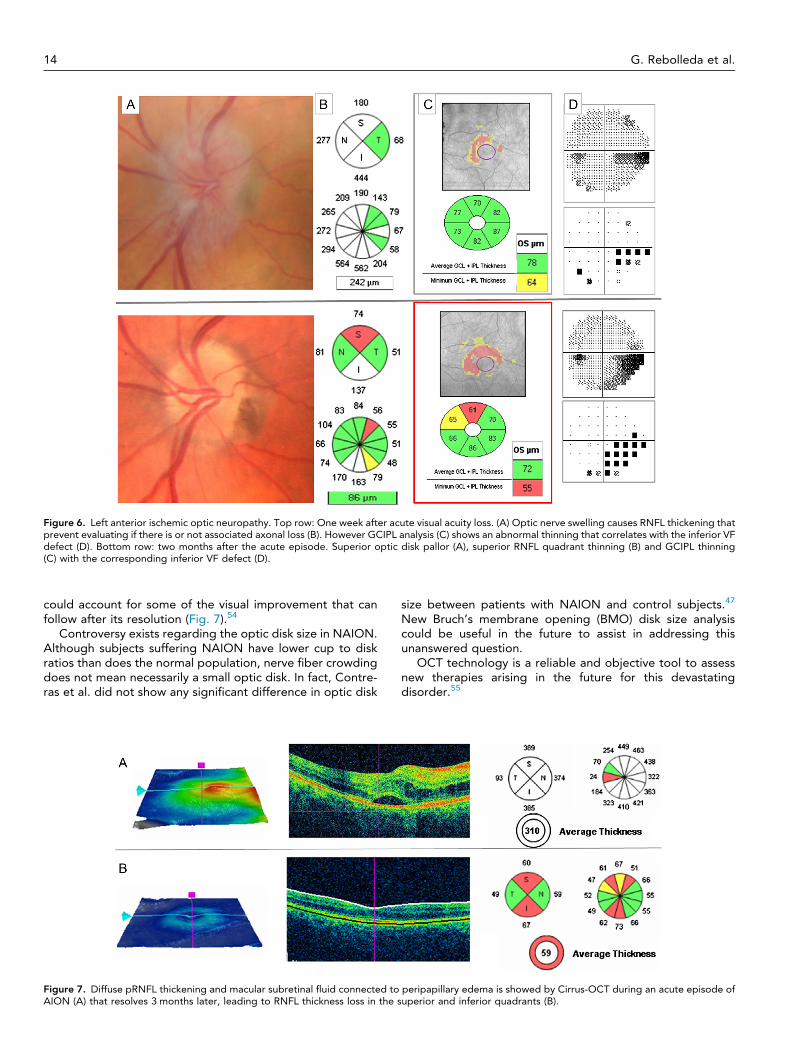
Figure 6. Left anterior ischemic optic neuropathy. Top row: One week after acute visual acuity loss. (A) Optic nerve swelling causes RNFL thickening thatprevent evaluating if there is or not associated axonal loss (B). However GCIPL analysis (C) shows an abnormal thinning that correlates with the inferior VFdefect (D). Bottom row: two months after the acute episode. Superior optic disk pallor (A), superior RNFL quadrant thinning (B) and GCIPL thinning(C) with the corresponding inferior VF defect (D).
14 G. Rebolleda et al.
could account for some of the visual improvement that canfollow after its resolution (Fig. 7).54
Controversy exists regarding the optic disk size in NAION.Although subjects suffering NAION have lower cup to diskratios than does the normal population, nerve fiber crowdingdoes not mean necessarily a small optic disk. In fact, Contre-ras et al. did not show any significant difference in optic disk
Figure 7. Diffuse pRNFL thickening and macular subretinal fluid connected toAION (A) that resolves 3 months later, leading to RNFL thickness loss in the s
size between patients with NAION and control subjects.47
New Bruch’s membrane opening (BMO) disk size analysiscould be useful in the future to assist in addressing thisunanswered question.
OCT technology is a reliable and objective tool to assessnew therapies arising in the future for this devastatingdisorder.55
peripapillary edema is showed by Cirrus-OCT during an acute episode ofuperior and inferior quadrants (B).
OCT update in neuro-ophthalmology 15
Papilledema
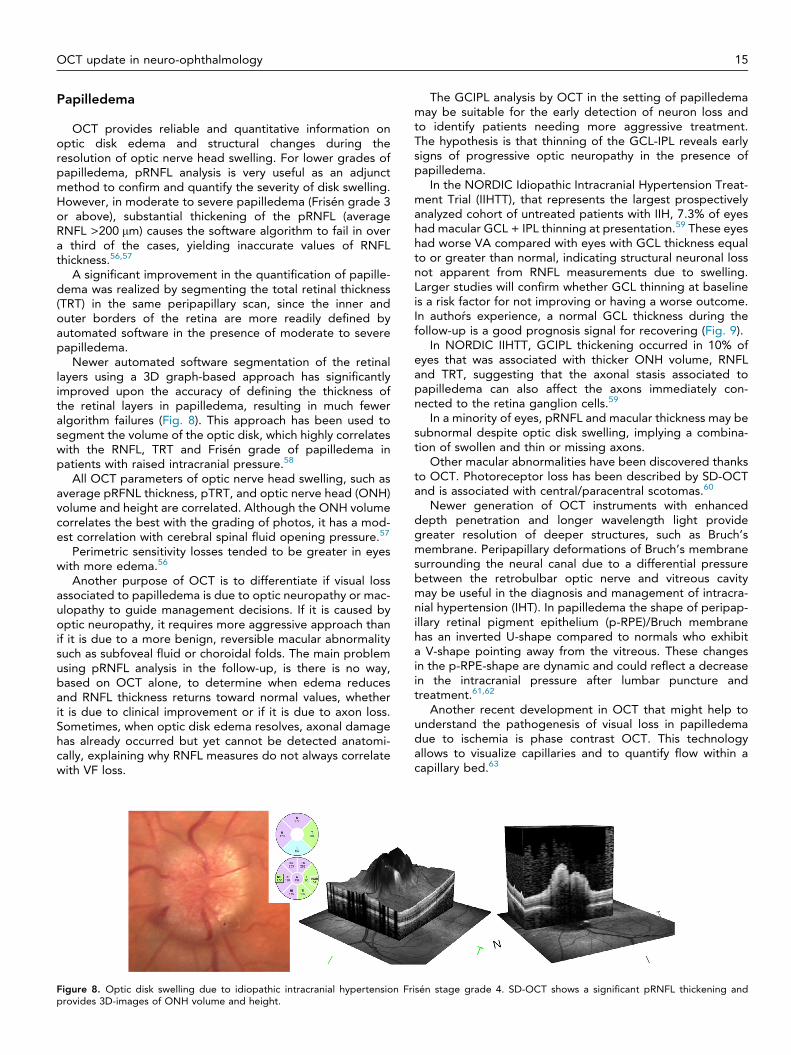
OCT provides reliable and quantitative information onoptic disk edema and structural changes during theresolution of optic nerve head swelling. For lower grades ofpapilledema, pRNFL analysis is very useful as an adjunctmethod to confirm and quantify the severity of disk swelling.However, in moderate to severe papilledema (Frisén grade 3or above), substantial thickening of the pRNFL (averageRNFL >200 lm) causes the software algorithm to fail in overa third of the cases, yielding inaccurate values of RNFLthickness.56,57
A significant improvement in the quantification of papille-dema was realized by segmenting the total retinal thickness(TRT) in the same peripapillary scan, since the inner andouter borders of the retina are more readily defined byautomated software in the presence of moderate to severepapilledema.
Newer automated software segmentation of the retinallayers using a 3D graph-based approach has significantlyimproved upon the accuracy of defining the thickness ofthe retinal layers in papilledema, resulting in much feweralgorithm failures (Fig. 8). This approach has been used tosegment the volume of the optic disk, which highly correlateswith the RNFL, TRT and Frisén grade of papilledema inpatients with raised intracranial pressure.58
All OCT parameters of optic nerve head swelling, such asaverage pRFNL thickness, pTRT, and optic nerve head (ONH)volume and height are correlated. Although the ONH volumecorrelates the best with the grading of photos, it has a mod-est correlation with cerebral spinal fluid opening pressure.57
Perimetric sensitivity losses tended to be greater in eyeswith more edema.56
Another purpose of OCT is to differentiate if visual lossassociated to papilledema is due to optic neuropathy or mac-ulopathy to guide management decisions. If it is caused byoptic neuropathy, it requires more aggressive approach thanif it is due to a more benign, reversible macular abnormalitysuch as subfoveal fluid or choroidal folds. The main problemusing pRNFL analysis in the follow-up, is there is no way,based on OCT alone, to determine when edema reducesand RNFL thickness returns toward normal values, whetherit is due to clinical improvement or if it is due to axon loss.Sometimes, when optic disk edema resolves, axonal damagehas already occurred but yet cannot be detected anatomi-cally, explaining why RNFL measures do not always correlatewith VF loss.
Figure 8. Optic disk swelling due to idiopathic intracranial hypertension Frprovides 3D-images of ONH volume and height.
The GCIPL analysis by OCT in the setting of papilledemamay be suitable for the early detection of neuron loss andto identify patients needing more aggressive treatment.The hypothesis is that thinning of the GCL-IPL reveals earlysigns of progressive optic neuropathy in the presence ofpapilledema.
In the NORDIC Idiopathic Intracranial Hypertension Treat-ment Trial (IIHTT), that represents the largest prospectivelyanalyzed cohort of untreated patients with IIH, 7.3% of eyeshad macular GCL + IPL thinning at presentation.59 These eyeshad worse VA compared with eyes with GCL thickness equalto or greater than normal, indicating structural neuronal lossnot apparent from RNFL measurements due to swelling.Larger studies will confirm whether GCL thinning at baselineis a risk factor for not improving or having a worse outcome.In authors experience, a normal GCL thickness during thefollow-up is a good prognosis signal for recovering (Fig. 9).
In NORDIC IIHTT, GCIPL thickening occurred in 10% ofeyes that was associated with thicker ONH volume, RNFLand TRT, suggesting that the axonal stasis associated topapilledema can also affect the axons immediately con-nected to the retina ganglion cells.59
In a minority of eyes, pRNFL and macular thickness may besubnormal despite optic disk swelling, implying a combina-tion of swollen and thin or missing axons.
Other macular abnormalities have been discovered thanksto OCT. Photoreceptor loss has been described by SD-OCTand is associated with central/paracentral scotomas.60
Newer generation of OCT instruments with enhanceddepth penetration and longer wavelength light providegreater resolution of deeper structures, such as Bruch’smembrane. Peripapillary deformations of Bruch’s membranesurrounding the neural canal due to a differential pressurebetween the retrobulbar optic nerve and vitreous cavitymay be useful in the diagnosis and management of intracra-nial hypertension (IHT). In papilledema the shape of peripap-illary retinal pigment epithelium (p-RPE)/Bruch membranehas an inverted U-shape compared to normals who exhibita V-shape pointing away from the vitreous. These changesin the p-RPE-shape are dynamic and could reflect a decreasein the intracranial pressure after lumbar puncture andtreatment.61,62
Another recent development in OCT that might help tounderstand the pathogenesis of visual loss in papilledemadue to ischemia is phase contrast OCT. This technologyallows to visualize capillaries and to quantify flow within acapillary bed.63
isén stage grade 4. SD-OCT shows a significant pRNFL thickening and
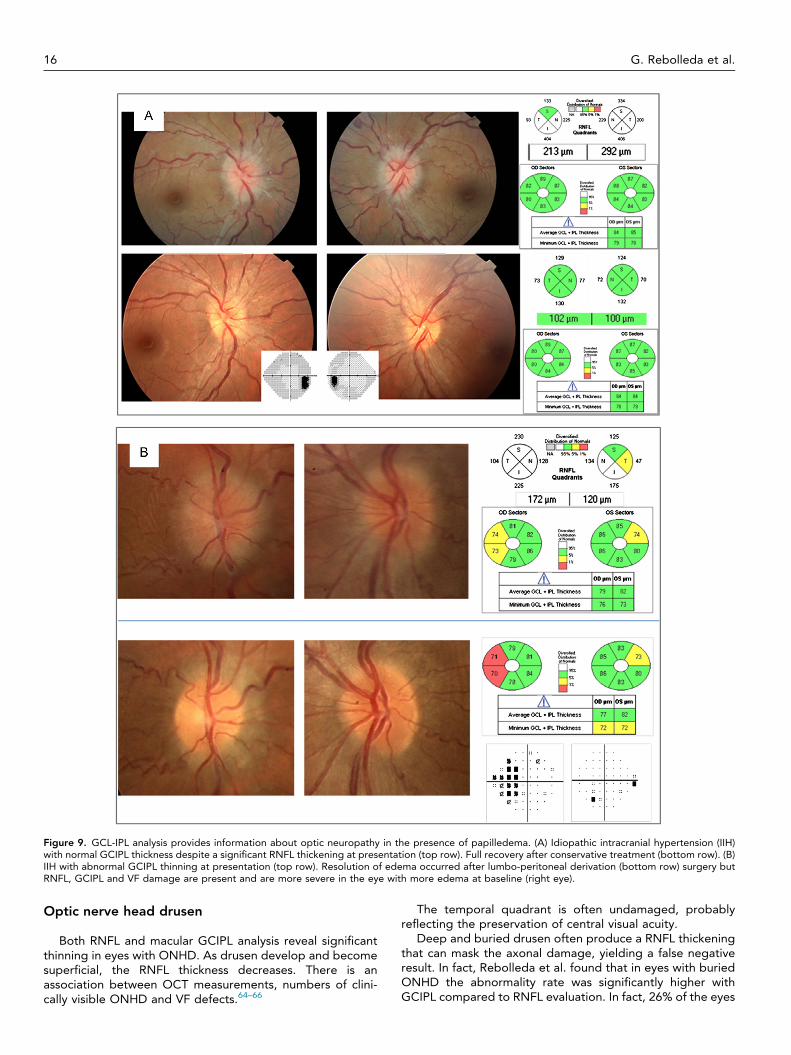
Figure 9. GCL-IPL analysis provides information about optic neuropathy in the presence of papilledema. (A) Idiopathic intracranial hypertension (IIH)with normal GCIPL thickness despite a significant RNFL thickening at presentation (top row). Full recovery after conservative treatment (bottom row). (B)IIH with abnormal GCIPL thinning at presentation (top row). Resolution of edema occurred after lumbo-peritoneal derivation (bottom row) surgery butRNFL, GCIPL and VF damage are present and are more severe in the eye with more edema at baseline (right eye).
16 G. Rebolleda et al.
Optic nerve head drusen
Both RNFL and macular GCIPL analysis reveal significantthinning in eyes with ONHD. As drusen develop and becomesuperficial, the RNFL thickness decreases. There is anassociation between OCT measurements, numbers of clini-cally visible ONHD and VF defects.64–66
The temporal quadrant is often undamaged, probablyreflecting the preservation of central visual acuity.
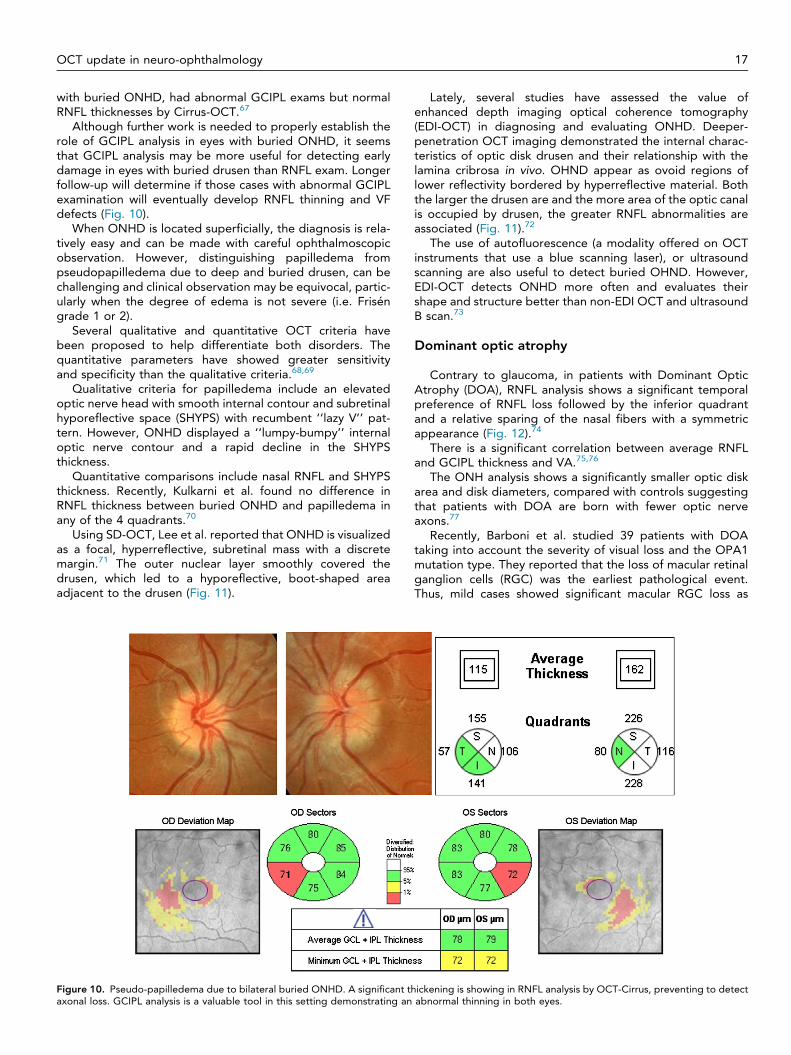
Deep and buried drusen often produce a RNFL thickeningthat can mask the axonal damage, yielding a false negativeresult. In fact, Rebolleda et al. found that in eyes with buriedONHD the abnormality rate was significantly higher withGCIPL compared to RNFL evaluation. In fact, 26% of the eyes
OCT update in neuro-ophthalmology 17
with buried ONHD, had abnormal GCIPL exams but normalRNFL thicknesses by Cirrus-OCT.67
Although further work is needed to properly establish therole of GCIPL analysis in eyes with buried ONHD, it seemsthat GCIPL analysis may be more useful for detecting earlydamage in eyes with buried drusen than RNFL exam. Longerfollow-up will determine if those cases with abnormal GCIPLexamination will eventually develop RNFL thinning and VFdefects (Fig. 10).
When ONHD is located superficially, the diagnosis is rela-tively easy and can be made with careful ophthalmoscopicobservation. However, distinguishing papilledema frompseudopapilledema due to deep and buried drusen, can bechallenging and clinical observation may be equivocal, partic-ularly when the degree of edema is not severe (i.e. Friséngrade 1 or 2).
Several qualitative and quantitative OCT criteria havebeen proposed to help differentiate both disorders. Thequantitative parameters have showed greater sensitivityand specificity than the qualitative criteria.68,69
Qualitative criteria for papilledema include an elevatedoptic nerve head with smooth internal contour and subretinalhyporeflective space (SHYPS) with recumbent ‘‘lazy V’’ pat-tern. However, ONHD displayed a ‘‘lumpy-bumpy’’ internaloptic nerve contour and a rapid decline in the SHYPSthickness.
Quantitative comparisons include nasal RNFL and SHYPSthickness. Recently, Kulkarni et al. found no difference inRNFL thickness between buried ONHD and papilledema inany of the 4 quadrants.70
Using SD-OCT, Lee et al. reported that ONHD is visualizedas a focal, hyperreflective, subretinal mass with a discretemargin.71 The outer nuclear layer smoothly covered thedrusen, which led to a hyporeflective, boot-shaped areaadjacent to the drusen (Fig. 11).
Figure 10. Pseudo-papilledema due to bilateral buried ONHD. A significant thaxonal loss. GCIPL analysis is a valuable tool in this setting demonstrating an
Lately, several studies have assessed the value ofenhanced depth imaging optical coherence tomography(EDI-OCT) in diagnosing and evaluating ONHD. Deeper-penetration OCT imaging demonstrated the internal charac-teristics of optic disk drusen and their relationship with thelamina cribrosa in vivo. OHND appear as ovoid regions oflower reflectivity bordered by hyperreflective material. Boththe larger the drusen are and the more area of the optic canalis occupied by drusen, the greater RNFL abnormalities areassociated (Fig. 11).72
The use of autofluorescence (a modality offered on OCTinstruments that use a blue scanning laser), or ultrasoundscanning are also useful to detect buried OHND. However,EDI-OCT detects ONHD more often and evaluates theirshape and structure better than non-EDI OCT and ultrasoundB scan.73
Dominant optic atrophy
Contrary to glaucoma, in patients with Dominant OpticAtrophy (DOA), RNFL analysis shows a significant temporalpreference of RNFL loss followed by the inferior quadrantand a relative sparing of the nasal fibers with a symmetricappearance (Fig. 12).74
There is a significant correlation between average RNFLand GCIPL thickness and VA.75,76
The ONH analysis shows a significantly smaller optic diskarea and disk diameters, compared with controls suggestingthat patients with DOA are born with fewer optic nerveaxons.77
Recently, Barboni et al. studied 39 patients with DOAtaking into account the severity of visual loss and the OPA1mutation type. They reported that the loss of macular retinalganglion cells (RGC) was the earliest pathological event.Thus, mild cases showed significant macular RGC loss as
ickening is showing in RNFL analysis by OCT-Cirrus, preventing to detectabnormal thinning in both eyes.
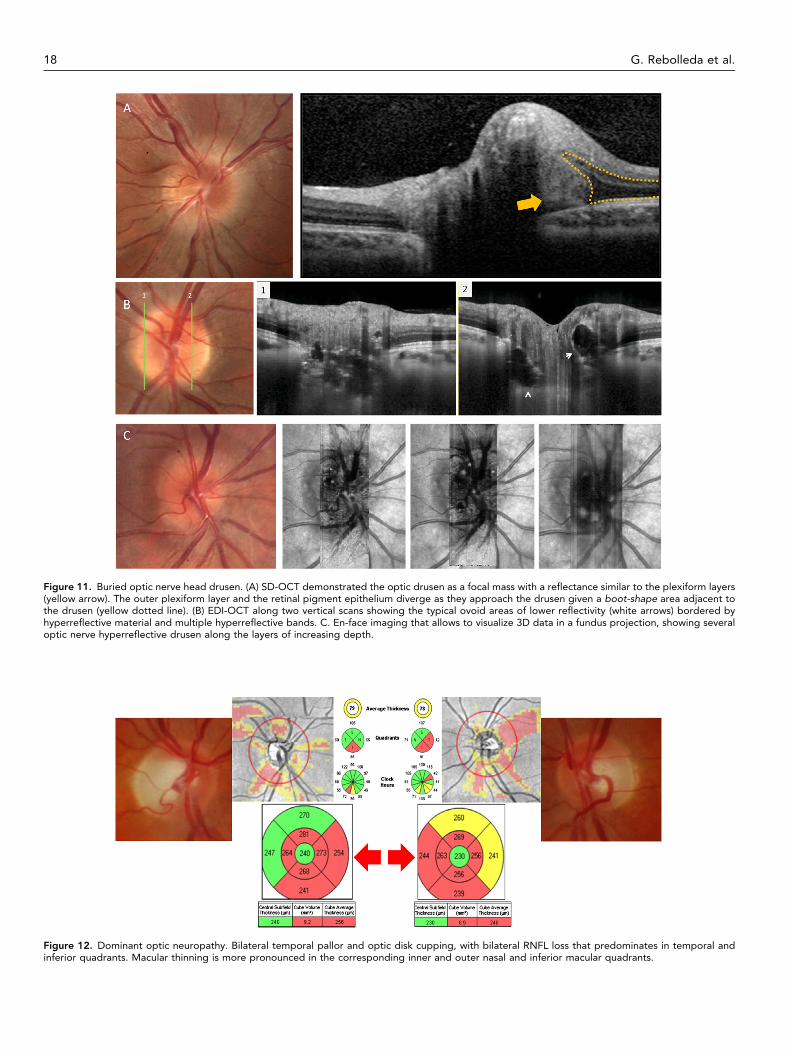
Figure 11. Buried optic nerve head drusen. (A) SD-OCT demonstrated the optic drusen as a focal mass with a reflectance similar to the plexiform layers(yellow arrow). The outer plexiform layer and the retinal pigment epithelium diverge as they approach the drusen given a boot-shape area adjacent tothe drusen (yellow dotted line). (B) EDI-OCT along two vertical scans showing the typical ovoid areas of lower reflectivity (white arrows) bordered byhyperreflective material and multiple hyperreflective bands. C. En-face imaging that allows to visualize 3D data in a fundus projection, showing severaloptic nerve hyperreflective drusen along the layers of increasing depth.
Figure 12. Dominant optic neuropathy. Bilateral temporal pallor and optic disk cupping, with bilateral RNFL loss that predominates in temporal andinferior quadrants. Macular thinning is more pronounced in the corresponding inner and outer nasal and inferior macular quadrants.
18 G. Rebolleda et al.
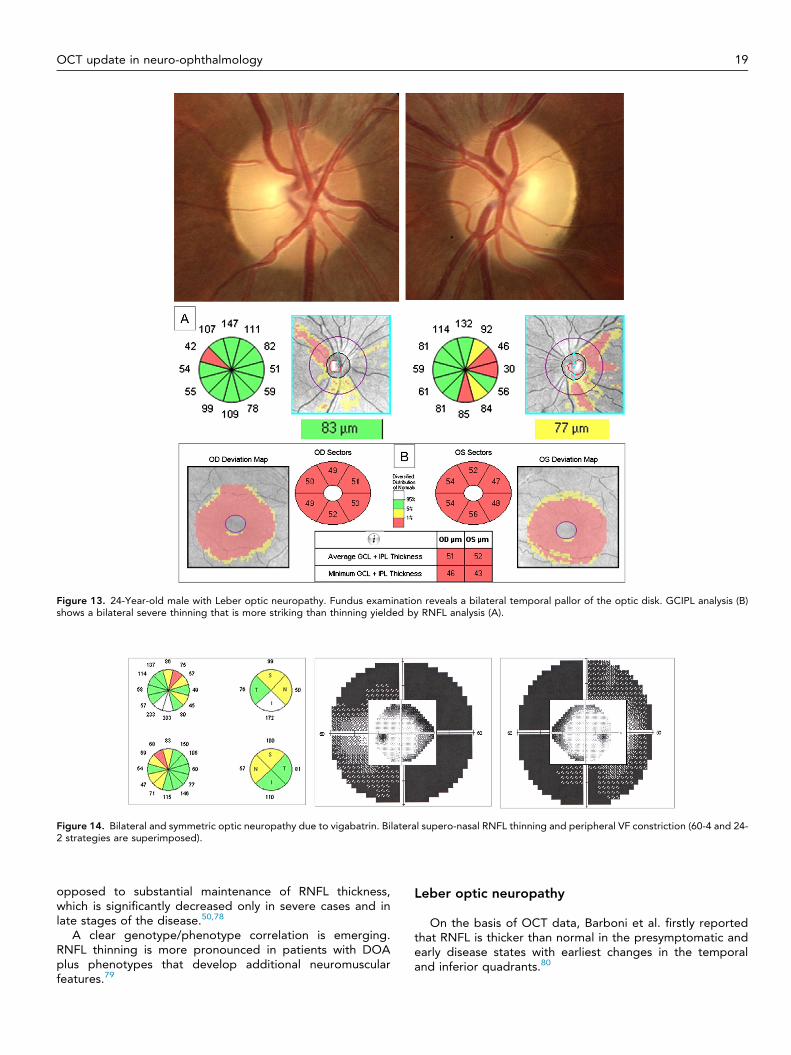
Figure 13. 24-Year-old male with Leber optic neuropathy. Fundus examination reveals a bilateral temporal pallor of the optic disk. GCIPL analysis (B)shows a bilateral severe thinning that is more striking than thinning yielded by RNFL analysis (A).
Figure 14. Bilateral and symmetric optic neuropathy due to vigabatrin. Bilateral supero-nasal RNFL thinning and peripheral VF constriction (60-4 and 24-2 strategies are superimposed).
OCT update in neuro-ophthalmology 19
opposed to substantial maintenance of RNFL thickness,which is significantly decreased only in severe cases and inlate stages of the disease.50,78
A clear genotype/phenotype correlation is emerging.RNFL thinning is more pronounced in patients with DOAplus phenotypes that develop additional neuromuscularfeatures.79
Leber optic neuropathy
On the basis of OCT data, Barboni et al. firstly reportedthat RNFL is thicker than normal in the presymptomatic andearly disease states with earliest changes in the temporaland inferior quadrants.80
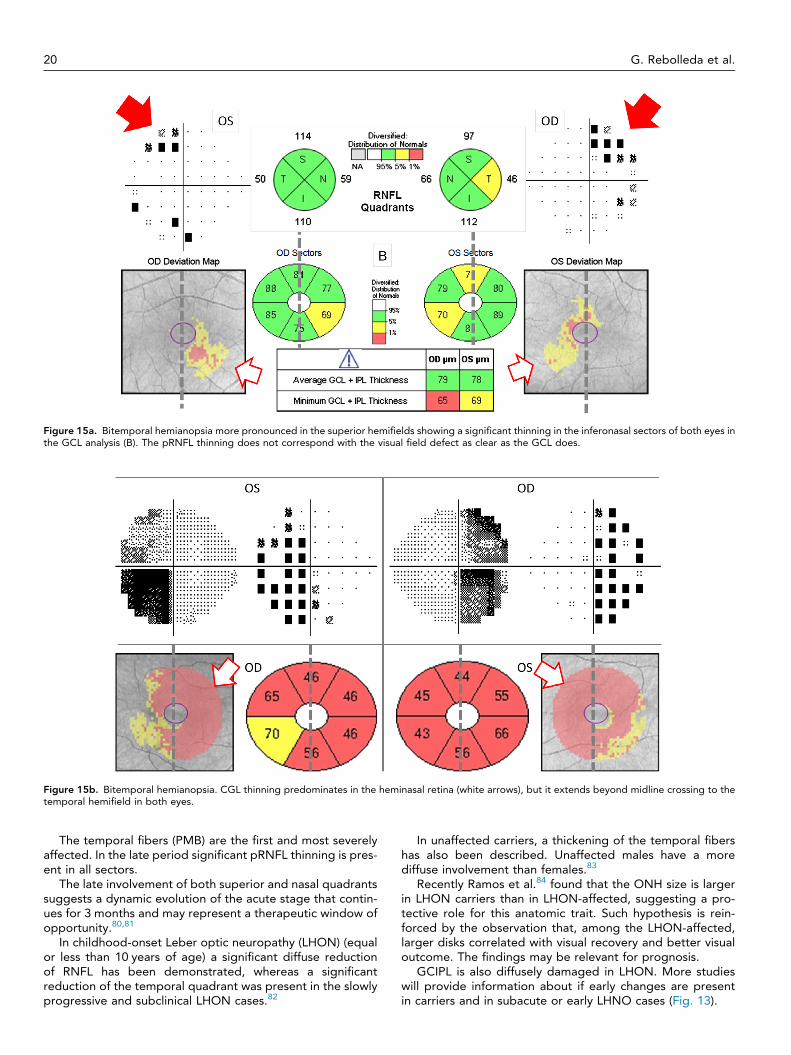
Figure 15a. Bitemporal hemianopsia more pronounced in the superior hemifields showing a significant thinning in the inferonasal sectors of both eyes inthe GCL analysis (B). The pRNFL thinning does not correspond with the visual field defect as clear as the GCL does.
Figure 15b. Bitemporal hemianopsia. CGL thinning predominates in the heminasal retina (white arrows), but it extends beyond midline crossing to thetemporal hemifield in both eyes.
20 G. Rebolleda et al.
The temporal fibers (PMB) are the first and most severelyaffected. In the late period significant pRNFL thinning is pres-ent in all sectors.
The late involvement of both superior and nasal quadrantssuggests a dynamic evolution of the acute stage that contin-ues for 3 months and may represent a therapeutic window ofopportunity.80,81
In childhood-onset Leber optic neuropathy (LHON) (equalor less than 10 years of age) a significant diffuse reductionof RNFL has been demonstrated, whereas a significantreduction of the temporal quadrant was present in the slowlyprogressive and subclinical LHON cases.82
In unaffected carriers, a thickening of the temporal fibershas also been described. Unaffected males have a morediffuse involvement than females.83
Recently Ramos et al.84 found that the ONH size is largerin LHON carriers than in LHON-affected, suggesting a pro-tective role for this anatomic trait. Such hypothesis is rein-forced by the observation that, among the LHON-affected,larger disks correlated with visual recovery and better visualoutcome. The findings may be relevant for prognosis.
GCIPL is also diffusely damaged in LHON. More studieswill provide information about if early changes are presentin carriers and in subacute or early LHNO cases (Fig. 13).
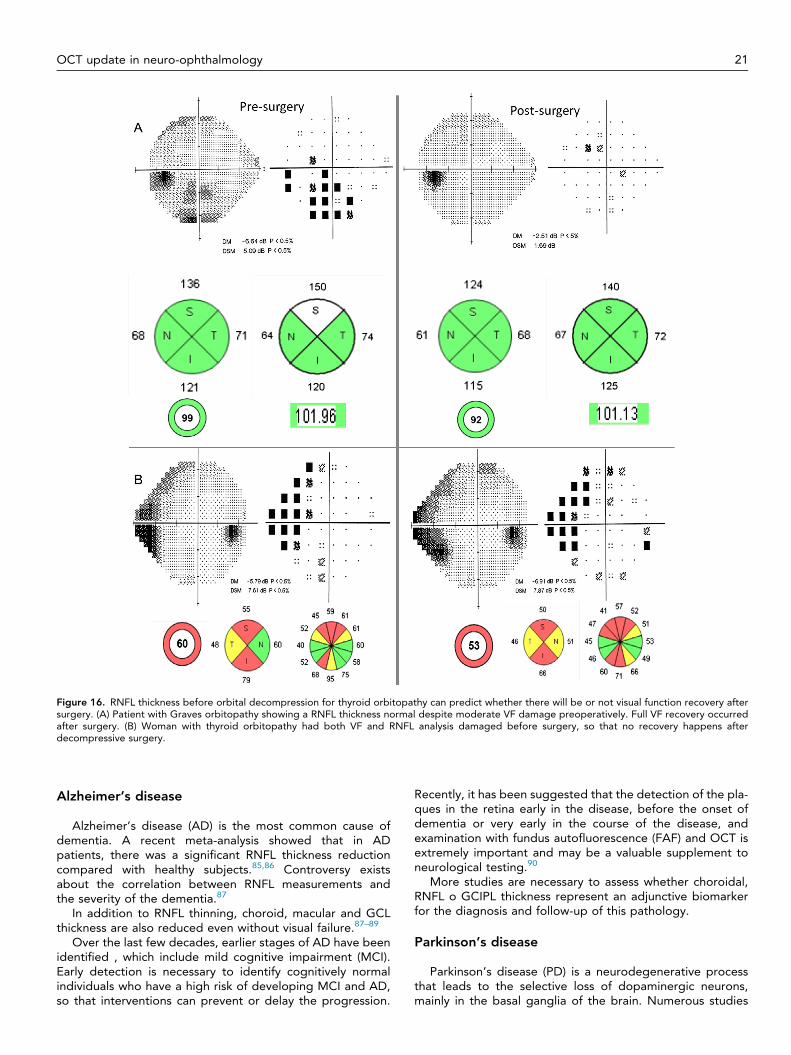
Figure 16. RNFL thickness before orbital decompression for thyroid orbitopathy can predict whether there will be or not visual function recovery aftersurgery. (A) Patient with Graves orbitopathy showing a RNFL thickness normal despite moderate VF damage preoperatively. Full VF recovery occurredafter surgery. (B) Woman with thyroid orbitopathy had both VF and RNFL analysis damaged before surgery, so that no recovery happens afterdecompressive surgery.
OCT update in neuro-ophthalmology 21
Alzheimer’s disease
Alzheimer’s disease (AD) is the most common cause ofdementia. A recent meta-analysis showed that in ADpatients, there was a significant RNFL thickness reductioncompared with healthy subjects.85,86 Controversy existsabout the correlation between RNFL measurements andthe severity of the dementia.87
In addition to RNFL thinning, choroid, macular and GCLthickness are also reduced even without visual failure.87–89
Over the last few decades, earlier stages of AD have beenidentified , which include mild cognitive impairment (MCI).Early detection is necessary to identify cognitively normalindividuals who have a high risk of developing MCI and AD,so that interventions can prevent or delay the progression.
Recently, it has been suggested that the detection of the pla-ques in the retina early in the disease, before the onset ofdementia or very early in the course of the disease, andexamination with fundus autofluorescence (FAF) and OCT isextremely important and may be a valuable supplement toneurological testing.90
More studies are necessary to assess whether choroidal,RNFL o GCIPL thickness represent an adjunctive biomarkerfor the diagnosis and follow-up of this pathology.
Parkinson’s disease
Parkinson’s disease (PD) is a neurodegenerative processthat leads to the selective loss of dopaminergic neurons,mainly in the basal ganglia of the brain. Numerous studies
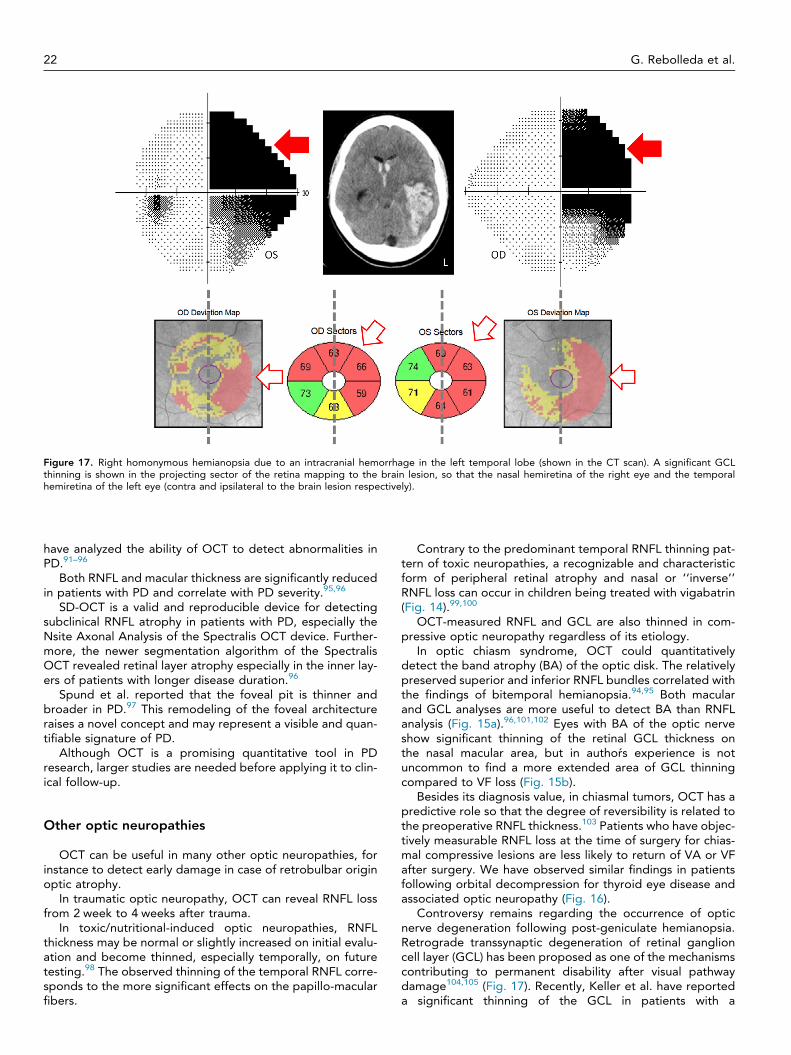
Figure 17. Right homonymous hemianopsia due to an intracranial hemorrhage in the left temporal lobe (shown in the CT scan). A significant GCLthinning is shown in the projecting sector of the retina mapping to the brain lesion, so that the nasal hemiretina of the right eye and the temporalhemiretina of the left eye (contra and ipsilateral to the brain lesion respectively).
22 G. Rebolleda et al.
have analyzed the ability of OCT to detect abnormalities inPD.91–96
Both RNFL and macular thickness are significantly reducedin patients with PD and correlate with PD severity.95,96
SD-OCT is a valid and reproducible device for detectingsubclinical RNFL atrophy in patients with PD, especially theNsite Axonal Analysis of the Spectralis OCT device. Further-more, the newer segmentation algorithm of the SpectralisOCT revealed retinal layer atrophy especially in the inner lay-ers of patients with longer disease duration.96
Spund et al. reported that the foveal pit is thinner andbroader in PD.97 This remodeling of the foveal architectureraises a novel concept and may represent a visible and quan-tifiable signature of PD.
Although OCT is a promising quantitative tool in PDresearch, larger studies are needed before applying it to clin-ical follow-up.
Other optic neuropathies
OCT can be useful in many other optic neuropathies, forinstance to detect early damage in case of retrobulbar originoptic atrophy.
In traumatic optic neuropathy, OCT can reveal RNFL lossfrom 2 week to 4 weeks after trauma.
In toxic/nutritional-induced optic neuropathies, RNFLthickness may be normal or slightly increased on initial evalu-ation and become thinned, especially temporally, on futuretesting.98 The observed thinning of the temporal RNFL corre-sponds to the more significant effects on the papillo-macularfibers.
Contrary to the predominant temporal RNFL thinning pat-tern of toxic neuropathies, a recognizable and characteristicform of peripheral retinal atrophy and nasal or ‘‘inverse’’RNFL loss can occur in children being treated with vigabatrin(Fig. 14).99,100
OCT-measured RNFL and GCL are also thinned in com-pressive optic neuropathy regardless of its etiology.
In optic chiasm syndrome, OCT could quantitativelydetect the band atrophy (BA) of the optic disk. The relativelypreserved superior and inferior RNFL bundles correlated withthe findings of bitemporal hemianopsia.94,95 Both macularand GCL analyses are more useful to detect BA than RNFLanalysis (Fig. 15a).96,101,102 Eyes with BA of the optic nerveshow significant thinning of the retinal GCL thickness onthe nasal macular area, but in authors experience is notuncommon to find a more extended area of GCL thinningcompared to VF loss (Fig. 15b).
Besides its diagnosis value, in chiasmal tumors, OCT has apredictive role so that the degree of reversibility is related tothe preoperative RNFL thickness.103 Patients who have objec-tively measurable RNFL loss at the time of surgery for chias-mal compressive lesions are less likely to return of VA or VFafter surgery. We have observed similar findings in patientsfollowing orbital decompression for thyroid eye disease andassociated optic neuropathy (Fig. 16).
Controversy remains regarding the occurrence of opticnerve degeneration following post-geniculate hemianopsia.Retrograde transsynaptic degeneration of retinal ganglioncell layer (GCL) has been proposed as one of the mechanismscontributing to permanent disability after visual pathwaydamage104,105 (Fig. 17). Recently, Keller et al. have reporteda significant thinning of the GCL in patients with a
OCT update in neuro-ophthalmology 23
retrogeniculate lesion.105 The correlation between VF defectand GCL thickness was stronger than that observed betweenVF and pRNFL, probably because at the macula the neuronbodies are topographically organized to correspond to theVF.
These findings provide new insights regarding transsynap-tic degeneration of the visual system, supporting the use ofGCL thickness as in imaging marker after brain lesions.
Emerging applications and future direction of OCT
Advancements in OCT technology continue to evolve at aquick step. The acquisition of scans is much faster in sweptsource OCT (SS-OCT) when compared with the SD-OCTand it is very useful for adequate analysis of choroidal thick-ness and volume in healthy and diseased states.
The commercialization of mobile SD-OCT systems mayexpand the application spectrum to analyze subjects mani-festing significant deteriorated motion, including adult andpediatric patients groups. In fact, hand-held OCT (HH-OCT)has already been used to quantify pRNFL thickness in chil-dren with optic pathway gliomas showing a close relationshipto visual function.
New emerging functional SD-OCT imaging modalitiessuch as Doppler-SD for blood-flow Imaging and Polariza-tion-Sensitive OCT had a wide spectrum of potential diag-nostic applications.
As advanced super-luminescent diodes and femtolasertechnologies have become cheaper, commercial ultra-highResolution OCT machines (approximating 2–3 lm of resolu-tion) will emerge as options to consider.106
OCT technology is changing very quickly and throughoutthis review there are only some of the multiple possibilitiesthat will emerge in the next future in the field of Neuro-ophthalmology.
Conflict of interest
The authors declared that there is no conflict of interest.
References
1. Parisi V, Manni G, Spadaro M, Colacino G, Restuccia R, Marchi S,et al. Correlation between morphological and functional retinalimpairment in multiple sclerosis patients. Invest Ophthalmol Vis Sci1999;40:2520–7.
2. Galetta KM, Calabresi PA, Frohman EM, Balcer LJ. Opticalcoherence tomography (OCT): imaging the visual pathway as amodel for neurodegeneration. Neurotherapeutics 2011;8:117–32.
3. Noval S, Contreras I, Muñoz S, Oreja-Guevara C, Manzano B,Rebolleda G. Optical coherence tomography in multiple sclerosisand neuromyelitis optica: an update. Mult Scler Int 2011;2011:472790.
4. Petzold A, de Boer JF, Schippling S, Vermersch P, Kardon R, FreenA, et al. Optical coherence tomography in multiple sclerosis: asystematic review and meta-analysis. Lancet Neurol 2010;9:921–32.
5. Rebolleda G, González-López JJ, Muñoz-Negrete FJ, Oblanca N,Costa-Frossard L, Álvarez-Cermeño JC. Color-code agreementamong stratus, cirrus, and spectralis optical coherencetomography in relapsing-remitting multiple sclerosis with andwithout prior optic neuritis. Am J Ophthalmol 2013;155:890–7.
6. Noval S, Contreras I, Rebolleda G, Muñoz-Negrete FJ. Opticalcoherence tomography in optic neuritis. Ophthalmology 2007;114:200.
7. Noval S, Contreras I, Rebolleda G, Muñoz-Negrete FJ. Opticalcoherence tomography versus automated perimetry for follow-up ofoptic neuritis. Acta Ophthalmol Scand 2006;84:90–794.
8. Rebolleda G, Noval S, Contreras I, Arnalich-Montiel F, García-PerezFJ, Muñoz-Negrete FJ. Optic disc cupping after optic neuritisevaluated with optic coherence tomography. Eye (Lond) 2009;23:890–4.
9. Fisher JB, Jacobs DA, Markowitz CE, Galetta SL, Volpe NJ, et al.Relation of visual function to retinal nerve fiber layer thickness inmultiple sclerosis. Ophthalmology 2006;113:324–32.
10. Scheel M, Finke C, Oberwahrenbrock T, Freing A, Pech LM,Schlichting J, et al. Retinal nerve fibre layer thickness correlateswith brain white matter damage in multiple sclerosis: A combinedoptical coherence tomography and diffusion tensor imaging study.Mult Scler 2014 [Epub ahead of print].
11. Fjeldstad C, Bemben M, Pardo G. Reduced retinal nerve fiber layerand macular thickness in patients with multiple sclerosis with nohistory of optic neuritis identified by the use of spectral domainhigh-definition optical coherence tomography. J Clin Neurosci2011;18:1469–72.
12. Garcia-Martin E, Pueyo V, Pinilla I, Ara JR, Martin J, Fernández J.Fourier-domain OCT in multiple sclerosis patients: reproducibilityand ability to detect retinal nerve fiber layer atrophy. InvestOphthalmol Vis Sci 2011;52:4124–31.
13. Rebolleda G, García-García A, Won Kim HR, Muñoz-Negrete FJ.Comparison of retinal nerve fiber layer measured by time domainand spectral domain optical coherence tomography in optic neuritis.Eye 2011;25:233–8.
14. Leal-Fonseca M, Rebolleda G, Oblanca N, Moreno-Montañes J,Muñoz-Negrete FJ. A comparison of false positives in retinal nervefiber layer, optic nerve head and macular ganglion cell-inner plexi-form layer from two spectral-domain optical coherence tomog-raphy devices. Graefes Arch Clin Exp Ophthalmol 2014;252:321–30.
15. Walter SD, Ishikawa H, Galetta KM, Sakai RE, Feller DJ, HendersonSB, et al. Ganglion cell loss in relation to visual disability in multiplesclerosis. Ophthalmology 2012;119:1250–7.
16. Saidha S, Sotirchos ES, Oh J, Syc SB, Seigo MA, Shiee N, et al.Relationships between retinal axonal and neuronal measures andglobal central nervous system pathology in multiple sclerosis. JAMANeurol 2013;70:34–43.
17. Albrecht P, Ringelstein M, Müller AK, Keser N, Dietlein T, Lappas A,et al. Degeneration of retinal layers in multiple sclerosis subtypesquantified by optical coherence tomography. Mult Scler 2012;18:1422–9.
18. Saidha S, Syc SB, Durbin MK, Eckstein C, Oakley JD, Meyer SA, et al.Visual dysfunction in multiple sclerosis correlates better with opticalcoherence tomography derived estimates of macular ganglion celllayer thickness than peripapillary retinal nerve fiber layer thickness.Mult Scler 2011;17:1449–63.
19. Garcia-Martin E, Polo V, Larrosa JM, Marques ML, Herrero R, MartinJ, et al. Retinal layer segmentation in patients with multiple sclerosisusing spectral domain optical coherence tomography.Ophthalmology 2014;121:573–9.
20. Gonzalez JJ, Rebolleda G, Leal M, Oblanca N, Muñoz-Negrete FJ,Costa-Frossard L, Alvarez-Cermeño JC. Comparative diagnosticaccuracy of ganglion cell-inner plexiform and retinal nerve fiber layerthickness measures by Cirrus and Spectralis OCTs in relapsing-remitting multiple sclerosis. Biomed Res Int 2014; in press.
21. Syc SB, Saidha S, Newsome SD, Ratchford JN, Levy M, Ford E, et al.Optical coherence tomography segmentation reveals ganglion celllayer pathology after optic neuritis. Brain 2012;135:521–33.
22. Sotirchos ES, Seigo MA, Calabresi PA, Saidha S. Comparison ofpoint estimates and average thicknesses of retinal layers measuredusing manual optical coherence tomography segmentation forquantification of retinal neurodegeneration in multiple sclerosis.Curr Eye Res 2013;38:224–8.
23. Costello F, Hodge W, Pan YI, Eggenberger E, Coupland S, KardonRH. Tracking retinal nerve fiber layer loss after optic neuritis: aprospective study using optical coherence tomography. Mult Scler2008;14:893–905.
24. Costello F, Coupland S, Hodge W, et al. Quantifying axonal lossafter optic neuritis with optical coherence tomography. Ann Neurol2006;59:963–9.
25. Narayanan D, Cheng H, Bonem KN, Saenz R, Tang RA, Frishman LJ.Tracking changes over time in retinal nerve fiber layer and ganglion
24 G. Rebolleda et al.
cell-inner plexiform layer thickness in multiple sclerosis. Mult Scler2014 Epub ahead of print.
26. Garcia-Martin E, Pueyo V, Martin J, Almarcegui C, Ara JR, Dolz I,et al. Progressive changes in the retinal nerve fiber layer in patientswith multiple sclerosis. Eur J Ophthalmol 2010;20:167–73.
27. Ratchford JN, Saidha S, Sotirchos ES, Oh JA, Seigo MA, Eckstein E,et al. Active MS is associated with accelerated retinal ganglion cell/inner plexiform layer thinning. Neurology 2013;80:47–54.
28. Zarbin MA, Jampol LM, Jager RD, Reder AT, Francis G, Collins W,et al. Ophthalmic evaluations in clinical studies of fingolimod(FTY720) in multiple sclerosis. Ophthalmology 2013;120:1432–9.
29. Gelfand JM, Nolan R, Schwartz DM, Graves J, Green AJ. Microcysticmacular oedema in multiple sclerosis is associated with diseaseseverity. Brain 2012;135(Pt 6):1786–93.
30. Saidha S, Sotirchos ES, Ibrahim MA, Crainiceanu CM, Gelfand JM,Sepah YJ, et al. Microcystic macular oedema, thickness of the innernuclear layer of the retina, and disease characteristics in multiplesclerosis: a retrospective study. Lancet Neurol 2012;11:963–72.
31. Abegg M, Dysli M, Wolf S, Kowal J, Dufour P, Zinkernagel M.Microcystic macular edema: Retrograde maculopathy caused byoptic neuropathy. Ophthalmology 2014;121:142–9.
32. Pulicken M, Gordon-Lipkin E, Balcer LJ, Frohman E, Cutter G,Calabresi PA. Optical coherence tomography and disease subtypein multiple sclerosis. Neurology 2007;69:2085–92.
33. Monteiro ML, Fernandes DB, Apóstolos-Pereira SL, Callegaro D.Quantification of retinal neural loss in patients with neuromyelitisoptica and multiple sclerosis with or without optic neuritis usingFourier-domain optical coherence tomography. Invest OphthalmolVis Sci 2012;26(53):3959–66.
34. Naismith RT, Tutlam NT, Xu J, Klawiter EC, Shepherd J, Trinkaus K,et al. Optical coherence tomography differs in neuromyelitis opticacompared with multiple sclerosis. Neurology 2009;72:1077–82.
35. Ratchford JN, Quigg ME, Conger A, Frohman T, Frohman E, BalcerLJ, et al. Optical coherence tomography helps differentiateneuromyelitis optica and MS optic neuropathies. Neurology2009;73:302–8.
36. Schneider E, Zimmermann H, Oberwahrenbrock T, Kaufhold F,Kadas EM, Petzold A, et al. Optical coherence tomography revealsdistinct patterns of retinal damage in neuromyelitis optica andmultiple sclerosis. PLoS One 2013;8(6):e66151.
37. Fernandes DB, Raza AS, Nogueira RG, Wang D, Callegaro D, HoodDC, et al. Evaluation of inner retinal layers in patients with multiplesclerosis or neuromyelitis optica using optical coherencetomography. Ophthalmology 2013;120:387–94.
38. Costello F, Pan YI, Burton J, Chan W, Hodge W. Predicting visualrecovery after optic neuritis. In: 40th NANOS (North AmericanNeuro-Ophthalmology Society) meeting, Rio Grande, Puerto Rico,USA: Annual Meeting Syllabus; 2014. p. 319.
39. Garas A, Simó M, Holló G. Nerve fiber layer and macular thinningmeasured with different imaging methods during the course ofacute optic neuritis. Eur J Ophthalmol 2011;21:473–83.
40. Rebolleda G, de Dompablo E, Muñoz-Negrete J. Ganglion cell layeranalysis unmasks axonal loss in anterior optic neuritis. JNeurophthalmol 2014; in press.
41. Saidha S, Syc SB, Ibrahim MA, Eckstein C, Warner CV, Farrell SK,et al. Primary retinal pathology in multiple sclerosis as detected byoptical coherence tomography. Brain 2011;134:518–33.
42. Wang X, Jia Y, Spain R, Potsaid B, Liu JJ, Baumann B, et al. Opticalcoherence tomography angiography of optic nerve head andparafovea in multiple sclerosis. Br J Ophthalmol 2014.
43. Farsiu S, Izatt JA, Toth CA. Advances and emerging applications ofspectral-domain. Optical coherence tomography imaging inophthalmology. US Ophthalmic Rev 2007;3:14–7.
44. Contreras I, Noval S, Rebolleda G, Muñoz-Negrete FJ. Follow-up ofnonarteritic anterior ischemic optic neuropathy with opticalcoherence tomography. Ophthalmology 2007;114:2338–44.
45. Kernstock C, Beisse F, Wiethoff S, Mast A, Krapp E, Grund R, et al.Assessment of functional and morphometric endpoints in patientswith non-arteritic anterior ischemic optic neuropathy (NAION).Graefes Arch Clin Exp Ophthalmol 2014;252:515–21.
46. Dotan G, Goldstein M, Kesler A, Skarf B. Long-term retinal nervefiber layer changes following nonarteritic anterior ischemic opticneuropathy. Clin Ophthalmol 2013;7:735–40.
47. Contreras I, Rebolleda G, Noval S, et al. Optic disc evaluation byoptical coherence tomography in nonarteritic anterior ischemicoptic neuropathy. Invest Ophthalmol Vis Sci 2007;48:4087–92.
48. Contreras I, Rebolleda G, Noval S, Muñoz-Negrete FJ. Ischemicoptic neuropathy. Ophthalmology 2009;116:814.
49. Fernández-Buenaga R, Rebolleda G, Muñoz-Negrete FJ, ContrerasP, Casas-Llera P. Macular thickness. Ophthalmology 2009;116:1587.
50. Rönnbäck C, Milea D, Larsen M. Imaging of the macula indicatesearly completion of structural deficit in autosomal-dominant opticatrophy. Ophthalmology 2013;120:2672–7.
51. Bellusci C, Savini G, Carbonelli M, Carelli V, Sadun AA, BarboniP. Retinal nerve fiber layer thickness in nonarteritic anteriorischemic optic neuropathy: OCT characterization of the acuteand resolving phases. Graefes Arch Clin Exp Ophthalmol2008;246:641–7.
52. Papchenko T, Grainger BT, Savino PJ, Gamble GD, Danesh-MeyerHV. Macular thickness predictive of visual field sensitivity inischaemic optic neuropathy. Acta Ophthalmol 2012;90:463–9.
53. Gonul S, Koktekir BE, Bakbak B, Gedik S. Comparison of theganglion cell complex and retinal nerve fibre layer measurementsusing Fourier domain optical coherence tomography to detectganglion cell loss in non-arteritic anterior ischaemic opticneuropathy. Br J Ophthalmol 2013;97:1045–50.
54. Hedges 3rd TR, Vuong LN, Gonzalez-Garcia AO, Mendoza-Santiesteban CE, Amaro-Quierza ML. Subretinal fluid fromanterior ischemic optic neuropathy demonstrated by opticalcoherence tomography. Arch Ophthalmol 2008;126:812–5.
55. Rebolleda G, Pérez-López M, Casas-LLera P, Contreras I, Muñoz-Negrete FJ. Visual and anatomical outcomes of non-arteriticanterior ischemic optic neuropathy with high-dose systemiccorticosteroids. Graefes Arch Clin Exp Ophthalmol 2013;251:255–60.
56. Rebolleda G, Muñoz-Negrete FJ. Follow-up of mild papilledema inidiopathic intracranial hypertension with optical coherencetomography. Invest Ophthalmol Vis Sci 2009;50:5197–200.
57. Scott CJ, Kardon RH, Lee AG, Frisén L, Wall M. Diagnosis andgrading of papilledema in patients with raised intracranialpressure using optical coherence tomography vs clinical expertassessment using a clinical staging scale. Arch Ophthalmol2010;128:705–11.
58. Wang JK, Kardon RH, Kupersmith MJ, Garvin MK. Automatedquantification of volumetric optic disc swelling in papilledema usingspectral-domain optical coherence tomography. Invest OphthalmolVis Sci 2012;53:4069–75.
59. NORDIC Idiopathic Intracranial Hypertension Study Group. Theidiopathic intracranial hypertension treatment trial: clinical profile atbaseline. JAMA Neurol 2014;71:693–701.
60. Dattilo M, Olumba K, Elmalem VI. Macular outer retinalabnormalities in severe papilledema. In: 40th NANOS (NorthAmerican Neuro-Ophthalmology Society) meeting, Rio Grande,Puerto Rico, USA: Annual Meeting Syllabus; 2014. p. 307.
61. Sibony P, Kupersmith M, Rohlf FJ. Geometric morphometrics of theperipapillary SD-OCT: Shape analysis of the RPE layer inpapilledema and ischemic optic neuropathy. Invest Ophthalmol VisSci 2011;52:7987–95.
62. Kupersmith M, Sibony P, Mandel G, Durbin M, Kardon R. Opticalcoherence tomography of the swollen optic nerve head:deformation of the peripapillary RPE layer in papilledema. InvOphthalmol Vis Sci 2011;52:6558–64.
63. Jia Y, Morrison JC, Tokayer J, Tan O, Lombardi L, Baumann B, et al.Quantitative OCT angiography of optic nerve head blood flow.Biomed Opt Express 2012;3:3127–37.
64. Gili P, Flores-Rodríguez P, Martin-Ríos MD, Carrasco Font C.Anatomical and functional impairment of the nerve fiber layer inpatients with optic nerve head drusen. Graefes Arch Clin ExpOphthalmol 2013;251:2421–8.
65. Noval S, Visa J, Contreras I. Visual field defects due to optic diskdrusen in children. Graefes Arch Clin Exp Ophthalmol2013;251:2445–50.
66. Roh S, Noecker RJ, Schuman JS, Hedges 3rd TR, Weiter JJ, MattoxC. Effect of optic nerve head drusen on nerve fiber layer thickness.Ophthalmology 1998;105:878–85.
67. Casado A, Rebolleda G, Guerrero L, Leal M, Contreras I, Oblanca N,Muñoz-Negrete FJ. Measurement of retinal nerve fiber layer andmacular ganglion cell-inner plexiform layer with spectral-domainoptical coherence tomography in patients with optic nerve headdrusen. Graefes Arch Clin Exp Ophthalmol 2014; [Epub ahead ofprint].
OCT update in neuro-ophthalmology 25
68. Johnson LN, Diehl ML, Hamm CW, Sommerville DN, Petroski GF.Differentiating optic disc edema from optic nerve head drusen onoptical coherence tomography. Arch Ophthalmol 2009;127:45–9.
69. Flores-Rodríguez P, Gili P, Martín-Ríos MD. Sensitivity andspecificity of time-domain and spectral-domain optical coherencetomography in differentiating optic nerve head drusen and opticdisc oedema. Ophthalmic Physiol Opt 2012;32:213–21.
70. Kulkarni KM, Pasol J, Rosa PR, Lam BL. Differentiating mildpapilledema and buried optic nerve head drusen using spectraldomain optical coherence tomography. Ophthalmology 2014;121:959–63.
71. Lee KM, Woo SJ, Hwang JM. Differentiation of optic nerve headdrusen and optic disc edema with spectral-domain opticalcoherence tomography. Ophthalmology 2011;118:971–7.
72. Sato T, Mrejen S, Spaide RF. Multimodal imaging of optic discdrusen. Am J Ophthalmol 2013;156:275–82.
73. Merchant KY, Su D, Park SC, Qayum S, Banik R, Liebmann JM, et al.Enhanced depth imaging optical coherence tomography of opticnerve head drusen. Ophthalmology 2013;120:1409–14.
74. Kim TW, Hwang JM. Stratus OCT in dominant optic atrophy:features differentiating it from glaucoma. J Glaucoma 2007;16:655–8.
75. Yu-Wai-Man P, Bailie M, Atawan A, Chinnery PF, Griffiths PG.Pattern of retinal ganglion cell loss in dominant optic atrophy due toOPA1 mutations. Eye 2011;25:596–602.
76. Russo A, Delcassi L, Marchina E, Semeraro F. Correlation betweenvisual acuity and OCT-measured retinal nerve fiber layer thickness ina family with ADOA and an OPA1 mutation. Ophthalmic Genet2013;34:69–74.
77. Barboni P, Carbonelli M, Savini G, Foscarini B, Parisi V, ValentinoML. OPA1 mutations associated with dominant optic atrophyinfluence optic nerve head size. Ophthalmology 2010;117:1547–53.
78. Barboni P, Savini G, Parisi V, Carbonelli M, La Morgia C, Maresca A,et al. Retinal nerve fiber layer thickness in dominant optic atrophymeasurements by optical coherence tomography and correlationwith age. Ophthalmology 2011;118:2076–80.
79. Barboni P, Savini G, Cascavilla ML, Caporali L, Milesi J, Borrelli E,et al. Early macular retinal ganglion cell loss in dominant opticatrophy: genotype-phenotype correlation. Am J Ophthalmol 2014Epub ahead of print.
80. Barboni P, Savini G, Valentino ML, Montagna P, Cortelli P, De NegriAM, et al. Retinal nerve fiber layer evaluation by optical coherencetomography in Leber’s hereditary optic neuropathy. Ophthalmology2005;112:120–6.
81. Barboni P, Carbonelli M, Savini G, Ramos Cdo V, Carta A,Berezovsky A, et al. Natural history of Leber’s hereditary opticneuropathy: longitudinal analysis of the retinal nerve fiber layer byoptical coherence tomography. Ophthalmology 2010;117:623–7.
82. Barboni P, Savini G, Valentino ML, La Morgia C, Bellusci C, De NegriAM. Leber’s hereditary optic neuropathy with childhood onset.Invest Ophthalmol Vis Sci 2006;47:5303–9.
83. Savini G, Barboni P, Valentino ML, Montagna P, Cortelli P, De NegriAM. Retinal nerve fiber layer evaluation by optical coherencetomography in unaffected carriers with Leber’s hereditary opticneuropathy mutations. Ophthalmology 2005;112:127–31.
84. Ramos Cdo V, Bellusci C, Savini G, Carbonelli M, Berezovsky A,Tamaki C. Association of optic disc size with development andprognosis of Leber’s hereditary optic neuropathy. InvestOphthalmol Vis Sci 2009;50:1666–74.
85. He XF, Liu YT, Peng C, Zhang F, Zhuang S, Zhang JS. Opticalcoherence tomography assessed retinal nerve fiber layer thicknessin patients with Alzheimer’s disease: a meta-analysis. Int JOphthalmol 2012;5:401–5.
86. Larrosa JM, Garcia-Martin E, Bambo MP, Pinilla J, Polo V, Otin S,et al. Potential new diagnostic tool for Alzheimer’s disease using alinear discriminant function for Fourier domain optical coherencetomography. Invest Ophthalmol Vis Sci 2014;55:3043–51.
87. Gharbiya M, Trebbastoni A, Parisi F, Manganiello S, Cruciani F,D’Antonio F, et al. Choroidal thinning as a new finding inAlzheimer’s disease: evidence from enhanced depth imagingspectral domain optical coherence tomography. J Alzheimer’s Dis2014;40:907–17.
88. Marziani E, Pomati S, Ramolfo P, Cigada M, Giani A, Mariani C, et al.Evaluation of retinal nerve fiber layer and ganglion cell layerthickness in Alzheimer’s disease using spectral-domain opticalcoherence tomography. Invest Ophthalmol Vis Sci 2013;54:5953–8.
89. Moschos MM, Markopoulos I, Chatziralli I, Rouvas A, PapageorgiouI, Ladas I, et al. Structural and functional impairment of the retinaand optic nerve in Alzheimer’s disease. Curr Alzheimer Res2012;9:782–8.
90. Sergott RC, Kayabasi U. Progression of plaques in retina withdementia in Alzheimers disease. In: 40th NANOS (North AmericanNeuro-Ophthalmology Society) meeting, Rio Grande, Puerto Rico,USA: Annual Meeting Syllabus; 2014. p. 148.
91. Inzelber R, Ramirez JA, Nisipeanu P, Ophir A. Retinal nerve fiberlayer thinning in Parkinson disease. Vision Res 2004;44:2793–7.
92. Kirbas S, Turkyilmaz K, Tufekci A, Durmus M. Retinal nerve fiberlayer in parkinson disease. J Neuroophthalmol 2013;33:62–5.
93. Garcia-Martin E, Satue M, Fuertes I, Otin S, Alarcia R, Herrero R,et al. Ability and reproducibility of Fourier-domain Opticalcoherence tomography to detect retinal nerve fiber layer atrophyin Parkinson’s disease. Ophthalmology 2012;119:2161–7.
94. Yu JG, Feng YF, Xiang Y, Huang JH, Savini G, Parisi V, et al. Retinalnerve fiber layer thickness changes in Parkinson disease: a meta-analysis. PLoS One 2014;9(1):e85718.
95. Satue M, Seral M, Otin S, Alarcia R, Herrero R, Bambo MP, et al.Retinal thinning and correlation with functional disability in patientswith Parkinson’s disease. Br J Ophthalmol 2014;98:350–5.
96. Garcia-Martin E, Larrosa JM, Polo V, Satue M, Marques ML, AlarciaR, et al. Distribution of retinal layer atrophy in patients withParkinson disease and association with disease severity andduration. Am J Ophthalmol 2014;157:470–8.
97. Spund B, Ding Y, Liu T, et al. Remodeling of the fovea in Parkinsondisease. J Neural Transm 2013;120:745–53.
98. Pasol J. Neuro-ophthalmic disease and optical coherence tomography:glaucoma look-alikes. Curr Opin Ophthalmol 2011;22:124–32.
99. Buncic JR, Westall CA, Panton CM, Munn JR, MacKeen LD, LoganWJ. Characteristic retinal atrophy with secondary ‘‘inverse’’ opticatrophy identifies vigabatrin toxicity in children. Ophthalmology2004;111:1935–42.
100. Rebolleda G, García Pérez JL, Muñoz Negrete FJ, Tang RA.Vigabatrin toxicity in children. Ophthalmology 2005;112:1322–3.
101. Costa-Cunha LV, Cunha LP, Malta RF, Monteiro ML. Comparison ofFourier domain and time-domain optical coherence tomography inthe detection of band atrophy of the optic nerve. Am J Ophthalmol2009;147:56–63.
102. Moura FC, Medeiros FA, Monteiro ML. Evaluation of macularthickness measurements for detection of band atrophy of the opticnerve using optical coherence tomography. Ophthalmology2007;114:175–81.
103. Danesh-Meyer HV, Papchenko T, Savino PJ, Law A, Evans J, GambleGD. In vivo retinal nerve fiber layer thickness measured by opticalcoherence tomography predicts visual recovery after surgery forparachiasmal tumors. Invest Ophthalmol Vis Sci 2008;49:1879–85.
104. Jindahra P, Petrie A, Plant GT. The time course of retrograde trans-synaptic degeneration following occipital lobe damage in humans.Brain 2012;135(Pt 2):534–41.
105. Keller J, Sánchez-Dalmau BF, Villoslada P. Lesions in the posteriorvisual pathway promote trans-synaptic degeneration of retinalganglion loss. PLoS One 2014;9(5):e97444.
106. Walsh AC. Next-generation OCT: what to look for in a Fourier domainOCT instrument. Retinal Physician 2007. Available from: http://www.retinalphysician.com/articleviewer.aspx?articleID=100302.