oceaneering international, inc. investor presentation annual ultimate energy conference december 1,...
TRANSCRIPT
5th Annual Ultimate Energy ConferenceDecember 1, 2015
New York, NY
Energy ConferenceNovember 11, 2015
Houston, TX
Oceaneering International, Inc.Investor Presentation
Safe Harbor Statement
Statements we make in this presentation that express a belief, expectation, or intention are forward looking. Forward looking statements are generally accompanied byForward-looking statements are generally accompanied by words such as “estimate,” “project,” “predict,” “believe,” “expect,” “anticipate,” “plan,” “forecast,” “budget,” “goal,” or other words that convey the uncertainly of future events or outcomes. These forward-looking statements are based on our current information and expectations that involve a number of risks uncertainties and assumptions Among thenumber of risks, uncertainties, and assumptions. Among the factors that could cause the actual results to differ materially from those indicated in the forward-looking statements are: industry conditions, prices of crude oil and natural gas, our ability to obtain and the timing of new projects, and changes in competitive factors. Should one or more of these risks or
t i ti t i li h ld th tiuncertainties materialize, or should the assumptions underlying the forward-looking statements prove incorrect, actual outcomes could vary materially from those indicated.
For additional information regarding these and other factors, see our periodic filings with the Securities and Exchangesee our periodic filings with the Securities and Exchange Commission, including our most recent Reports on Forms 10-K and 10-Q.
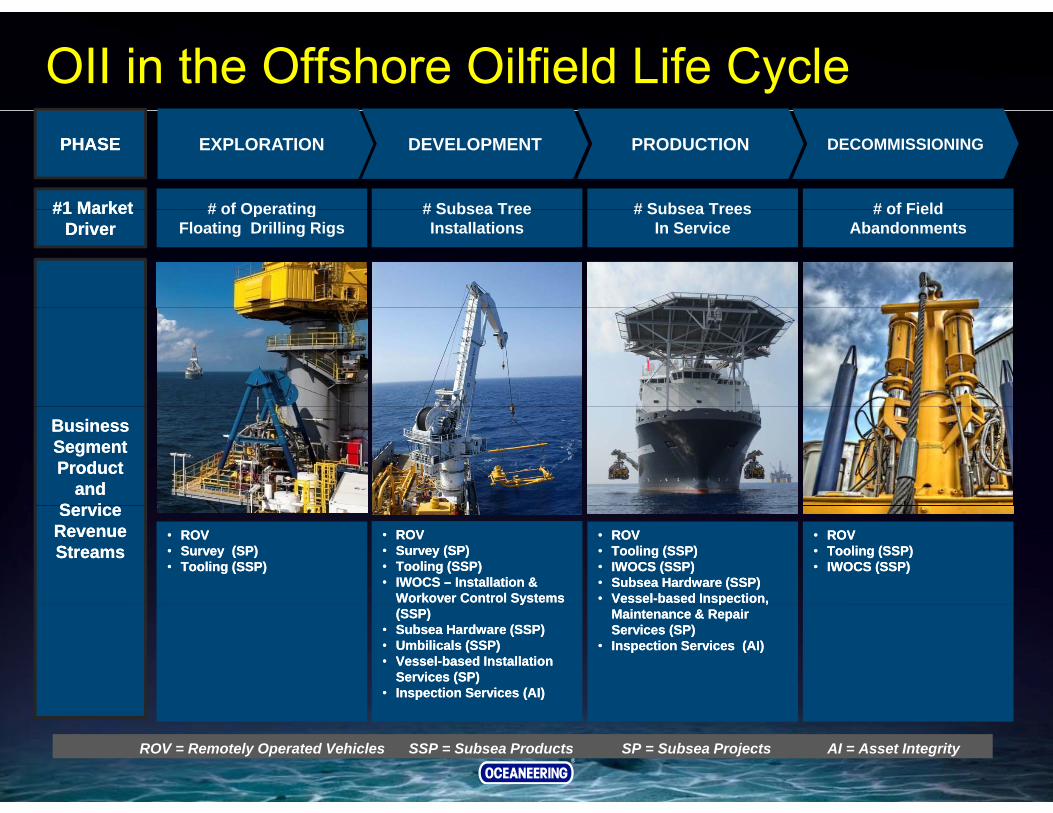
OII in the Offshore Oilfield Life CycleEXPLORATION DEVELOPMENT PRODUCTION DECOMMISSIONING
# of Operating # Subsea Tree # Subsea Trees # of Field
PHASEPHASE
#1 Market#1 Market # of OperatingFloating Drilling Rigs
# Subsea Tree Installations
# Subsea TreesIn Service
# of Field Abandonments
#1 Market #1 Market DriverDriver
Business Business Segment Segment Product Product
and and S iS i
•• ROVROV•• Survey (SP)Survey (SP)•• Tooling (SSP)Tooling (SSP)
Service Service Revenue Revenue StreamsStreams
•• ROVROV•• Survey (SP)Survey (SP)•• Tooling (SSP)Tooling (SSP)•• IWOCS IWOCS –– Installation & Installation &
Workover Control Systems Workover Control Systems
•• ROVROV•• Tooling (SSP)Tooling (SSP)•• IWOCS (SSP)IWOCS (SSP)•• Subsea Hardware (SSP)Subsea Hardware (SSP)•• VesselVessel--based Inspection, based Inspection,
•• ROV ROV •• Tooling (SSP)Tooling (SSP)•• IWOCS (SSP)IWOCS (SSP)
yy(SSP)(SSP)
•• Subsea Hardware (SSP)Subsea Hardware (SSP)•• Umbilicals (SSP)Umbilicals (SSP)•• VesselVessel--based Installation based Installation
Services (SP)Services (SP)•• Inspection Services (AI)Inspection Services (AI)
p ,p ,Maintenance & Repair Maintenance & Repair Services (SP)Services (SP)
•• Inspection Services (AI) Inspection Services (AI)
ROV = Remotely Operated Vehicles SSP = Subsea Products SP = Subsea Projects AI = Asset Integrity
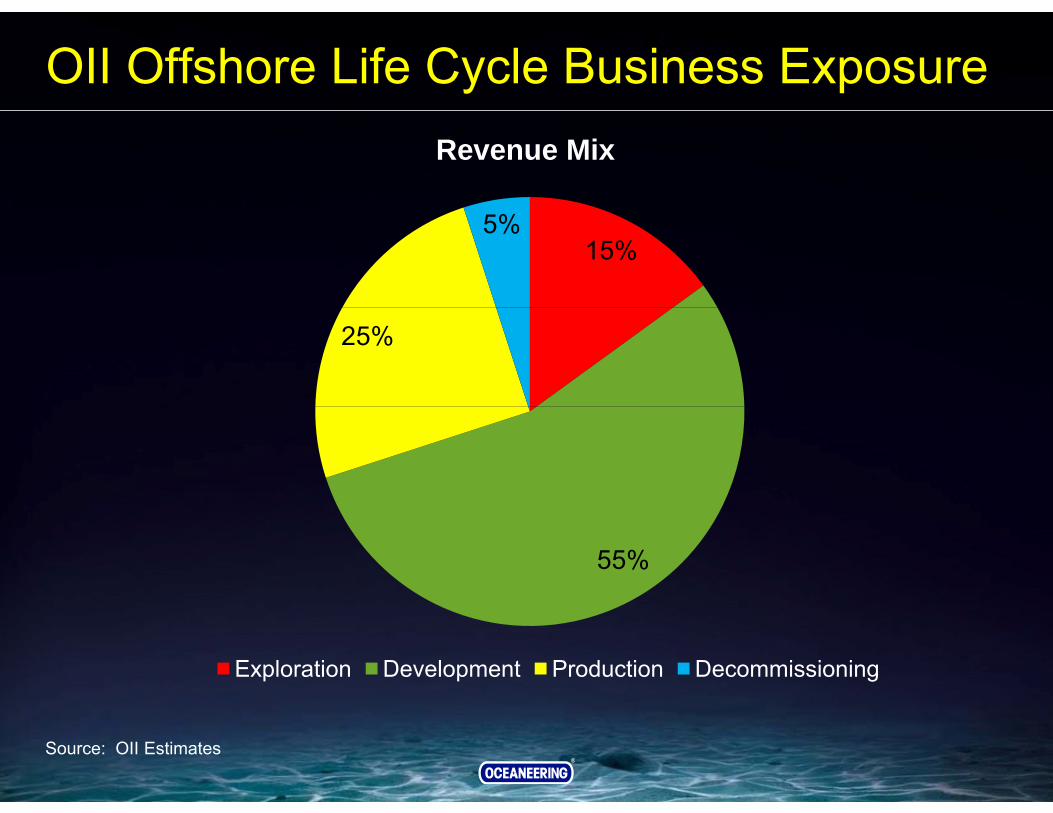
OII Offshore Life Cycle Business ExposureRevenue Mix
15%5%
25%
55%
Exploration Development Production Decommissioning
Source: OII Estimates
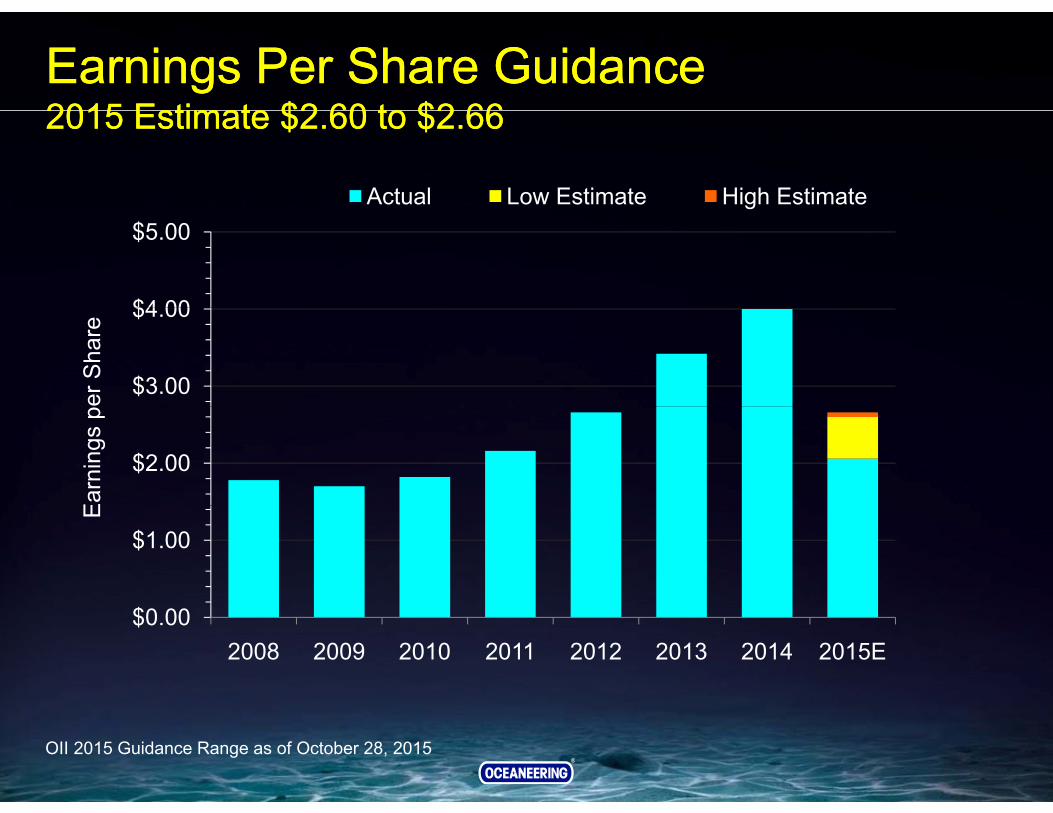
Earnings Per Share Guidance2015 Estimate $2 60 to $2 66Earnings Per Share Guidance2015 Estimate $2 60 to $2 66
Actual Low Estimate High Estimate
2015 Estimate $2.60 to $2.662015 Estimate $2.60 to $2.66
$4 00
$5.00
$3.00
$4.00
er S
hare
$2.00
Ear
ning
s p
$1.00
E
$0.002008 2009 2010 2011 2012 2013 2014 2015E
OII 2015 Guidance Range as of October 28, 2015
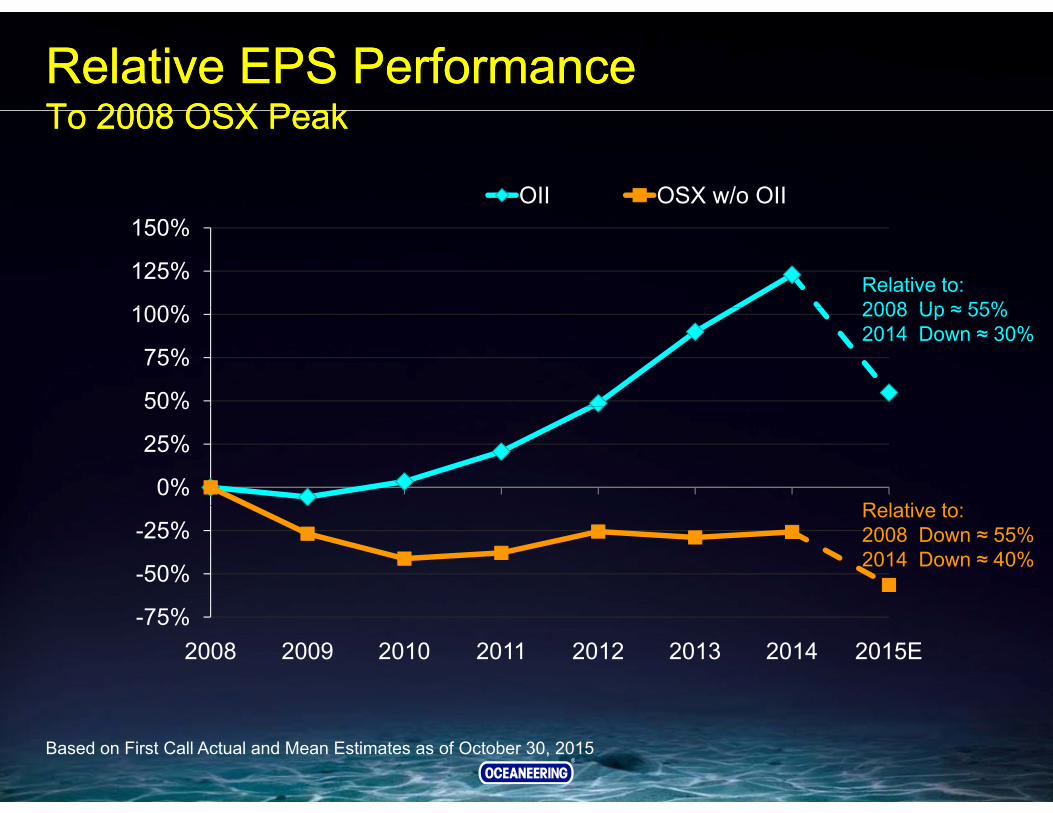
Relative EPS PerformanceTo 2008 OSX PeakRelative EPS PerformanceTo 2008 OSX PeakTo 2008 OSX PeakTo 2008 OSX Peak
OII OSX w/o OII
100%
125%
150%
Relative to:2008 Up ≈ 55%
50%
75%
100% 2008 Up ≈ 55%2014 Down ≈ 30%
0%
25%
50%
R l ti t
-50%
-25%Relative to:2008 Down ≈ 55%2014 Down ≈ 40%
-75%2008 2009 2010 2011 2012 2013 2014 2015E
Based on First Call Actual and Mean Estimates as of October 30, 2015
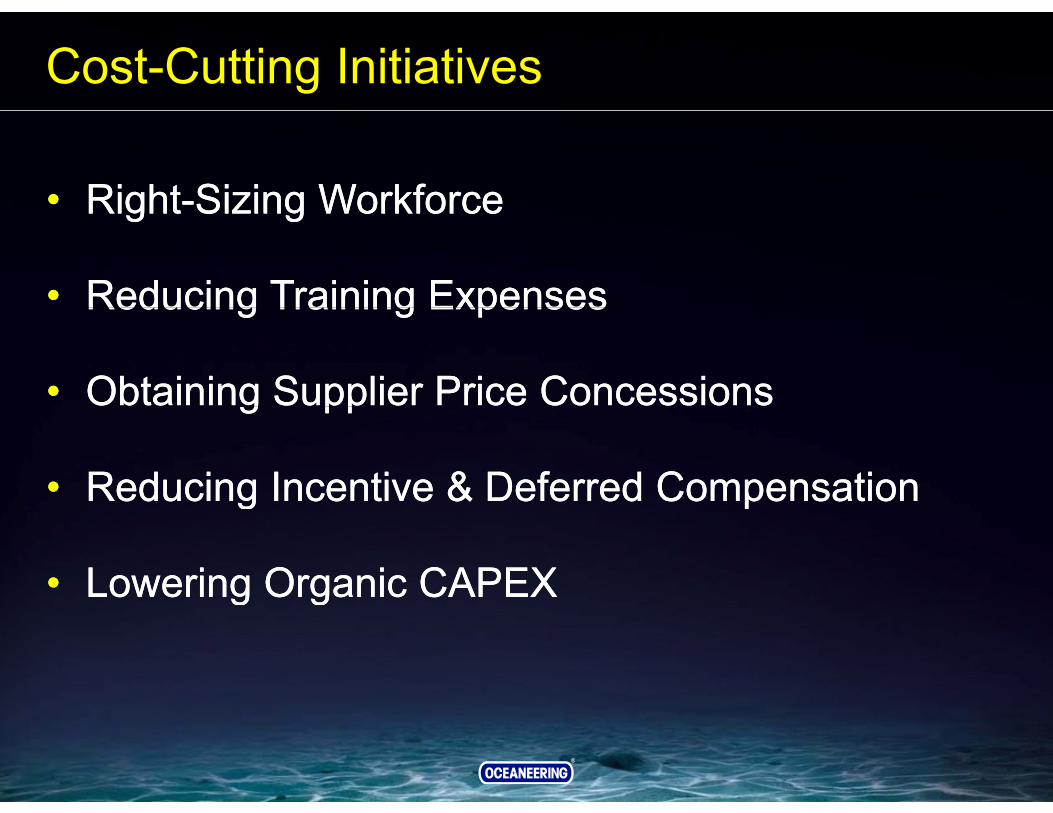
Cost-Cutting Initiatives
• Right-Sizing Workforce• Right-Sizing WorkforceRight Sizing Workforce
• Reducing Training Expenses
Right Sizing Workforce
• Reducing Training ExpensesReducing Training Expenses
• Obtaining Supplier Price Concessions
Reducing Training Expenses
• Obtaining Supplier Price Concessionsg pp
• Reducing Incentive & Deferred Compensation
g pp
• Reducing Incentive & Deferred Compensationg p
• Lowering Organic CAPEX
g p
• Lowering Organic CAPEXg gg g
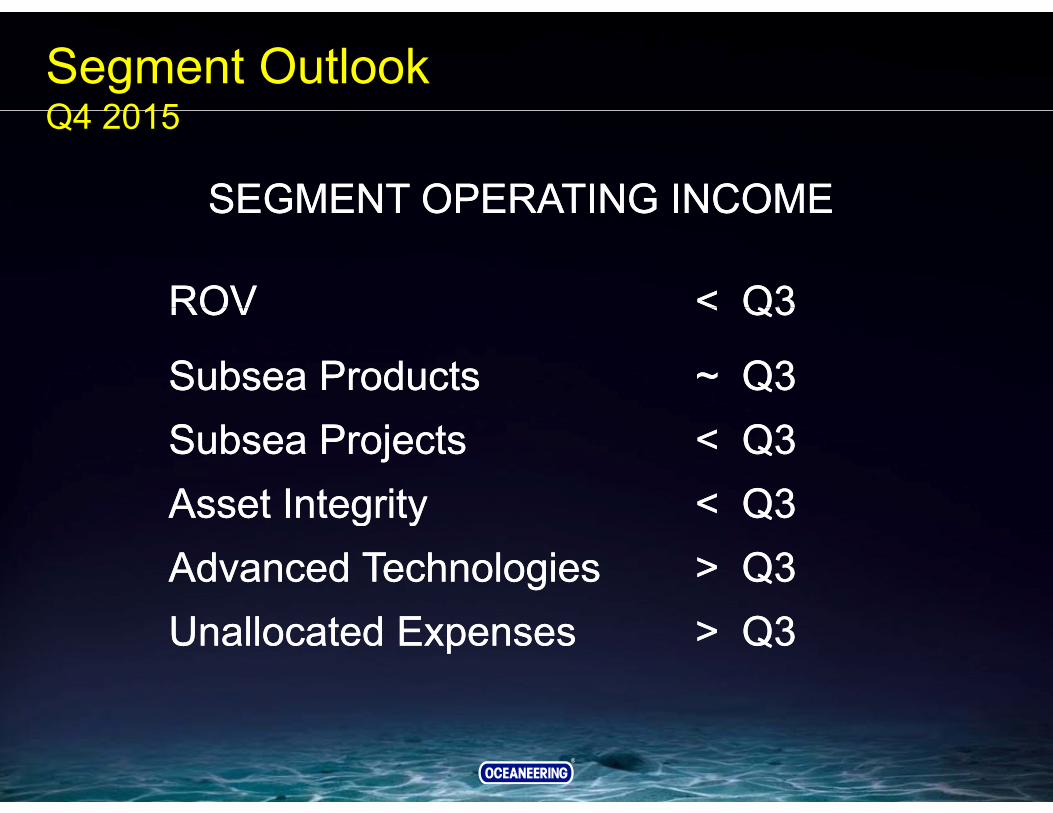
Segment Outlook Q4 2015Q4 2015
SEGMENT OPERATING INCOMESEGMENT OPERATING INCOMESEGMENT OPERATING INCOME
ROV < Q3
SEGMENT OPERATING INCOME
ROV < Q3ROV < Q3
Subsea Products ~ Q3
ROV < Q3
Subsea Products ~ Q3Subsea Projects < Q3 Asset Integrity < Q3Subsea Projects < Q3 Asset Integrity < Q3Asset Integrity < Q3Advanced Technologies > Q3Asset Integrity < Q3Advanced Technologies > Q3Unallocated Expenses > Q3Unallocated Expenses > Q3
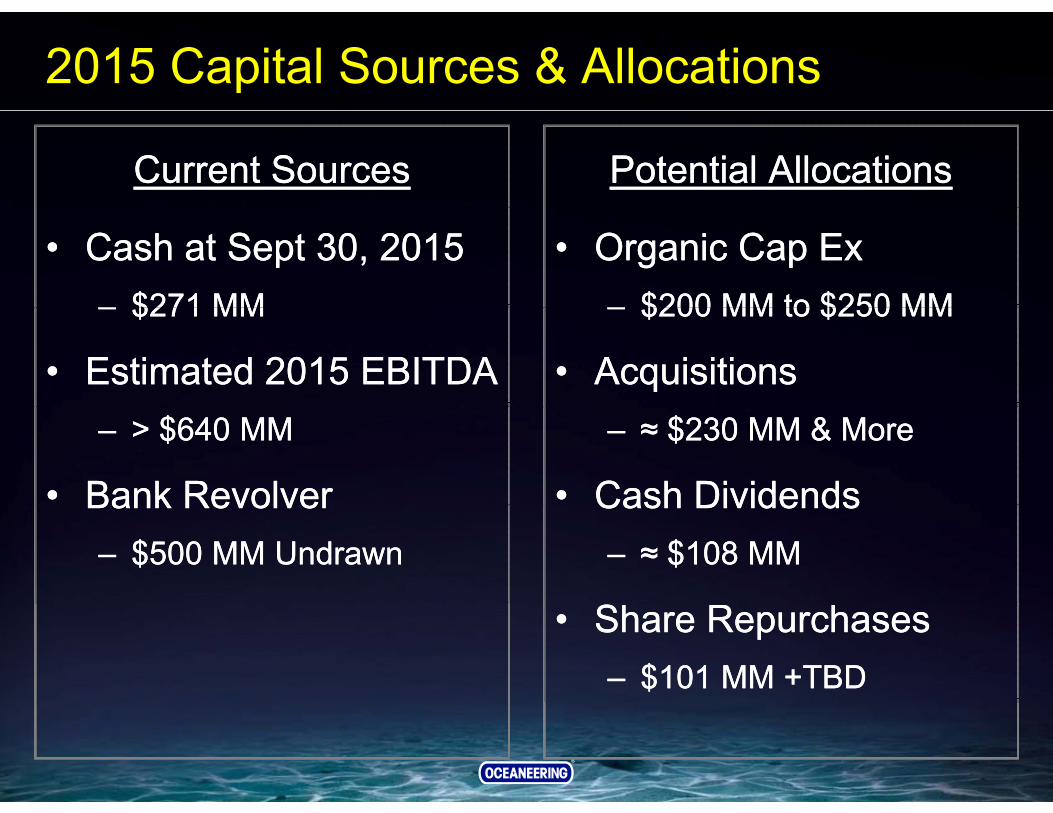
2015 Capital Sources & Allocations
Potential AllocationsPotential AllocationsCurrent SourcesCurrent Sources
• Organic Cap Ex– $200 MM to $250 MM
• Organic Cap Ex– $200 MM to $250 MM
• Cash at Sept 30, 2015– $271 MM
• Cash at Sept 30, 2015– $271 MM – $200 MM to $250 MM
• Acquisitions
– $200 MM to $250 MM
• Acquisitions
– $271 MM
• Estimated 2015 EBITDA
– $271 MM
• Estimated 2015 EBITDA– ≈ $230 MM & More
• Cash Dividends
– ≈ $230 MM & More
• Cash Dividends
– > $640 MM
• Bank Revolver
– > $640 MM
• Bank Revolver Cash Dividends– ≈ $108 MM
Cash Dividends– ≈ $108 MM
Bank Revolver– $500 MM Undrawn
Bank Revolver– $500 MM Undrawn
• Share Repurchases– $101 MM +TBD
• Share Repurchases– $101 MM +TBD
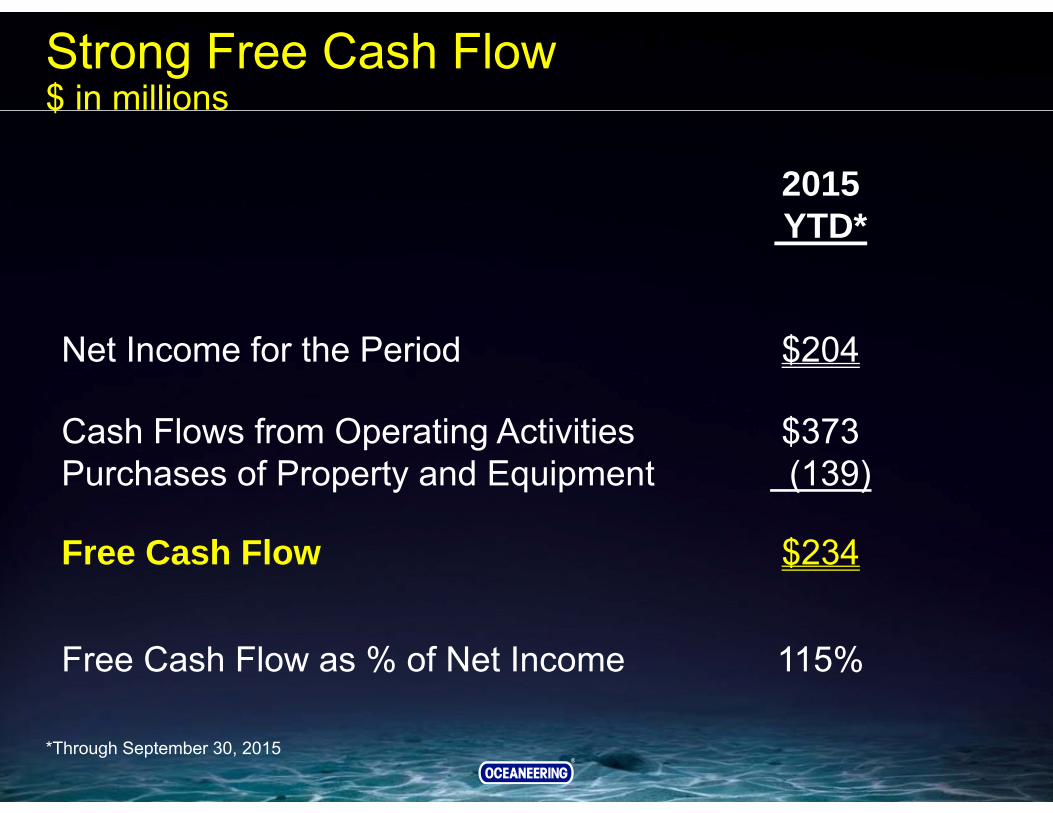
Strong Free Cash Flow$ in millions
2015
$
YTD*
Net Income for the Period $204
Cash Flows from Operating Activities $373Purchases of Property and Equipment (139)
Free Cash Flow $234
Free Cash Flow as % of Net Income 115%
*Through September 30, 2015
2016 Earnings Outlook
• Less Than 2015 Projected Earnings• Less Than 2015 Projected EarningsLess Than 2015 Projected Earnings
– Additional Customer Spending Cuts
Less Than 2015 Projected Earnings
– Additional Customer Spending Cuts
• Reductions in Offshore Activities, including• Reductions in Offshore Activities, includingFewer Contracted Floating RigsFewer Contracted Floating Rigs
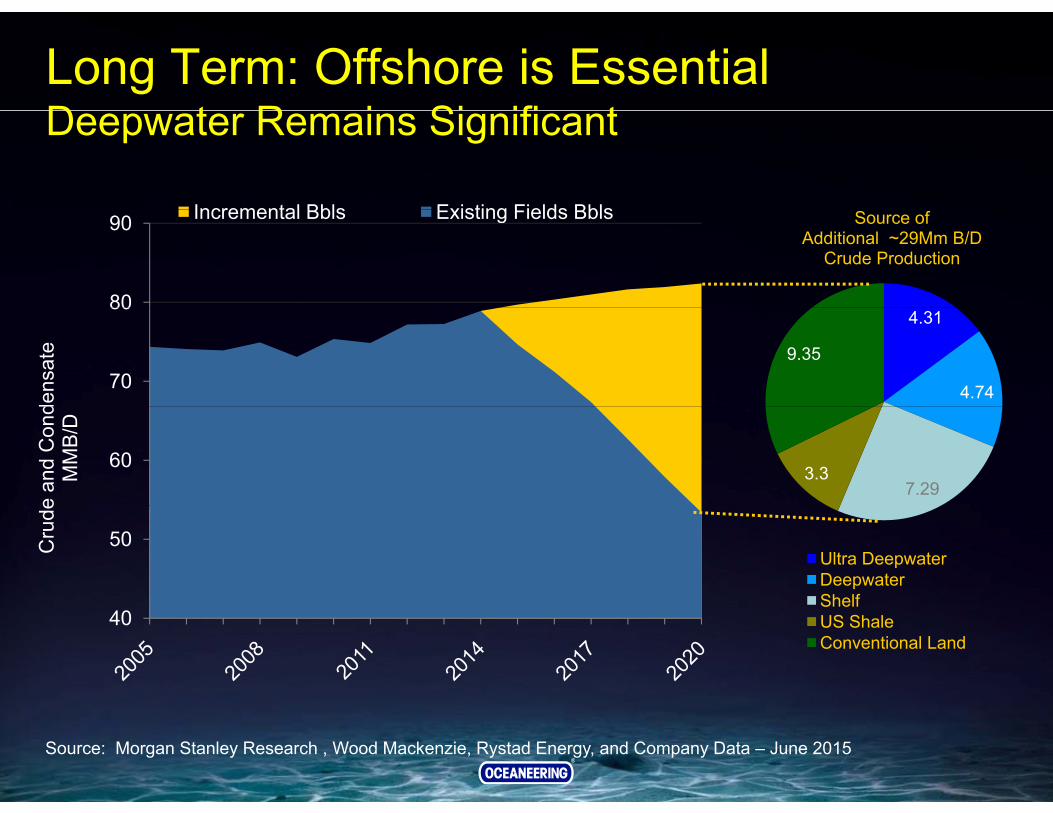
Long Term: Offshore is EssentialD t R i Si ifi tDeepwater Remains Significant
Incremental Bbls Existing Fields Bbls Source of Additional ~29Mm B/D
Crude Production
80
90 Incremental Bbls Existing Fields Bbls
4.31
4.74
9.3570
80
dens
ate
7.293.3
60
e an
d C
ond
MM
B/D
Ultra DeepwaterDeepwaterShelf
50Cru
de
ShelfUS ShaleConventional Land
40
Source: Morgan Stanley Research , Wood Mackenzie, Rystad Energy, and Company Data – June 2015
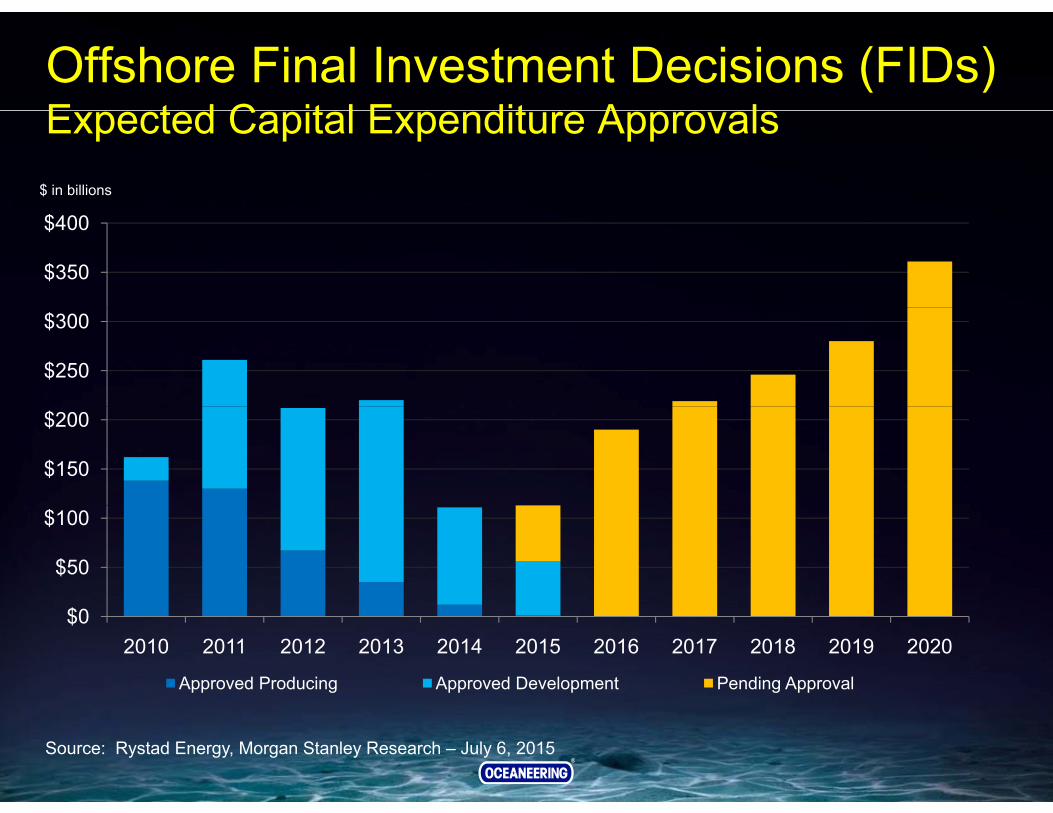
Offshore Final Investment Decisions (FIDs)E t d C it l E dit A l
$ in billions
Expected Capital Expenditure Approvals
$350
$400
$250
$300
$150
$200
$50
$100
$02010 2011 2012 2013 2014 2015 2016 2017 2018 2019 2020
Approved Producing Approved Development Pending Approval
Source: Rystad Energy, Morgan Stanley Research – July 6, 2015
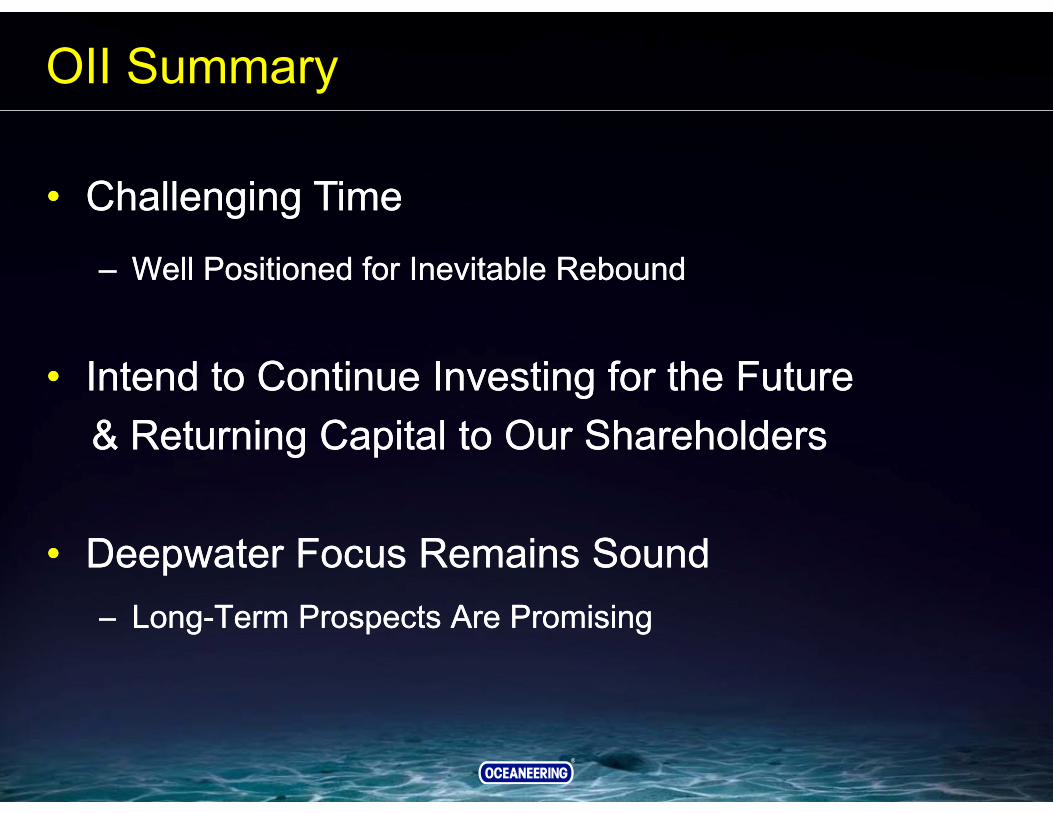
OII Summary
• Challenging Time• Challenging TimeChallenging Time
– Well Positioned for Inevitable Rebound
Challenging Time
– Well Positioned for Inevitable Rebound
• Intend to Continue Investing for the Future• Intend to Continue Investing for the Future& Returning Capital to Our Shareholders& Returning Capital to Our Shareholders
• Deepwater Focus Remains Sound• Deepwater Focus Remains Sound– Long-Term Prospects Are Promising– Long-Term Prospects Are Promising

®®
Supplemental Financial Informationpp
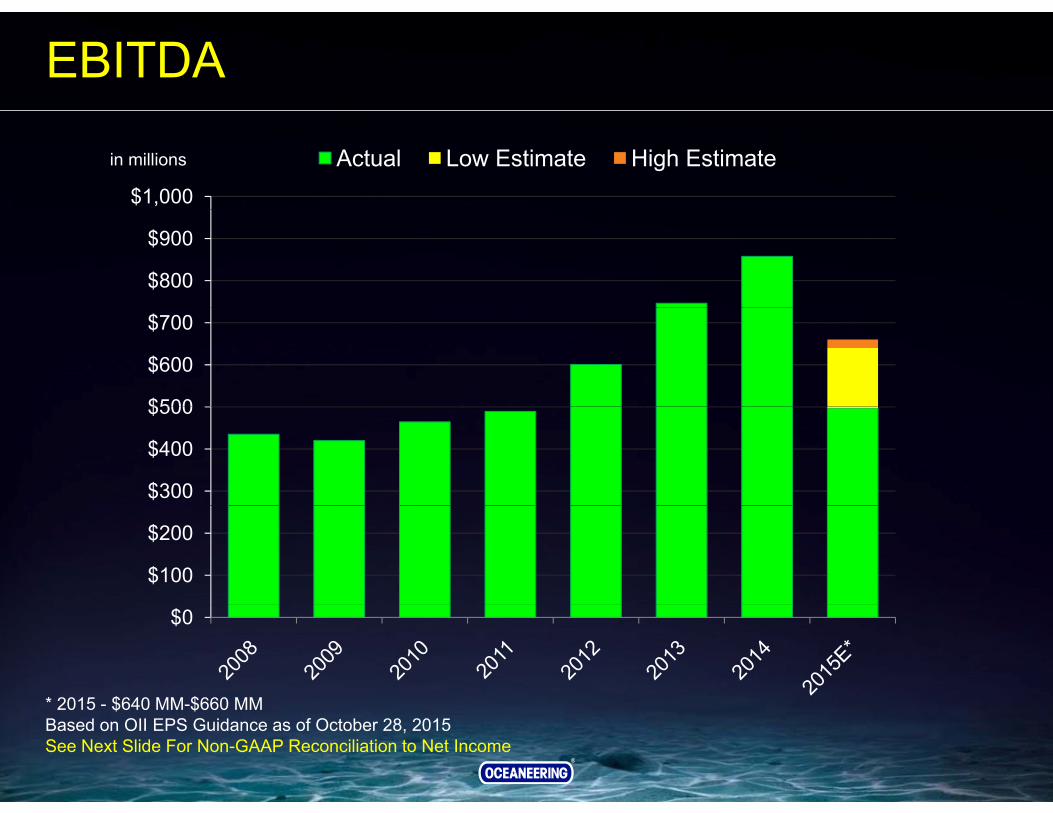
EBITDA
$1,000
in millions Actual Low Estimate High Estimate
$800
$900
$500
$600
$700
$300
$400
$500
$100
$200
* 2015 $640 MM $660 MM
$0
2015 - $640 MM-$660 MMBased on OII EPS Guidance as of October 28, 2015See Next Slide For Non-GAAP Reconciliation to Net Income
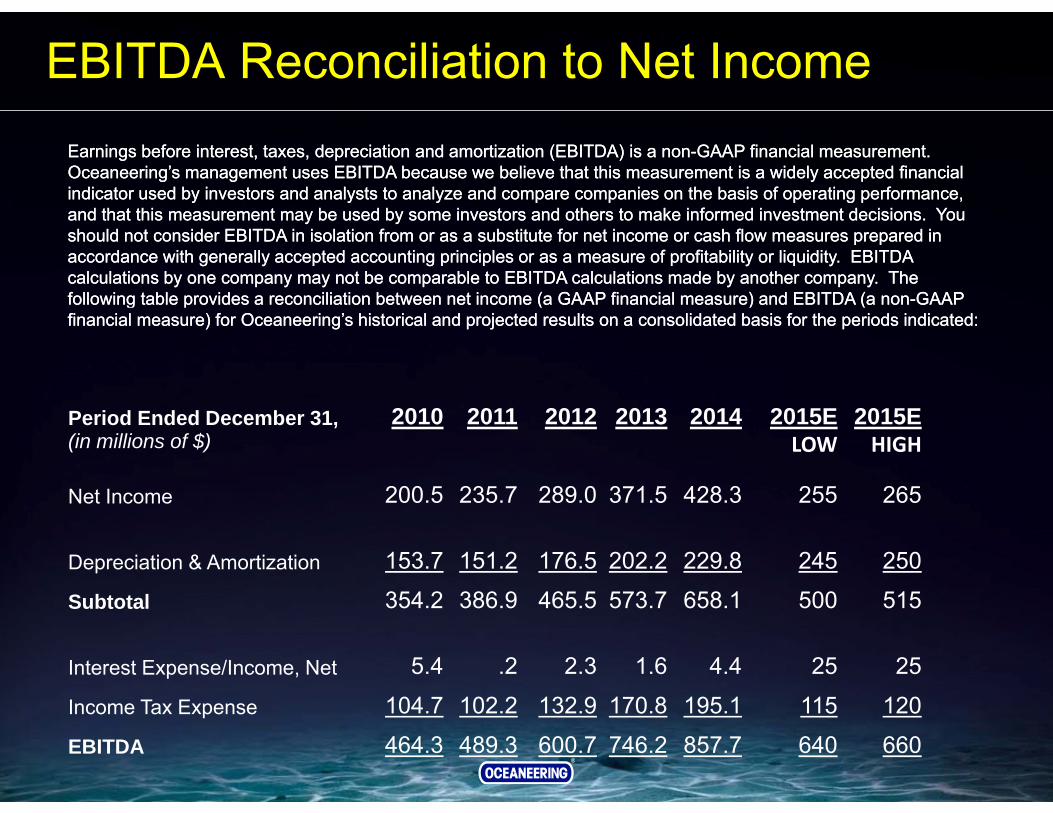
EBITDA Reconciliation to Net IncomeEarnings before interest, taxes, depreciation and amortization (EBITDA) is a non-GAAP financial measurement. Oceaneering’s management uses EBITDA because we believe that this measurement is a widely accepted financial indicator used by investors and analysts to analyze and compare companies on the basis of operating performance,
d th t thi t b d b i t d th t k i f d i t t d i i Y
Earnings before interest, taxes, depreciation and amortization (EBITDA) is a non-GAAP financial measurement. Oceaneering’s management uses EBITDA because we believe that this measurement is a widely accepted financial indicator used by investors and analysts to analyze and compare companies on the basis of operating performance,
d th t thi t b d b i t d th t k i f d i t t d i i Yand that this measurement may be used by some investors and others to make informed investment decisions. You should not consider EBITDA in isolation from or as a substitute for net income or cash flow measures prepared in accordance with generally accepted accounting principles or as a measure of profitability or liquidity. EBITDA calculations by one company may not be comparable to EBITDA calculations made by another company. The following table provides a reconciliation between net income (a GAAP financial measure) and EBITDA (a non-GAAP
and that this measurement may be used by some investors and others to make informed investment decisions. You should not consider EBITDA in isolation from or as a substitute for net income or cash flow measures prepared in accordance with generally accepted accounting principles or as a measure of profitability or liquidity. EBITDA calculations by one company may not be comparable to EBITDA calculations made by another company. The following table provides a reconciliation between net income (a GAAP financial measure) and EBITDA (a non-GAAP g p ( ) (financial measure) for Oceaneering’s historical and projected results on a consolidated basis for the periods indicated:
g p ( ) (financial measure) for Oceaneering’s historical and projected results on a consolidated basis for the periods indicated:
Period Ended December 31, 2010 2011 2012 2013 2014 2015E 2015E(in millions of $) LOW HIGH
Net Income 200.5 235.7 289.0 371.5 428.3 255 265
Depreciation & Amortization 153.7 151.2 176.5 202.2 229.8 245 250
Subtotal 354 2 386 9 465 5 573 7 658 1 500 515Subtotal 354.2 386.9 465.5 573.7 658.1 500 515
Interest Expense/Income, Net 5.4 .2 2.3 1.6 4.4 25 25
I T E 104 7 102 2 132 9 170 8 195 1 115 120Income Tax Expense 104.7 102.2 132.9 170.8 195.1 115 120
EBITDA 464.3 489.3 600.7 746.2 857.7 640 660
Free Cash Flow
“Free Cash Flow” (FCF) is a non-GAAP financial measurement. FCF represents cash flow from operations less organic capital expenditures (i.e., capital expenditures excluding those for business acquisitions or other investments) Management believes
“Free Cash Flow” (FCF) is a non-GAAP financial measurement. FCF represents cash flow from operations less organic capital expenditures (i.e., capital expenditures excluding those for business acquisitions or other investments) Management believesexcluding those for business acquisitions or other investments). Management believes that this is an important measure because it represents funds available to pursue opportunities that enhance shareholder value such as making acquisitions or other investments, and returning cash to owners through share repurchases and dividends, or
excluding those for business acquisitions or other investments). Management believes that this is an important measure because it represents funds available to pursue opportunities that enhance shareholder value such as making acquisitions or other investments, and returning cash to owners through share repurchases and dividends, or , g g p ,to reduce debt.
, g g p ,to reduce debt.
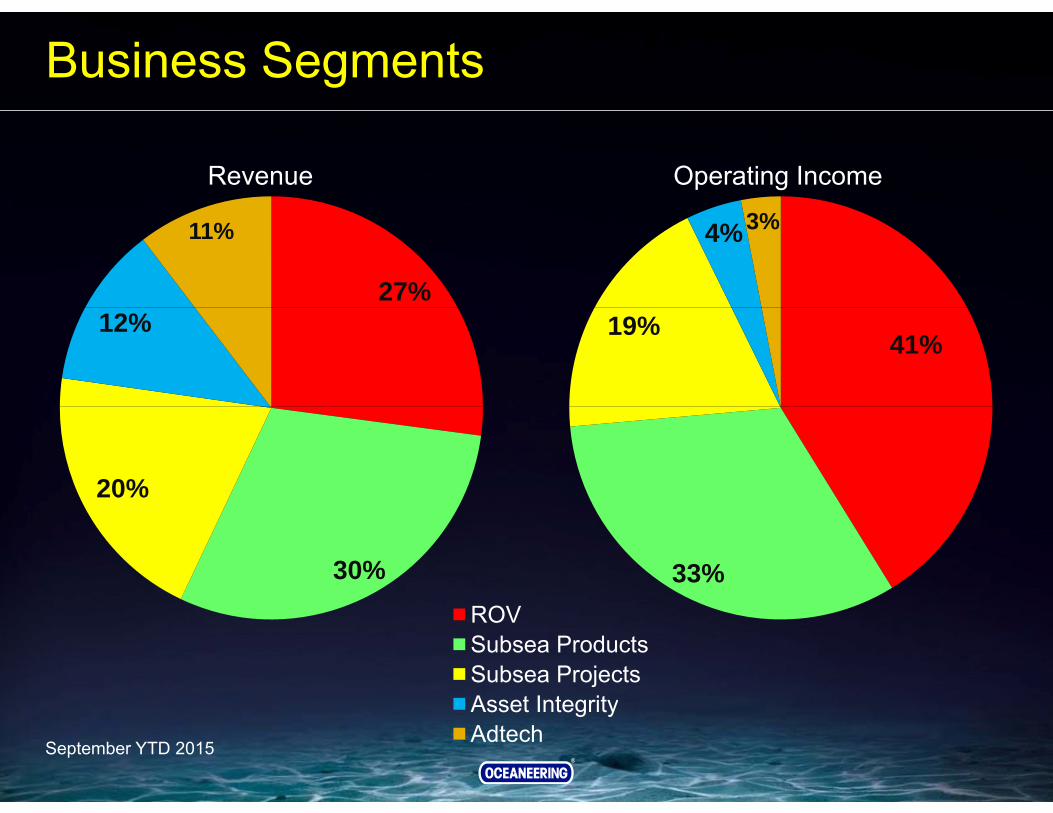
Business Segments
Revenue Operating Income
27%
11% 4%3%
12%41%
19%
20%
30% 33%ROVSubsea ProductsSubsea ProjectsAsset IntegrityAsset IntegrityAdtech
September YTD 2015
Supplemental Market Informationpp
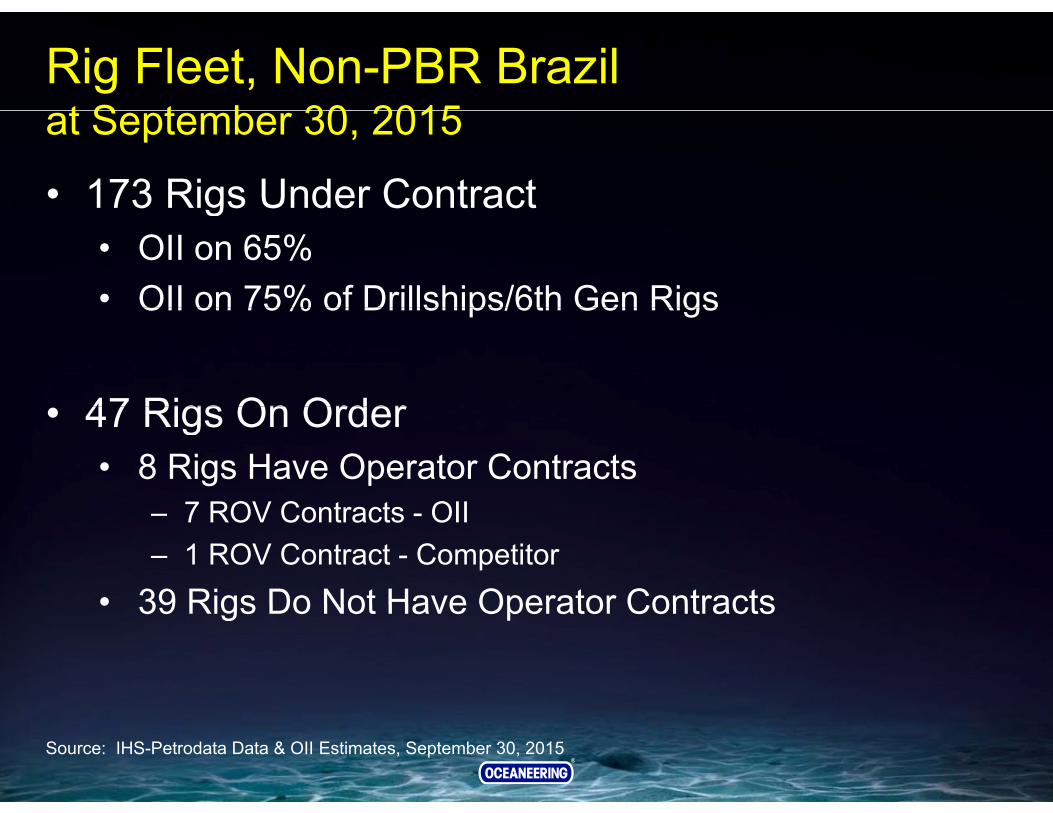
Rig Fleet, Non-PBR Brazil t S t b 30 2015at September 30, 2015
• 173 Rigs Under Contractg• OII on 65%• OII on 75% of Drillships/6th Gen RigsOII on 75% of Drillships/6th Gen Rigs
47 Rigs On Order• 47 Rigs On Order • 8 Rigs Have Operator Contracts
7 ROV C t t OII– 7 ROV Contracts - OII – 1 ROV Contract - Competitor
• 39 Rigs Do Not Have Operator Contracts• 39 Rigs Do Not Have Operator Contracts
Source: IHS-Petrodata Data & OII Estimates, September 30, 2015
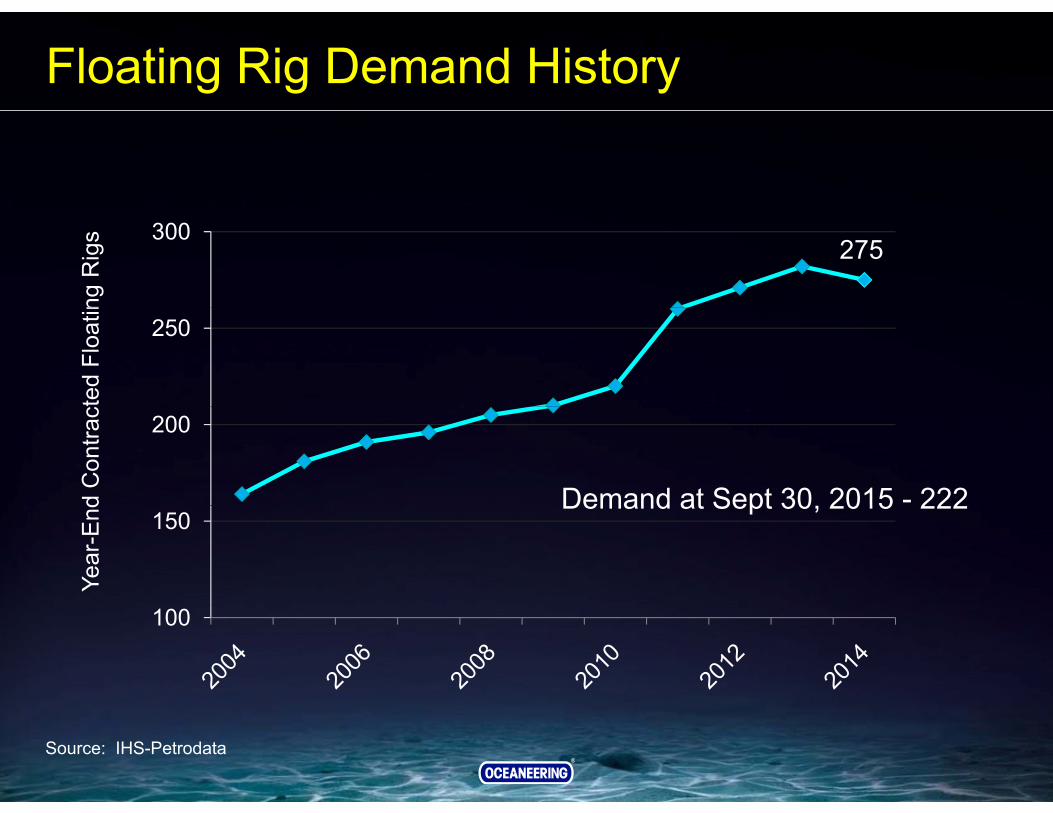
Floating Rig Demand History
275300
ng R
igs
250
ted
Floa
tin
200
d C
ontra
c
Demand at Sept 30 2015 - 222150
Year
-End Demand at Sept 30, 2015 222
100
Source: IHS-Petrodata
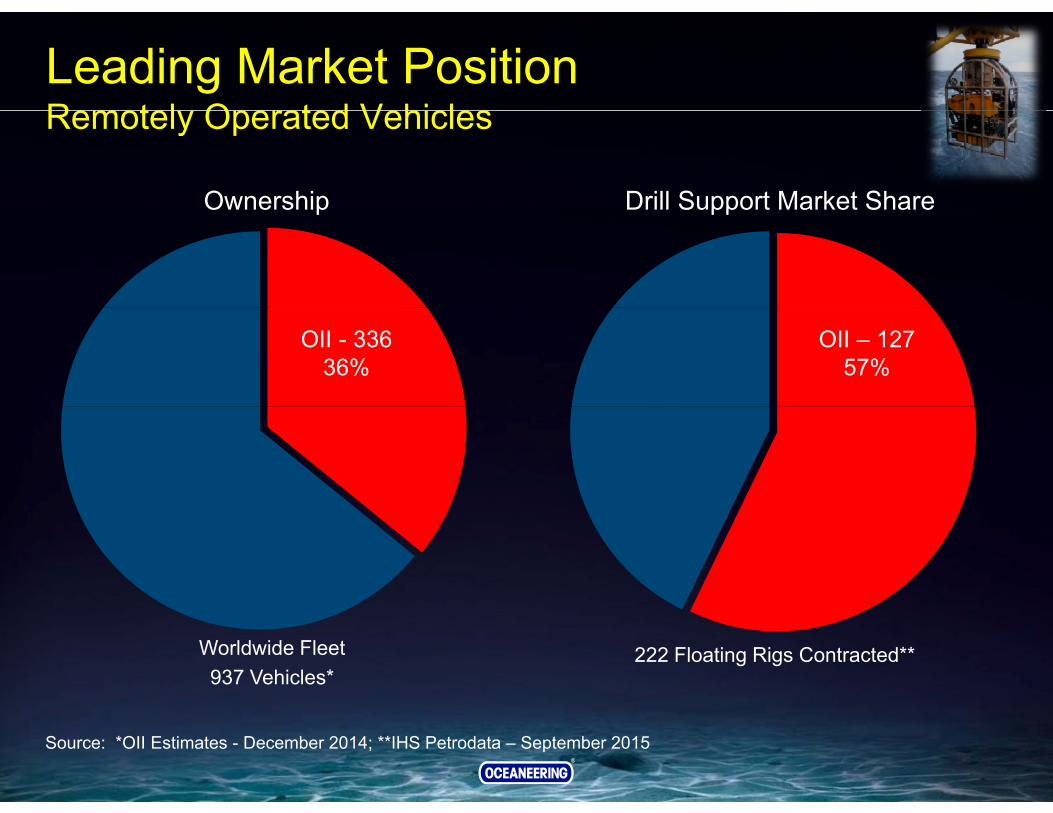
Leading Market PositionRemotely Operated VehiclesRemotely Operated Vehicles
Ownership Drill Support Market ShareOwnership Drill Support Market Share
OII - 33636%
OII – 12757%
Worldwide Fleet937 Vehicles*
222 Floating Rigs Contracted**
Source: *OII Estimates - December 2014; **IHS Petrodata – September 2015
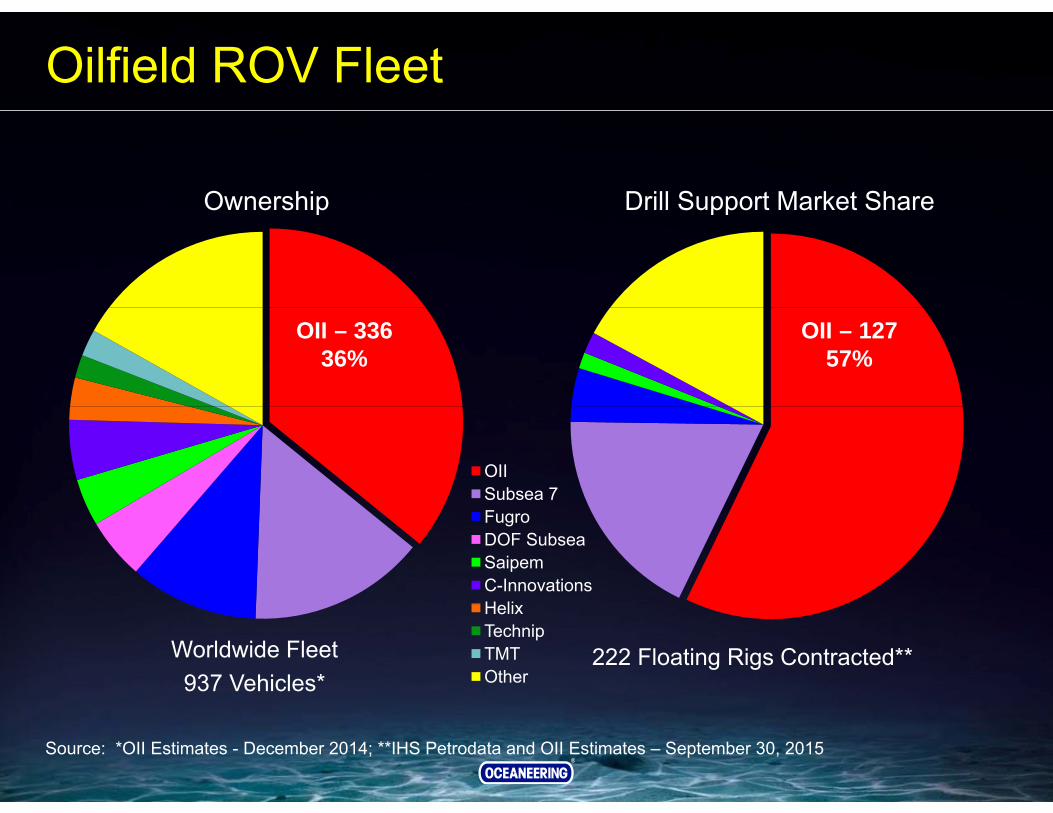
Oilfield ROV Fleet
Ownership Drill Support Market ShareOwnership Drill Support Market Share
OII – 12757%
OII – 33636%
OIISubsea 7FugroDOF SubseaSaipemC-InnovationsH liHelixTechnipTMTOther
Worldwide Fleet937 Vehicles*
222 Floating Rigs Contracted**
Source: *OII Estimates - December 2014; **IHS Petrodata and OII Estimates – September 30, 2015
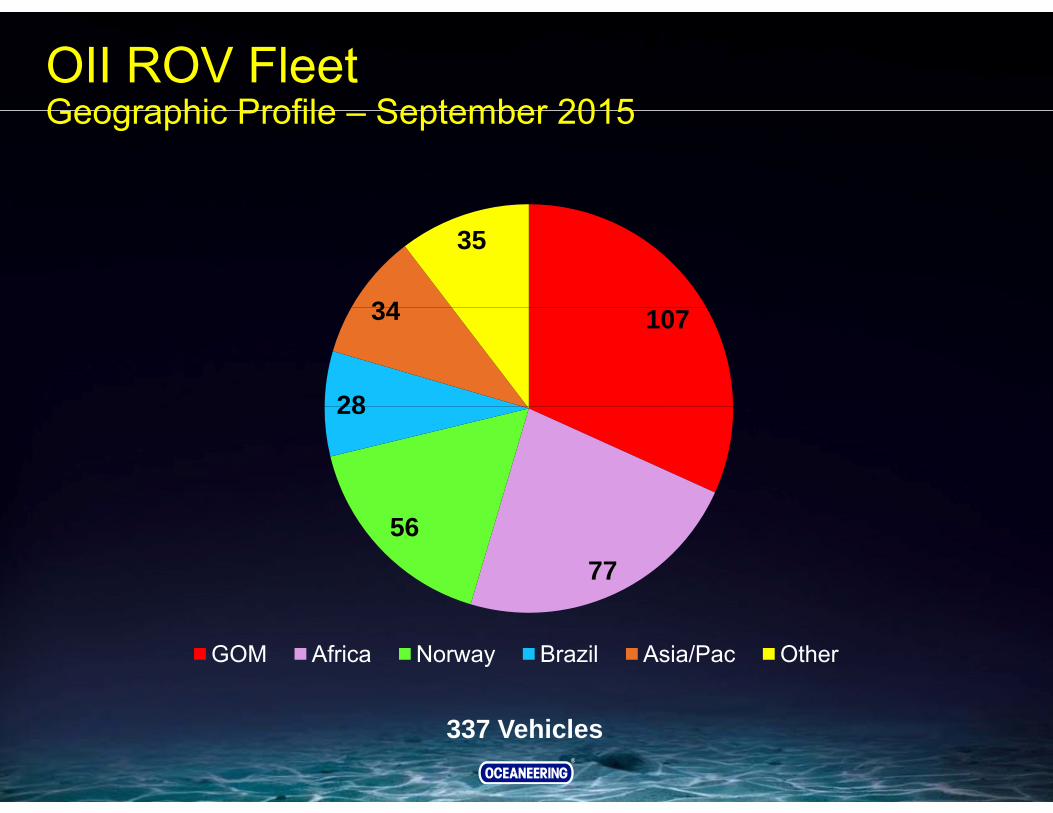
OII ROV FleetGeographic Profile September 2015Geographic Profile – September 2015
34
35
107
28
34
28
7756
GOM Africa Norway Brazil Asia/Pac Other
337 Vehicles
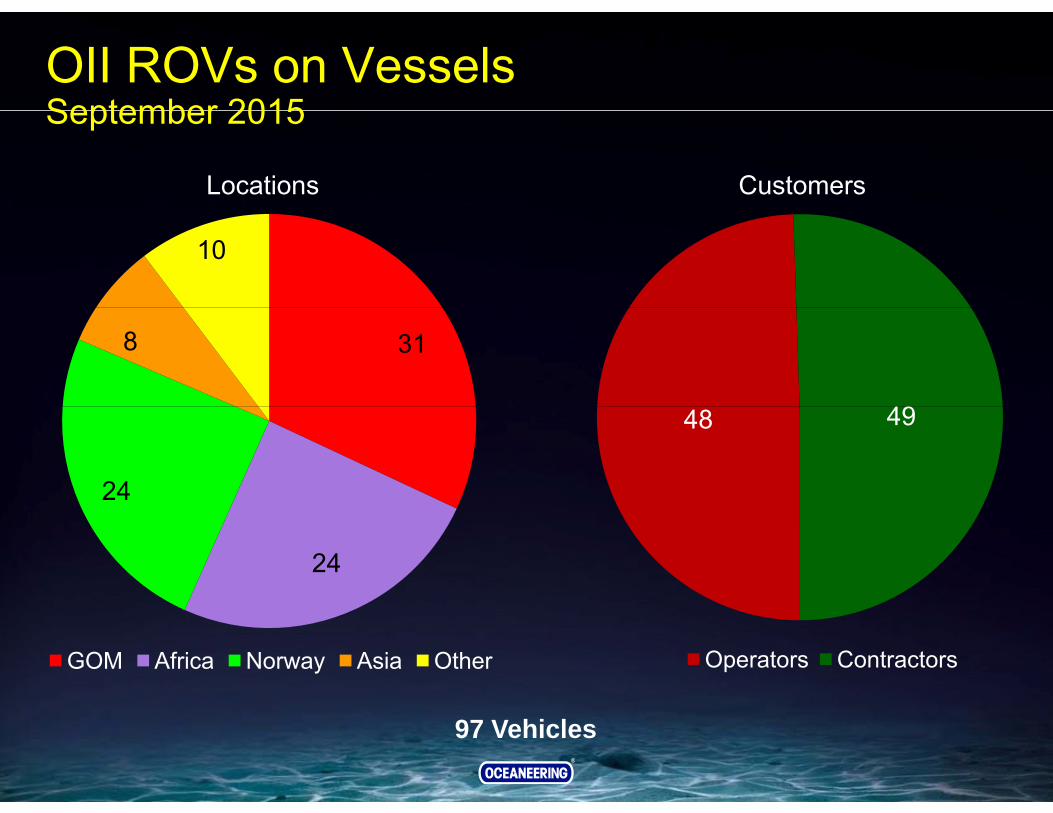
OII ROVs on Vessels September 2015September 2015
Locations Customers
10
318
49
24
48 49
24
GOM Africa Norway Asia Other Operators Contractors
97 Vehicles
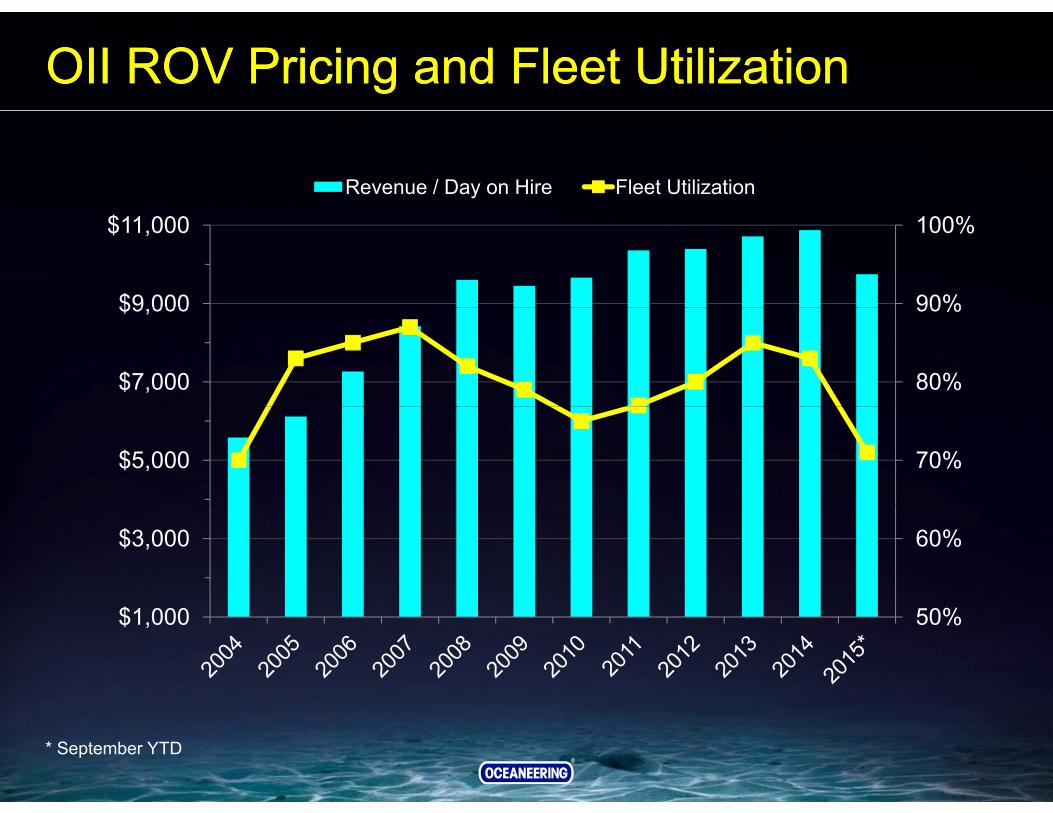
OII ROV Pricing and Fleet UtilizationOII ROV Pricing and Fleet Utilization
Revenue / Day on Hire Fleet Utilization
90%
100%
$9 000
$11,000
80%
90%
$7,000
$9,000
70%$5,000
60%$3,000
50%$1,000
* September YTD
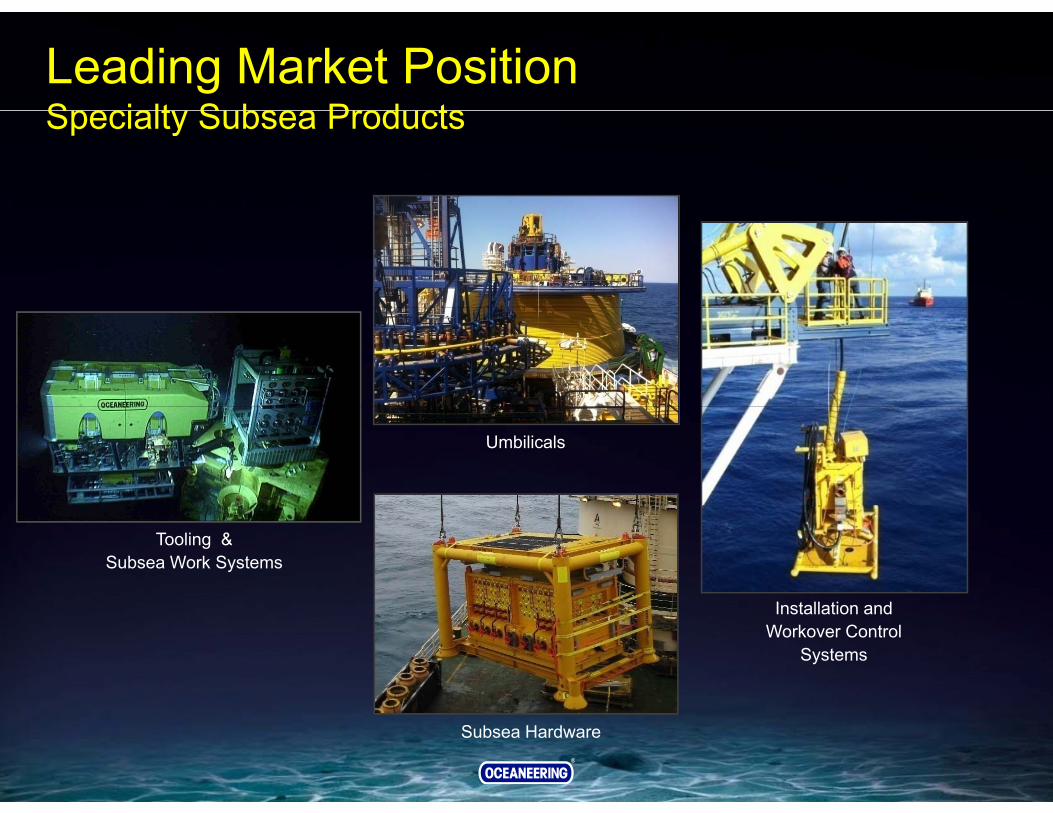
Leading Market PositionSpecialty Subsea ProductsSpecialty Subsea Products
Umbilicals
Tooling & Subsea Work Systems
I t ll ti dInstallation andWorkover Control
Systems
Subsea Hardware
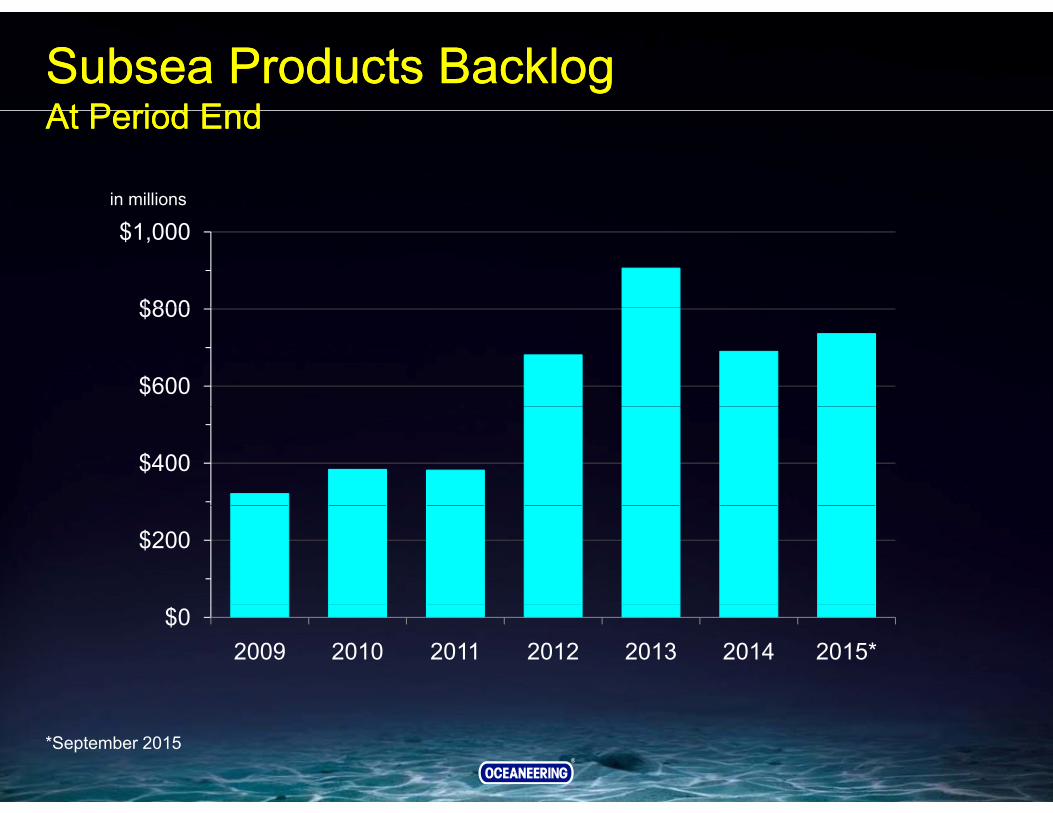
Subsea Products BacklogAt Period EndSubsea Products BacklogAt Period End
in millions
At Period EndAt Period End
$800
$1,000
$600
$800
$400
$200
$02009 2010 2011 2012 2013 2014 2015*
*September 2015