occurrence of foodborne illness risk factors in fast food ... · 11/15/2013 · in fast food...
TRANSCRIPT
FDA REPORT ON THE OCCURRENCE OF FOODBORNE ILLNESS RISK FACTORS IN FAST FOOD AND FULL-
SERVICE RESTAURANTS, 2013-2014
PREPARED BY THE FDA NATIONAL RETAIL FOOD TEAM
November 2018
Acknowledgements
We offer special thanks to John Marcello, Regional Retail Food Specialist, FDA Office of Regulatory Affairs, and Marc Boyer, Biostatistician, FDA Center for Food Safety and Applied Nutrition. Without them, this study would not have happened. Special thanks also belong to the Regional Retail Food Specialists who collected data for this study. We also thank the members of FDA’s Risk Factor Study Workgroup for their thoughtful and patient help in developing and managing the study. Finally, we thank the report’s authors and reviewers.
The following groups provided invaluable contributions to the development of this report and/or implementation of this project:
FDA
Center for Food Safety and Applied Nutrition Biostatistics and Bioinformatics Staff, Office of Analytics and Outreach
Office of Executive Programs, Office of the Center Director Retail Food Protection Staff, Office of Food Safety
Senior Science Advisor Staff, Office of the Center Director
Office of Regulatory Affairs Division of Human Resource Development
Office of Partnerships Retail Food Specialists State Cooperative Program Directors
FDA National Retail Food Team National Retail Food Team Steering Committee Retail Food Foodborne Illness Risk Factor Study Work Group
REGULATORY PARTNERS State, local, and tribal regulatory jurisdiction representatives who accompanied FDA Retail Food Specialists on data collection visits.
INDUSTRY Food service managers of the restaurants selected for the study for their cooperation and assistance during the data collections.
Published by the Food and Drug Administration (FDA), U.S. Department of Health and Human Services, April 12, 2018.
Contributors to this compilation are past or current members or consultants of FDA’s National Retail Food Team. For more information on the National Retail Food Team, see http://www.fda.gov/Retailfoodprotection.
Disclaimer: The findings and conclusions in this report are those of the individual authors and do not necessarily represent the views of the Food and Drug Administration.
There is no copyright in U.S. government work (17 U.S.C. 105). This work is considered U.S. government work.
Suggested citation: Food and Drug Administration (2018). FDA Report on the Occurrence of Foodborne Illness Risk Factors in Fast Food and Full-service Restaurants, 2013-2014.
U.S. Department of Health and Human Services Food and Drug Administration
5001 Campus Drive, College Park, MD 20740

CONTENTS LIST OF TABLES ............................................................................................................. i
LIST OF FIGURES .......................................................................................................... iii
Abstract ........................................................................................................................... 1
Background ..................................................................................................................... 1
DESIGN AND METHODOLOGY ..................................................................................... 6
RESULTS AND DISCUSSION ...................................................................................... 17
CONCLUSION .............................................................................................................. 39
APPENDIX A: FDA FOODBORNE ILLNESS RISK FACTOR STUDY DATA COLLECTION FORM .................................................................................................... 42
APPENDIX B: DATA COLLECTION INTRODUCTION LETTER .................................. 60
APPENDIX C: LIMITATIONS ........................................................................................ 62
APPENDIX D: DATA COLLECTION CYCLE FOR THE RESTAURANT INDUSTRY ... 66
APPENDIX E: SUPPLEMENTAL STATISTICAL ANALYSIS ........................................ 67
ACRONYMS/ABBREVIATIONS .................................................................................... 74
REFERENCES .............................................................................................................. 75

i
LIST OF TABLES
Table 1 Summary of Data Collection Time Frames for the Restaurant Industry .......... 3 Table 2 Description of Restaurant Facility Types Included in the Study ...................... 6 Table 3 Risk Categorization of Food Establishments .................................................. 7 Table 4 Foodborne Illness Risk Factors and the Associated Primary Data Items Examined in the Study .................................................................................................. 11 Table 5 Descriptive Statistics ..................................................................................... 19 Table 6 Jurisdictional Characteristics ........................................................................ 20 Table 7 Total Number and Percentage of Restaurants Out-of-compliance for Each Risk Factor .................................................................................................................... 21 Table 8 Total Number and Percentage of Restaurants Out-of-compliance for Each Data Item. ...................................................................................................................... 22 Table 9 Primary Data Items Out-of-compliance in Descending Order of Percentage 23 Table 10 Overall Number of Primary Data Items Out-of-compliance Percentiles (Fast Food Restaurants)......................................................................................................... 25 Table 11 Overall Number of Primary Data Items Out-of-compliance Percentiles (Full- service Restaurants) ..................................................................................................... 26 Table 12 Mean Number of Primary Data Items Out-of-compliance by Multiple- unit Operation Status (Fast Food Restaurants) .................................................................... 27 Table 13 Mean Number of Primary Data Items Out-of-compliance by Risk Category (Fast Food Restaurants) ............................................................................................... 27 Table 14 Mean Number of Primary Data Items Out-of-compliance by Jurisdiction Variable (Fast Food Restaurants) ................................................................................. 28 Table 15 Mean Number of Primary Data Items Out-of-compliance by Certified Food Protection Manager Status (Fast Food Restaurants) .................................................... 29 Table 16 Mean Number of Primary Data Items Out-of-compliance by Multiple- unit Operation Status (Full-service Restaurants) ................................................................. 29 Table 17 Mean Number of Primary Data Items Out-of-compliance by Risk Category (Full-service Restaurants) ............................................................................................. 30 Table 18 Mean Number of Primary Data Items Out-of-compliance by Jurisdiction Variables (Full-service Restaurants) ............................................................................. 30 Table 19 Mean Number of Primary Data Items Out-of-compliance by Certified Food Protection Manager Status (Full-service Restaurants) .................................................. 31 Table 20 Pearson Product Correlations between Study Variables (Fast Food Restaurants) .................................................................................................................. 33 Table 21 Pearson Product Correlations between Study Variables (Full-service Restaurants) .................................................................................................................. 34 Table 22 Tests for Predictors of Out-Of-Compliance Items for Fast Food Restaurants 35
ii
Table 23 Regression Analysis (Fast Food Restaurants) ............................................... 36 Table 24 Least Squares Means (Fast Food Restaurants) ....................................... 36 Table 25 Tests for Predictors of Out-Of-Compliance Items for Full-service Restaurants ...................................................................................................................................... 37 Table 26 Regression Analysis (Full-service Restaurants) ....................................... 38 Table 27 Least Squares means (Full-service Restaurants) ..................................... 38 Table 28 Summary of Data Collection Time Frames for the Restaurant Industry ..... 66 Table 29 Fast Food Restaurants multi-factor ANOVA ................................................... 68 Table 30 Full-service restaurants multi-factor ANOVA .................................................. 69 Table 31 ANOVA by Food Safety Management System: Full-service Restaurant ........ 73 Table 32 ANOVA by Food Safety Management System: Fast Food Restaurant .......... 73 Table 33 Acronyms and Abbreviations .................................................................... 74

iii
LIST OF FIGURES
Figure 1 Study Selection Areas within a 150-mile Radius from 22 Specialists’ Locations 8 Figure 2 Bubble Plot of Mean Out of Compliance by Food Safety Management System ...................................................................................................................................... 71
1
ABSTRACT This report includes the background, design, and results of data collection on the occurrence of foodborne illness risk factors in the United States in restaurant settings during 2013-2014. It is a stand-alone report representing the first data collection period of the FDA’s current 10-year study on trends in the occurrence of foodborne illness risk factors, food safety behaviors/practices, and interventions in food service facilities. Data from the 2013-2014 collection will be used as a baseline to assess trends in the occurrence of risk factors during data collections, in 2017 and 2021. Additional data collections in 2015, 2019, and 2023 investigate similar retail food safety research questions in institutional food service settings and retail food stores.
BACKGROUND The restaurant industry is a major driver of food service and food safety in the United States. Consumer demand for food away from home has led to increased spending in both fast food and full-service restaurants (Powell, Nguyen, & Han, 2012; Stewart, Blisard, Bhuyan, & Nayga Jr., 2004), with more than one million restaurant locations employing more than 14 million people (NRA, 2016). Along with this high demand comes the need for careful attention to food safety practices and behaviors that minimize the incidence of foodborne illness in these locations.
Foodborne illness remains a major public health concern in the United States. Foodborne diseases cause approximately 48 million illnesses, 128,000 hospitalizations, and 3,000 deaths each year (Scallan et al., 2011). The annual economic burden from health losses due to foodborne illness is estimated at 77.7 billion dollars (Scharff, 2012).
According to the Centers for Disease Control and Prevention (CDC, 2014) more than half of foodborne illness outbreaks that occur each year are associated with food from restaurants. When considering incidents in 2014 involving a single location of food preparation, for example, restaurants accounted for 485 outbreaks (65%) and 4,780 illnesses (44%) (CDC, 2014).
In a study of restaurant-associated outbreaks in the United States from 1998-2013, Angelo, Nisler, Hall, Brown and Gould (2016) identified 9,788 restaurant-associated outbreaks, with a median of 620 outbreaks per year. Norovirus caused 46% of the 3,072 outbreaks associated with a single, confirmed etiology. Activities related to food handling and preparation practices were the most commonly reported contributing factors within restaurant-associated outbreaks.
2
Surveillance data from the CDC have consistently identified five major risk factors related to food safety practices within the retail food industry that contribute to foodborne illness. Most regulatory retail food inspection programs throughout the United States monitor these risk factors in their routine inspections, and each necessitates specific food safety behaviors and practices. These risk factors include:
• Poor personal hygiene
• Improper food holding/time and temperature
• Contaminated equipment/protection from contamination
• Inadequate cooking
• Food obtained from unsafe sources
Tracking these risk factors and their respective intervention strategies provides a consistent means of monitoring food safety efforts and determining trends over time within the restaurant industry. The U.S. Food and Drug Administration (FDA) promotes and conducts research designed to inform the application of science-based food safety principles in retail and food service settings to minimize the incidence of foodborne illness. Research results support developing and delivering scientifically based guidance, training, program evaluation, and technical assistance to retail food regulatory agencies and the industries they regulate.
FDA previously conducted a 10-year study between 1998-2008 to measure trends in the occurrence of foodborne illness risk factors and food safety behaviors/practices. This study consisted of three data collection periods (1998, 2003, and 2008), and FDA summarized the findings for each (FDA, 2000; FDA, 2004; FDA, 2009). Data from all three periods were analyzed to detect trends over time and determine whether progress had been made toward the goal of reducing the occurrence of risk factors in food service and retail food establishments (FDA, 2010). Significant improvement in at least one risk factor occurred in eight of the nine facility types FDA studied; however, many segments of the retail food industry continued to require improvement in three critical areas:
• Poor personal hygiene
• Improper food holding/time and temperature
• Contaminated equipment/protection from contamination
At the conclusion of the 10-year study conducted between 1998 and 2008, FDA determined that it needed additional research to identify the root causes for all poor retail food safety practices and to determine the most effective intervention strategies

3
and inspection approaches for enhancing the safety of the nation’s retail food protection system.
The 2013-2014 data collection reported here starts the process of additional research. The intervention strategies and factors of interest encompass active managerial control, regulatory characteristics, and establishment characteristics. Data from the 2013-2014 collection will be used as a baseline to assess trends in the occurrence of risk factors during data collections, in 2017 and 2021. Table 1 summarizes the time frames for restaurant data collection within the overall study period.
Table 1 Summary of Data Collection Time Frames for the Restaurant Industry
Industry Segment
Facility Type
Initial Data Collection Period
(Baseline Measurement)
2ND Data Collection
Period
3RD Data Collection
Period
Restaurants
Full-service Restaurants
and Fast Food
Restaurants
Nov. 15, 2013 to
Sept. 30, 2014
Oct. 1, 2017 to
Sept. 30, 2018
Oct. 1, 2021 to
Sept. 30, 2022

4
Purpose of the Study The purpose of each restaurant data collection during the current 10-year study period is to investigate the relationship between food safety management systems (FSMS), certified food protection managers (CFPMs), and the occurrence of risk factors and food safety behaviors/practices commonly associated with foodborne illness in restaurants.
FSMS refers to a specific set of actions (e.g., procedures, training, and monitoring) to help achieve active managerial control. While FSMS procedures vary across the retail and food service industry, purposeful implementation of those procedures, training, and monitoring are consistent components of FSMS. While several systems and tools are available internationally, including International Organization for Standardization (ISO 22000), Good Manufacturing Practices (GMP), Hazard Analysis and Critical Control Points (HACCP), British Retail Consortium (BRC) and Safe Quality Food Institute (SQF) (Codex, 2003; ISO 22000:2005, 2005; Luning et al., 2008), the ongoing prevalence and degree of implementation of these or similar systems within restaurants in the United States remains understudied. Inadequate FSMS are thought to contribute to the worldwide burden of foodborne disease (Luning et al., 2008). For example, HACCP has been shown to have positive effects on food safety, but the poor implementation of HACCP has been described as a precursor to foodborne outbreaks (Cormier, 2007; Luning et al., 2009; Ropkins and Beck, 2000).
A CFPM is an individual who has shown proficiency in food safety information by passing a test that is part of an accredited program (FDA, 2013a). Research has shown that the presence of a CFPM is associated with improved inspection scores (Hedberg et al., 2007; Cates et al., 2008, Brown et al., 2014). Hedberg et al. (2006) found that the major difference between outbreak and non-outbreak restaurants was the presence of a CFPM.
Our objectives are to:
• Identify the least and most often occurring foodborne illness risk factor and food safety behaviors/practices in restaurants within the United States
• Determine the extent to which FSMS and the presence of a CFPM impact the occurrence of food safety behaviors/practices
• Determine whether the occurrence of food safety behaviors/practices in restaurants differs based on an establishment’s risk categorization and status as a single-unit or multiple-unit operation (e.g., restaurants that are part of an operation with two or more units)
5
The results of the current 10-year study period will be used to:
• Develop retail food safety initiatives, policies, and targeted intervention strategies focused on controlling foodborne illness risk factors
• Provide technical assistance to state, local, tribal, and territorial regulatory professionals
• Identify FDA retail work plan priorities
• Inform FDA resource allocation to enhance retail food safety nationwide
Intervention Strategies and Factors of Interest
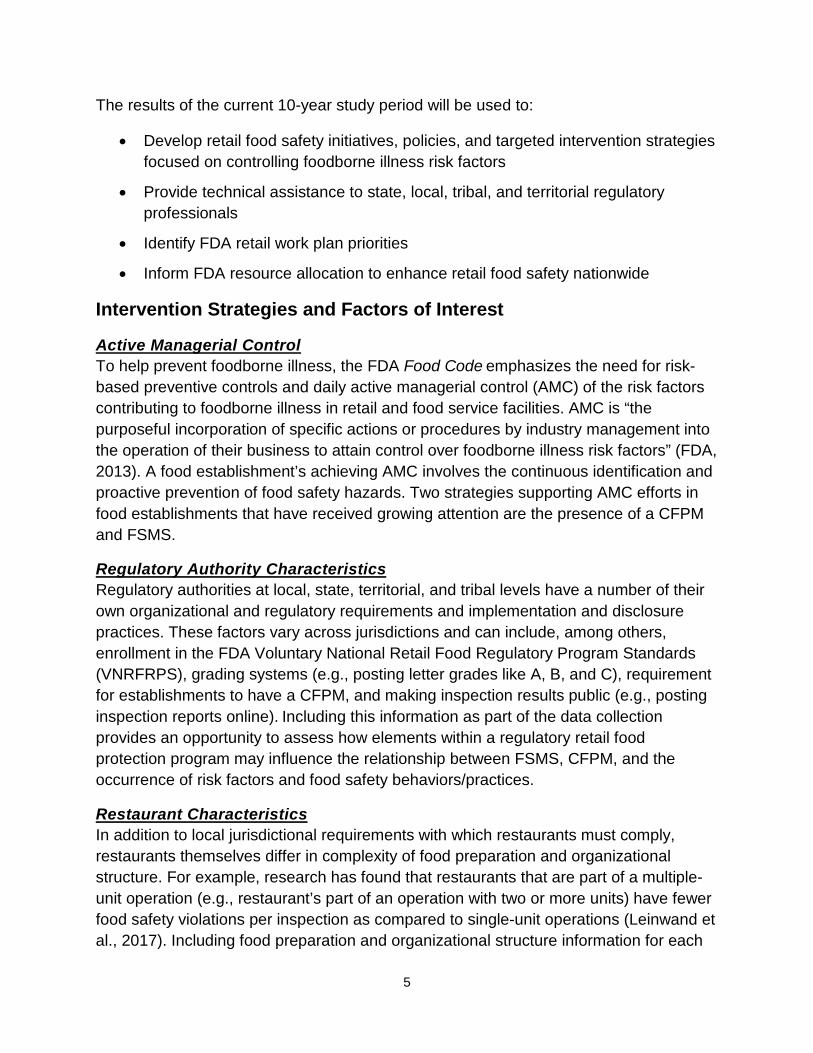
Active Managerial Control To help prevent foodborne illness, the FDA Food Code emphasizes the need for risk-based preventive controls and daily active managerial control (AMC) of the risk factors contributing to foodborne illness in retail and food service facilities. AMC is “the purposeful incorporation of specific actions or procedures by industry management into the operation of their business to attain control over foodborne illness risk factors” (FDA, 2013). A food establishment’s achieving AMC involves the continuous identification and proactive prevention of food safety hazards. Two strategies supporting AMC efforts in food establishments that have received growing attention are the presence of a CFPM and FSMS.
Regulatory Authority Characteristics Regulatory authorities at local, state, territorial, and tribal levels have a number of their own organizational and regulatory requirements and implementation and disclosure practices. These factors vary across jurisdictions and can include, among others, enrollment in the FDA Voluntary National Retail Food Regulatory Program Standards (VNRFRPS), grading systems (e.g., posting letter grades like A, B, and C), requirement for establishments to have a CFPM, and making inspection results public (e.g., posting inspection reports online). Including this information as part of the data collection provides an opportunity to assess how elements within a regulatory retail food protection program may influence the relationship between FSMS, CFPM, and the occurrence of risk factors and food safety behaviors/practices.
Restaurant Characteristics In addition to local jurisdictional requirements with which restaurants must comply, restaurants themselves differ in complexity of food preparation and organizational structure. For example, research has found that restaurants that are part of a multiple-unit operation (e.g., restaurant’s part of an operation with two or more units) have fewer food safety violations per inspection as compared to single-unit operations (Leinwand et al., 2017). Including food preparation and organizational structure information for each
6
restaurant in this data collection allows for assessing how the occurrence of food safety behaviors/practices in restaurants differs based on complexity of food preparation and status as a single-unit or multiple-unit operation.
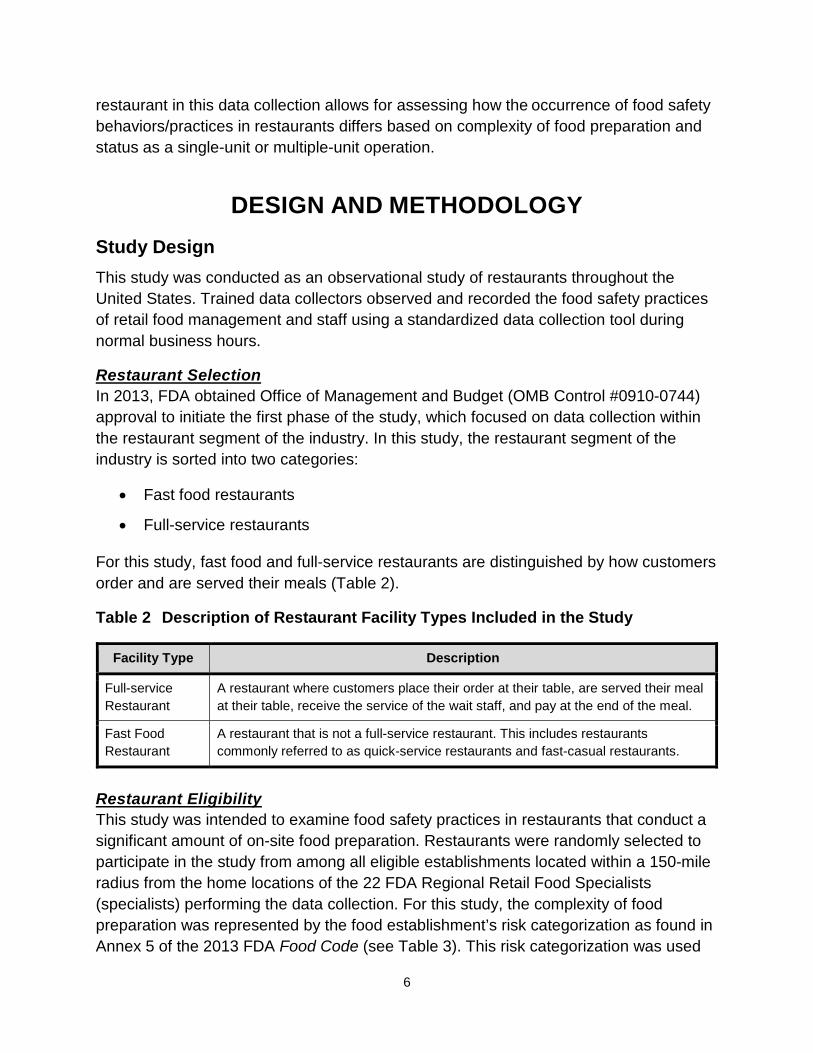
DESIGN AND METHODOLOGY Study Design This study was conducted as an observational study of restaurants throughout the United States. Trained data collectors observed and recorded the food safety practices of retail food management and staff using a standardized data collection tool during normal business hours.
Restaurant Selection In 2013, FDA obtained Office of Management and Budget (OMB Control #0910-0744) approval to initiate the first phase of the study, which focused on data collection within the restaurant segment of the industry. In this study, the restaurant segment of the industry is sorted into two categories:
• Fast food restaurants
• Full-service restaurants
For this study, fast food and full-service restaurants are distinguished by how customers order and are served their meals (Table 2).
Table 2 Description of Restaurant Facility Types Included in the Study
Facility Type Description
Full-service Restaurant
A restaurant where customers place their order at their table, are served their meal at their table, receive the service of the wait staff, and pay at the end of the meal.
Fast Food Restaurant
A restaurant that is not a full-service restaurant. This includes restaurants commonly referred to as quick-service restaurants and fast-casual restaurants.
Restaurant Eligibility This study was intended to examine food safety practices in restaurants that conduct a significant amount of on-site food preparation. Restaurants were randomly selected to participate in the study from among all eligible establishments located within a 150-mile radius from the home locations of the 22 FDA Regional Retail Food Specialists (specialists) performing the data collection. For this study, the complexity of food preparation was represented by the food establishment’s risk categorization as found in Annex 5 of the 2013 FDA Food Code (see Table 3). This risk categorization was used
7
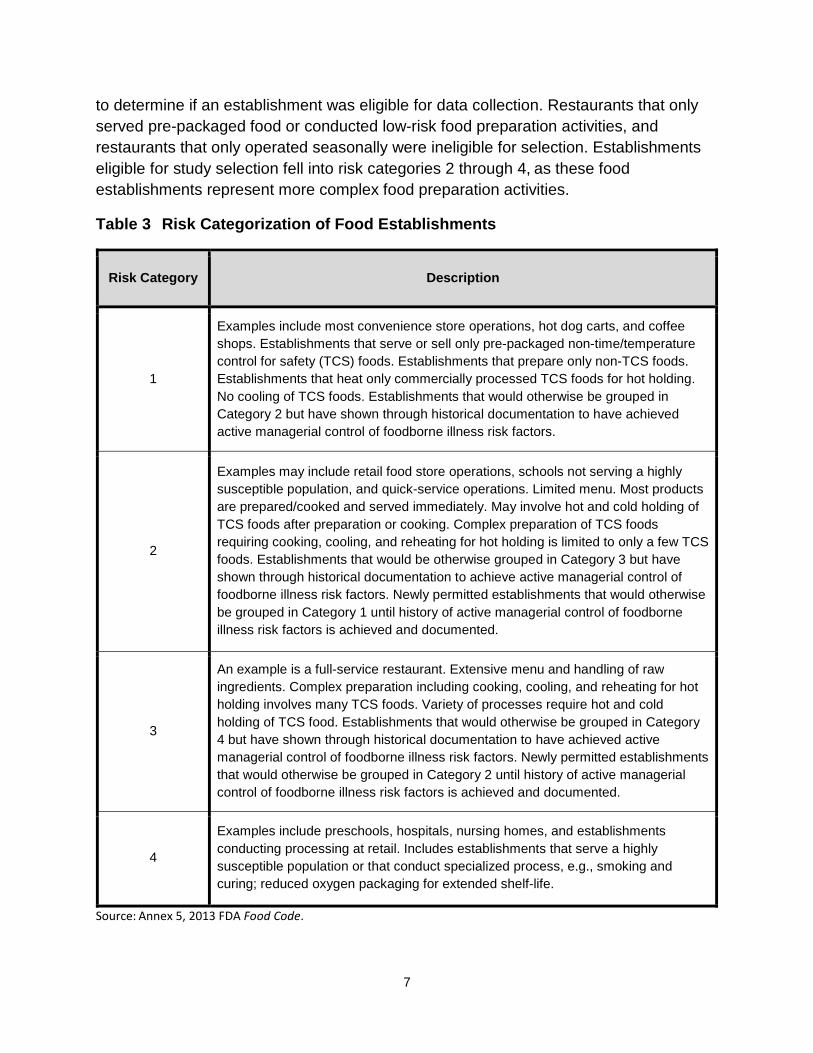
to determine if an establishment was eligible for data collection. Restaurants that only served pre-packaged food or conducted low-risk food preparation activities, and restaurants that only operated seasonally were ineligible for selection. Establishments eligible for study selection fell into risk categories 2 through 4, as these food establishments represent more complex food preparation activities.
Table 3 Risk Categorization of Food Establishments
Risk Category Description
1
Examples include most convenience store operations, hot dog carts, and coffee shops. Establishments that serve or sell only pre-packaged non-time/temperature control for safety (TCS) foods. Establishments that prepare only non-TCS foods. Establishments that heat only commercially processed TCS foods for hot holding. No cooling of TCS foods. Establishments that would otherwise be grouped in Category 2 but have shown through historical documentation to have achieved active managerial control of foodborne illness risk factors.
2
Examples may include retail food store operations, schools not serving a highly susceptible population, and quick-service operations. Limited menu. Most products are prepared/cooked and served immediately. May involve hot and cold holding of TCS foods after preparation or cooking. Complex preparation of TCS foods requiring cooking, cooling, and reheating for hot holding is limited to only a few TCS foods. Establishments that would be otherwise grouped in Category 3 but have shown through historical documentation to achieve active managerial control of foodborne illness risk factors. Newly permitted establishments that would otherwise be grouped in Category 1 until history of active managerial control of foodborne illness risk factors is achieved and documented.
3
An example is a full-service restaurant. Extensive menu and handling of raw ingredients. Complex preparation including cooking, cooling, and reheating for hot holding involves many TCS foods. Variety of processes require hot and cold holding of TCS food. Establishments that would otherwise be grouped in Category 4 but have shown through historical documentation to have achieved active managerial control of foodborne illness risk factors. Newly permitted establishments that would otherwise be grouped in Category 2 until history of active managerial control of foodborne illness risk factors is achieved and documented.
4
Examples include preschools, hospitals, nursing homes, and establishments conducting processing at retail. Includes establishments that serve a highly susceptible population or that conduct specialized process, e.g., smoking and curing; reduced oxygen packaging for extended shelf-life.
Source: Annex 5, 2013 FDA Food Code.
8
Data Collection Twenty-two specialists conducted site visits throughout the United States at randomly selected restaurants to perform data collections. All specialists received customized training specific to the study data collection protocol and marking instructions for the standardized data collection tool. FDA’s Center for Food Safety and Applied Nutrition (CFSAN) personnel standardized the specialists in applying and interpreting the FDA Food Code. In addition, all specialists possessed technical expertise in retail food safety and a solid understanding of food service operations within the restaurant industry.
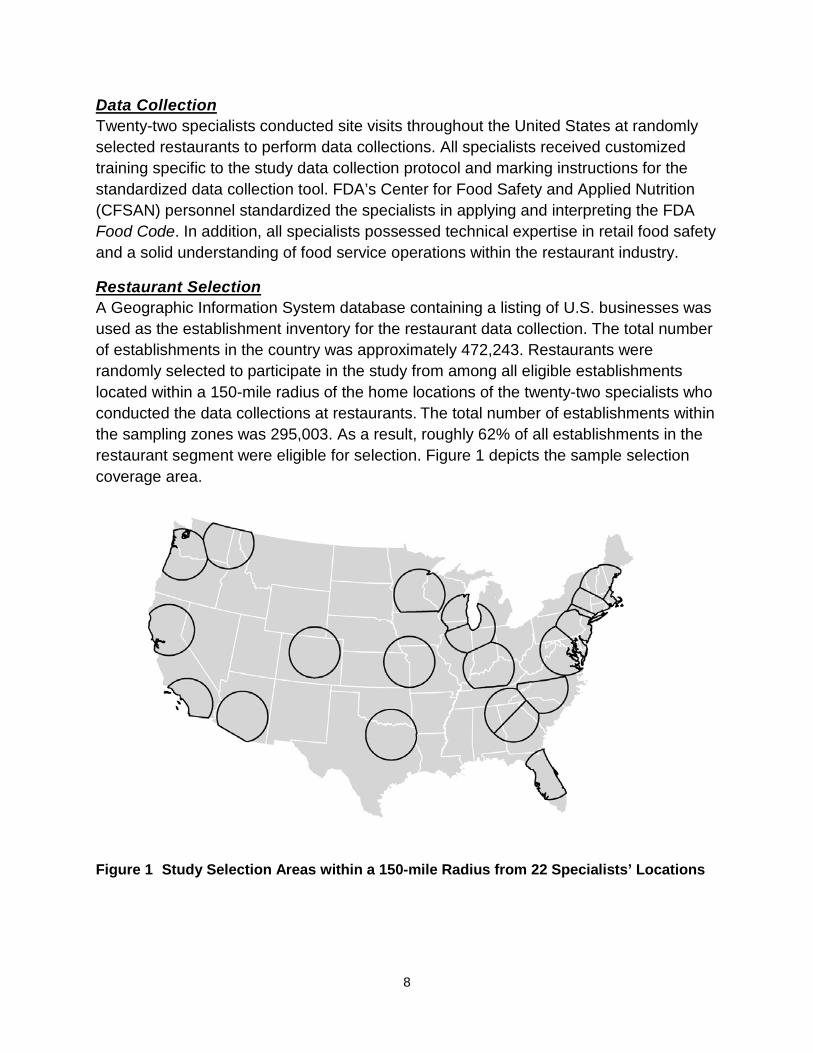
Restaurant Selection A Geographic Information System database containing a listing of U.S. businesses was used as the establishment inventory for the restaurant data collection. The total number of establishments in the country was approximately 472,243. Restaurants were randomly selected to participate in the study from among all eligible establishments located within a 150-mile radius of the home locations of the twenty-two specialists who conducted the data collections at restaurants. The total number of establishments within the sampling zones was 295,003. As a result, roughly 62% of all establishments in the restaurant segment were eligible for selection. Figure 1 depicts the sample selection coverage area.
Figure 1 Study Selection Areas within a 150-mile Radius from 22 Specialists’ Locations

9
Sample Size The FDA CFSAN Biostatistics Team determined that a minimum of 384 data collections of each restaurant facility type was needed during the initial and subsequent data collection periods. This sample size provides sufficient observations of food safety practices to be 95% confident that compliance percentages derived from the data collections are within 5% of their actual occurrence. For this study, the sample size was 396 data collections for full-service restaurants and 425 for fast food restaurants.
The sample establishment inventory was distributed evenly among the specialists. Since industry participation in the study was voluntary, a list of substitute restaurants was selected for each specialist for establishments that were found to be misclassified, closed, or otherwise unable or unwilling to participate. The FDA CFSAN Biostatistics Team randomly selected and maintained the inventory of substitute establishments.
Study Protocol and Methodology Appendix A reproduces the data collection form used to collect observations in this study. A comprehensive presentation of the study protocol for data collection and marking instructions for the data collection form can be accessed using the web links provided in the References for the following documents:
• Food and Drug Administration (2013b), Study on the Occurrence of Foodborne Illness Risk Factors in Selected Retail and Foodservice Facility Types (2013-2023) – Protocol for the Data Collection
• Food and Drug Administration (2013c), Retail Food Program Foodborne Illness Risk Factor Study – Marking Instructions for the Data Collection Form
Eligibility Verification of Randomly Selected Restaurants The state or local jurisdictions with regulatory responsibility for conducting retail food inspections of the selected restaurants were contacted prior to conducting a data collection at the establishment. Specialists verified that the selected restaurant was placed in the proper restaurant category and, through discussions with the regulatory authority, determined whether the restaurant was under any legal notice. If the selected restaurant was under a legal notice, closed, or misclassified, the specialist did not conduct a data collection at that establishment, and a substitute was randomly selected.
Regulatory Authorities of Selected Restaurants As part of the initial contact with the state or local regulatory authority, the specialist obtained information pertaining to its retail food inspection program, such as enrollment in the FDA Voluntary National Retail Food Regulatory Program Standards (VNRFRPS), timing of regulatory inspections, use of grading systems, posting of inspection results, manager certification requirements, and required food handler training. This information

10
was included as part of the data collection for the selected restaurants and provided an opportunity to assess how elements within a regulatory retail food protection program impact the relationship between FSMS, CFPM, and the occurrence of risk factors and food safety behaviors/practices.
Each specialist extended an invitation to the state or local regulatory agency representative to accompany him or her during the data collection. When restaurant conditions merited regulatory actions, the accompanying state or local representative could intervene to ensure appropriate corrective actions were taken. If a state or local representative was not with the specialist during the data collection and conditions warranted regulatory action, the specialist contacted the regulatory authority after completing the data collection so that any necessary follow up could occur.
Data Collection Protocol The specialist conducted unannounced, non-regulatory visits to each selected restaurant. Upon arrival at the establishment, the specialist explained the purpose of the visit to the owner or person in charge. An introductory letter explaining the purpose of the data collection visit, included in Appendix B, was also presented to the person in charge. If the owner or person in charge denied entry into the restaurant, data collection was not performed, and a substitute restaurant was randomly selected to replace the one that opted not to participate in the study.
The specialist used the 2013 FDA Food Code as the standard of measurement for compliance markings for observations of employee food safety behaviors/practices. Quantitative measurements of food product temperatures, sanitizer concentrations, and dish machine final rinse temperatures were collected using calibrated equipment such as thermocouples, heat-sensitive tape, and maximum registering stem thermometers. Visual observations of food safety practices were supplemented by asking questions of food employees and/or managers to ensure clear understanding of food processes and procedures. The owner or person in charge of the restaurant was encouraged to accompany the specialist during data collection.
Risk Factors and Associated Data Items This study focuses on observation and/or measurement of food safety practices/behaviors associated with the occurrence of foodborne illness risk factors. Four foodborne illness risk factors, comprising specific food safety behaviors (data items), were used as the key indicators for FDA’s statistical analysis for this study. Data items in this study are based on FDA Food Code recommendations and are designed to control food safety behaviors/practices. Table 4 presents the 10 data items and their associated risk factors. Ensuring that food is obtained from an approved source is the first line of defense for restaurants. FDA’s study design did not include this risk factor under the primary data items because the agency observed low out-of-compliance

11
percentages in the previous FDA 10-year study, and inspections conducted by regulatory partners substantiated these findings.
Table 4 Foodborne Illness Risk Factors and the Associated Primary Data Items Examined in the Study
Foodborne Illness Risk Factor Associated Primary Data Item Numbers and Description
Poor Personal Hygiene
• Data Item #1 – Employees practice proper handwashing. • Data Item #2 – Employees do not contact ready-to-eat foods with bare
hands.
Contaminated Equipment/Protection from Contamination
• Data Item #3 – Food is protected from cross contamination during storage, preparation, and display.
• Data Item #4 – Food contact surfaces are properly cleaned and sanitized.
Improper Holding Time/Temperature
• Data Item #5 – Foods requiring refrigeration are held at the proper temperature.
• Data Item #6 – Foods displayed or stored hot are held at the proper temperature.
• Data Item #7 – Foods are cooled properly. • Data Item #8 – Refrigerated, ready-to-eat foods are properly date
marked and discarded within 7 days of preparation or opening.
Inadequate Cooking • Data Item #9 – Raw animal foods are cooked to required temperatures. • Data Item #10 – Cooked foods are reheated to required temperatures.
Data Items, Information Statements, and Documenting Observations Using the 2013 version of the FDA Food Code, the specialist marked observations and findings on the data collection form in four categories (see Appendix A). The specialist determined whether observations of employee food safety practices or behaviors contained in the information statements were in compliance, out-of-compliance, not observed, or not applicable:
• In Compliance (IN): One or more information statements that are part of the data item were recorded as in compliance, and none of the information statements that are part of the data item was recorded as out-of-compliance.
• Out-of-compliance (OUT): One or more information statements that are part of the data item were recorded as out-of-compliance.
• Not Observed (NO): None of the information statements that are part of the data item was recorded as in compliance or out-of-compliance, and one or more information statements that are part of the data item were recorded as not observed. The “NO” marking was used when an information statement is a usual

12
practice in the food establishment, but the specialist did not observe the practice during the data collection.
• Not Applicable (NA): All information statements that are part of the data item were recorded as not applicable. The “NA” marking was used when a data item or information statement was not a function of the food establishment.
Calculating Compliance Percentages for Food Safety Behaviors/Practices Each data item comprises information statements related to specific food safety behaviors/practices. If any food safety practice was observed to be out-of-compliance, then the overall data item was marked out-of-compliance.1 The following formula calculates the percentage of out-of-compliance observations for each data item:
Percent out-of-compliance observations for each data item represents the proportion of establishments where that data item was found out-of-compliance. If, for example, the data shows 80% out-of-compliance for the proper cooling of foods this means that there was at least one observation of improper cooling of foods in eight out of 10 establishments where cooling of TCS foods was observed. The 80% score should not be interpreted to mean that foods were not cooled properly 80% of the time.
Calculating Compliance Percentages for Each Risk Factor Each risk factor category encompasses a number of different food safety practices that take place in restaurants and for which widely recognized prevention-based controls exist which, when followed, may prevent or minimize the impact of foodborne illness outbreaks. If any data item that is part of a risk factor was marked “OUT,” the risk factor was considered out-of-compliance. The following formula calculates the percentage of restaurants out-of-compliance for each risk factor:
1 The previous FDA Report on the Occurrence of Foodborne Illness Risk Factors in Selected Institutional Foodservice, Restaurant, and Retail Food Store Facility Types (2009) used a weighted average.

13
Assessing Food Protection Manager Certification During data collection, the specialist obtained information about the scope and type of food protection manager certification attained by restaurant personnel. An assessment was made to determine whether
• A CFPM was employed at the restaurant
• A CFPM was present during data collection
• The person in charge (as defined in the FDA Food Code) at the time of data collection was a CFPM
For each area listed above where restaurant personnel provided a “yes” response, the specialist made an attempt to verify the response by requesting to view a copy of the certificate. The specialist also noted whether the certification was obtained from
• An American National Standards Institute (ANSI)-accredited food protection manager certification program2.
• A food protection manager certification program that was not ANSI-accredited, such as one that may have been developed and administered by the state or local regulatory authority with inspection oversight for the restaurant
• A source for which the restaurant personnel could not provide documentation or specific reference
In addition, by interviewing the person in charge, the specialist determined whether it was the restaurant’s policy to have a food protection manager present at all times, to gather baseline information on restaurants that have such a policy in place.
Assessing Food Safety Management Systems A FSMS refers to a specific set of actions and/or procedures to help achieve active managerial control. While FSMS vary across the retail and food service industry, the purposeful implementation of those procedures, training, and monitoring are consistent components of FSMS. For the purpose of this study, these three key elements were used to assess a restaurant’s FSMS:
2 The American National Standards Institute (ANSI) provides independent third-party evaluation and accreditation of certification bodies determined to be in conformance with the Standards for Accreditation of Food Protection Manager Certification Programs available from the Conference for Food Protection (CFP). A food employee certified by a food protection manager certification program that is evaluated and listed by a CFP-recognized accrediting agency as conforming to the CFP Standards is deemed to comply with the 2013 FDA Food Code, §2-102.12, Certified Food Protection Manager.

14
• Procedures (P): A defined set of actions adopted by food service management for accomplishing a task in a way that minimizes food safety risks
• Training (T): The process of management’s informing employees of the food safety procedures within the restaurant and teaching employees how to carry them out
• Monitoring (M): Routine observations and measurements conducted to determine if food safety procedures are being followed and maintained
Taken collectively, these elements are referred to as an establishment’s “PTM” rating. During data collection, the specialist assessed each restaurant’s FSMS to determine the extent to which FSMS were developed and implemented in the restaurant to control one of the four foodborne illness risk factors shown in Table 4 that include the 10 primary data items in the study. The risk factor for which a FSMS assessment was conducted in each restaurant was randomly selected.
For each of three FSMS key elements, the specialist interviewed the person in charge to determine if the assessment criteria for the assigned foodborne illness risk factor were addressed. The assessment criteria focused on determining if:
• Management is able to describe the critical limits for (the specific risk factor procedure or practice) as they apply to the restaurant.
• Management is able to describe the steps/tasks (how and when) that are performed to ensure the identified critical limits for (the specific risk factor procedure or practice) are achieved.
• Management is able to identify specific employees that have been assigned the responsibility to correctly perform (the specific risk factor procedure or practice).
• Management is able to produce written materials (standard operating procedures, posters, wall charts, wallet cards, etc.) that support implementing the system to control (the specific risk factor procedure or practice) within the restaurant.
Based on management responses for each area described above, the specialist used a standardized system to rate each food safety management system element (Procedures, Training, and Monitoring (PTM)).
15
For this study, rating numbers (1 through 4) were defined as follows:
1 Nonexistent: No system in place or system haphazardly implemented (no defined structure or frequency for implementation).
2 Underdeveloped: System is in early development. Efforts are being made, but there are crucial gaps in completeness and/or consistency.
3 Well-developed: System is complete, consistent, and oral or a combination of oral and written. The preponderance of the management system is oral.
4 Well-developed and Documented: System is complete, consistent, and primarily written. The preponderance of the management system is written.
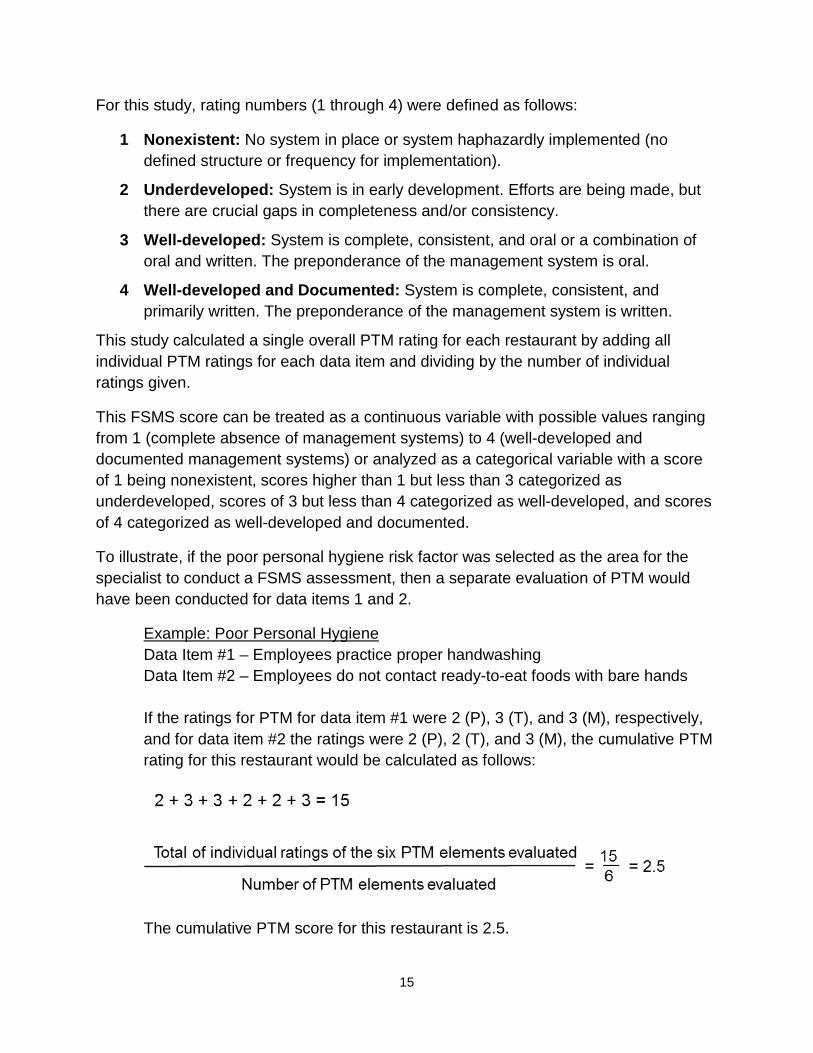
This study calculated a single overall PTM rating for each restaurant by adding all individual PTM ratings for each data item and dividing by the number of individual ratings given.
This FSMS score can be treated as a continuous variable with possible values ranging from 1 (complete absence of management systems) to 4 (well-developed and documented management systems) or analyzed as a categorical variable with a score of 1 being nonexistent, scores higher than 1 but less than 3 categorized as underdeveloped, scores of 3 but less than 4 categorized as well-developed, and scores of 4 categorized as well-developed and documented.
To illustrate, if the poor personal hygiene risk factor was selected as the area for the specialist to conduct a FSMS assessment, then a separate evaluation of PTM would have been conducted for data items 1 and 2.
Example: Poor Personal Hygiene Data Item #1 – Employees practice proper handwashing Data Item #2 – Employees do not contact ready-to-eat foods with bare hands If the ratings for PTM for data item #1 were 2 (P), 3 (T), and 3 (M), respectively, and for data item #2 the ratings were 2 (P), 2 (T), and 3 (M), the cumulative PTM rating for this restaurant would be calculated as follows:
The cumulative PTM score for this restaurant is 2.5.
16
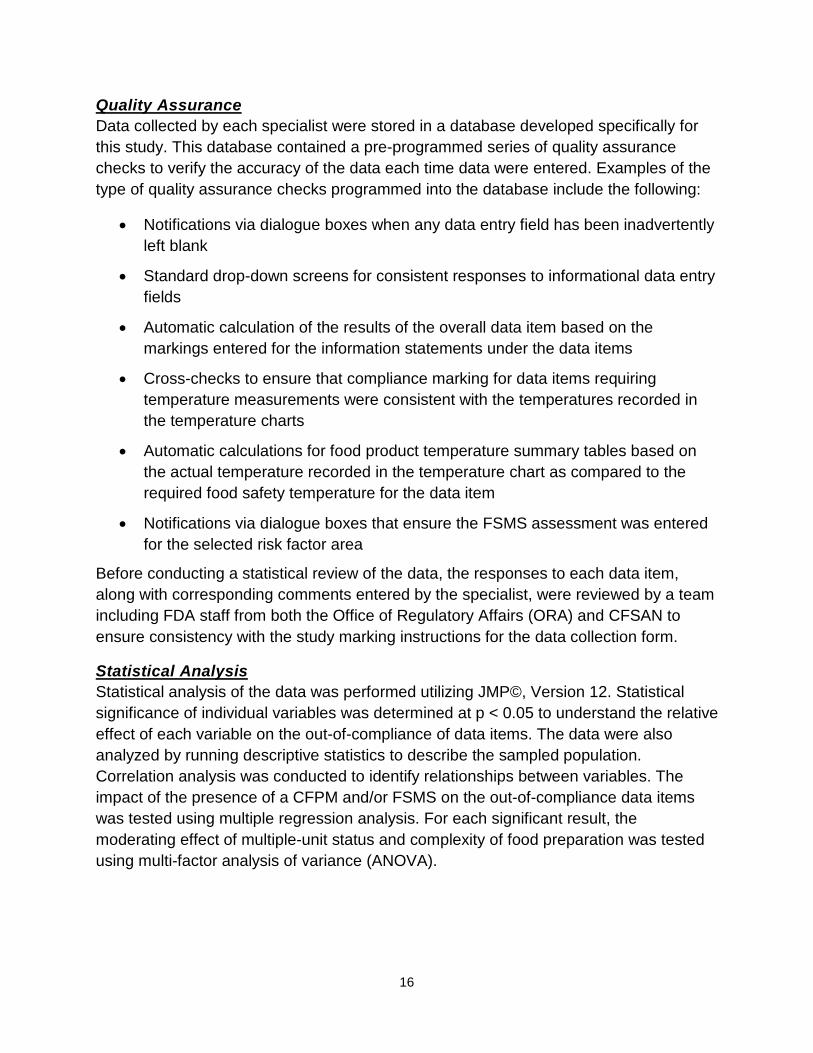
Quality Assurance Data collected by each specialist were stored in a database developed specifically for this study. This database contained a pre-programmed series of quality assurance checks to verify the accuracy of the data each time data were entered. Examples of the type of quality assurance checks programmed into the database include the following:
• Notifications via dialogue boxes when any data entry field has been inadvertently left blank
• Standard drop-down screens for consistent responses to informational data entry fields
• Automatic calculation of the results of the overall data item based on the markings entered for the information statements under the data items
• Cross-checks to ensure that compliance marking for data items requiring temperature measurements were consistent with the temperatures recorded in the temperature charts
• Automatic calculations for food product temperature summary tables based on the actual temperature recorded in the temperature chart as compared to the required food safety temperature for the data item
• Notifications via dialogue boxes that ensure the FSMS assessment was entered for the selected risk factor area
Before conducting a statistical review of the data, the responses to each data item, along with corresponding comments entered by the specialist, were reviewed by a team including FDA staff from both the Office of Regulatory Affairs (ORA) and CFSAN to ensure consistency with the study marking instructions for the data collection form.
Statistical Analysis Statistical analysis of the data was performed utilizing JMP©, Version 12. Statistical significance of individual variables was determined at p < 0.05 to understand the relative effect of each variable on the out-of-compliance of data items. The data were also analyzed by running descriptive statistics to describe the sampled population. Correlation analysis was conducted to identify relationships between variables. The impact of the presence of a CFPM and/or FSMS on the out-of-compliance data items was tested using multiple regression analysis. For each significant result, the moderating effect of multiple-unit status and complexity of food preparation was tested using multi-factor analysis of variance (ANOVA).
17
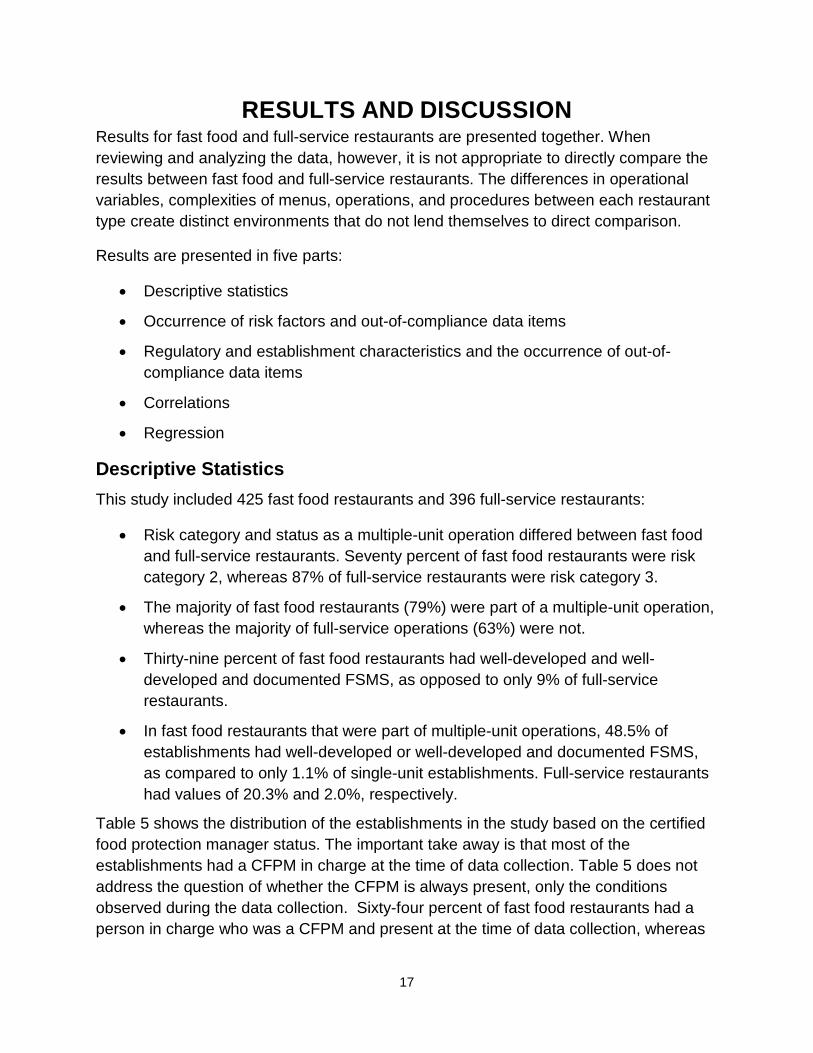
RESULTS AND DISCUSSION Results for fast food and full-service restaurants are presented together. When reviewing and analyzing the data, however, it is not appropriate to directly compare the results between fast food and full-service restaurants. The differences in operational variables, complexities of menus, operations, and procedures between each restaurant type create distinct environments that do not lend themselves to direct comparison.
Results are presented in five parts:
• Descriptive statistics
• Occurrence of risk factors and out-of-compliance data items
• Regulatory and establishment characteristics and the occurrence of out-of-compliance data items
• Correlations
• Regression
Descriptive Statistics This study included 425 fast food restaurants and 396 full-service restaurants:
• Risk category and status as a multiple-unit operation differed between fast food and full-service restaurants. Seventy percent of fast food restaurants were risk category 2, whereas 87% of full-service restaurants were risk category 3.
• The majority of fast food restaurants (79%) were part of a multiple-unit operation, whereas the majority of full-service operations (63%) were not.
• Thirty-nine percent of fast food restaurants had well-developed and well-developed and documented FSMS, as opposed to only 9% of full-service restaurants.
• In fast food restaurants that were part of multiple-unit operations, 48.5% of establishments had well-developed or well-developed and documented FSMS, as compared to only 1.1% of single-unit establishments. Full-service restaurants had values of 20.3% and 2.0%, respectively.
Table 5 shows the distribution of the establishments in the study based on the certified food protection manager status. The important take away is that most of the establishments had a CFPM in charge at the time of data collection. Table 5 does not address the question of whether the CFPM is always present, only the conditions observed during the data collection. Sixty-four percent of fast food restaurants had a person in charge who was a CFPM and present at the time of data collection, whereas
18
19% had no CFPM at all. In full-service restaurants, 58% had a person in charge who was a CFPM and present at the time of data collection, as opposed to 26% with no CFPM. It is worth noting that the majority of all restaurants in this study operated in jurisdictions enrolled in the VNRFRPS, but the majority of those jurisdictions did not meet Program Standard 1, which applies to the regulatory foundation used by a retail food program (Table 6).3 Most restaurants also operated in jurisdictions that used grading and scoring systems, publicly posted inspection results, and had a requirement that establishments must have a CFPM (Table 6).
3 The VNRFRPS (Voluntary National Retail Food Regulatory Program Standards) define what constitutes a highly effective and responsive program for regulating food service and retail food establishments. They begin by providing a regulatory foundation (Program Standard 1), which includes any statute, regulation, rule, ordinance, or other prevailing set of regulatory requirements that governs the operation of a retail food establishment. They progress to a system upon which all regulatory programs can build through a continuous improvement process. The Retail Program Standards encourage regulatory agencies to improve and build upon existing programs. Further, they provide a framework designed to accommodate both traditional and emerging approaches to food safety. More information is available at http://www.fda.gov/Food/GuidanceRegulation/RetailFoodProtection/ProgramStandards/default.htm.

19
Table 5 Descriptive Statistics
Characteristic
Number of Fast Food
Restaurants (N = 425)
%
Number of Full-service Restaurants
(N = 396)
%
Certified Food Protection Manager
None 82 19.29 101 25.51
Employed but not present 53 12.47 45 11.36
Employed and present 16 3.76 20 5.05
Person in charge 274 64.47 230 58.08
Food Safety Management System4
Nonexistent 56 13.37 124 31.31
Underdeveloped 201 47.97 237 59.85
Well-developed 119 28.40 24 6.06
Well-developed and documented 43 10.26 11 2.78
Risk Categorization
Risk category 2 298 70.12 35 8.84
Risk category 3 126 29.65 343 86.62
Risk category 4 1 0.24 18 4.55
Multiple-unit
Yes 337 79.29 148 37.37
No 88 20.71 248 62.63
4 PTM evaluations were not performed for six establishments at which inadequate cooking was randomly selected as the area for the specialist to conduct a FSMS assessment. A FSMS assessment of the inadequate cooking risk factor required calculation of an overall PTM score based on an evaluation of data items 9 (Raw animal foods are cooked to required temperatures) and 10 (Cooked foods are reheated to required temperatures). However, the six establishments did not do any cooking or reheating so data items 9 and 10 were marked not applicable.

20
Table 6 Jurisdictional Characteristics
Characteristic
Number of Fast Food
Restaurants (N = 425)
%
Number of Full-service Restaurants
(N = 396)
%
Jurisdiction enrolled in VNRFRPS
Yes 283 66.59 244 61.62
No 142 33.41 152 38.38
Jurisdiction meets VNRFRPS Standard 1
Yes 98 34.63 80 32.79
No 185 65.37 164 67.21
Jurisdiction uses a grading system
Yes 264 62.12 225 56.82
No 161 37.88 171 43.18
Jurisdiction requires public posting of inspection results
Yes 324 76.24 286 72.22
No 101 23.76 110 27.78
Jurisdiction has mandatory certified food protection manager requirement
Yes 299 70.35 279 70.45
No 126 29.65 117 29.55
21
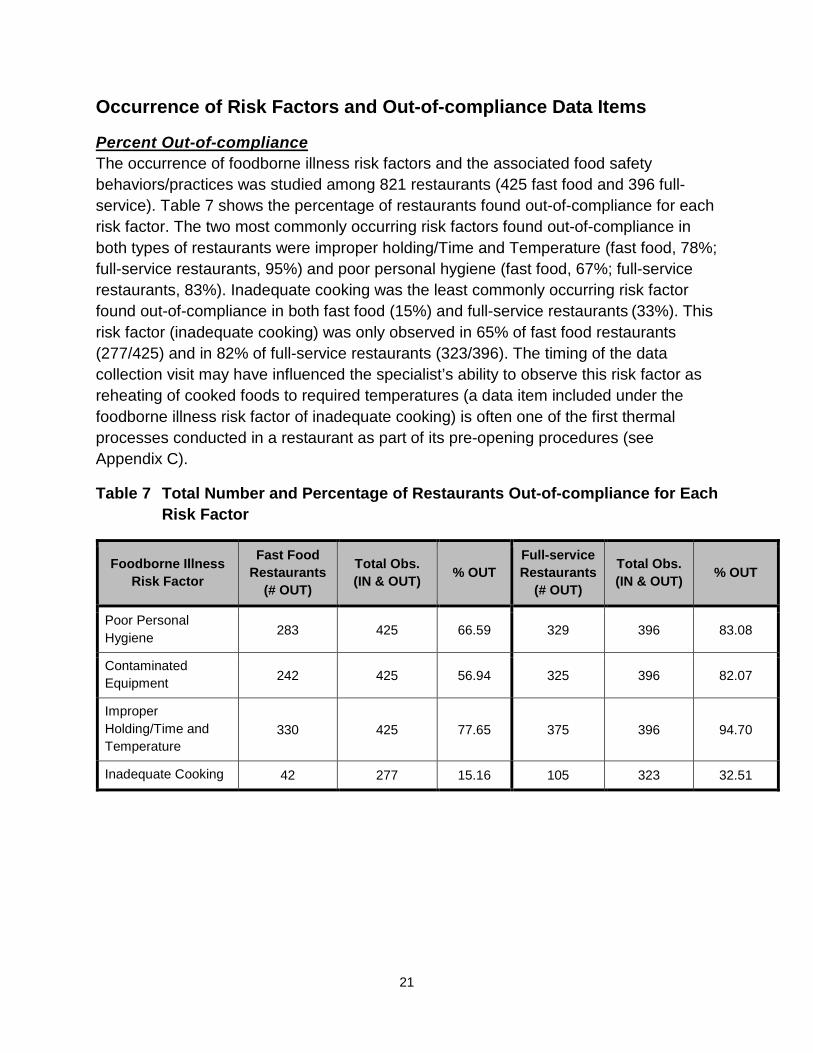
Occurrence of Risk Factors and Out-of-compliance Data Items
Percent Out-of-compliance The occurrence of foodborne illness risk factors and the associated food safety behaviors/practices was studied among 821 restaurants (425 fast food and 396 full-service). Table 7 shows the percentage of restaurants found out-of-compliance for each risk factor. The two most commonly occurring risk factors found out-of-compliance in both types of restaurants were improper holding/Time and Temperature (fast food, 78%; full-service restaurants, 95%) and poor personal hygiene (fast food, 67%; full-service restaurants, 83%). Inadequate cooking was the least commonly occurring risk factor found out-of-compliance in both fast food (15%) and full-service restaurants (33%). This risk factor (inadequate cooking) was only observed in 65% of fast food restaurants (277/425) and in 82% of full-service restaurants (323/396). The timing of the data collection visit may have influenced the specialist’s ability to observe this risk factor as reheating of cooked foods to required temperatures (a data item included under the foodborne illness risk factor of inadequate cooking) is often one of the first thermal processes conducted in a restaurant as part of its pre-opening procedures (see Appendix C).
Table 7 Total Number and Percentage of Restaurants Out-of-compliance for Each Risk Factor
Foodborne Illness Risk Factor
Fast Food Restaurants
(# OUT)
Total Obs. (IN & OUT) % OUT
Full-service Restaurants
(# OUT)
Total Obs. (IN & OUT) % OUT
Poor Personal Hygiene 283 425 66.59 329 396 83.08
Contaminated Equipment 242 425 56.94 325 396 82.07
Improper Holding/Time and Temperature
330 425 77.65 375 396 94.70
Inadequate Cooking 42 277 15.16 105 323 32.51
22
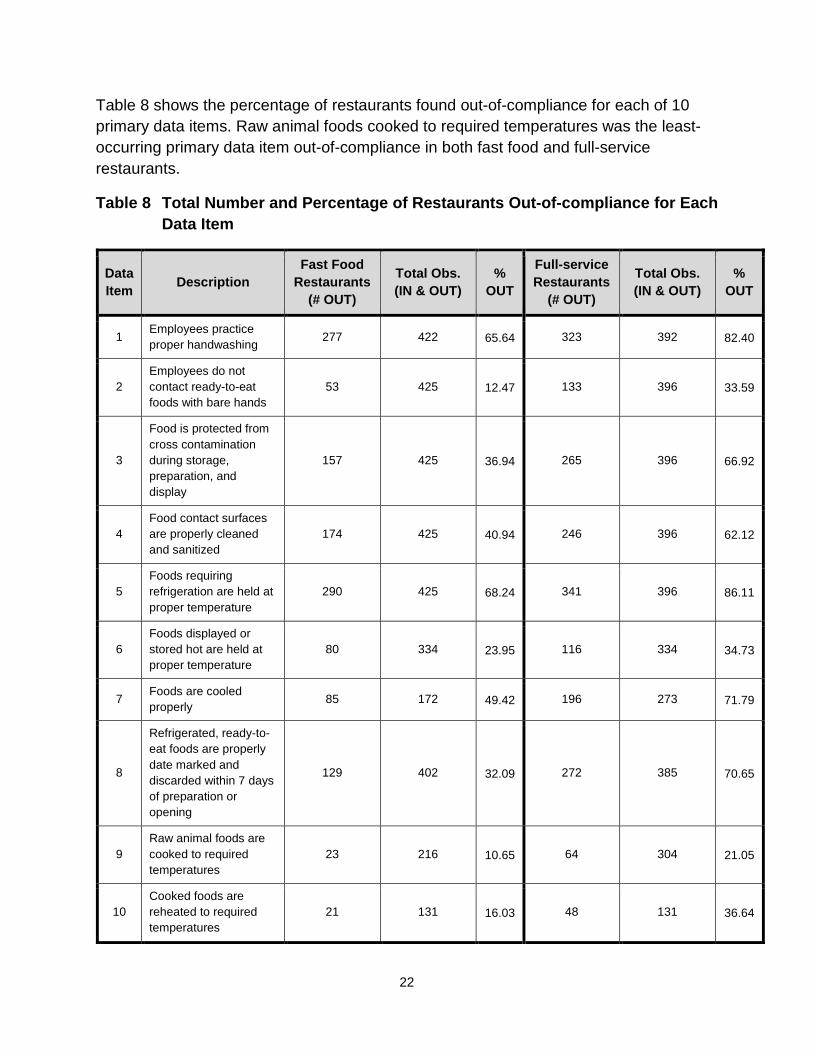
Table 8 shows the percentage of restaurants found out-of-compliance for each of 10 primary data items. Raw animal foods cooked to required temperatures was the least-occurring primary data item out-of-compliance in both fast food and full-service restaurants.
Table 8 Total Number and Percentage of Restaurants Out-of-compliance for Each Data Item
Data Item Description
Fast Food Restaurants
(# OUT)
Total Obs. (IN & OUT)
% OUT
Full-service Restaurants
(# OUT)
Total Obs. (IN & OUT)
% OUT
1 Employees practice proper handwashing 277 422 65.64 323 392 82.40
2 Employees do not contact ready-to-eat foods with bare hands
53 425 12.47 133 396 33.59
3
Food is protected from cross contamination during storage, preparation, and display
157 425 36.94 265 396 66.92
4 Food contact surfaces are properly cleaned and sanitized
174 425 40.94 246 396 62.12
5 Foods requiring refrigeration are held at proper temperature
290 425 68.24 341 396 86.11
6 Foods displayed or stored hot are held at proper temperature
80 334 23.95 116 334 34.73
7 Foods are cooled properly 85 172 49.42 196 273 71.79
8
Refrigerated, ready-to-eat foods are properly date marked and discarded within 7 days of preparation or opening
129 402 32.09 272 385 70.65
9 Raw animal foods are cooked to required temperatures
23 216 10.65 64 304 21.05
10 Cooked foods are reheated to required temperatures
21 131 16.03 48 131 36.64

23
Table 9 lists in (descending order) out-of-compliance percentages for each primary data item.
Table 9 Primary Data Items Out-of-compliance in Descending Order of Percentage
Data Item
Fast Food Restaurants Data Item Description
% OUT
Data Item
Full-service Restaurants Data Item Description
% OUT
5 Foods requiring refrigeration are held at proper temperature 68.24 5 Foods requiring refrigeration are
held at proper temperature 86.11
1 Employees practice proper handwashing 65.64 1 Employees practice proper
handwashing 82.40
7 Foods are cooled properly 49.42 7 Foods are cooled properly 71.79
4 Food contact surfaces are properly cleaned and sanitized 40.94 8
Refrigerated, ready-to-eat foods are properly date marked and discarded within 7 days of preparation or opening
70.65
3 Food is protected from cross contamination during storage, preparation, and display
36.94 3 Food is protected from cross contamination during storage, preparation, and display
66.92
8
Refrigerated, ready-to-eat foods are properly date marked and discarded within 7 days of preparation or opening
32.09 4 Food contact surfaces are properly cleaned and sanitized 62.12
6 Foods displayed or stored hot are held at proper temperature 23.95 10 Cooked foods are reheated to
required temperatures 36.64
10 Cooked foods are reheated to required temperatures 16.03 6 Foods displayed or stored hot are
held at proper temperature 34.73
2 Employees do not contact ready-to-eat foods with bare hands 12.47 2 Employees do not contact ready-
to-eat foods with bare hands 33.59
9 Raw animal foods are cooked to required temperatures 10.65 9 Raw animal foods are cooked to
required temperatures 21.05
Of the 10 food safety behaviors/practices (data items) associated with the four risk factors in this study, both fast food and full-service restaurants were found to have the most control over the same two data items (2,9) and also had the least control over the same two data items (5,1). When a data item or risk factor is IN compliance then the facility has control over that data item or risk factor. The data items or risk factors with the lower OUT of compliance percentages indicate more control over the data item or
24
risk factor. In this study both fast food and full-service restaurants have the most control over data item 9 since it has the lowest OUT of compliance percentage.
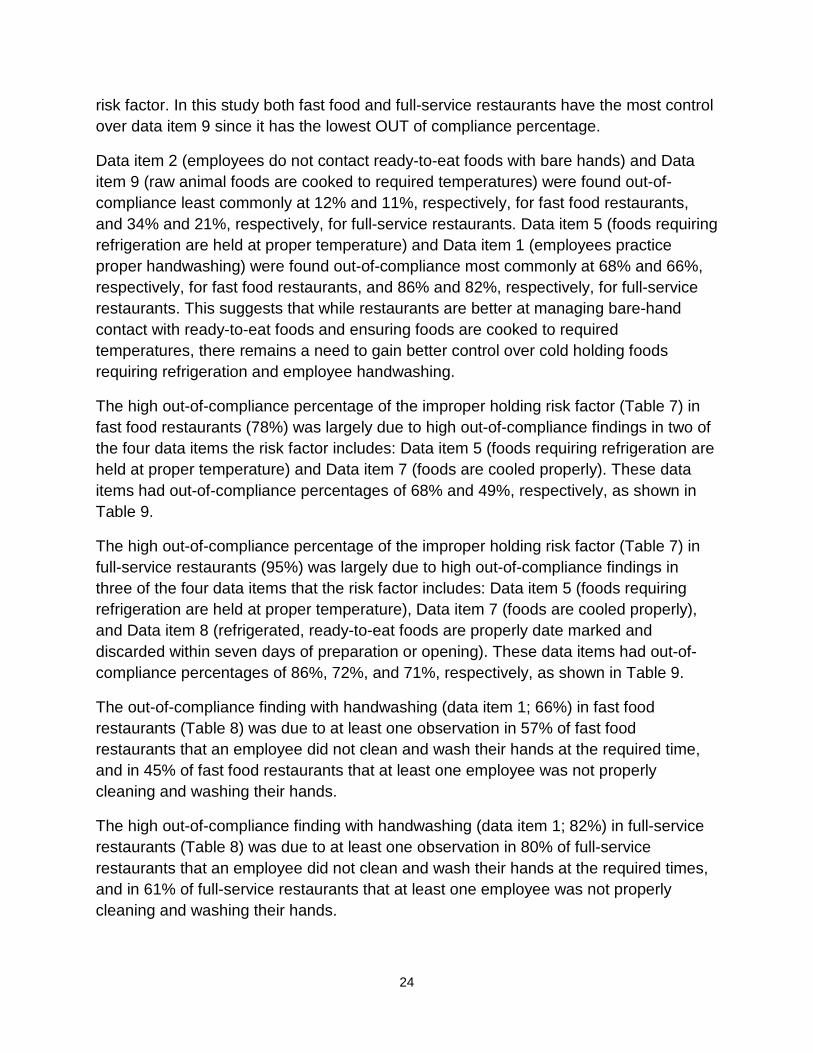
Data item 2 (employees do not contact ready-to-eat foods with bare hands) and Data item 9 (raw animal foods are cooked to required temperatures) were found out-of-compliance least commonly at 12% and 11%, respectively, for fast food restaurants, and 34% and 21%, respectively, for full-service restaurants. Data item 5 (foods requiring refrigeration are held at proper temperature) and Data item 1 (employees practice proper handwashing) were found out-of-compliance most commonly at 68% and 66%, respectively, for fast food restaurants, and 86% and 82%, respectively, for full-service restaurants. This suggests that while restaurants are better at managing bare-hand contact with ready-to-eat foods and ensuring foods are cooked to required temperatures, there remains a need to gain better control over cold holding foods requiring refrigeration and employee handwashing.
The high out-of-compliance percentage of the improper holding risk factor (Table 7) in fast food restaurants (78%) was largely due to high out-of-compliance findings in two of the four data items the risk factor includes: Data item 5 (foods requiring refrigeration are held at proper temperature) and Data item 7 (foods are cooled properly). These data items had out-of-compliance percentages of 68% and 49%, respectively, as shown in Table 9.
The high out-of-compliance percentage of the improper holding risk factor (Table 7) in full-service restaurants (95%) was largely due to high out-of-compliance findings in three of the four data items that the risk factor includes: Data item 5 (foods requiring refrigeration are held at proper temperature), Data item 7 (foods are cooled properly), and Data item 8 (refrigerated, ready-to-eat foods are properly date marked and discarded within seven days of preparation or opening). These data items had out-of-compliance percentages of 86%, 72%, and 71%, respectively, as shown in Table 9.
The out-of-compliance finding with handwashing (data item 1; 66%) in fast food restaurants (Table 8) was due to at least one observation in 57% of fast food restaurants that an employee did not clean and wash their hands at the required time, and in 45% of fast food restaurants that at least one employee was not properly cleaning and washing their hands.
The high out-of-compliance finding with handwashing (data item 1; 82%) in full-service restaurants (Table 8) was due to at least one observation in 80% of full-service restaurants that an employee did not clean and wash their hands at the required times, and in 61% of full-service restaurants that at least one employee was not properly cleaning and washing their hands.

25
Number of Data Items Out-of-compliance per Restaurant Tables 10 and 11 list the cumulative number of restaurants found out-of-compliance by the number of data items. The tables also display the corresponding percentage, and cumulative percentages. Fast Food Restaurants
• Median number of primary data items out-of-compliance = 3
• 63% (269) had 3 or fewer primary data items out-of-compliance
• 8% (36) had no primary data items out-of-compliance
• 15% (63) had one primary data item out-of-compliance
Full-service Restaurants • Median number of primary data items out-of-compliance = 5
• 55% (217) had 5 or fewer primary data items out-of-compliance
• 2% (8) had no primary data items out-of-compliance
• 3% (13) had one primary data item out-of-compliance
Table 10 Overall Number of Primary Data Items Out-of-compliance Percentiles (Fast Food Restaurants)
Number of Primary Data Items Out-of-
compliance
Number of Fast Food
Restaurants %
Cumulative Number of Fast Food Restaurants
Cumulative %
0 36 8.47 36 8.47
1 63 14.82 99 23.29
2 84 19.76 183 43.06
3 86 20.24 269 63.29
4 58 13.65 327 76.94
5 48 11.29 375 88.24
6 28 6.59 403 94.82
7 16 3.76 419 98.59
8 6 1.41 425 100.00
9 0 0.00 425 100.00
10 0 0.00 425 100.00

26
Table 11 Overall Number of Primary Data Items Out-of-compliance Percentiles (Full- service Restaurants)
Number of Primary Data Items Out-of-
compliance
Number of Full-service
Restaurants %
Cumulative Number of Full-service Restaurants
Cumulative %
0 8 2.02 8 2.02
1 13 3.28 21 5.30
2 29 7.32 50 12.63
3 33 8.33 83 20.96
4 55 13.89 138 34.85
5 79 19.95 217 54.80
6 86 21.72 303 76.52
7 47 11.87 350 88.38
8 41 10.35 391 98.74
9 4 1.01 395 99.75
10 1 0.25 396 100.00
Regulatory and Establishment Characteristics and the Occurrence of Out-of-compliance Data Items
Fast Food Restaurants
A. Multiple-unit Operations
On average fast food restaurants that were part of a multiple-unit operation had significantly lower primary data items out-of-compliance (p < 0.01) compared to those not part of a multiple-unit operation (Table 12). Restaurants part of an operation with two or more units were classified as multiple-unit operations.

27
Table 12 Mean Number of Primary Data Items Out-of-compliance by Multiple- unit Operation Status (Fast Food Restaurants)
Multiple-unit Number of Fast Food Restaurants Mean Number of Primary Data Items Out-of-compliance
No 88 4.51
Yes 337 2.65
B. Risk Categorization
On average risk category 2 establishments had significantly lower primary data items out-of-compliance (p < 0.05) compared to risk category 3 establishments (Table 13). Statistical comparisons were not performed on one fast food restaurant designated as risk category 4.
Table 13 Mean Number of Primary Data Items Out-of-compliance by Risk Category (Fast Food Restaurants)
Risk Category Number of Fast Food Restaurants Mean Number of Primary Data Items Out-of-compliance
2 298 2.86
3 126 3.42
C. Grading, Inspection Reporting, and Food Handler Training
On average fast food restaurants located in jurisdictions that graded establishments did not have significantly different results (p = 0.5573) compared to those located in jurisdictions that did not grade (Table 14). Establishments located in jurisdictions where there was a requirement to make inspection results public did not have significantly different compliance (p = 0.8440) than those without inspection reporting. Establishments in jurisdictions that required food handler training did not have significantly different compliance (p = 0.8448) than establishments in jurisdictions that did not require food handler training.

28
Table 14 Mean Number of Primary Data Items Out-of-compliance by Jurisdiction Variable (Fast Food Restaurants)
Variable Number of Fast Food Restaurants
Mean Number of Primary Data Items Out-of-compliance
Grading
No 161 2.96
Yes 264 3.08
Inspection Reporting
No 101 3.00
Yes 324 3.04
Food Handler Training Requirement
No 266 3.02
Yes 159 3.06
D. Certified Food Protection Managers
As indicated in Table 15, fast food restaurants with no CFPM employed at the restaurant averaged 3.4634 primary data items out-of-compliance. Those with a CFPM employed at the restaurant but not present during data collection had an average of 3.2642 primary data items out-of-compliance. The difference is not significant (p = 0.5620). Those establishments with a CFPM present at the time of data collection had an average of 2.6875 primary data items out-of-compliance. The average number out-of-compliance was not significantly different from those establishments with no CFPM employed (p = 0.1278). Fast food restaurants with a CFPM present and in charge had a significantly lower number of data items out-of-compliance than those with no CFPM (p = 0.0160). This indicates a significant difference in the number of out-of-compliance data items between establishments with a CFPM present and those that did not have a CFPM present at the time of data collection.

29
Table 15 Mean Number of Primary Data Items Out-of-compliance by Certified Food Protection Manager Status (Fast Food Restaurants)
Certified Manager
Employed
Certified Manager Present
Certified Person in Charge
Number of Fast Food Restaurants
Mean Number of Primary Data Items Out-of-Compliance
No No No 82 3.46
Yes No No 53 3.26
Yes Yes No 16 2.69
Yes Yes Yes 274 2.88
Full-service Restaurants
A. Multiple-unit Operations
On average full-service restaurants that were part of a multiple-unit operation had significantly lower primary data items out-of-compliance (p < 0.01) compared to those not part of a multiple-unit operation (Table 16). Restaurants part of an operation with two or more units were classified as multiple-unit operations.
Table 16 Mean Number of Primary Data Items Out-of-compliance by Multiple- unit Operation Status (Full-service Restaurants)
Multiple-unit Number of Full-service Restaurants
Mean Number of Primary Data Items Out-of-Compliance
No 248 5.30
Yes 148 4.66
B. Risk Categorization
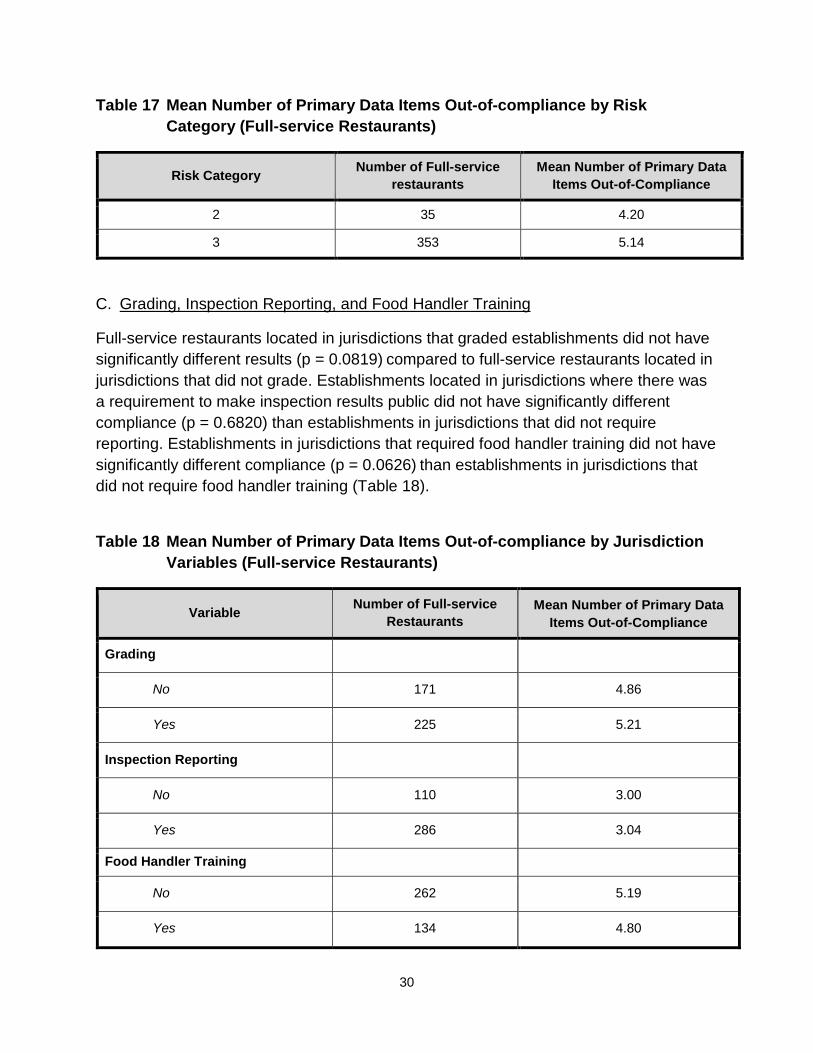
On average risk category 2 establishments had significantly lower primary data items out-of-compliance (p < 0.05) compared to risk category 3 establishments (Table 17). Only 18 full-service restaurants were designated as risk category 4, so statistical comparisons were not performed.
30
Table 17 Mean Number of Primary Data Items Out-of-compliance by Risk Category (Full-service Restaurants)
Risk Category Number of Full-service restaurants
Mean Number of Primary Data Items Out-of-Compliance
2 35 4.20
3 353 5.14
C. Grading, Inspection Reporting, and Food Handler Training
Full-service restaurants located in jurisdictions that graded establishments did not have significantly different results (p = 0.0819) compared to full-service restaurants located in jurisdictions that did not grade. Establishments located in jurisdictions where there was a requirement to make inspection results public did not have significantly different compliance (p = 0.6820) than establishments in jurisdictions that did not require reporting. Establishments in jurisdictions that required food handler training did not have significantly different compliance (p = 0.0626) than establishments in jurisdictions that did not require food handler training (Table 18).
Table 18 Mean Number of Primary Data Items Out-of-compliance by Jurisdiction Variables (Full-service Restaurants)
Variable Number of Full-service Restaurants
Mean Number of Primary Data Items Out-of-Compliance
Grading
No 171 4.86
Yes 225 5.21
Inspection Reporting
No 110 3.00
Yes 286 3.04
Food Handler Training
No 262 5.19
Yes 134 4.80

31
D. Certified Food Protection Managers
As shown in Table 19, full-service restaurants with no CFPM employed averaged 5.6931 primary data items out-of-compliance. Those with a CFPM employed at the restaurant but not present during the data collection had an average of 5.4000 primary data items out-of-compliance. The difference is not statistically significant (p = 0.3222). Those establishments with a CFPM present at the time of data collection had an average of 4.8500 primary data items out-of-compliance. The average number out-of-compliance was significantly different from those establishments with no CFPM employed (p = 0.0343). Full-service restaurants with a CFPM present and in charge had a significantly lower number of data items out-of-compliance than those with no CFPM (p < 0.0001). This indicates a significant difference in the number of out-of-compliance data items between establishments with a CFPM present and those without a CFPM present at the time of data collection.
Table 19 Mean Number of Primary Data Items Out-of-compliance by Certified Food Protection Manager Status (Full-service Restaurants)
Certified Manager
Employed
Certified Manager Present
Certified Person in Charge
Number of Full-service Restaurants
Mean Number of Primary Data Items Out-of-compliance
No No No 101 5.69
Yes No No 45 5.40
Yes Yes No 20 4.85
Yes Yes Yes 230 4.73
Correlations Tables 20 and 21 present Pearson’s product moment correlations between different factors. Pearson’s product moment correlations appearing with an asterisk are significant (p < 0.05). The Spearman correlation is also presented for selected pairs.
Spearman’s rank-order coefficient is the nonparametric version of Pearson’s coefficient and was used as a second measure to evaluate correlation. Pearson’s coefficient assesses linearity, whereas Spearman’s coefficient assesses monotonicity (including nonlinear relationships).

32
The CFPM variable was converted to an ordinal variable for the correlation analysis. Having no CFPM employed was coded as 1, having a CFPM employed but not present was coded as 2, having a CFPM present was coded as 3, and having the CFPM in charge was coded as 4.
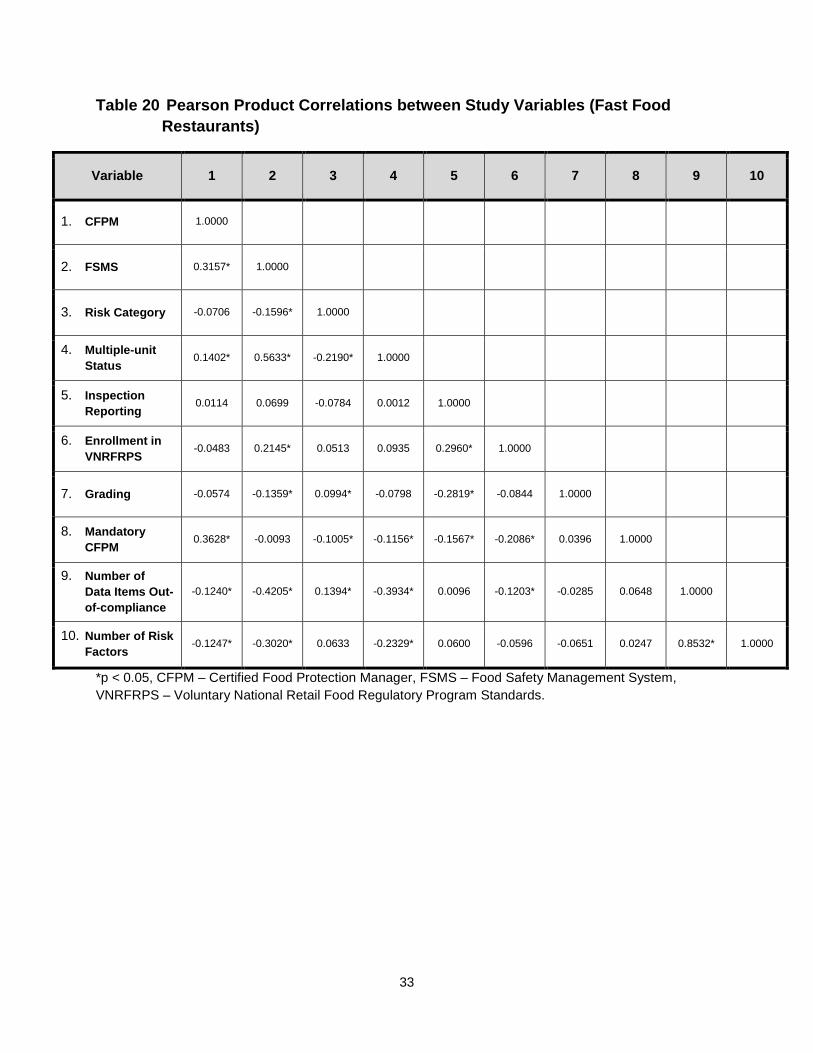
In fast food restaurants, food safety management systems were highly correlated with a CFPM, multiple-unit operations, and the number of primary data items out-of-compliance. The positive correlation 0.3157 (Spearman’s ρ = 0.3081, p < 0.01) indicates that as the certified food protection manager category increases, the food safety management systems category also increases. Multiple-unit operations were correlated, 0.5633, (Spearman’s ρ = 0.5625, p < 0.01) with better food safety management systems. This indicates that multiple-unit operations tended to have better FSMS. FSMS were negatively correlated with the number of primary data items out-of-compliance, -0.4205, (Spearman’s ρ = -0.4125, p < 0.01). This negative correlation indicates that as the FSMS category increases, the number of primary data items out-of-compliance decreases. Multiple-unit operations are also correlated with the number of primary data items out-of-compliance, -0.3934, (Spearman’s ρ = -0.3725, p < 0.01). This indicates that multiple-unit operations are correlated with lower numbers of primary data items out-of-compliance.
In full-service restaurants, food safety management systems were correlated with a CFPM (0.2882), multiple-unit operations (0.4592), and number of primary data items out-of-compliance (-0.4549) (Spearman’s ρ = 0.2509, 0.4226, and -0.4102, respectively; p < 0.01 for each). As the CFPM category increases, the FSMS category also increases. Multiple-unit operations were positively correlated with FSMS. FSMS were negatively correlated with the number of primary data items out-of-compliance, indicating an inverse relationship. Increases in the FSMS category were correlated with lower numbers of primary data items out-of-compliance.
33
Table 20 Pearson Product Correlations between Study Variables (Fast Food Restaurants)
Variable 1 2 3 4 5 6 7 8 9 10
1. CFPM 1.0000
2. FSMS 0.3157* 1.0000
3. Risk Category -0.0706 -0.1596* 1.0000
4. Multiple-unit Status 0.1402* 0.5633* -0.2190* 1.0000
5. Inspection Reporting 0.0114 0.0699 -0.0784 0.0012 1.0000
6. Enrollment in VNRFRPS -0.0483 0.2145* 0.0513 0.0935 0.2960* 1.0000
7. Grading -0.0574 -0.1359* 0.0994* -0.0798 -0.2819* -0.0844 1.0000
8. Mandatory CFPM 0.3628* -0.0093 -0.1005* -0.1156* -0.1567* -0.2086* 0.0396 1.0000
9. Number of Data Items Out-of-compliance
-0.1240* -0.4205* 0.1394* -0.3934* 0.0096 -0.1203* -0.0285 0.0648 1.0000
10. Number of Risk Factors -0.1247* -0.3020* 0.0633 -0.2329* 0.0600 -0.0596 -0.0651 0.0247 0.8532* 1.0000
*p < 0.05, CFPM – Certified Food Protection Manager, FSMS – Food Safety Management System, VNRFRPS – Voluntary National Retail Food Regulatory Program Standards.

34
Table 21 Pearson Product Correlations between Study Variables (Full-service Restaurants)
Variable 1 2 3 4 5 6 7 8 9 10
1. CFPM 1.0000
2. FSMS 0.2882* 1.0000
3. Risk Category 0.0545 -0.0237 1.0000
4. Multiple-unit Status 0.1370* 0.4592* -0.1099* 1.0000
5. Inspection Reporting -0.0548 0.1117* -0.0422 0.1528* 1.0000
6. Enrollment in VNRFRPS -0.1608* 0.1102* -0.0075 0.0838 0.3684* 1.0000
7. Grading 0.0169 -0.0770 -0.0092 -0.1676* -0.2789* -0.1296* 1.0000
8. Mandatory CFPM 0.6089* 0.0848 -0.0003 0.0426 -0.1545* -0.2607* 0.0282 1.0000
9. Number of Data Items Out-of-compliance
-0.2101* -0.4549* 0.1147* -0.1538* -0.0207 0.0680 -0.0875 -0.0772 1.0000
10. Number of Risk Factors -0.1420* -0.2909* 0.0690 -0.0347 -0.0064 0.0729 -0.1264* -0.0314 0.7970* 1.0000
*p < 0.05 CFPM – Certified Food Protection Manager, FSMS – Food Safety Management System, VNRFRPS – Voluntary National Retail Food Regulatory Program Standards.
35
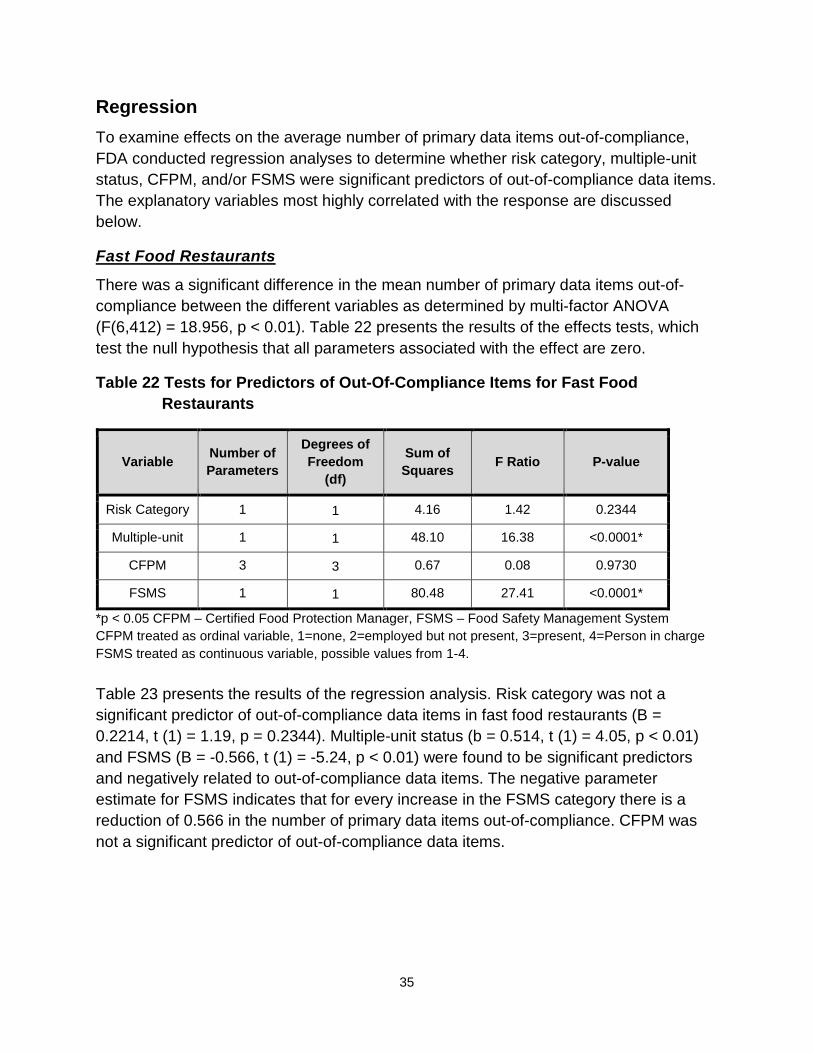
Regression To examine effects on the average number of primary data items out-of-compliance, FDA conducted regression analyses to determine whether risk category, multiple-unit status, CFPM, and/or FSMS were significant predictors of out-of-compliance data items. The explanatory variables most highly correlated with the response are discussed below.
Fast Food Restaurants
There was a significant difference in the mean number of primary data items out-of-compliance between the different variables as determined by multi-factor ANOVA (F(6,412) = 18.956, p < 0.01). Table 22 presents the results of the effects tests, which test the null hypothesis that all parameters associated with the effect are zero.
Table 22 Tests for Predictors of Out-Of-Compliance Items for Fast Food Restaurants
Variable Number of Parameters
Degrees of Freedom
(df)
Sum of Squares F Ratio P-value
Risk Category 1 1 4.16 1.42 0.2344
Multiple-unit 1 1 48.10 16.38 <0.0001*
CFPM 3 3 0.67 0.08 0.9730
FSMS 1 1 80.48 27.41 <0.0001*
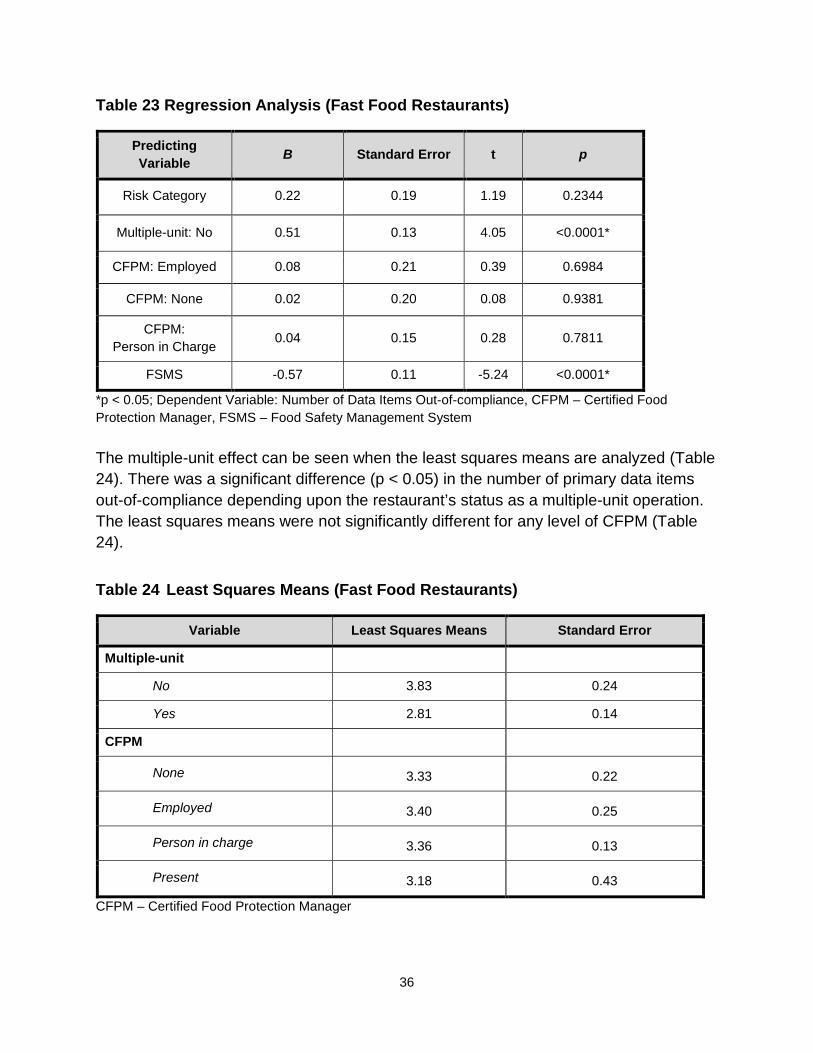
*p < 0.05 CFPM – Certified Food Protection Manager, FSMS – Food Safety Management System CFPM treated as ordinal variable, 1=none, 2=employed but not present, 3=present, 4=Person in charge FSMS treated as continuous variable, possible values from 1-4. Table 23 presents the results of the regression analysis. Risk category was not a significant predictor of out-of-compliance data items in fast food restaurants (B = 0.2214, t (1) = 1.19, p = 0.2344). Multiple-unit status (b = 0.514, t (1) = 4.05, p < 0.01) and FSMS (B = -0.566, t (1) = -5.24, p < 0.01) were found to be significant predictors and negatively related to out-of-compliance data items. The negative parameter estimate for FSMS indicates that for every increase in the FSMS category there is a reduction of 0.566 in the number of primary data items out-of-compliance. CFPM was not a significant predictor of out-of-compliance data items.
36
Table 23 Regression Analysis (Fast Food Restaurants)
Predicting Variable B Standard Error t p
Risk Category 0.22 0.19 1.19 0.2344
Multiple-unit: No 0.51 0.13 4.05 <0.0001*
CFPM: Employed 0.08 0.21 0.39 0.6984
CFPM: None 0.02 0.20 0.08 0.9381
CFPM: Person in Charge 0.04 0.15 0.28 0.7811
FSMS -0.57 0.11 -5.24 <0.0001*
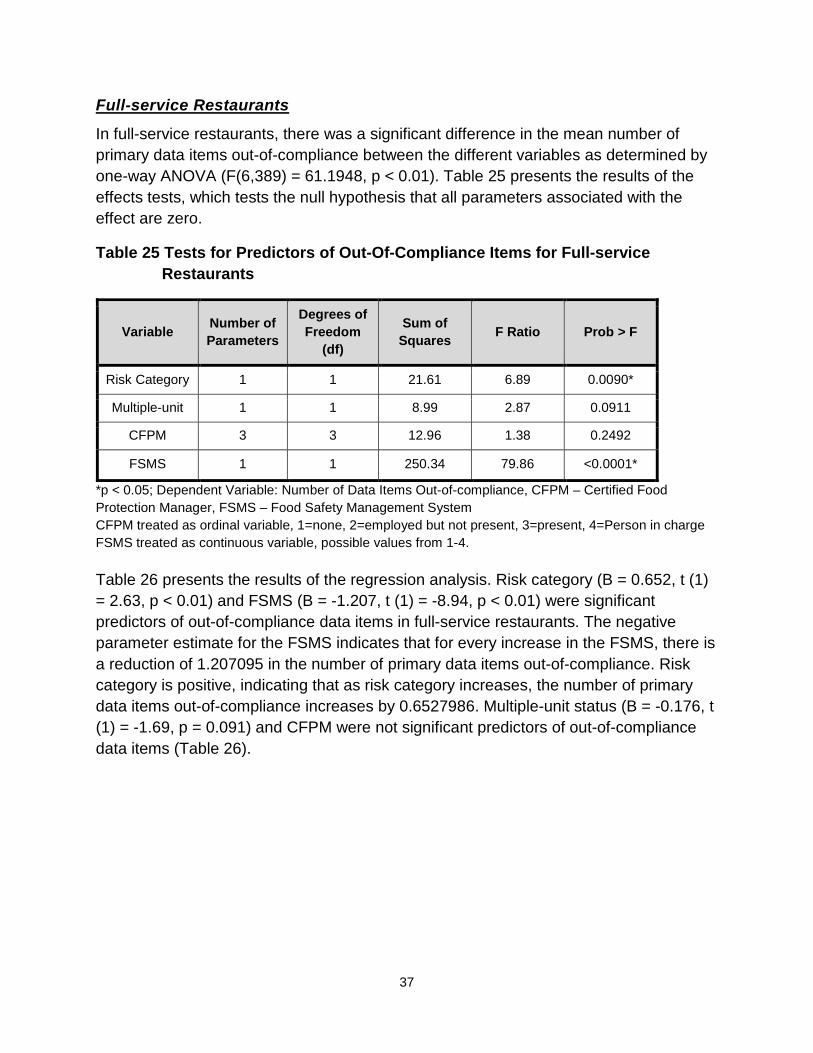
*p < 0.05; Dependent Variable: Number of Data Items Out-of-compliance, CFPM – Certified Food Protection Manager, FSMS – Food Safety Management System The multiple-unit effect can be seen when the least squares means are analyzed (Table 24). There was a significant difference (p < 0.05) in the number of primary data items out-of-compliance depending upon the restaurant’s status as a multiple-unit operation. The least squares means were not significantly different for any level of CFPM (Table 24). Table 24 Least Squares Means (Fast Food Restaurants)
Variable Least Squares Means Standard Error
Multiple-unit
No 3.83 0.24
Yes 2.81 0.14
CFPM
None 3.33 0.22
Employed 3.40 0.25
Person in charge 3.36 0.13
Present 3.18 0.43
CFPM – Certified Food Protection Manager
37
Full-service Restaurants
In full-service restaurants, there was a significant difference in the mean number of primary data items out-of-compliance between the different variables as determined by one-way ANOVA (F(6,389) = 61.1948, p < 0.01). Table 25 presents the results of the effects tests, which tests the null hypothesis that all parameters associated with the effect are zero.
Table 25 Tests for Predictors of Out-Of-Compliance Items for Full-service Restaurants
Variable Number of Parameters
Degrees of Freedom
(df)
Sum of Squares F Ratio Prob > F
Risk Category 1 1 21.61 6.89 0.0090*
Multiple-unit 1 1 8.99 2.87 0.0911
CFPM 3 3 12.96 1.38 0.2492
FSMS 1 1 250.34 79.86 <0.0001*
*p < 0.05; Dependent Variable: Number of Data Items Out-of-compliance, CFPM – Certified Food Protection Manager, FSMS – Food Safety Management System CFPM treated as ordinal variable, 1=none, 2=employed but not present, 3=present, 4=Person in charge FSMS treated as continuous variable, possible values from 1-4. Table 26 presents the results of the regression analysis. Risk category (B = 0.652, t (1) = 2.63, p < 0.01) and FSMS (B = -1.207, t (1) = -8.94, p < 0.01) were significant predictors of out-of-compliance data items in full-service restaurants. The negative parameter estimate for the FSMS indicates that for every increase in the FSMS, there is a reduction of 1.207095 in the number of primary data items out-of-compliance. Risk category is positive, indicating that as risk category increases, the number of primary data items out-of-compliance increases by 0.6527986. Multiple-unit status (B = -0.176, t (1) = -1.69, p = 0.091) and CFPM were not significant predictors of out-of-compliance data items (Table 26).
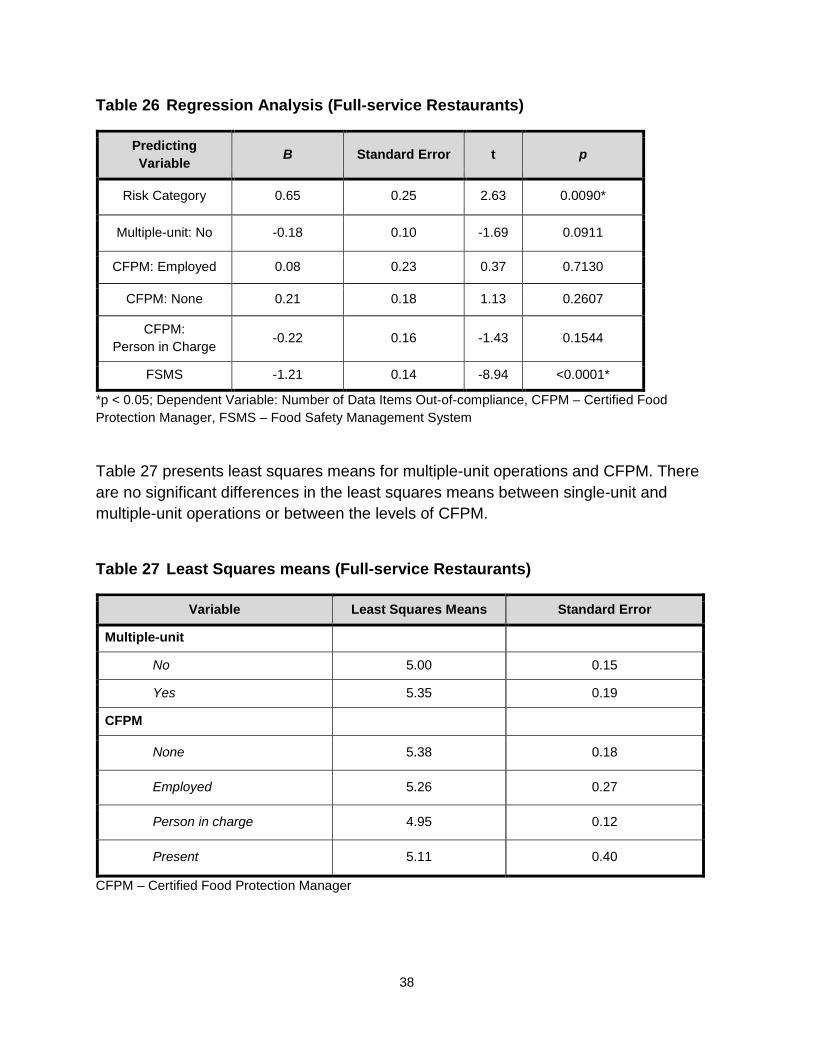
38
Table 26 Regression Analysis (Full-service Restaurants)
Predicting Variable B Standard Error t p
Risk Category 0.65 0.25 2.63 0.0090*
Multiple-unit: No -0.18 0.10 -1.69 0.0911
CFPM: Employed 0.08 0.23 0.37 0.7130
CFPM: None 0.21 0.18 1.13 0.2607
CFPM: Person in Charge -0.22 0.16 -1.43 0.1544
FSMS -1.21 0.14 -8.94 <0.0001*
*p < 0.05; Dependent Variable: Number of Data Items Out-of-compliance, CFPM – Certified Food Protection Manager, FSMS – Food Safety Management System
Table 27 presents least squares means for multiple-unit operations and CFPM. There are no significant differences in the least squares means between single-unit and multiple-unit operations or between the levels of CFPM.
Table 27 Least Squares means (Full-service Restaurants)
Variable Least Squares Means Standard Error
Multiple-unit
No 5.00 0.15
Yes 5.35 0.19
CFPM
None 5.38 0.18
Employed 5.26 0.27
Person in charge 4.95 0.12
Present 5.11 0.40
CFPM – Certified Food Protection Manager

39
CONCLUSION The purpose of this first data collection during the current study period was to investigate the relationship between FSMS, CFPM, and the occurrence of risk factors and food safety behaviors/practices commonly associated with foodborne illness in restaurants.
Our objectives were to:
• Identify the least and most often occurring foodborne illness risk factor and food safety behaviors/practices in restaurants within the United States;
• Determine the extent to which FSMS and the presence of a CFPM impact the occurrence of food safety behaviors/practices; and
• Determine whether the occurrence of food safety behaviors/practices in restaurants differs based on a restaurant’s risk categorization and status as a single-unit or multiple-unit operation.
Data analyses in this report showed the following:
• More than 70% of the restaurants in this study operated in jurisdictions that required a CFPM and most restaurants were found to have a CFPM employed and present at the time of data collection.
• Of the foodborne illness risk factors investigated in this study, restaurants had the best control over inadequate cooking. There remains a need to gain better control over improper holding/time and temperature and poor personal hygiene.
• Of the food safety behaviors/practices investigated in this study, restaurants had the best control over the following:
o Ensuring no bare-hand contact with ready-to-eat foods; and
o Cooking raw animal foods to their required temperatures.
• There remains a need to gain better control over the following food safety behaviors and practices:
o Employee Handwashing (includes both when to wash and how to wash properly); and
o Cold holding of foods requiring refrigeration.
• FSMS were the strongest predictor of data items being out-of-compliance in both fast food and full-service restaurants: those with well-developed food safety management systems had significantly fewer food safety behaviors/practices out-of-compliance than did those with less developed food safety management systems.
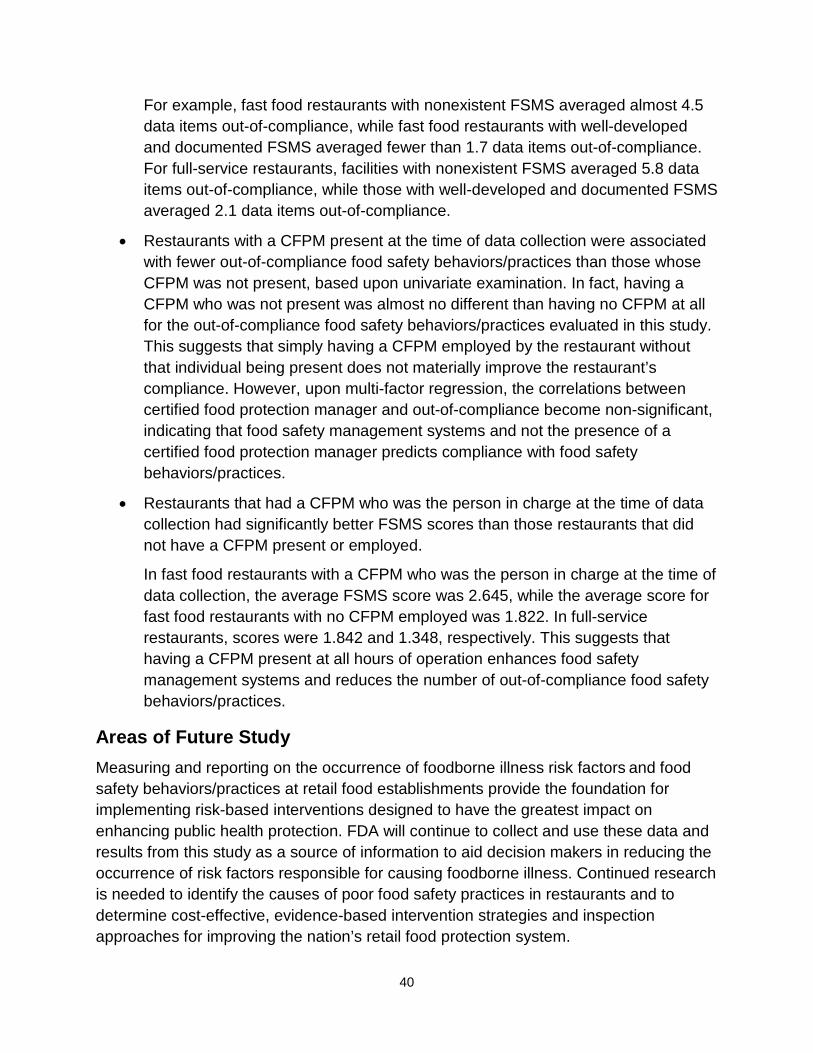
40
For example, fast food restaurants with nonexistent FSMS averaged almost 4.5 data items out-of-compliance, while fast food restaurants with well-developed and documented FSMS averaged fewer than 1.7 data items out-of-compliance. For full-service restaurants, facilities with nonexistent FSMS averaged 5.8 data items out-of-compliance, while those with well-developed and documented FSMS averaged 2.1 data items out-of-compliance.
• Restaurants with a CFPM present at the time of data collection were associated with fewer out-of-compliance food safety behaviors/practices than those whose CFPM was not present, based upon univariate examination. In fact, having a CFPM who was not present was almost no different than having no CFPM at all for the out-of-compliance food safety behaviors/practices evaluated in this study. This suggests that simply having a CFPM employed by the restaurant without that individual being present does not materially improve the restaurant’s compliance. However, upon multi-factor regression, the correlations between certified food protection manager and out-of-compliance become non-significant, indicating that food safety management systems and not the presence of a certified food protection manager predicts compliance with food safety behaviors/practices.
• Restaurants that had a CFPM who was the person in charge at the time of data collection had significantly better FSMS scores than those restaurants that did not have a CFPM present or employed.
In fast food restaurants with a CFPM who was the person in charge at the time of data collection, the average FSMS score was 2.645, while the average score for fast food restaurants with no CFPM employed was 1.822. In full-service restaurants, scores were 1.842 and 1.348, respectively. This suggests that having a CFPM present at all hours of operation enhances food safety management systems and reduces the number of out-of-compliance food safety behaviors/practices.
Areas of Future Study Measuring and reporting on the occurrence of foodborne illness risk factors and food safety behaviors/practices at retail food establishments provide the foundation for implementing risk-based interventions designed to have the greatest impact on enhancing public health protection. FDA will continue to collect and use these data and results from this study as a source of information to aid decision makers in reducing the occurrence of risk factors responsible for causing foodborne illness. Continued research is needed to identify the causes of poor food safety practices in restaurants and to determine cost-effective, evidence-based intervention strategies and inspection approaches for improving the nation’s retail food protection system.

APPENDICES
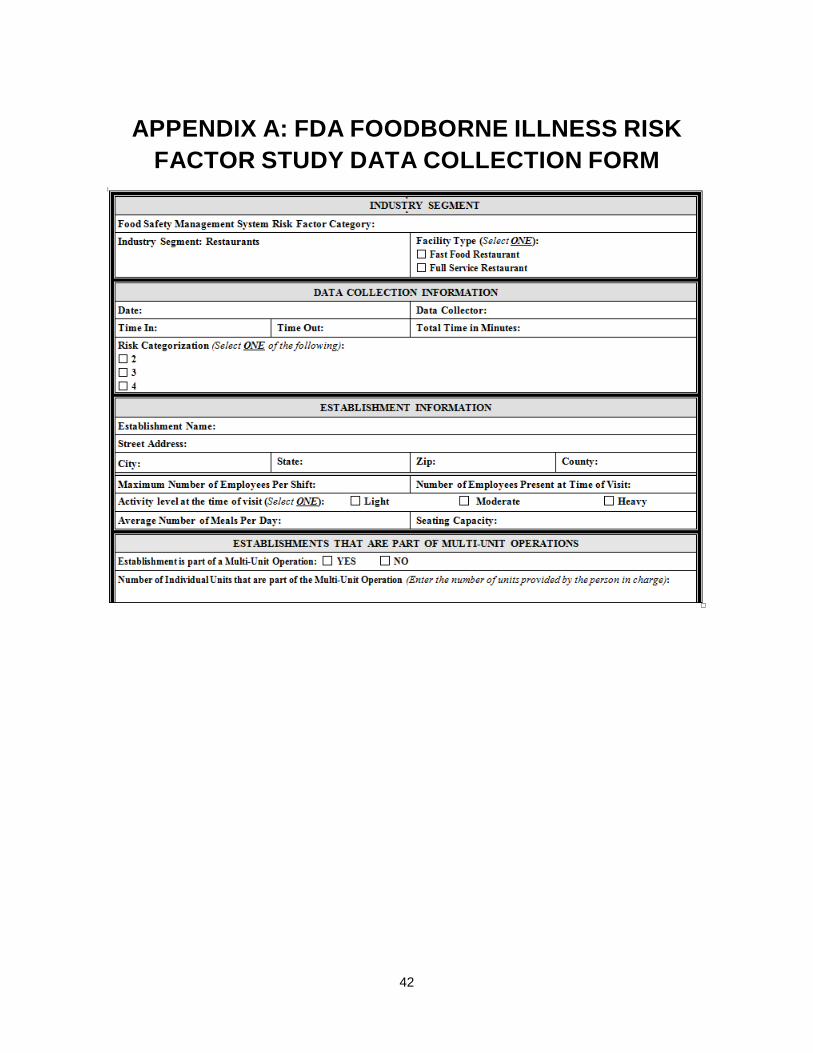
42
APPENDIX A: FDA FOODBORNE ILLNESS RISK FACTOR STUDY DATA COLLECTION FORM

43
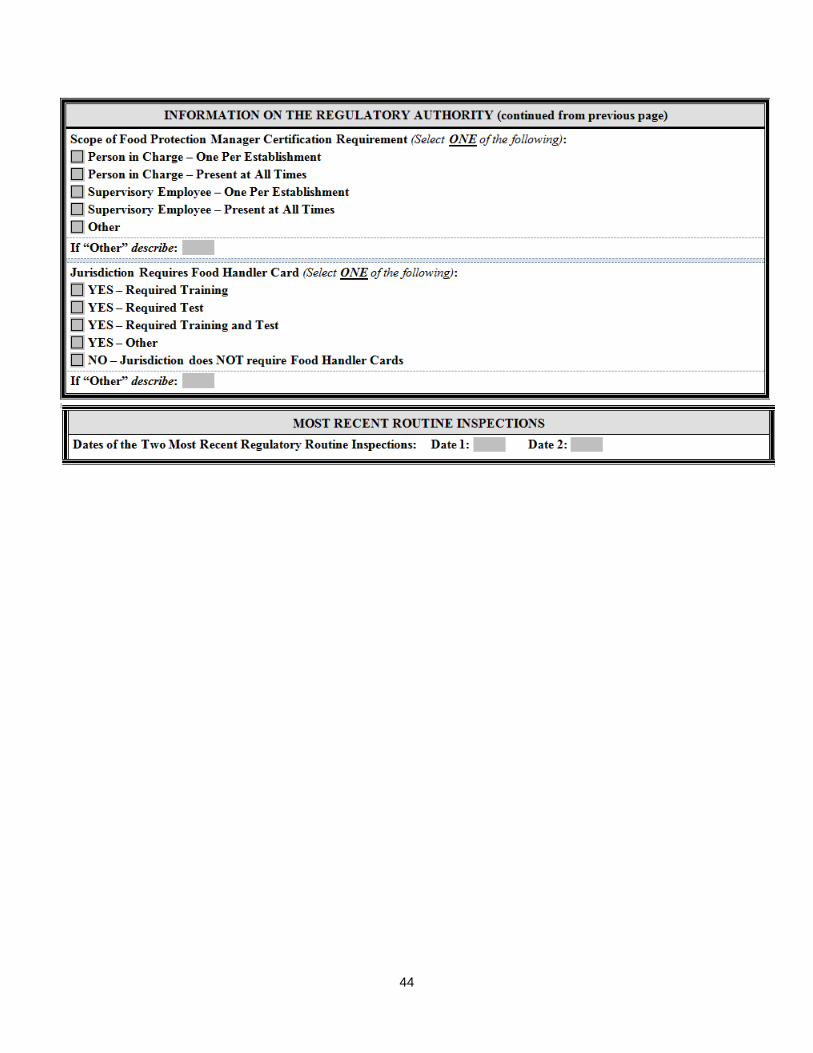
44

45
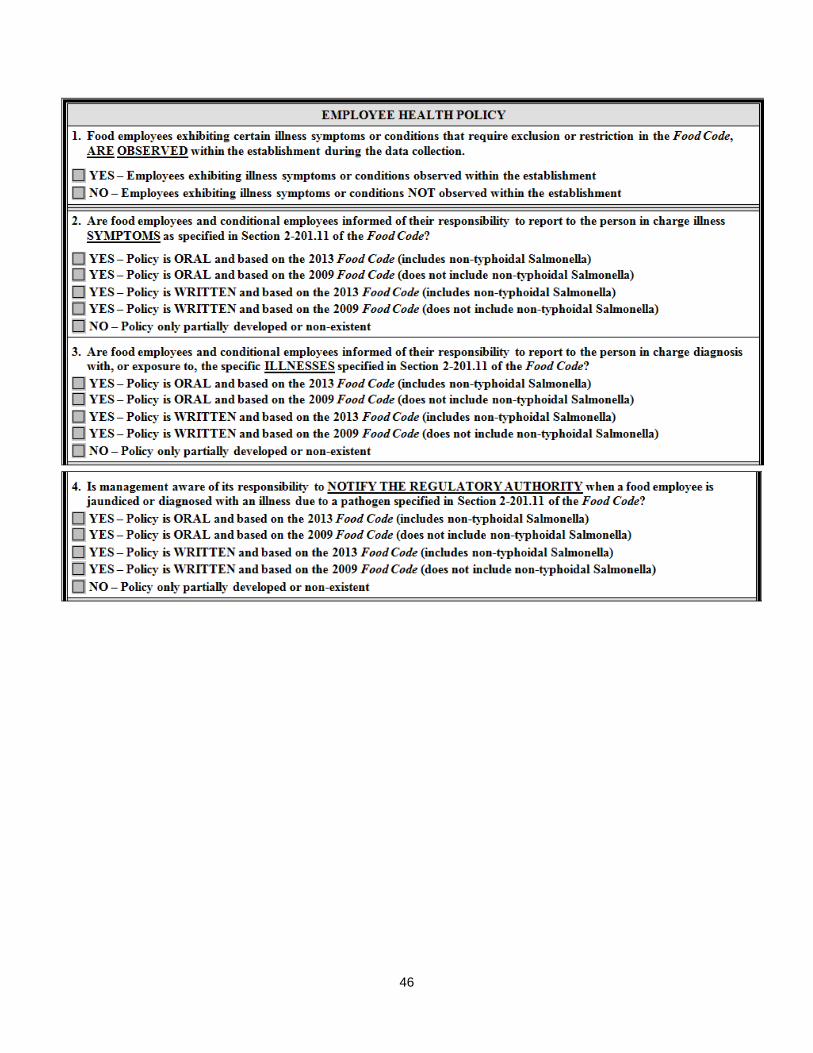
46

47

48
Risk Factor – Poor Personal Hygiene (Data Items 1 & 2)

49
Risk Factor – Contaminated Equipment/Protection from Contamination (Data Items 3 & 4)
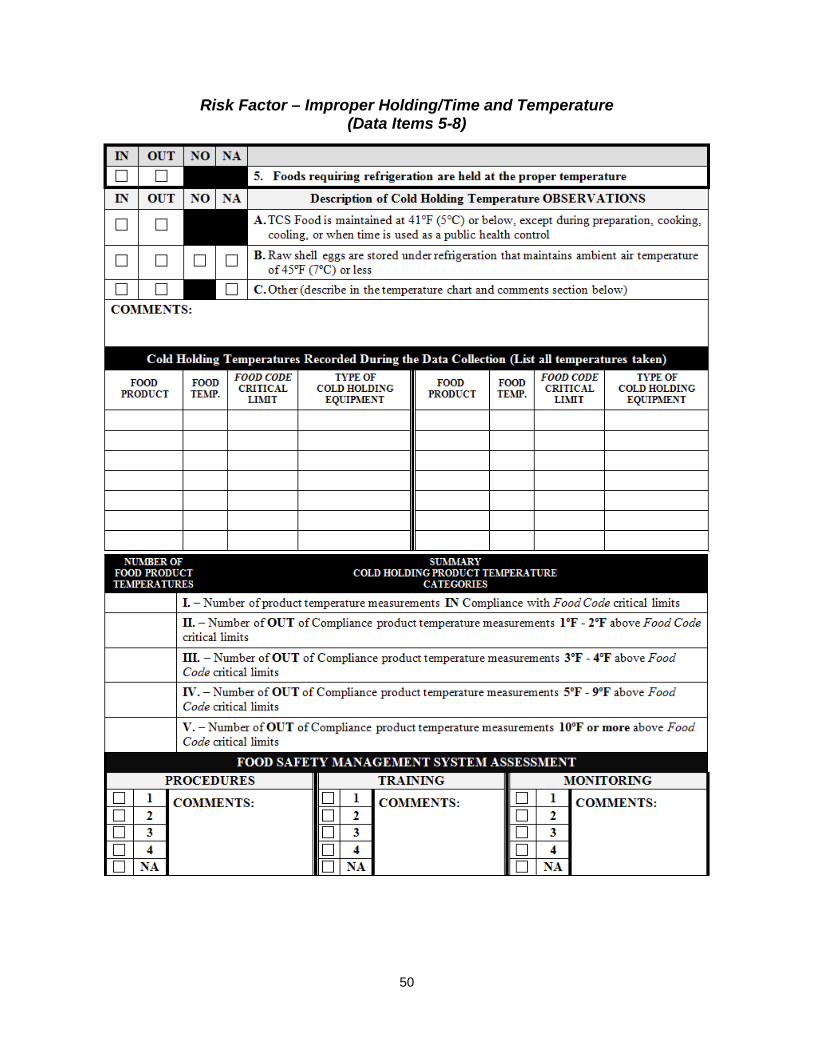
50
Risk Factor – Improper Holding/Time and Temperature (Data Items 5-8)
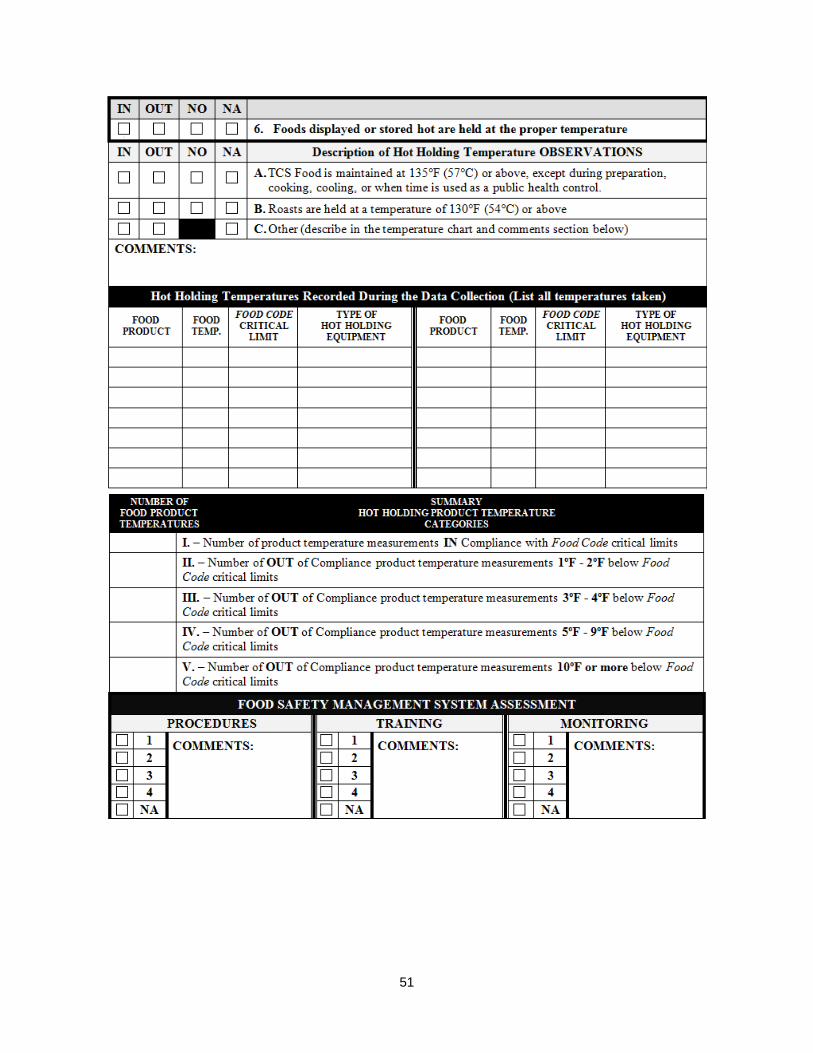
51
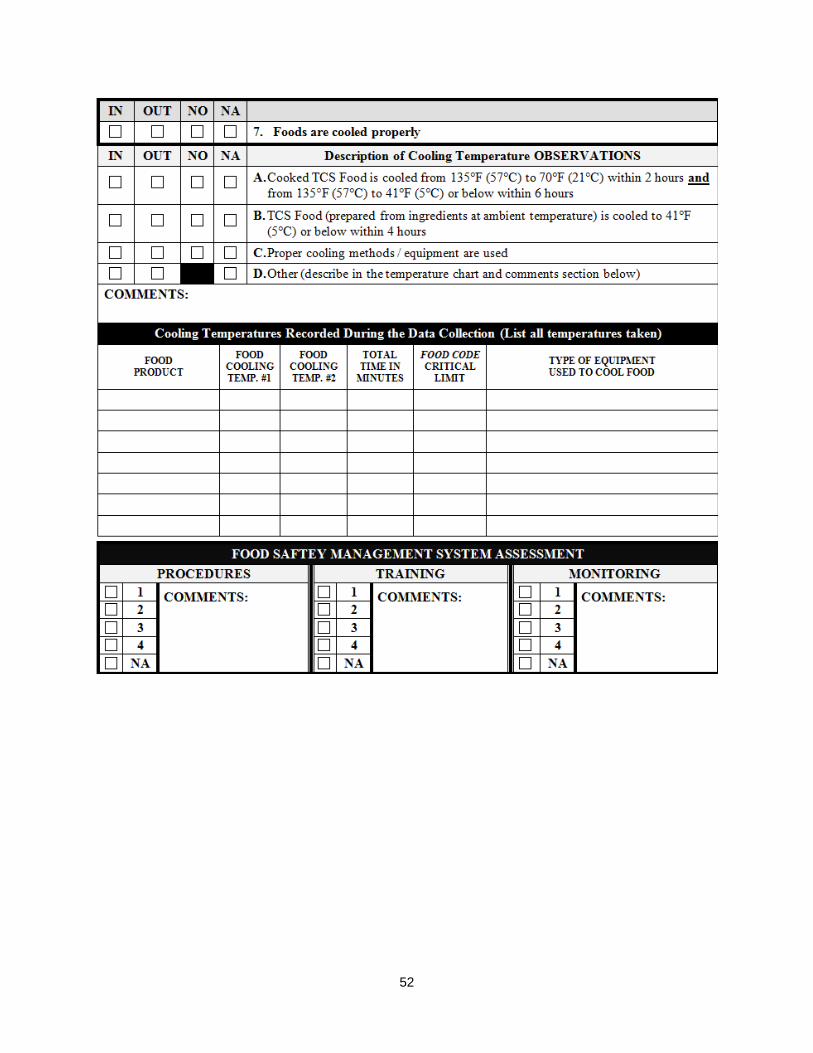
52
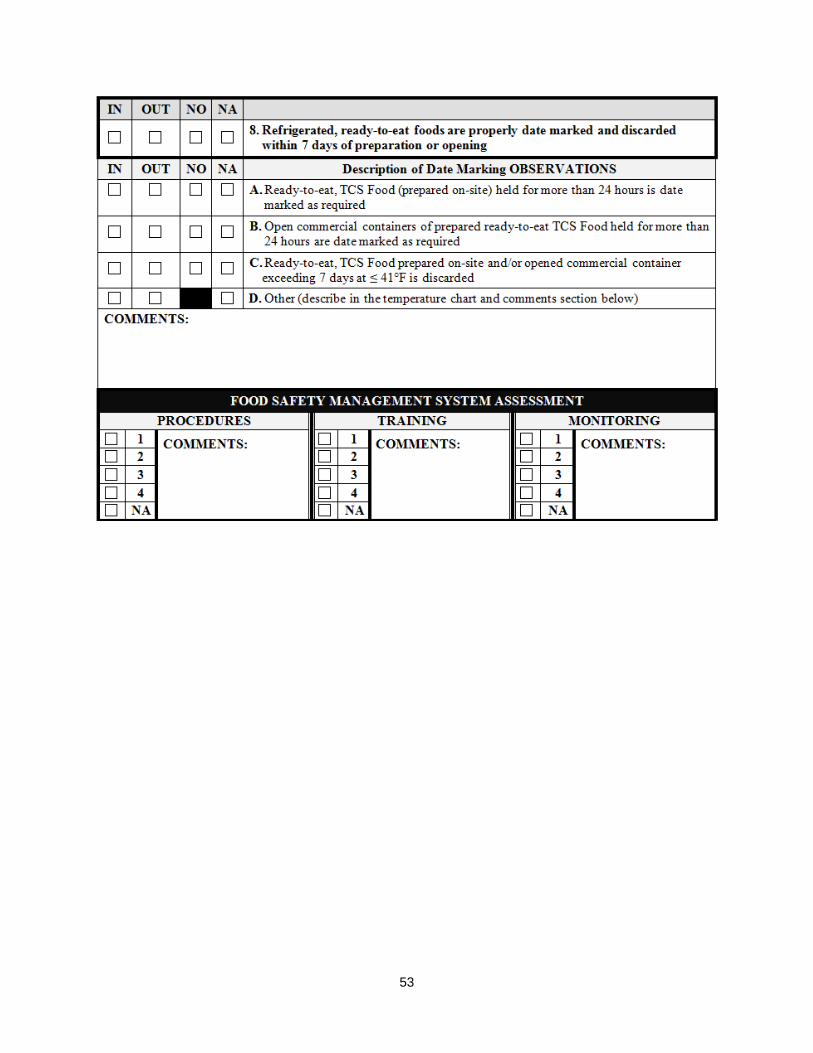
53

54
Risk Factor – Inadequate Cooking (Data Items 9 & 10)

55
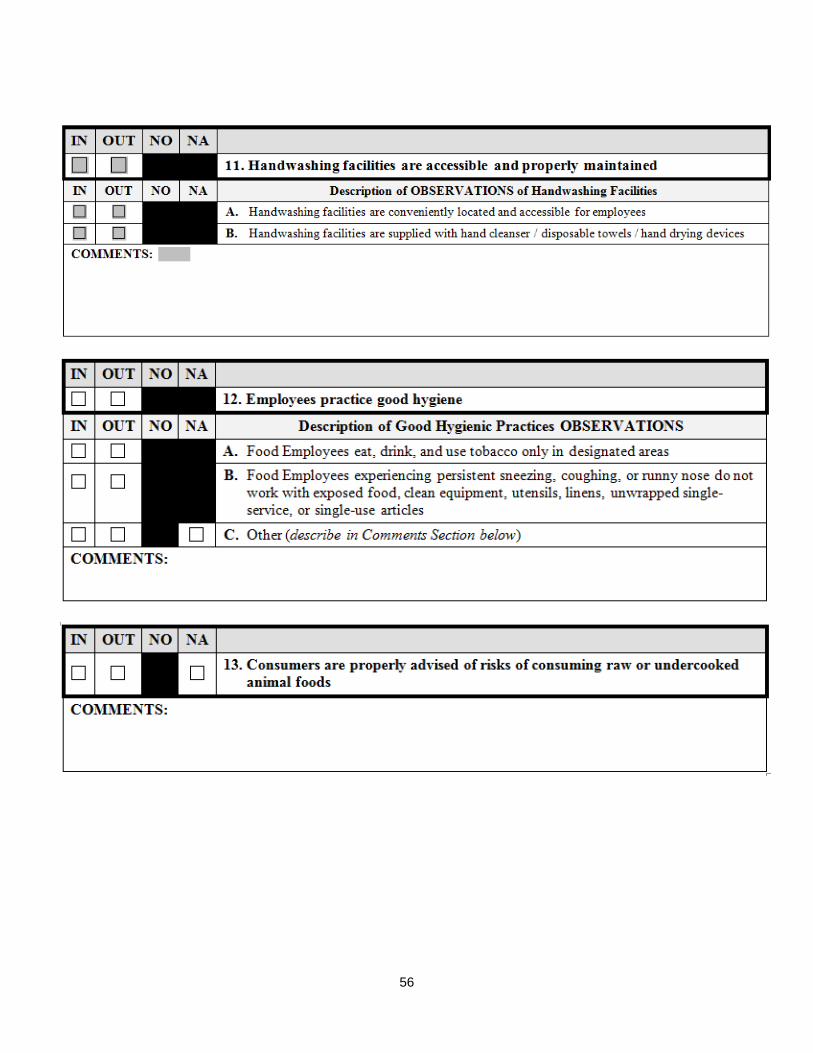
56
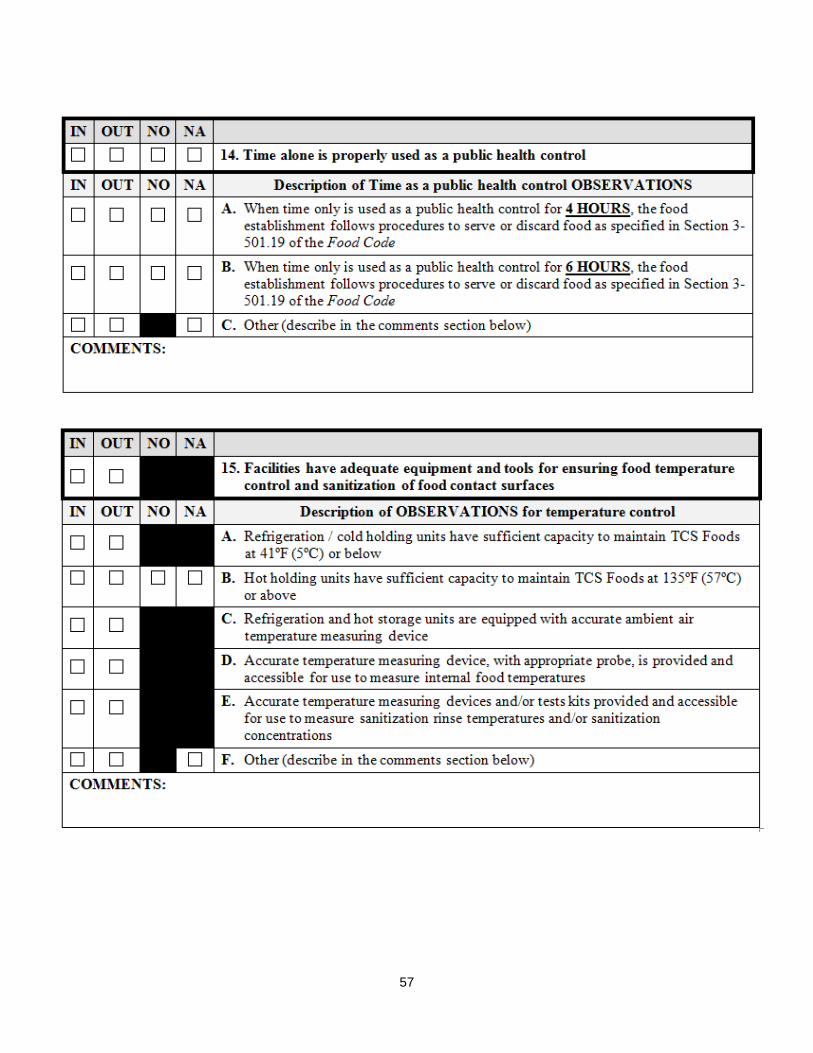
57
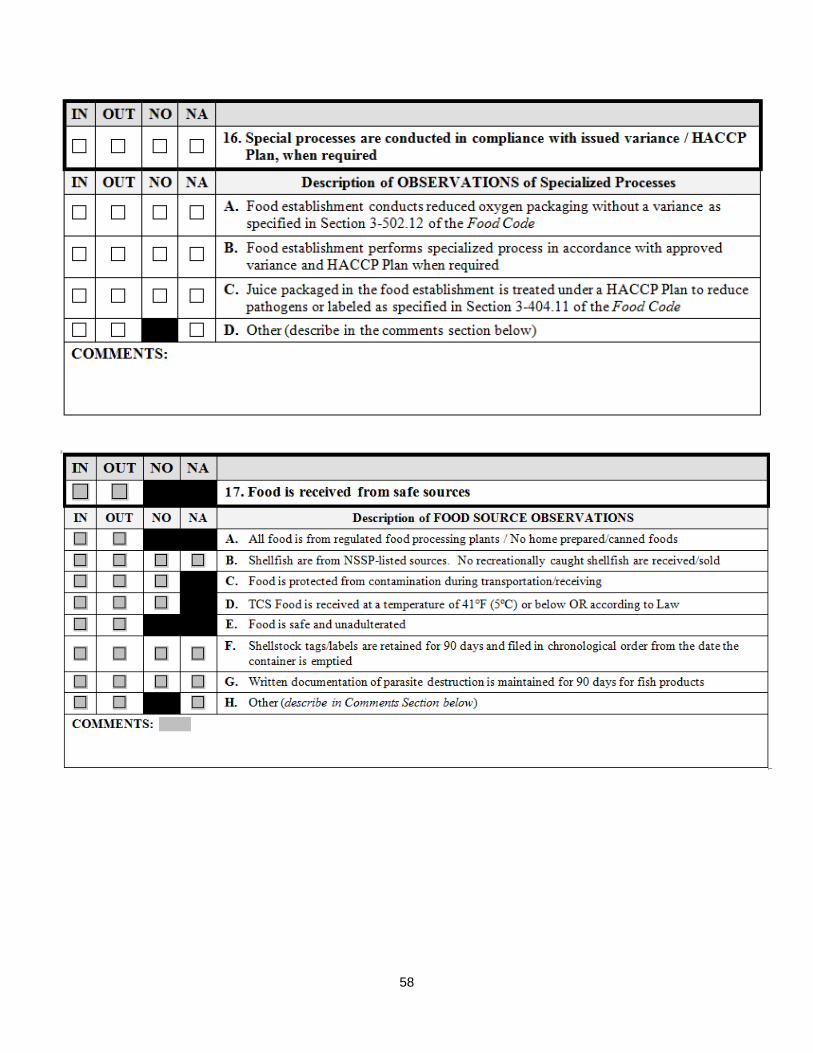
58
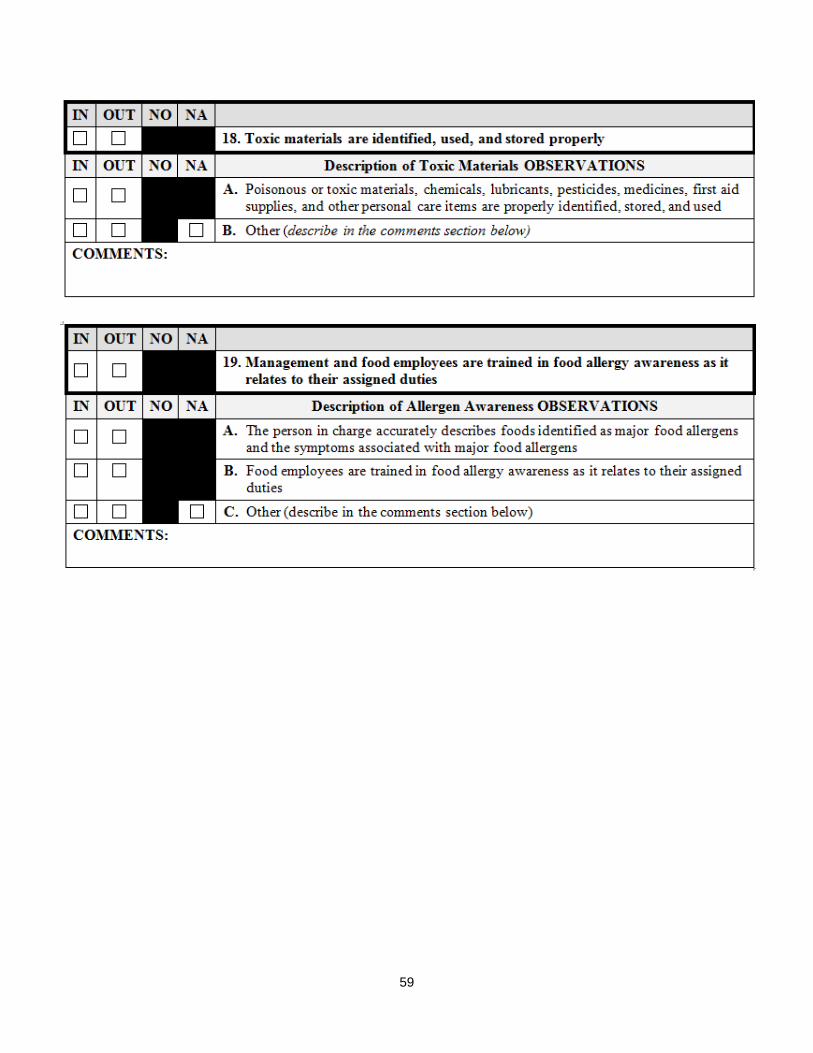
59

60
APPENDIX B: DATA COLLECTION INTRODUCTION LETTER
Dear Owner/Manager:
Your facility has been randomly selected as part of a nationwide research project designed to assess food preparation procedures and practices specific to the various segments of the retail food industry. The U.S. Food and Drug Administration (FDA) will use this research for identifying best practices within the industry and directing limited resources to areas that will provide the most significant public health benefits.
This is not a regulatory visit. Your participation is voluntary. No inspection report will be left with your facility. This is a research project designed to focus on the implementation of food safety procedures and practices within the retail food industry that are designed to protect the public health. The expected length of the data collection will be 90-120 minutes. Approximate 30 minutes of the data collection will focus on obtaining information on the nature of your operation.
Should an observation be made of a food safety procedure or practice that poses a significant public health risk, every effort will be made to work with you to ensure that the appropriate corrective action is taken to alleviate the hazard. Should a situation arise where a significant public health risk cannot be resolved during the data collection, the regulatory authority that has issued your permit will be contacted to work with you to ensure corrective action is taken.
An exit briefing will be provided at the end of the visit to discuss significant findings that may assist you in enhancing the effectiveness of your food safety system. If significant food safety issues are identified, they will be brought to the attention of the person in charge or responsible employee to determine the appropriate corrective action based on the current FDA Food Code. Your questions regarding the data collection process or food safety issues in general are encouraged as part of the visit to your facility.
Your facility’s name will not appear on any reports or public documents. The research project is designed to protect the privacy of participating establishments to the extent the law permits. The data collected is tabulated using broad industry segments and is not associated with any specific establishment.
FDA is responsible for providing technical assistance to approximately 75 state and territorial agencies and more than 2,300 local departments that assume primary responsibility for working with the industry on preventing foodborne illnesses. Beginning in 1998, FDA began collecting data related to direct observations made of food safety
61
practices within institutional food service, restaurant, and retail food segments of the industry. From the data collected, FDA provides guidance to regulatory and industry food safety professionals to assist them in addressing food safety issues that have the most significant impact on protecting the public health.
FDA’s previous research studies can be accessed and downloaded from the following web link:
http://www.fda.gov/Food/GuidanceRegulation/RetailFoodProtection/FoodborneIllnessRiskFactorReduction/default.htm
Public Reporting burden of this collection of information is estimated to average 73 minutes per response for the person in charge of a fast food restaurant, 106 minutes for the person of charge of a full-service restaurant, and 30 minutes for the program director (or designated individual) of the regulatory authority. This includes the time for reviewing instructions, searching existing data sources, gathering and maintaining the data needed, and completing and reviewing the collection of information. An agency may not conduct or sponsor, and a person is not required to respond to a collection of information unless it displays a currently valid OMB control number. Send comments regarding this burden estimate or any other aspect of this collection of information, including suggestions for reducing this burden to: FDA PRA Staff, Office of Operations, Food and Drug Administration, 1350 Piccard Dr., P150-400B, Rockville, MD 20850. [email protected]. OMB Control #0910-0744. Expires August 13, 2015.
Thank you for your willingness to cooperate in this important endeavor. It is through this type of cooperative effort that government and the food service industry seek to provide safe and wholesome food to the consuming public.
In the future, should you have any questions regarding this study or other food safety issues, please do not hesitate to contact me.
Sincerely,

62
APPENDIX C: LIMITATIONS
Field Operations
The restaurant industry is dynamic. There is no set pattern of operation within a restaurant upon which a data collection protocol can be established that will ensure an opportunity to observe all food safety practices and employee behaviors covered in this study. Establishment type, the season of the year, the time of day, and the length of time available for each data collection are some of the factors that impacted direct observations of food safety practices within restaurants. As an example, cooling foods requires a significant period of time to conduct a quantitative assessment of multiple temperature measurements to determine if the rate of cooling will conform to Food Code time/temperature critical limits. Reheating foods (captured under the foodborne illness risk factor of inadequate cooking) is often one of the first thermal processes conducted in a restaurant as part of its pre-opening procedures. The timing of the data collection visit and the availability of cooked foods reheating to required temperatures are elements that influenced the specialist’s ability to observe this data item.
A sufficient number of observations must be obtained based on the sample size to draw statistically significant conclusions. FDA attempted to achieve this balance in the current design of the study by focusing the statistical analysis on 10 primary data items that had a high likelihood of being observed during the data collections and have been epidemiologically linked to foodborne illness outbreaks.
Focusing on the primary 10 data items during this restaurant data collection period reduced the variations in observations of data items that occurred during the previous study. Of the 10 primary data items, two were more difficult to observe (occurred less frequently at the time of data collection) than the others:
• Data Item # 7 – Foods are properly cooled
• Data Item # 10 – Cooked foods are reheated to required temperatures
Study Design
Sample Design
Twenty-two FDA specialists conducted the data collections at restaurant facilities. The specialists are geographically dispersed throughout the United States. The geographic distribution of specialists throughout the U.S. allows for a broad sampling of establishments in all regions of the U.S.; therefore, establishments were randomly
63
selected to participate in the study from among all eligible establishments located within a 150-mile radius of each specialist’s home location.
The total number of establishments in the country is approximately 472,243 and the total number within the sampling zones is 295,003. Roughly 62% of all establishments in the restaurant segment were eligible for selection.
The current picture of compliance with the risk factors reflects the entire U.S. only to the extent that the facilities in the sampling zones are representative of the overall industry.
The data used in the selection process were purchased from the Environmental Systems Research Institute (ESRI), Inc. The restaurant data are part of ESRI’s USA Business Locations and Business Summary. This dataset is updated annually, with the latest version updated in July 2012. The data are stored as a GeoDataBase, which is a collection of geographic datasets of various types held in a common file system folder, a Microsoft Access database, or a multi-user relational database management system.
ESRI and its partner, Infogroup, reference several sources, including directory listings such as the Yellow Pages and business white pages; annual reports; 10Ks and Securities and Exchange Commission (SEC) information; federal, state, and municipal government data; business magazines; newsletters and newspapers; and information from the U.S. Postal Service. To ensure accurate and complete information, Infogroup conducts annual telephone verifications with each business listed in the database.
For restaurant data, ESRI used Infogroup’s proprietary six-digit Standards Industrial Classification (SIC) and eight-digit North American Industry Classification System (NAICS) industry codes and a special industry code for some restaurants. It represented comprehensive restaurant records based on a single restaurant per location.
Restaurant addresses are geocoded to assign latitude and longitude coordinates to each restaurant site. The quality of the local address system varies; address matching is better in urban areas that use street-level address systems than in rural areas that might not. Restaurants that cannot be assigned to a census block group are assigned to a census tract or county. The geographic codes were used to perform spatial sampling for the risk factor study.
The geographical distribution of specialists throughout the country, especially in relatively high-density population centers, allowed for a broad sampling throughout all regions of the U.S. The choice of data collection locations was based on the

64
specialists’ geographical areas of responsibility and provided a reasonably convenient design for estimating national risk-related behaviors and practices.
This project was designed to examine patterns of the occurrence of foodborne illness risk factors within the restaurant industry using multiple data collection periods. The way the samples were selected and the size of the dataset do not support comparisons of individual specialists’ geographical areas, states, cities, or even regions of the U.S.
In addition, the project is not designed to support comparisons of different chains of restaurants. There is no statistical justification for examining reduced sets of results particular to, for example, two chains of restaurants, and drawing conclusions from the differences.
Comparing Data over Time
The total number of observations for each data item is likely to change from one data collection period to another. Variation in the number of observations can make it difficult to draw statistical conclusions between any two data collection periods. Changes in the number of observations of data items may be attributed to the following:
• Sample variations
• Changes in industry practices
Sampling Variations
The frequency at which a data item can be observed during each data collection period may change due to sampling establishments within the same facility type that have different food products and procedures.
FDA tracked the actual time spent to complete data collection at each restaurant. The average time to complete data collection in fast food and full-service restaurants was 82 and 104 minutes, respectively. Travel time to and from the restaurant location and off-site data entry were not included as part of this FDA time assessment.
Changes in Industry Practices
If changes in an industry practice result in more inspectors marking “not applicable” (NA) rather than “in” or “out-of-compliance,” there may be a change in the total number of observations for a given data item from one data collection period to the next. This may result in a corresponding change in the relative weight of that data item in the compliance percentage for the relevant risk factor.
For example, if numerous establishments have shifted from using raw shell eggs to using pasteurized egg products, the number of observations related to inadequate cooking will decrease from one data collection period to the next. Therefore, a lower

65
out-of-compliance percentage for the inadequate cooking risk factor may not be reported, even though the new industry practice represents improved active managerial control.

66
APPENDIX D: DATA COLLECTION CYCLE FOR THE RESTAURANT INDUSTRY
To assess trends over time three data points, at a minimum, are required for statistical purposes. The data from this report and two restaurant data collection periods in 2017 and 2021 will be used to determine trends in the occurrence of risk factors over the 10-year study period.
The initial restaurant data collection period began in November 2013 and was completed in early October 2014. This report highlights the statistically significant findings from that data collection period. Table 28 provides a summary of the 10-year study time frames for the restaurant data collection periods.
Table 28 Summary of Data Collection Time Frames for the Restaurant Industry
Industry Segment
Facility Type
Initial Data Collection Period
(Baseline Measurement)
2ND Data Collection Period
3RD Data Collection Period
Restaurants
Full-service Restaurants
and Fast Food
Restaurants
Nov. 15, 2013 to
Sept. 30, 2014
Oct. 1, 2017 to
Sept. 30, 2018
Oct. 1, 2021 to
Sept. 30, 2022

67
APPENDIX E: SUPPLEMENTAL STATISTICAL ANALYSIS
The Biostatistics and Bioinformatics Staff has analyzed the data from the Foodborne Illness Risk Factors Study utilizing a main effects multi-factor ANOVA. We found that the primary factor associated with improved compliance is Food Safety Management Systems (PTM) for both Full- Service and Fast Food establishments. In the analysis of Fast Food restaurants, the factor Multi-Unit was also predictive of the out-of-compliance rate. In the Full-service analysis, there were statistically significant main effect P-values in the model for PTM, Risk category, Enrolled in program standards, Jurisdiction requires grading and Jurisdiction requires food handler card.
Reasons for performing the regression analysis:
Many factors were measured in the Foodborne Risk Factors Study and several have statistically significant (p<0.05) pairwise correlations with each other as seen in tables 20 and 21, page 33-34 of the study. The purpose of the ANOVA is to determine whether a factor has remaining or additional explanatory power or association with the response of interest, in this case compliance status, when other predictor variables are also included in the model. The goal is to identify potentially spurious correlations. In our regression analysis, we want to determine which variables are predictive of improved compliance when the set of correlated predictors are in the model. If a pairwise correlation becomes non-significant in the ANOVA model, we say the pair-wise correlation is explained by other predictors and may be spurious.
Parameter analysis:
There are several variables that may affect the response variable “number of primary data items out of compliance”. The multi-factor ANOVA model was run in JMP, Version 12 with all the variables and then each variable was removed from the full model in order to assess the effect on the change in model R-squared upon removal. The R-squared represents the amount of variance in the response variable that is explained by the model. If there is minimal change in the model R-square upon removal of a predictor, it means that the correlation between the response and the variable can be explained by other variables in the model. If there is a significant reduction in R-squared upon removal, it indicates that the predictor in question has statistical explanatory power that is not explained by the other variables. We also report the P-values of the F statistic. P-values greater than 0.05 are not generally considered to be statistically significant. The data from Full-service and Fast Food restaurants were analyzed separately.

68
Table 29 Fast Food Restaurants multi-factor ANOVA
For fast food restaurants removing only the variable “Management systems (PTM) (FSMS)” from the model resulted in a reduction of R-square of 19.46%. Removing only the variable “multiple-unit” resulted in a 17.12% reduction in R-squared. The removal of any of the other variables from the model had a negligible effect on the R-square. Removing both “PTM (FSMS)” and “multiple-unit” resulted in a 67.83% reduction in R-squared.
The average out of compliance for establishments with nonexistent management systems was 4.48 primary data items out of compliance while those with well-developed and documented managements systems had 1.70 primary data out of compliance. In this analysis, only the predictors Management systems (PTM) and Multiple-unit had statistically significant effects on the model predictions, with both significant at the p<0.0001 level.
Fast Food Model R-square
Reduction in R-
Square
% R-square
reduction Prob >
F Model with all parameters 0.228932
Management systems (PTM)(FSMS) 0.184372 0.044560 19.46% <0.0001 Multiple-Unit 0.189742 0.039190 17.12% <0.0001 Risk category 0.221951 0.006981 3.05% 0.1620
Certified Manager(CFPM) 0.226928 0.002004 0.88% 0.7892 Enrolled in program standards 0.224659 0.004273 1.87% 0.1354
Jurisdiction requires CFPM 0.226494 0.002438 1.06% 0.2591 Jurisdiction requires grading 0.223994 0.004938 2.16% 0.1085
Jurisdiction requires reporting 0.227919 0.001013 0.44% 0.4668 Jurisdiction requires food handler
card 0.228899 0.000033 0.01% 0.8964

69
Table 30 Full-service restaurants multi-factor ANOVA
Full-service Model R-square
Reduction in R-
Square
% R-square
reduction Prob >
F Model with all parameters 0.221845
Management systems (PTM)(FSMS) 0.113826 0.108019 48.69% <0.0001 Multiple-Unit 0.221720 0.000125 0.06% 0.8044 Risk category 0.206260 0.015585 7.03% 0.0096
Certified Manager (CFPM) 0.209423 0.012422 5.60% 0.1096 Enrolled in program standards 0.213041 0.008804 3.97% 0.0385
Jurisdiction requires CFPM 0.219152 0.002693 1.21% 0.2516 Jurisdiction requires grading 0.207173 0.014672 6.61% 0.0077
Jurisdiction requires reporting 0.221249 0.000596 0.27% 0.5894 Jurisdiction requires food
handler card 0.211421 0.010424 4.70% 0.0244
In the Full-service restaurants the removal of the variable “Management systems (PTM) (FMSM)” resulted in a 48.69% reduction in the R-squared. The removal of any of the other variables had a negligible effect on the R-squared.
The average out of compliance for establishments with nonexistent Food safety management systems was 5.84 primary data items out of compliance while those with well-developed and documented managements systems had 2.09 primary data out of compliance.
Effect of Certified food protection managers (CFPM) on Food safely management systems (FSMS):
It is important to note that CFPM category does not have a statistically significant effect on the number of data items out of compliance when FSMS is included in the model. However there is evidence to suggest that the presence of a certified manager is correlated with improved management systems:
Fast Food restaurants:
There is a relationship between the Certified manager status and the Management systems (PTM)(FSMS). Facilities that had either a certified manager present or a certified manager who was the person in charge (PIC) at the time of inspection had a far higher percentage of well developed or better management systems than those that had no certified manager present at the time of inspection. Facilities that had a certified

70
manager present or in charge had almost half of the establishments with well developed or better management systems (PTM) while those that did not had far less.
Full-service Restaurants:
There is a relationship between the certified manager status and the management systems (PTM) (FSMS). Facilities that had a certified manager present or in charge had a far higher percentage of well developed or better management systems than those that had no certified manager present at the time of inspection.
Fast Food Management systems (PTM)
Non-Existent Underdeveloped Well developedWell developed and
documentedCertified Manager = Employed 16.98% 50.94% 26.42% 5.66%
Certified Manager = None 24.05% 64.56% 10.13% 1.27%Certified Manager = PIC 9.96% 42.80% 33.95% 13.28%
Certified Manager = Present 6.25% 43.75% 31.25% 18.75%
Full Service Management systems (PTM)
Non-Existent Underdeveloped Well developedWell developed and
documentedCertified Manager = Employed 42.22% 55.56% 2.22% 0.00%
Certified Manager = None 41.58% 58.42% 0.00% 0.00%Certified Manager = PIC 25.22% 61.30% 8.70% 4.78%
Certified Manager = Present 25.00% 60.00% 15.00% 0.00%
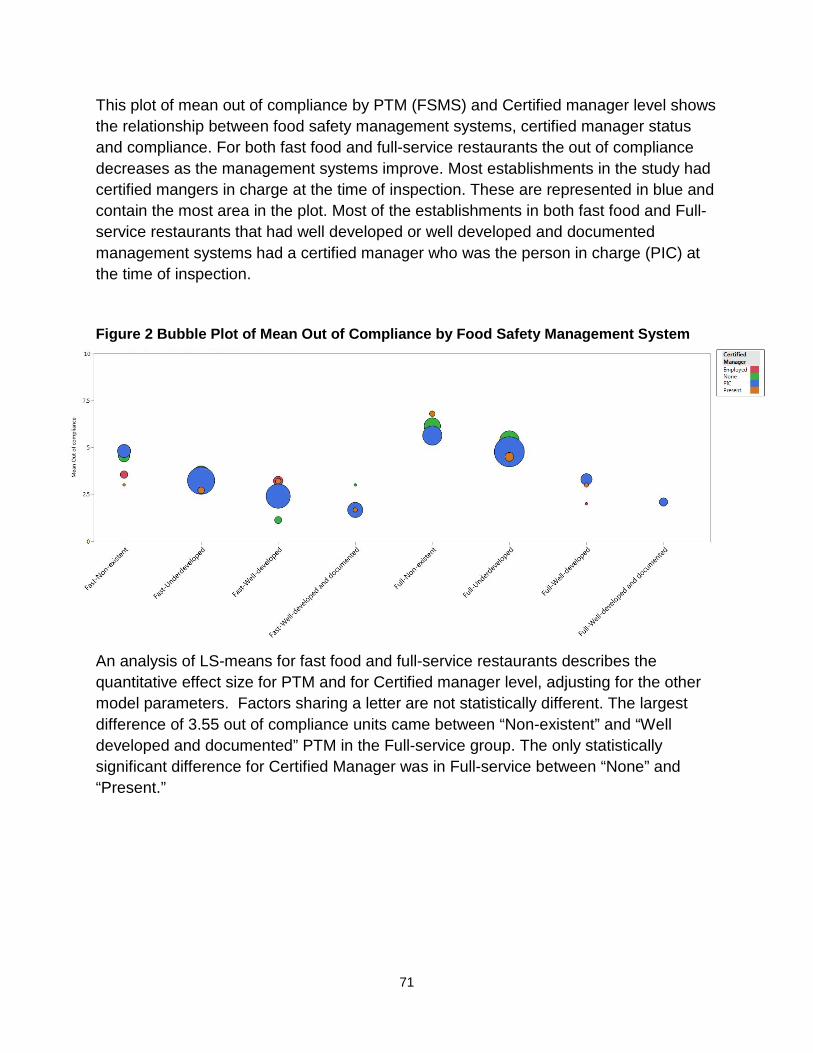
71
This plot of mean out of compliance by PTM (FSMS) and Certified manager level shows the relationship between food safety management systems, certified manager status and compliance. For both fast food and full-service restaurants the out of compliance decreases as the management systems improve. Most establishments in the study had certified mangers in charge at the time of inspection. These are represented in blue and contain the most area in the plot. Most of the establishments in both fast food and Full-service restaurants that had well developed or well developed and documented management systems had a certified manager who was the person in charge (PIC) at the time of inspection.
Figure 2 Bubble Plot of Mean Out of Compliance by Food Safety Management System
An analysis of LS-means for fast food and full-service restaurants describes the quantitative effect size for PTM and for Certified manager level, adjusting for the other model parameters. Factors sharing a letter are not statistically different. The largest difference of 3.55 out of compliance units came between “Non-existent” and “Well developed and documented” PTM in the Full-service group. The only statistically significant difference for Certified Manager was in Full-service between “None” and “Present.”
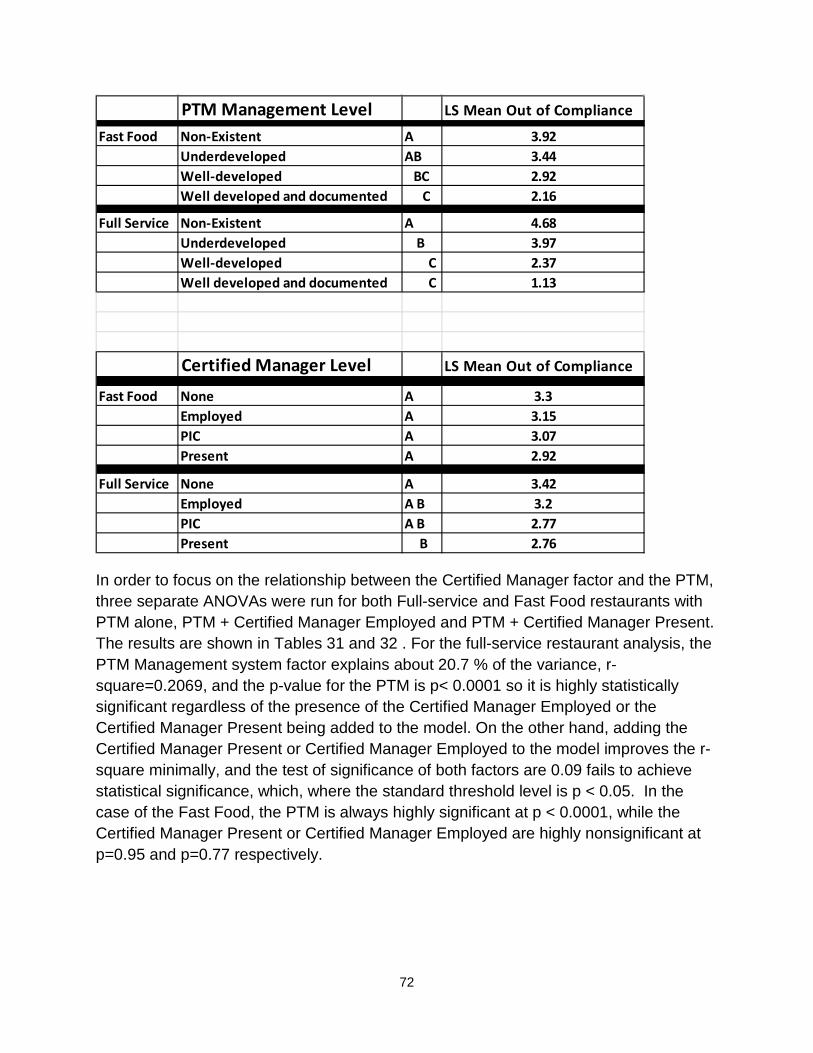
72
In order to focus on the relationship between the Certified Manager factor and the PTM, three separate ANOVAs were run for both Full-service and Fast Food restaurants with PTM alone, PTM + Certified Manager Employed and PTM + Certified Manager Present. The results are shown in Tables 31 and 32 . For the full-service restaurant analysis, the PTM Management system factor explains about 20.7 % of the variance, r-square=0.2069, and the p-value for the PTM is p< 0.0001 so it is highly statistically significant regardless of the presence of the Certified Manager Employed or the Certified Manager Present being added to the model. On the other hand, adding the Certified Manager Present or Certified Manager Employed to the model improves the r-square minimally, and the test of significance of both factors are 0.09 fails to achieve statistical significance, which, where the standard threshold level is p < 0.05. In the case of the Fast Food, the PTM is always highly significant at p < 0.0001, while the Certified Manager Present or Certified Manager Employed are highly nonsignificant at p=0.95 and p=0.77 respectively.
PTM Management Level LS Mean Out of Compliance
Fast Food Non-Existent A 3.92Underdeveloped AB 3.44Well-developed BC 2.92Well developed and documented C 2.16
Full Service Non-Existent A 4.68Underdeveloped B 3.97Well-developed C 2.37Well developed and documented C 1.13
Certified Manager Level LS Mean Out of Compliance
Fast Food None A 3.3Employed A 3.15PIC A 3.07Present A 2.92
Full Service None A 3.42Employed A B 3.2PIC A B 2.77Present B 2.76

73
Table 31 ANOVA by Food Safety Management System: Full-service Restaurant
Model Factor P-value R-square PTM(FSMS), Certified Manager
Employed PTM(FSMS) 0.0001 0.2125
CFPM
employed 0.09 (NS) PTM(FSMS), Certified Manager
Present PTM(FSMS) 0.0001 0.2127 CFPM Present 0.09 (NS)
PTM (FSMS) only PTM(FSMS) 0.0001 0.2069
Table 32 ANOVA by Food Safety Management System: Fast Food Restaurant
Model Factor P-value R-square PTM(FSMS), Certified Manager
Employed PTM (FSMS) 0.0001 0.178
CFPM
employed 0.77 (NS) PTM (FSMS), Certified Manager
Present PTM (FSMS) 0.0001 0.1781 CFPM Present 0.95 (NS)
PTM (FSMS) only PTM(FSMS 0.0001 0.178
These results, along with the full model and the bubble plots clearly demonstrate that there is a very strong association between Management Systems and In-compliance in this survey. The correlations seen with Certified Manager effects and compliance are explained by the fact that restaurants with good management systems are also more likely to employ Certified Managers or have them present at the time of inspection.

74
ACRONYMS/ABBREVIATIONS The following table describes the acronyms and abbreviations used throughout this report.
Table 33 Acronyms and Abbreviations
Acronym Meaning
AMC active managerial control
BRC British Retail Consortium
CDC Centers for Disease Control and Prevention
CFPM certified food protection manager
CFSAN Center for Food Safety and Applied Nutrition
FDA U.S. Food and Drug Administration
FSMS food safety management system
GMP good manufacturing practices
HACCP hazard analysis and critical control points
NRA National Restaurant Association
SQF Safe Quality Food Institute
PTM Procedures, Training and Monitoring
VNRFRPS Voluntary National Retail Food Regulatory Program Standards
75
REFERENCES Angelo, K.M., Nisler, A.L., Hall, A.J., Brown, L.G., and Gould, L.H. (2016). Epidemiology
of Restaurant-associated Foodborne Disease Outbreaks, United States, 1998-2013. Epidemiology & Infection, 1-12.
Brown, L.G., Le, B., Wong, M.R., Reimann, D., Nicholas, D., Faw, B., Davis, E., and Selman, C.A. (2014). Restaurant Manager and Worker Food Safety Certification and Knowledge. Foodborne Pathogens and Disease, (11)11, 1-19.
Cates, S.C., Muth, M.K., Karns, S.A., Penne, M.A., Stone, C.N., Harrison, J.E., and Radke, V.J. (2008). Certified Kitchen Managers: Do They Improve Restaurant Inspection Outcomes? Journal of Food Protection, (72)2, 384-391.
Centers for Disease Control and Prevention. Surveillance for Foodborne Disease Outbreaks, United States, 2014 Annual Report. Retrieved from http://www.cdc.gov/foodsafety/pdfs/foodborne-outbreaks-annual-report-2014-508.pdf.
Codex Alimentarius Commission (2003). Hazard Analysis and Critical Control Point (HACCP) System and Guidelines for its Application; Annex to Recommended International Code of Practice/General Principles of Food Hygiene. CAC/RCP 1-1969, Rev 4, FAO/WHO Codex Alimentarius Commission (2003).
Cormier, R.J., Mallet, M., Chiasson, S., Magnusson, H., and Valdimarsson, G. (2007). Effectiveness and Performance of HACCP-based Programs. Food Control, 18(6), 665-671.
Food and Drug Administration (2000). Report of the FDA Retail Food Program Database of Foodborne Illness Risk Factors. Retrieved from https://wayback.archive-it.org/7993/20170406023019/https://www.fda.gov/downloads/Food/GuidanceRegulation/UCM123546.pdf
Food and Drug Administration (2004). FDA Report on the Occurrence of Foodborne Illness Risk Factors in Selected Institutional Foodservice, Restaurant, and Retail Food Store Facility Types. Retrieved from https://wayback.archive-it.org/7993/20170406023011/https://www.fda.gov/downloads/Food/GuidanceRegulation/RetailFoodProtection/FoodborneIllnessRiskFactorReduction/UCM423850.pdf
Food and Drug Administration (2009). FDA Report on the Occurrence of Foodborne Illness Risk Factors in Selected Institutional Foodservice, Restaurant, and Retail Food Store Facility Types. Retrieved from https://wayback.archive-

76
it.org/7993/20170406023004/https://www.fda.gov/Food/GuidanceRegulation/RetailFoodProtection/FoodborneIllnessRiskFactorReduction/ucm224321.htm
Food and Drug Administration (2010). FDA Trend Analysis Report on the Occurrence of Foodborne Illness Risk Factors in Selected Institutional Foodservice, Restaurant, and Retail Food Store Facility Types (1998-2008). Retrieved from https://wayback.archive-it.org/7993/20170406022950/https://www.fda.gov/Food/GuidanceRegulation/RetailFoodProtection/FoodborneIllnessRiskFactorReduction/ucm223293.htm
Food and Drug Administration (2013a). Food Code. Retrieved from http://www.fda.gov/Food/ GuidanceRegulation/RetailFoodProtection/FoodCode/ucm374275.htm.
Food and Drug Administration (2013b). Study on the Occurrence of Foodborne Illness Risk Factors in Selected Retail and Foodservice Facility Types (2013-2024) – Protocol for the Data Collection. Retrieved from http://www.fda.gov/downloads/Food/GuidanceRegulation/RetailFoodProtection/ FoodborneIllnessRiskFactorReduction/UCM505468.pdf.
Food and Drug Administration (2013c). Retail Food Program Foodborne Illness Risk Factor Study – Marking Instructions for the Data Collection Form. Retrieved from http://www.fda.gov/downloads/ Food/GuidanceRegulation/RetailFoodProtection/FoodborneIllnessRiskFactorReduction/UCM505471.pdf.
Hedberg, C.W., Smith, S.J., Kirkland, E., Radke, V., Jones, T.F., Selman, C.A., and EHS-Net Working Group (2006). Systematic Environmental Evaluations to Identify Food Safety Differences between Outbreak and Nonoutbreak Restaurants. Journal of Food Protection, (69)11, 2697-2702.
Hedberg, C.W., Palazzi-Chauras, K.L., Radke, V.J., Selman, C.A., and Tauxe, R.V. (2007). The Use of Clinical Profiles in the Investigation of Foodborne Outbreaks in Restaurants: United States, 1982-1997. Epidemiology and Infection, 136, 65-72.
International Organization for Standardization (2005). ISO 22000:2005. Food Safety Management Systems – Requirements for any Organization in the Food Chain. Retrieved from: http://www.iso.org/iso/home/store/catalogue_tc/catalogue_detail.htm?csnumber=35466.
Leinwand, S.E., Glanz, K., Keenan, B.T., and Branas, C. C. (2017). Inspection Frequency, Sociodemographic Factors, and Food Safety Violations in Chain and

77
Nonchain Restaurants, Philadelphia, Pennsylvania, 2013-2014. Public Health Reports, 10,1-8.
Luning, P.A., Bango, L., Kussaga, J., Rovira, J., and Marcelis, W.J. (2008). Comprehensive Analysis and Differentiated Assessment of Food Safety Control Systems: A Diagnostic Instrument. Trends in Food Science & Technology, 19(10), 522-534.
Luning, P.A., Marcelis, W.J., Rovira, J., Van der Spiegal, M., Uyttendaela, M., and Jacxsens, L. (2009). Systematic Assessment of Core Assurance Activities in a Company-specific Food Safety Management System. Trends in Food Science & Technology, 20(6), 300-312.
National Restaurant Association. (2016). Facts at a Glance. Retrieved from http://www.restaurant.org/News-Research/Research/Facts-at-a-Glance.
Powell, L.M., Nguyen, B.T., and Han, E. (2012). Energy Intake from Restaurants: Demographics and Socioeconomics, 2003–2008. American Journal of Preventive Medicine, 43(5), 498-504.
Ropkins, K., and Beck, A.J. (2000). Evaluation of Worldwide Approaches to the Use of HACCP to Control Food Safety. Trends in Food Science & Technology, 11(1), 10-12.
Scallan E., Hoekstra, R.M., Angulo, F.J., Tauxe, R.V., Widdowson, M.A., Roy, S.L., Jones, J.L., and Griffin, P.M. (2011). Foodborne Illness Acquired in the United States—Major Pathogens. Emerging Infectious Diseases, 17(1), 7-15.
Scharff, R. (2012). Economic Burden from Health Losses Due to Foodborne Illness in the United States. Journal of Food Protection, 75(1), 123-131.
Stewart, H., Blisard, N., Bhuyan, S., and Nayga Jr., R.M. (2004). The Demand for Food away from Home. U.S. Department of Agriculture, Economic Research Service, Agricultural Economic Report, 829.