obstacles to developing small and medium-sized … · obstacles to developing small and...
TRANSCRIPT
P.svkem~dx Id (~S Dg3
WORKING PAPEARS
I PUN. 6eioa Me n -I t
Country Economics DepartmentThe World BankFebruary 1991
WPS 588
Obstacles to DevelopingSmall and Medium-Sized
Enterprises
An Empirical Assessment
Brian Levy
How financing, regulatory, technical, marketing, and otherconstraints inhibit small and medium-sized enterprises fromparticipating in the economies of Sri Lanka and Tanzania - andwhat this means for policy.
The Pdicy.Rearch, and External Affairs CoMple distibuter PRE Working Papen to diuarnnate the findinsp of work n pross andto encourage the exchange of ideas among Bank staff and alU others interested in development issues, nese poape carry the names ofthe authors, eflect mnly their views, and should be used and cited accordingly. The findings, interpreations, and conclusions are theauthors own. They should not be atuibuted to the World Bank, its Board of Directors, its managenent, or any od its manber countrie.
Pub
lic D
iscl
osur
e A
utho
rized
Pub
lic D
iscl
osur
e A
utho
rized
Pub
lic D
iscl
osur
e A
utho
rized
Pub
lic D
iscl
osur
e A
utho
rized
ndWPrivate Soo-bwvlo_ri
WPS 588
This paper - a product of the Public Sector Management and Private Sector Development Division,Country Economics Department - is part of a larger effort in PRE to understand how to strengthen thepnvate sector in developing countries. Copies are available free from the World Bank, 1818 i Street NW,Washington DC 20433. Please contact Ernestina Madrona, roomn N9-061, extension 37496 (62 pages).
Brian Levy analyzes different types of con- In Sri Lanka, heavy formal tax and regulatorystraints on the participation of small and obligations are imposed only on larger firms.medium-sized enterprises (SMEs) in the econo- Reform priorities there should be to reducemies of Sri Lanka and Tanzania. He concludes these disincentives to finns achieving fornalthat: status and to broaden (but not to the point of
universality) the reach of the tax and* The type and severity of constraints vary regulatory apparatus.
between the two countries:In Tanzania, heavy tax and regulatory
Lack of access to finance is the binding requirements are imposed on all firms, albeitnonprice constraint on the expansion of all with pervasive lubrication and renegotiation ofSMEs in Tanzania, and on smaller, less- formal obligations. There the reforn priorityestablished firms in Sri Lanka. should be to exempt the smallest enterprises
entirely from regulatory and tax obligationsIn Tanzania, tax and regulatory burdens am and to introduce more transparentthe next heaviest constraint on all SMEs. In administrative procedures.Sri Lanka, the smallest, least-establishedenterprises maintain an informal status outside * Underdeveloped arm's-length markets forthe regulatory web. Larger, established Sri intermediate inputs constrain the participation ofLankan SMEs are inhibited by a host of SMEs. A prime cause of such market weaknessnonprice constraints, no one of which is is vertically integrated production by state-dominant. owned enterprises, even where there is no
economic rationale for such integration. ATanzania's formal and informal financial challenge for privatization is to distinguish
systems for SMEs are weak. Sri Lanka's finan- between those sectors where vertical integrationcial system for SMEs functions weUl; firms for is efficient and should be maintained when state-which financing is limited are those to which owned enterprises are privatized and those wherelending would be imprudent. A key policy the vertical structure should be broken up,question is whether targeted credit should be allowing morc opportunities for SMEs to parnici-used to accelerate SMEs' access to formal pate.financial institutions (such a World Bank pro-gram was important for Sri Lanka's success) and * Educated entrepreneurs in established SMEswhether banks should use their SME lending that serve high-quality market niches (but notapparatus to make loans to microenterprises uneducated entrepreneurs serving simpler(which even in Sri Lanka are denied access to markets) perceive limits in enterprise andformal finance). economywide technical and marketing capabili-
ties as significantly constraining expansion. It* Regulation inhibits the expansion of SMEs remains uncertain whether the weakness of
in quite different ways in the two countries: support systems signals an underlying marketimperfection that only government interventioncan overcome.
The PRE Worldng Paper Series disseninates the fidings of work under way in the Bank's Policy, Research, and ExternalAffairs Complex. An objective of the series is to get these findings out quickly, even if presentations re lss than fully polished.The find ngs, interpretations, ad conclusions in these papers do not necessarily represent ofricial Bank policy.
Produced by PRE Editorial Services
TABLE OF CONTENTS
Page No.
I. SOME PRELIMINARIES ...................................... 1
I.1 Structural Adjustment, Micro Constraints, andSME Participation ...................... , ., 1
I.2 The Empirical Approach ............................ 4
II. AN ASSESSMENT OF CONSi'RAINTS .. 9
Tt.1 An Overview of the Constraints. 9
II.2 Constraints on Access to Finance .... .............. 12
1I.3 Regulatory Constraints ............................ 21
II.4 Constraints on Access to Non-Financial Inputs ..... 30
III. SOME POLICY IMPLICATIONS ................................ 40
III.1 Formulating the Agenda for Reform .... ............. 40
I1I.2 Enhancing Access to Finance ....................... 43
III.3 Reforming the Regulatory and Tax Regime .... ....... 45
III.4 Enhancing Access to Non-Financial Inputs .... ...... 52
ANNEX A . ................................................. 55
I am grateful to Rafael Herz, Danl Kaufman, EnrlqueRueda-Sabater, Mary Shirley, Willlam Steel, Andrew Stone,and Lelia Webster for thelr helpful comments.
OBSTACLES TO THE DEVEL'IMENT OF INDIGENOUS SHALL AND MEDIUM ENTERPRISES:
AN EMPIRICAL ASSESSMENT
I: SOME PRELIMINARIES
The purpose of this paper is to report the results of micro-level
field research conducted in late 1989 and earl7 1990 of constraints
confronting small and medium enterprises (SMEs) in Sri Lanka and Tanzania,l
and to analyze the implications of these results for reforms to promote the
development of an efficient indigenous private sector in LDCs. In doing so,
an effort will be made to lay out the empirical methodology in sufficient
detail to facilitate parallel studies in other countries where there might be
some interest in assessing obstacles to SME development.
I.1 Structural Adjustment, Micro Constraints, and SME Participation
Among the many lessons that have begun to emerge with the
accumulation of experience in programs of structural adjustment, two are
central to the present paper. First, it has increasingly become apparent that
programs of reform that eliminate macro-economic imbalances, bring overvalued
exchange rates closer to equilibrium, and promote pricing on the basis of
market signals and opportunity costs are not necessarily sufficient to ease
the constraints on development. In some countries, rather than securing a
1 The research served as inputs for Tanzania Country Economic Memorandum(1990) and Sri Lanka: Country Economic Memorandum (1990). Preliminary papersthat provide the results of the analyses for each country in more detail thanis provided heti are available upon request.
-2-
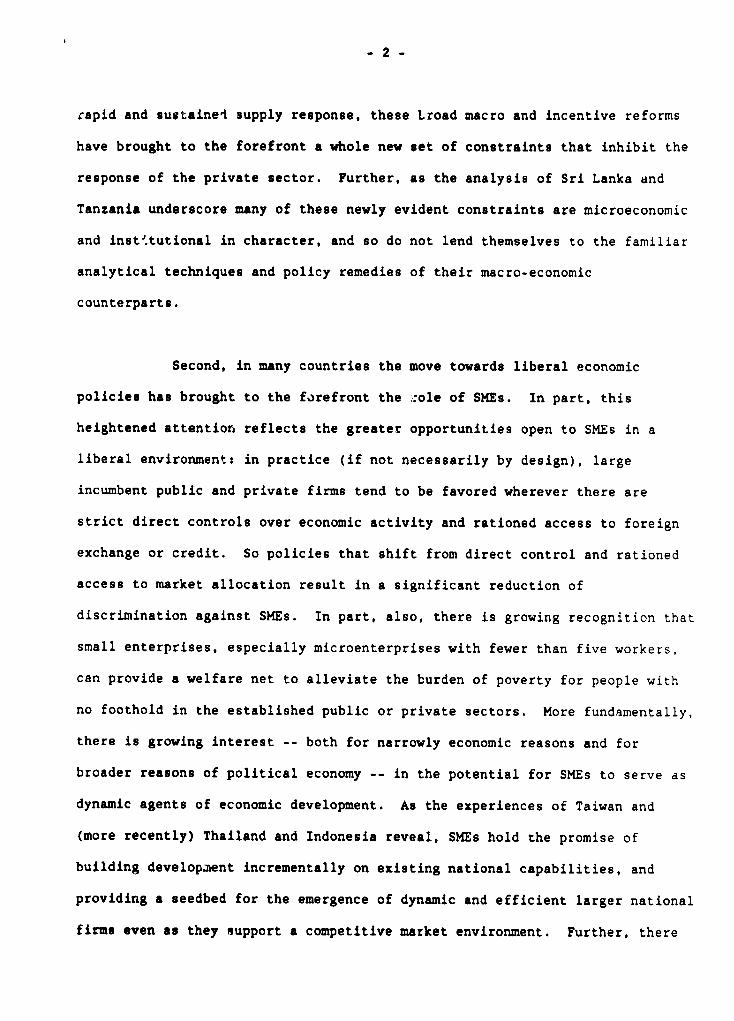
rapid and sustained supply response, these Lroad macro and incentive reforms
have brought to the forefront a whole new set of constraints that inhibit the
response of the private sector. Further, as the analysis of Sri Lanka and
Tanzania underscore many of these newly evident constraints are microeconomic
and inst'.tutional in character, and so do not lend themselves to the familiar
analytical techniques and policy remedies of their macro-economic
counterparts.
Second, in many countries the move towards liberal economic
policies has brought to the forefront the .:ole of SMEs. In part, this
heightened attention reflects the greater opportunities open to SMEs in a
liberal environment: in practice (if not necessarily by design), large
incumbent public and private firms tend to be favored wherever there are
strict direct controls over economic activity and rationed access to foreign
exchange or credit. So policies that shift from direct control and rationed
access to market allocation result in a significant reduction of
discrimination against SMEs. In part, also, there is growing recognition that
small enterprises, especially microenterprises with fewer than five workers,
can provide a welfare net to alleviate the burden of poverty for people with
no foothold in the established public or private sectors. More fundamentally,
there is growing interest -- both for narrowly economic reasons and for
broader reasons of political economy -- in the potential for SMEs to serve as
dynamic agents of economic development. As the experiences of Taiwan and
(more recently) Thailand and Indonesia reveal, SMEs hold the promise of
building development incrementally on existing national capabilities, and
providing a seedbed for the emergence of dynamic and efficient larger national
firms even as they support a competitive market environment. Further, there
-3-
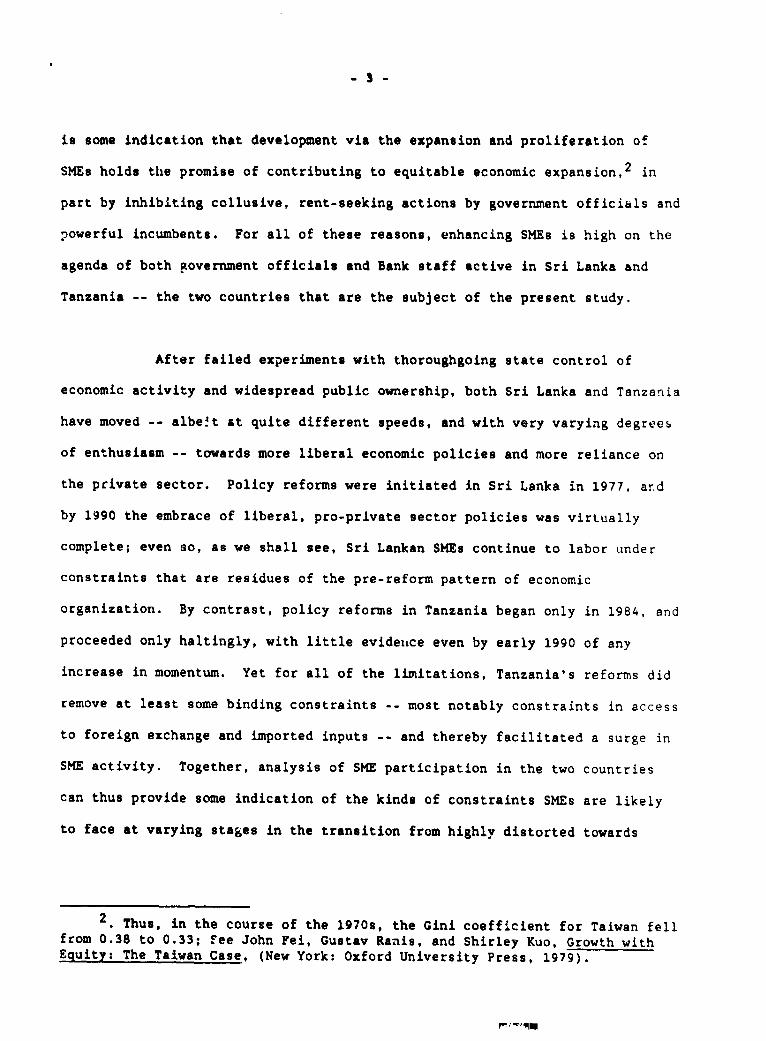
is some indication that development via the expansion and proliferation of
SMEs holds the promise of contributing to equitable economic expansion,2 in
part by inhibiting collusive, rent-seeking actions by government officials and
powerful incumbents. For all of these reasons, enhancing SMEs is high on the
agenda of both government officials and Bank staff active in Sri Lanka and
Tanzania -- the two countries that are the subject of the present study.
After failed experiments with thoroughgoing state control of
economic activity and widespread public ownership, both Sri Lanka and Tanzania
have moved -- albe't at quite different speeds, and with very varying degrees
of enthusiasm -- towards more liberal economic policies and more reliance on
the private sector. Policy reforms were initiated in Sri Lanka in 1977, ard
by 1990 the embrace of liberal, pro-private sector policies was virtually
complete; even so, as we shall see, Sri Lankan SMEs continue to labor under
constraints that are residues of the pre-reform pattern of economic
organization. By contrast, policy reforms in Tanzania began only in 1984, and
proceeded only haltingly, with little evidelLce even by early 1990 of any
increase in momentum. Yet for all of the limitations, Tanzania's reforms did
remove at least some binding constraints -- most notably constraints in access
to foreign exchange and imported inputs -- and thereby facilitated a surge in
SME activity. Together, analysis of SME participation in the two countries
can thus provide some indication of the kinds of constraints SMEs are likely
to face at varying stages in the transition from highly distorted towards
2. Thus, in the course of the 1970s, the Gini coefficient for Taiwan fellfrom 0.38 to 0.33; Fee John Fei, Gustav Ranis, and Shirley Kuo, Growth withEquity: The Taiwan Case, (New York: Oxford University Press, 1979).
r 's
-4-
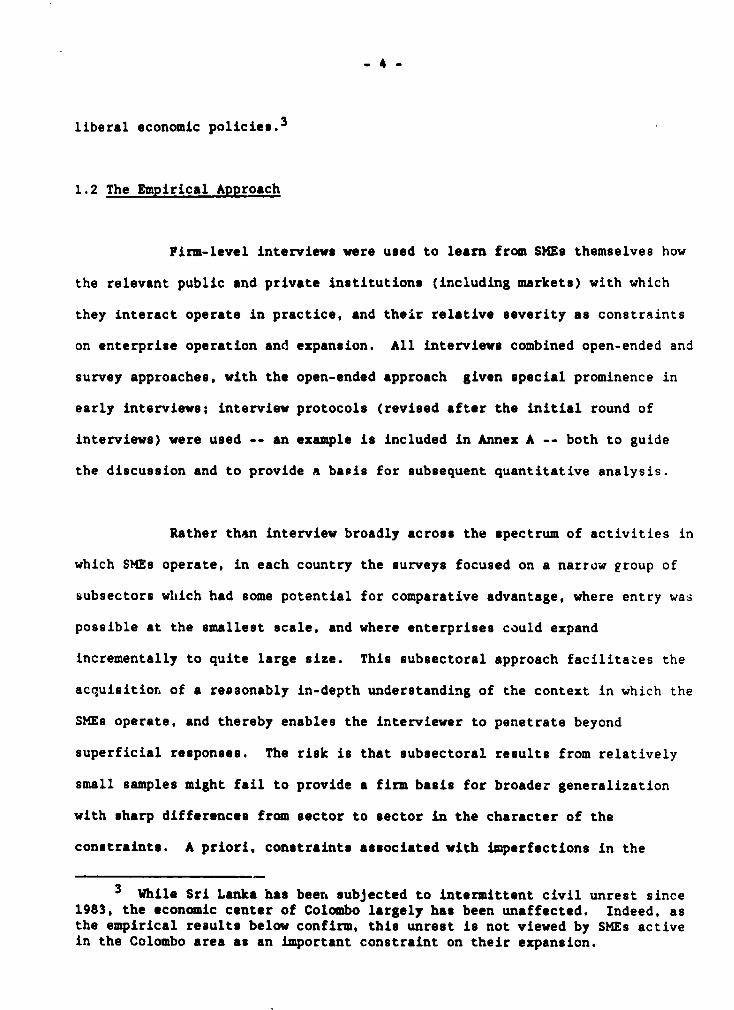
liberal economic policies.3
1.2 The Empirical Approach
Firm-level interviews were used to learn from SMEs themselves how
the relevant public and private institutions (including markets) with which
they interact operate in practice, and their relative severity as constraints
on enterprise operation and expansion. All interviews combined open-ended and
survey approaches, with the open-ended approach given special prominence in
early interviews; interview protocols (revised after the initial round of
interviews) were used -- an example is included in Annex A -- both to guide
the discussion and to provide a basis for subsequent quantitative analysis.
Rather than interview broadly across the spectrum of activities in
which SMEs operate, in each country the surveys focused on a narrow group of
subsectors wihich had some potential for comparative advantage, where entry was
possible at the smallest scale, and where enterprises could expand
incrementally to quite large size. This subsectoral approach facilitates the
acquisitior of a reasonably in-depth understanding of the context in which the
SMEs operate, and thereby enables the interviewer to penetrate beyond
superficial responses. The risk is that subsectoral results from relatively
small samples might fail to provide a firm basis for broader generalization
with sharp differences from sector to sector in the character of the
constraints. A priori, constraints associated with imperfections in the
3 While Sri Lanka has beer. subjected to intermittent civil unrest since1983, the economic center of Colombo largely has been unaffected. Indeed, asthe empirical reaults below confirm, this unrest is not viewed by SMEs activein the Colombo area as an important constraint on their expansion.
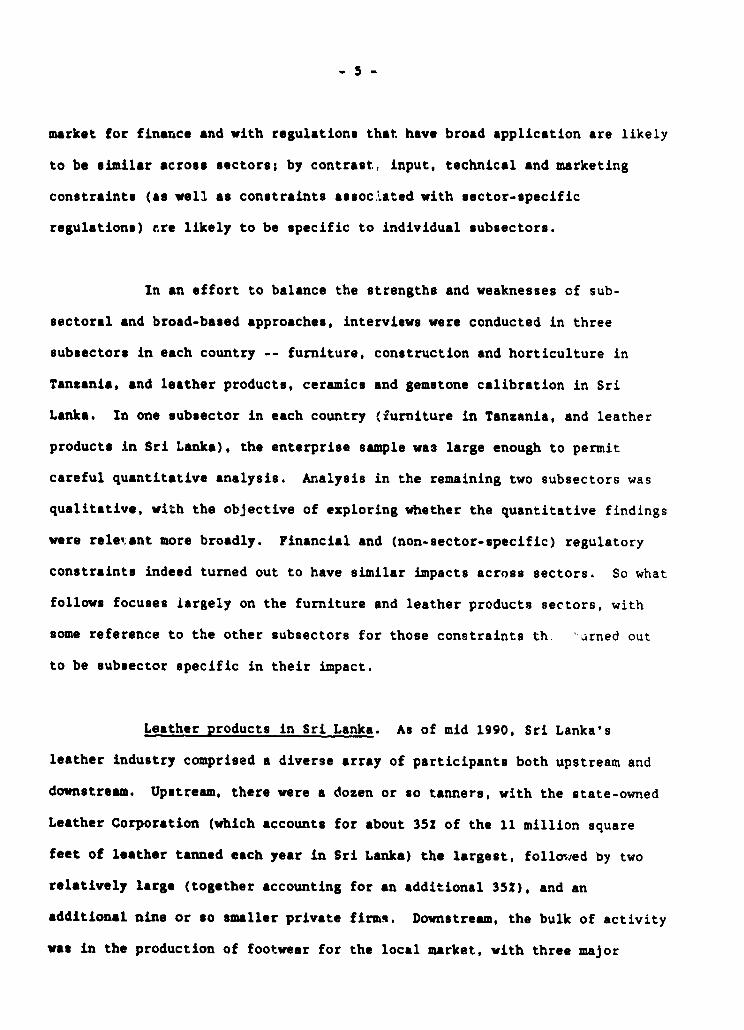
market for finance and with regulations that have broad application are likely
to be similar across sectors; by contrast, input, technical and marketing
constraints (as well as constraints assoc.ated with sector-specific
regulations) cre likely to be specific to individual subsectors.
In an effort to balance the strengths and weaknesses of sub-
sectoral and broad-based approaches, interviews were conducted in three
subsectors in each country -- furniture, construction and horticulture in
Tanzania, and leather products, ceramics and gemstone calibration in Sri
Lanka. In one subsector in each country (furniture in Tanzania, and leather
products in Sri Lanka), the enterprise sample was large enough to permit
careful quantitative analysis. Analysis in the remaining two subsectors was
qualitative, with the objective of exploring whether the quantitative findings
were reletant more broadly. Financial and (non-sector-specific) regulatory
constraints indeed turned out to have similar impacts across sectors. So what
follows focuses iargely on the furniture and leather products sectors, with
some reference to the other subsectors for those constraints th. .arned out
to be subsector specific in their impact.
Leather products in Sri Lanka. As of mid 1990, Sri Lanka's
leather industry comprised a diverse array of participants both upstream and
downstream. Upstream, there were a dozen or so tanners, with the state-owned
Leather Corporation (which accounts for about 35Z of the 11 million square
feet of leather tanned each year in Sri Lanka) the largest, folloted by two
relatively large (together accounting for an additional 35?), and an
additional nine or so smaller private firms. Downstream, the bulk of activity
was in the production of footwear for the local market, with three major
producers (the multinational enterprise Bata, a downstre-m division of the
Leather Corporation, and a private Sri Lankan firm), some medium-sized
enterprises (some of whom produce for their own retail outlets, with others
engaged in subcontracting -- most often for Bata), and a host of smaller
producers of footwear, including thousands of cobblers active in Sri Lanka.
Along with footwear for the local market, two enterprises -- one Japanese, the
other Korean -- produced leather footwear products for export throughout Sri
Lanka's export processing zone. Footwear aside, there were also a number of
producers of other leather products, largely for exports and the local tourist
market; these vary in size from relatively large operations to SMEs with fewer
than 30 employees. Interviews were conducted with the Leather Corporation,
two private tanners, Bata, and 38 locally-owned producers of leather products
and footwear in the greater Colombo area.
As the patterns of enterprise participation imply, with the
possible exception of tanning, economies of scale in the leather industries
are limited, and the scope for SME participation consequently substantial.
Further, export patterns suggest that Sri Lanka's comparative advantage in the
leather industry is based on an abundant supply of labor skilled in the
fabrication of high value added, labor intensive leather products. Exports of
these goods -- by the two enterprises located in the export zones, by two
relatively large producers of industrial gloves and other leather products
that are part of vertically integrated tanning and leather products
enterprises, and by a half dozen or so SMEs -- accounted for over 90 percent
of Sri Lanka's leather exports in 1987. However, with total exports under $S5
million, Sri Lanka has barely begun to tap its potential comparative advantage
in the export by both large enterprises and SMEs of high value added, labor
- 7 -
intensive leather products. Indeed, with the exception of the two firms
located in the export zones, not a single Sri Lankan producer of footwear has
yet4 begun to participate in any sustained way in the export of footwear. T-e
analysis that follows of SME constraints identifies some of the reasons for
this limited export performance.
Furniture in Tanzania. The field research on Tanzania's furniture
industry was concentrated on the capital city, Dar es Salaam, and its
surrounding areas. Participating firms include 5 medium-to-large enterprises
whose ownerp are of Indian origin (or -- in one case -- an expatriate
European) and each employ up to 200 workers, 5-10 medium-sized firms (also
with owners of Indian origin), half a dozen or so long-established,
indigenously owned small-to-medium ventures (some of which were taken over
from non-indigenous owners that left the country in the late 1960s and early
1970s), and hundreds (no accurate count is available) of indigenous
enterprises that entered the industry irk the 1980s, apparently with some
acceleration in entry since the initiation of structural adjustment reforms in
1985. Some of the newer, indigenouc SMEs have achieved quite substantial
incremental expansion, and at the time of interviews employed up to 70
workers.5 Twenty-four firms were interviewed, .ncluding 3 in the medium-to-
large category.
4 Bata apparently is beginning to explore export markets, and has set anexport target of 10 percent of total sales by 1992.
5 Thus, 9 of the 13 (randomly selected) post-1980 entrants that wereinterviewed started up their operations in the 1986-1989 period, and only 4between 1981 and 1985. SEe also the aggregate data in the upcoming Tanzania:Country Economic Memorandum that supports this conclusion.
The submarkets served by Tanzania's furniture enterprises range
from the completion of large-volume orders for government agencies and the
export of processed wood products at the top end of the market, to roadside
males of household furniture to consumers at the bottom-end. Between these
extremes firms produced furniture for sale in retail shorrooms (in all but one
instance marketing was vertically integrated, with the showrooms owned by the
manufacturers themselves), supplied high-quality custom designed furniture for
higher-income consumers, and produced household furniture on tender to
government agencies including parastatals .'e agencies, in turn, distribute
the furniture as a fringe benefit to higher-level employees). Interviews
uncovered evidence of quite substantial mobility among submarkets. Smaller
enterprises increasingly have moved into the aid-range of the market: 7 of the
indigenous SME interviewees won their first tenders to supply government
agencies in the 1980s, all but one of these in the pasc two years. Although
very few retailera purchase from independent manufacturers for subsequent
resale,6 at least one of the expanding enterprises in the aample responded by
establishing his own makeshift 'showroom' some distance from his workshop.
Paralleling the movement of smaller enterprises, some larger
enterprises are in the process of moving from the mid-range to the top end of
the market. One enterprise has recently abandoned entirely furniture
manufacture to devote itself to the production fo- *xport of parquet flooring
and other components of wood; a second enterpriee has reduced the share of
6 One reason for this absence of intermediation at the retail level maybe the prevailing sales tax regime which treats as two separate taxabletransactions a sale from manufacturer to retailer and then from retailer tofinal customer, but as only one transaction a sale from a manufacturer throughhis own showroom to a final consumer.
- 9 -
wood furniture in total sales from 50S to 107, shifting instead into the
production of metal office furniture for the domestic market and the export of
parquet flooring and other wood components. An important implication of these
moves up-market by larger enterprises is that, rather than being "crowded
out", new market opportunities are likely continually to emerge for SMEs
seeking to expand. Subsequent sections of this paper will detail many of the
obstacles that confront indigenous SMEs as they seek to take advantage of the
new opportunities.
II: AN ASSESSMENT OF CONSTRAINTS
I1.1 An Overview of the Constraints
The e3trtepreneurship surveys in the Tanzanian furniture and Sri
Lankan leether industries explored with enterprises their assessments of the
relative magnitude of obstacles inhibiting their efforts to expand. An
initial set of interviews yielded a list of potential constraints to expansion
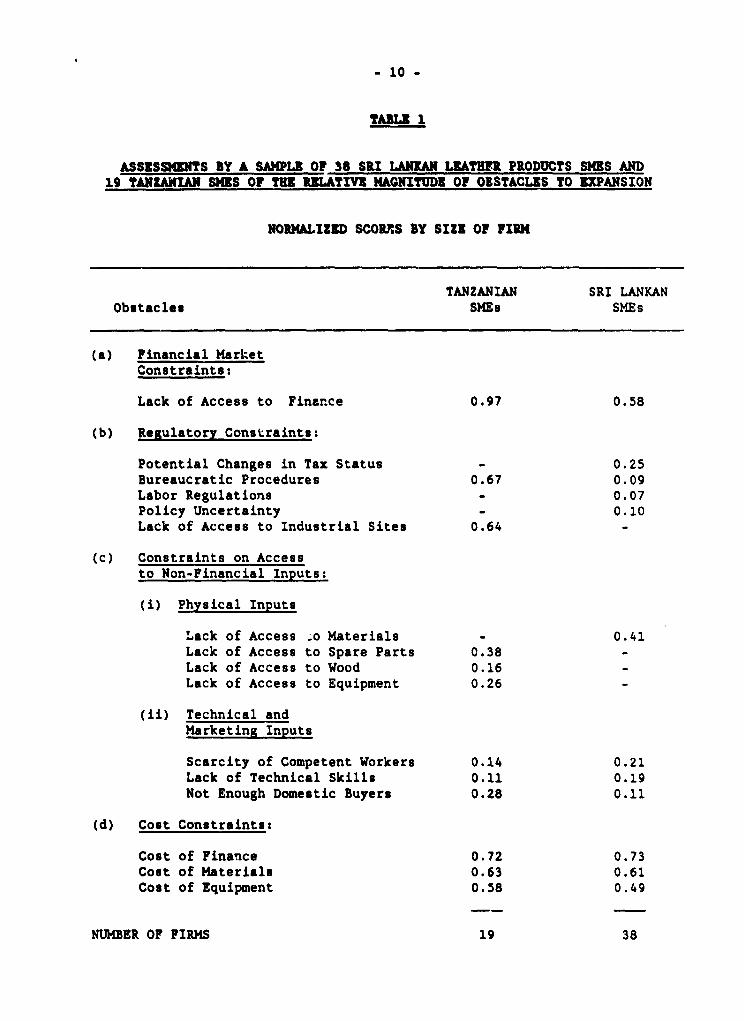
in each industry.7 Table 1 groups these constraints into four categories:
financing constraints; regulatory constrainto; technical, marketing and other
non-financial input constraints; and cost constraints. As the table details,
there was a broad overlap between the two industries (and countries) in the
constraints identified, albeit with some variation in the specific ways in
which they were formulated.
7 The small differences in Table 1 between the constraints for Tanzaniaand those for Sri Lanka reflect differences in the way firms in the twocountries classified their constraints.
- 10 -
TABLE
ASSESSMENTS BY A SAMPLE OF 38 SRI LANKAN LEATHER PRODUCTS SMES AND19 TANZANIAN SMIS OF THE RCLATIVI MAGNITUDE OF OBSTACLES TO EXPANSION
NORMALIZED SCORRIS BY SIZE OF FIRM
TANZANIAN SRI LANKANObstacles SHEs SMEs
(a) Financial MarketConstraints:
Lack of Access to Finance 0.97 0.58
(b) Regulatory Constraints:
Potential Changes in Tax Status - 0.25Bureaucratic Procedures 0.67 0.09Labor Regulations _ 0.07Policy Uncertainty - 0.10Lack of Access to Industrial Sites 0.64 -
(c) Constraints on Accessto Non-Financial Inputs:
(i) Physical Inputs
Lack of Access o Materials - 0.41Lack of Access to Spare Parts 0.38 -Lack of Access to Wood 0.16Lack of Access to Equipment 0.26 -
(ii) Technical andMarketing Inputs
Scarcity of Competent Workers 0.14 0.21Lack of Technical Skills 0.11 0.19Not Enough Domestic Buyers 0.28 0.11
(d) Cost Constraints:
Cost of Finance 0.72 0.73Cost of Materials 0.63 0.61Cost of Equipment 0.58 0.49
NUMBER OF FIRMS 19 38
- 11 -
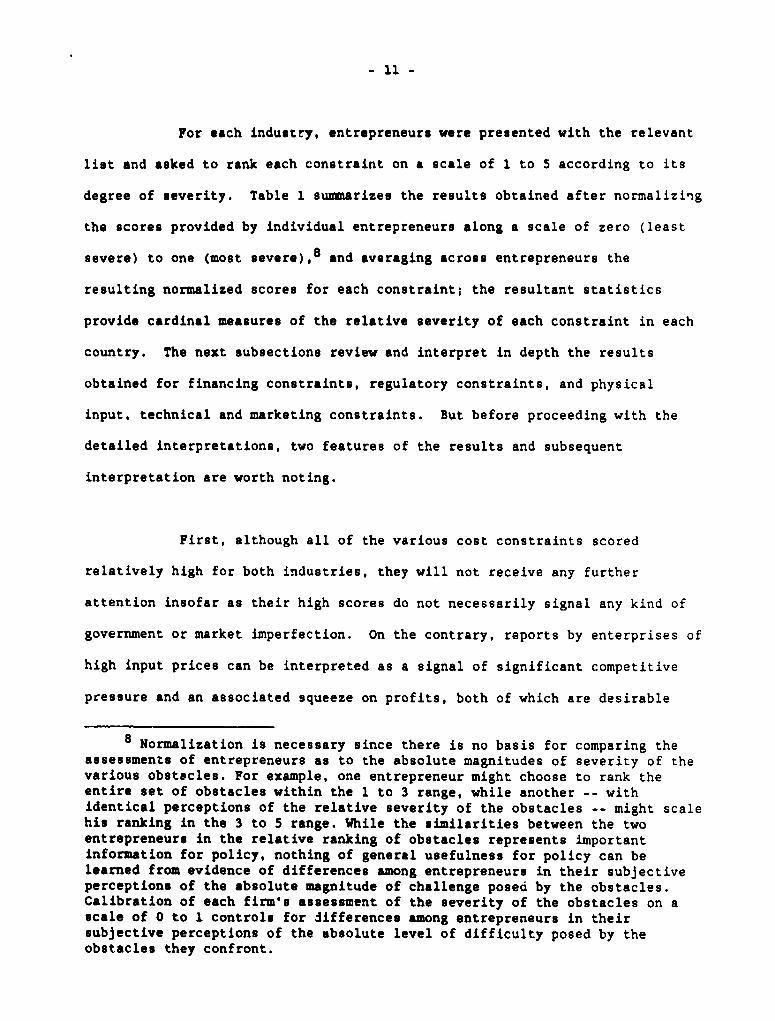
For each industry, entrepreneurs were presented with the relevant
list and asked to rank each constraint on a scale of 1 to 5 according to its
degree of severity. Table 1 summarizes the results obtained after normalizing
the scores provided by individual entrepreneurs along a scale of zero (least
severe) to one (most severe),8 and averaging across entrepreneurs the
resulting normalized scores for each constraint; the resultant statistics
provide cardinal measures of the relative severity of each constraint in each
country. The next subsections review and interpret in depth the results
obtained for financing constraints, regulatory constraints, and physical
input, technical and marketing constraints. But before proceeding with the
detailed interpretations, two features of the results and subsequent
interpretation are worth noting.
First, although all of the various cost constraints scored
relatively high for both industries, they will not receive any further
attention insofar as their high scores do not necessarily signal any kind of
government or market imperfection. On the contrary, reports by enterprises of
high input prices can be interpreted as a signal of significant competitive
pressure and an associated squeeze on profits, both of which are desirable
8 Normalization is necessary since there is no basis for comparing theassessments of entrepreneurs as to the absolute magnitudes of severity of thevarious obstecles. For example, one entrepreneur might choose to rank theentire set of obstacles within the 1 to 3 range, while another -- withidentical perceptions of the relative severity of the obstacles -- might scalehis ranking in the 3 to 5 range. While the similarities between the twoentrepreneurs in the relative ranking of obstacles represents importantinformation for policy, nothing of general usefulness for policy can belearned from evidence of differences among entrepreneurs in their subjectiveperceptions of the absolute magnitude of challenge posed by the obstacles.Calibration of each firm's assessment of the severity of the obstacles on ascale of 0 to 1 controls for Jifferences among entrepreneurs in theirsubjective perceptions of the absolute level of difficulty posed by theobstacles they confront.
- 12 -
insofar as they induce enterprises to innovate and become more efficient.9
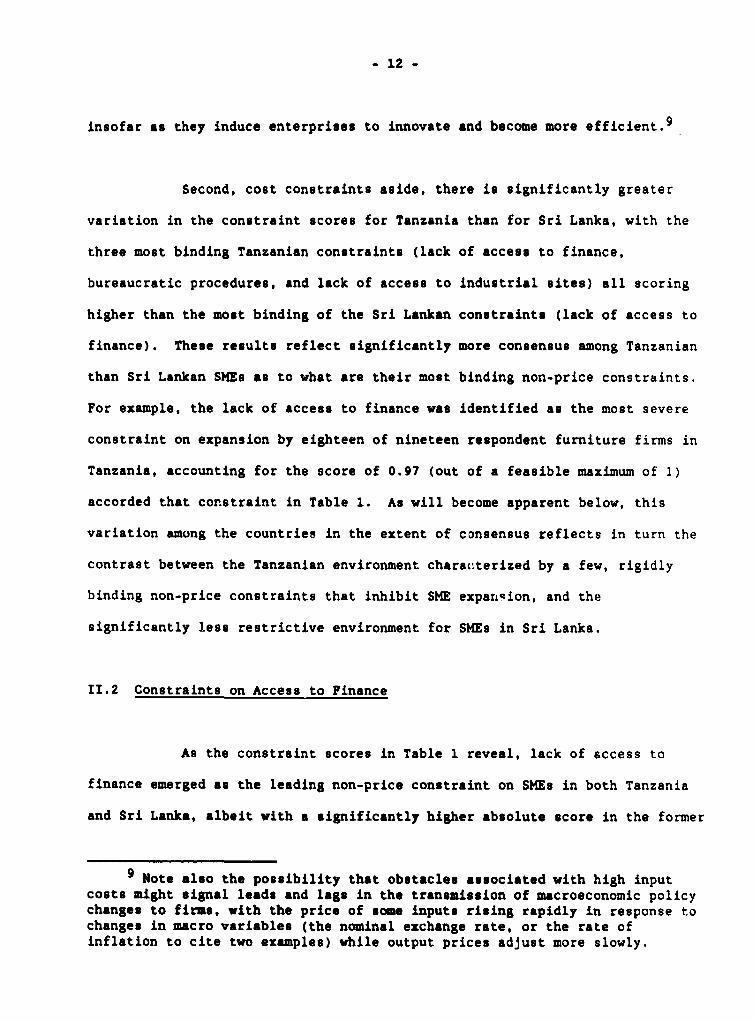
Second, cost constraints aside, there is significantly greater
variation in the constraint scores for Tanzania than for Sri Lanka, with the
three most binding Tanzanian constraints (lack of access to finance,
bureaucratic procedures, and lack of access to industrial sites) all scoring
higher than the most binding of the Sri Lankan constraints (lack of access to
finance). These results reflect significantly more consensus among Tanzanian
than Sri Lankan SMEs as to what are their most binding non-price constraints.
For example, the lack of access to finance was identified as the most severe
constraint on expansion by eighteen of nineteen respondent furniture firms in
Tanzania, accounting for the score of 0.97 (out of a feasible maximum of 1)
accorded that constraint in Table 1. As will become apparent below, this
variation among the countries in the extent of consensus reflects in turn the
contrast between the Tanzanian environment characterized by a few, rigidly
binding non-price constraints that inhibit SHE exparLiion, and the
significantly less restrictive environment for SMEs in Sri Lanka.
II.2 Constraints on Access to Finance
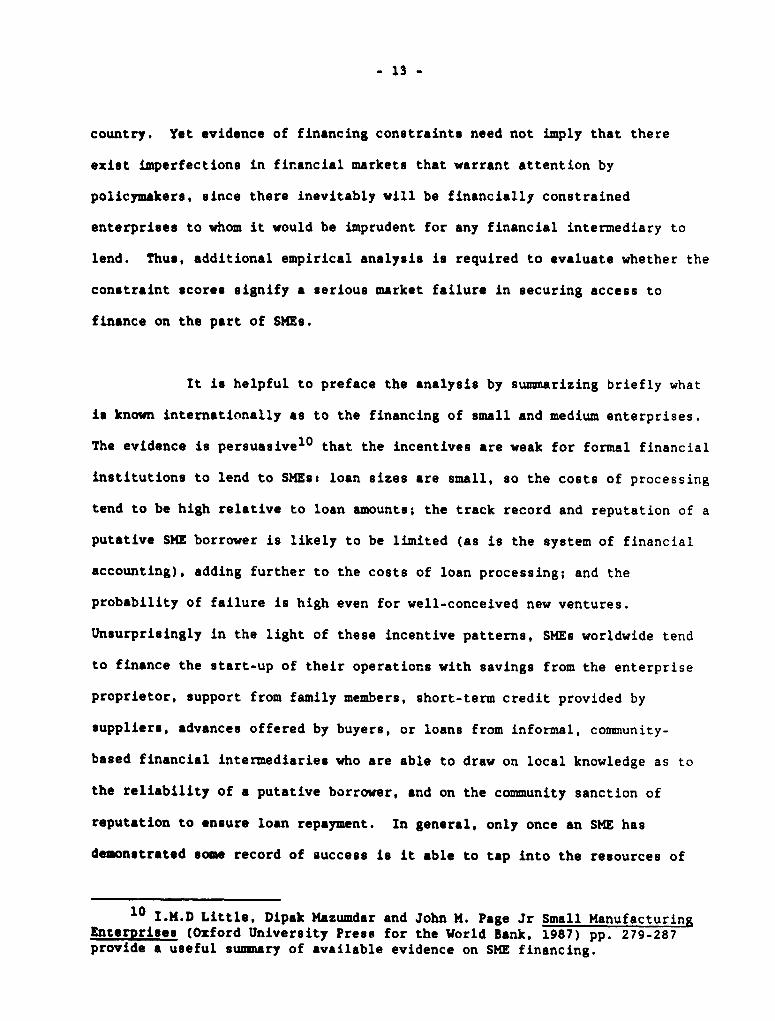
As the constraint scores in Table 1 reveal, lack of access to
finance emerged as the leading non-price constraint on SMEs in both Tanzania
and Sri Lanka, albeit with a significantly higher absolute score in the former
9 Note also the possibility that obstacles associated with high inputcosts might signal leads and lags in the transmission of macroeconomic policychanges to firms, with the price of some inputs rising rapidly in response tochanges in macro variables (the nominal exchange rate, or the rate ofinflation to cite two examples) while output prices adjust more slowly.
- 13 -
country. Yet evidence of financing constraints need not imply that there
exist imperfections in financial markets that warrant attention by
policymakers, since there inevitably will be financially constrained
enterprises to whom it would be imprudent for any financial intermediary to
lend. Thus, additional empirical analysis is required to evaluate whether the
constraint scores signify a serious market failure in securing access to
finance on the part of SHEs.
It is helpful to preface the analysis by summarizing briefly what
is known internationally as to the financing of small and medium enterprises.
The evidence is persuasive10 that the incentives are weak for formal financial
institutions to lend to SMEs: loan sizes are small, so the costs of processing
tend to be high relative to loan amounts; the track record and reputation of a
putative SME borrower is likely to be limited (as is the system of financial
accounting), adding further to the costs of loan processing; and the
probability of failure is high even for well-conceived new ventures.
Unsurprisingly in the light of these incentive patterns, SMEs worldwide tend
to finance the start-up of their operations with savings from the enterprise
proprietor, support from family members, short-term credit provided by
suppliers, advances offered by buyers, or loans from informal, community-
based financial intermediaries who are able to draw on local knowledge as to
the reliability of a putative borrower, and on the community sanction of
reputation to ensure loan repayment. In general, only once an SME has
demonstrated some record of success is it able to tap into the resources of
10 I.H.D Little, Dipak Mazumdar and John M. Page Jr Small ManufacturingEnterprises (Oxford University Press for the World Bank, 1987) pp. 279-287provide a useful summary of available evidence on SME financing.

- 14 -
the formal financial system.
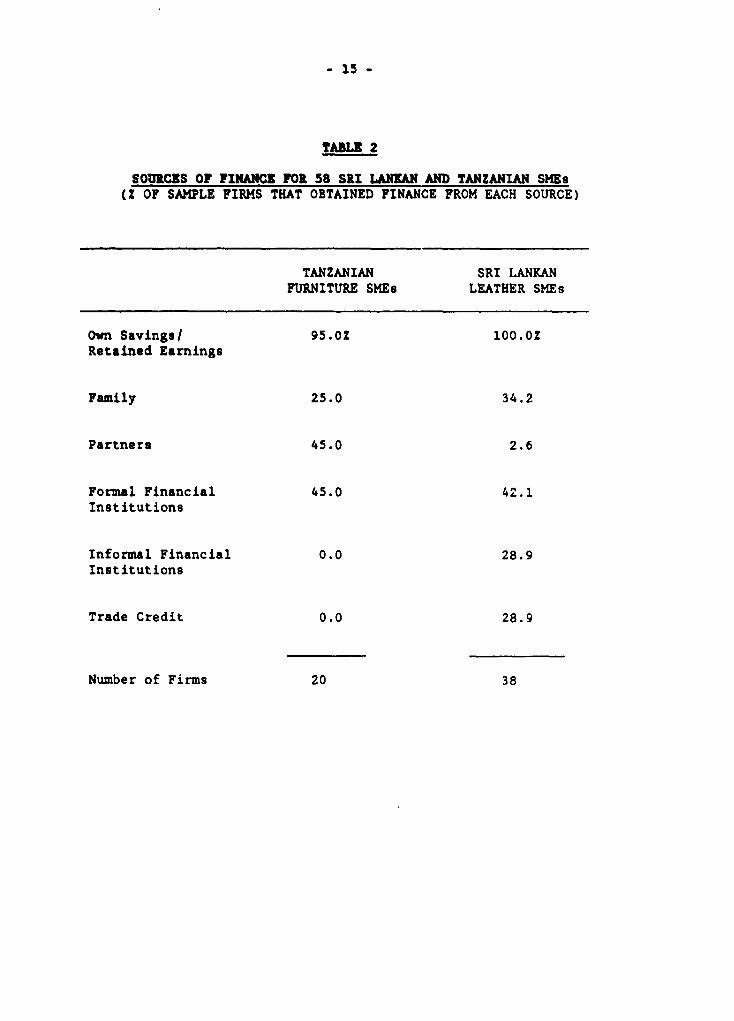
As Table 2 summarizes, the financing mechanisms of both Sri Lankan
and Tanzanian SMEs exhibit some similarities to the stylized general pattern,
albeit with some suggestive differences between the two countries. One
feature common to both countries is the dominant role of own savings:
consistent with the general pattern, all but one of the 58 OMER for which data
were available drew on the savings of the proprietor.
By contrast to the similar role of own savings, there are
significant differences between the two countries in the role of informal
credit (including trede credit). Paralleling the general pattern, trade
credits or informal financial intermediaries each have been used by about 30
percent of the sampled Sri Lankan enterprises, with half the sample having
used at least one of these informal sources.11 Interestingly, 32 percent of
the Sri Lankan sample reported using at least one of these sources of informal
credit in their initial years of operation, prior to securing finance from the
formal banking sector.
In Tanzania, none of the sample enterprises obtained financing via
either trade credits or informal intermediaries, 1 2 although the widespread use
of partnerships in that country could be interpreted as representing a
substitute channel of informal financing. The absence of trade credit can in
11 3 of the sampled Srl Lankan SMEs obtained finance via both tradecredits and informal financial institutions.
12 The picture is quite different for non-indigenous entrepreneurs activein Tanzania who apparently have access to well-developed informal mechanismsof financial intermediation.
- 15 -
TABLE 2
SOURCES OF FINANCE FOR 58 SRI LANKAN AND TANZANIAN SMEs(Z OF SAMPLE FIRMS THAT OBTAINED FINANCE FROM EACH SOURCE)
TANZANIAN SRI LANKANFURNITURE SMEs LEATHER SMEs
Own Savings/ 95.0 100.02Retained Earnings
Family 25.0 34.2
Partner. 45.0 2.6
Formal Financial 45.0 42.1Institutions
Informal Financial 0.0 28.9Institutions
Trade Credit 0.0 28.9
Number of Firms 20 38
- 16 -
part be accounted for by the virtual breakdown of Tanzania's chequing system
in the fsce of both pervasive banking inefficiencies (on which more below) and
a legal system which affords only protracted and uncertain recourse; legally-
binding post-dated cheques are commonly used as credit and payment mechanisms
in countries where firms make extensive use of trade credit. As for the
absence of other informal lending mechanisms for indigenous enterprises, here
the Tanzanian pattern appears illustrative of a lacuna that is evident
throughout East Africa.
Turning to formal finance, in Tanzania a number of financial
institutions (all state-owned, as are all financial institutions in the
country) have the responsibility in principle for providing financial support
to SMEs: a small enterprise lending unit has been operating in the National
Bank of Commerce since 1982; since 1974 the Small Industries Development
Organization (SIDO) has provided financing for the purchase of new equipment;
in principle the Co-operative and Rural Development Bank also lends to SMEs.
By contrast to Tanzania, Sri Lanka's banking system is highly diversified, and
includes 4 domestic commercial banks (2 government owned), four regional rural
development banks, two industrial development banks, 21 foreign commercial
banks, and a host of finance companies, leasing companies and insurance
companies. At the very least, all 4 domestic commercial banks, both
industrial development banks, and the regional rural development banks
actively are engaged in lending to SMEs. A comprehensive analysis of the
performance of Tanzania's and Sri Lanka's financial institutions is beyond the
scope of the present paper. Rather the task here is the narrower one of
evaluating that performance from the perspective of the putative borrowers --
the SM¢s themselves.
- 17 -
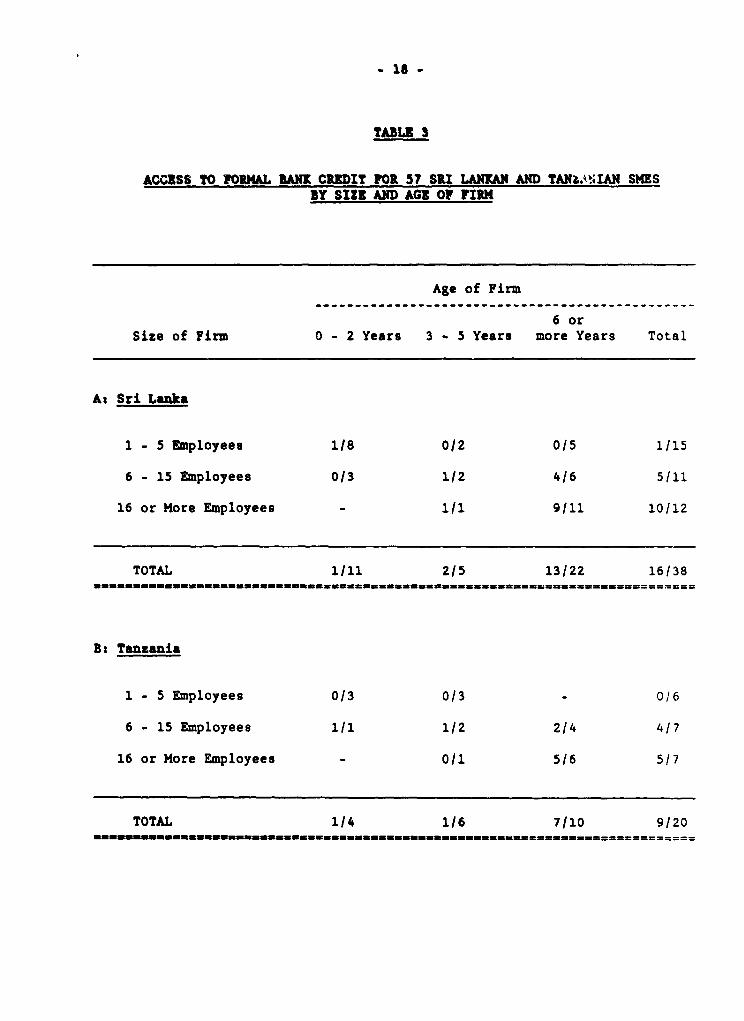
Table 3 disaggregates the Sri Lankan and Tanzanian SMEs with
access to formal bank loans by size and age of the enterprises. As the table
reveals, only 1 of 18 Sri Lankan, and 1 of 7 Tanzanian SMEs with 5 or fewer
employees and less than 3 years of experience had access to formal finance;
these patterns of lending are consistent with the theory and empirical
evidence suarized earlier that it is entirely rational for banks not to lend
to the smallest and least established firms. Coverage within the pool of
'qualifying' clients (those with more than 5 employees, and at least 3 years
of experience) appears similar in the two ccuntries, with loans extended to 75
percent (15 of 20) of the qualifying Sri Lankan SMEs, and about 70 percent (9
of 13) of the qualifying Tanzanian firms.
What the data in Table 3 do not reveal are the sharp differences
between the two countries in the characteristics of those qualifying'
borrowers without loans, and in the service afforded to SMEs with loans. Four
of the five qualifying Sri Lankan SMEs without loans reported that they were
not financially constrainedl3, and exhibited no interest in borrowing from
banks. By contrast, all 5 of the qualifying Tanzanian firms that were without
loans identified lack of access to finance as among their leading
constraints.14 Three of the five were among the most successful and rapidly
expanding SMEs in the sample; all three made initial approaches to the banks
Table 3
13 Each of these 4 SMEs recorded 0 (zero) as their normalized score foraccess to finance as a constraint on expansion.
14 The constraint score for lack of access to finance was the maximumpossible of 1 for 4 of the 5 firms, and 0.75 for the fifth.
_ 18 -
TABLE 3
ACCESS TO FORMAL ANU CREDIT FOR 57 SRI LANKAN AND TANXAkIAN SMESBY SIZE AND AGE OF FIRt
Age of Firm
6 orSize of Firm 0 - 2 Years 3 - 5 Years more Years Total
As Sri Lanka
1 - 5 Employees 1/8 0/2 0/5 1/15
6 - 15 Employees 0/3 1/2 4/6 5/11
16 or More Employees - 1/1 9/11 10/12
TOTAL 1/11 2/5 13/22 16/38
8: Tanzania
1 - 5 Employees 0/3 0/3 - 0/6
6 - 15 Employees 1/1 1/2 214 4/7
16 or More Employees - 0/1 5/6 5/7
TOTAL 1/4 1/6 7/10 9/20m m m m mrn m m m m m ainssssssws^susassss^ss=ss.s=== == ==
- 19 -
for loans, but without success am of the time of the interviews.15 In large
part, their difficulties can be attributed to the exceedingly burdensome
conditions that Tanzanian SMEs must meet if they are to qualify for loans.
According to interviewees, loan applicants are required to provide fixed
property as collateral; since the banks refuse to recognize leasehold land
title (the only form of land title permitted in Tanzania) as collateral, only
individuals with the resources to erect physical structures on their land can
borrow, and only to the value of these physical structures. Further, along
with collateral, applicants are required to provide detailed feasibility
studies of their projected investments (even where commercial bank loans take
the form of overdraft facilities, typically used for working capital), as well
as detailed financial statements. Even with collateral, feasibility studies,
and financial statements in hand, firms reported that the processing of loan
applications takes an average of six months, and may still require side
payments as a precondition for processing.
As for service to SMEs with loans, while Sri Lanka's 16 borrower
SMEs appeared satisfied with the service they were afforded, 8 of the 9 SMEs
with loans in Tanzania complained bitterly about their relationship with the
banks. The difficulties of 3 of the firms appear to be related to the
precarious financial condition of the enterprises themselves. but of the
remaining 6 (healthy) firms, 2 reported that the bank imposed its own
arbitrary loan ceiling thereby disrupting the enterprise's business plan even
though all prerequisites for a larger loan had been fulfilled, and 2 others
15 One firm still had no response two years after the initialapplication; a second was waited already for six months, and expects anadditional one year's wait. The third approached a bank in 1988, but wasdiscouraged by burdensome bureaucracy and a demand for SME payments.
- 20 -
reported that their banker temporarily shut down their overdraft facilities,
over disputes that were peripheral to the lending relationship itself. The
conclusion that emerges from the interviews is that Tanzania's banks do not
view their lending to indigenous SMEs in developmental terms, with a goal of
identifying and supporting enterprises that have real potential to succeed
commercially, and a mutual interest on the part of both the bank and the
enterprise in a venture's success. Rather, as indigenous enterprises see it,
the banks perceive them to be unwelcome supplicants, to be dealt with only so
long as stringent conditions are met and, even then, only so long as the
enterprise respects without question the omniscient authority of the lending
agency.
In all, the constraint scores and detailed empirical analysis
reveal a good deal about the relative im,ortance of lack of access to finance
as an obstacle to SHE expansion in the two sample countries. In Tanzania, the
evidence that finance represents the binding constra'nt appears unambiguous:
not only were Tanzania's SMEs virtually unanimous in scoring lack of access to
finance as their leading obstacle to expansion, the disaggregated analysis
points to a virtual disintegration of Tanzania's financial system for SMEs.
By contrast to Tanzania, only 14 of the 38 SMEs sampled in Sri Lanka
identified lack of access to finance as their leading constraint on expansion.
Further, consistent with evidence that Sri Lanka's banks rationally choose not
to lend to the smallest and least established firms, 8 of the 14 financially
constrained SMEs either had been in business for less than 3 years or had 5 or
fewer employees; and 3 of the 6 remaining financially constrained SMEs
reported current levels of employment to be well below some earlier peak
- 21 -
level,16 suggesting that they might be serious credit risks. Absent these 11
SMEs, Sri Lanka's score for lack of access to finance as an obstacle to
expansion falls to 0.41. Together the constraint scores and disaggregated
analysis suggest that, while some of the smallest and least established Sri
Lankan SMEs indeed appear to be credit constrained, for the more established
SMEs the system of financing functions well and is not a serious obstacle to
continued expansion.
I1.3 Regulatory Constraints
Consistent with the general approach outlined in the introduction,
the analysis of regulatory constraints in Sri Lanka and Tanzania focused not
on the formal regulations themselves but rather on the impact of these
regulations on SMEs. The analysis shows regulatory constraints to be
significantly more binding to Tanzanian SMEs than to their Sri Lankan
counterparts. Further, it shows that there are substantial differences
between the impact that might be deduced from perusal of the formal
regulations themselves, and the impact as actually experienced by SMEs.
Finally, it shows that regulation can inhibit SHE expansion in two quite
different ways, wiith one of these operative in Tanzania, and the other (if to
a lesser extent) in Sri Lanka.
The scores for the two sets of regulatory constraints included in
Table 1 for Tanzania -- lack of access to industrial sites and bureaucratic
procedures -- both are relatively high, at 0.64 and 0.67 respectively. The
16 In all, 7 of the 38 sample Sri Lankan enterprises reported theiremployment levels as of 1990 as below some earlier, peak level.
- 22 -
catch-all category of bureaucratic procedures subsumes the relations of
Tanzanian SMEs with a wide range of regulatory authorities, including sales
and income tax authorities, town councils which serve as licensing
authorities, providers of public utilities (power, telephone and water), the
National Provident Fund, and officials from the Labor Ministry; in practice,
as detailed further below, Tanzanian SMEs reported that their bureaucratic
difficulties were most substantial with the sales, income tax and licensing
authorities. Table 1 provides more disaggregation for the Sri Lankan
regulatory constraints, explicitly separating labor regulations and the
constraint associated with potential changes in tax status from other
bureaucratic procedures that might inhibit SME expansion; the latter includes
local licensing requirements, and relations with the providers of public
utilities.17 By contrast to the results for Tanzania, the scores are
relatively low for all three Sri Lankan regulatory constraints.
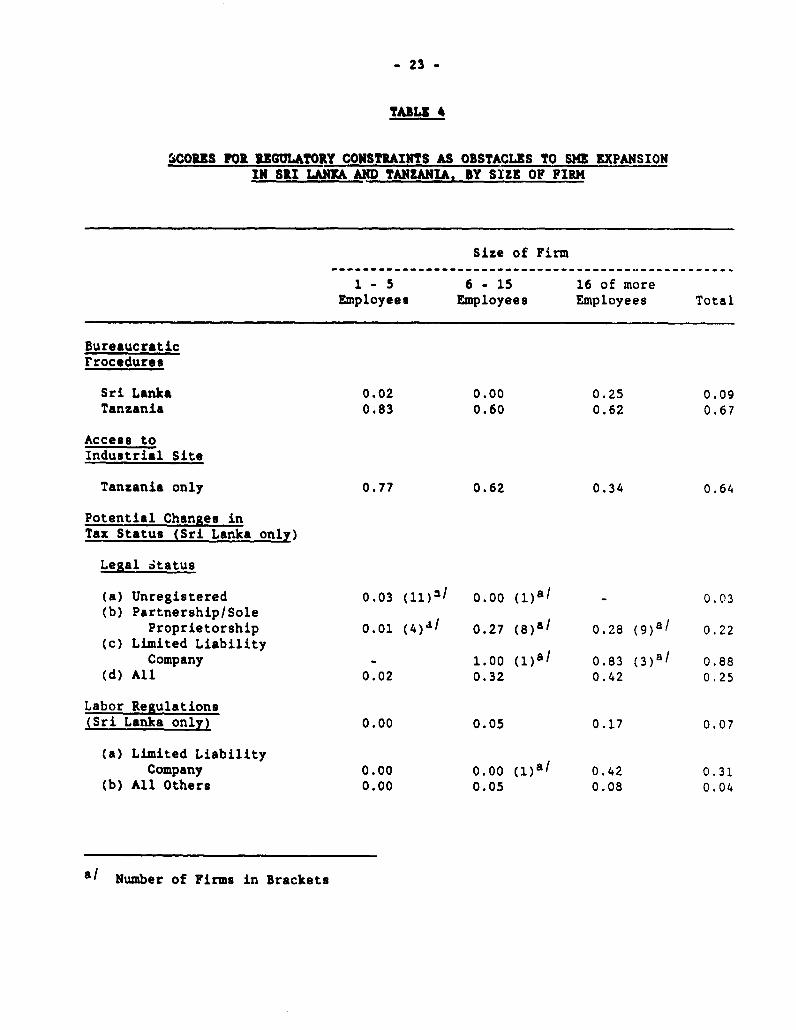
Table 4 decomposes the constraint scores by size and (for Sri
Lanka) legal status of SMEs. The decomposition uncovers svstematic variation
in the impact of regulatory constraints among SMEs, with the pattern of
variation different across the two countries. Whereas in Tanzania the scores
are largest for the smallest enterprises, in Sri Lanka the scores rise as
enterprise size increases for all three sets of constraints, with the rise
somewhat larger for the tax constraint than for the others; additionally,
independent of size, tax constraints appear to be especially significant for
17 Access to adequate industrial premises is not included in the categoryof bureaucratic procedures. Wile scattered anecdotal information suggeststhat this might indeed represent a constraint for some SMEs., the Sri Lankansurvey was not implemented in a way that could systematically shed light onthe issue.
- 23 -
TABLE 4
SCORES FOR REGULATORY CONSTRAINTS AS OBSTACLES TO SME EXPANSIONIN SRI LAMK AND TANZANIA, BY SIZE OF FIRM
Size of Firm
1 -5 6 - 15 16 of moreEmployees Employees Employees Total
Bureaucraticrrocedures
Sri Lanka 0.02 0.00 0.25 0.09Tanzania 0.83 0.60 0.62 0.67
Access toIndustrial Site
Tanzania only 0.77 0.62 0.34 0.64
Potential Changes inTax Status (Sri Lanka only)
Legal Status
(a) Unregistered 0.03 (11)3/ 0.00 (1)aI - 0.03(b) Partnership/Sole
Proprietorship 0.01 (4)1/ 0.27 (8)a/ 0.28 (9)a/ 0.22(c) Limited Liability
Company - 100 ()aI 0.83 ( 3 )aI 0.88(d) All 0.02 0.32 0.42 0.25
Labor Regulations(Sri Lanka only) 0.00 0.05 0.17 0.07
(a) Limited LiabilityCompany 0.00 0.00 (1)a/ 0.42 0.31
(b) All Others 0.00 0.05 0.08 0.04
a/ Number of Firms in Brackets
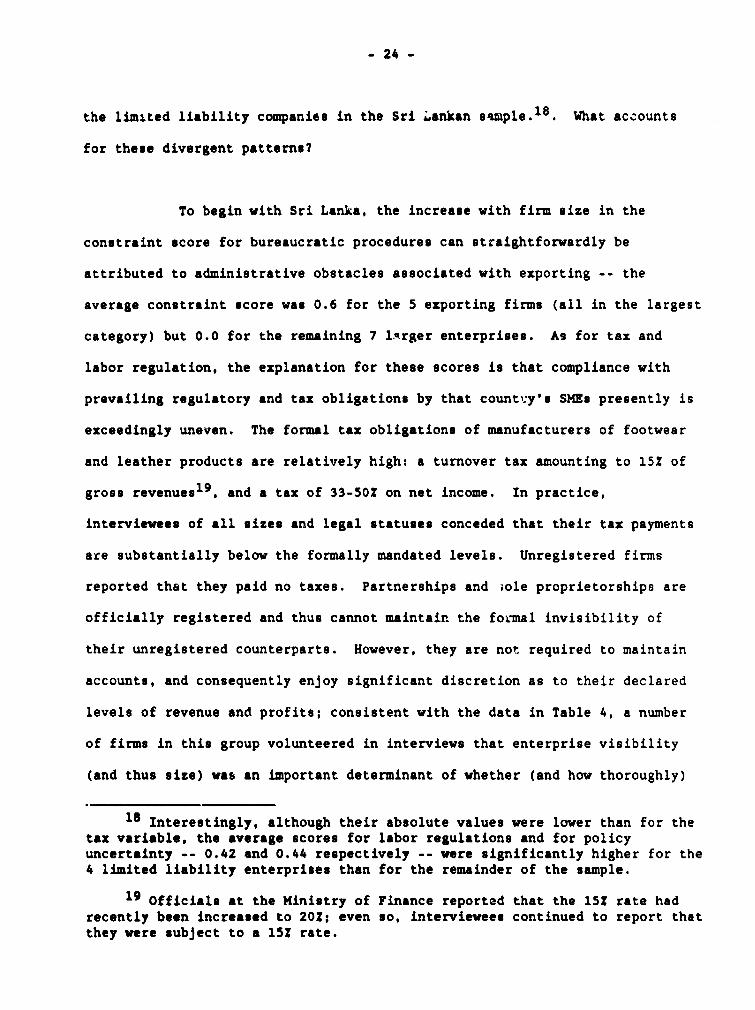
- 24 -
the limited liability companies in the Sri Lankan sample.1 8. What accounts
for these divergent patterns?
To begin with Sri Lanka, the increase with firm size in the
constraint score for bureaucratic procedures can straightforwardly be
attributed to administrative obstacles associated with exporting -- the
average constraint score was 0.6 for the 5 exporting firms (all in the largest
category) but 0.0 for the remaining 7 larger enterprises. As for tax and
labor regulation, the explanation for these scores is that compliance with
prevailing regulatory and tax obligations by that countvy's SMEs presently is
exceedingly uneven. The formal tax obligations of manufacturers of footwear
and leather products are relatively high: a turnover tax amounting to 152 of
gross revenuesl9, and a tax of 33-502 on net income. In practice,
interviewees of all sizes and legal statuses conceded that their tax payments
are substantially below the formally mandated levels. Unregistered firms
reported that they paid no taxes. Partnerships and iole proprietorships are
officially registered and thus cannot maintair the formal invisibility of
their unregistered counterparts. However, they are not required to maintain
accounts, and consequently enjoy significant discretion as to their declared
levels of revenue and profits; consistent with the data in Table 4, a number
of firms in this group volunteered in interviews that enterprise visibility
(and thus size) was an important determinant of whether (and how thoroughly)
18 Interestingly, although their absolute values were lower than for thetax variable, the average scores for labor regulations and for policyuncertainty -- 0.42 and 0.44 respectively -- were significantly higher for the4 limited liability enterprises than for the remainder of the sample.
19 Officials at the Ministry of Finance reported that the 152 rate hadrecently been increased to 20Z; even so, interviewees continued to report thatthey were subject to a 15? rate.
- 25 -
they might be investigated by the tax authorities. Limited liability
companies have less room for manoeuvre, insofar as they are required to
maintain audited accounts.20 Further, as Table 4 implies, the increased
visibility of limited liability companies also appears to make them more
likely targets of enforcement of labor regulations.21
In sum, what the data for Sri Lanka in Table 4 imply is that the
opportunities for tax evasion diminish22 with increases in size and with more
formal legal status. Enterprises that grow (or shift to limited liability
status) run the risk of suddenly finding themselves liable for very large
increases in tax obligations. As a result, many entrepreneurs rationally
limit their efforts at expansion.23 More generally, the variations in
constraint score by size and legal status suggest that the combination of high
formal tax and regulatory obligations and their uneven enforcement create a
discontinuity in the structure of costs of Sri Lankan enterprises as they
grow, thereby inhibiting expansion beyond some moderate level, and limiting
20 But even foz these companies, the sense was conveyed in interviewsthat a combination of a low profile and creative accounting could help tolimit their tax burden.
21 Interestingly, although not too much should be read into them, thedata suggest that participation in export markets increases visibility andconsequent vulnerability to labor regulation: within the largest sizecategory, the average score of the labor regulation constraint was 0.2 for the4 non-limited-liability exporters, but 0.0 for the remaining 5 non-limited-liability firms.
22 Put differently, the implication is that the risks and associatedcosts of tax evasion increase with size and more formal legal status, withconcomitant increases in the extent of tax compliance.
23 One important exception is expansion into export markets, whereearnings presently are tax free. However, export growth is also likely to beindirectly limited, insofar as tax obligations inhibit tirms from growingincrementally in the domestic market and progressively improving theircapabilities to the point that they perceive themselves to be ready to export.
- 26 -
the potential of Sri Lanka's SHE. to serve as a seedbed for the emergence of
dynamic national firms.
The constraints created by regulatory practice are quite different
in Tanzania. As in Sri Lanka, Tanzania's formal tax and regulatory
requirements are demanding. However, unlike Sri Lanka, enforcement is
comprehensive, albeit with pervasive lubrication and renegotiation of formal
obligations. The net effect of the Tanzanian pattern is to impose entry and
expansion-deterring costs on all enterprises, both financial costs and the
opportunity cost associated with the diversion of scarce entrepreneurial time
and effort away from socially efficient wealth-generating activities;24
consistent with the scores in Table 4, the relative burden of these costs
appears to fall with increases in firm size. The examples of enterprise
licensing, and sales and income tax assessment and collection illustrate.
Irrespective of size, all Tanzanian furniture enterprises formally
are obligated to license their ventures with local authorlties, and formally
are liable for very substantial payments of taxes. Enterprises with fewer
than ten employees are required to obtain a trading license; enterprises with
more than ten employees and enterprises that sell to government agencies are
required to obtain a business license. Sales tax for sales of furniture,
24 Interestingly, since for any individual enterprise that is too smallto hire a manager the supply of entrepreneurial talent is perfectly inelastic,even if the costs imposed take the form solely of fixed costs that areinvariant with enterprise size, they can nonetheless inhibit the expansion ofenterprises that have already entered into production. Analytically, theargument is that entrepreneurship is complementary to other inputs intoproduction. Thus, by freeing up the entrepreneur's time to manage hisenterprise, a reduction of bureaucratic costs would lead to a downward shiftof both fixed and variable cost schedules.

- 27 -
payable by manufacturers (and again by retailers if they operate independently
of the producers), is formally set at a rate equal to 252 of sales revenue;
income taxes are set at 50S of enterprise profits. In practice, enforcement
of Tanzania's tax and licensing requirements (at least in the capital c.ty)
was very thorough. All of the interviewees canvassed on the subject confirmed
that they were licensed to operate by the Dar Es Salaam City Council.
Similarly, with even the smallest furniture enterprises in the sample
confirming that they were regularly held liable for tax payment, there appears
to be no lower bound on the size of firms that fall within the tax net.
The combination of cumbersome and punitive formal tax and
licensing requirements and ubiquitous enforcement create substantial
opportunities for officials to extract side payments from even the smallest
Tanzanian SMEs. Licenses must be renewed annually. While the fee is modest,
and is calculated on a sliding scale according to the size of the enterprise,
each renewal is dependent on prior clearance from (among others) the various
sales and income tax authorities. In the best of circumstances, obtaining all
these clearances and thereafter the license renewal imposes a significant
burden on the scarce time of the enterprise proprietor. In circumstances
where not all the necessary clearances have been obtained, the proprietor is
at the mercy of the licensing official. In practice, incomplete compliance
does not appear to have served as a pretext for obstructing entry, or led to
the shutting down of enterprises, but instead functions as a vehicle for
officials to extract side payments. Hence the report of 7 of 13 interviewees
that 'lubrication' is an integral part of the completion each year of license
formalities.
- 28 -
Side payments also are ubiquitous in the implementation of tax,l.
laws: only 1 of 13 interviewees was willing to characterize the system of tax
collection (of both sales and income taxes) as 'legitimate'; the remaining 12
firms confirmed instead that 'lubrication' was pervasive in their dealings
with the tax authorities. Nor is harassment by tax officials only occasional.
With sales tax legally payable on a monthly basis, tax officials have the
opportunity to visit individual enterprises and 'negotiate' their tax burden
twelve times annually. In practice, the number of negotiations is somewhat
fewer -- the number of visits over the past twelve months by sales tax
officials to the thirteen firms that provided information ranged from a low of
2 to a high of 10, with the ave;age 5 per annum -- but the burden on
enterprises is hardly trivial; all 4 of the furniture firms that provided a
ranking highlighted the burden of dealing with sales tax officials as the most
severe of the regulatory obstacles which they confronted. Income tax is
payable annually, so in principle the number of legally mandated visits is
fewer. However, individual tax assessors have the right to re-examine the
accounts of any enterprise at any time on the grounds that inaccurate
information has been filed; hence a ,sported average of 2 visits per annum
from income tax officials.
Underlying the improper implementation of tax laws appears to be a
broad perception that tax requirements impose an unmanageable burden on
enterprises. This perception (together with the low salaries paid government
employees) legitimizes25 for both owners and tax collectors a process whereby
25 To be sure, sometimes the process of renegotiation can be quiteantagonistict one four-person enterprise described how an initial reluctanceto 'lubricate' resulted in a sales tax assessment so high that it stood tobankrupt the venture; at that point, the owner had no alternative but to plead
- 29 -
the tax obligations on enterprises are renegotiated (via downward estimates of
sales revenue and profits), with associated side payments to the tax assessors
themselves. More generally, pervasive lubrication reduces the impact on firms
of egregiously unrealistic regulatory policies.26 Obviously, the pattern of
unrealistic policy offset by pervasive lubrication is hardly desirable:
corruption is wrong; it gives arbitrary advantages to firms that are more
successful in cultivating co-operative relations with public officials; it
compels even entrepreneurs who might otherwise prefer to adhere to what is
legally required to 'lubricate' the system if they are to survive in a highly
competitive environment; and it undermines broadly the capability of the
public administration to perform thuie functions where their contribution is
necessary. Even so, from the perspective of private firms, lubrication
tempers what would otherwise be a near-impossible environment for conducting
business.
As noted, however, the combination of unrealistic policy and
pervasive lubrication does not have a similar proportional impact on all
firms. The official payments, side payments, and time spent navigating the
bureaucratic morass represent entry- and expansion-deterring costs on
onterprises, comprising both financial elements and the opportunity cost of
with the assessor to accept lubrication in return for scaling down the taxbill.
26 This judgement does not apply to the constraint associated with lackof access to an industrial site. A recalculation of the constraint score inTable 3 to exclude with access to an industrial site and SMEs that had nointerest in expansion yields a result of 0.86, implying that for manyentrepreneurs the scarcity of land in Dar Es Salaam allocated to industrialuse represents almost as substantial an obstacle to expansion as does lack ofaccess to finance. Further, four of ten SMEs without sites volunteereddirectly that they would expand if they had access to such a site, implyingthat insecure land rights inhibit investment.
- 30 -
the fixed resource of the entrepreneur's time. When firms are large enough
they can 'grow out' of the costs imposed by an obstructionist bureaucracy:
senior executives can delegate the management of relations with the
bureaucracy to employees; they can use the influence afforded by their
economic power to shield themselves against egregious examples of harassment;
and, where necessary, they can cover whatever s. -e payments are required
without reducing substantially the working capital available for their
business enterprises. Smaller enterprises do not have these options and
hence, as the data for Tanzania in Table 5 imply, confront a significantly
greater regulatory burden relative to their larger counterparts. In all,
Tanzania's regulatory environment has the paradoxical (and presumably
unintended) consequence of strengthening the competitive position of large,
often non-indigenous enterprises in relation to indigenous SMEs.
II.4 Constraints on Access to Non-financial Inputs
The non-financial inputs considered in this section include
physical inputs into production, labor, and technical and marketing skills and
information. Unlike constraints associated with regulation or access to
finance, constraints in access to non-financial inputs tend to be sector-
specific. So, where relevant information is available, this section will draw
on survey results from other sectors in addition to furniture and to leather
products.
Physical inputs into production. Difficulties in gaining access
to physical inputs turned out to be more constraining in both relative and
absolute terms in the Sri Lankan leather industry than they were for Tanzanian
- 31 -
furniture producers. Not only is the aggregate constraint score for access to
physical inputs higher for Sri Lanka than Tanzania, disaggregation reveals a
sharp divergence in Sri Lanka (but not Tanzania) in the severity of the
constraint by size of fim: the average score for the 15 sample Sri Lankan
firms with 5 or fewer employees was a low 0.16 (a reflection of their
willingness to make do with odd lots of low quality leather); the average for
the 23 remaining (larger) enterprises was 0.55, making lack of access to
materials about as binding a constraint to these latter firms as was lack of
access to finance.
Underlying the high constraint scores afforded access to materials
by Sri Lanka's larger SMEs are some serious imperfections in that country's
market for leather: only 3 of the 18 firms in this category that provided
information reported adequate quantities of leather of adequate quality to be
available; the remaining firms expressed dissatisfaction in one or both of
these dimensions. At the root of this dissatisfaction is a longstanding Sri
Lankan policy -- even in the face of a manifest absence of any comparative
advantage in the supply of tanned leather -- of limiting the rate of expansion
of the footwear and leather products industry to the rate of expansion of
local tanning capability.
Prior to 1983, the policy of promoting upstream suppliers of
leather at the expense of private, downstream producers of leather products
took the form of indiscriminate support for the state-owned L' ather
Corporation. This parastatal was afforded preferential access to local hides,
was provided a veto on the entry of potential private competitors and was
protected from foreign competition by means of a bar on imports. Further, the
- 32 -
Corporation channelled two-thirds of its production to its own downstream
footwear and leather products divisions, thereby restricting even further the
availability of leather to private local users. Subsequent to 1983, the
restrictions on entry and on access to hides were liberalized. However, while
the ban on leather was lifted, a 602 nominal tariff continued to discriminate
against imported leather.27 Further, for all that since 1983 a number of
private entrants have begun tanning leather, most of the leather tanned in
Sri Lanka still does not find its way onto the open market: approximately 552
of the production of the three leading tanners is transferred to their own
downstream operations, and an additional 15-20Z sold on contract to the two
leading private producers of footwear for the Sri Lankan market; only 25-30?
of their output is sold on the open market to independent producers.
While the imperfections detailed above clearly are specific to the
market for leather, it is noteworthy that access to materials emerged also in
Sri Lanka's ceramics and calibrated gemstone sectors as among the leading
constraints on SME expansion.28 In ceramics, the state-owned Ceramics
Corporation has a legal monopoly to mine the requisite inputs for ceramics
production (all available in abundance in Sri Lanka), and has used that
monopoly to shape the structure of the industry in favor of large enterprises
at the expense of SHEs. In gemstone calibration, the State Gem Corporation
27 With a 200 percent export tax on raw hides, the effective subsidy fortanners is substantially in excess of 60 percent. Interestingly,notwithstanding the widespread claims of unavailability of leather, none ofthe SMHs lnterviewed reported that they used imported leather, raising thepossibility that there continue to exist non-tariff obsta.cles to theimportation of leather.
28 This conclusion is a qualitative one, since the number of SMEssurveyed ln the two sectors was too small for quantitative constraint scoresto be useful.
- 33 -
has been mandated to control -- via the physical lnspection of the contents of
each and every transaction -- both the export of gemstones, and the
importation of uncut stones from abroad for calibration in Sri Lanka and
subsequent re-export. It has proceeded with its regulatory function in a
manner that (paralleling the earlier discussion on the impact of regulation on
Tanzanian SME9) imposes a disproportionately severe administrative burden for
smaller enterprises involved in the export of calibrated gemstones, especially
new entrants that have not yet learned their way around.29 While the
materials constraints in leather products, ceramics and gemstone calibration
each have idiosyncratic, sector-specific features, all three sectors are
characterized by a dominant state-owned enterprise which has shaped industrial
organization in a way that discriminates against SMEs. As will be explored
further in the conclusion to this paper, this common pattern raises some
intriguing questions as to how privatization might be carried out in
previously state-dominated economies so as to enhance the opportunities for
efficient participation by SMEs.
Turning to Tanzania, the low scores for the obstacles associated
with lack of access to equipment, spare parts and wood signify the existence
of well-functioning input markets for producers of furniture. In the market
for wood, large numbers of indigenous entrepreneurs have specialized at a
range of levels, with some procuring wood from local forests via their own
29 One SME exporter whose experience apparently is not atypical reportedthat he personally spends two days processing the shipment of an export order,and three days processing the clearance requirements prior to receipt of aparcel of gemstones sent by a foreign buyer on a no-foreign-exchange basis forcalibration and re-export. In a typical month, he reported, he has noalternative but to devote fully 50Z of his time to overcoming bureaucratichurdles set up by the State Gem Corporation and by Customs (which operates aparallel apparatus to regulate international trade in gemstones).
- 34 -
agents and then retailing in small lots to urban users, and others coming
direct from the countryside and wholesaling lots directly to larger urban
users. As for equipment and spare parts, these are purchased from traders who
in turn import their wares from abroad. Input markets did not operate as well
in Tanzania's construction industry, where lack of access to equipment was
identified as the non-price constraint that was most binding after access to
finance, and lack of access to building materials also was reported as a
significant obstacle. Even so, it is noteworthy that in the construction as
well as the furniture industries there was a decline in the perceived severity
of constraints in access to physical inputs between the time of --try and of
the interviews.30 One possible explanation for these d:clines is the greater
availability of imported items subsequent to the policy reforms initiated in
1985.
Technical and marketing constraints. The scores in Table 1 for
'lack of technical skills', 'scarcity of competent workers' and not enough
domestic buyers' are low for both Sri Lanka and Tanzania, implying that on
average the sample SMEs do not now perceive shortfalls in these areas to be
serious constraints on expansion. It is important, however, not to
misinterpret these results: typically, firms in the sample evaluated the
obstacles in relation to the markets they were serving at the time of the
interviews, and a production quality that sufficed to meet the needs of this
30 The constraint scores (calculated from a sample of 14 constructionfirms) for lack of access to equipment and lack of access to buildingmaterials as obstacles to expansion were 0.71 and 0.51 respectively; theirrespective scores as obstacles to entry were 0.94 and 0.86, the leading andsecond constraints faced by the 14 firms at entry. For the furniture firms,the scores for lack of access to spare parts and to equipment as constraintson entry were 0.49 and 0.45 respectively.

- 35 -
clientele. Yet current practice is not necessarily a reliable basis for
evaluating technical and marketing constraints; the relevant constraints are
those which enterprises confront in relatively demanding markets. Thus
perceptions of constraint might be hypothesized to vary according to both the
(market-driven) price and quality requirements of the speciZic market niches
which enterprises seek to serve, and the (entrepreneur-driven) ambition and
market awareness of the enterprise proprietors. In practice, patterns of
variation emerged most vividly for the technical constraints, so it is on
these that the analysis focuses.
Table 5 disaggregates among the sample according to enterprise
size, entrepreneur's education, and the 'quality' of the market niches that
the enterprise sought to serve. Reflecting overall differences between the
two countries in levels of education, in Tanzania entrepreneurs with 10 or
more years of schooling were taken to be educated, while in Sri Lanka 13 years
of schooling served as the minimum requirement. Sri Lankan enterprises '-e,e
classified as serving a high quality niche if they subcontracted to Bata or
the second large private producer and distributor of footwear (6 firms), if
they had made some effort to export (5 firms), or if they sold their products
through established, relatively high volume and high quality retail footwear
outlets (4 firms);31 the remaining 22 enterprises in the sample -- including 9
enterprises with 5 or fewer workers that sold all of tiaeir output directly
from their workshops -- were classified as serving low quality niches. The
Tanzanian enterprises serving high quality niches were defined to be those
31 This last category was defined to com7rise firms with over 15 workersthat sold their products through retail outlets. Two of the four firms hadmultiple retail ou.lets and employed well above 15 workers; for the remaining2 firms the classification was somewhat more arbitrary.

- 36 -
TABLES
CONSTRAINT SCORNS I01 LACK OF TUICAL SKILLS AS AN OBSTACLETO OM6 WARSSION IN SRI LANKA AND TANZAIXA
SY SU1 OF FIRM. HAl?T EXCEl AND DNTUFPRENIR'S EDUCATION
Number of Employees
1 - 5 6 - 15 16 or More TOTAL
No. Score No. Score No. Score Score
A: Sri Lanka
High QualityMarket Niche
Educated Entrepreneur 0 - 3 0.52 9 0.36 0.40Uneducated Entrepreneur 0 - 0 - 3 0.08 0.08
Low QualityMarket Niche
Educated Entrepreneur 2 0.0 1 0.0 0 - 0.0Uneducated Entrepreneur 12 0.04 7 0.18 0 - 0.09
14 (0.32) 11 (0.26) 12 (0.29) 0.19
B: Tanzania
High QualityMarket Niche
Educated Entrepreneur 0 - 3 0.39 3 0.08 0.20Uneducated Entrepreneur 0 - 2 0.13 2 0.13 0.13
Low QualityMarket Niche
Educated Entrepreneur 2 0.0 1 0.0 0 - 0.0Uneducated Entrepreneur 4 0.08 1 0.0 1 0.0 0.06
6 0.06 7 (0.20) 6 (0.08) 0.11=sXsg=w a"s"w"" _ "ssaa "wsssss sa--ww" -- w---w w_s-sS- -"s"sSs tas3=== ====== ==
- 37 -
that sold furniture to government agencies (10 firms) or through retail
outlets that were physically independent of the workshop (4 firms, all of whom
also sold to government); the remaining 9 (low quality niche) firms all sold
,.heir entire output directly from their workshops.
Consistent with the hypothesis that the perception of technical
constraint is a function of market- and entrepreneur-driven influences, the
data in Table 5 indeed point to systematic variations in perception of
technical constrGint. Moreover, although the various influences turn out to
be highly collinear with one another, there is some evidence that each has
some independent effect. Concretely, as is most clearly evident in the data
for Sri Lanka, the sample enterprises fall overwhelmingly into one of two
quite distinct groups: a group of educated entrepreneurs that employ over 5
(actually, most over 15) workers, with some involvement in high quality market
niches, and that appraise technical constraints as quite significant; and a
group of uneducated entrepreneurs with 15 or fewer (actually, most 5 or fewer)
employees, no involvement in high quality market niches, and no perception
that limited technical capabilities might limit their expansion efforts. As
for evidence of the independent impact of market-driven and entrepreneur-
driven influences, the perception of technical constraint among the SMEs that
serve high quality niches is greater for the educated than uneducated
entrepreneur; correspondingly, among the SMEs with educated entrepreneurs, the
perception of technical constraint is greater among those that serve high
rather than low quality market niches.
The weakness of support systems -- market and institutional
networks (both private and public) external to the firm -- via which SMEs
- 38 -
might learn about new production techniques at the frontier of their
capabi1.ities, and about the requirements for penetrating new markets
(especially export markets) appears to be an important reasox! for the
technical constraints reported by educated entrepreneurs serving high quality
market niches. Only S of 15 Sri Lankan leather SMEs serving high quality
niches (and none of the 22 serving low quality niches) reported that their
enterprise had received some form of technical assistance -- provided to 3 of
the 5 by buyers, and to 2 by a foreign expert sponsored jointly by the ILO and
the Sri Lankan government; the remaining enterprises reported that the
technical capabilities of their staff were acquired by on the Job learning --
either in their own firms or as employees of other enterprises. As is
attested by the example of the only Tanzanian furniture SHE that had organized
its workshop on a quasi-assembly line basis consistent with the fulfillment of
orders for high volume, technical support systems appear even weaker in that
nation than in Sri Lanka. In an effort to upgrade its capabilities, and in
the absence of alternative information, the SHE placed an order for 4
woodworking machines with a vernot visiting Tanzania from a little-known
foreign company and introduced to the firm by its bank. In the event, the
enterprise was able to use only 2 of the 4 machines: the third machine (fully
paid for) never was delivered; and with the promiced technical support for
installation and start-up failing to materialize, the enterprise found itself
unable to operate the fourth and most expensive machine.
Information is more limited as to support systems for export
marketing insofar as only a small minority of SMEs in the two sectors analyzed
in the most derth -- two furniture SMEs in Tanzania , and 5 leather product
SMEs in Sri Lanka -- had any intecest in export markets. There was more
- 39 -
export activity -- but less opportunity for data-gathering and analysis --
among Sri Lanka's suppliers of calibrated stones (a sector that produced
almost entirely for export) and Tanzania's nascent exporters of horticultural
products. Even so, the sample provides an interesting glimpse of the balance
between public and private initiatives in establishing channels for export
(albeit no basis for uncovering what balance might be efficient).
In the leather products sector, all of the export channels were
established privately, with the 2 most successful channels32 started by
foreigners in the course of visits to Sri Lanka for reasons that initially had
nothing to do with export procurement. While exports of calibrated gemstones
from Sri Lanka got underway only in the late 1970s, exporters were able to
build on pre-existing ties with buyers who had long been visiting Sri Lanka to
purchase precious, uncut or partially cut gems. In recent years, Sri Lanka's
Export Development Board has actively sought to promote participation in the
activity, and apparently has provided useful support for new entrants to enter
the business, but there is insufficient information to evaluate to what degree
this public support has accelerated the expansion of exports of calibrated
gemstones. In the Tanzanian wood products sector, the export efforts were
entirely at the initiative of the manufacturers (both of Indian origin).
Tanzania's Board of External Trade has sponsored a number of visits abroad for
potential horticultural exporters, and has thereby been a catalyst for at
least some of the emerging interest in the sector. Even so, while none of the
horticultural entrepreneurs had as yet established a clear market presence as
32 Both firms exported more than half of their total production; foreignsales amounted to below five percent of sales of the remaining 3 firms activein export markets.
- 40 -
exporters, the two putative exporters whose plans were most advanced both
appear to have acted largely on their own initiatives.
In all, both the constraint scores and evidence as to the
character of support systems suggest that technical (and, by extension,
marketing) constraints are rather more restrictive than they might
superficially appear -- the SMEs who gave technical constraints least weight
were those least aware of the technical requirements associated with upgradirg
their capabilities, while the SMEs with more awareness weighted them somewhat
more heavily. Even so, as the concluding section of this paper explores
further, recognition that technical constraints bind more stringently than
might superficially appear need not necessarily imply that government has an
active role to play in their alleviation.
III: SOME POLICY IMPLICATIONS
Analysis of the constraints confronting SMEs in Sri Lanka and
Tanzania yields a range of implications for policy reform that are likely also
to be relevant for other countries. Some address the general issue of how to
go about formulating the agenda for reform of the environment in which SMEs do
business. Others address specific reforms in relation to each of the
individual constraints.
111.1 Formulating the Agenda for Reform
As the analysis reveals. SMEs operate in a complex environment and
confront a diverse array of constraints; it is chimerical to search for a
- 41 -
single binding constraint, common across all countries, which once released
will set in motion a rapid, sustained process of SHE development. Not only is
there likely to be substantial variation among countries -- and, within
countries, among classes of SHEs -- as to which constraint is binding, the
release of one constraint is likely to bring to the fox.-front some other
constraint whose inhibiting influence had not previously been as clearly
evident. Yet for all of this complexity, the analysis has outlined a
methodology for learning from SMEs themselves what is the relative impact of
the various non-price constraints, and detailing how this impact might vary
among groups of SMEs.
The applications of the methodology have uncovered quite different
patterns of SHE constraint in Tanzania and Sri Lanka and, within Sri Lanka,
between the smallest and least experienced SHEs on the one hand, and larger
and more established firms on the other. The evidence seems unambiguous that
lack cf access to finance represents the binding constraint on expansion for
all classes of SHEs in Tanzania, as well as for smaller, less established
firms in Sri Lanka. Further, this constraint appears more severe for the
smallest Tanzanian SMEs than for their Sri Lankan counterparts: while formal
banks do not lend to the smallest firms in either country, both informal
finance and trade credits appear more readily available in Sri Lanka. In
Tanzania, the financing constraint was followed -- again for all SMEs, but
with a disproportionately severe impact on the smallest -- by the burdens of
pervasive and non-transparent tax and regulatory obligations. By contrast,
the smallest and least established Sri Lankan enterprises maintained an
informal status entirely outside the regulatory web, and reported no
difficulties with regulatory authorities. Neither the smallest Sri Lankan nor
- 42 -
any of the Tanzanian firmi reported technical, marketing or input constraints
to be significant obstacles to expansion, although this appears to reflect
more the relatively narrow market they currently serve and limited information
as to the requirements of more demanding market segments than any underlying
capabilities.
The evidence as to which constraints are most binding is more
ambiguous for the larger, established SMEs in Sri Lanka. While the financing
constraint appears to ease as firms grow, a host of new obstacles -- no one of
which appears to be dominant -- come to the fore. Thus larger Sri Lankan SMEs
felt constrained by the limited availability of requisite inputs, vulnerable
to the risk of heightened scrutiny by tax and other government authorities in
the wake of success, limited by weaknesses in their technical skills, and --
for the subsample of enterprises that sought to export -- frustrated by
cumbersome bureaucratic procedures and the weakness of institutional
mechanisms via which they might link to the international marketplace.
To be sure, learning which constraints bind enterprises is only a
first step in setting priorities for reform to promote efficient SME
development. Some constraints may not be susceptible to reform. For others,
the costs of effective reform may be too high to justify the resultant
benefits. Finally, the absence of constraint may signal some undesirable
weaknesses in, say, the regulatory environment. What is needed is detailed
analysis of the prospects for reform of each constraint, more detailed than is
possible in the present paper. Nonetheless, the final sections of the paper
draw on the experiences of Sri Lanka and Tanzania to offer some preliminary
co mments as to how reform might proceed in each constraint area.
- 43 -
III.2 Enhancing Access to Finance
This subsection highlights two financing issues: the provision of
credit by formal financial institutions; and the provision of credit to micro-
enterprises.
It is difficult to imagine a starker contrast in the performance
of formal financial institutions in the provision of SME finance than was
evident between Sri Lanka and Tanzania. Whereas Sri Lanka by all accounts
represents a model of what can be achieved by a well-functioning system,33 as
outlined earlier the Tanzanian system appears to be in a state of virtual
disintegration. Given the evidence thait established SMEs rely increasingly on
formal finance, and the virtually unanimous view of Tanzania's SMEs that lack
of access to finance is their leading obstacle to expansion, reform of
Tanzania's banking sector deserves the highest priority.
The Sri Lankan success offers a useful guide to the
characteristics of a formal banking sector that can lend effectively to SMEs.
Some are the increasingly familiar virtues of a well-functioning financial
system: competition among independent banks for borrowers; positive real
interest rates (no SME credit is provided at below-market interest rates);
determined efforts at collection of outstanding loans (even with ongoing civil
unrest, the recovery rate of Sri Lankan banks for loans to SMEs has been in
33 See, for example, the recent review by Leila Webster, World BankLending to Small and Medium Enterprises: Fifteen Years of Experience, Industryand Energy Department Wcrking Paper Series No. 20, November 1989.
- 44 -
the 75-901 range). But other characteristics are rather less consistent with
prevailing dogmas of financial sector reform. For one thing, the bulk of SHE
lending appears to have come from credit provided via targeted, World Bank
supported SML loans; three loans already have been disbursed, and a fourth is
in preparation. For another thing, while both public and private institutions
participate in the bank supported project, by far the largest lender has been
the state-owned Bank of Ceylon, followed by the (also state-owned) People's
Bank. Further, although there is little difference in the recovery rates of
the public and private banks, the public banks have more aggressively sought
out borrowers that do not ordinarily have access to formal credit, with the
private banks willing to 'cream' the market and service only the most
obviously creditworthy SME borrowers. Finally, the Central Bank of Sri Lanka
operates a credit guarantee scheme which provides partial coverage for SME
lending; while no evaluation of the effectiveness of the scheme is available,
it apparently was widely used at least in the initial years of SME lending.
The Sri Lankan experience suggests that it is at the very least premature to
conclude that the solution to the financing problems of SMEs necessarily lies
in the unsupported, market-driven provision of non-targeted credit by
competing private banks.
As for the provision of credit to micro-enterprises, even in Sri
Lanka the evidence suggests that formal lending programs do not reach the
smallest and least well established enterprises. These are precisely the
enterprises which are most likely to provide opportunities for self-employment
- 45 -
to the least weil endowed members of society,34 a group which in Sri Lanka
repeatedly has expressed its discontent by violently challenging the state.
For reasons both of equity and of political pragmatism, it might be desirable
to make an added effort to extend financing to microenterprises. But it is
crucial to recognize that this task is distinct from the task of extending
access to formal finance to S4Es, and is likely to involve a quite different
set of institutional mechanisms (for example, lending to borrower groups).
Special care should be taken to ensure that efforts to pursue the task of
poverty alleviation by extending access to finance to microenterprises are not
pursued in a way that pressures lenders into making loans they judge to be
unviable, and thereby undermines financial systems that have proven themselves
effective in the rather different task of reaching those SMEs that have begun
to show signs of maturity.
III.3 Reforming the Regulatory and Tax Regime
Much of the debate on regulatory reform has centered around the
circumstances in which market failure affords a justification for regulatory
intervention. Such debate offers only a partial perspective: a comprehensive
analysis should give careful attention not only to the social benefits that
regulations are intended to achieve, but also to the costs that they impose on
enterprises. Consistent with the overall approach of the present paper, this
subsection will analyze the implications for the design of regulatory and tax
34 Of the 17 Sri Lankan entrepreneurs sampled with fewer than 13 years ofeducation, with father's that had fewer than 13 years of education and withonly a limited command of English (still the language of business among theelite), 13 were active in enterprises with 5 or fewer workers, and inoperation for less than 3 years.
- 46 -
reform of more careful attention to these costs.
It is by now broadly accepted on a priori grounds that a well-
functioning regulatory and tax regime should be characterized by a minimum of
bureaucratic requirements, and by transparent, moderate obligations imposed
across a broad spectrum of enterprises. The empirical analysis uncovered four
ways in which the regulatory and tax regimes in Sri Lanka and Tanzania depart
from the efficient, a priori model: high formal tax obligations (in both
countries); pervasive lubrication (in Tanzania); high bureaucratic costs
(especially in Tanzania); and a pattern of selective enforcement that excludes
the smallest enterprises from the regulatory net (in Sri Lanka).
In sorting out the impact of these distortions on SMEs and what
they imply for policy reform, it is useful to distinguish analytically among
three distinct but interrelated burdens -- a fiscal burden, a bureaucratic
burden, and a threshold burden. The fiscal burden represents the disincentive
effects of taxation -- a disincentive borne by taxpaying firms of all size,
and one which increases in magnitude as tax rates rise. As both the Sri
Lankan and Tanzanian experiences reveal, analysis of official tax rules can
provide a wholly misleading picture of the character of these obligations --
either because (as in Sri Lanka) tax laws are not enforced on small
enterprises, or because (as in Tanzania) pervasive lubrication results in
there being little relation between the formal obligations and the amount
actually paid by enterprises.
The bureaucratic burden represents the costs to SMEs -- most
importantly the opportunity cost of the entrepreneur's time -- of dealing with
- 47 -
the various agencies of government, with the magnitude of the burden inversely
proportional to the efficiency with which the government agencies carry out
their assigned tasks. Since presumably governments do not impose bureaucratic
tasks simply for the perverse pleasure of tormenting entrepreneurs, the
bureaucratic burden is produced jointly with the fiscal burden -- or jointly
with the performance of some other task aside from tax collection that
government has taken upon itself. Unlike the fiscal burden, the bureaucratic
burden is likely to be disproportionately large for the smallest enterprises -
- in part because it is in the nature of a fixed cost which is more or less
invariant with firm size, and in part because large but not small enterprises
can hire managers to whom to delegate many of their dealings with government
officials. The empirical analysis suggests that the bureaucratic burden is
larger for Tanzanian firms than for their Sri Lankan counterparts -- both
because the bureaucracy may simply be less efficient in Tanzania, and because
the Tanzanian but not Sri Lankan authorities have extended their bureaucratic
net to include even the smiallest firms.
Tmhe threshold burden represents a discontinuity in the structure
of costs that results from the imposition of some tax-related fiscal burden or
tax-or-regulatory related bureaucratic burden only on firms larger than some
minimum threshold size. Depending on its magnitude, this discontinuity can
lead some firms to rein in expansion -- or alternatively to expand via the
socially inefficient route of horizontal multiplication of quasi-independent
enterprises, all of which remain smaller than the threshold at which the tax
and regulatory requirements are imposed. The magnitude of the discontinuity
in costs varies with the magnitude of the fiscal or bureaucratic burden
imposed by the tax or regulation, 'while the firm size at which the threshold
- 48 -
is reached varies according to how far short of universal is the
implementation of the regulatory requirements. As the empirical analysis
reveals, the threshold burden appears to deter expansion in Sri Lanka where
regulations are applied only to larger firms, but not in Tanzania where
application is universal.
Paradoxically, interactions among the fiscal, bureaucratic and
threshold burdens can have the effect of offsetting the most egregiously
harmful effects of an inefficient regulatory regime; so partial reform can
have the unintended effect of worsening the regulatory environment for SMEs
relative to the status quo. Thus, in circumstances such as Tanzania's where
an excessive fiscal burden is offset by pervasive, bureaucratically costly (as
measured by the opportunity cost of entrepreneur's time) lubrication, it is
entirely plausible that the environment for SMEs would be worsened by the
imposition of measures that aought only to reduce the bureaucratic burden by
making regulatory and tax enforcement entirely transparent, and thereby
exposed SMEs to the obligation to pay their currently exorbitant tax
obligations in full. Conversely, efforts in Sri Lanka to secure universal
coverage of the prevailing regulatory and tax regime would eliminate the
threshold burden, but replace it instead with a new bureaucratic and fiscal
burden for the smallest enterprises.
Given these interactions, regulatory and tax reform needs to
proceed simultaneously on four fronts. First, the prevailing web of
regulations should be scrutinized, and those that serve no social purpose
eliminated entirely (this scrutiny is likely to yield more opportunities for
streamlining in Tanzania than in Sri Lanka). Second, where (as in both Sri
- 49 -
Lanka and Tanzania) formal tea obligations are too high they need to be
reduced. Third, in parallel with the reduction in formal tax obligations,
measures should be taken to secure increased transparency of the regulatory
and bureaucratic apparatus, thereby both reducing the bureaucratic burden, and
increasing the likelihood that enterprises pay all rather than only a fraction
of the taxes they are owed (reform along these lines is especially relevant
for Tanzania). Fourth, in parallel with fiscal and bureaucratic reform,
decisions need to be taken as to the appropriate reach of coverage of tax and
regulatory obligations.
How universal should coverage be? One superficially appealing, but
ultimately unsustainable, argument is that coverage should be wholly universal
as a way of eliminating the threshold burden. It is true that universal
coverage would eliminate an important disincentive to the growth of those
enterprises that hitherto had sheltered below the enforcement threshold. But
this would be achieved not by removing some underlying obstacle, but by
transforming the obstacle from one which inhibits expansion into one which
inhibits entry, with equally pernicious -- if less visible -- effects. A more
persuasive argument for universal coverage (especially of tax obligations) is
that it would broaden the revenue base, and thereby permit lower tax rates and
less disincentive to growth by taxpaying enterprises. To be sure, universal
coverage would impose a new, expansion-inhibiting fiscal burden on smaller,
previously untaxed enterprises. However, some such inhibition is inherent to
all revenue-based tax systems; moreover (unlike the bureaucratic burden), with
proportional or progressive taxes the fiscal burden is no greater for small
enterprises than it is for their larger counterparts. Set against this last
argument for universal coverage is the fact that any new fiscal burden
- 50 -
necessarily is associated with a corresponding bureaucratic burden.
Increasing the extent of coverage not only increases the number of enterprises
exposed to the bureaucratic burden, it extends the bureaucratic burden to
smaller and smaller firms -- precisely those firms for whom (as the Tanzanian
experience exemplifies) the effects are most harmful.
Two implications follow from these competing arguments as to the
appropriate extent of coverage. The first implication is that the case for
extending the reach of the regulatory net to encompass all enterprises is
unambiguous only given ths empirically implausible assumption that bureaucracy
operates entirely frictionlessly. Put differently, the implication is that
the existence of a group of firms excluded from the reach of regulation need
not only be a symptom of some underlying policy distortion (the usual
rationale for the existence of the so-called 'informal sector'). It may also
sigiify a wise recognition that the imposition of regulatory requirements on
enterprises inevitably has some cost, a cost that falls disproportionately on
the smallest enterprises. The second implication is that there is no single
optimal firm size, identical across counitries, below which tax and regulatory
obligations should be excused, with firms permitted to operate informally.
Rather, the reach of the regulatory net should vary with the administrative
capabilities of individual countries. Since large enterprises are better
placed to offset the costs of a cumbersome bureaucracy, the weaker is a
country's administrative capability, the narrower should be the reach of a
country's tax and regulatory apparatus.
Concretely, in both Sri Lanka and Tanzania the first task for
regulatory reform is to eliminate regulations now in effect that serve no
- 51 -
useful social purpose. Once this tatk has been achieved, the agendas for
regulatory and tax reform are entirely different in the two countries. In
Tanzania, the bureaucratic burden represents the primary regulatory constraint
on SME development. Thus the priority for reform should be to eliminate the
bureaucratic and fiscal burdens on the smallest enterprises by exempting them
entirely from regulatory and tax obligations. As a secondary measure, the
bureaucratic burden on firms that remain within the regulatory and tax net
should be reduced by the introduction of more transparent administrative
procedures; even with lower tax rates, this last measure could lead to a
somewhat larger fiscal burden for taxpaying firms. In Sri Lanka, by contrast,
the primary regulatory constraint on SME development is the threshold burden
that results from high regulatory and tax obstacles enforced only on a subset
of larger firms. So in that country the priority should be to reduce taxes
and the associated fiscal burden on large enterprises, and thereby to reduce
the disincentives that inhibit firms from growing into formal status. To
maintain the level of tax revenues, this reduction needs to be accompanied by
a broadening of the reach of the tax and regulatory apparatus relative to the
status quo, thereby imposing new fiscal and bureaucratic burdens on some SMEs
that hitherto had effectively been outside the administrative net. Even
subsequent to reform, the smallest Sri Lankan firms should continue to remain
outside the reach of the regulatory and tax net. Note, though, that insofar
as (as the empirical analysis implies) Tanzania's bureaucracy is less
efficient than Sri Lanka's, the reach of the regulatory and tax apparatus
should extend to smaller enterprises in Sri Lanka than in Tanzania --
precisely the reverse of what 1s now the case.
- 52 -
III4 Enhancing Access to Ncni-financial Inputs
This final subsection will consider the implications of the
empirical analysis f..r reforms to enhance access to physical inputs into
production, a*d to technical and marketing support services.
To begin with access to physical inputs, the empirical analysis
uncovered significant difficulties on the part of Sri Lankan SHEs in gaining
access to physical inputs in all three of the leather product, ceramics, and
gemstone calibration subsectors. With foreign exchange freely available and
no other policy-induced rationing in evidence, these difficulties might
straightforwardly be attributed to idiosyncratic features of individual
subsectors. However, as noted earlier all three sectors are characterized by
a dominant state-owned enterprise which has directly or indirectly promoted
the emergence of large-scale, vertically integrated operations, and thereby
shaped industrial organization in a way that discriminates against SMEs.
Given the priority currently being given to privatization in Sri Lanka and
elsewhere, the question arises as to whether privatization efforts can perhaps
be carried out in a way that redresses the bias agsinst SMEs.
The promc ion of product competition -- via imports, private
done. 1c competitors or even sometimes the break-up of state-owned enterprises
into independent competing units -- has long been a preoccupation of efforts
at privatization. Rather less attention has been paid, however, to the ways
in which vertical integration might inhibit competition and SME participation,
and thus to how privatization might be undertaken in a way that secures a
vertical restructuring of the industry, one that substitutes more-or-less arms
- 53 -
length transactions for hierarchical relationships within vertically
integrated firms. To be sure, vertically integrated ties established to take
advantage of transactional or technological efficiencies of integration or to
capture eccnomies of scope should not be disrupted. But there is no reason to
maintain vertical integration that emerged arbitrarily as a result of the
decisions of state-owned entities, and that inhibits the participation of
SMEs, even though it need not be significantly less efficient than arms
length arrangements, and thus would not necessarily disintegrate under the
pressure of market competition.35 The task for reform in this area -- one
which in the present context can only be identified -- is to distinguish among
those sectors where state-owned enterprises should be privatized as vertically
integrated entities, and those where there might be grounds for breaking up
the vertical structure into its component parts.
Finally, there is the question of what might be done to strengthen
technical and marketing support systems for SMEs. The central policy issue
here concerns the appropriate balance between public and private mechanisms
for strengthening support. One possibility is that the development of support
systems is endogenous -- that the weakness of these systems in Sri Lanka and
Tanzania is a reflection, rather than underlying cause, of the rather simple
market niches in which SMEs are active and that there will be spontaneous
increases in the private provision of technical and marketing support as SMEs
respond to new opportunities created by policy reform and take on more
35 Brian Levy 'Transactions Costs, the Size of Firms and IndustrialPolicy' Journal of Development Economics, forthcoming 1990, and 'StrategicOrientations of Firms and the Performance of Korea and Taiwan in FrontierIndustries' World Development, forthcoming, 1991, details how the Korean andTaiwanese footwear and computer industries are characterized by entirelydifferent patterns of vertical integration.
- 54 -
demanding challenges. An alternative possibility is that the weakness of
support systems signals some underlying market failure,36 and thus represents
an exogenous constraint on SHE development, one that can be overcome on.y via
government intervention of one kind or another. Only careful empirical
analysis of successful experiences of SHE and support system development can
reveal which of these competing alternatives is closer to the truth. And
since Tanzania and Sri Lanka hardly qualify as successes, that analysis must
necessarily be the subject of another study.
36 The putative market failure could plausibly be traced to the publicgood character of technical and marketing information, and its consequentundersupply by private providers; the case for direct or indirect governmentsupport follows straightforwardly. Alternatively, the market failure could betraced to co-ordination problems that undermine the incentive to be the firstentrant in circumstances where participation on one side of a market createspositive externalities for participants on the other side; the latter argumentimplies that the appropriate role for government is as a ca-alyst that, byproviding the initial stimulus, sets in motion a self-sustaining process ofprivate *ndogenous expansion by SMEs and their related support systems.
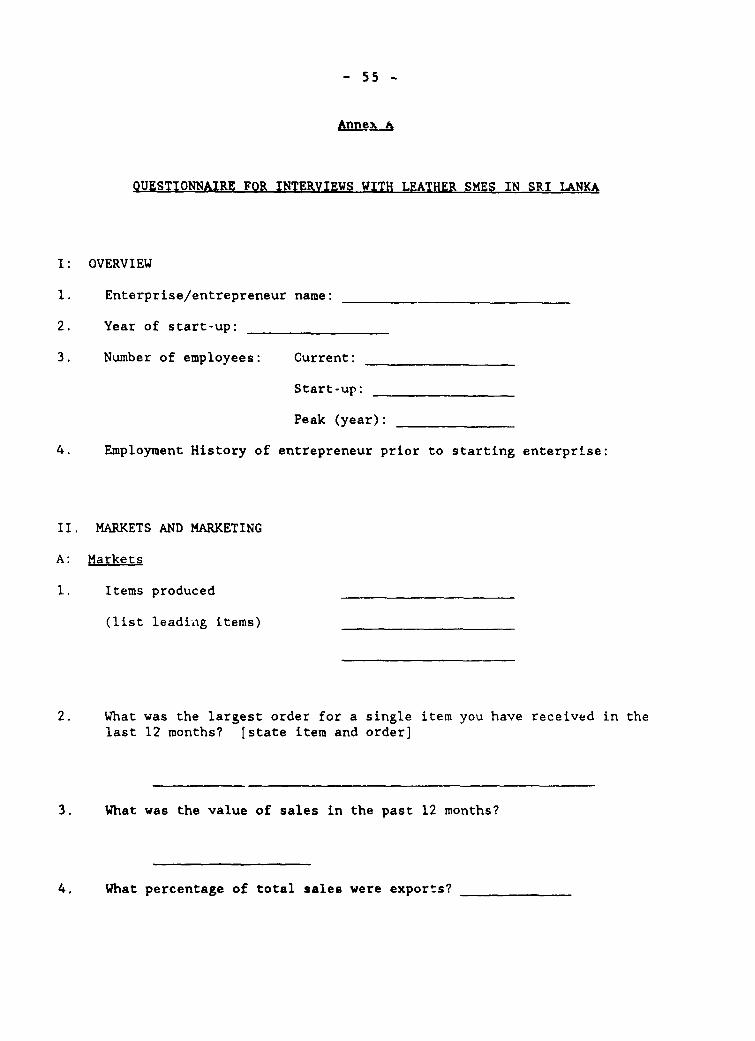
- 55 -
Anne.- A
OUESTIONNAIRE FOR INTERVIEWS WITH LEATHER SMES IN SRI LANKA
I: OVERVIEW
1. Enterprise/entrepreneur name:
2. Year of start-up: _
3. Number of employees: Current: _
Start-up: _
Peak (year): ____
4. Employment History of entrepreneur prior to starting enterprise:
II. MARKETS AND MARKETING
A: Markets
1. Items produced
(list leadi. g items)
2. What was the largest order for a single item you have received in the
last 12 months? [state item and order]
3. What was the value of sales in the past 12 months?
4. What percentage of total sales were exports?
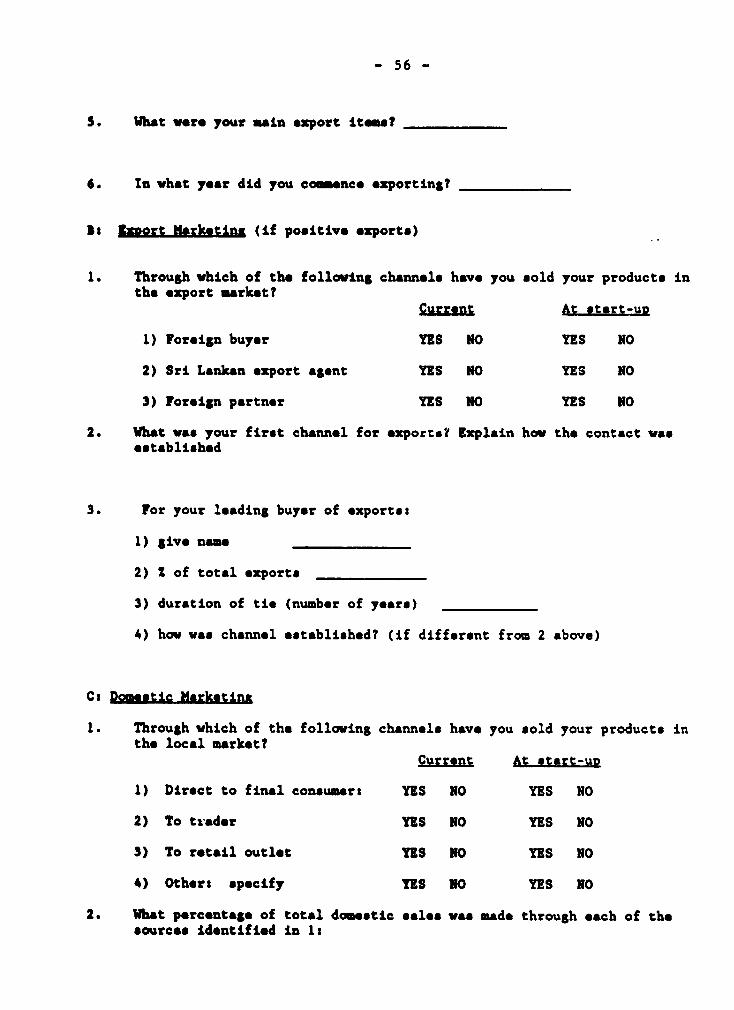
- 56 -
S. What were your main export items?
6. In what year did you commence exporting?
D1 lzort Marketins (if positive exports)
1. Through which of the following channels have you sold your products inthe export market?
Currcnt At #tart-uD
1) Foreign buyer YES NO YES NO
2) Sri Lankan export agent YES NO YES NO
3) Foreign partner YES NO YES NO
2. What was your first channel for exports? Explain how the contact wasestablished
3. For your leading buyer of exports:
1) give name
2) 2 of total exports
3) duration of tie (number of yoars)
4) how was channel established? (if different from 2 above)
C: Domestic Marketing
1. Through which of the following channels have you sold your products inthe local market?
Current At start-up
1) Direct to final consumer: YES NO YES NO
2) To trader YES NO YES NO
3) To retail outlet YES No YES NO
4) Others specify YES NO YES NO
2. What percentage of total dometic sales was made through each of thesources Identified in Is
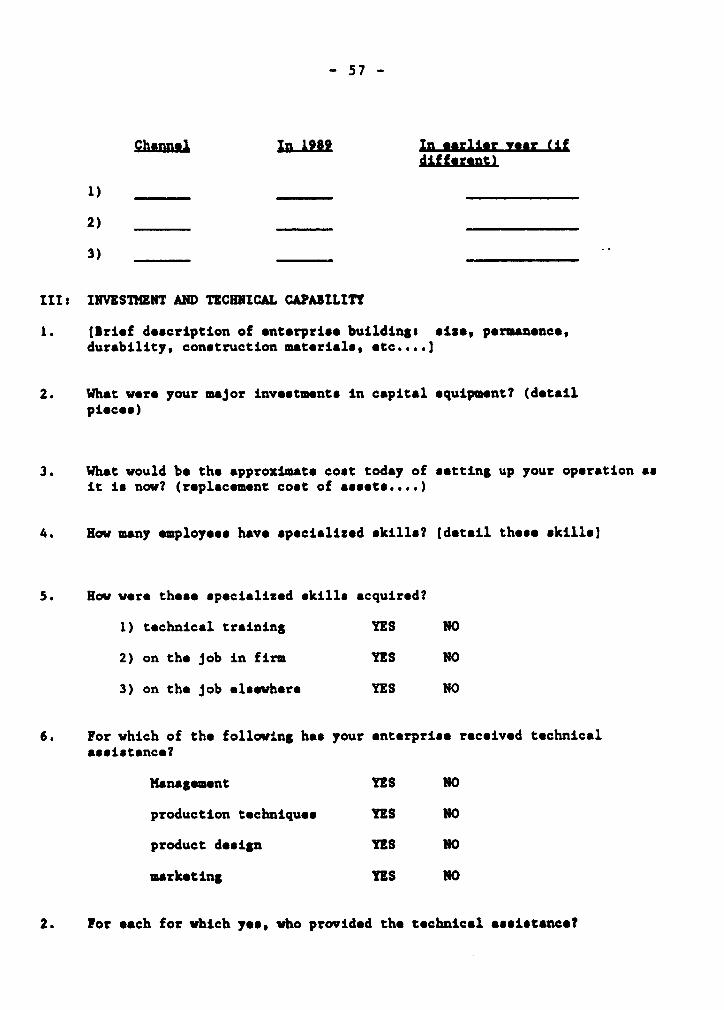
- 57 -
Channl In 1989 In earlier voar (if
1)
2)
3)
III: INVESTMENT AND TECHNICAL CAPABILITY
1. (Brief description of enterprise buildings lsise permanence,durabilityq, construction materilsl, *tc l..
2. What vere your major investments in capital equipment? (detailpieces)
3. What vould be the approximate cost today of setting up your opcration asit is nov? (replacement cost of assets...
4. Hov many employees have specalized skilllc7 (det-il these skills)
S. How vere theme specilizedso*kills acqulrct?
1) tcchnic_l training YES NO
2) on the job in firm YES NO
3) on the job *ls_whorc YES NO
6. or vhich of tho followo ng hf your enterprise rbie,vpe technicalassitance?
Management YES NO
productron tochnmques YES NO
product artson YES NO
mtrket rng YES NO
2. For ahich of thefh yfe, vho provuren the technical *sltance?
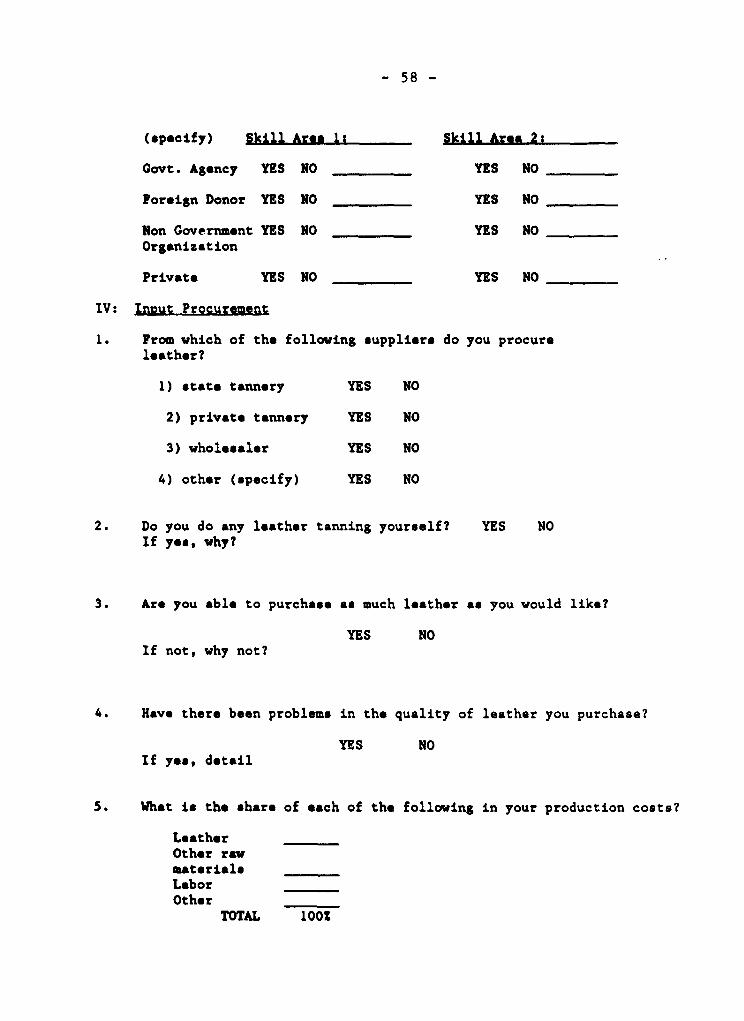
- 58 -
(specify) Skill Area 1i Skill Area 2:
Govt. Agency YES NO YES NO
Foreign Donor YES NO YES NO
Non Government YES NO YES NOOrganization
Private YES NO YES NO
IV: Input Procurement
l. Prom which of the following suppliers do you procureleather?
1) state tannery YES NO
2) private tannery YES NO
3) wholesaler YES NO
4) other (specify) YES NO
2. Do you do any leather tanning yourself? YES NOIf yes, why?
3. Are you able to purchase as much leather as you would like?
YES NOIf not, why not?
4. Have there been problems in the quality of leather you purchase?
YES NOIf yes, detail
5. What is the share of each of the following in your production costs?
LeatherOther rawmaterialsLaborOther
TOTAL 100l
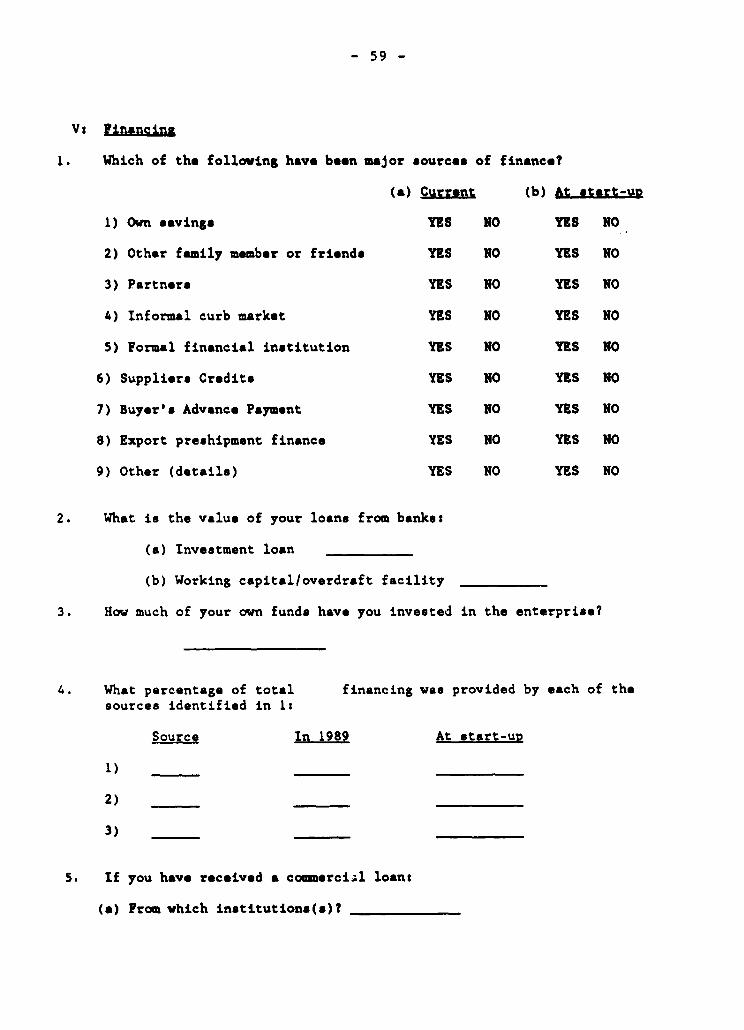
- 59 -
Vs Financing
1. Which of the following have been major sources of finance?
(a) Current (b) At start-up
1) Ovn savings YES NO YES NO
2) Other family member or friends YES NO YES NO
3) Partners YES NO YES NO
4) Informal curb market YES NO YES NO
5) Formal financial institution YES NO YES NO
6) Suppliers Credits YES NO YES NO
7) Buyer's Advance Payment YES NO YES NO
8) Export preshipment finance YES NO YES NO
9) Other (details) YES NO YES NO
2. What is the value of your loans from banks:
(a) Investment loan
(b) Working capital/overdraft facility
3. How much of your own funds have you invested in the enterprise?
4. What percentage of total financing was provided by each of thesources identified in 1:
Source In 1989 At start-ug
1)
2)
3)
5. If you have received a comoercial loan:
(a) From vhich institutions(s)?
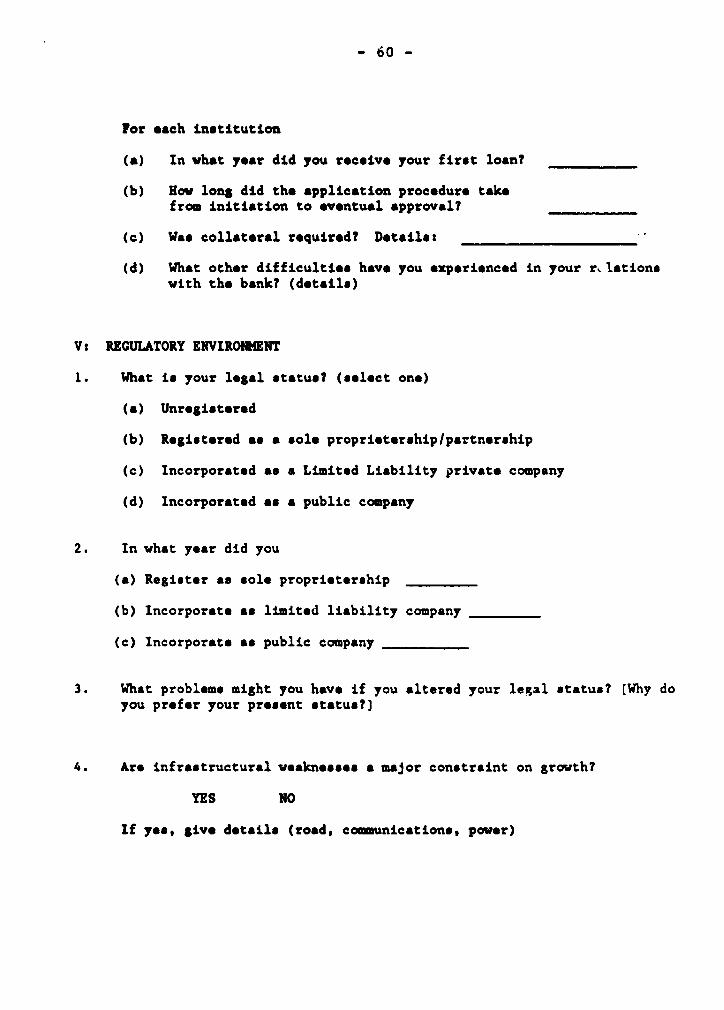
- 60 -
For each institution
(a) In vhat year did you receive your first loan?
(b) How long did the application procedure takefrom initiation to eventual approval?
(c) Was collatoral required? Detailcs
(d) What other difficulties have you experienced in your r lationswith the bank? (details)
Vt REGULATORY EHVIRONMENT
1. What is your legal status? (select one)
(a) Unregistered
(b) Registered as a sole proprietership/partnership
(c) Incorporated as a Limited Liability privato company
(d) Incorporated as a public company
2. In what year did you
(a) Register as sole proprietership
(b) Incorporate as limited liability company
(c) Incorporate as public company
3. What problems might you have if you altered your legal status? (Why doyou prefer your present status?)
4. Are infrastructural weaknesses a major constraint on growth?
YES NO
If yes, give details (road, coounications, power)
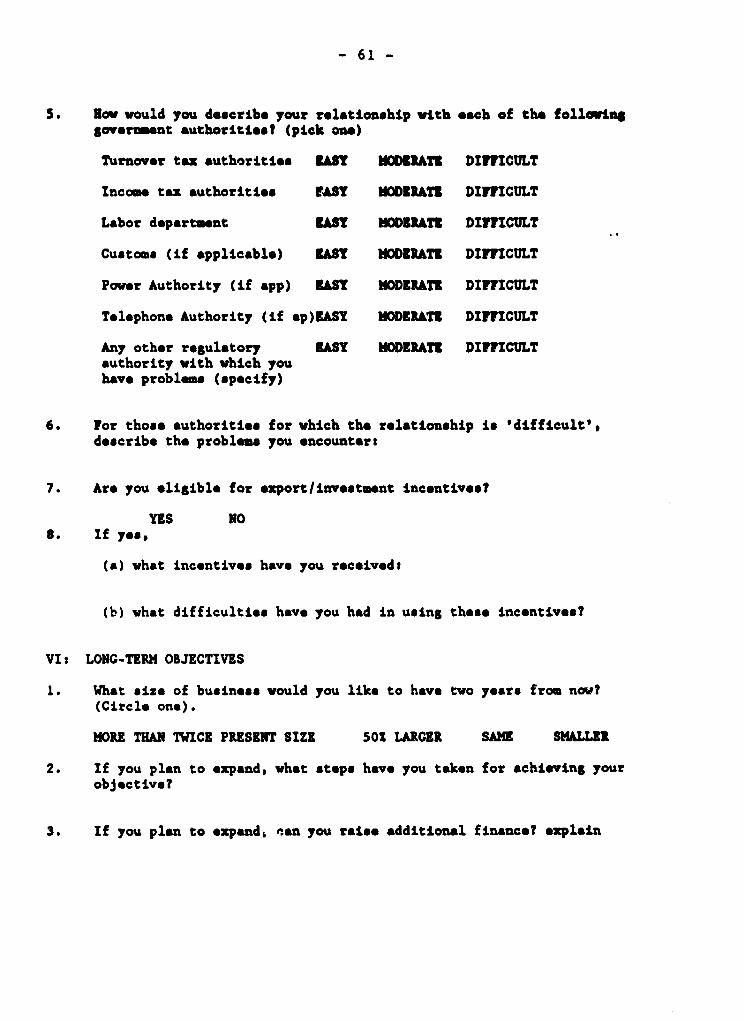
- 61 -
S, Nov would you describe your relationship with each of the followinsgover ment authoritiest (pick one)
Turnover tax authorities EAMT NWODRAT DIPICULT
Income tax authorities AST MODERATE DInICULT
Labor department EASY NODERATE DIF"ICULT
Customs (if applicable) ZASY MODERATS DIFFICULT
Power Authority (if app) LAST MODERATE DIF"ICULT
Telephone Authority (if ap)WAST MODERATE DIF"ICULT
Any other regulatory 2ASY MODERATE DIFFICULTauthority with which youhavo problems (specify)
6. For those authorities for vhich the relationship is 'difficult',describe the problem you encounters
7. Are you eligible for export/investment incentives?
YES NOS. If yes,
(a) what incentives have you received:
(b) what difficulties have you had in using these incentives?
VI: LONG-TERM OBJECTIVES
1. What size of business would you like to have two years from now?(Circle one).
MORE THAN TWICE PRESENT SIZE 50S LARGER SANE SMALLIR
2. If you plan to expand, what steps have you taken for achieving yourobjective?
3. If you plan to expand, ean you raiso additional finance? explain
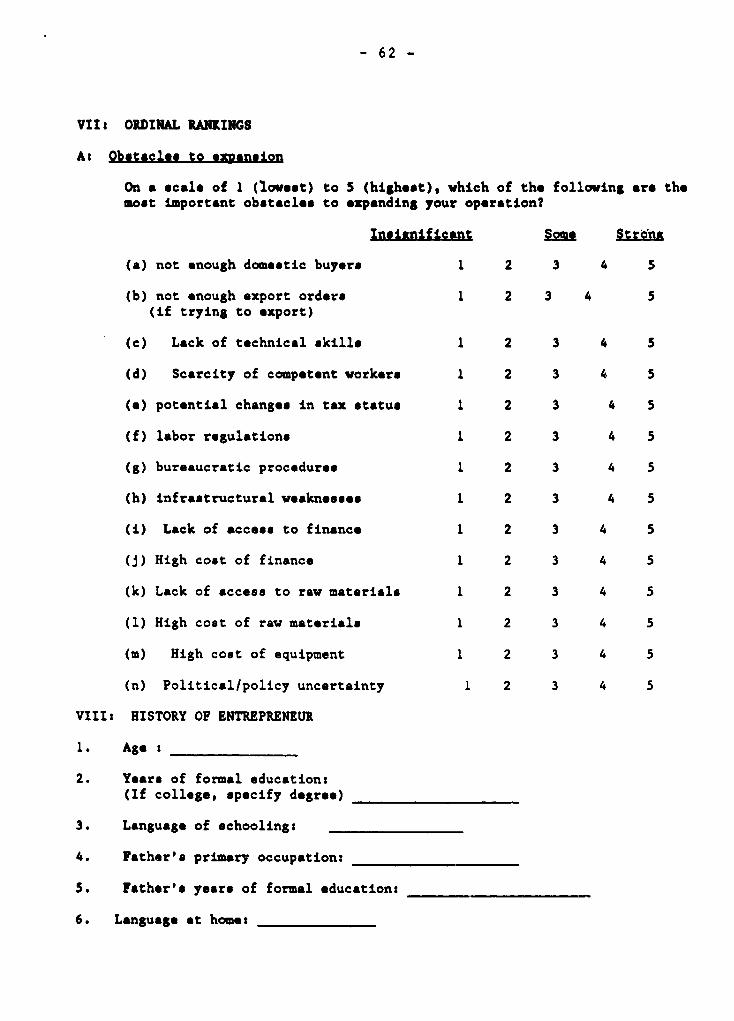
- 62 -
VII: ORDINAL RANKINGS
At Obstacles to exgansion
On a scale of 1 (lowest) to 5 (highest), vhich of the following are themoot important obstacles to expanding your operation?
Insalnificant SOD Strongt
(a) not enough domestic buyers 1 2 3 4 5
(b) not enough export orders 1 2 3 4 5(if trying to export)
(c) Lack of technical skills 1 2 3 4 5
(d) Scarcity of competent workers 1 2 3 4 5
(e) potential changes in tax status 1 2 3 4 5
(f) labor regulations 1 2 3 4 5
(g) bureaucratic procedures 1 2 3 4 5
(h) infrastructural weaknesses 1 2 3 4 5
(1) Lack of access to finance 1 2 3 4 5
(j) High cost of finance 1 2 3 4 5
(k) Lack of acceas to raw materials 1 2 3 4 5
(1) High cost of raw materials 1 2 3 4 5
(m) High cost of equipment 1 2 3 4 5
(n) Political/policy uncertainty 1 2 3 4 5
VIII: HISTORY OF ENTREPRENEUR
1. Age s
2. Years of formal education:(If college, specify degree) _
3. Language of schooling:
4. Father's primary occupation:
S. Father's years of formal education:
6. Language at home:
PRE Workdg Poor Serbes
Contactlb 1QL Dor Dap
WPS568 Higher Wages for Relief Work Can Martin Ravallion January 1991 C. SpoonerMake Many of the Poor Worse Off: Gaurav Dan 30464Recent Evidence from Maharashtra's Shubham Chaudhuri'Employment Guarantee Scheme'
WPS569 Domestic Purchase Requirements for Wendy E. Takacs January 1991 S. FallonImport License Allocations in Mali 37947
WPS570 Debt Concentration and Secondary Raquel Fernandez January 1991 S. King-WatsonMarket Prices Sule Ozber 31047
WPS571 Credit's Effect on Productivity In Gershon Feder January 1991 C. SpoonerChinese Agriculture: A Lawrence J. Lau 30464Microeconomic Model of Justin Y. LinDisequilibrium Xiaopong Luo
WPS572 Capital Positions of Japanese Edward J. Kane January 1991 S. King-WatsonBanks Haluk Unal 33730
Asli Demirguc-Kunt
WPS573 Malaysian Labor Markets Under Dipak Mazumdar January 1991 M. SchreierStructural Adjustment 36432
WPS574 Public Policies and Saving in Vittorio Corbo January 1991 S. JonnakutyDeveloping Countries Klaus Schmidt-Hebbel 39074
WPS575 Household Saving in Developing Klaus Schmidt-Hebbel January 1991 E. KhineCountries: First Cross-Country Steven B. Webb 39361Evidence Giancarlo Corsetti
WPS576 Lessons from Tax Reform: Wayne Thirsk January 1991 A. BhallaAn Overview 37699
WPS577 Africa's Rising Inflation: Causes, Ajay Chhibber February 1991 B. DhomunConsequences, and Cures 39413
WPS578 The Bank's Use of Technical Beatrice Buyck January 1991 E. MadronaAssistance for Institutional 37496Development
WPS579 Chile's Experience with Stabilization Vittorio Corbo January 1991 E. KhineRevisited Andr6s Solimano 39361
WPS580 Do Natural Resource-Based Alexander J. Yeats January 1991 J. JacobsonIndustrialization Strategies Convey 33710Important (Unrecognized) PriceBenefits for Commodity-ExportingDevebping Countries?
PR, WA Pn Sefia.
ContactBe hdbm D11111111 for i Di
WPS581 How Successful is World Bank Patrick Conway January 1991 S. FalbnLending for Structural Adjustment? 37947
WPS582 Adjustment Programs and Bank Vittorbo Corbo January 1991 L. OropesaSupport: Rationale and Main Stanley Fischer 39075Results
WPS583 World Bank Lending for Education Marlaine E. Lockheed January 1991 C. CristobalResearch, 1982-89 Alastair G. Rodd 33640
WPS584 Whither Hungary and the European Alfred Tovias January 1991 G. lIogonCommunites? Sam Lard 33732
WPS585 Financial Innovation and Money Patricio Arrau January 1991 S. Kiig-WatsonDemand: Theory and Empirical Jose de Gregoro 31047Implementation
WPS586 The Challenging Arithmetic of Poverty Martin Ravallion February 1991 WDR Officein Bangladesh 31393
WPS587 Quantifying the Magnitude and Martin Ravallion February 1991 WDR OfficeSeverity of Absolute Poverty in the Gaurav Datt 31393Developing World in the Mid-1980s Dominique van de Walle
Elaine Chan
WPS588 Obstacles to Developing Small and Brian Levy February 1991 E. MadronaMedium-Sized Enterprises: An 37496Empirical Assessment
WPS589 To Prescribe or Not to Prescribe: Jeffrey S. Hammer February 1991 0. NadoraOn the Regulation of Pharmaceuticals S6-065in Developing Countries