obstacles dont have to stop you - asx · 2016. 10. 27. · investment and divestment decisions,...
TRANSCRIPT

1A N N U A L R E P O R T | 2016
ANNUAL REPORT | 2016
If you run into a wall, don’t turn around and give up.
how to climb it, go through it,
or work around it.
Figure out
Michael Jordan
OBSTACLES DON' T HAVE TO STOP YOU
For
per
sona
l use
onl
y
C V C L I M I T E D A N D I T ’ S C O N T R O L L E D E N T I T I E S
CONTENTSCompany Particulars 1
The Year in Review 2
Directors’ Report 10
Consolidated Statement of Financial Performance 19
Consolidated Statement of Comprehensive Income 20
Consolidated Statement of Financial Position 21
Consolidated Statement of Changes in Equity 22
Consolidated Statement of Cash Flows 24
Notes to the Financial Statements 25
Directors’ Declaration 78
Independent Auditor’s Report 79
Corporate Governance Statement 80
Additional Information 82
For
per
sona
l use
onl
y
1A N N U A L R E P O R T | 2016
REGISTERED OFFICELevel 6, Gold Fields House1 Alfred Street, Sydney NSW 2000
DIRECTORS– Alexander Beard– John Read – Ian Campbell
MANAGEMENT TEAM– Alexander Beard– Elliott Kaplan – John Hunter– Mark Avery – Michael Bower– Andrew Harris– William Highland– Christian Jensen– Charles Williams– Tom Kellaway
SECRETARIES– Alexander Beard– John Hunter
BANKERSSuncorp-Metway LimitedWestpac Banking Corporation Limited
AUDITORSHLB Mann Judd Chartered AccountantsLevel 19, 207 Kent Street, Sydney NSW 2000
SHARE REGISTRYNext RegistriesLevel 16, 1 Market Street, Sydney NSW 2000
"SIGNIFICANT EFFORT HAS BEEN EXPENDED OVER THE PAST 12 MONTHS TO DEVELOP SKILLS, AND DEAL FLOW ACROSS THE FINANCE, AND PROPERTY SECTORS, WHICH WE BELIEVE WILL BE SIGNIFICANT CONTRIBUTORS TO THE GROWTH IN NET ASSETS AND CONTINUED PROFITABILITY OF THE COMPANY."
CVC LIMITED ABN 34 002 700 361 AFSL 239665
COMPANY PARTICULARS
For
per
sona
l use
onl
y
CVC LIMITED AND IT’S CONTROLLED ENTITIES
Highlights– Partial sale of land at Donnybrook
which (subject to planning outcomes) will provide the JV between CVC and Villa World Limited a free carried interest in land capable of producing approximately 1,200 lots;
– Continued progression of Marsden Park development;
– Development of an option portfolio with partner LeaMac, creating the opportunity to participate in future residential developments on favourable terms, for developments planned to exceed 5,000 potential lots;
– Returns of $19 million from property backed investments;
– Management of ASX listed portfolio, with additions and subtractions to core portfolio, and substantial value uplift in a number of key investments during the year including Lantern Hotel Group;
– Continued development of strategic investment partnerships and deal flow pipe line in the property and funds management sectors;
– Establishment of Eildon Capital Limited to provide a purely property backed investment vehicle focused on enhanced returns, with a view to compliance listing on the ASX in 2016/17;
– Establishment of Add+Venture to provide an early stage investment vehicle, capitalising on CVC’s track record, existing portfolio and potential investment incentives;
– Continued growth of private equity portfolio, including pursuit of liquidity for Green's Foods Holdings Pty Limited and progression of new investment opportunities;
– Continued development of Litigation Funding deal flow and above benchmark returns from first case;
– Payment of 10 cent dividends per share representing commitment to enhance shareholder returns.
2016 WAS A STRONG YEAR FOR CVC, UNDERPINNED BY THE PERFORMANCE FROM PROPERTY BACKED INVESTMENTS, SIGNIFICANT PROGRESS ON A NUMBER OF KEY INVESTMENTS, INCREASED ANNUAL DIVIDEND, AND SOLID PLATFORM FOR 2017 AND BEYOND.
NET PROFIT AFTER TAX OF $13.8 MILLION, REPRESENTED EARNINGS PER SHARE OF 12 CENTS, AND A HEALTHY CASH POSITION OF $21.7 MILLION, SUPPORTED BY CONTINUED STRONG BALANCE SHEET WITH NET TANGIBLE ASSETS OF $213.5 MILLION, REPRESENTING A GROWTH OF 13% ON THE PRIOR YEAR (INCLUDING DIVIDENDS PAID).
THE YEAR IN REVIEW1 J U LY 2 0 1 5 – 3 0 J U N E 2 0 1 6
2
For
per
sona
l use
onl
y
3A N N U A L R E P O R T | 2016
Management TeamThe CVC management team continue to deliver with regard to sourcing and capitalising on key investments across a range of sectors. The management team continue to represent the core of CVC’s performance and ability to deliver against the outperformance targets set by the Board and shareholders.
Significant effort has been expended over the past 12 months to develop skills, and deal flow across the finance, and property sectors, which we believe will be significant contributors to the growth in net assets and continued profitability of the Company.
The skills of the management team include:– Sourcing, selection, and structuring of
investment opportunities;
– Operational management of investee companies, including strategy and corporate advisory, board positions
ApproachWe believe timing is crucial in both investment and divestment decisions, particularly in smaller capitalised companies or private companies.
The approach taken by management continues to lie in backing skilled management teams to create or realise value in their underlying business and assets. Included in this investment approach is the need to identify assets and companies who have suffered due to cyclical issues, triggering of financial covenants, ownership and management issues or other circumstances that have temporarily impaired the asset or business, or created an opportunity for an investment.
on investee companies including Chairmanship where appropriate;
– Corporate advisory skills, including under-writing of placements and general offers;
– Divestments, including trade sales, demergers, initial public offerings, mergers and acquisitions, management buyouts and financial restructuring;
– Infrastructure investment capabilities, including financial feasibility, negotiation of off-take agreements, negotiation of senior and mezzanine debt facilities and sourcing of equity;
– Distressed debt recoveries and investment turn-arounds;
– Project financing and property development capabilities, including structuring, joint ventures, feasibility and mezzanine financing;
– Financial product development and distribution;
CVC continues to aim to identify businesses that have potential investment upsides through improved economic climates, removal or reduction of underperforming segments and assets and de-risking strategies created through market acceptance, restored credit worthiness or improved regulatory approvals and requirements.
CVC continues to structure its investment portfolio by maintaining a balance of income producing and capital growth assets. Management continues to target opportunities with potential for superior risk adjusted returns, and to identify unique opportunities which build on investment insights accumulated over the past 30 years.
– Assessment and management of litigation funding opportunities, including case management and negotiation;
– Availability and access to government grants;
– Advice/implementation of internal control procedures, management information systems, monthly reporting procedures and statutory reports;
– Development of distribution networks, licensing of technology, patent and advice on portfolio/intellectual property protection, and export market penetration;
– Specialist investment skills in environmental industries, with a depth of expertise in low emission and cleaner technologies; and
– Long term investment performance.
During 2016 the management team have continued to focus and expand on investments across a range of sectors including:
– Providing financing solutions to property backed investments;
– Private equity investments;
– Earlier stage investments;
– A core ASX listed share portfolio;
– Strategic long term investments that are largely equity accounted;
– Litigation funding;
– Opportunistic investment opportunities; and
– Funds management initiatives.
1 J U LY 2 0 1 5 – 3 0 J U N E 2 0 1 6
THE YEAR IN REVIEW
For
per
sona
l use
onl
y
C V C L I M I T E D A N D I T ’ S C O N T R O L L E D E N T I T I E S4
Due to the nature of diversified investments, particularly those of a venture capital or private equity nature, there may be enhanced exposures to risks that are outside of the management team’s control. These can include market volatility amongst listed shares, the strength of the economy, negotiations between buyers and sellers and regulatory changes.
The management team have developed substantial networks in the property industry and continues to utilise these to procure, evaluate and manage real estate investments. The value of this network in protecting capital and producing strong returns is significant. With regard to
earlier stage investments, for accounting purposes it is often difficult to ascribe any significant carrying value to the investment, due to underlying losses whilst the commerciality of the investment is established. Accordingly, it is hard to provide investors any meaningful information on potential value of these investments other than to provide a brief description of the company’s aims and website information to enable some insights into individual companies. Earlier stage investments account for less than 5% of the assets of CVC at cost, but historically they have contributed significant periodic capital gains.
To enhance the return on these investment opportunities requires time and patience to diligently identify, analyse and negotiate strong outcomes. As part of executing this plan, CVC engages in rigorous due diligence as well as patiently supporting management through the phases of business engagement and development, including inevitable periods where performance doesn’t meet plans, through to the realisation phase of the investment lifecycle. CVC continues to aim to structure exits from its investments through trade sales, initial public offerings and on-market sell downs.
Dividend PolicyCVC distributed significant shareholder returns by way of a total of 10 cent fully franked dividends, paid in two 5 cent instalments in March and September. In view of CVC’s maturity, the Board is endeavouring to maintain regular dividends and increase them over time to match a level of underlying profitability. It is anticipated that future dividend payments will be franked to 100%, subject to available credits.
Capital ManagementCVC will periodically purchase shares under its share buy-back scheme, dependent on price. Historically the buy-back scheme has enabled a better matching of assets with recurrent earnings and has achieved accretion in shareholder value. The Board has also periodically distributed special dividends when warranted by either significant surplus cash, or significant realisations.
Corporate GovernanceCVC continues to review its corporate governance initiatives in accordance with the Corporate Governance Principles and Recommendations issued by the ASX Corporate Governance Council on an on-going basis. Further information on CVC’s corporate governance is provided in the corporate governance statement.
Approach
"CVC CONTINUES TO STRUCTURE ITS INVESTMENT PORTFOLIO BY MAINTAINING A BALANCE OF INCOME
PRODUCING AND CAPITAL GROWTH ASSETS."
THE YEAR IN REVIEW1 J U LY 2 0 1 5 – 3 0 J U N E 2 0 1 6
For
per
sona
l use
onl
y

5A N N U A L R E P O R T | 2016
NET ASSETS P E R S H A R E
168 cents2015 155 cents
2014 163 cents
2010 124 cents
2009 110 cents
2008 169 cents
2013 142 cents
2012 130 cents
201 1 126 cents
GROUP SUMMARY
Earnings per share
12 $201.2
$1.68
$185.7 million
$1.55
cents
cents
million$255.4
119,532,788
2015
2015 2015
$242.6 million
119,532,788 shares
million
Total assets employed
Shares on issue at year end
Net assets per share attributable to shareholders
10Dividends per share
Shareholders equity
2015 15 cents
2015 15 cents
2015
1 J U LY 2 0 1 5 – 3 0 J U N E 2 0 1 6
THE YEAR IN REVIEW
For
per
sona
l use
onl
y
C V C L I M I T E D A N D I T ’ S C O N T R O L L E D E N T I T I E S6
THE YEAR IN REVIEW1 J U LY 2 0 1 5 – 3 0 J U N E 2 0 1 6
Outlook and GrowthCVC aims to enhance investor returns by way of asset growth, and improved asset yield, through a range of new and existing investment opportunities. Backed by a strong balance sheet, CVC will continue to source and execute on transactions that enhance shareholder value and return.
CVC remains cautious about the economic climate, and expects continued
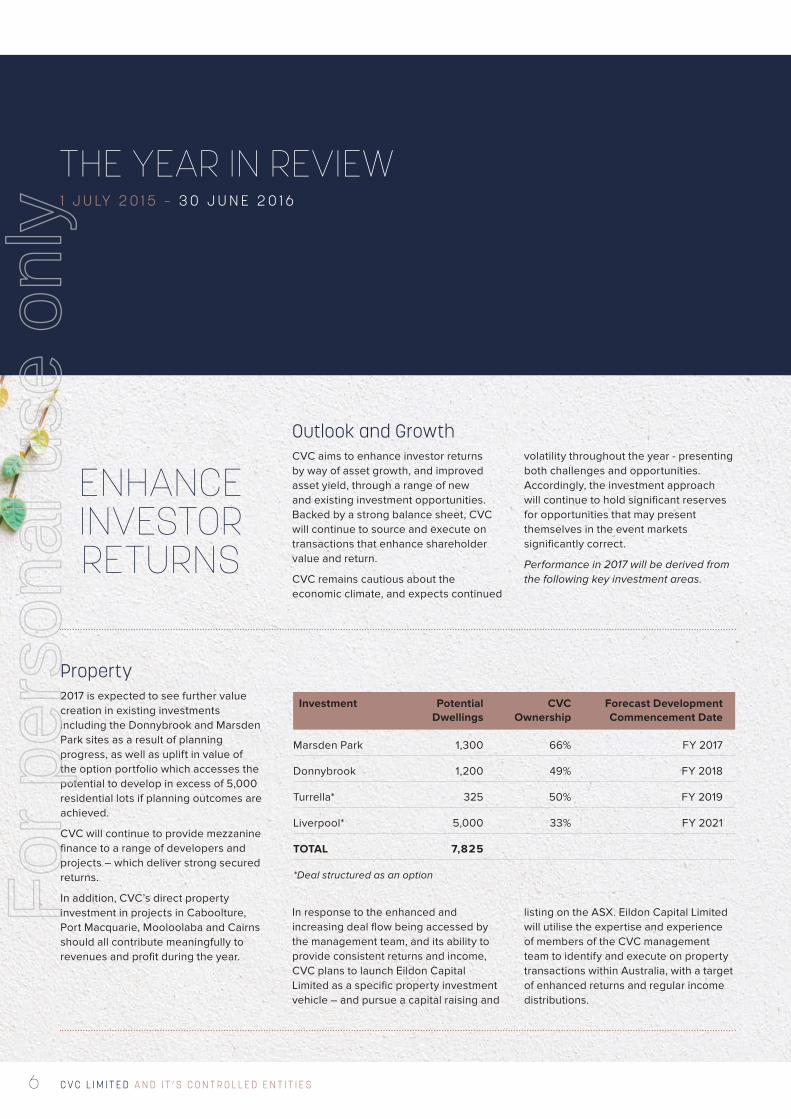
Property2017 is expected to see further value creation in existing investments including the Donnybrook and Marsden Park sites as a result of planning progress, as well as uplift in value of the option portfolio which accesses the potential to develop in excess of 5,000 residential lots if planning outcomes are achieved.
CVC will continue to provide mezzanine finance to a range of developers and projects – which deliver strong secured returns.
In addition, CVC’s direct property investment in projects in Caboolture, Port Macquarie, Mooloolaba and Cairns should all contribute meaningfully to revenues and profit during the year.
volatility throughout the year - presenting both challenges and opportunities. Accordingly, the investment approach will continue to hold significant reserves for opportunities that may present themselves in the event markets significantly correct.
Performance in 2017 will be derived from the following key investment areas.
In response to the enhanced and increasing deal flow being accessed by the management team, and its ability to provide consistent returns and income, CVC plans to launch Eildon Capital Limited as a specific property investment vehicle – and pursue a capital raising and
listing on the ASX. Eildon Capital Limited will utilise the expertise and experience of members of the CVC management team to identify and execute on property transactions within Australia, with a target of enhanced returns and regular income distributions.
ENHANCE INVESTOR RETURNS
Investment Potential CVC Forecast Development Dwellings Ownership Commencement Date
Marsden Park 1,300 66% FY 2017
Donnybrook 1,200 49% FY 2018
Turrella* 325 50% FY 2019
Liverpool* 5,000 33% FY 2021
TOTAL 7,825
*Deal structured as an option
For
per
sona
l use
onl
y
7A N N U A L R E P O R T | 2016
1 J U LY 2 0 1 5 – 3 0 J U N E 2 0 1 6
CVC will continue to evaluate and invest in private equity opportunities, as a fundamental objective of delivering superior long term returns. CVC views private equity opportunities as businesses that are mature and requiring capital for growth, facilitating change of ownership or are undergoing a turnaround strategy.
CVC’s long term holding in Green’s Foods Holdings Limited is in the process of being realised, and is envisaged to release cash of approximately $24 million and net profits after tax of approximately
Listed InvestmentsCVC continued to hold significant investments in Cellnet Group Limited, Lantern Hotel Group, Mitchell Services Limited, 360 Total Return Fund, Bionomics Limited, Prime Media Group Limited, Vita Life Sciences Limited, and Cyclopharm Limited. CVC derives income from these strategic listed investments, including dividend income, but has acquired the holdings with the view to meaningful long-term capital returns from a re-rating or improved performance.
Funds Management– CVC will continue to support
Australian Mid-Cap Equities Manager, Concise Asset Management Limited which performs above expectations in building funds under management;
– continue to support and develop specialist Property Manager JAK Investment Group Pty Limited; and
– evaluate other opportunities to invest in new or established specialist fund managers who are seeking the opportunity to expand or develop their business.
$10 million to the Group during 2016/17, representing investment returns in excess of 30% per annum since acquisition from GPG in 2012.
CVC will continue to look to participate in a full spectrum of private equity investments, including succession planning, turnarounds, shareholder liquidity, expansion/merger and acquisition activity and pre-IPO investments. Where warranted by size or complexity CVC will provide significant management resources to assist with execution of the investment objective.
Where appropriate CVC provided active management of key strategic investments with assistance in both acquisitive and organic growth and operational and financial restructuring.
During the financial year, CVC will continue to identify new strategic investments in which the Company can acquire significant and meaningful stakes to complement existing major holdings and contribute a source of dividends and capital growth.
Litigation FundingDuring the year CVC funded a number of litigation cases, primarily for liquidators pursuing recovery of insolvency assets. CVC derives a return on the monies loaned, and a percentage share of successful outcomes.
CVC sees the potential to build a recurrent portfolio of cases over time with the ability to derive meaningful returns from limited balance sheet exposure – and envisages in some future period that this investment strategy will warrant its own investment vehicle.
CVC will seek to acquire a meaningful stake in private equity opportunities during the year, to provide for substantial longer term equity accounted earnings and capital growth.
In 2016 meaningful stakes were acquired in award winning breathing device manufacturer PAFtec Pty Limited, and NSX listed Heritage Brands Limited – both of which we anticipate will contribute meaningfully to future profitability.
"THE APPROACH TAKEN BY MANAGEMENT CONTINUES TO LIE IN BACKING SKILLED MANAGEMENT TEAMS TO CREATE OR REALISE VALUE IN THEIR UNDERLYING BUSINESS AND ASSETS."
THE YEAR IN REVIEW
Private Equity Investments
For
per
sona
l use
onl
y
C V C L I M I T E D A N D I T ’ S C O N T R O L L E D E N T I T I E S8
THE YEAR IN REVIEW1 J U LY 2 0 1 5 – 3 0 J U N E 2 0 1 6
CVC increased its focus on earlier stage investments during the year, as a result of three key developments:
1) an improved investment environment for returns from earlier stage investments;
2) improved access to capital for early stage companies including crowd-funding; and
3) potential for improved regulatory support and incentives for earlier stage investments
Early stage investments have played a fundamental part in CVC’s growth from inception and represents one part of CVC’s multi-decade investment success.
As a result of the success of some of these earlier stage investments, and the
quality of deal flow we are receiving, CVC is launching a new early stage strategy comprising a crowd funding style syndication platform, under the new name Add+Venture.
Through Add+Venture, CVC will offer qualifying investors exposure to the potentially substantial returns available to investors in early stage companies.
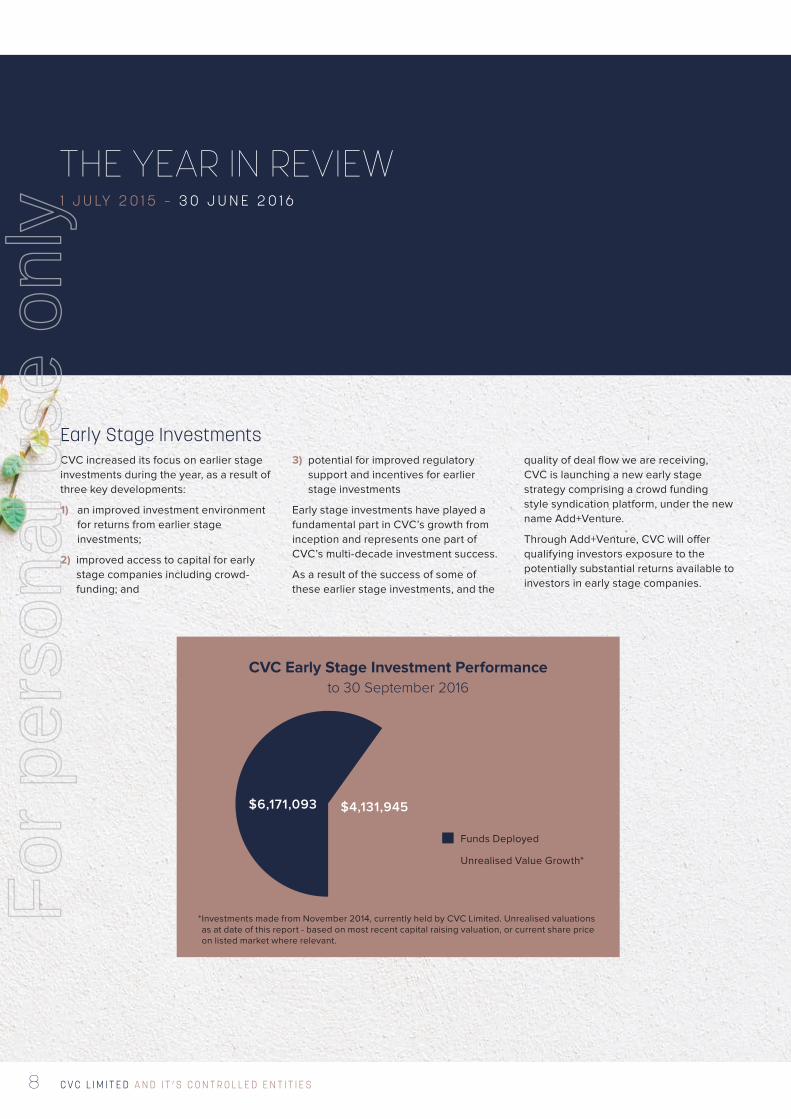
* Investments made from November 2014, currently held by CVC Limited. Unrealised valuations as at date of this report - based on most recent capital raising valuation, or current share price on listed market where relevant.
CVC Early Stage Investment Performance to 30 September 2016
$6,171,093 $4,131,945
Funds Deployed
Unrealised Value Growth*
Early Stage Investments
For
per
sona
l use
onl
y
9A N N U A L R E P O R T | 2016
F O R T H E Y E A R E N D E D 3 0 J U N E 2 0 1 6
FINANCIAL REPORT
For
per
sona
l use
onl
y
C V C L I M I T E D A N D I T ’ S C O N T R O L L E D E N T I T I E S10
Your Directors present the Financial Report of CVC Limited (the “Company”) and its controlled entities (“CVC”), for the year ended 30 June 2016 together with the Auditors’ Report thereon.
DIRECTORSThe names of Directors who served at any time during or since the end of the financial year are John Douglas Read, Alexander Damien Harry Beard and Ian Houston Campbell. The names of Company Secretaries in office throughout the financial year and to the date of this report are Mr Alexander Damien Harry Beard and Mr John Andrew Hunter. Details of qualifications, experience and special responsibilities of Directors are as follows:
John Douglas Read (Non-Executive Director)B.Sc. (Hons) (Cant.), M.B.A. (A.G.S.M.)
Fellow of the Australian Institute of Company Directors.
Board member since 1989 and Chairman of the audit committee of the Company.
Mr Read has over 30 years experience in the venture capital industry. He is a former Director of CSIRO and the Australian Institute for Commercialisation Limited.
During the past three years Mr Read has also served as Director of Patrys Limited, The Environmental Group Limited and the Central Coast Water Corporation.
Alexander Damien Harry Beard (Managing Director and Company Secretary)B.Com. (Uni. of NSW)
Fellow of the Chartered Accountants Australia and New Zealand; Member of the Australian Institute of Company Directors.
Board member since 2000 and Chief Executive Officer since 2001. Member of the audit committee.
Mr Beard has been employed by the manager of the Company since 1991.
During the past three years Mr Beard has also served as Chairman of Cellnet Group Limited and Villa World Limited and Director of the following other listed companies: Cellnet Group Limited, Villa World Limited, Grays Ecommerce Group Limited and Eildon Funds Management Limited (formerly CVC Property Managers Limited) as Responsible Entity for CVC Property Fund.
Ian Houston Campbell (Non-Executive Director)Fellow of the Chartered Accountants Australia and New Zealand; Member of the Australian Institute of Company Directors.
Mr Campbell is currently a Non-Executive Director of Kip McGrath Education Centres Limited (ASX: KME) and Redox Pty Limited. Mr Campbell’s previous Non-Executive Director roles include Gloria Jean's Coffees International Pty Limited, Young Achievement Australia Limited and Green’s Foods Holdings Pty Limited. Mr Campbell brings to CVC 30 years of experience as a former partner with Ernst and Young and predecessor firms,
DIRECTORS’ REPORTF O R T H E Y E A R E N D E D 3 0 J U N E 2 0 1 6
principally working with entrepreneurial companies in preparing them for growth, sale and capital markets.
COMPANY SECRETARIESJohn Andrew Hunter B.Com. (ANU), M.B.A. (MGSM), MAppFin (MAFC)
Member of the Chartered Accountants Australia and New Zealand.
In addition to being a Director of the Company, Alexander Damien Harry Beard is also a Company Secretary of the Company.
KEY MANAGEMENT PERSONNELThe key management personnel during the financial year were:
John Andrew Hunter – Chief Financial Officer
Elliott Grant Kaplan (a) – Investment Director and Executive Officer
(a) Elliott Kaplan ceased to be considered to be a member of the key management personnel on 23 November 2015 when he retired as Managing Director of Eildon Capital Limited (formerly CVC Private Equity Limited).
DIRECTORS’ MEETINGS No. of meetings No. of meetings attended eligible to attend
John Douglas Read 4 4
Alexander Damien Harry Beard 4 4
Ian Houston Campbell 4 4
The Company has an audit committee. The number of meetings and the number of meetings attended by each of the Directors on the audit committee during the financial year were:
AUDIT COMMITTEE MEETINGS No. of meetings No. of meetings attended eligible to attend
John Douglas Read 2 2
Alexander Damien Harry Beard 2 2
Ian Houston Campbell 2 2For
per
sona
l use
onl
y
A N N U A L R E P O R T | 2016 1 1
DIRECTORS’ REPORTF O R T H E Y E A R E N D E D 3 0 J U N E 2 0 1 6
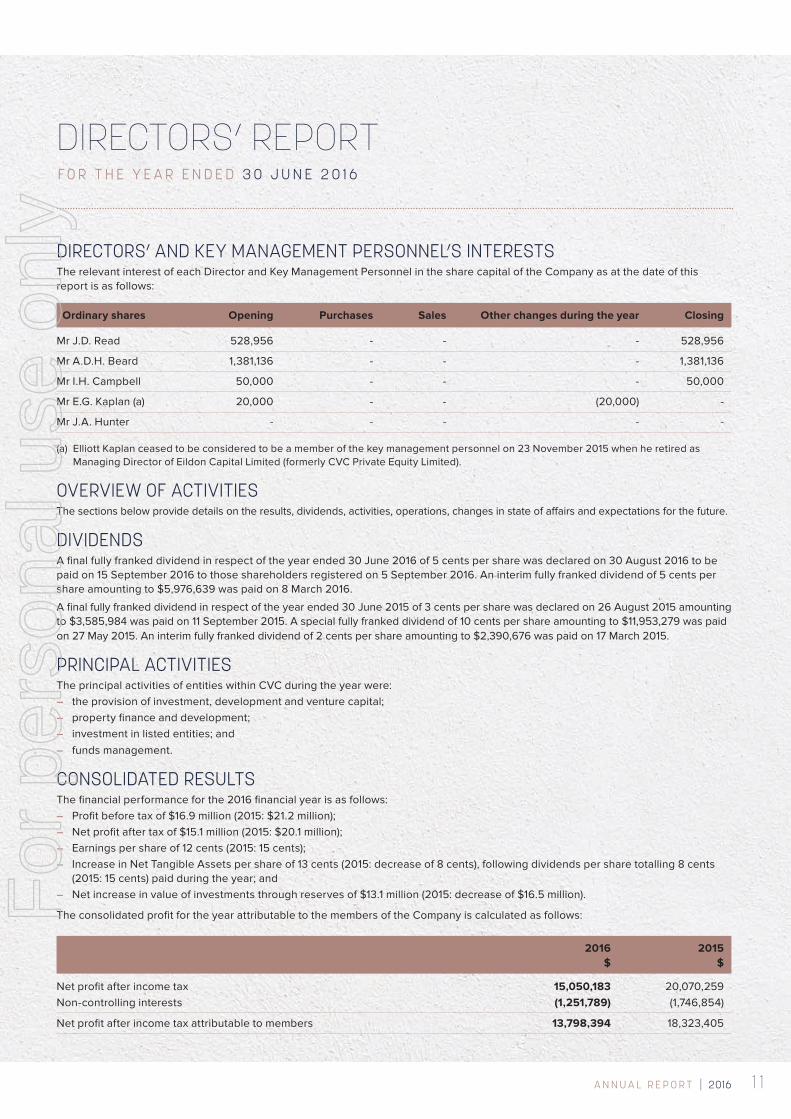
DIRECTORS’ AND KEY MANAGEMENT PERSONNEL’S INTERESTSThe relevant interest of each Director and Key Management Personnel in the share capital of the Company as at the date of this report is as follows:
Ordinary shares Opening Purchases Sales Other changes during the year Closing
Mr J.D. Read 528,956 - - - 528,956
Mr A.D.H. Beard 1,381,136 - - - 1,381,136
Mr I.H. Campbell 50,000 - - - 50,000
Mr E.G. Kaplan (a) 20,000 - - (20,000) -
Mr J.A. Hunter - - - - -
(a) Elliott Kaplan ceased to be considered to be a member of the key management personnel on 23 November 2015 when he retired as Managing Director of Eildon Capital Limited (formerly CVC Private Equity Limited).
OVERVIEW OF ACTIVITIESThe sections below provide details on the results, dividends, activities, operations, changes in state of affairs and expectations for the future.
DIVIDENDSA final fully franked dividend in respect of the year ended 30 June 2016 of 5 cents per share was declared on 30 August 2016 to be paid on 15 September 2016 to those shareholders registered on 5 September 2016. An interim fully franked dividend of 5 cents per share amounting to $5,976,639 was paid on 8 March 2016.
A final fully franked dividend in respect of the year ended 30 June 2015 of 3 cents per share was declared on 26 August 2015 amounting to $3,585,984 was paid on 11 September 2015. A special fully franked dividend of 10 cents per share amounting to $11,953,279 was paid on 27 May 2015. An interim fully franked dividend of 2 cents per share amounting to $2,390,676 was paid on 17 March 2015.
PRINCIPAL ACTIVITIESThe principal activities of entities within CVC during the year were:– the provision of investment, development and venture capital; – property finance and development; – investment in listed entities; and– funds management.
CONSOLIDATED RESULTSThe financial performance for the 2016 financial year is as follows:– Profit before tax of $16.9 million (2015: $21.2 million);– Net profit after tax of $15.1 million (2015: $20.1 million); – Earnings per share of 12 cents (2015: 15 cents);– Increase in Net Tangible Assets per share of 13 cents (2015: decrease of 8 cents), following dividends per share totalling 8 cents
(2015: 15 cents) paid during the year; and– Net increase in value of investments through reserves of $13.1 million (2015: decrease of $16.5 million).
The consolidated profit for the year attributable to the members of the Company is calculated as follows:
2016 2015 $ $
Net profit after income tax 15,050,183 20,070,259Non-controlling interests (1,251,789) (1,746,854)
Net profit after income tax attributable to members 13,798,394 18,323,405
For
per
sona
l use
onl
y
C V C L I M I T E D A N D I T ’ S C O N T R O L L E D E N T I T I E S12
DIRECTORS’ REPORTF O R T H E Y E A R E N D E D 3 0 J U N E 2 0 1 6
Listed InvestmentsThe total contribution to comprehensive income amounted to $11.4 million (2015: loss of $0.3 million), which includes both movements in reserves of $11.8 million (2015: reduction of $16.9 million) and loss on realised investments of $0.4 million (2015: profit of $16.6 million). During the year CVC continued to make acquisitions in listed companies it considers to be undervalued, including an additional investment in Lantern Hotel Group. The result for the year was directly attributed to positive results of a number of investments held during the year including:
– Lantern Hotel Group of $5.3 million;
– Heritage Brands Limited of $3.4 million;
– Cyclopharm Limited of $3.6 million; and
– Afterpay Holdings Limited of $1.2 million.
Although CVC’s investment strategy of being a long term investor in undervalued stocks, in accordance with CVC’s policy of impairing investments where there has been a significant reduction in share prices, the contribution by listed investments to CVC’s overall performance has been reduced by impairment charges against investments. The total impairment charges raised during the year amounted to $4.8 million (2015: $5.8 million). This included impairments in relation to:
– Bionomics Limited of $2.1 million (share price of $0.285);
– Prime Media Group Limited of $0.9 million (share price of $0.315);
– Mitchell Services Limited of $0.6 million (share price of $0.016); and
– MMA Offshore Limited of $0.7 million (share price of $0.300).
Distributions received from various investments during the financial year amounted to $1.0 million (2015: $2.0 million).
Private EquityThe total contribution to comprehensive income was $4.3 million (2015: $2.2 million) including the results of equity accounted investments. During the year the final tranche of shares were bought back by Ron Finemore Transport Pty Limited for proceeds of $7.5 million, generating a profit of $1.2 million. CVC has also made an investment in PAFtec Pty Limited, an Australian patented and developed breathing device manufacturer with significant export earnings and a recent recipient of the prestigious red dot design award.
CVC made a number of smaller investments into earlier stage companies with a view to longer term value creation. CVC continues to seek investment opportunities in private companies, and expects that investment conditions may present more opportunities in the next 12 – 18 months.
Green’s Foods Holdings Pty Limited (Green’s) contributed $1.7 million to CVC’s comprehensive income during the year. In addition dividends amounting to $3.5 million were received. CVC has explored the sale of it’s shareholding in Green’s and is of the opinion that the current value of the shareholding is in the range of $20 - $24 million. If the shareholding in Green’s was to be sold at the director’s assessed value this would generate an increase in the net assets of CVC in the range of $2.2 - $5.0 million and a contribution to profit after tax of approximately $7.9 - $10.7 million.
PropertyTotal contribution to comprehensive income was $19.2 million (2015: $3.9 million) net of project specific borrowing costs of $1.9 million. This included interest related income generated from the provision of mezzanine finance facilities of $12.4 million, exit from property investments of $4.2 million and profit recognised from the construction of the South Nowra property of $4.5 million.
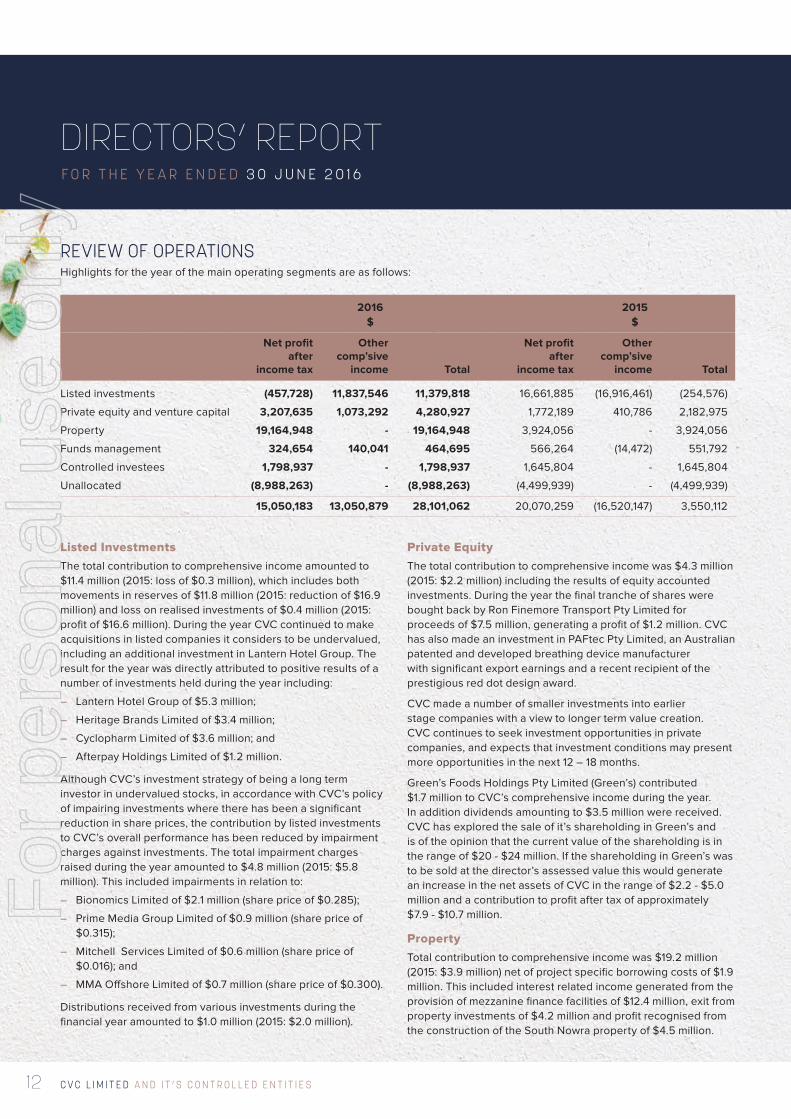
REVIEW OF OPERATIONSHighlights for the year of the main operating segments are as follows:
2016 2015 $ $
Net profit Other Net profit Other after comp’sive after comp’sive income tax income Total income tax income Total
Listed investments (457,728) 11,837,546 11,379,818 16,661,885 (16,916,461) (254,576)
Private equity and venture capital 3,207,635 1,073,292 4,280,927 1,772,189 410,786 2,182,975
Property 19,164,948 - 19,164,948 3,924,056 - 3,924,056
Funds management 324,654 140,041 464,695 566,264 (14,472) 551,792
Controlled investees 1,798,937 - 1,798,937 1,645,804 - 1,645,804
Unallocated (8,988,263) - (8,988,263) (4,499,939) - (4,499,939)
15,050,183 13,050,879 28,101,062 20,070,259 (16,520,147) 3,550,112
For
per
sona
l use
onl
y
13A N N U A L R E P O R T | 2016
CVC is launching a specialist early stage investment fund to be known as Add+Venture, which will seek to enhance our early stage deal flow and provide opportunities for investors to participate in investments in a crowd funding style platform.
Controlled investeesCellnet Group Limited (ASX: CLT) provided a contribution to comprehensive income of $1.8 million (2015: $1.6 million) for the period. The Cellnet Group Limited result was achieved despite difficult trading conditions exacerbated by the closure of Dick Smith Electronics stores. During the second half of the year a number of organic growth opportunities were implemented which are expected to further improve operating performance during the 2017 financial year. Cellnet Group Limited is continuing to seek value enhancing acquisition opportunities.
STATE OF AFFAIRSThere were no significant changes in the state of affairs of the Company that occurred during the year not otherwise disclosed in this report or the financial statements.
LIKELY DEVELOPMENTSAs explained in previous reports, the total level of profit for any period, notwithstanding the recurrent earnings, is largely determined by the timing of the realisation of investments that result in capital gains. The Company believes the strong financial position and continual evaluation of investment opportunities by its management team will enable the identification and execution of suitable investment opportunities during the course of the year.
ENVIRONMENTAL REGULATIONCVC’s operations are not subject to environmental regulations.
EVENTS SUBSEQUENT TO BALANCE DATEA final dividend in respect of the year ended 30 June 2016 of 5 cents per share was declared on 30 August 2016 to be paid on 15 September 2016 to those shareholders registered on 5 September 2016.
Other than as set out above, there are no other matters or circumstances that have arisen since the end of the financial year which significantly affected or may significantly affect the operations of CVC, the results of those operations or the state of affairs of CVC in future financial years.
During the year CVC sold the South Nowra retail property and completed the development of the site under a development and delivery agreement.
During the year CVC made investments in three new sites: a 15 hectare commercial site in Caboolture, Queensland; an industrial site in East Bentleigh, Victoria and a commercial site in Mooloolaba, Queensland. All projects provide long term development pipelines once rezoning has been achieved of combined retail, commercial and residential uses.
CVC’s Donnybrook joint venture, of which CVC holds a 49% share, has entered into a conditional contract to sell 67.9 ha of the 274 ha proposed residential development project for $34 million. The sale is subject to achieving a Precinct Structure Plan by 6 April 2020. This has significantly improved the joint venture’s commercial position and will free up capital to develop the remaining 206 ha of the project. The entire property was purchased by the Donnybrook joint venture in 2014 for $22.8 million.
CVC continues to progress the planning approval of the Marsden Park North property in conjunction with Mirvac Homes (NSW) Pty Limited, to achieve a residential rezoning. The area has experienced significant growth since CVC acquired the site in 2012, and once the sale of residential lots commence the project is expected to generate significant long term value for CVC. Based on internal estimates of valuation of similar properties and discounted cash flows from the project delivery agreement, CVC’s share of the value of the project was estimated to be in the vicinity of $40 million as previously announced to the market on 19 November 2014. This is compared to a carrying value of the property, which is classified as inventories, of $10.9 million.
Following the announcement by Woolworths Limited in January 2016 regarding its exit and sale of its Home Improvement businesses, Masters Home Improvement Australia Pty Limited repudiated the Agreement for Lease in relation to the Port Macquarie site on 30 June 2016. Negotiations have failed to produce a satisfactory outcome for CVC and accordingly CVC will seek compensation via a court process.
Funds ManagementThe contribution to comprehensive income of this segment was $0.5 million (2015: $0.6 million).
Concise Asset Management Limited (Mid Cap Australian Equities Specialist) continues to grow its funds management business and has contributed $0.5 million to CVC’s comprehensive income during the year.
During the year Eildon Capital Limited (formerly CVC Private Equity Limited) completed a restructure to change its focus from private equity investments to a pure property investment focus. The company plans to undertake a capital raising and pursue an ASX listing this year. This will provide shareholders, as well as retail investors, the opportunity to invest directly into a CVC entity that specialises in mezzanine funded projects with the objective of generating higher returns for investors.
DIRECTORS’ REPORTF O R T H E Y E A R E N D E D 3 0 J U N E 2 0 1 6
For
per
sona
l use
onl
y
C V C L I M I T E D A N D I T ’ S C O N T R O L L E D E N T I T I E S14
DIRECTORS’ REPORTF O R T H E Y E A R E N D E D 3 0 J U N E 2 0 1 6
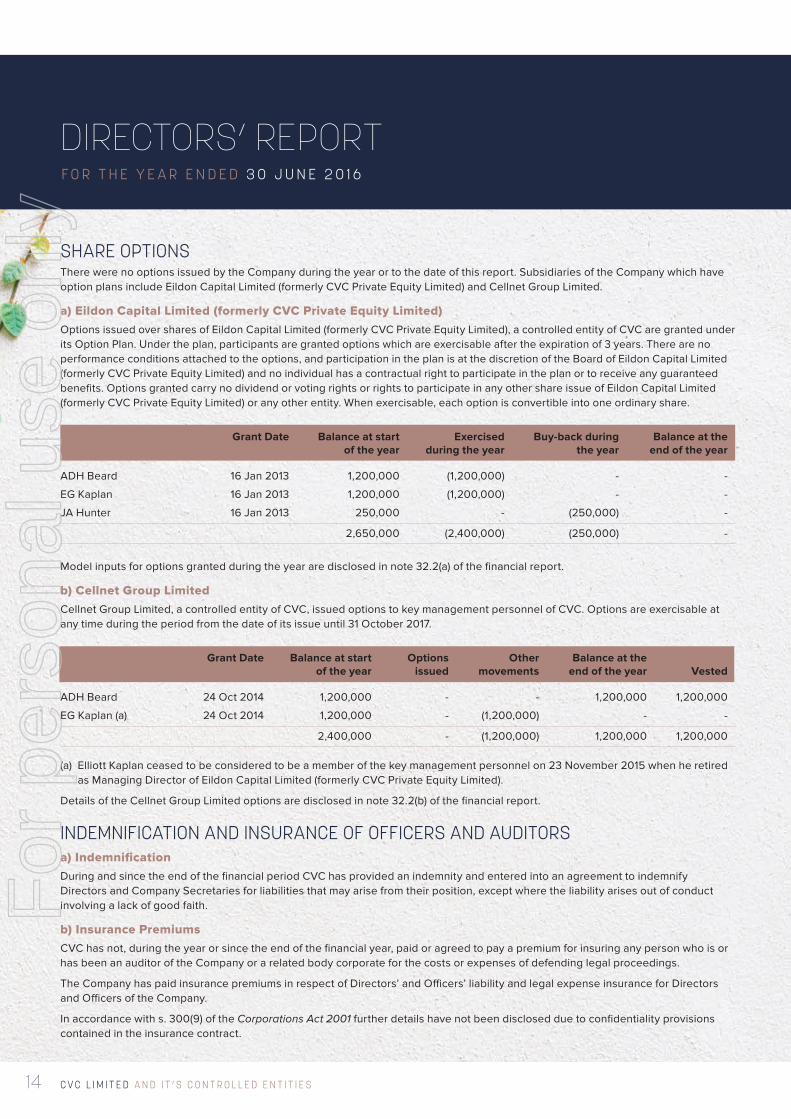
SHARE OPTIONSThere were no options issued by the Company during the year or to the date of this report. Subsidiaries of the Company which have option plans include Eildon Capital Limited (formerly CVC Private Equity Limited) and Cellnet Group Limited.
a) Eildon Capital Limited (formerly CVC Private Equity Limited) Options issued over shares of Eildon Capital Limited (formerly CVC Private Equity Limited), a controlled entity of CVC are granted under its Option Plan. Under the plan, participants are granted options which are exercisable after the expiration of 3 years. There are no performance conditions attached to the options, and participation in the plan is at the discretion of the Board of Eildon Capital Limited (formerly CVC Private Equity Limited) and no individual has a contractual right to participate in the plan or to receive any guaranteed benefits. Options granted carry no dividend or voting rights or rights to participate in any other share issue of Eildon Capital Limited (formerly CVC Private Equity Limited) or any other entity. When exercisable, each option is convertible into one ordinary share.
Grant Date Balance at start Exercised Buy-back during Balance at the of the year during the year the year end of the year
ADH Beard 16 Jan 2013 1,200,000 (1,200,000) - -
EG Kaplan 16 Jan 2013 1,200,000 (1,200,000) - -
JA Hunter 16 Jan 2013 250,000 - (250,000) -
2,650,000 (2,400,000) (250,000) -
Model inputs for options granted during the year are disclosed in note 32.2(a) of the financial report.
b) Cellnet Group LimitedCellnet Group Limited, a controlled entity of CVC, issued options to key management personnel of CVC. Options are exercisable at any time during the period from the date of its issue until 31 October 2017.
Grant Date Balance at start Options Other Balance at the of the year issued movements end of the year Vested
ADH Beard 24 Oct 2014 1,200,000 - - 1,200,000 1,200,000
EG Kaplan (a) 24 Oct 2014 1,200,000 - (1,200,000) - -
2,400,000 - (1,200,000) 1,200,000 1,200,000
(a) Elliott Kaplan ceased to be considered to be a member of the key management personnel on 23 November 2015 when he retired as Managing Director of Eildon Capital Limited (formerly CVC Private Equity Limited).
Details of the Cellnet Group Limited options are disclosed in note 32.2(b) of the financial report.
INDEMNIFICATION AND INSURANCE OF OFFICERS AND AUDITORSa) IndemnificationDuring and since the end of the financial period CVC has provided an indemnity and entered into an agreement to indemnify Directors and Company Secretaries for liabilities that may arise from their position, except where the liability arises out of conduct involving a lack of good faith.
b) Insurance PremiumsCVC has not, during the year or since the end of the financial year, paid or agreed to pay a premium for insuring any person who is or has been an auditor of the Company or a related body corporate for the costs or expenses of defending legal proceedings.
The Company has paid insurance premiums in respect of Directors’ and Officers’ liability and legal expense insurance for Directors and Officers of the Company.
In accordance with s. 300(9) of the Corporations Act 2001 further details have not been disclosed due to confidentiality provisions contained in the insurance contract.
For
per
sona
l use
onl
y
15A N N U A L R E P O R T | 2016
employment rewards with the wealth generated for shareholders whilst providing a mechanism to retain key employees over the longer term. In general terms, under the plan:
– key employees are invited by the Directors to acquire shares in the Company subject to certain conditions;
– the conditions specify performance hurdles and time periods in which they are required to be achieved;
– all shares issued under the plan cover a three year period and require that the total return to shareholders over the three year period exceeds the rate of growth over the same period for the S&P/ASX Small Ordinaries Accumulation Index;
– shares are issued at market value and the Company provides a loan to the participant to cover the cost of the shares;
– interest is charged on the loan equivalent to dividends paid on the shares;
– the shares are restricted and cannot be dealt with by the participant during the period;
– shares are forfeited and the loans are cancelled if the performance hurdles have not been met or the share price at the end of the period is below the issue price;
– if shares are not forfeited, at the end of the period the participant is required to repay the loan, the restrictions on the shares are removed and the shares are taken out of the plan; and
– a maximum of 5 million shares can be issued under the plan.
There are currently no shares issued under the CVC Executive Long Term Incentive Plan.
Individual remuneration disclosuresThe following table provides details of the remuneration expense of the Company and its 100% owned entities recognised for the group’s key management personnel for the current and previous financial year measured in accordance with the requirements of the accounting standard.
REMUNERATION REPORT (AUDITED)This report outlines the remuneration arrangements in place for key management personnel of the Company and its 100% owned entities in accordance with the requirements of the Corporations Act 2001 and its regulations. For clarity it includes the remuneration received by Messrs Beard and Kaplan from Cellnet Group Limited and Eildon Capital Limited (formerly CVC Private Equity Limited), but excludes the remuneration of those key management personnel of Cellnet Group Limited and Eildon Capital Limited (formerly CVC Private Equity Limited) which are not considered to be key management personnel of CVC. This information has been audited as required by s. 308(3C) of the Corporations Act 2001. The remuneration report details the remuneration arrangements for key management personnel who are defined as those persons having authority and responsibility for planning, directing and controlling the major activities of CVC.
Remuneration philosophyThe performance of CVC depends upon its ability to attract and retain quality people. CVC is committed to developing a remuneration philosophy of paying sufficient competitive ‘base’ rewards to attract and retain high calibre management personnel and providing the opportunity to receive superior remuneration tied directly to the creation of value for shareholders.
Remuneration structureIn accordance with best practice corporate governance, the structure of Non-Executive Director and remuneration for all other key management personnel is separate and distinct.
Non-Executive Director’s remuneration is solely in the form of fees and has been set by shareholders at a maximum aggregate amount of $550,000, to be allocated amongst the Directors as they see fit. It has been set to balance the need to attract and retain Directors of the highest calibre at a cost that is acceptable to shareholders.
Key management personnel remuneration consists of: base salary, fees, superannuation contributions, short term performance discretionary bonuses and participation in the CVC Executive Long Term Incentive Plan.
The Company does not have a remuneration committee. The remuneration of the Managing Director, Mr Beard, is determined following discussion with the Non-Executive Directors. The remuneration of key management personnel other than Mr Beard are determined following discussion with the Board of CVC.
Short term discretionary performance bonuses permit CVC to reward individuals for superior personal performance or contribution towards components of CVC’s performance for which they have direct responsibility and are determined at the end of the financial year.
The objectives of the CVC Executive Long Term Incentive Plan are to directly align the opportunity to achieve superior
DIRECTORS’ REPORTF O R T H E Y E A R E N D E D 3 0 J U N E 2 0 1 6
For
per
sona
l use
onl
y
C V C L I M I T E D A N D I T ’ S C O N T R O L L E D E N T I T I E S16
DIRECTORS’ REPORTF O R T H E Y E A R E N D E D 3 0 J U N E 2 0 1 6
(Chairperson & Executive Director until 19 Dec 2014) (c)
(Executive from 19 Dec to 31 March 2015)
(Executive Director until 16 March 2015)
(Executive until 31 March 2015)
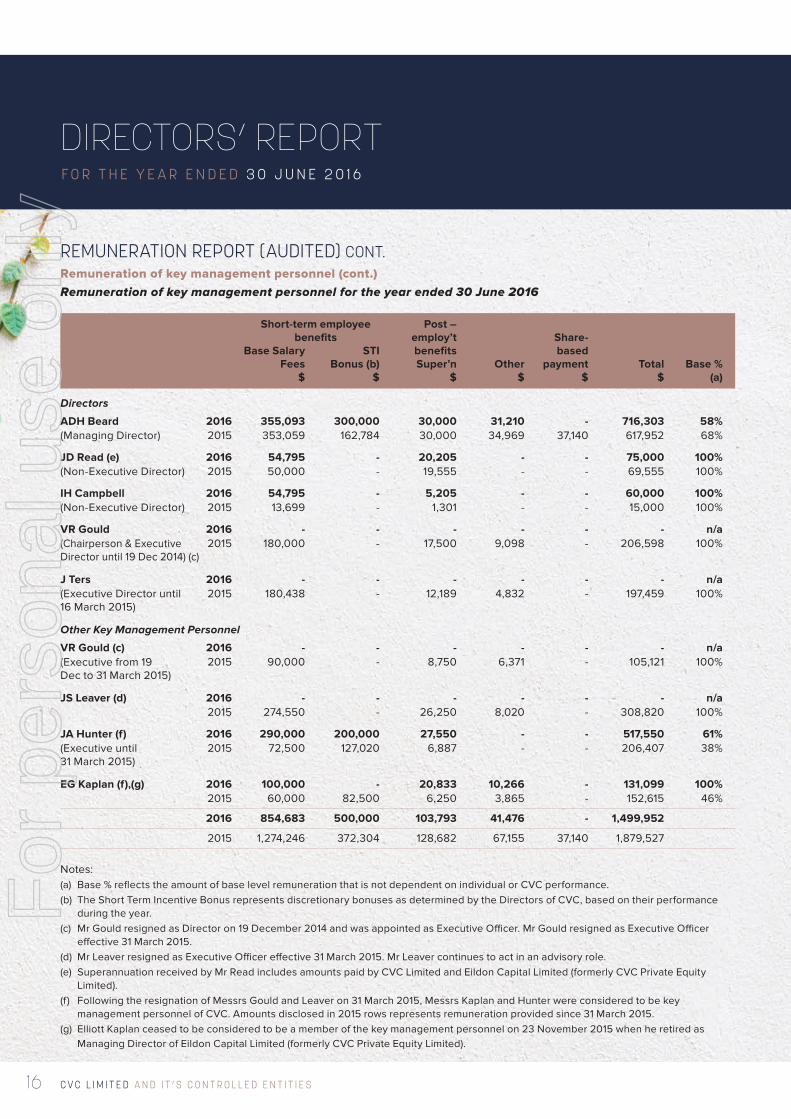
REMUNERATION REPORT (AUDITED) CONT.Remuneration of key management personnel (cont.)Remuneration of key management personnel for the year ended 30 June 2016
Short-term employee Post – benefits employ’t Share- Base Salary STI benefits based Fees Bonus (b) Super’n Other payment Total Base % $ $ $ $ $ $ (a)
Directors
ADH Beard 2016 355,093 300,000 30,000 31,210 - 716,303 58%(Managing Director) 2015 353,059 162,784 30,000 34,969 37,140 617,952 68%
JD Read (e) 2016 54,795 - 20,205 - - 75,000 100%(Non-Executive Director) 2015 50,000 - 19,555 - - 69,555 100%
IH Campbell 2016 54,795 - 5,205 - - 60,000 100%(Non-Executive Director) 2015 13,699 - 1,301 - - 15,000 100%
VR Gould 2016 - - - - - - n/a 2015 180,000 - 17,500 9,098 - 206,598 100%
J Ters 2016 - - - - - - n/a 2015 180,438 - 12,189 4,832 - 197,459 100%
Other Key Management Personnel
VR Gould (c) 2016 - - - - - - n/a 2015 90,000 - 8,750 6,371 - 105,121 100%
JS Leaver (d) 2016 - - - - - - n/a 2015 274,550 - 26,250 8,020 - 308,820 100%
JA Hunter (f) 2016 290,000 200,000 27,550 - - 517,550 61% 2015 72,500 127,020 6,887 - - 206,407 38%
EG Kaplan (f),(g) 2016 100,000 - 20,833 10,266 - 131,099 100% 2015 60,000 82,500 6,250 3,865 - 152,615 46%
2016 854,683 500,000 103,793 41,476 - 1,499,952
2015 1,274,246 372,304 128,682 67,155 37,140 1,879,527
Notes:(a) Base % reflects the amount of base level remuneration that is not dependent on individual or CVC performance. (b) The Short Term Incentive Bonus represents discretionary bonuses as determined by the Directors of CVC, based on their performance
during the year. (c) Mr Gould resigned as Director on 19 December 2014 and was appointed as Executive Officer. Mr Gould resigned as Executive Officer
effective 31 March 2015.(d) Mr Leaver resigned as Executive Officer effective 31 March 2015. Mr Leaver continues to act in an advisory role. (e) Superannuation received by Mr Read includes amounts paid by CVC Limited and Eildon Capital Limited (formerly CVC Private Equity
Limited).(f ) Following the resignation of Messrs Gould and Leaver on 31 March 2015, Messrs Kaplan and Hunter were considered to be key
management personnel of CVC. Amounts disclosed in 2015 rows represents remuneration provided since 31 March 2015.(g) Elliott Kaplan ceased to be considered to be a member of the key management personnel on 23 November 2015 when he retired as
Managing Director of Eildon Capital Limited (formerly CVC Private Equity Limited).
For
per
sona
l use
onl
y
17A N N U A L R E P O R T | 2016
DIRECTORS’ REPORTF O R T H E Y E A R E N D E D 3 0 J U N E 2 0 1 6
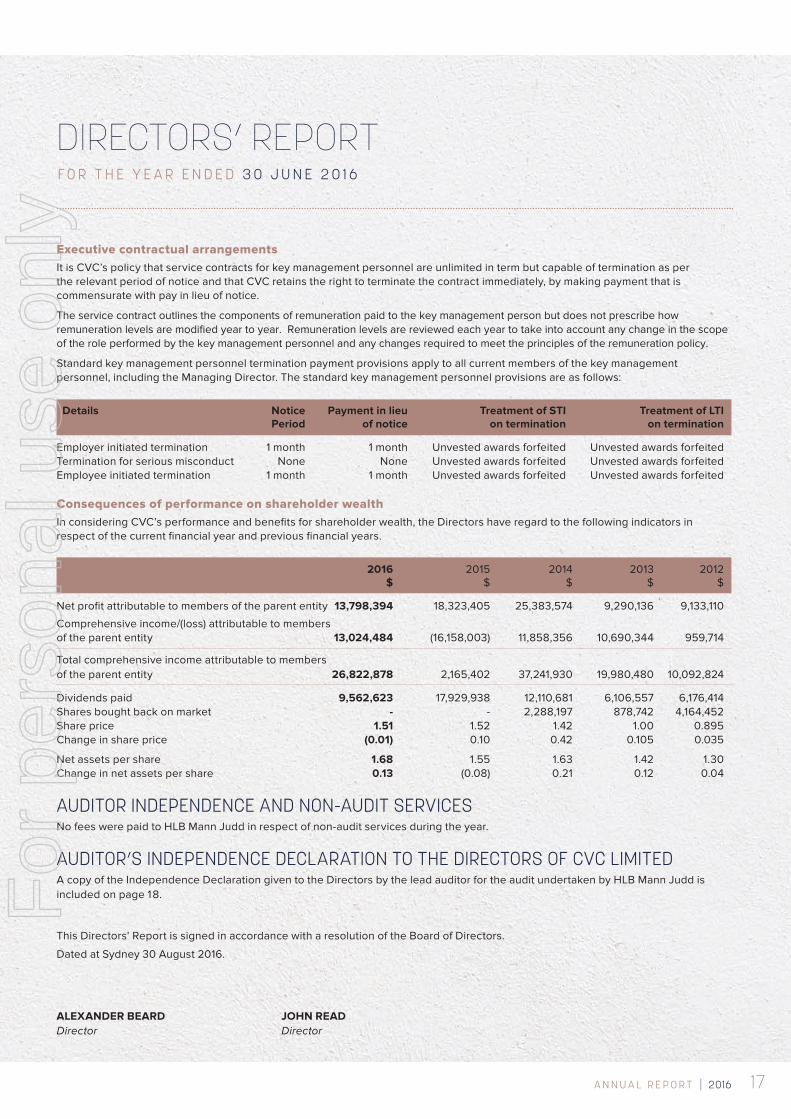
Executive contractual arrangementsIt is CVC’s policy that service contracts for key management personnel are unlimited in term but capable of termination as per the relevant period of notice and that CVC retains the right to terminate the contract immediately, by making payment that is commensurate with pay in lieu of notice.
The service contract outlines the components of remuneration paid to the key management person but does not prescribe how remuneration levels are modified year to year. Remuneration levels are reviewed each year to take into account any change in the scope of the role performed by the key management personnel and any changes required to meet the principles of the remuneration policy.
Standard key management personnel termination payment provisions apply to all current members of the key management personnel, including the Managing Director. The standard key management personnel provisions are as follows:
Details Notice Payment in lieu Treatment of STI Treatment of LTI Period of notice on termination on termination
Employer initiated termination 1 month 1 month Unvested awards forfeited Unvested awards forfeitedTermination for serious misconduct None None Unvested awards forfeited Unvested awards forfeitedEmployee initiated termination 1 month 1 month Unvested awards forfeited Unvested awards forfeited
Consequences of performance on shareholder wealthIn considering CVC’s performance and benefits for shareholder wealth, the Directors have regard to the following indicators in respect of the current financial year and previous financial years.
2016 2015 2014 2013 2012 $ $ $ $ $
Net profit attributable to members of the parent entity 13,798,394 18,323,405 25,383,574 9,290,136 9,133,110
Comprehensive income/(loss) attributable to members of the parent entity 13,024,484 (16,158,003) 11,858,356 10,690,344 959,714
Total comprehensive income attributable to members of the parent entity 26,822,878 2,165,402 37,241,930 19,980,480 10,092,824
Dividends paid 9,562,623 17,929,938 12,110,681 6,106,557 6,176,414Shares bought back on market - - 2,288,197 878,742 4,164,452Share price 1.51 1.52 1.42 1.00 0.895Change in share price (0.01) 0.10 0.42 0.105 0.035
Net assets per share 1.68 1.55 1.63 1.42 1.30Change in net assets per share 0.13 (0.08) 0.21 0.12 0.04
AUDITOR INDEPENDENCE AND NON-AUDIT SERVICESNo fees were paid to HLB Mann Judd in respect of non-audit services during the year.
AUDITOR’S INDEPENDENCE DECLARATION TO THE DIRECTORS OF CVC LIMITEDA copy of the Independence Declaration given to the Directors by the lead auditor for the audit undertaken by HLB Mann Judd is included on page 18.
This Directors’ Report is signed in accordance with a resolution of the Board of Directors.
Dated at Sydney 30 August 2016.
ALEXANDER BEARD JOHN READDirector Director
For
per
sona
l use
onl
y
C V C L I M I T E D A N D I T ’ S C O N T R O L L E D E N T I T I E S18
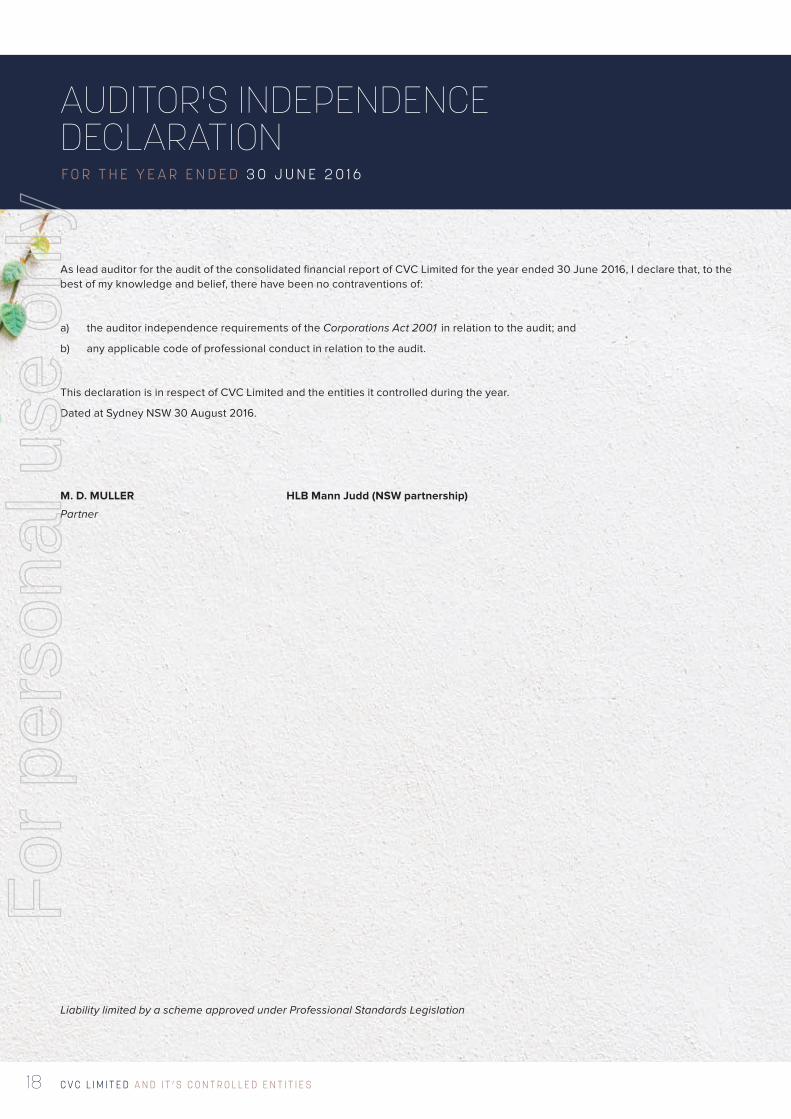
AUDITOR'S INDEPENDENCE DECLARATIONF O R T H E Y E A R E N D E D 3 0 J U N E 2 0 1 6
As lead auditor for the audit of the consolidated financial report of CVC Limited for the year ended 30 June 2016, I declare that, to the best of my knowledge and belief, there have been no contraventions of:
a) the auditor independence requirements of the Corporations Act 2001 in relation to the audit; and
b) any applicable code of professional conduct in relation to the audit.
This declaration is in respect of CVC Limited and the entities it controlled during the year.
Dated at Sydney NSW 30 August 2016.
M. D. MULLER HLB Mann Judd (NSW partnership)
Partner
Liability limited by a scheme approved under Professional Standards Legislation
For
per
sona
l use
onl
y
19A N N U A L R E P O R T | 2016
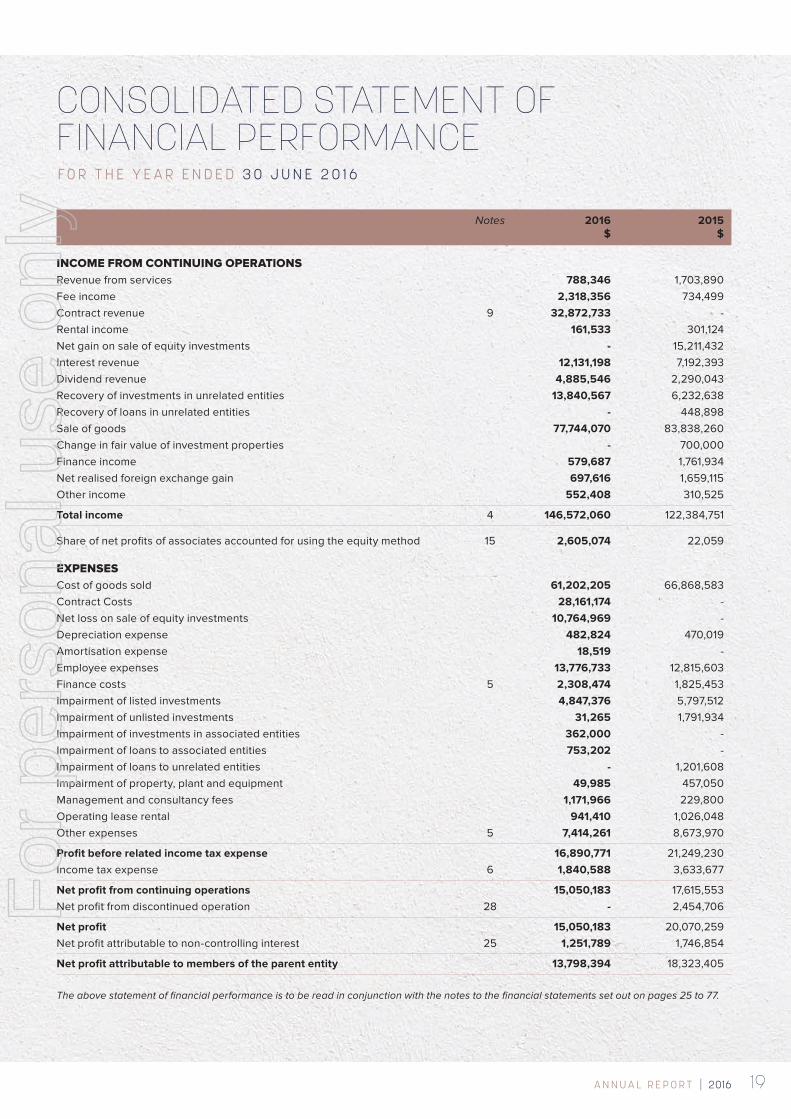
CONSOLIDATED STATEMENT OF FINANCIAL PERFORMANCEF O R T H E Y E A R E N D E D 3 0 J U N E 2 0 1 6
Notes 2016 2015 $ $
INCOME FROM CONTINUING OPERATIONS Revenue from services 788,346 1,703,890Fee income 2,318,356 734,499Contract revenue 9 32,872,733 -Rental income 161,533 301,124Net gain on sale of equity investments - 15,211,432Interest revenue 12,131,198 7,192,393Dividend revenue 4,885,546 2,290,043Recovery of investments in unrelated entities 13,840,567 6,232,638Recovery of loans in unrelated entities - 448,898Sale of goods 77,744,070 83,838,260Change in fair value of investment properties - 700,000Finance income 579,687 1,761,934Net realised foreign exchange gain 697,616 1,659,115Other income 552,408 310,525
Total income 4 146,572,060 122,384,751
Share of net profits of associates accounted for using the equity method 15 2,605,074 22,059
EXPENSES Cost of goods sold 61,202,205 66,868,583Contract Costs 28,161,174 -Net loss on sale of equity investments 10,764,969 -Depreciation expense 482,824 470,019Amortisation expense 18,519 -Employee expenses 13,776,733 12,815,603Finance costs 5 2,308,474 1,825,453Impairment of listed investments 4,847,376 5,797,512Impairment of unlisted investments 31,265 1,791,934Impairment of investments in associated entities 362,000 -Impairment of loans to associated entities 753,202 -Impairment of loans to unrelated entities - 1,201,608Impairment of property, plant and equipment 49,985 457,050Management and consultancy fees 1,171,966 229,800Operating lease rental 941,410 1,026,048Other expenses 5 7,414,261 8,673,970
Profit before related income tax expense 16,890,771 21,249,230Income tax expense 6 1,840,588 3,633,677
Net profit from continuing operations 15,050,183 17,615,553Net profit from discontinued operation 28 - 2,454,706
Net profit 15,050,183 20,070,259Net profit attributable to non-controlling interest 25 1,251,789 1,746,854
Net profit attributable to members of the parent entity 13,798,394 18,323,405
The above statement of financial performance is to be read in conjunction with the notes to the financial statements set out on pages 25 to 77.
For
per
sona
l use
onl
y
C V C L I M I T E D A N D I T ’ S C O N T R O L L E D E N T I T I E S20
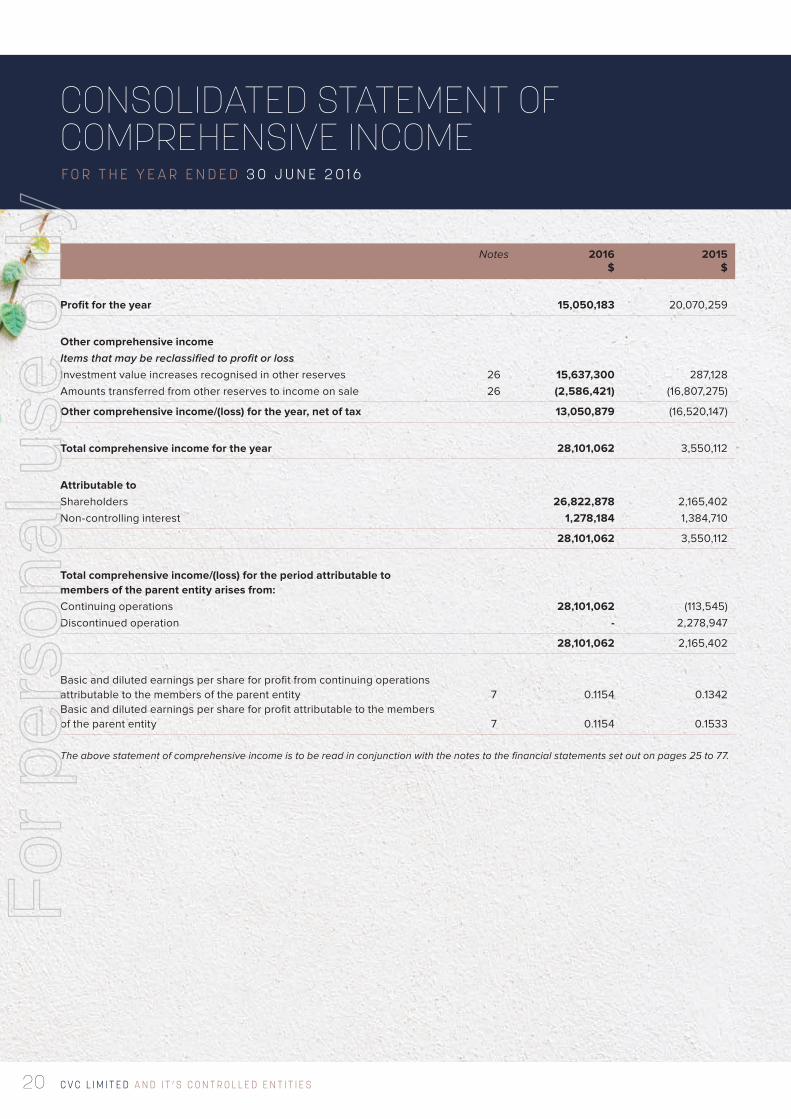
CONSOLIDATED STATEMENT OF COMPREHENSIVE INCOMEF O R T H E Y E A R E N D E D 3 0 J U N E 2 0 1 6
Notes 2016 2015 $ $
Profit for the year 15,050,183 20,070,259
Other comprehensive income Items that may be reclassified to profit or loss Investment value increases recognised in other reserves 26 15,637,300 287,128Amounts transferred from other reserves to income on sale 26 (2,586,421) (16,807,275)
Other comprehensive income/(loss) for the year, net of tax 13,050,879 (16,520,147)
Total comprehensive income for the year 28,101,062 3,550,112
Attributable to Shareholders 26,822,878 2,165,402Non-controlling interest 1,278,184 1,384,710
28,101,062 3,550,112
Total comprehensive income/(loss) for the period attributable to members of the parent entity arises from: Continuing operations 28,101,062 (113,545)Discontinued operation - 2,278,947
28,101,062 2,165,402
Basic and diluted earnings per share for profit from continuing operations attributable to the members of the parent entity 7 0.1154 0.1342Basic and diluted earnings per share for profit attributable to the members of the parent entity 7 0.1154 0.1533
The above statement of comprehensive income is to be read in conjunction with the notes to the financial statements set out on pages 25 to 77.
For
per
sona
l use
onl
y
21A N N U A L R E P O R T | 2016
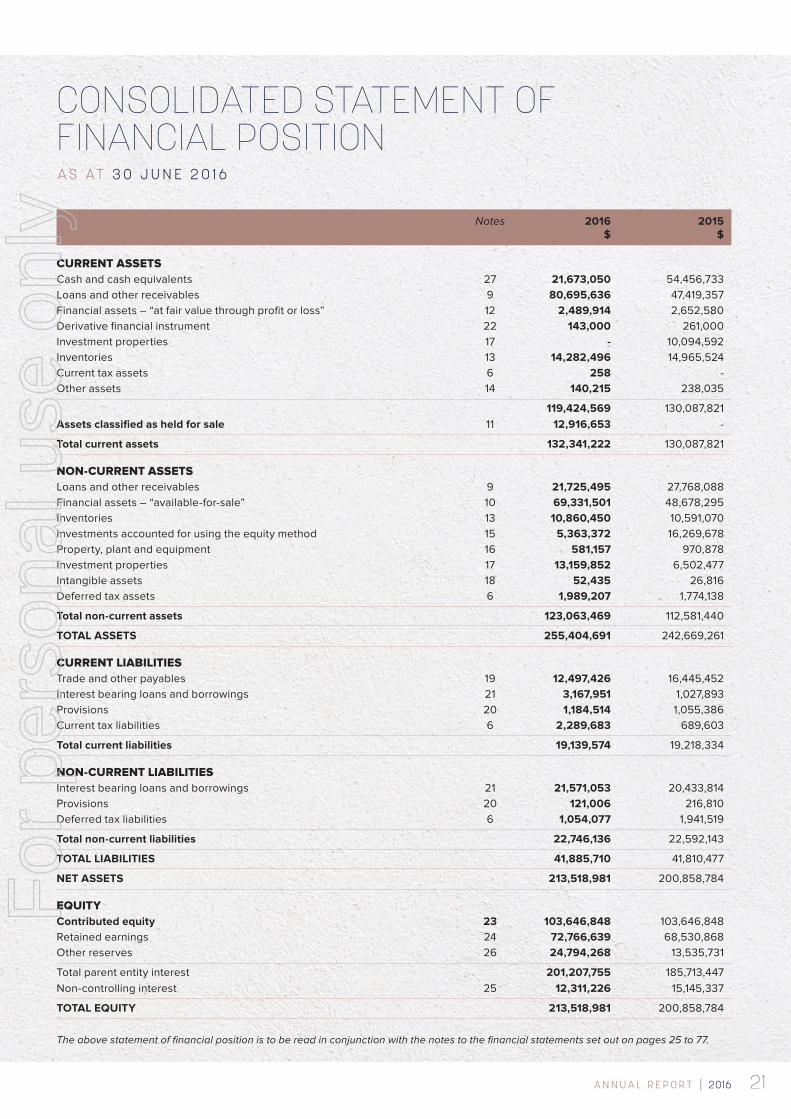
CONSOLIDATED STATEMENT OF FINANCIAL POSITIONA S A T 3 0 J U N E 2 0 1 6
Notes 2016 2015 $ $
CURRENT ASSETS Cash and cash equivalents 27 21,673,050 54,456,733Loans and other receivables 9 80,695,636 47,419,357Financial assets – “at fair value through profit or loss” 12 2,489,914 2,652,580Derivative financial instrument 22 143,000 261,000Investment properties 17 - 10,094,592Inventories 13 14,282,496 14,965,524Current tax assets 6 258 -Other assets 14 140,215 238,035
119,424,569 130,087,821Assets classified as held for sale 11 12,916,653 -
Total current assets 132,341,222 130,087,821
NON-CURRENT ASSETS Loans and other receivables 9 21,725,495 27,768,088Financial assets – “available-for-sale” 10 69,331,501 48,678,295Inventories 13 10,860,450 10,591,070Investments accounted for using the equity method 15 5,363,372 16,269,678Property, plant and equipment 16 581,157 970,878Investment properties 17 13,159,852 6,502,477Intangible assets 18 52,435 26,816Deferred tax assets 6 1,989,207 1,774,138
Total non-current assets 123,063,469 112,581,440
TOTAL ASSETS 255,404,691 242,669,261
CURRENT LIABILITIES Trade and other payables 19 12,497,426 16,445,452Interest bearing loans and borrowings 21 3,167,951 1,027,893Provisions 20 1,184,514 1,055,386Current tax liabilities 6 2,289,683 689,603
Total current liabilities 19,139,574 19,218,334
NON-CURRENT LIABILITIES Interest bearing loans and borrowings 21 21,571,053 20,433,814Provisions 20 121,006 216,810Deferred tax liabilities 6 1,054,077 1,941,519
Total non-current liabilities 22,746,136 22,592,143
TOTAL LIABILITIES 41,885,710 41,810,477
NET ASSETS 213,518,981 200,858,784
EQUITY Contributed equity 23 103,646,848 103,646,848Retained earnings 24 72,766,639 68,530,868Other reserves 26 24,794,268 13,535,731
Total parent entity interest 201,207,755 185,713,447Non-controlling interest 25 12,311,226 15,145,337
TOTAL EQUITY 213,518,981 200,858,784
The above statement of financial position is to be read in conjunction with the notes to the financial statements set out on pages 25 to 77.
For
per
sona
l use
onl
y
C V C L I M I T E D A N D I T ’ S C O N T R O L L E D E N T I T I E S22
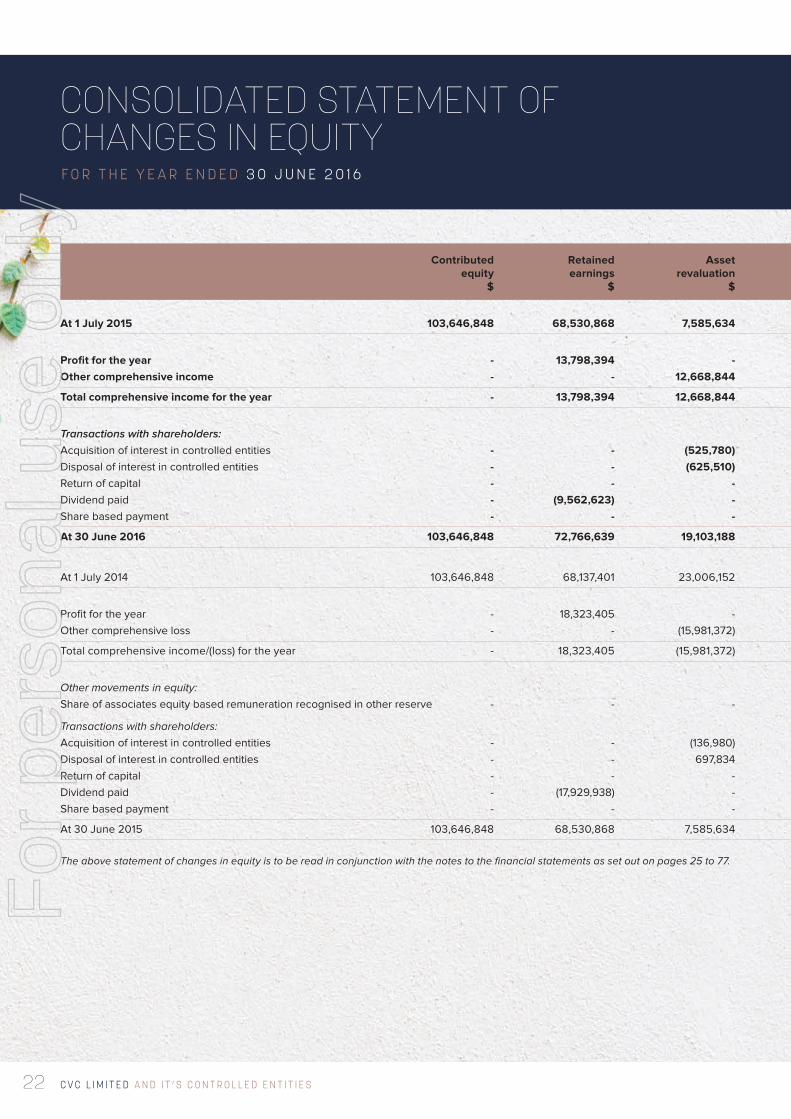
CONSOLIDATED STATEMENT OF CHANGES IN EQUITYF O R T H E Y E A R E N D E D 3 0 J U N E 2 0 1 6
Contributed Retained Asset Employee Foreign exchange Owners of the Non-controlling equity earnings revaluation equity benefit translation parent interest Total $ $ $ $ $ $ $ $
At 1 July 2015 103,646,848 68,530,868 7,585,634 5,981,880 (31,783) 185,713,447 15,145,337 200,858,784
Profit for the year - 13,798,394 - - - 13,798,394 1,251,789 15,050,183Other comprehensive income - - 12,668,844 - 355,640 13,024,484 26,395 13,050,879
Total comprehensive income for the year - 13,798,394 12,668,844 - 355,640 26,822,878 1,278,184 28,101,062
Transactions with shareholders: Acquisition of interest in controlled entities - - (525,780) - - (525,780) (4,461,055) (4,986,835)Disposal of interest in controlled entities - - (625,510) - - (625,510) 1,750,727 1,125,217Return of capital - - - - - - (500,000) (500,000) Dividend paid - (9,562,623) - - - (9,562,623) (1,195,336) (10,757,959)Share based payment - - - (614,657) - (614,657) 293,369 (321,288)
At 30 June 2016 103,646,848 72,766,639 19,103,188 5,367,223 323,857 201,207,755 12,311,226 213,518,981
At 1 July 2014 103,646,848 68,137,401 23,006,152 235,388 112,140 195,137,929 17,825,232 212,963,161
Profit for the year - 18,323,405 - - - 18,323,405 1,746,854 20,070,259Other comprehensive loss - - (15,981,372) (32,708) (143,923) (16,158,003) (362,144) (16,520,147)
Total comprehensive income/(loss) for the year - 18,323,405 (15,981,372) (32,708) (143,923) 2,165,402 1,384,710 3,550,112
Other movements in equity: Share of associates equity based remuneration recognised in other reserve - - - 5,631,945 - 5,631,945 - 5,631,945
Transactions with shareholders: Acquisition of interest in controlled entities - - (136,980) - - (136,980) (722,412) (859,392)Disposal of interest in controlled entities - - 697,834 - - 697,834 (1,383,779) (685,945)Return of capital - - - - - - (801,304) (801,304) Dividend paid - (17,929,938) - - - (17,929,938) (1,263,336) (19,193,274)Share based payment - - - 147,255 - 147,255 106,226 253,481
At 30 June 2015 103,646,848 68,530,868 7,585,634 5,981,880 (31,783) 185,713,447 15,145,337 200,858,784
The above statement of changes in equity is to be read in conjunction with the notes to the financial statements as set out on pages 25 to 77.
For
per
sona
l use
onl
y
23A N N U A L R E P O R T | 2016
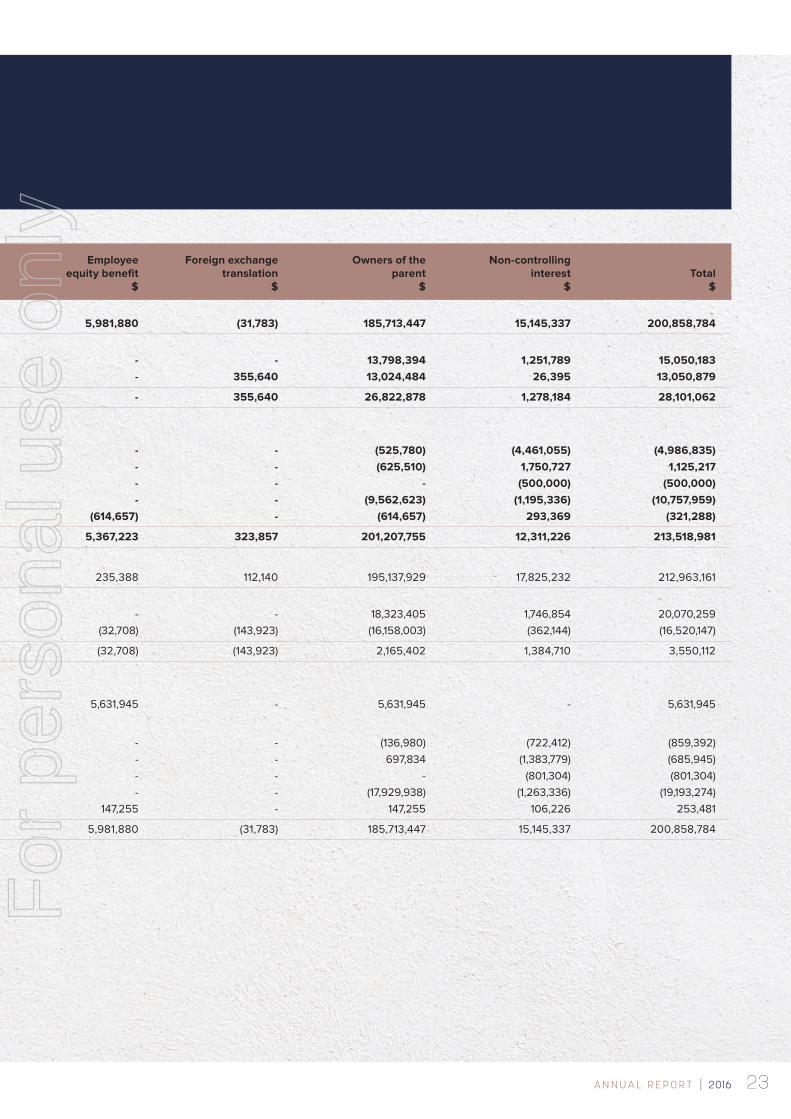
Contributed Retained Asset Employee Foreign exchange Owners of the Non-controlling equity earnings revaluation equity benefit translation parent interest Total $ $ $ $ $ $ $ $
At 1 July 2015 103,646,848 68,530,868 7,585,634 5,981,880 (31,783) 185,713,447 15,145,337 200,858,784
Profit for the year - 13,798,394 - - - 13,798,394 1,251,789 15,050,183Other comprehensive income - - 12,668,844 - 355,640 13,024,484 26,395 13,050,879
Total comprehensive income for the year - 13,798,394 12,668,844 - 355,640 26,822,878 1,278,184 28,101,062
Transactions with shareholders: Acquisition of interest in controlled entities - - (525,780) - - (525,780) (4,461,055) (4,986,835)Disposal of interest in controlled entities - - (625,510) - - (625,510) 1,750,727 1,125,217Return of capital - - - - - - (500,000) (500,000) Dividend paid - (9,562,623) - - - (9,562,623) (1,195,336) (10,757,959)Share based payment - - - (614,657) - (614,657) 293,369 (321,288)
At 30 June 2016 103,646,848 72,766,639 19,103,188 5,367,223 323,857 201,207,755 12,311,226 213,518,981
At 1 July 2014 103,646,848 68,137,401 23,006,152 235,388 112,140 195,137,929 17,825,232 212,963,161
Profit for the year - 18,323,405 - - - 18,323,405 1,746,854 20,070,259Other comprehensive loss - - (15,981,372) (32,708) (143,923) (16,158,003) (362,144) (16,520,147)
Total comprehensive income/(loss) for the year - 18,323,405 (15,981,372) (32,708) (143,923) 2,165,402 1,384,710 3,550,112
Other movements in equity: Share of associates equity based remuneration recognised in other reserve - - - 5,631,945 - 5,631,945 - 5,631,945
Transactions with shareholders: Acquisition of interest in controlled entities - - (136,980) - - (136,980) (722,412) (859,392)Disposal of interest in controlled entities - - 697,834 - - 697,834 (1,383,779) (685,945)Return of capital - - - - - - (801,304) (801,304) Dividend paid - (17,929,938) - - - (17,929,938) (1,263,336) (19,193,274)Share based payment - - - 147,255 - 147,255 106,226 253,481
At 30 June 2015 103,646,848 68,530,868 7,585,634 5,981,880 (31,783) 185,713,447 15,145,337 200,858,784
The above statement of changes in equity is to be read in conjunction with the notes to the financial statements as set out on pages 25 to 77.
For
per
sona
l use
onl
y
C V C L I M I T E D A N D I T ’ S C O N T R O L L E D E N T I T I E S24
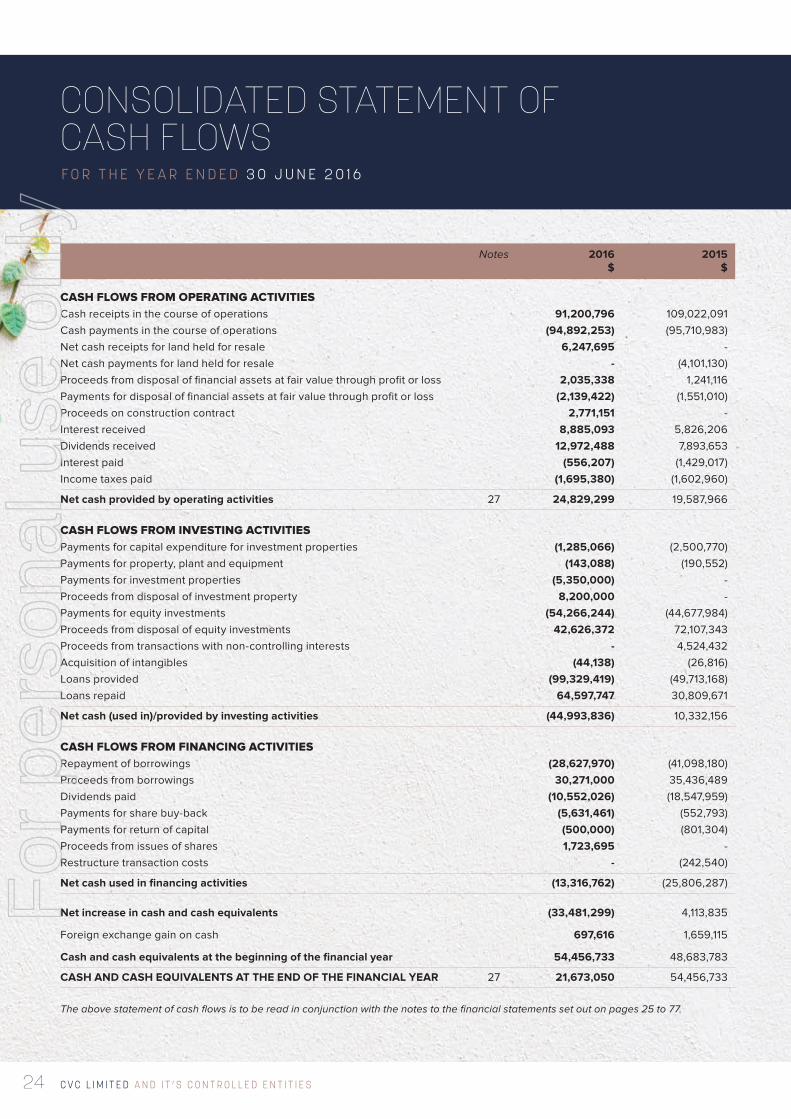
CONSOLIDATED STATEMENT OF CASH FLOWSF O R T H E Y E A R E N D E D 3 0 J U N E 2 0 1 6
Notes 2016 2015 $ $
CASH FLOWS FROM OPERATING ACTIVITIES Cash receipts in the course of operations 91,200,796 109,022,091Cash payments in the course of operations (94,892,253) (95,710,983)Net cash receipts for land held for resale 6,247,695 -Net cash payments for land held for resale - (4,101,130) Proceeds from disposal of financial assets at fair value through profit or loss 2,035,338 1,241,116Payments for disposal of financial assets at fair value through profit or loss (2,139,422) (1,551,010)Proceeds on construction contract 2,771,151 -Interest received 8,885,093 5,826,206Dividends received 12,972,488 7,893,653Interest paid (556,207) (1,429,017)Income taxes paid (1,695,380) (1,602,960)
Net cash provided by operating activities 27 24,829,299 19,587,966 CASH FLOWS FROM INVESTING ACTIVITIES Payments for capital expenditure for investment properties (1,285,066) (2,500,770)Payments for property, plant and equipment (143,088) (190,552)Payments for investment properties (5,350,000) -Proceeds from disposal of investment property 8,200,000 -Payments for equity investments (54,266,244) (44,677,984)Proceeds from disposal of equity investments 42,626,372 72,107,343Proceeds from transactions with non-controlling interests - 4,524,432Acquisition of intangibles (44,138) (26,816)Loans provided (99,329,419) (49,713,168)Loans repaid 64,597,747 30,809,671
Net cash (used in)/provided by investing activities (44,993,836) 10,332,156 CASH FLOWS FROM FINANCING ACTIVITIES Repayment of borrowings (28,627,970) (41,098,180)Proceeds from borrowings 30,271,000 35,436,489Dividends paid (10,552,026) (18,547,959)Payments for share buy-back (5,631,461) (552,793)Payments for return of capital (500,000) (801,304)Proceeds from issues of shares 1,723,695 -Restructure transaction costs - (242,540)
Net cash used in financing activities (13,316,762) (25,806,287)
Net increase in cash and cash equivalents (33,481,299) 4,113,835
Foreign exchange gain on cash 697,616 1,659,115
Cash and cash equivalents at the beginning of the financial year 54,456,733 48,683,783
CASH AND CASH EQUIVALENTS AT THE END OF THE FINANCIAL YEAR 27 21,673,050 54,456,733
The above statement of cash flows is to be read in conjunction with the notes to the financial statements set out on pages 25 to 77.
For
per
sona
l use
onl
y
25A N N U A L R E P O R T | 2016
NOTES TO THE FINANCIAL STATEMENTSF O R T H E Y E A R E N D E D 3 0 J U N E 2 0 1 6
NOTE 1: STATEMENT OF ACCOUNTING POLICIES
The significant policies which have been adopted in the preparation of this Financial Report are:
1.1 Basis of PreparationThe financial report is a general-purpose financial report, which has been prepared in accordance with the requirements of the Corporations Act 2001 and Australian Accounting Standards. The financial report has also been prepared on a historical cost basis, except for “available-for-sale” and “at fair value through profit or loss” investments and investment properties which have been measured at fair value.
These accounting policies have been consistently applied by each entity in CVC and, except where a change in accounting policy is indicated, are consistent with those of the previous year. Management is required to make judgements, estimates and assumptions in relation to the carrying value of assets and liabilities that have significant risk of material adjustments in the next year and these have been disclosed in the relevant notes to the financial statements.
Critical accounting estimatesThe preparation of financial statements in conformity with Australian Accounting Standards requires the use of certain critical accounting estimates. It also requires management to exercise its judgement in the process of applying CVC’s accounting policies. The areas involving a higher degree of judgement or complexity, or areas where assumptions and estimates are significant to the financial statements are disclosed in note 36.
1.2 Statement of ComplianceThe financial report complies with Australian Accounting Standards, which include the Australian Accounting Interpretations. The financial report also complies with International Financial Reporting Standards (IFRS).
There are no standards, interpretations or amendments to existing standards that are effective for the first time for the financial year commencing 1 July that have a material impact on CVC.
Certain new accounting standards and interpretations have been published that are not mandatory for the 30 June 2016 reporting period:
(i) AASB 9 Financial Instruments AASB 9 Financial Instruments was released in December 2014 and is mandatory for periods beginning on or after 1 January 2018. The Standard addresses the classification, measurement and derecognition of financial assets and financial liabilities, introduces new rules for hedge accounting and a new impairment model for financial assets.
Note1. Statement of Accounting Policies .............................................. 25
2. Controlled Entities .......................................................................... 32
3. Parent Company Information .......................................................37
4. Income ................................................................................................ 39
5. Profit Before Income Tax Expense ............................................. 39
6. Income Tax ........................................................................................ 40
7. Earnings Per Share ......................................................................... 42
8. Dividends............................................................................................43
9. Loans and Other Receivables ......................................................43
10. Financial Assets – “Available-for-Sale” .................................... 45
11. Assets Classified as Held for Sale ............................................. 45
12. Financial assets – “At Fair Value Through Profit or Loss” ... 46
13. Inventories ......................................................................................... 46
14. Other Assets ..................................................................................... 46
15. Investments Accounted for Using the Equity Method ......... 46
16. Property, Plant and Equipment .................................................... 51
17. Investment Properties ................................................................... 52
18. Intangible Assets ............................................................................ 53
19. Trade and Other Payables............................................................ 53
20. Provisions .......................................................................................... 54
21. Interest Bearing Loans and Borrowings ................................... 54
22. Derivative Financial Instruments ................................................ 54
23. Contributed Equity.......................................................................... 55
24. Retained Earnings ........................................................................... 55
25. Non-Controlling Interest ............................................................... 55
26. Other Reserves ................................................................................ 56
27. Notes to Statement of Cash Flows .............................................57
28. Discontinued Operation ................................................................ 58
29. Auditors’ Remuneration ................................................................ 59
30. Commitments and Contingencies ............................................. 60
31. Segment Information ...................................................................... 61
32. Related Party Information ............................................................. 64
33. Additional Financial Instruments Disclosure ...........................70
34. Fair Value Measurements ..............................................................74
35. Events Subsequent to Year End ..................................................76
36. Critical Accounting Estimates and Judgements .....................76
CONTENTS
For
per
sona
l use
onl
y
C V C L I M I T E D A N D I T ’ S C O N T R O L L E D E N T I T I E S26
Subsequent to initial recognition:
– Right-of-use assets are accounted for on a similar basis to non-financial assets, whereby the right-of-use asset is accounted for in accordance with a cost model unless the underlying asset is accounted for on a revaluation basis; and
– Lease liabilities are accounted for on a similar basis as other financial liabilities, whereby interest expense is recognised in respect of the liability and the carrying amount of the liability is reduced to reflect lease payments made.
Although the directors anticipate that the adoption of AASB 16 may have an impact on CVC’s accounting for operating leases, it is impracticable at this stage to provide a reasonable estimate of such impact.
1.3 Principles of ConsolidationControlled entitiesThe consolidated financial statements comprise the financial statements of CVC Limited (the “Company”) and its subsidiaries during the year ended 30 June 2016 (“CVC”). The financial statements of controlled entities are included in the results only from the date control commences until the date control ceases and include those entities over which CVC has the power to govern the financial and operating policies so as to obtain benefits from their activities.
In preparing the consolidated financial statements, all intercompany balances and transactions, income and expenses and profits and losses resulting from intra-group transactions have been eliminated in full and the reporting period and accounting policies of subsidiaries are consistent with those of the parent entity.
The acquisition of subsidiaries is accounted for using the purchase method of accounting which allocates the cost of the business combination to the fair value of the assets acquired and the liabilities assumed at the date of acquisition.
Non-controlling interests not held by CVC are allocated their share of net profit after tax in the statement of comprehensive income and are presented within equity in the consolidated statement of financial position, separately from parent shareholders’ equity. Increases in investments in existing controlled entities are recognised by CVC in equity with no impact on goodwill and the statement of financial performance. The difference between the consideration paid by CVC and the carrying amount of non-controlling interest has been included in asset revaluation reserve.
AssociatesAssociates are those entities, other than partnerships, over which CVC exercises significant influence but not control. In the consolidated financial statements investments in associates are accounted for using equity accounting principles. The equity accounted investments are not recorded at a value in excess of CVC’s share of the associates net assets at the date significant influence commences, with the exception of CVC’s share of the associates future profits. Investments in associates are carried
CVC has yet to undertake a detailed assessment of the classification and measurement of financial assets. The financial assets held by the group include:
– Equity instruments currently classified as “available-for-sale” for which a fair value through other comprehensive income election is available;
– Equity instruments currently measured “at fair value through profit or loss” which would likely continue to be measured on the same basis under the standard;
– Loans and receivables currently measured at amortised cost using the effective interest rate method which would likely continue to be measured on the same basis under the standard.
Accordingly CVC does not expect the new guidance to have a significant impact on the classification and measurement of its financial assets.
The new impairment model requires the recognition of impairment provisions based on expected credit losses rather than only incurred credit losses as is the case under AASB 139. While CVC has not yet undertaken a detailed assessment of how its impairment provisions would be affected by the new model, it may result in an earlier recognition of credit losses.
The new standard also introduces expanded disclosure requirements and changes in presentation. These are expected to change the nature and extent of CVC’s disclosures about its financial instruments particularly in the year of the adoption of the new standard.
(ii) AASB 15 Revenue from contracts with customers AASB 15 Revenue from contracts with customers was released in October 2015 and is mandatory for periods beginning on or after 1 January 2018. The standard is based on the principle that revenue is recognised when control of a good or service transfers to a customer – so the notion of control replaces the existing notion of risks and rewards. CVC does not expect the new standard to have any material impact on the timing of recognition of its revenues in the initial period of application.
(iii) AASB 16 Leases AASB 16 Leases was released in February 2016 and is mandatory for periods beginning on or after 1 January 2019. The new standard introduces a single lessee accounting model that will require a lessee to recognise right-of-use assets and lease liabilities for all leases with a term of more than 12 months, unless the underlying asset is of low value. Right-of-use assets are initially measured at their cost and lease liabilities are initially measured on a present value basis.
NOTES TO THE FINANCIAL STATEMENTSF O R T H E Y E A R E N D E D 3 0 J U N E 2 0 1 6
NOTE 1: STATEMENT OF ACCOUNTING POLICIES (CONT.)
1.2 Statement of Compliance (cont.)
For
per
sona
l use
onl
y
27A N N U A L R E P O R T | 2016
1.6 Income Tax and Other TaxesCurrent tax assets and liabilities for the current and prior periods are measured at the amount expected to be recovered from or paid to the taxation authorities on the current period’s taxable income at the tax rates enacted by the reporting date. Deferred income tax assets and liabilities are measured at the tax rates that are expected to apply to the year when the asset is realised or the liability is settled, based on tax rates (and tax laws) that have been enacted or substantively enacted at the reporting date.
Deferred income tax is provided on all temporary differences at the reporting date between the tax bases of assets and liabilities and their carrying amounts for financial reporting purposes. Deferred income tax assets are recognised for all deductible temporary differences, carry-forward of unused tax credits and unused tax losses, to the extent that it is probable that taxable profits will be available against which deductible temporary differences and the carry-forward of unused tax credits can be utilised. Unrecognised deferred income tax assets are reassessed at each reporting date and are recognised to the extent that it has become probable that future taxable profit will allow the deferred tax asset to be recovered.
The carrying amount of deferred income tax assets is reviewed at each reporting date and reduced to the extent that it is no longer probable that sufficient taxable profit will be available to allow all or part of the deferred income tax asset to be utilised.
Deferred tax assets and deferred tax liabilities are offset only if a legally enforceable right exists to set off current tax assets against current tax liabilities and the deferred tax assets and liabilities relate to the same taxable entity and the same taxation authority.
Income taxes relating to items recognised directly in equity are recognised in equity and not in profit.
Tax consolidation legislationThe controlled entities of the Company implemented the tax consolidation legislation as at 30 June 2003. The entities in the consolidated group continue to account for their own current and deferred tax amounts. CVC has applied the “stand-alone taxpayer” approach in determining the appropriate amount of current taxes and deferred taxes to be allocated to members of the tax consolidated group. The Company recognises the current tax liabilities (or assets) from controlled entities in the tax consolidated group. To the extent that it is probable that sufficient taxable profit will be available to allow all or part of the deferred income tax asset to be utilised the Company recognises the deferred tax assets from unused tax losses and unused tax credits assumed from controlled entities in the tax consolidated group.
at the lower of the equity accounted amount and recoverable amount. CVC’s equity accounted share of the associates' net profit or loss is recognised in the consolidated statement of comprehensive income from the date significant influence commences until the date significant influence ceases. CVC’s equity accounted share of movements in retained profits from changes in accounting policies by associates is recognised directly in consolidated retained earnings (note 24). CVC’s equity accounted share of other movements in reserves of associates is recognised directly in consolidated reserves.
Parent entity informationThe financial information of the Company is disclosed in note 3 and has been prepared on the same basis as the consolidated financial statements with the exception of investments in associates and controlled entities which are accounted for as “available-for-sale” investments.
Joint venturesCVC’s interests in joint venture partnerships are accounted for using equity accounting principles. Investments in joint venture partnerships are carried at the lower of the equity accounted amount and recoverable amount. CVC's equity accounted share of the joint venture partnerships’ net profit or loss is recognised in the consolidated statement of comprehensive income from the date joint control commences to the date joint control ceases. CVC’s share of other movements in reserves is recognised directly in consolidated reserves.
GoodwillGoodwill is considered to have an indefinite life and represents the excess of the purchase consideration over the fair value of identifiable net assets acquired at the time of acquisition of a business or shares in a controlled entity. Following initial recognition goodwill is measured at cost less any accumulated impairment losses. Goodwill is not amortised.
1.4 ImpairmentIntangible assets that have an indefinite useful life are not subject to amortisation and are tested annually for impairment or more frequently if events or changes in circumstances indicate that they might be impaired. Other assets are tested for impairment whenever events or changes in circumstances indicate that the carrying amount may not be recoverable. An impairment loss is recognised for the amount by which the asset’s carrying amount exceeds its recoverable amount. Non-financial assets other than goodwill that suffered impairment are tested for possible reversal of the impairment whenever events or changes in circumstances indicate that the impairment may have reversed.
1.5 InvestmentsSet-off of financial assets and liabilitiesFor investments with direct associated debt, the financial assets and liabilities are reflected on a net basis where this reflects a right, and an intention, to set-off the expected future cash flows from settling those assets and liabilities.
For
per
sona
l use
onl
y
C V C L I M I T E D A N D I T ’ S C O N T R O L L E D E N T I T I E S28
which reflect market conditions at the reporting date. Gains or losses arising from changes in the fair value of investment properties are recognised in the statement of financial performance in the year in which they arise.
Leased plant and equipmentLease of plant and equipment under which the Company or its controlled entities assume substantially all the risks and benefits of ownership are classified as finance leases. Other leases are classified as operating leases.
Finance leases are capitalised. A lease asset and a liability equal to the present value of the minimum lease payments are recorded at the inception of the lease. Lease liabilities are reduced by repayments of principal. The interest components of the lease payments are charged to the profit or loss. Contingent rentals are expensed as incurred.
Payments made under operating leases are charged against profits in equal instalments over the accounting periods covered by the lease term, except where an alternative basis is more representative of the pattern of benefits to be derived from the leased property.
Depreciation and amortisationProperty, plant and equipment are depreciated/amortised using the straight line and diminishing value methods over the estimated useful lives, with the exception of finance lease assets. Finance lease assets are amortised over the term of the relevant lease, or where it is likely CVC will obtain ownership of the asset, the life of the asset. Depreciation and amortisation rates and methods are reviewed annually for appropriateness. When changes are made, adjustments are reflected prospectively in current and future periods only.
The current depreciation rates for each class of assets are as follows:
Plant and equipment 5% to 50%
Leased assets 15% to 25%
Leasehold improvements 2.5% to 30%
The carrying values of plant and equipment are reviewed for impairment at each reporting date, with recoverable amounts being estimated when events or changes in circumstances indicate that the carrying value may be impaired.
1.11 InventoriesInventories are measured at the lower of cost and net realisable value. Cost is calculated using the average cost method and includes direct and allocated costs incurred in acquiring the inventories and bringing them to their present location and condition. Provision is recognised when there is objective evidence that the consolidated entity will not be able to sell the inventory at normal reseller pricing.
Net realisable value is the estimated selling price in the ordinary course of business, less estimated costs of completion and the estimated costs necessary to make the sale.
Goods and Services TaxRevenues, expenses and assets are recognised net of the amount of Goods and Services Tax (GST), except:
– when the GST incurred on a purchase of goods and services is not recoverable from the taxation authority, in which case the GST is recognised as part of the cost of acquisition of the asset or as part of an item of the expense item as applicable; and
– receivables and payables, which are stated with the amount of GST included.
The net amount of GST recoverable from, or payable to, the taxation authority is included as part of receivables or payables in the statement of financial position.
Cash flows are included in the statement of cash flows on a gross basis and the GST component of cash flows arising from investing and financing activities which are recoverable from, or payable to, the taxation authority are classified as operating cash flows.
1.7 Cash and Cash EquivalentsFor the statement of cash flows, cash includes cash on hand and short-term deposits with an original maturity of three months or less.
1.8 Trade and Other Payables Trade payables and other payables are carried at amortised cost and represent liabilities for goods and services provided to CVC prior to the end of the financial year that are unpaid and arise when CVC becomes obliged to make future payments in respect of the purchase of these goods and services. Trade payables are non-interest bearing and are normally settled on average between 30 - 45 day terms.
1.9 Trade and Other Receivables Trade and other receivables, which generally have 30 - 120 day terms, are stated at their amortised cost less impairment losses. Individual debts that are known to be uncollectible are written off when identified. An impairment provision is recognised when there is objective evidence that CVC will not be able to collect the receivable.
1.10 Property, Plant and Equipment AcquisitionItems of property, plant and equipment are recorded at cost and depreciated as outlined below.
Investment propertiesInvestment properties are initially measured at cost, including transaction costs. Investment properties are stated at fair value,
NOTES TO THE FINANCIAL STATEMENTSF O R T H E Y E A R E N D E D 3 0 J U N E 2 0 1 6
NOTE 1: STATEMENT OF ACCOUNTING POLICIES (CONT.)
1.6 Income Tax and Other Taxes (cont.)
For
per
sona
l use
onl
y
29A N N U A L R E P O R T | 2016
“Available-for-sale” investments“Available-for-sale” investments are those non-derivative financial assets that are designated as “available-for-sale” or are not classified as any of the two preceding categories. After initial recognition “available-for-sale” investments are measured at fair value with gains or losses being recognised as separate components of equity until the investment is derecognised or until the investment is determined to be impaired, at which time the cumulative gain or loss previously reported in equity is recognised in the consolidated statement of financial performance.
The fair value of investments that are actively traded in organised financial markets is determined by reference to quoted market bid prices at the close of business on the reporting date. For investments with no active market, fair value is determined using valuation techniques. Such techniques include using recent arm’s length market transactions; net asset backing; reference to the current market value of another instrument that is substantially the same and discounted cash flow analysis.
All other non-current investments are carried at the lower of cost and recoverable amount.
CVC assesses at each reporting date whether there is objective evidence that a financial asset or group of financial assets is impaired. In the case of equity securities classified as “available-for-sale”, a significant or prolonged decline in the fair value of a security below its cost is considered as an indicator that the securities are impaired. If any such evidence exists for “available-for-sale” financial assets, the cumulative loss – measured as the difference between the acquisition cost and the current fair value, less any impairment loss on that financial asset previously recognised in the statement of comprehensive income – is removed from equity and recognised in the statement of comprehensive income. Impairment losses recognised in the consolidated statement of financial performance on equity instruments classified as “available-for-sale” are not reversed through the consolidated statement of financial performance.
1.14 Intangible Assets(i) GoodwillGoodwill on acquisition of subsidiaries is included in intangible assets. Following initial recognition, goodwill is measured at cost less any accumulated impairment losses.
(ii) Other intangible assetsOther intangible assets are initially recorded at cost. Following initial recognition, other intangible assets are carried at cost less any accumulated amortisation and any accumulated impairment losses.
1.15 Interest-Bearing Loans and BorrowingsAll loans and borrowings are initially recognised at the fair value of the consideration received less directly attributable transaction costs.
1.12 Non-current assets (or disposal groups) held for sale and discontinued operations
Non-current assets (or disposal groups) are classified as held for sale if their carrying amounts will be recovered through a sale transaction rather than through continuing use and a sale is considered highly probable. They are measured at the lower of their carrying amount and fair value less costs to sell.
A discontinued operation is a component of the entity that has been disposed of or is classified as held for sale and that represents a separate major line of business or geographical area of operations, is part of a single co-ordinated plan to dispose of such a line of business or area of operations, or is a subsidiary acquired exclusively with a view to resale. The results of discontinued operations are presented separately in the statement of profit or loss.
1.13 Investments and Other Financial AssetsFinancial assets in the scope of AASB 139 Financial Instruments: Recognition and Measurement are classified as either “financial assets at fair value through profit or loss”, “loans and receivables”, “held-to-maturity investments”, or “available-for-sale” investments, as appropriate. When financial assets are recognised initially, they are measured at fair value, plus, in the case of investments not at fair value through profit or loss, transaction costs. CVC determines the classification of its financial assets after initial recognition and, when allowed and appropriate, re-evaluates this designation at each financial year-end.
All regular way purchases and sales of financial assets are recognised on the trade date i.e. the date that CVC commits to purchase the asset. Regular way purchases or sales are purchases or sales of financial assets under contracts that require delivery of the assets within the period established generally by regulation or convention in the marketplace.
“At fair value through profit or loss”Financial assets "at fair value through profit or loss" are financial assets held for trading. A financial asset is classified in this category if acquired principally for the purpose of selling in the short term. After initial recognition “at fair value through profit or loss” assets are measured at fair value with gains or losses being recognised in the statement of financial performance.
The fair value of investments that are actively traded in organised financial markets is determined by reference to quoted market bid prices at the close of business on the reporting date.
Loans and receivablesLoans and receivables are non-derivative financial assets with fixed or determinable payments that are not quoted in an active market. Such assets are carried at amortised cost using the effective interest method. Gains and losses are recognised in the consolidated statement of financial performance when the loans and receivables are derecognised or impaired, as well as through the amortisation process.
For
per
sona
l use
onl
y
C V C L I M I T E D A N D I T ’ S C O N T R O L L E D E N T I T I E S30
warehousing services to external parties is recognised as the service is provided.
Where a financial asset has been issued in exchange for services, the market value of that asset is included as income at the date an unconditional contract is signed.
Fee IncomeFees and commissions that relate to the execution of a significant act (for example, advisory or arrangement services, placement fees and underwriting fees) are recognised when the significant act has been completed.
Fees charged for providing ongoing services (for example, managing and administering existing facilities and funds) are recognised as income over the service period.
DividendsRevenue from dividends and other distributions from controlled entities are recognised by the parent entity when they are declared by the controlled entities.
Revenue from dividends from associates is recognised by the Company when dividends are received.
Revenue from dividends from other investments is recognised when received.
Dividends received out of pre-acquisition reserves are recognised in revenue and the investment is also assessed for impairment.
Rental incomeRental revenue from operating leases is recognised on a straight line basis over the term of the lease.
Outgoings recoveredOutgoings recovered in relation to operating leases are recognised on a straight line basis over the term of the lease.
Construction contractWhen the outcome of a construction contract can be estimated reliably and it is probable that the contract will be profitable, contract revenue is recognised over the period of the contract by reference to the stage of completion. Contract costs are recognised as expenses by reference to the stage of completion of the contract activity at the end of the reporting period. When it is probable that total contract costs will exceed total contract revenue, the expected loss is recognised as an expense immediately.When the outcome of a construction contract cannot be estimated reliably, contract revenue is recognised only to the extent of contract costs incurred that are likely to be recoverable.Variations in contract work, claims and incentive payments are included in contract revenue to the extent that may have been agreed with the customer and are capable of being reliably measured.
After initial recognition, interest-bearing loans and borrowings are subsequently measured at amortised cost using the effective interest method. Borrowing costs consists of interest and other costs relating to the financing of the acquisition of investment properties, and are expensed in the period they occur.
1.16 Revenue and Revenue RecognitionRevenue is recognised to the extent that it is probable that the economic benefits will flow to CVC and the revenue can be reliably measured. The following specific recognition criteria must also be met before revenue is recognised:
Sale of goods Revenue from the sale of goods is recognised in total income when the significant risks and rewards of ownership have been transferred to the customer. This transfer generally occurs when the goods are delivered to the customer.
Interest incomeRevenue is recognised as interest accrues using the effective interest method. This is a method of calculating the amortised cost of a financial asset and allocating the interest income over the relevant period using the effective interest rate, which is the rate that exactly discounts estimated future cash receipts through the expected life of the financial asset to the net carrying amount of the financial asset.
Sale of non-current assetsThe gain or loss on sale of non-current asset sales is included as income at the date control of the asset passes to the buyer, when a contract of sale becomes unconditional.
The gain or loss on disposal is calculated as the difference between the carrying amount of the asset at the time of disposal and the net proceeds on disposal and in the case of “available-for-sale” assets will include any amount attributable to the asset which is included in reserves.
Where an equity investment in a controlled entity is reduced and the entity ceases to be controlled, revenue from either the sale of goods or services from that investment ceases to be included in the statement of comprehensive income. If the equity investment continues to be held as an “available-for-sale” asset, changes in its fair value will be recognised directly in other comprehensive income. This may impact the ability to directly compare financial information.
Provision of servicesRevenue from the provision of services includes management fees charged to associated entities and is recognised when the terms or the agreement are satisfied and the provision of
NOTES TO THE FINANCIAL STATEMENTSF O R T H E Y E A R E N D E D 3 0 J U N E 2 0 1 6
NOTE 1: STATEMENT OF ACCOUNTING POLICIES (CONT.)
1.15 Interest-Bearing Loans and Borrowings (cont.)
For
per
sona
l use
onl
y

31A N N U A L R E P O R T | 2016
business combination. Subsequent changes to the fair value of the contingent consideration that is deemed to be an asset or liability will be recognised in accordance with AASB 139 either in profit or loss or as a change to other comprehensive income.
1.17 Employee EntitlementsWages, salaries, annual leave and sick leaveLiabilities for wages and salaries, including non-monetary benefits and annual leave expected to be settled within 12 months of the reporting date are recognised in other payables in respect of employees’ services up to the reporting date. They are measured at the amounts expected to be paid when the liabilities are settled including “on-costs”.
Long service leaveThe liability for long service leave is recognised in the provision for employee benefits and measured as the present value of expected future payments to be made in respect of services provided by employees up to the reporting date.
Share based payment transactionsCVC provides benefits to employees (including senior executives) of CVC in the form of share-based payments, whereby employees render services in exchange for shares or rights over shares (equity-settled transactions).
The cost of these equity-settled transactions with employees is measured by reference to the fair value of the equity instruments at the date at which they are granted, and amortised over the term of the plan.
1.18 Contributed EquityOrdinary shares are classified as equity. Incremental costs directly attributable to the issue of new shares or options are shown in equity as a deduction, net of tax, from the proceeds.
1.19 Dividends Provision is made for the amount of any dividend declared, being appropriately authorised and no longer at the discretion of the entity, on or before the end of the reporting period but not distributed at the end of the reporting period.
1.20 Earnings Per ShareBasic earnings per share is calculated as net profit attributable to members of the parent, adjusted to exclude any costs of servicing equity (other than dividends) and preference share dividends, divided by the weighted average number of ordinary shares, adjusted for any bonus element.
1.21 Comparative FiguresWhere necessary, comparative figures have been adjusted to conform with changes in presentation in the current year.
1.22 Segment ReportingA business segment is a distinguishable component of the entity that is engaged in providing differentiated products or services.
1.23 Contingent ConsiderationContingent consideration, resulting from business combinations, is valued at fair value at the acquisition date as part of the
For
per
sona
l use
onl
y
C V C L I M I T E D A N D I T ’ S C O N T R O L L E D E N T I T I E S32
NOTES TO THE FINANCIAL STATEMENTSF O R T H E Y E A R E N D E D 3 0 J U N E 2 0 1 6
NOTE 2: CONTROLLED ENTITIES2.1 Composition of Consolidated GroupThe consolidated financial statements include the following controlled entities. The financial years of all controlled entities are the same as that of the parent entity.
Companies incorporated in Australia:
Interest Held by Interest Held by Consolidated Entity non-controlling interests 2016 2015 2016 2015 % % % %
CVC Limited Direct Controlled Entities: AddVenture Pty Limited 100 - - -Biomedical Systems Pty Limited 100 100 - -CVC Alternate Funding Pty Limited 100 100 - -CVC Bentleigh (Loan) Pty Limited 100 - - -CVC Bentleigh (Developer) Pty Limited 100 - - -CVC Caboolture Unit Trust 60 - 40 -CVC Fairfield Pty Limited 100 100 - -CVC Finance Company Pty Limited 100 100 - -CVC Funds Management Pty Limited 100 100 - -CVC Knoxfield Unit Trust No. 2 100 100 - -CVC Investment Managers Pty Limited 100 100 - -CVC Litigation Funding Pty Limited 100 100 - -CVC Managers Pty Limited 100 100 - -CVC Masters Unit Trust 50 50 50 50CVC Mezzanine Finance Pty Limited 100 100 - -CVC Nepean Pty Limited 100 100 - -CVC (Newcastle) Pty Limited 100 100 - -CVC Property Investments Pty Limited 100 100 - -CVC Reef Investment Managers Pty Limited 100 100 - -CVC Renewables Pty Limited 94 94 6 6CVC Sustainable Investments Limited - 100 - -CVC Sustainable Investments No.2 Limited - 100 - -CVC Wagga Wagga Pty Limited 100 100 - -CVC Wagga Wagga Unit Trust 50 50 50 50Cellnet Group Limited 58 55 42 45Eildon Capital Limited (formerly CVC Private Equity Limited) 67 63 33 37Eildon Funds Management Limited (formerly CVC Property Managers Limited) 100 100 - -Greens IPO SALECO 100 100 - -iLiv CVC Rockhampton Trust 50 50 50 50MAC 1 MP Pty Ltd 66 66 34 34Marsden Park Development Trust 66 66 34 34P2P Investments Pty Limited 100 100 - -Renewable Energy Managers Pty Limited 100 100 - -Stinoc Pty Limited 99 99 1 1The Eco Fund Pty Limited 100 100 - -
For
per
sona
l use
onl
y
33A N N U A L R E P O R T | 2016
2.2 Acquisition and disposals of Business Operations(a) CVC Property FundOn 22 April 2015 CVC sold 52% of its holding in CVC Property Fund for a consideration of $5 million. The balance of the unitholding in CVC Property Fund was exchanged for units in 360 Capital Total Return Fund (ASX: TOT) in a scrip-for-scrip rollover. In addition, CVC received 690,240,449 A Class units from CVC Property Fund which entitled unitholders to any amount (net of costs and adjustments) in excess of the independent valuation of $26 million arising from the sale of the properties at 357 – 373 Warringah Road and 8 Rodborough Road Frenchs Forest under the contract for sale as at 22 April 2015. Refer to note 28.
(b) CVC Sustainable Investments Limited and CVC Sustainable Investments No.2 Limited (CVC Sustainable Investments)
On 29 June 2015, CVC Sustainable Investments distributed 100% of its net assets to ordinary shareholders. Concurrently, CVC Sustainable Investments cancelled 100% of its ordinary shares and issued one A Class ordinary share to the Company, where it became 100% owned by CVC. As the net assets of CVC Sustainable Investments were nil, no consideration was paid for the A Class ordinary share. The companies were deregistered during the year.
2.3 Interest in material subsidiaries(a) Significant restrictionsCVC has statutory and regulatory restrictions on its ability to access or use the assets in Cellnet Group Limited and Eildon Capital Limited (formerly CVC Private Equity Limited). The Corporations Act 2001 provides CVC with an interest in the equity of the entities, but does not provide it a right to their assets.
CVC also has constitutional restrictions on its ability to access or use the assets of CVC Caboolture Unit Trust, CVC Masters Unit Trust, iLiv CVC Rockhampton Trust and Marsden Park Development Trust, which arise from the operation of the various Trust Deeds of the entities. CVC has an interest in the equity of the entities, but does not provide it a right to their assets or liabilities.
The carrying amount of the non-controlling interests of the various entities included within the consolidated financial statements to which these restrictions apply is $12,311,226 (2015: $15,145,337). Refer note 25.
(b) Information on subsidiaries:Set out below are those entities that have non-controlling interests that are material to CVC.
Cellnet Group Limited: a distributor of mobile and IT technology to the reseller community in Australia.
CVC Caboolture Unit Trust: a commercial property development in Caboolture, Queensland.
CVC Masters Unit Trust: commercial property developments in South Nowra and Port Macquarie, New South Wales.
Eildon Capital Limited (formerly CVC Private Equity Limited): investment company with a focus on Australian property investments.
iLiv CVC Rockhampton Trust: a property development of residential properties in Rockhampton in Queensland.
Marsden Park Development Trust: a residential property development in Riverstone, New South Wales.
2.1 Composition of Consolidated Group (cont.)
Interest Held by Interest Held by Consolidated Entity non-controlling interests 2016 2015 2016 2015 % % % %
Controlled Entities jointly owned by CVC Renewables Pty Limited and CVC Reef Investment Managers:Wind Corporation Australia Pty Limited 100 100 - -Hampton Wind Park Company Pty Limited 100 100 - -
Controlled Entities controlled by Cellnet Group Limited: C&C Warehouse (Holdings) Pty Limited 100 100 - -Regadget Pty Limited 100 100 - -OYT Pty Limited 100 100 - -Cellnet Online Pty Limited 100 100 - -
Companies incorporated in New Zealand: Controlled Entities controlled by Cellnet Group Limited: Cellnet Limited 100 100 - -
Companies incorporated in Hong Kong: Controlled Entities controlled by Cellnet Group Limited: 3SixT Limited 100 100 - -
For
per
sona
l use
onl
y
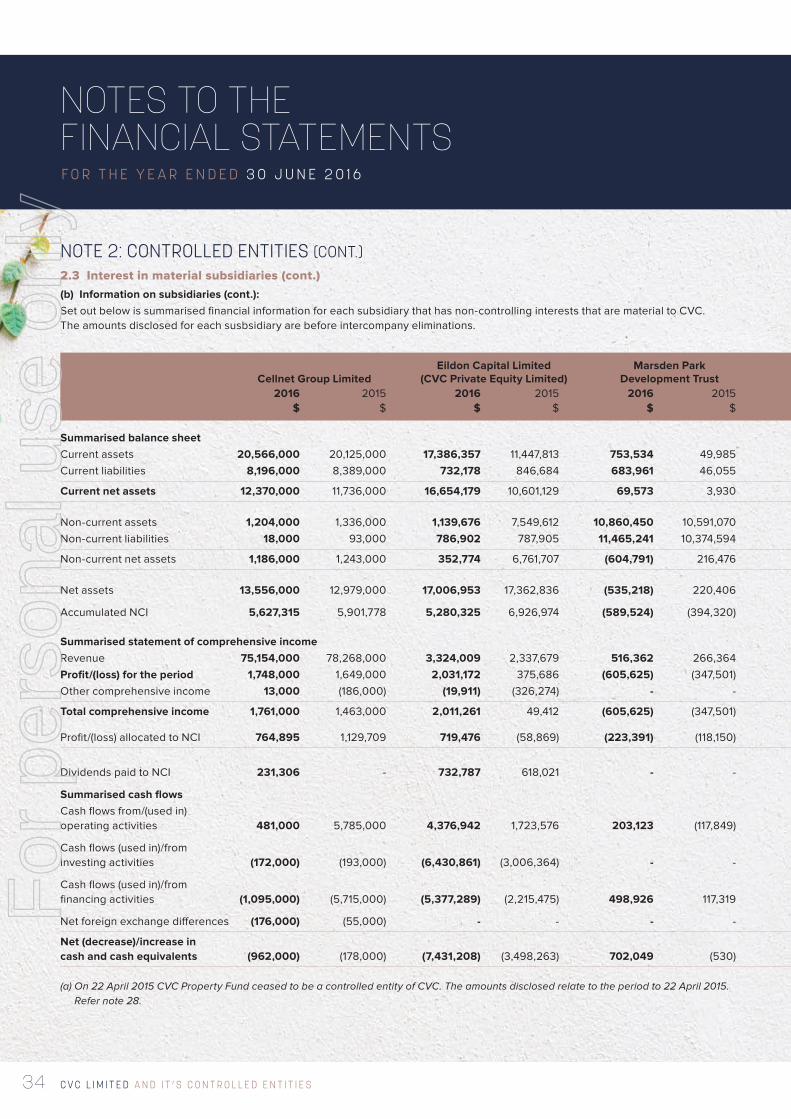
C V C L I M I T E D A N D I T ’ S C O N T R O L L E D E N T I T I E S34
NOTES TO THE FINANCIAL STATEMENTSF O R T H E Y E A R E N D E D 3 0 J U N E 2 0 1 6
NOTE 2: CONTROLLED ENTITIES (CONT.)2.3 Interest in material subsidiaries (cont.)(b) Information on subsidiaries (cont.):Set out below is summarised financial information for each subsidiary that has non-controlling interests that are material to CVC. The amounts disclosed for each susbsidiary are before intercompany eliminations.
Eildon Capital Limited Marsden Park CVC Caboolture Unit iLiv CVC Rockhampton Cellnet Group Limited (CVC Private Equity Limited) Development Trust Trust Trust CVC Masters Unit Trust CVC Property Fund 2016 2015 2016 2015 2016 2015 2016 2015 2016 2015 2016 2015 2016 2015(a) $ $ $ $ $ $ $ $ $ $ $ $ $ $
Summarised balance sheet Current assets 20,566,000 20,125,000 17,386,357 11,447,813 753,534 49,985 48,535 - 5,335,164 6,446,577 5,391,184 8,689,014 - -Current liabilities 8,196,000 8,389,000 732,178 846,684 683,961 46,055 7,123,328 - 1,934,640 2,046,054 717,849 13,390 - -
Current net assets 12,370,000 11,736,000 16,654,179 10,601,129 69,573 3,930 7,074,793 - 3,400,524 4,400,523 4,673,335 8,675,624 - - Non-current assets 1,204,000 1,336,000 1,139,676 7,549,612 10,860,450 10,591,070 6,329,406 - - - 10,696,028 6,502,477 - -Non-current liabilities 18,000 93,000 786,902 787,905 11,465,241 10,374,594 - - - - - - - -
Non-current net assets 1,186,000 1,243,000 352,774 6,761,707 (604,791) 216,476 6,329,406 - - - 10,696,028 6,502,477 - -
Net assets 13,556,000 12,979,000 17,006,953 17,362,836 (535,218) 220,406 745,387 - 3,400,524 4,400,523 15,369,363 15,178,101 - -
Accumulated NCI 5,627,315 5,901,778 5,280,325 6,926,974 (589,524) (394,320) (298,155) - 1,699,742 2,199,742 20,369 (11,763) - - Summarised statement of comprehensive income Revenue 75,154,000 78,268,000 3,324,009 2,337,679 516,362 266,364 90,953 - 2,173,253 6,012,291 34,469,125 - - 3,172,794Profit/(loss) for the period 1,748,000 1,649,000 2,031,172 375,686 (605,625) (347,501) (745,487) - 380,710 1,173,230 6,017,400 (18,340) - 1,738,908Other comprehensive income 13,000 (186,000) (19,911) (326,274) - - - - - - - - - -
Total comprehensive income 1,761,000 1,463,000 2,011,261 49,412 (605,625) (347,501) (745,487) - 380,710 1,173,230 6,017,400 (18,340) - 1,738,908
Profit/(loss) allocated to NCI 764,895 1,129,709 719,476 (58,869) (223,391) (118,150) (298,195) - 209,390 645,315 32,132 (9,170) - 175,759
Dividends paid to NCI 231,306 - 732,787 618,021 - - - - 209,390 645,315 - - - -
Summarised cash flows Cash flows from/(used in) operating activities 481,000 5,785,000 4,376,942 1,723,576 203,123 (117,849) (6,299,676) - 991,173 3,646,902 9,115,506 (3,677,609) - 1,956,348
Cash flows (used in)/from investing activities (172,000) (193,000) (6,430,861) (3,006,364) - - - - - - - - - (4,865)
Cash flows (used in)/from financing activities (1,095,000) (5,715,000) (5,377,289) (2,215,475) 498,926 117,319 6,309,506 - (1,473,385) (3,168,731) (8,343,334) 3,684,757 - (1,942,540)
Net foreign exchange differences (176,000) (55,000) - - - - - - - - - - - -
Net (decrease)/increase in cash and cash equivalents (962,000) (178,000) (7,431,208) (3,498,263) 702,049 (530) 9,830 - (482,212) 478,171 772,172 7,148 - 8,943
(a) On 22 April 2015 CVC Property Fund ceased to be a controlled entity of CVC. The amounts disclosed relate to the period to 22 April 2015. Refer note 28.
For
per
sona
l use
onl
y
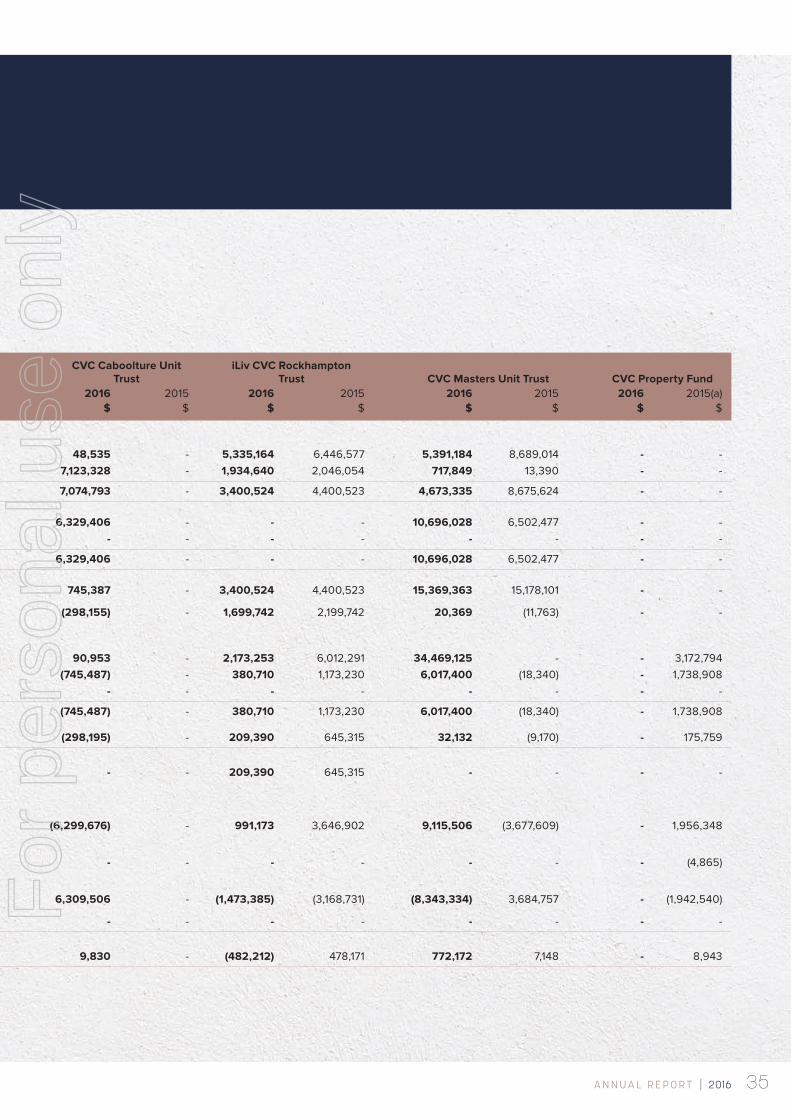
35A N N U A L R E P O R T | 2016
Eildon Capital Limited Marsden Park CVC Caboolture Unit iLiv CVC Rockhampton Cellnet Group Limited (CVC Private Equity Limited) Development Trust Trust Trust CVC Masters Unit Trust CVC Property Fund 2016 2015 2016 2015 2016 2015 2016 2015 2016 2015 2016 2015 2016 2015(a) $ $ $ $ $ $ $ $ $ $ $ $ $ $
Summarised balance sheet Current assets 20,566,000 20,125,000 17,386,357 11,447,813 753,534 49,985 48,535 - 5,335,164 6,446,577 5,391,184 8,689,014 - -Current liabilities 8,196,000 8,389,000 732,178 846,684 683,961 46,055 7,123,328 - 1,934,640 2,046,054 717,849 13,390 - -
Current net assets 12,370,000 11,736,000 16,654,179 10,601,129 69,573 3,930 7,074,793 - 3,400,524 4,400,523 4,673,335 8,675,624 - - Non-current assets 1,204,000 1,336,000 1,139,676 7,549,612 10,860,450 10,591,070 6,329,406 - - - 10,696,028 6,502,477 - -Non-current liabilities 18,000 93,000 786,902 787,905 11,465,241 10,374,594 - - - - - - - -
Non-current net assets 1,186,000 1,243,000 352,774 6,761,707 (604,791) 216,476 6,329,406 - - - 10,696,028 6,502,477 - -
Net assets 13,556,000 12,979,000 17,006,953 17,362,836 (535,218) 220,406 745,387 - 3,400,524 4,400,523 15,369,363 15,178,101 - -
Accumulated NCI 5,627,315 5,901,778 5,280,325 6,926,974 (589,524) (394,320) (298,155) - 1,699,742 2,199,742 20,369 (11,763) - - Summarised statement of comprehensive income Revenue 75,154,000 78,268,000 3,324,009 2,337,679 516,362 266,364 90,953 - 2,173,253 6,012,291 34,469,125 - - 3,172,794Profit/(loss) for the period 1,748,000 1,649,000 2,031,172 375,686 (605,625) (347,501) (745,487) - 380,710 1,173,230 6,017,400 (18,340) - 1,738,908Other comprehensive income 13,000 (186,000) (19,911) (326,274) - - - - - - - - - -
Total comprehensive income 1,761,000 1,463,000 2,011,261 49,412 (605,625) (347,501) (745,487) - 380,710 1,173,230 6,017,400 (18,340) - 1,738,908
Profit/(loss) allocated to NCI 764,895 1,129,709 719,476 (58,869) (223,391) (118,150) (298,195) - 209,390 645,315 32,132 (9,170) - 175,759
Dividends paid to NCI 231,306 - 732,787 618,021 - - - - 209,390 645,315 - - - -
Summarised cash flows Cash flows from/(used in) operating activities 481,000 5,785,000 4,376,942 1,723,576 203,123 (117,849) (6,299,676) - 991,173 3,646,902 9,115,506 (3,677,609) - 1,956,348
Cash flows (used in)/from investing activities (172,000) (193,000) (6,430,861) (3,006,364) - - - - - - - - - (4,865)
Cash flows (used in)/from financing activities (1,095,000) (5,715,000) (5,377,289) (2,215,475) 498,926 117,319 6,309,506 - (1,473,385) (3,168,731) (8,343,334) 3,684,757 - (1,942,540)
Net foreign exchange differences (176,000) (55,000) - - - - - - - - - - - -
Net (decrease)/increase in cash and cash equivalents (962,000) (178,000) (7,431,208) (3,498,263) 702,049 (530) 9,830 - (482,212) 478,171 772,172 7,148 - 8,943
(a) On 22 April 2015 CVC Property Fund ceased to be a controlled entity of CVC. The amounts disclosed relate to the period to 22 April 2015. Refer note 28.
For
per
sona
l use
onl
y
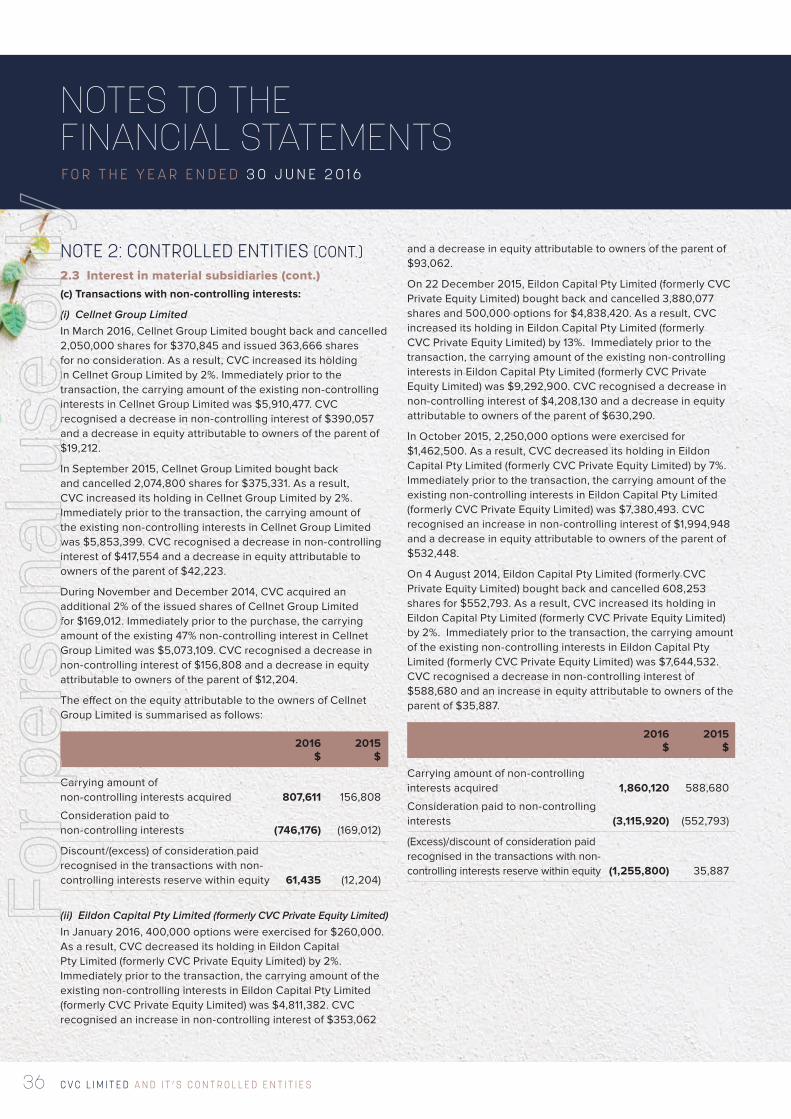
C V C L I M I T E D A N D I T ’ S C O N T R O L L E D E N T I T I E S36
NOTES TO THE FINANCIAL STATEMENTSF O R T H E Y E A R E N D E D 3 0 J U N E 2 0 1 6
NOTE 2: CONTROLLED ENTITIES (CONT.)2.3 Interest in material subsidiaries (cont.)(c) Transactions with non-controlling interests:
(i) Cellnet Group LimitedIn March 2016, Cellnet Group Limited bought back and cancelled 2,050,000 shares for $370,845 and issued 363,666 shares for no consideration. As a result, CVC increased its holding in Cellnet Group Limited by 2%. Immediately prior to the transaction, the carrying amount of the existing non-controlling interests in Cellnet Group Limited was $5,910,477. CVC recognised a decrease in non-controlling interest of $390,057 and a decrease in equity attributable to owners of the parent of $19,212.
In September 2015, Cellnet Group Limited bought back and cancelled 2,074,800 shares for $375,331. As a result, CVC increased its holding in Cellnet Group Limited by 2%. Immediately prior to the transaction, the carrying amount of the existing non-controlling interests in Cellnet Group Limited was $5,853,399. CVC recognised a decrease in non-controlling interest of $417,554 and a decrease in equity attributable to owners of the parent of $42,223.
During November and December 2014, CVC acquired an additional 2% of the issued shares of Cellnet Group Limited for $169,012. Immediately prior to the purchase, the carrying amount of the existing 47% non-controlling interest in Cellnet Group Limited was $5,073,109. CVC recognised a decrease in non-controlling interest of $156,808 and a decrease in equity attributable to owners of the parent of $12,204.
The effect on the equity attributable to the owners of Cellnet Group Limited is summarised as follows:
2016 2015 $ $
Carrying amount of non-controlling interests acquired 807,611 156,808
Consideration paid to non-controlling interests (746,176) (169,012)
Discount/(excess) of consideration paid recognised in the transactions with non- controlling interests reserve within equity 61,435 (12,204)
(ii) Eildon Capital Pty Limited (formerly CVC Private Equity Limited)
In January 2016, 400,000 options were exercised for $260,000. As a result, CVC decreased its holding in Eildon Capital Pty Limited (formerly CVC Private Equity Limited) by 2%. Immediately prior to the transaction, the carrying amount of the existing non-controlling interests in Eildon Capital Pty Limited (formerly CVC Private Equity Limited) was $4,811,382. CVC recognised an increase in non-controlling interest of $353,062
and a decrease in equity attributable to owners of the parent of $93,062.
On 22 December 2015, Eildon Capital Pty Limited (formerly CVC Private Equity Limited) bought back and cancelled 3,880,077 shares and 500,000 options for $4,838,420. As a result, CVC increased its holding in Eildon Capital Pty Limited (formerly CVC Private Equity Limited) by 13%. Immediately prior to the transaction, the carrying amount of the existing non-controlling interests in Eildon Capital Pty Limited (formerly CVC Private Equity Limited) was $9,292,900. CVC recognised a decrease in non-controlling interest of $4,208,130 and a decrease in equity attributable to owners of the parent of $630,290.
In October 2015, 2,250,000 options were exercised for $1,462,500. As a result, CVC decreased its holding in Eildon Capital Pty Limited (formerly CVC Private Equity Limited) by 7%. Immediately prior to the transaction, the carrying amount of the existing non-controlling interests in Eildon Capital Pty Limited (formerly CVC Private Equity Limited) was $7,380,493. CVC recognised an increase in non-controlling interest of $1,994,948 and a decrease in equity attributable to owners of the parent of $532,448.
On 4 August 2014, Eildon Capital Pty Limited (formerly CVC Private Equity Limited) bought back and cancelled 608,253 shares for $552,793. As a result, CVC increased its holding in Eildon Capital Pty Limited (formerly CVC Private Equity Limited) by 2%. Immediately prior to the transaction, the carrying amount of the existing non-controlling interests in Eildon Capital Pty Limited (formerly CVC Private Equity Limited) was $7,644,532. CVC recognised a decrease in non-controlling interest of $588,680 and an increase in equity attributable to owners of the parent of $35,887.
2016 2015 $ $
Carrying amount of non-controlling interests acquired 1,860,120 588,680
Consideration paid to non-controlling interests (3,115,920) (552,793)
(Excess)/discount of consideration paid recognised in the transactions with non- controlling interests reserve within equity (1,255,800) 35,887
For
per
sona
l use
onl
y
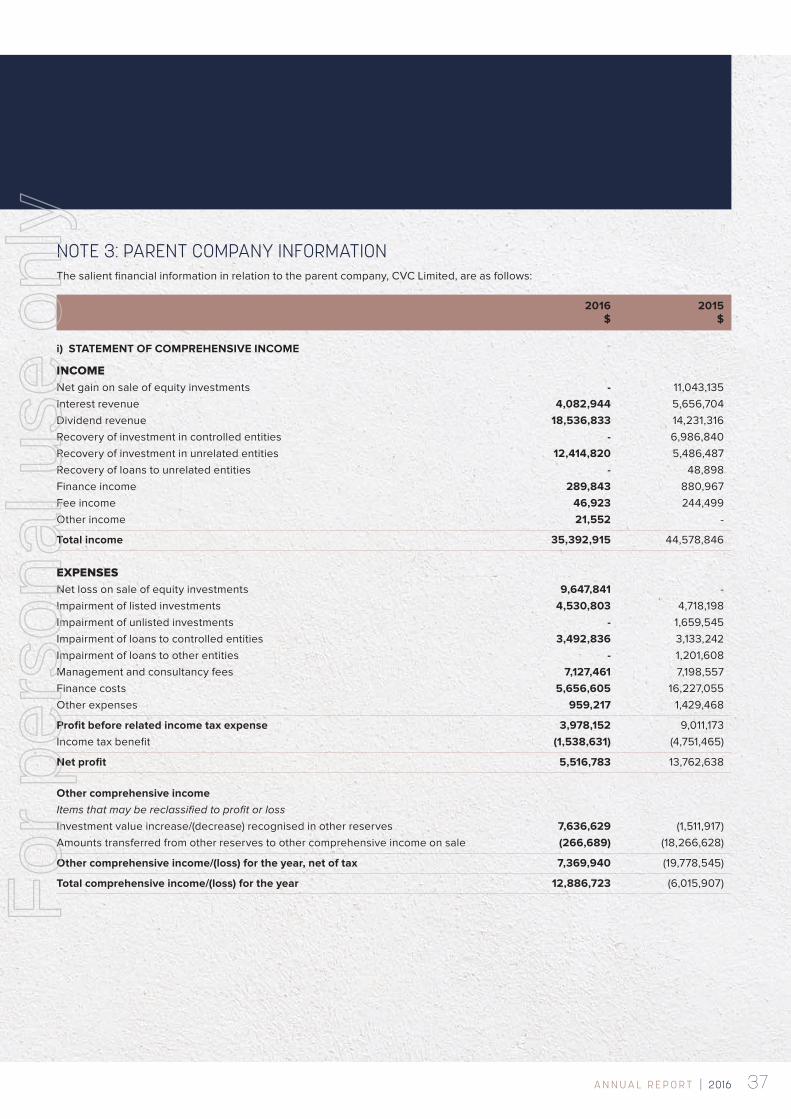
37A N N U A L R E P O R T | 2016
NOTE 3: PARENT COMPANY INFORMATIONThe salient financial information in relation to the parent company, CVC Limited, are as follows: 2016 2015 $ $
i) STATEMENT OF COMPREHENSIVE INCOME
INCOME Net gain on sale of equity investments - 11,043,135Interest revenue 4,082,944 5,656,704Dividend revenue 18,536,833 14,231,316Recovery of investment in controlled entities - 6,986,840Recovery of investment in unrelated entities 12,414,820 5,486,487Recovery of loans to unrelated entities - 48,898Finance income 289,843 880,967Fee income 46,923 244,499Other income 21,552 -
Total income 35,392,915 44,578,846
EXPENSES Net loss on sale of equity investments 9,647,841 -Impairment of listed investments 4,530,803 4,718,198Impairment of unlisted investments - 1,659,545Impairment of loans to controlled entities 3,492,836 3,133,242Impairment of loans to other entities - 1,201,608Management and consultancy fees 7,127,461 7,198,557Finance costs 5,656,605 16,227,055Other expenses 959,217 1,429,468
Profit before related income tax expense 3,978,152 9,011,173Income tax benefit (1,538,631) (4,751,465)
Net profit 5,516,783 13,762,638
Other comprehensive income Items that may be reclassified to profit or loss Investment value increase/(decrease) recognised in other reserves 7,636,629 (1,511,917)Amounts transferred from other reserves to other comprehensive income on sale (266,689) (18,266,628)
Other comprehensive income/(loss) for the year, net of tax 7,369,940 (19,778,545)
Total comprehensive income/(loss) for the year 12,886,723 (6,015,907)For
per
sona
l use
onl
y
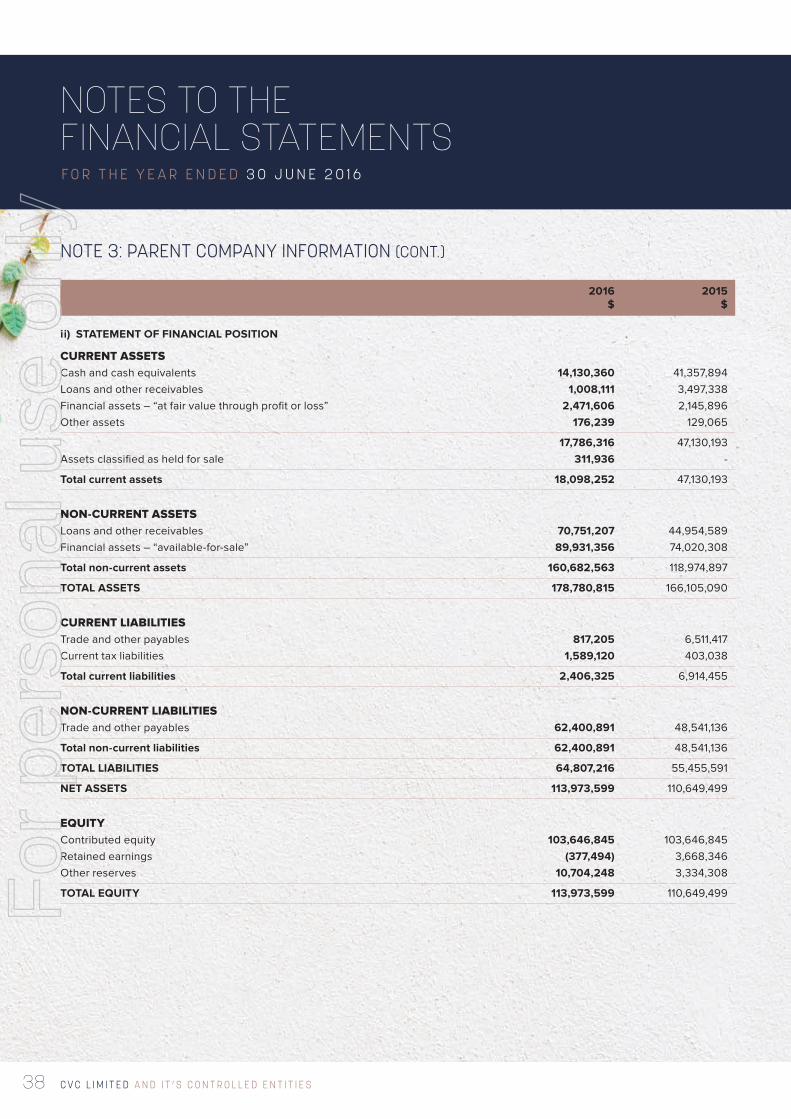
C V C L I M I T E D A N D I T ’ S C O N T R O L L E D E N T I T I E S38
NOTES TO THE FINANCIAL STATEMENTSF O R T H E Y E A R E N D E D 3 0 J U N E 2 0 1 6
NOTE 3: PARENT COMPANY INFORMATION (CONT.) 2016 2015 $ $
ii) STATEMENT OF FINANCIAL POSITION
CURRENT ASSETS Cash and cash equivalents 14,130,360 41,357,894Loans and other receivables 1,008,111 3,497,338Financial assets – “at fair value through profit or loss” 2,471,606 2,145,896Other assets 176,239 129,065
17,786,316 47,130,193Assets classified as held for sale 311,936 -
Total current assets 18,098,252 47,130,193
NON-CURRENT ASSETS Loans and other receivables 70,751,207 44,954,589Financial assets – “available-for-sale” 89,931,356 74,020,308
Total non-current assets 160,682,563 118,974,897
TOTAL ASSETS 178,780,815 166,105,090
CURRENT LIABILITIES Trade and other payables 817,205 6,511,417Current tax liabilities 1,589,120 403,038
Total current liabilities 2,406,325 6,914,455
NON-CURRENT LIABILITIES Trade and other payables 62,400,891 48,541,136
Total non-current liabilities 62,400,891 48,541,136
TOTAL LIABILITIES 64,807,216 55,455,591
NET ASSETS 113,973,599 110,649,499
EQUITY Contributed equity 103,646,845 103,646,845Retained earnings (377,494) 3,668,346Other reserves 10,704,248 3,334,308
TOTAL EQUITY 113,973,599 110,649,499For
per
sona
l use
onl
y
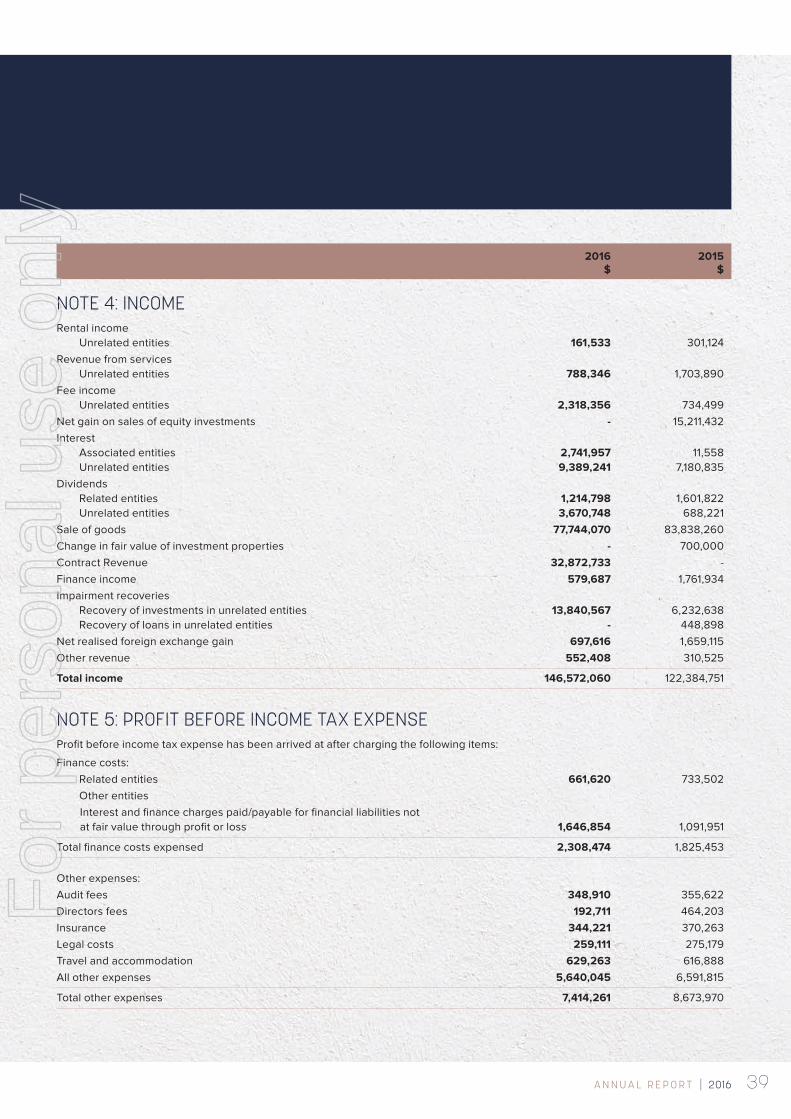
39A N N U A L R E P O R T | 2016
2016 2015 $ $
NOTE 4: INCOMERental income Unrelated entities 161,533 301,124Revenue from services Unrelated entities 788,346 1,703,890Fee income Unrelated entities 2,318,356 734,499Net gain on sales of equity investments - 15,211,432Interest Associated entities 2,741,957 11,558 Unrelated entities 9,389,241 7,180,835Dividends Related entities 1,214,798 1,601,822 Unrelated entities 3,670,748 688,221Sale of goods 77,744,070 83,838,260Change in fair value of investment properties - 700,000Contract Revenue 32,872,733 -Finance income 579,687 1,761,934Impairment recoveries Recovery of investments in unrelated entities 13,840,567 6,232,638 Recovery of loans in unrelated entities - 448,898Net realised foreign exchange gain 697,616 1,659,115Other revenue 552,408 310,525
Total income 146,572,060 122,384,751
NOTE 5: PROFIT BEFORE INCOME TAX EXPENSEProfit before income tax expense has been arrived at after charging the following items:
Finance costs: Related entities 661,620 733,502 Other entities Interest and finance charges paid/payable for financial liabilities not
at fair value through profit or loss 1,646,854 1,091,951
Total finance costs expensed 2,308,474 1,825,453
Other expenses: Audit fees 348,910 355,622Directors fees 192,711 464,203Insurance 344,221 370,263Legal costs 259,111 275,179Travel and accommodation 629,263 616,888All other expenses 5,640,045 6,591,815
Total other expenses 7,414,261 8,673,970
For
per
sona
l use
onl
y
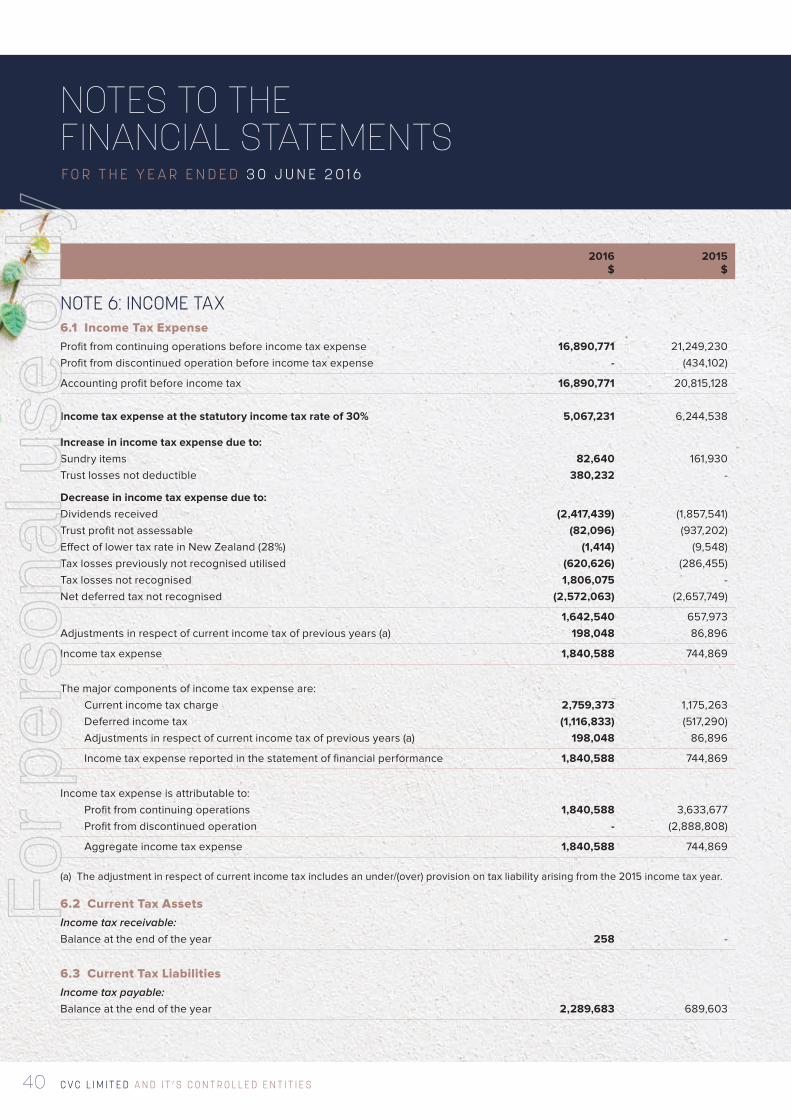
C V C L I M I T E D A N D I T ’ S C O N T R O L L E D E N T I T I E S40
NOTES TO THE FINANCIAL STATEMENTSF O R T H E Y E A R E N D E D 3 0 J U N E 2 0 1 6
2016 2015 $ $
NOTE 6: INCOME TAX6.1 Income Tax ExpenseProfit from continuing operations before income tax expense 16,890,771 21,249,230Profit from discontinued operation before income tax expense - (434,102)
Accounting profit before income tax 16,890,771 20,815,128
Income tax expense at the statutory income tax rate of 30% 5,067,231 6,244,538
Increase in income tax expense due to: Sundry items 82,640 161,930Trust losses not deductible 380,232 -
Decrease in income tax expense due to: Dividends received (2,417,439) (1,857,541)Trust profit not assessable (82,096) (937,202)Effect of lower tax rate in New Zealand (28%) (1,414) (9,548)Tax losses previously not recognised utilised (620,626) (286,455)Tax losses not recognised 1,806,075 -Net deferred tax not recognised (2,572,063) (2,657,749)
1,642,540 657,973Adjustments in respect of current income tax of previous years (a) 198,048 86,896
Income tax expense 1,840,588 744,869
The major components of income tax expense are: Current income tax charge 2,759,373 1,175,263 Deferred income tax (1,116,833) (517,290) Adjustments in respect of current income tax of previous years (a) 198,048 86,896
Income tax expense reported in the statement of financial performance 1,840,588 744,869
Income tax expense is attributable to: Profit from continuing operations 1,840,588 3,633,677 Profit from discontinued operation - (2,888,808)
Aggregate income tax expense 1,840,588 744,869
(a) The adjustment in respect of current income tax includes an under/(over) provision on tax liability arising from the 2015 income tax year.
6.2 Current Tax AssetsIncome tax receivable: Balance at the end of the year 258 -
6.3 Current Tax LiabilitiesIncome tax payable: Balance at the end of the year 2,289,683 689,603
For
per
sona
l use
onl
y
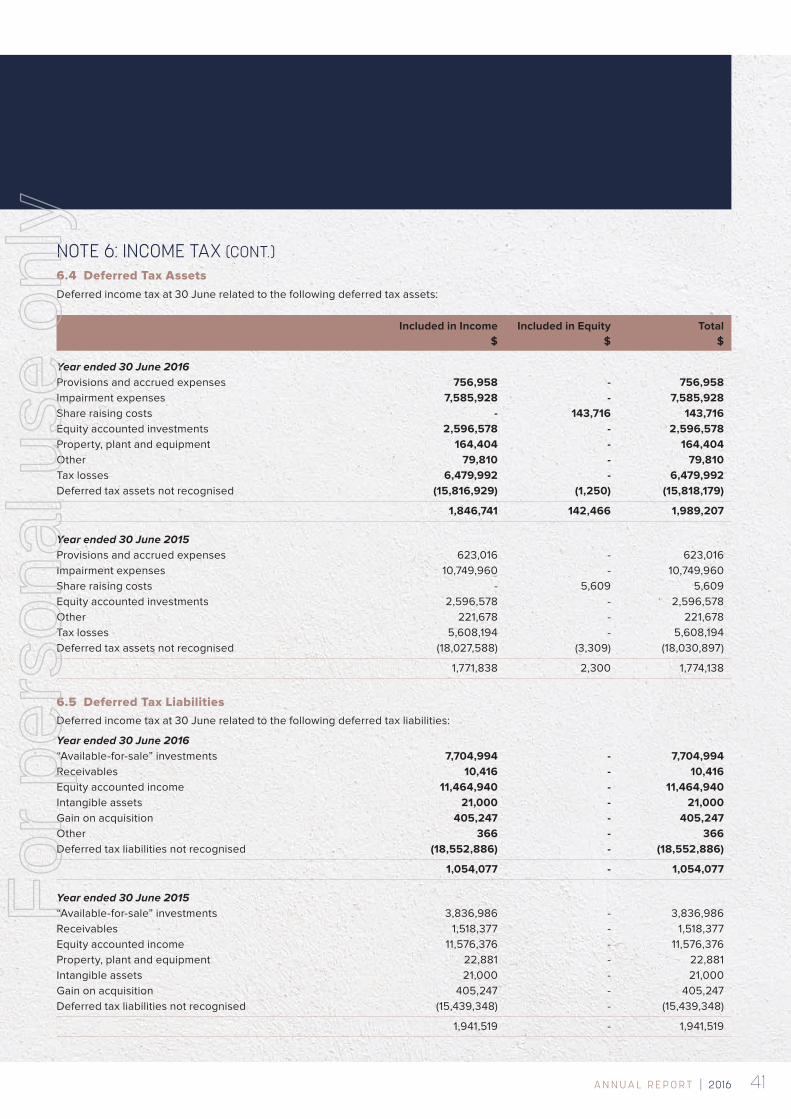
41A N N U A L R E P O R T | 2016
NOTE 6: INCOME TAX (CONT.)6.4 Deferred Tax AssetsDeferred income tax at 30 June related to the following deferred tax assets:
Included in Income Included in Equity Total $ $ $
Year ended 30 June 2016 Provisions and accrued expenses 756,958 - 756,958Impairment expenses 7,585,928 - 7,585,928Share raising costs - 143,716 143,716Equity accounted investments 2,596,578 - 2,596,578Property, plant and equipment 164,404 - 164,404Other 79,810 - 79,810Tax losses 6,479,992 - 6,479,992Deferred tax assets not recognised (15,816,929) (1,250) (15,818,179)
1,846,741 142,466 1,989,207
Year ended 30 June 2015 Provisions and accrued expenses 623,016 - 623,016Impairment expenses 10,749,960 - 10,749,960Share raising costs - 5,609 5,609Equity accounted investments 2,596,578 - 2,596,578Other 221,678 - 221,678Tax losses 5,608,194 - 5,608,194Deferred tax assets not recognised (18,027,588) (3,309) (18,030,897)
1,771,838 2,300 1,774,138
6.5 Deferred Tax LiabilitiesDeferred income tax at 30 June related to the following deferred tax liabilities:
Year ended 30 June 2016 “Available-for-sale” investments 7,704,994 - 7,704,994Receivables 10,416 - 10,416Equity accounted income 11,464,940 - 11,464,940Intangible assets 21,000 - 21,000Gain on acquisition 405,247 - 405,247Other 366 - 366Deferred tax liabilities not recognised (18,552,886) - (18,552,886)
1,054,077 - 1,054,077
Year ended 30 June 2015 “Available-for-sale” investments 3,836,986 - 3,836,986Receivables 1,518,377 - 1,518,377Equity accounted income 11,576,376 - 11,576,376Property, plant and equipment 22,881 - 22,881Intangible assets 21,000 - 21,000Gain on acquisition 405,247 - 405,247Deferred tax liabilities not recognised (15,439,348) - (15,439,348)
1,941,519 - 1,941,519
For
per
sona
l use
onl
y
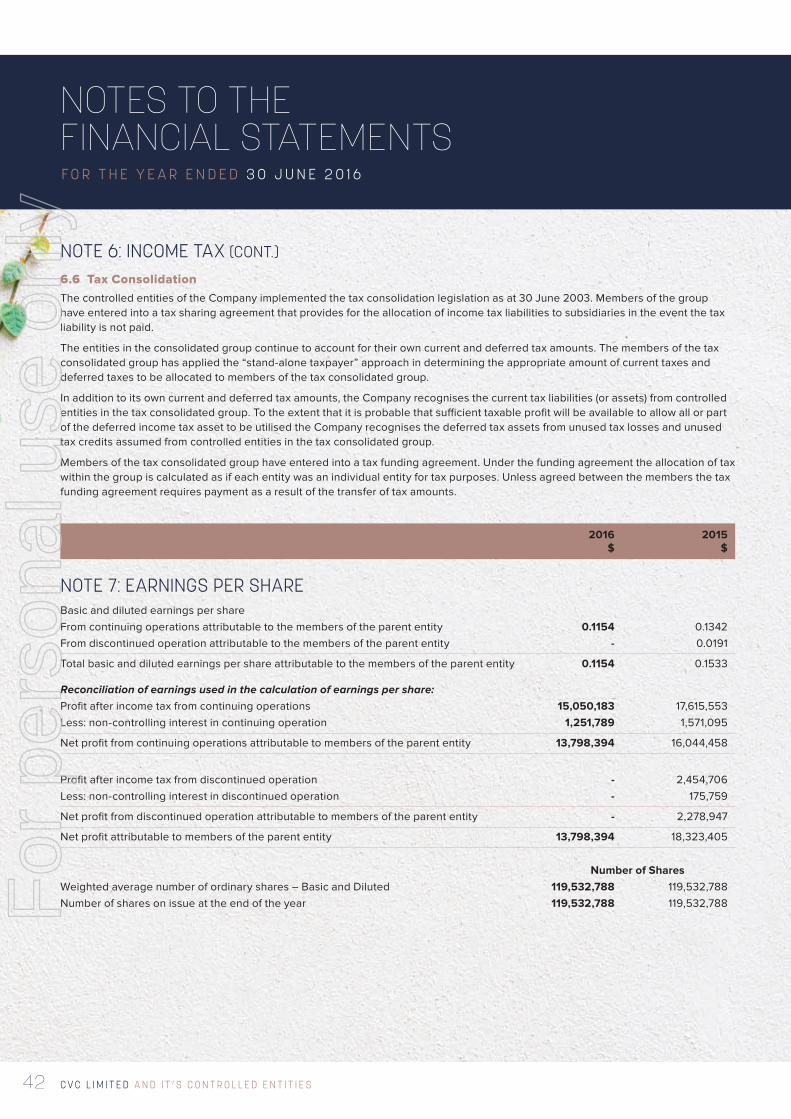
C V C L I M I T E D A N D I T ’ S C O N T R O L L E D E N T I T I E S42
NOTES TO THE FINANCIAL STATEMENTSF O R T H E Y E A R E N D E D 3 0 J U N E 2 0 1 6
NOTE 6: INCOME TAX (CONT.)
6.6 Tax ConsolidationThe controlled entities of the Company implemented the tax consolidation legislation as at 30 June 2003. Members of the group have entered into a tax sharing agreement that provides for the allocation of income tax liabilities to subsidiaries in the event the tax liability is not paid.
The entities in the consolidated group continue to account for their own current and deferred tax amounts. The members of the tax consolidated group has applied the “stand-alone taxpayer” approach in determining the appropriate amount of current taxes and deferred taxes to be allocated to members of the tax consolidated group.
In addition to its own current and deferred tax amounts, the Company recognises the current tax liabilities (or assets) from controlled entities in the tax consolidated group. To the extent that it is probable that sufficient taxable profit will be available to allow all or part of the deferred income tax asset to be utilised the Company recognises the deferred tax assets from unused tax losses and unused tax credits assumed from controlled entities in the tax consolidated group.
Members of the tax consolidated group have entered into a tax funding agreement. Under the funding agreement the allocation of tax within the group is calculated as if each entity was an individual entity for tax purposes. Unless agreed between the members the tax funding agreement requires payment as a result of the transfer of tax amounts.
2016 2015 $ $
NOTE 7: EARNINGS PER SHAREBasic and diluted earnings per share From continuing operations attributable to the members of the parent entity 0.1154 0.1342From discontinued operation attributable to the members of the parent entity - 0.0191
Total basic and diluted earnings per share attributable to the members of the parent entity 0.1154 0.1533
Reconciliation of earnings used in the calculation of earnings per share:Profit after income tax from continuing operations 15,050,183 17,615,553Less: non-controlling interest in continuing operation 1,251,789 1,571,095
Net profit from continuing operations attributable to members of the parent entity 13,798,394 16,044,458
Profit after income tax from discontinued operation - 2,454,706Less: non-controlling interest in discontinued operation - 175,759
Net profit from discontinued operation attributable to members of the parent entity - 2,278,947
Net profit attributable to members of the parent entity 13,798,394 18,323,405
Number of SharesWeighted average number of ordinary shares – Basic and Diluted 119,532,788 119,532,788Number of shares on issue at the end of the year 119,532,788 119,532,788F
or p
erso
nal u
se o
nly
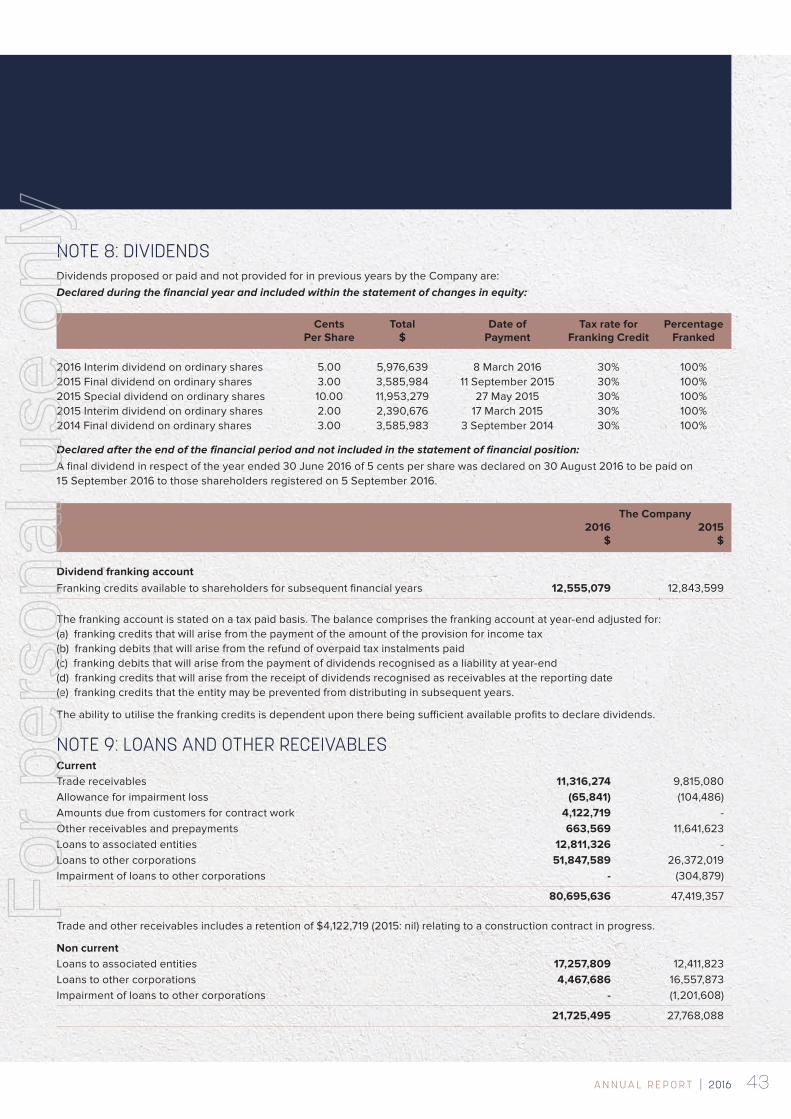
43A N N U A L R E P O R T | 2016
NOTE 8: DIVIDENDSDividends proposed or paid and not provided for in previous years by the Company are:Declared during the financial year and included within the statement of changes in equity:
Cents Total Date of Tax rate for Percentage Per Share $ Payment Franking Credit Franked
2016 Interim dividend on ordinary shares 5.00 5,976,639 8 March 2016 30% 100%2015 Final dividend on ordinary shares 3.00 3,585,984 11 September 2015 30% 100%2015 Special dividend on ordinary shares 10.00 11,953,279 27 May 2015 30% 100%2015 Interim dividend on ordinary shares 2.00 2,390,676 17 March 2015 30% 100%2014 Final dividend on ordinary shares 3.00 3,585,983 3 September 2014 30% 100%
Declared after the end of the financial period and not included in the statement of financial position:A final dividend in respect of the year ended 30 June 2016 of 5 cents per share was declared on 30 August 2016 to be paid on 15 September 2016 to those shareholders registered on 5 September 2016.
The Company 2016 2015 $ $ Dividend franking accountFranking credits available to shareholders for subsequent financial years 12,555,079 12,843,599
The franking account is stated on a tax paid basis. The balance comprises the franking account at year-end adjusted for:(a) franking credits that will arise from the payment of the amount of the provision for income tax(b) franking debits that will arise from the refund of overpaid tax instalments paid(c) franking debits that will arise from the payment of dividends recognised as a liability at year-end(d) franking credits that will arise from the receipt of dividends recognised as receivables at the reporting date(e) franking credits that the entity may be prevented from distributing in subsequent years.
The ability to utilise the franking credits is dependent upon there being sufficient available profits to declare dividends.
NOTE 9: LOANS AND OTHER RECEIVABLESCurrent Trade receivables 11,316,274 9,815,080Allowance for impairment loss (65,841) (104,486)Amounts due from customers for contract work 4,122,719 -Other receivables and prepayments 663,569 11,641,623Loans to associated entities 12,811,326 -Loans to other corporations 51,847,589 26,372,019Impairment of loans to other corporations - (304,879)
80,695,636 47,419,357
Trade and other receivables includes a retention of $4,122,719 (2015: nil) relating to a construction contract in progress.
Non current Loans to associated entities 17,257,809 12,411,823Loans to other corporations 4,467,686 16,557,873Impairment of loans to other corporations - (1,201,608)
21,725,495 27,768,088
For
per
sona
l use
onl
y
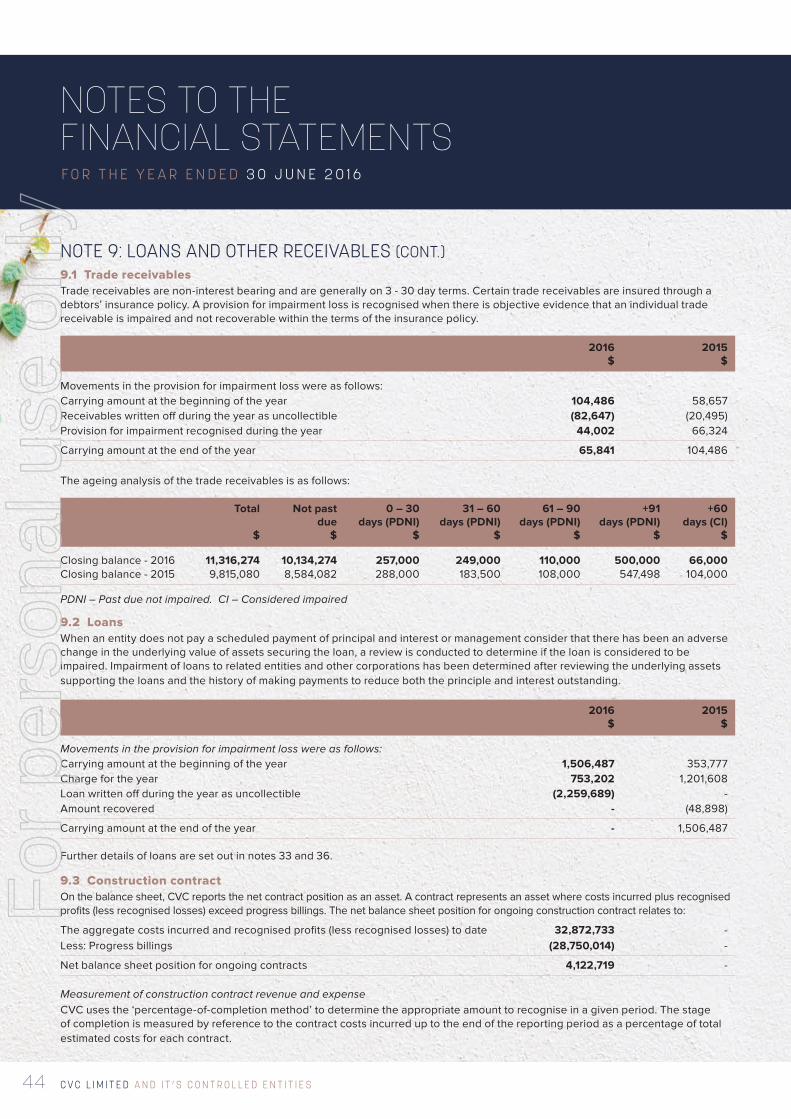
C V C L I M I T E D A N D I T ’ S C O N T R O L L E D E N T I T I E S44
NOTES TO THE FINANCIAL STATEMENTSF O R T H E Y E A R E N D E D 3 0 J U N E 2 0 1 6
NOTE 9: LOANS AND OTHER RECEIVABLES (CONT.)9.1 Trade receivables Trade receivables are non-interest bearing and are generally on 3 - 30 day terms. Certain trade receivables are insured through a debtors’ insurance policy. A provision for impairment loss is recognised when there is objective evidence that an individual trade receivable is impaired and not recoverable within the terms of the insurance policy.
2016 2015 $ $
Movements in the provision for impairment loss were as follows:Carrying amount at the beginning of the year 104,486 58,657Receivables written off during the year as uncollectible (82,647) (20,495)Provision for impairment recognised during the year 44,002 66,324
Carrying amount at the end of the year 65,841 104,486
The ageing analysis of the trade receivables is as follows:
Total Not past 0 – 30 31 – 60 61 – 90 +91 +60 due days (PDNI) days (PDNI) days (PDNI) days (PDNI) days (CI) $ $ $ $ $ $ $
Closing balance - 2016 11,316,274 10,134,274 257,000 249,000 110,000 500,000 66,000Closing balance - 2015 9,815,080 8,584,082 288,000 183,500 108,000 547,498 104,000
PDNI – Past due not impaired. CI – Considered impaired
9.2 LoansWhen an entity does not pay a scheduled payment of principal and interest or management consider that there has been an adverse change in the underlying value of assets securing the loan, a review is conducted to determine if the loan is considered to be impaired. Impairment of loans to related entities and other corporations has been determined after reviewing the underlying assets supporting the loans and the history of making payments to reduce both the principle and interest outstanding.
2016 2015 $ $
Movements in the provision for impairment loss were as follows:Carrying amount at the beginning of the year 1,506,487 353,777Charge for the year 753,202 1,201,608Loan written off during the year as uncollectible (2,259,689) -Amount recovered - (48,898)
Carrying amount at the end of the year - 1,506,487
Further details of loans are set out in notes 33 and 36.
9.3 Construction contractOn the balance sheet, CVC reports the net contract position as an asset. A contract represents an asset where costs incurred plus recognised profits (less recognised losses) exceed progress billings. The net balance sheet position for ongoing construction contract relates to:
The aggregate costs incurred and recognised profits (less recognised losses) to date 32,872,733 -Less: Progress billings (28,750,014) -
Net balance sheet position for ongoing contracts 4,122,719 -
Measurement of construction contract revenue and expenseCVC uses the ‘percentage-of-completion method’ to determine the appropriate amount to recognise in a given period. The stage of completion is measured by reference to the contract costs incurred up to the end of the reporting period as a percentage of total estimated costs for each contract.
For
per
sona
l use
onl
y
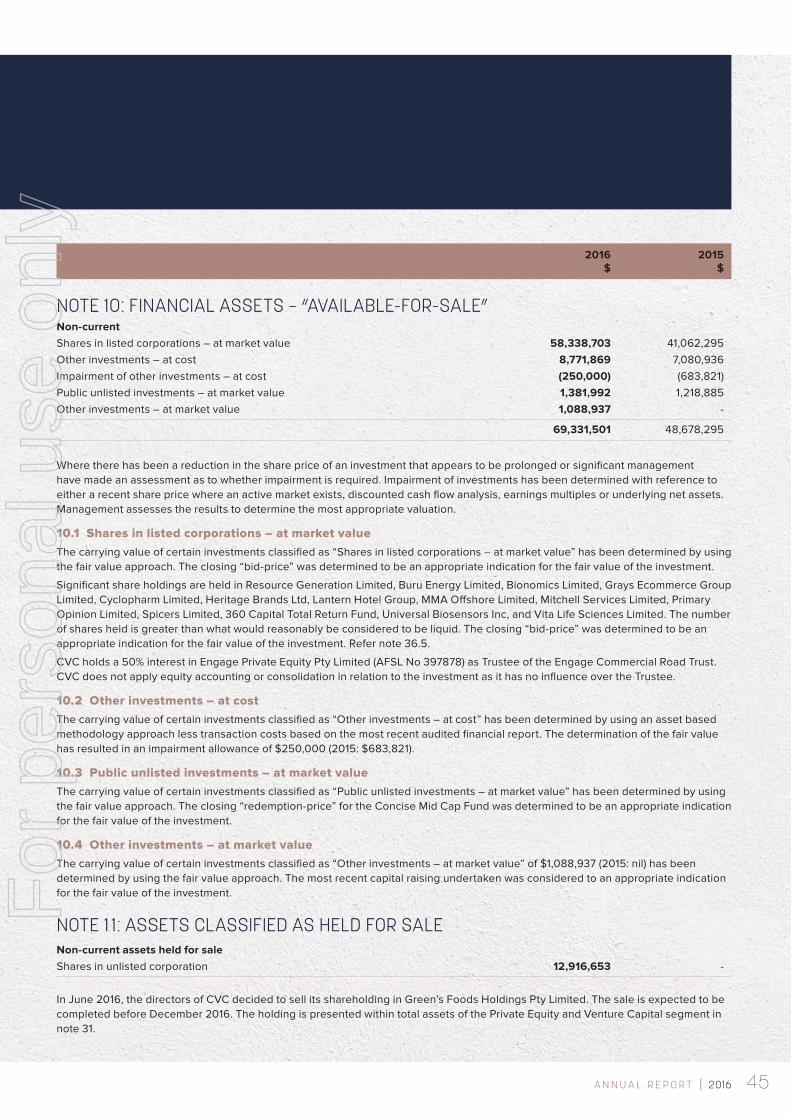
45A N N U A L R E P O R T | 2016
2016 2015 $ $
NOTE 10: FINANCIAL ASSETS – “AVAILABLE-FOR-SALE”Non-current Shares in listed corporations – at market value 58,338,703 41,062,295Other investments – at cost 8,771,869 7,080,936Impairment of other investments – at cost (250,000) (683,821)Public unlisted investments – at market value 1,381,992 1,218,885Other investments – at market value 1,088,937 -
69,331,501 48,678,295
Where there has been a reduction in the share price of an investment that appears to be prolonged or significant management have made an assessment as to whether impairment is required. Impairment of investments has been determined with reference to either a recent share price where an active market exists, discounted cash flow analysis, earnings multiples or underlying net assets. Management assesses the results to determine the most appropriate valuation.
10.1 Shares in listed corporations – at market valueThe carrying value of certain investments classified as “Shares in listed corporations – at market value” has been determined by using the fair value approach. The closing “bid-price” was determined to be an appropriate indication for the fair value of the investment.
Significant share holdings are held in Resource Generation Limited, Buru Energy Limited, Bionomics Limited, Grays Ecommerce Group Limited, Cyclopharm Limited, Heritage Brands Ltd, Lantern Hotel Group, MMA Offshore Limited, Mitchell Services Limited, Primary Opinion Limited, Spicers Limited, 360 Capital Total Return Fund, Universal Biosensors Inc, and Vita Life Sciences Limited. The number of shares held is greater than what would reasonably be considered to be liquid. The closing “bid-price” was determined to be an appropriate indication for the fair value of the investment. Refer note 36.5.
CVC holds a 50% interest in Engage Private Equity Pty Limited (AFSL No 397878) as Trustee of the Engage Commercial Road Trust. CVC does not apply equity accounting or consolidation in relation to the investment as it has no influence over the Trustee.
10.2 Other investments – at costThe carrying value of certain investments classified as “Other investments – at cost” has been determined by using an asset based methodology approach less transaction costs based on the most recent audited financial report. The determination of the fair value has resulted in an impairment allowance of $250,000 (2015: $683,821).
10.3 Public unlisted investments – at market valueThe carrying value of certain investments classified as “Public unlisted investments – at market value” has been determined by using the fair value approach. The closing “redemption-price” for the Concise Mid Cap Fund was determined to be an appropriate indication for the fair value of the investment.
10.4 Other investments – at market valueThe carrying value of certain investments classified as “Other investments – at market value” of $1,088,937 (2015: nil) has been determined by using the fair value approach. The most recent capital raising undertaken was considered to an appropriate indication for the fair value of the investment.
NOTE 1 1: ASSETS CLASSIFIED AS HELD FOR SALENon-current assets held for sale Shares in unlisted corporation 12,916,653 -
In June 2016, the directors of CVC decided to sell its shareholding in Green’s Foods Holdings Pty Limited. The sale is expected to be completed before December 2016. The holding is presented within total assets of the Private Equity and Venture Capital segment in note 31.
For
per
sona
l use
onl
y
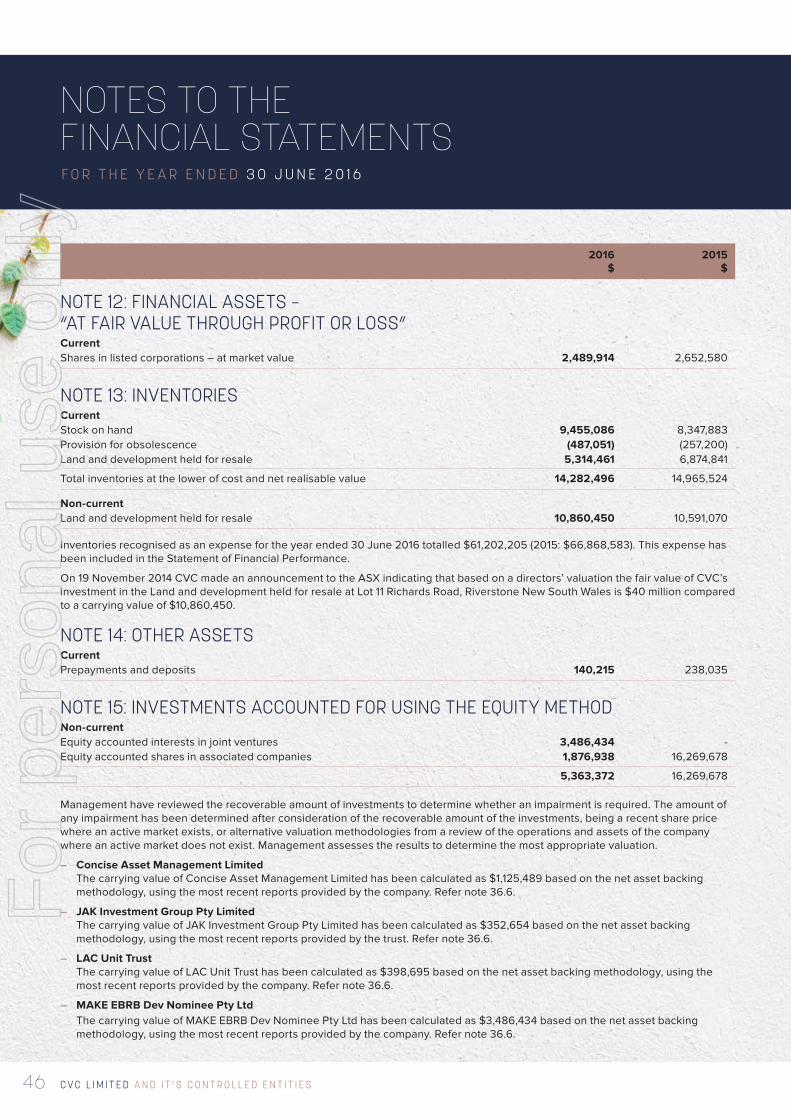
C V C L I M I T E D A N D I T ’ S C O N T R O L L E D E N T I T I E S46
NOTES TO THE FINANCIAL STATEMENTSF O R T H E Y E A R E N D E D 3 0 J U N E 2 0 1 6
2016 2015 $ $
NOTE 12: FINANCIAL ASSETS – “AT FAIR VALUE THROUGH PROFIT OR LOSS”Current Shares in listed corporations – at market value 2,489,914 2,652,580
NOTE 13: INVENTORIESCurrent Stock on hand 9,455,086 8,347,883Provision for obsolescence (487,051) (257,200)Land and development held for resale 5,314,461 6,874,841
Total inventories at the lower of cost and net realisable value 14,282,496 14,965,524
Non-current Land and development held for resale 10,860,450 10,591,070
Inventories recognised as an expense for the year ended 30 June 2016 totalled $61,202,205 (2015: $66,868,583). This expense has been included in the Statement of Financial Performance.
On 19 November 2014 CVC made an announcement to the ASX indicating that based on a directors’ valuation the fair value of CVC’s investment in the Land and development held for resale at Lot 11 Richards Road, Riverstone New South Wales is $40 million compared to a carrying value of $10,860,450.
NOTE 14: OTHER ASSETSCurrent Prepayments and deposits 140,215 238,035
NOTE 15: INVESTMENTS ACCOUNTED FOR USING THE EQUITY METHODNon-current Equity accounted interests in joint ventures 3,486,434 -Equity accounted shares in associated companies 1,876,938 16,269,678
5,363,372 16,269,678
Management have reviewed the recoverable amount of investments to determine whether an impairment is required. The amount of any impairment has been determined after consideration of the recoverable amount of the investments, being a recent share price where an active market exists, or alternative valuation methodologies from a review of the operations and assets of the company where an active market does not exist. Management assesses the results to determine the most appropriate valuation.
– Concise Asset Management Limited The carrying value of Concise Asset Management Limited has been calculated as $1,125,489 based on the net asset backing
methodology, using the most recent reports provided by the company. Refer note 36.6.
– JAK Investment Group Pty Limited The carrying value of JAK Investment Group Pty Limited has been calculated as $352,654 based on the net asset backing
methodology, using the most recent reports provided by the trust. Refer note 36.6.
– LAC Unit Trust The carrying value of LAC Unit Trust has been calculated as $398,695 based on the net asset backing methodology, using the
most recent reports provided by the company. Refer note 36.6.
– MAKE EBRB Dev Nominee Pty Ltd The carrying value of MAKE EBRB Dev Nominee Pty Ltd has been calculated as $3,486,434 based on the net asset backing
methodology, using the most recent reports provided by the company. Refer note 36.6.
For
per
sona
l use
onl
y
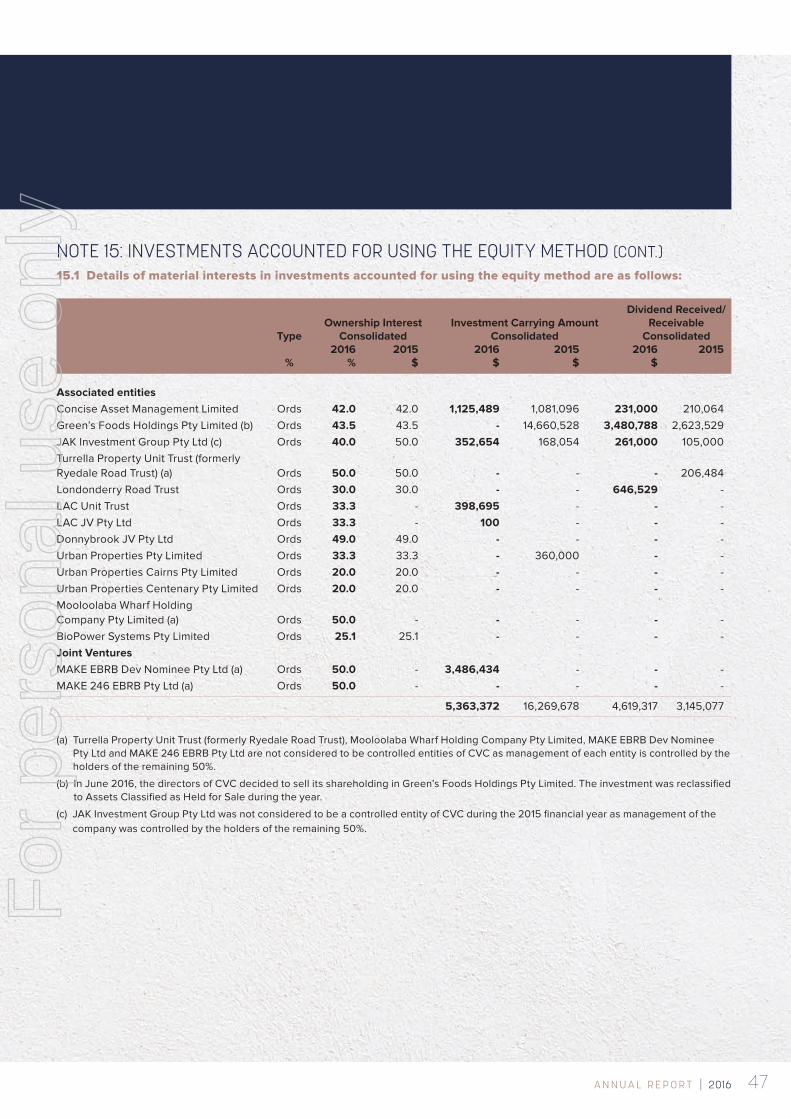
47A N N U A L R E P O R T | 2016
NOTE 15: INVESTMENTS ACCOUNTED FOR USING THE EQUITY METHOD (CONT.)15.1 Details of material interests in investments accounted for using the equity method are as follows:
Dividend Received/ Ownership Interest Investment Carrying Amount Receivable Type Consolidated Consolidated Consolidated 2016 2015 2016 2015 2016 2015 % % $ $ $ $
Associated entities Concise Asset Management Limited Ords 42.0 42.0 1,125,489 1,081,096 231,000 210,064Green’s Foods Holdings Pty Limited (b) Ords 43.5 43.5 - 14,660,528 3,480,788 2,623,529JAK Investment Group Pty Ltd (c) Ords 40.0 50.0 352,654 168,054 261,000 105,000Turrella Property Unit Trust (formerly Ryedale Road Trust) (a) Ords 50.0 50.0 - - - 206,484Londonderry Road Trust Ords 30.0 30.0 - - 646,529 -LAC Unit Trust Ords 33.3 - 398,695 - - -LAC JV Pty Ltd Ords 33.3 - 100 - - -Donnybrook JV Pty Ltd Ords 49.0 49.0 - - - -Urban Properties Pty Limited Ords 33.3 33.3 - 360,000 - -Urban Properties Cairns Pty Limited Ords 20.0 20.0 - - - -Urban Properties Centenary Pty Limited Ords 20.0 20.0 - - - -Mooloolaba Wharf Holding Company Pty Limited (a) Ords 50.0 - - - - -BioPower Systems Pty Limited Ords 25.1 25.1 - - - -Joint Ventures MAKE EBRB Dev Nominee Pty Ltd (a) Ords 50.0 - 3,486,434 - - -MAKE 246 EBRB Pty Ltd (a) Ords 50.0 - - - - -
5,363,372 16,269,678 4,619,317 3,145,077
(a) Turrella Property Unit Trust (formerly Ryedale Road Trust), Mooloolaba Wharf Holding Company Pty Limited, MAKE EBRB Dev Nominee
Pty Ltd and MAKE 246 EBRB Pty Ltd are not considered to be controlled entities of CVC as management of each entity is controlled by the holders of the remaining 50%.
(b) In June 2016, the directors of CVC decided to sell its shareholding in Green’s Foods Holdings Pty Limited. The investment was reclassified to Assets Classified as Held for Sale during the year.
(c) JAK Investment Group Pty Ltd was not considered to be a controlled entity of CVC during the 2015 financial year as management of the company was controlled by the holders of the remaining 50%.
For
per
sona
l use
onl
y
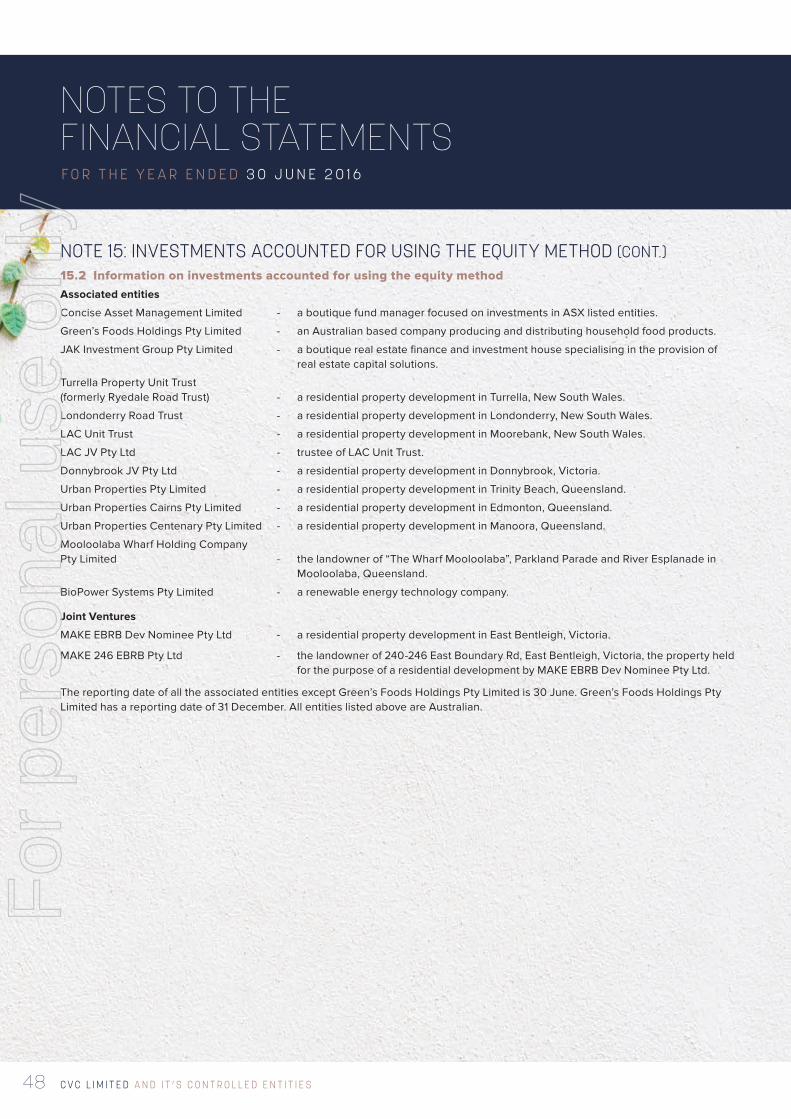
C V C L I M I T E D A N D I T ’ S C O N T R O L L E D E N T I T I E S48
NOTES TO THE FINANCIAL STATEMENTSF O R T H E Y E A R E N D E D 3 0 J U N E 2 0 1 6
NOTE 15: INVESTMENTS ACCOUNTED FOR USING THE EQUITY METHOD (CONT.)15.2 Information on investments accounted for using the equity methodAssociated entities
Concise Asset Management Limited - a boutique fund manager focused on investments in ASX listed entities.
Green’s Foods Holdings Pty Limited - an Australian based company producing and distributing household food products.
JAK Investment Group Pty Limited - a boutique real estate finance and investment house specialising in the provision of real estate capital solutions.
Turrella Property Unit Trust (formerly Ryedale Road Trust) - a residential property development in Turrella, New South Wales.
Londonderry Road Trust - a residential property development in Londonderry, New South Wales.
LAC Unit Trust - a residential property development in Moorebank, New South Wales.
LAC JV Pty Ltd - trustee of LAC Unit Trust.
Donnybrook JV Pty Ltd - a residential property development in Donnybrook, Victoria.
Urban Properties Pty Limited - a residential property development in Trinity Beach, Queensland.
Urban Properties Cairns Pty Limited - a residential property development in Edmonton, Queensland.
Urban Properties Centenary Pty Limited - a residential property development in Manoora, Queensland.
Mooloolaba Wharf Holding Company Pty Limited - the landowner of “The Wharf Mooloolaba”, Parkland Parade and River Esplanade in
Mooloolaba, Queensland.
BioPower Systems Pty Limited - a renewable energy technology company.
Joint Ventures
MAKE EBRB Dev Nominee Pty Ltd - a residential property development in East Bentleigh, Victoria.
MAKE 246 EBRB Pty Ltd - the landowner of 240-246 East Boundary Rd, East Bentleigh, Victoria, the property held for the purpose of a residential development by MAKE EBRB Dev Nominee Pty Ltd.
The reporting date of all the associated entities except Green’s Foods Holdings Pty Limited is 30 June. Green’s Foods Holdings Pty Limited has a reporting date of 31 December. All entities listed above are Australian.
For
per
sona
l use
onl
y
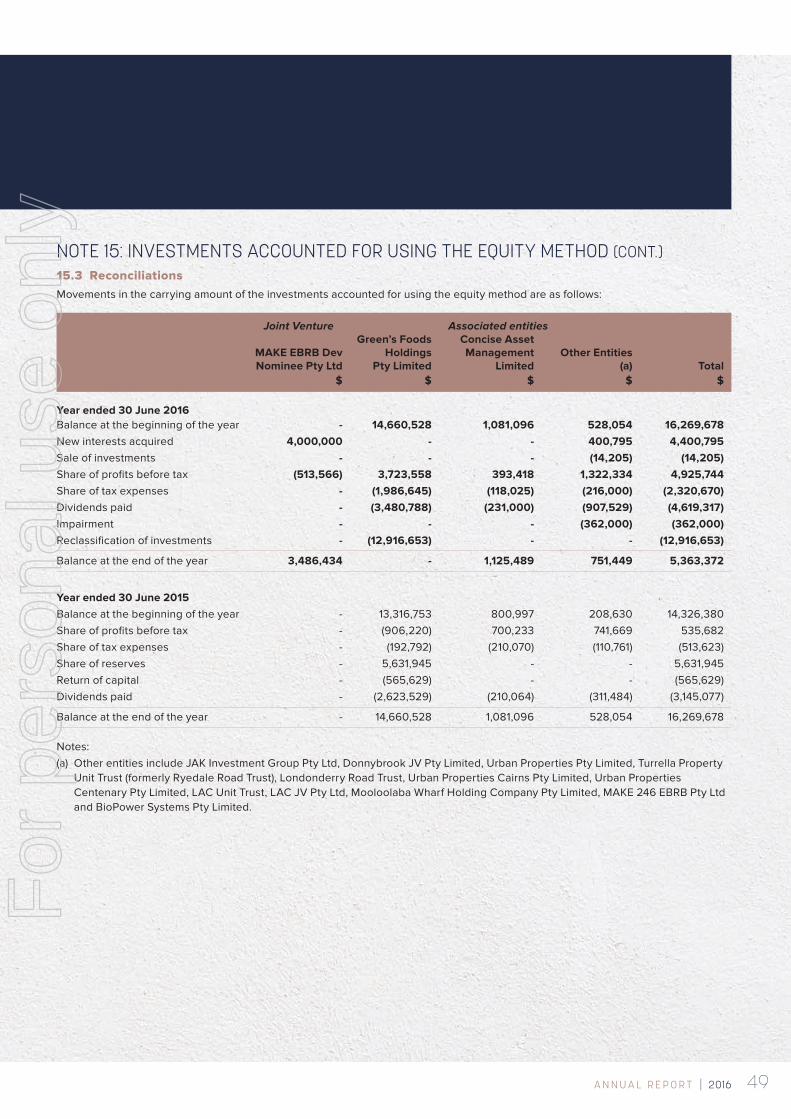
49A N N U A L R E P O R T | 2016
NOTE 15: INVESTMENTS ACCOUNTED FOR USING THE EQUITY METHOD (CONT.)15.3 ReconciliationsMovements in the carrying amount of the investments accounted for using the equity method are as follows: Joint Venture Associated entities Green’s Foods Concise Asset MAKE EBRB Dev Holdings Management Other Entities Nominee Pty Ltd Pty Limited Limited (a) Total $ $ $ $ $
Year ended 30 June 2016 Balance at the beginning of the year - 14,660,528 1,081,096 528,054 16,269,678New interests acquired 4,000,000 - - 400,795 4,400,795Sale of investments - - - (14,205) (14,205)Share of profits before tax (513,566) 3,723,558 393,418 1,322,334 4,925,744Share of tax expenses - (1,986,645) (118,025) (216,000) (2,320,670)Dividends paid - (3,480,788) (231,000) (907,529) (4,619,317)Impairment - - - (362,000) (362,000)Reclassification of investments - (12,916,653) - - (12,916,653)
Balance at the end of the year 3,486,434 - 1,125,489 751,449 5,363,372
Year ended 30 June 2015 Balance at the beginning of the year - 13,316,753 800,997 208,630 14,326,380Share of profits before tax - (906,220) 700,233 741,669 535,682Share of tax expenses - (192,792) (210,070) (110,761) (513,623)Share of reserves - 5,631,945 - - 5,631,945Return of capital - (565,629) - - (565,629) Dividends paid - (2,623,529) (210,064) (311,484) (3,145,077)
Balance at the end of the year - 14,660,528 1,081,096 528,054 16,269,678
Notes: (a) Other entities include JAK Investment Group Pty Ltd, Donnybrook JV Pty Limited, Urban Properties Pty Limited, Turrella Property
Unit Trust (formerly Ryedale Road Trust), Londonderry Road Trust, Urban Properties Cairns Pty Limited, Urban Properties Centenary Pty Limited, LAC Unit Trust, LAC JV Pty Ltd, Mooloolaba Wharf Holding Company Pty Limited, MAKE 246 EBRB Pty Ltd and BioPower Systems Pty Limited.
For
per
sona
l use
onl
y
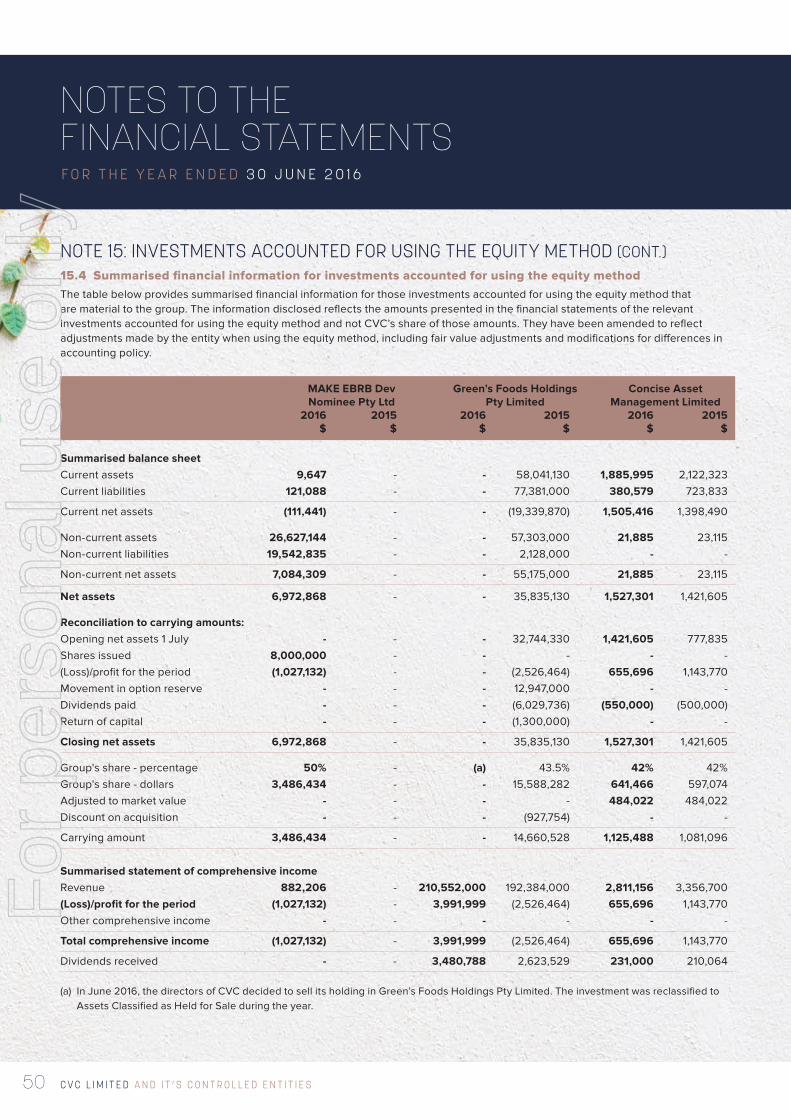
C V C L I M I T E D A N D I T ’ S C O N T R O L L E D E N T I T I E S50
NOTES TO THE FINANCIAL STATEMENTSF O R T H E Y E A R E N D E D 3 0 J U N E 2 0 1 6
NOTE 15: INVESTMENTS ACCOUNTED FOR USING THE EQUITY METHOD (CONT.)15.4 Summarised financial information for investments accounted for using the equity methodThe table below provides summarised financial information for those investments accounted for using the equity method that are material to the group. The information disclosed reflects the amounts presented in the financial statements of the relevant investments accounted for using the equity method and not CVC’s share of those amounts. They have been amended to reflect adjustments made by the entity when using the equity method, including fair value adjustments and modifications for differences in accounting policy.
MAKE EBRB Dev Green’s Foods Holdings Concise Asset Nominee Pty Ltd Pty Limited Management Limited 2016 2015 2016 2015 2016 2015 $ $ $ $ $ $
Summarised balance sheet Current assets 9,647 - - 58,041,130 1,885,995 2,122,323Current liabilities 121,088 - - 77,381,000 380,579 723,833
Current net assets (111,441) - - (19,339,870) 1,505,416 1,398,490
Non-current assets 26,627,144 - - 57,303,000 21,885 23,115Non-current liabilities 19,542,835 - - 2,128,000 - -
Non-current net assets 7,084,309 - - 55,175,000 21,885 23,115
Net assets 6,972,868 - - 35,835,130 1,527,301 1,421,605
Reconciliation to carrying amounts: Opening net assets 1 July - - - 32,744,330 1,421,605 777,835Shares issued 8,000,000 - - - - -(Loss)/profit for the period (1,027,132) - - (2,526,464) 655,696 1,143,770Movement in option reserve - - - 12,947,000 - -Dividends paid - - - (6,029,736) (550,000) (500,000)Return of capital - - - (1,300,000) - -
Closing net assets 6,972,868 - - 35,835,130 1,527,301 1,421,605
Group's share - percentage 50% - (a) 43.5% 42% 42%Group's share - dollars 3,486,434 - - 15,588,282 641,466 597,074Adjusted to market value - - - - 484,022 484,022Discount on acquisition - - - (927,754) - -
Carrying amount 3,486,434 - - 14,660,528 1,125,488 1,081,096
Summarised statement of comprehensive income Revenue 882,206 - 210,552,000 192,384,000 2,811,156 3,356,700(Loss)/profit for the period (1,027,132) - 3,991,999 (2,526,464) 655,696 1,143,770Other comprehensive income - - - - - -
Total comprehensive income (1,027,132) - 3,991,999 (2,526,464) 655,696 1,143,770
Dividends received - - 3,480,788 2,623,529 231,000 210,064
(a) In June 2016, the directors of CVC decided to sell its holding in Green’s Foods Holdings Pty Limited. The investment was reclassified to Assets Classified as Held for Sale during the year.
For
per
sona
l use
onl
y
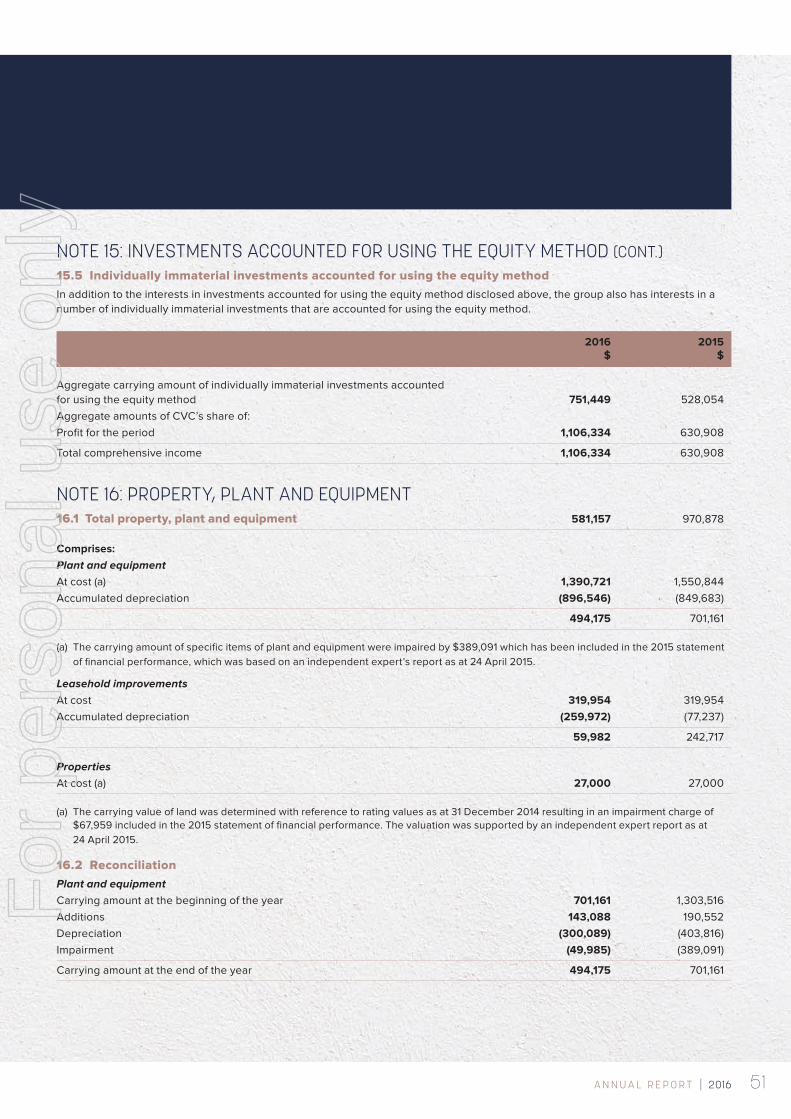
51A N N U A L R E P O R T | 2016
NOTE 15: INVESTMENTS ACCOUNTED FOR USING THE EQUITY METHOD (CONT.)15.5 Individually immaterial investments accounted for using the equity method In addition to the interests in investments accounted for using the equity method disclosed above, the group also has interests in a number of individually immaterial investments that are accounted for using the equity method.
2016 2015 $ $
Aggregate carrying amount of individually immaterial investments accounted for using the equity method 751,449 528,054Aggregate amounts of CVC’s share of: Profit for the period 1,106,334 630,908
Total comprehensive income 1,106,334 630,908
NOTE 16: PROPERTY, PLANT AND EQUIPMENT16.1 Total property, plant and equipment 581,157 970,878
Comprises: Plant and equipment At cost (a) 1,390,721 1,550,844Accumulated depreciation (896,546) (849,683)
494,175 701,161
(a) The carrying amount of specific items of plant and equipment were impaired by $389,091 which has been included in the 2015 statement of financial performance, which was based on an independent expert’s report as at 24 April 2015.
Leasehold improvements At cost 319,954 319,954Accumulated depreciation (259,972) (77,237)
59,982 242,717
Properties At cost (a) 27,000 27,000
(a) The carrying value of land was determined with reference to rating values as at 31 December 2014 resulting in an impairment charge of $67,959 included in the 2015 statement of financial performance. The valuation was supported by an independent expert report as at 24 April 2015.
16.2 Reconciliation Plant and equipment Carrying amount at the beginning of the year 701,161 1,303,516Additions 143,088 190,552Depreciation (300,089) (403,816)Impairment (49,985) (389,091)
Carrying amount at the end of the year 494,175 701,161
For
per
sona
l use
onl
y
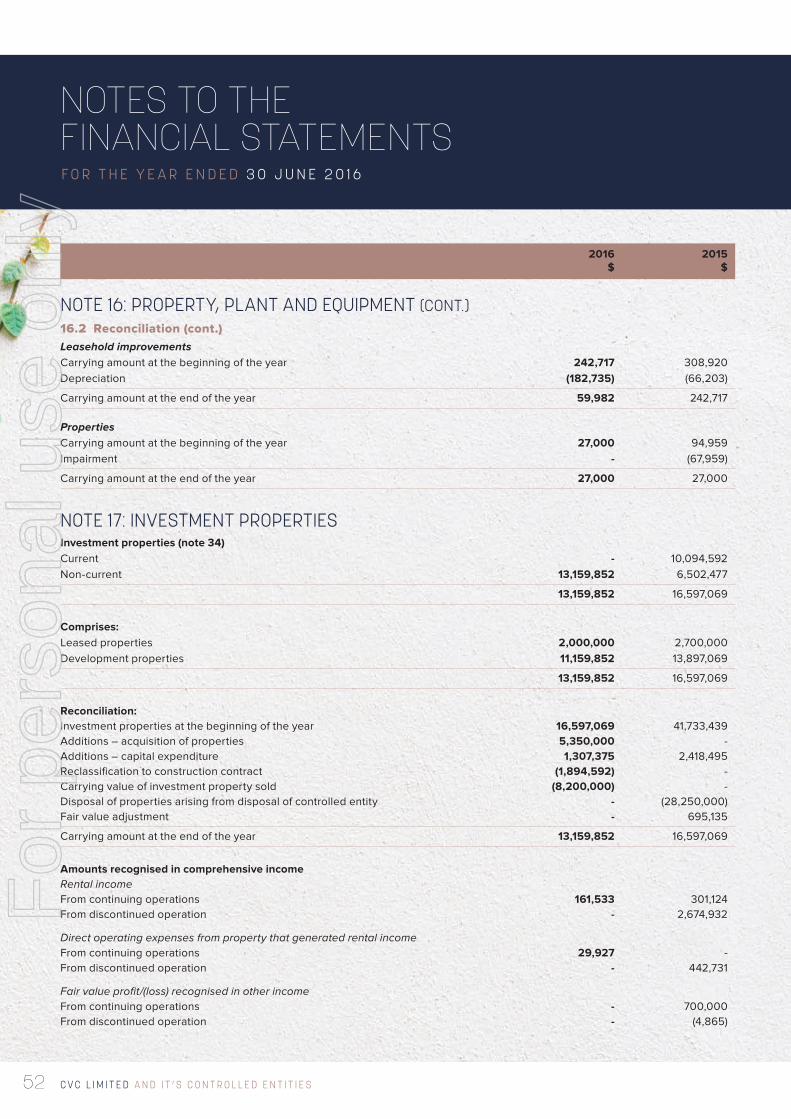
C V C L I M I T E D A N D I T ’ S C O N T R O L L E D E N T I T I E S52
NOTES TO THE FINANCIAL STATEMENTSF O R T H E Y E A R E N D E D 3 0 J U N E 2 0 1 6
2016 2015 $ $
NOTE 16: PROPERTY, PLANT AND EQUIPMENT (CONT.)16.2 Reconciliation (cont.) Leasehold improvements Carrying amount at the beginning of the year 242,717 308,920Depreciation (182,735) (66,203)
Carrying amount at the end of the year 59,982 242,717
Properties Carrying amount at the beginning of the year 27,000 94,959Impairment - (67,959)
Carrying amount at the end of the year 27,000 27,000
NOTE 17: INVESTMENT PROPERTIESInvestment properties (note 34) Current - 10,094,592Non-current 13,159,852 6,502,477
13,159,852 16,597,069
Comprises: Leased properties 2,000,000 2,700,000Development properties 11,159,852 13,897,069
13,159,852 16,597,069
Reconciliation: Investment properties at the beginning of the year 16,597,069 41,733,439Additions – acquisition of properties 5,350,000 -Additions – capital expenditure 1,307,375 2,418,495Reclassification to construction contract (1,894,592) -Carrying value of investment property sold (8,200,000) -Disposal of properties arising from disposal of controlled entity - (28,250,000)Fair value adjustment - 695,135
Carrying amount at the end of the year 13,159,852 16,597,069
Amounts recognised in comprehensive income Rental income From continuing operations 161,533 301,124From discontinued operation - 2,674,932
Direct operating expenses from property that generated rental income From continuing operations 29,927 -From discontinued operation - 442,731
Fair value profit/(loss) recognised in other income From continuing operations - 700,000From discontinued operation - (4,865)
For
per
sona
l use
onl
y
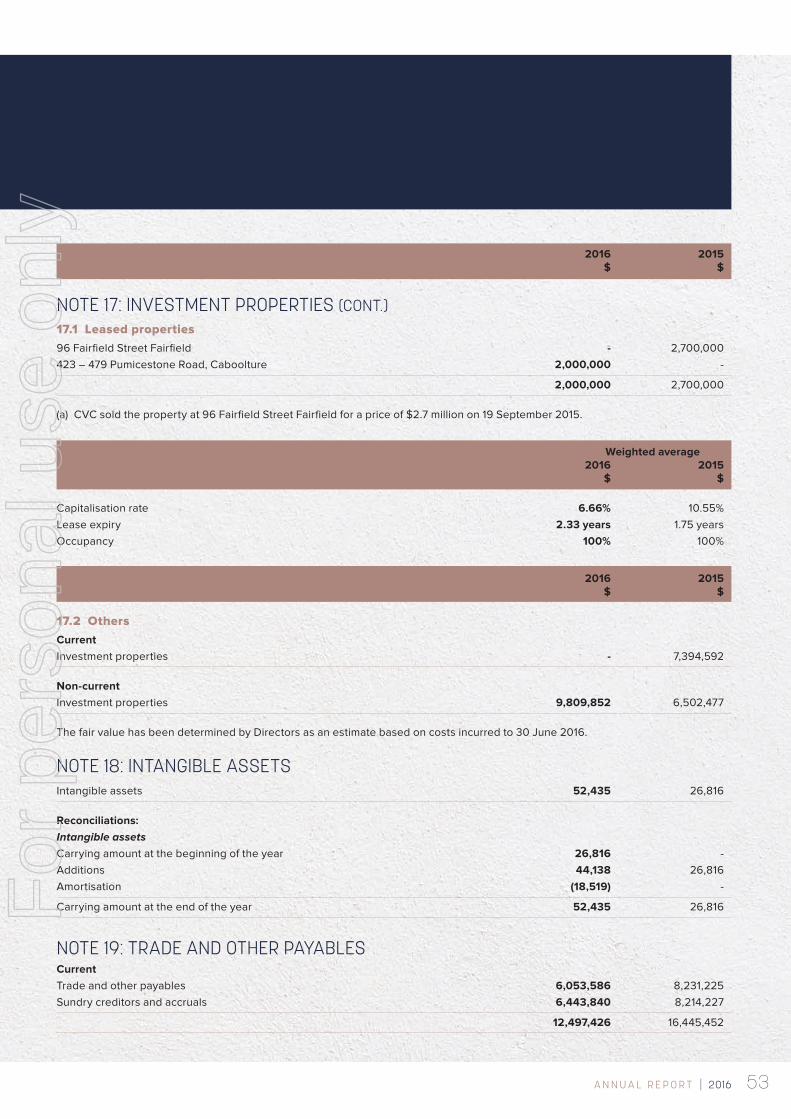
53A N N U A L R E P O R T | 2016
2016 2015 $ $
NOTE 17: INVESTMENT PROPERTIES (CONT.)17.1 Leased properties96 Fairfield Street Fairfield - 2,700,000423 – 479 Pumicestone Road, Caboolture 2,000,000 -
2,000,000 2,700,000
(a) CVC sold the property at 96 Fairfield Street Fairfield for a price of $2.7 million on 19 September 2015.
Weighted average 2016 2015 $ $
Capitalisation rate 6.66% 10.55%Lease expiry 2.33 years 1.75 yearsOccupancy 100% 100%
2016 2015 $ $
17.2 OthersCurrent Investment properties - 7,394,592
Non-current Investment properties 9,809,852 6,502,477
The fair value has been determined by Directors as an estimate based on costs incurred to 30 June 2016.
NOTE 18: INTANGIBLE ASSETSIntangible assets 52,435 26,816
Reconciliations: Intangible assets Carrying amount at the beginning of the year 26,816 -Additions 44,138 26,816Amortisation (18,519) -
Carrying amount at the end of the year 52,435 26,816
NOTE 19: TRADE AND OTHER PAYABLESCurrent Trade and other payables 6,053,586 8,231,225Sundry creditors and accruals 6,443,840 8,214,227
12,497,426 16,445,452
For
per
sona
l use
onl
y
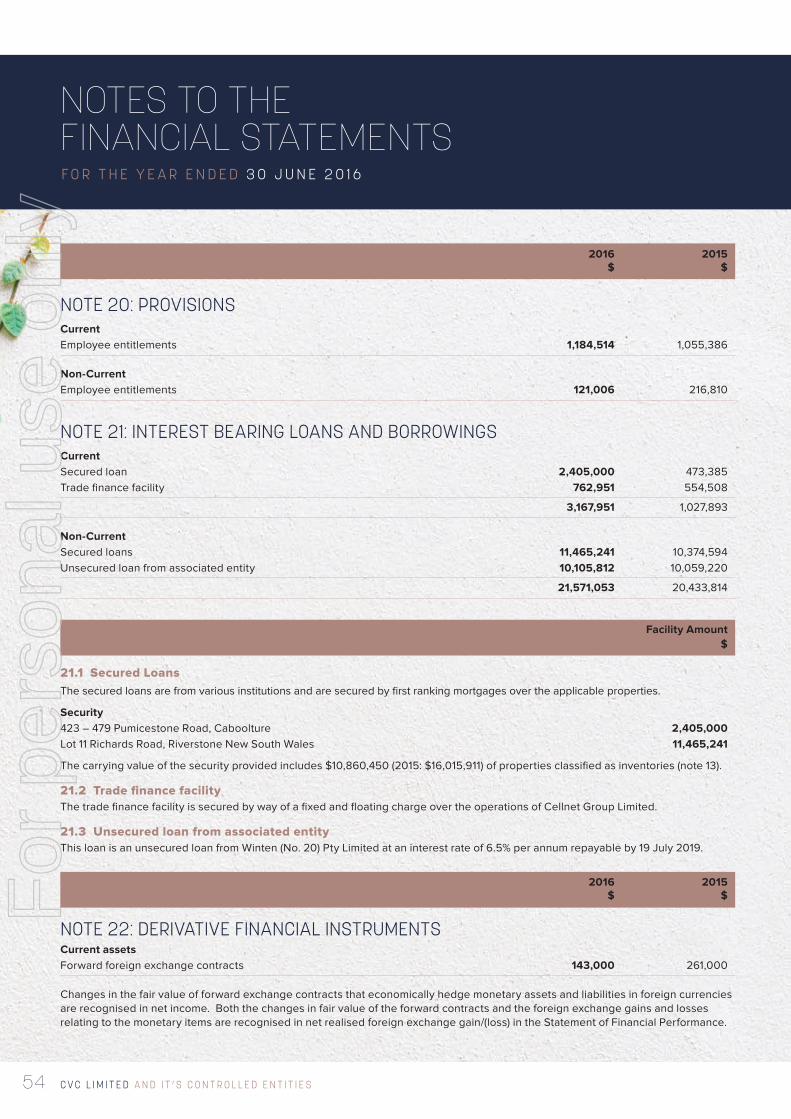
C V C L I M I T E D A N D I T ’ S C O N T R O L L E D E N T I T I E S54
NOTES TO THE FINANCIAL STATEMENTSF O R T H E Y E A R E N D E D 3 0 J U N E 2 0 1 6
2016 2015 $ $
NOTE 20: PROVISIONSCurrent Employee entitlements 1,184,514 1,055,386
Non-Current Employee entitlements 121,006 216,810
NOTE 21: INTEREST BEARING LOANS AND BORROWINGSCurrent Secured loan 2,405,000 473,385Trade finance facility 762,951 554,508
3,167,951 1,027,893
Non-Current Secured loans 11,465,241 10,374,594Unsecured loan from associated entity 10,105,812 10,059,220
21,571,053 20,433,814
Facility Amount $
21.1 Secured LoansThe secured loans are from various institutions and are secured by first ranking mortgages over the applicable properties.
Security 423 – 479 Pumicestone Road, Caboolture 2,405,000Lot 11 Richards Road, Riverstone New South Wales 11,465,241
The carrying value of the security provided includes $10,860,450 (2015: $16,015,911) of properties classified as inventories (note 13).
21.2 Trade finance facilityThe trade finance facility is secured by way of a fixed and floating charge over the operations of Cellnet Group Limited.
21.3 Unsecured loan from associated entityThis loan is an unsecured loan from Winten (No. 20) Pty Limited at an interest rate of 6.5% per annum repayable by 19 July 2019.
2016 2015 $ $
NOTE 22: DERIVATIVE FINANCIAL INSTRUMENTSCurrent assets Forward foreign exchange contracts 143,000 261,000
Changes in the fair value of forward exchange contracts that economically hedge monetary assets and liabilities in foreign currencies are recognised in net income. Both the changes in fair value of the forward contracts and the foreign exchange gains and losses relating to the monetary items are recognised in net realised foreign exchange gain/(loss) in the Statement of Financial Performance.
For
per
sona
l use
onl
y
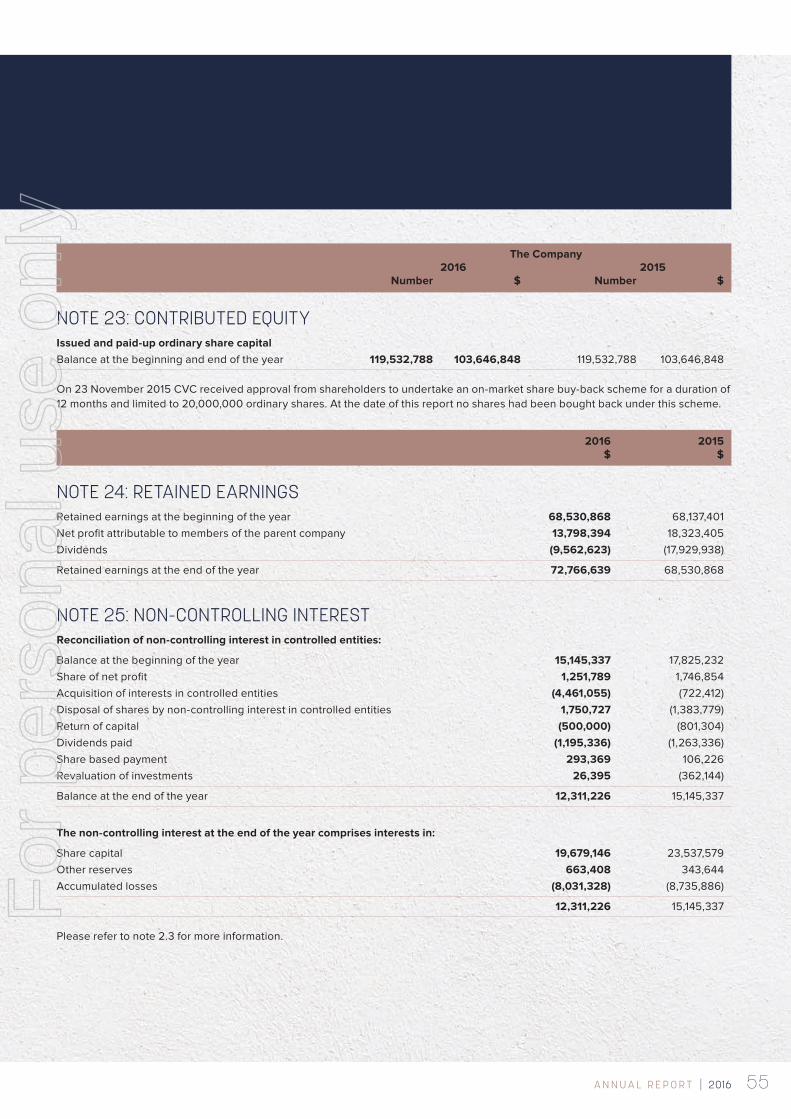
55A N N U A L R E P O R T | 2016
The Company 2016 2015 Number $ Number $
NOTE 23: CONTRIBUTED EQUITYIssued and paid-up ordinary share capital Balance at the beginning and end of the year 119,532,788 103,646,848 119,532,788 103,646,848
On 23 November 2015 CVC received approval from shareholders to undertake an on-market share buy-back scheme for a duration of 12 months and limited to 20,000,000 ordinary shares. At the date of this report no shares had been bought back under this scheme.
2016 2015 $ $
NOTE 24: RETAINED EARNINGSRetained earnings at the beginning of the year 68,530,868 68,137,401Net profit attributable to members of the parent company 13,798,394 18,323,405Dividends (9,562,623) (17,929,938)
Retained earnings at the end of the year 72,766,639 68,530,868
NOTE 25: NON-CONTROLLING INTERESTReconciliation of non-controlling interest in controlled entities:
Balance at the beginning of the year 15,145,337 17,825,232Share of net profit 1,251,789 1,746,854Acquisition of interests in controlled entities (4,461,055) (722,412)Disposal of shares by non-controlling interest in controlled entities 1,750,727 (1,383,779)Return of capital (500,000) (801,304)Dividends paid (1,195,336) (1,263,336)Share based payment 293,369 106,226Revaluation of investments 26,395 (362,144)
Balance at the end of the year 12,311,226 15,145,337
The non-controlling interest at the end of the year comprises interests in:
Share capital 19,679,146 23,537,579Other reserves 663,408 343,644Accumulated losses (8,031,328) (8,735,886)
12,311,226 15,145,337
Please refer to note 2.3 for more information.
For
per
sona
l use
onl
y
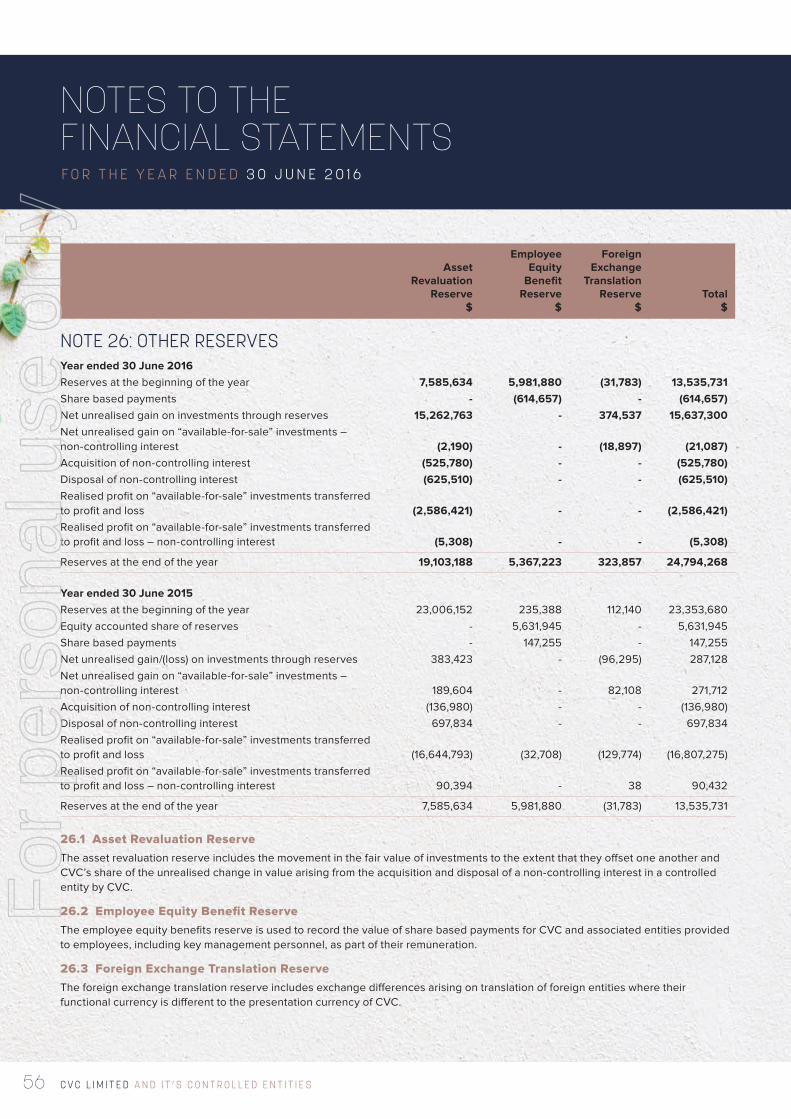
C V C L I M I T E D A N D I T ’ S C O N T R O L L E D E N T I T I E S56
NOTES TO THE FINANCIAL STATEMENTSF O R T H E Y E A R E N D E D 3 0 J U N E 2 0 1 6
Employee Foreign Asset Equity Exchange Revaluation Benefit Translation Reserve Reserve Reserve Total $ $ $ $
NOTE 26: OTHER RESERVESYear ended 30 June 2016 Reserves at the beginning of the year 7,585,634 5,981,880 (31,783) 13,535,731Share based payments - (614,657) - (614,657)Net unrealised gain on investments through reserves 15,262,763 - 374,537 15,637,300Net unrealised gain on “available-for-sale” investments – non-controlling interest (2,190) - (18,897) (21,087)Acquisition of non-controlling interest (525,780) - - (525,780)Disposal of non-controlling interest (625,510) - - (625,510)Realised profit on “available-for-sale” investments transferred to profit and loss (2,586,421) - - (2,586,421)Realised profit on “available-for-sale” investments transferred to profit and loss – non-controlling interest (5,308) - - (5,308)
Reserves at the end of the year 19,103,188 5,367,223 323,857 24,794,268 Year ended 30 June 2015 Reserves at the beginning of the year 23,006,152 235,388 112,140 23,353,680Equity accounted share of reserves - 5,631,945 - 5,631,945Share based payments - 147,255 - 147,255Net unrealised gain/(loss) on investments through reserves 383,423 - (96,295) 287,128Net unrealised gain on “available-for-sale” investments – non-controlling interest 189,604 - 82,108 271,712Acquisition of non-controlling interest (136,980) - - (136,980)Disposal of non-controlling interest 697,834 - - 697,834Realised profit on “available-for-sale” investments transferred to profit and loss (16,644,793) (32,708) (129,774) (16,807,275)Realised profit on “available-for-sale” investments transferred to profit and loss – non-controlling interest 90,394 - 38 90,432
Reserves at the end of the year 7,585,634 5,981,880 (31,783) 13,535,731
26.1 Asset Revaluation ReserveThe asset revaluation reserve includes the movement in the fair value of investments to the extent that they offset one another and CVC’s share of the unrealised change in value arising from the acquisition and disposal of a non-controlling interest in a controlled entity by CVC.
26.2 Employee Equity Benefit ReserveThe employee equity benefits reserve is used to record the value of share based payments for CVC and associated entities provided to employees, including key management personnel, as part of their remuneration.
26.3 Foreign Exchange Translation ReserveThe foreign exchange translation reserve includes exchange differences arising on translation of foreign entities where their functional currency is different to the presentation currency of CVC.
For
per
sona
l use
onl
y
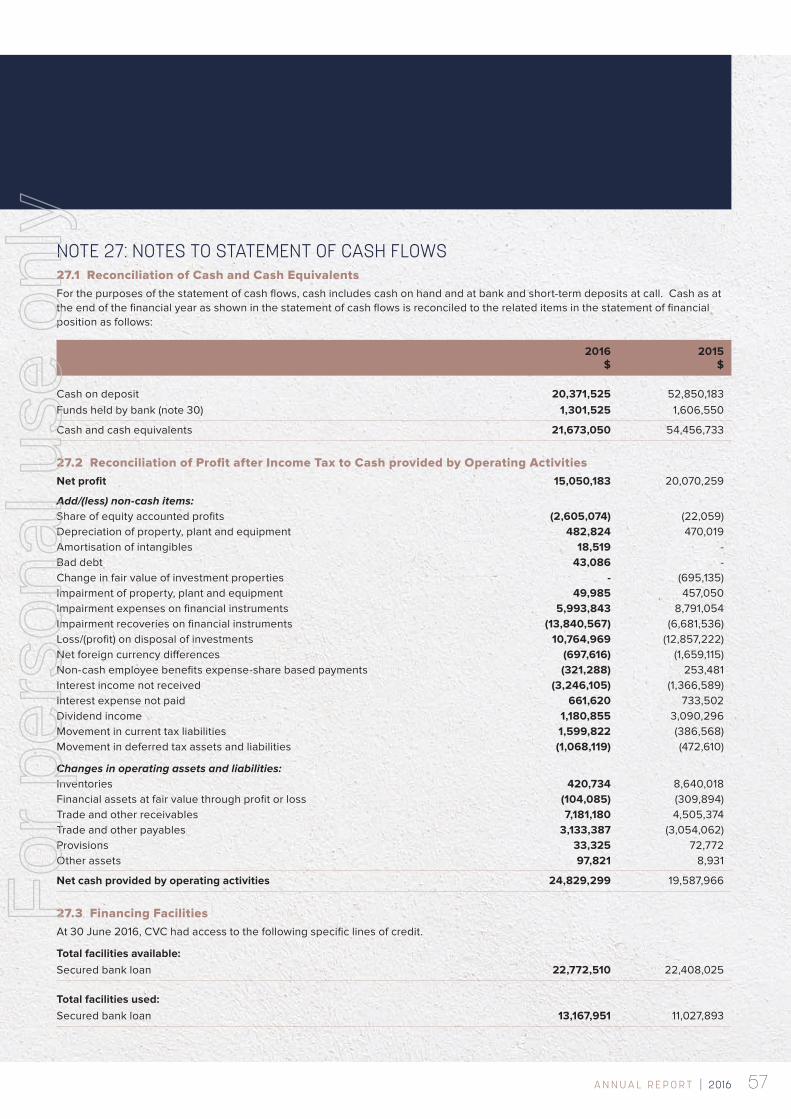
57A N N U A L R E P O R T | 2016
NOTE 27: NOTES TO STATEMENT OF CASH FLOWS27.1 Reconciliation of Cash and Cash EquivalentsFor the purposes of the statement of cash flows, cash includes cash on hand and at bank and short-term deposits at call. Cash as at the end of the financial year as shown in the statement of cash flows is reconciled to the related items in the statement of financial position as follows:
2016 2015 $ $
Cash on deposit 20,371,525 52,850,183Funds held by bank (note 30) 1,301,525 1,606,550
Cash and cash equivalents 21,673,050 54,456,733
27.2 Reconciliation of Profit after Income Tax to Cash provided by Operating ActivitiesNet profit 15,050,183 20,070,259
Add/(less) non-cash items: Share of equity accounted profits (2,605,074) (22,059)Depreciation of property, plant and equipment 482,824 470,019Amortisation of intangibles 18,519 -Bad debt 43,086 -Change in fair value of investment properties - (695,135)Impairment of property, plant and equipment 49,985 457,050Impairment expenses on financial instruments 5,993,843 8,791,054Impairment recoveries on financial instruments (13,840,567) (6,681,536)Loss/(profit) on disposal of investments 10,764,969 (12,857,222)Net foreign currency differences (697,616) (1,659,115)Non-cash employee benefits expense-share based payments (321,288) 253,481Interest income not received (3,246,105) (1,366,589)Interest expense not paid 661,620 733,502Dividend income 1,180,855 3,090,296Movement in current tax liabilities 1,599,822 (386,568)Movement in deferred tax assets and liabilities (1,068,119) (472,610)
Changes in operating assets and liabilities: Inventories 420,734 8,640,018Financial assets at fair value through profit or loss (104,085) (309,894)Trade and other receivables 7,181,180 4,505,374Trade and other payables 3,133,387 (3,054,062)Provisions 33,325 72,772Other assets 97,821 8,931
Net cash provided by operating activities 24,829,299 19,587,966
27.3 Financing Facilities At 30 June 2016, CVC had access to the following specific lines of credit.
Total facilities available: Secured bank loan 22,772,510 22,408,025
Total facilities used: Secured bank loan 13,167,951 11,027,893
For
per
sona
l use
onl
y
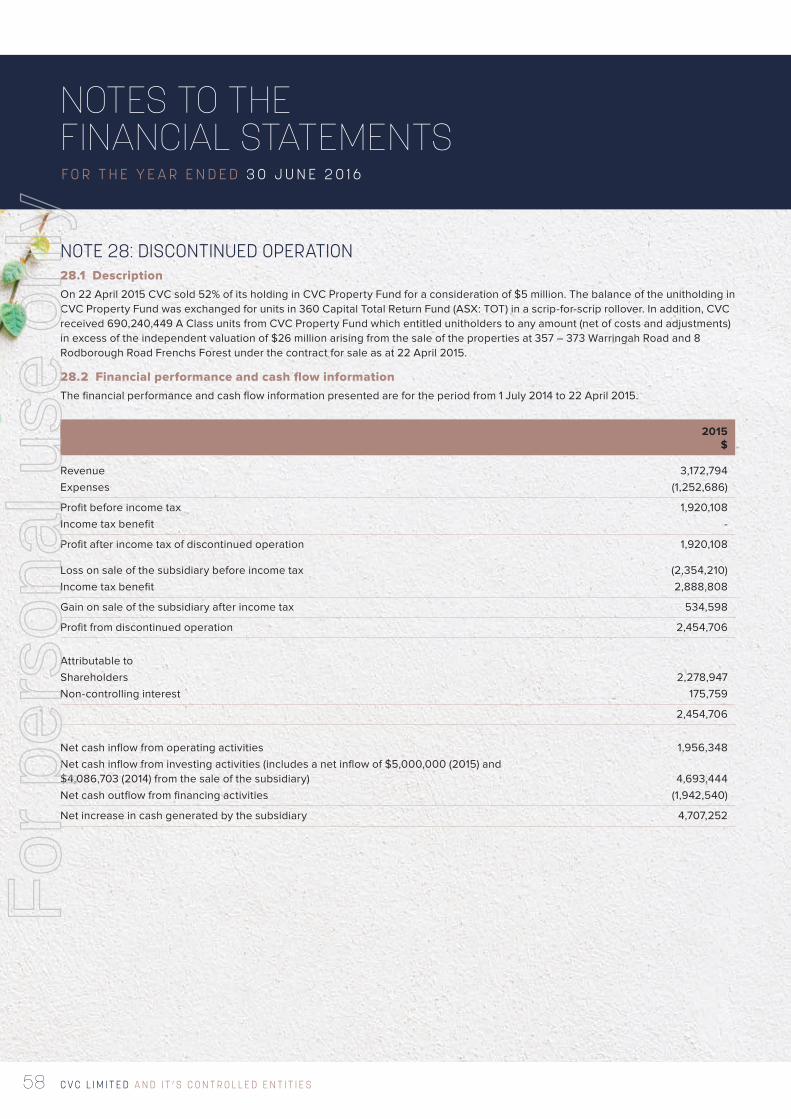
C V C L I M I T E D A N D I T ’ S C O N T R O L L E D E N T I T I E S58
NOTES TO THE FINANCIAL STATEMENTSF O R T H E Y E A R E N D E D 3 0 J U N E 2 0 1 6
NOTE 28: DISCONTINUED OPERATION28.1 DescriptionOn 22 April 2015 CVC sold 52% of its holding in CVC Property Fund for a consideration of $5 million. The balance of the unitholding in CVC Property Fund was exchanged for units in 360 Capital Total Return Fund (ASX: TOT) in a scrip-for-scrip rollover. In addition, CVC received 690,240,449 A Class units from CVC Property Fund which entitled unitholders to any amount (net of costs and adjustments) in excess of the independent valuation of $26 million arising from the sale of the properties at 357 – 373 Warringah Road and 8 Rodborough Road Frenchs Forest under the contract for sale as at 22 April 2015.
28.2 Financial performance and cash flow informationThe financial performance and cash flow information presented are for the period from 1 July 2014 to 22 April 2015.
2015 $
Revenue 3,172,794Expenses (1,252,686)
Profit before income tax 1,920,108Income tax benefit -
Profit after income tax of discontinued operation 1,920,108
Loss on sale of the subsidiary before income tax (2,354,210)Income tax benefit 2,888,808
Gain on sale of the subsidiary after income tax 534,598
Profit from discontinued operation 2,454,706
Attributable to Shareholders 2,278,947Non-controlling interest 175,759
2,454,706
Net cash inflow from operating activities 1,956,348Net cash inflow from investing activities (includes a net inflow of $5,000,000 (2015) and $4,086,703 (2014) from the sale of the subsidiary) 4,693,444Net cash outflow from financing activities (1,942,540)
Net increase in cash generated by the subsidiary 4,707,252
For
per
sona
l use
onl
y
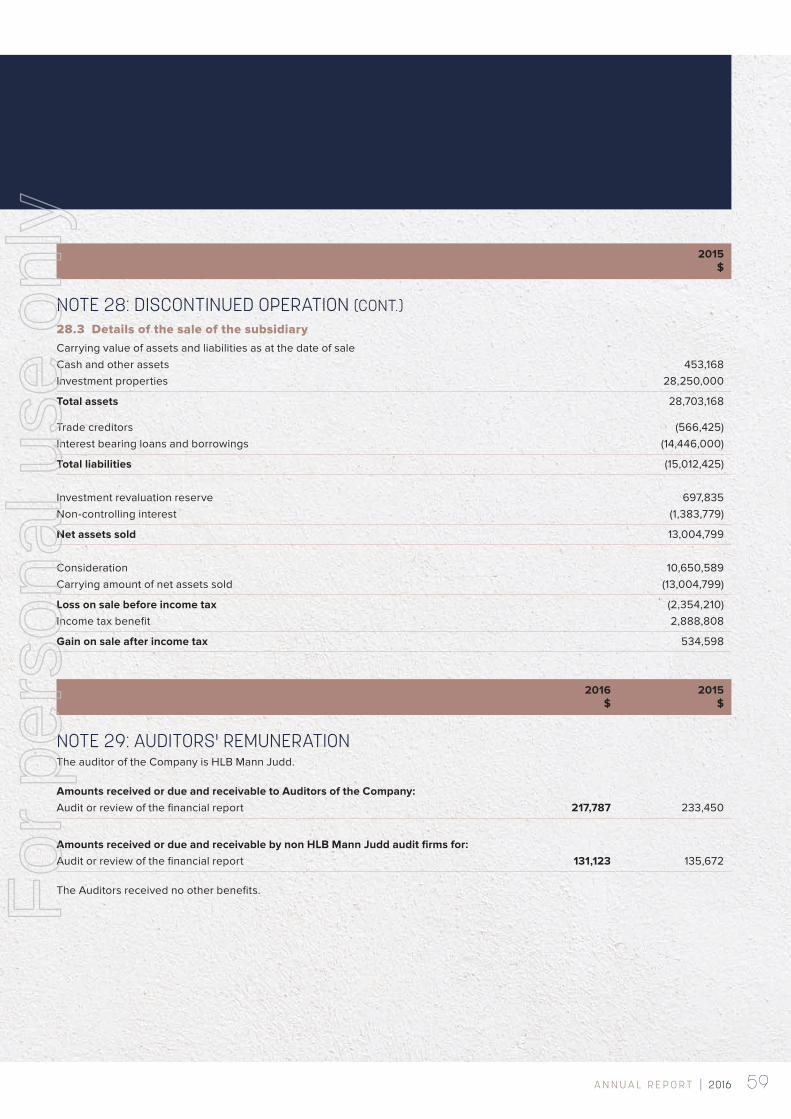
59A N N U A L R E P O R T | 2016
2015 $
NOTE 28: DISCONTINUED OPERATION (CONT.)28.3 Details of the sale of the subsidiaryCarrying value of assets and liabilities as at the date of sale Cash and other assets 453,168Investment properties 28,250,000
Total assets 28,703,168
Trade creditors (566,425)Interest bearing loans and borrowings (14,446,000)
Total liabilities (15,012,425)
Investment revaluation reserve 697,835Non-controlling interest (1,383,779)
Net assets sold 13,004,799
Consideration 10,650,589Carrying amount of net assets sold (13,004,799)
Loss on sale before income tax (2,354,210)Income tax benefit 2,888,808
Gain on sale after income tax 534,598
2016 2015 $ $
NOTE 29: AUDITORS' REMUNERATIONThe auditor of the Company is HLB Mann Judd.
Amounts received or due and receivable to Auditors of the Company:Audit or review of the financial report 217,787 233,450
Amounts received or due and receivable by non HLB Mann Judd audit firms for:Audit or review of the financial report 131,123 135,672
The Auditors received no other benefits.For
per
sona
l use
onl
y
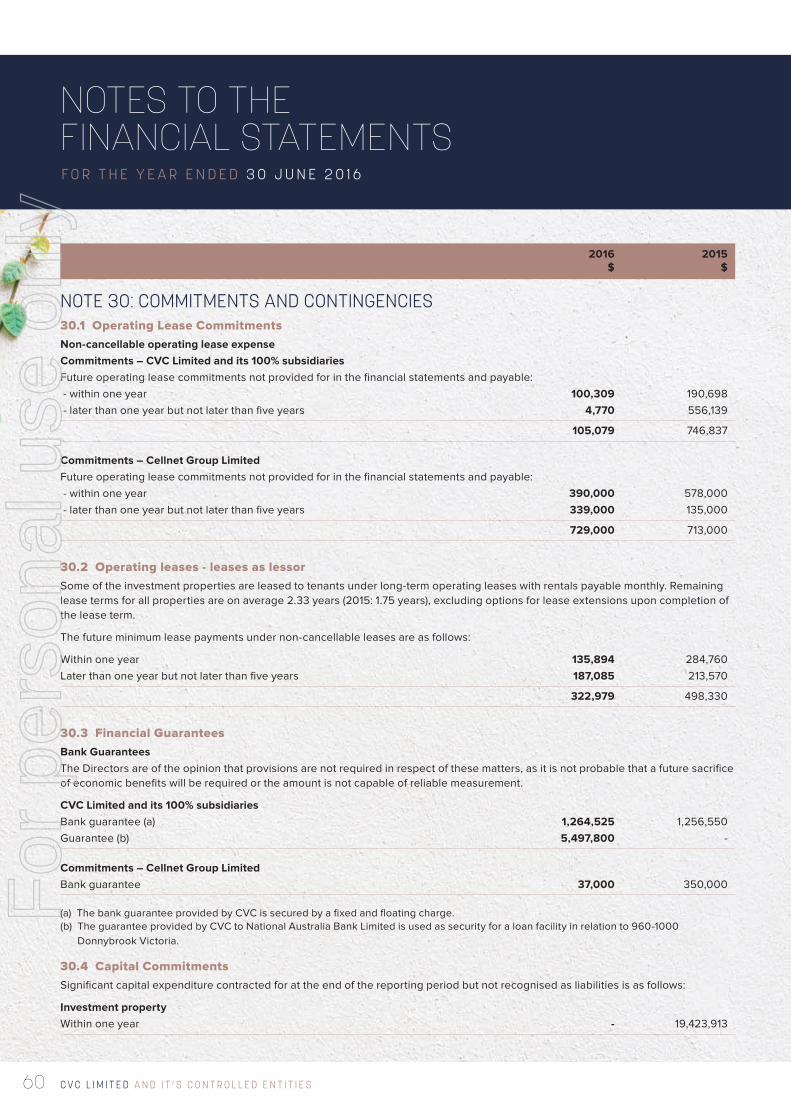
C V C L I M I T E D A N D I T ’ S C O N T R O L L E D E N T I T I E S60
NOTES TO THE FINANCIAL STATEMENTSF O R T H E Y E A R E N D E D 3 0 J U N E 2 0 1 6
2016 2015 $ $
NOTE 30: COMMITMENTS AND CONTINGENCIES30.1 Operating Lease CommitmentsNon-cancellable operating lease expenseCommitments – CVC Limited and its 100% subsidiaries Future operating lease commitments not provided for in the financial statements and payable: - within one year 100,309 190,698 - later than one year but not later than five years 4,770 556,139
105,079 746,837
Commitments – Cellnet Group Limited Future operating lease commitments not provided for in the financial statements and payable: - within one year 390,000 578,000 - later than one year but not later than five years 339,000 135,000
729,000 713,000
30.2 Operating leases - leases as lessorSome of the investment properties are leased to tenants under long-term operating leases with rentals payable monthly. Remaining lease terms for all properties are on average 2.33 years (2015: 1.75 years), excluding options for lease extensions upon completion of the lease term.
The future minimum lease payments under non-cancellable leases are as follows:
Within one year 135,894 284,760Later than one year but not later than five years 187,085 213,570
322,979 498,330
30.3 Financial Guarantees Bank GuaranteesThe Directors are of the opinion that provisions are not required in respect of these matters, as it is not probable that a future sacrifice of economic benefits will be required or the amount is not capable of reliable measurement.
CVC Limited and its 100% subsidiaries Bank guarantee (a) 1,264,525 1,256,550Guarantee (b) 5,497,800 -
Commitments – Cellnet Group Limited Bank guarantee 37,000 350,000
(a) The bank guarantee provided by CVC is secured by a fixed and floating charge.(b) The guarantee provided by CVC to National Australia Bank Limited is used as security for a loan facility in relation to 960-1000
Donnybrook Victoria.
30.4 Capital CommitmentsSignificant capital expenditure contracted for at the end of the reporting period but not recognised as liabilities is as follows:
Investment property Within one year - 19,423,913
For
per
sona
l use
onl
y
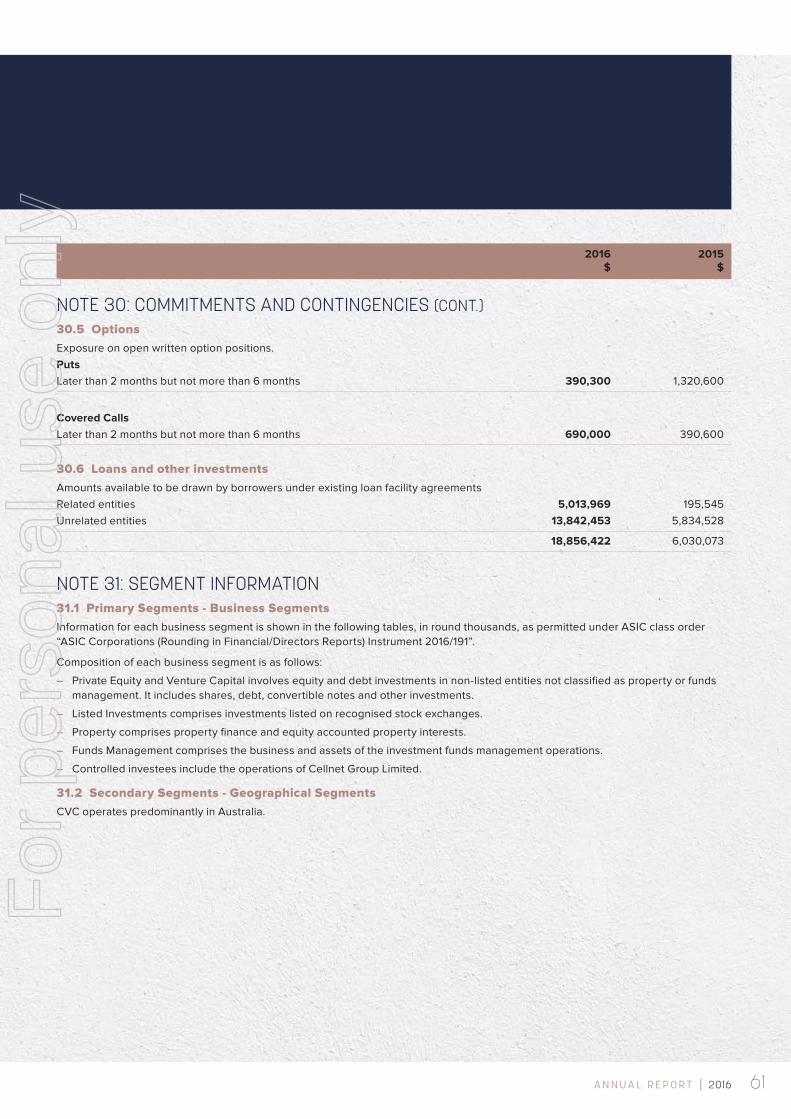
61A N N U A L R E P O R T | 2016
2016 2015 $ $
NOTE 30: COMMITMENTS AND CONTINGENCIES (CONT.)30.5 OptionsExposure on open written option positions.Puts Later than 2 months but not more than 6 months 390,300 1,320,600
Covered Calls Later than 2 months but not more than 6 months 690,000 390,600
30.6 Loans and other investmentsAmounts available to be drawn by borrowers under existing loan facility agreementsRelated entities 5,013,969 195,545Unrelated entities 13,842,453 5,834,528
18,856,422 6,030,073
NOTE 31: SEGMENT INFORMATION31.1 Primary Segments - Business Segments Information for each business segment is shown in the following tables, in round thousands, as permitted under ASIC class order “ASIC Corporations (Rounding in Financial/Directors Reports) Instrument 2016/191”.
Composition of each business segment is as follows:
– Private Equity and Venture Capital involves equity and debt investments in non-listed entities not classified as property or funds management. It includes shares, debt, convertible notes and other investments.
– Listed Investments comprises investments listed on recognised stock exchanges.
– Property comprises property finance and equity accounted property interests.
– Funds Management comprises the business and assets of the investment funds management operations.
– Controlled investees include the operations of Cellnet Group Limited.
31.2 Secondary Segments - Geographical SegmentsCVC operates predominantly in Australia.
For
per
sona
l use
onl
y
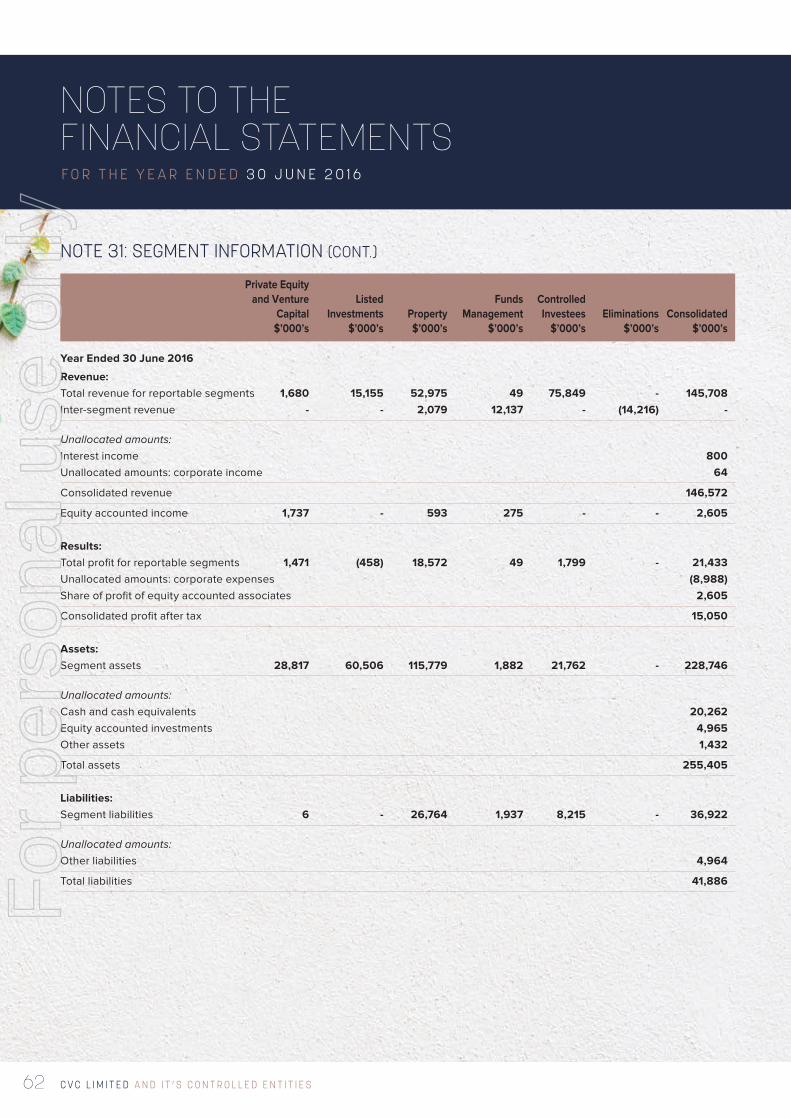
C V C L I M I T E D A N D I T ’ S C O N T R O L L E D E N T I T I E S62
NOTES TO THE FINANCIAL STATEMENTSF O R T H E Y E A R E N D E D 3 0 J U N E 2 0 1 6
NOTE 31: SEGMENT INFORMATION (CONT.)
Private Equity and Venture Listed Funds Controlled Capital Investments Property Management Investees Eliminations Consolidated $’000’s $’000’s $’000’s $’000’s $’000’s $’000’s $’000’s
Year Ended 30 June 2016
Revenue: Total revenue for reportable segments 1,680 15,155 52,975 49 75,849 - 145,708Inter-segment revenue - - 2,079 12,137 - (14,216) -
Unallocated amounts: Interest income 800Unallocated amounts: corporate income 64
Consolidated revenue 146,572
Equity accounted income 1,737 - 593 275 - - 2,605
Results: Total profit for reportable segments 1,471 (458) 18,572 49 1,799 - 21,433Unallocated amounts: corporate expenses (8,988)Share of profit of equity accounted associates 2,605
Consolidated profit after tax 15,050
Assets: Segment assets 28,817 60,506 115,779 1,882 21,762 - 228,746
Unallocated amounts: Cash and cash equivalents 20,262Equity accounted investments 4,965Other assets 1,432
Total assets 255,405
Liabilities: Segment liabilities 6 - 26,764 1,937 8,215 - 36,922
Unallocated amounts: Other liabilities 4,964
Total liabilities 41,886For
per
sona
l use
onl
y
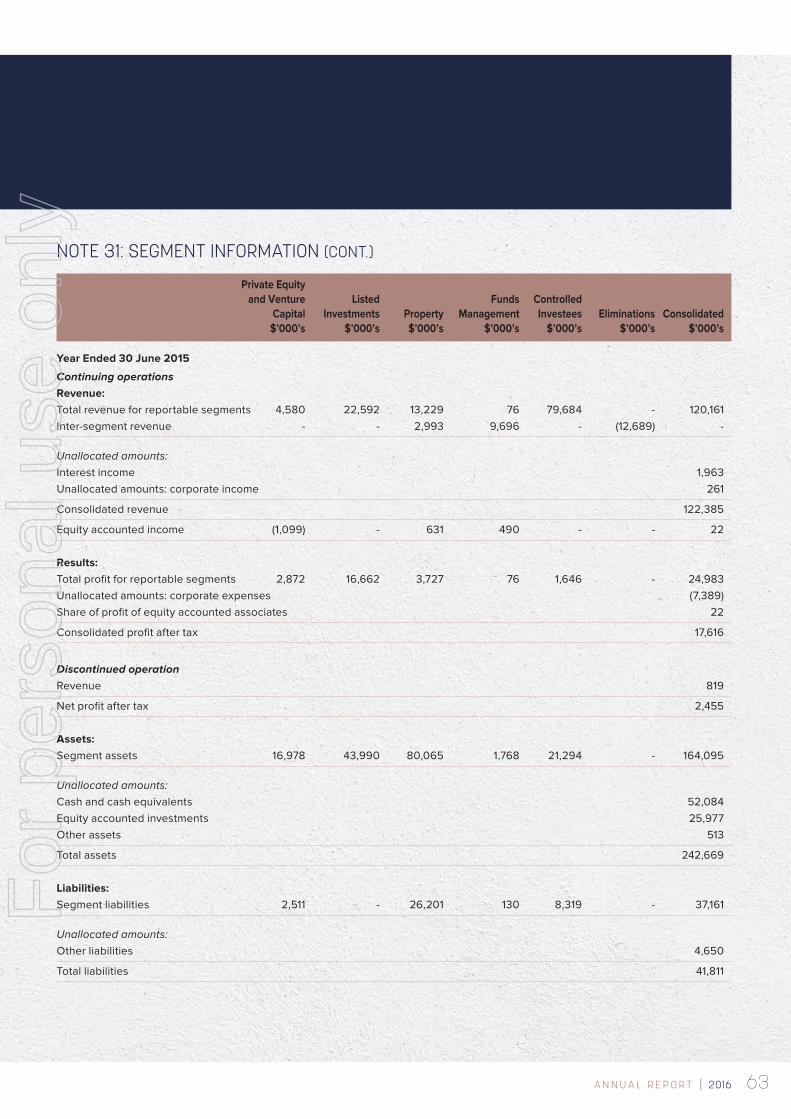
63A N N U A L R E P O R T | 2016
NOTE 31: SEGMENT INFORMATION (CONT.)
Private Equity and Venture Listed Funds Controlled Capital Investments Property Management Investees Eliminations Consolidated $’000’s $’000’s $’000’s $’000’s $’000’s $’000’s $’000’s
Year Ended 30 June 2015
Continuing operationsRevenue: Total revenue for reportable segments 4,580 22,592 13,229 76 79,684 - 120,161Inter-segment revenue - - 2,993 9,696 - (12,689) -
Unallocated amounts: Interest income 1,963Unallocated amounts: corporate income 261
Consolidated revenue 122,385
Equity accounted income (1,099) - 631 490 - - 22
Results: Total profit for reportable segments 2,872 16,662 3,727 76 1,646 - 24,983Unallocated amounts: corporate expenses (7,389)Share of profit of equity accounted associates 22
Consolidated profit after tax 17,616
Discontinued operation Revenue 819
Net profit after tax 2,455
Assets: Segment assets 16,978 43,990 80,065 1,768 21,294 - 164,095
Unallocated amounts: Cash and cash equivalents 52,084Equity accounted investments 25,977Other assets 513
Total assets 242,669
Liabilities: Segment liabilities 2,511 - 26,201 130 8,319 - 37,161
Unallocated amounts: Other liabilities 4,650
Total liabilities 41,811
For
per
sona
l use
onl
y
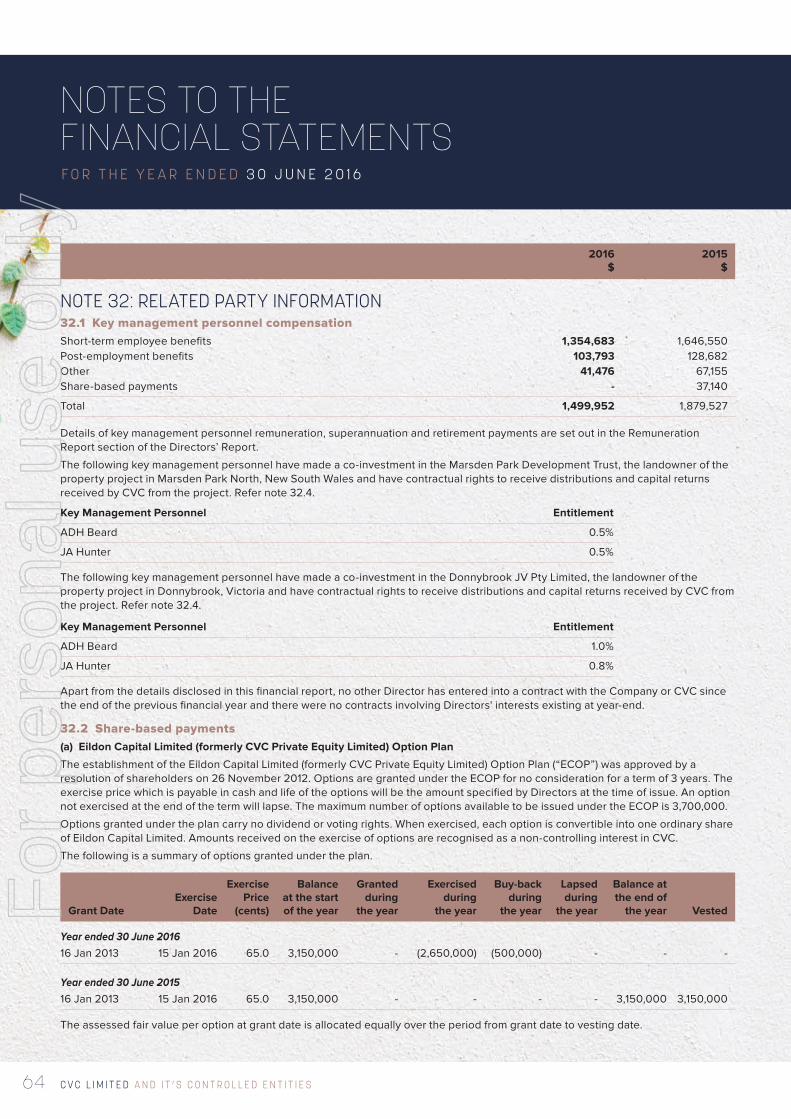
C V C L I M I T E D A N D I T ’ S C O N T R O L L E D E N T I T I E S64
NOTES TO THE FINANCIAL STATEMENTSF O R T H E Y E A R E N D E D 3 0 J U N E 2 0 1 6
2016 2015 $ $
NOTE 32: RELATED PARTY INFORMATION 32.1 Key management personnel compensationShort-term employee benefits 1,354,683 1,646,550Post-employment benefits 103,793 128,682Other 41,476 67,155Share-based payments - 37,140
Total 1,499,952 1,879,527
Details of key management personnel remuneration, superannuation and retirement payments are set out in the Remuneration Report section of the Directors’ Report.
The following key management personnel have made a co-investment in the Marsden Park Development Trust, the landowner of the property project in Marsden Park North, New South Wales and have contractual rights to receive distributions and capital returns received by CVC from the project. Refer note 32.4.
Key Management Personnel Entitlement
ADH Beard 0.5%
JA Hunter 0.5%
The following key management personnel have made a co-investment in the Donnybrook JV Pty Limited, the landowner of the property project in Donnybrook, Victoria and have contractual rights to receive distributions and capital returns received by CVC from the project. Refer note 32.4.
Key Management Personnel Entitlement
ADH Beard 1.0%
JA Hunter 0.8%
Apart from the details disclosed in this financial report, no other Director has entered into a contract with the Company or CVC since the end of the previous financial year and there were no contracts involving Directors' interests existing at year-end.
32.2 Share-based payments(a) Eildon Capital Limited (formerly CVC Private Equity Limited) Option Plan
The establishment of the Eildon Capital Limited (formerly CVC Private Equity Limited) Option Plan (“ECOP”) was approved by a resolution of shareholders on 26 November 2012. Options are granted under the ECOP for no consideration for a term of 3 years. The exercise price which is payable in cash and life of the options will be the amount specified by Directors at the time of issue. An option not exercised at the end of the term will lapse. The maximum number of options available to be issued under the ECOP is 3,700,000.
Options granted under the plan carry no dividend or voting rights. When exercised, each option is convertible into one ordinary share of Eildon Capital Limited. Amounts received on the exercise of options are recognised as a non-controlling interest in CVC.
The following is a summary of options granted under the plan.
Exercise Balance Granted Exercised Buy-back Lapsed Balance at Exercise Price at the start during during during during the end of Grant Date Date (cents) of the year the year the year the year the year the year Vested
Year ended 30 June 2016 16 Jan 2013 15 Jan 2016 65.0 3,150,000 - (2,650,000) (500,000) - - -
Year ended 30 June 2015 16 Jan 2013 15 Jan 2016 65.0 3,150,000 - - - - 3,150,000 3,150,000
The assessed fair value per option at grant date is allocated equally over the period from grant date to vesting date.
For
per
sona
l use
onl
y
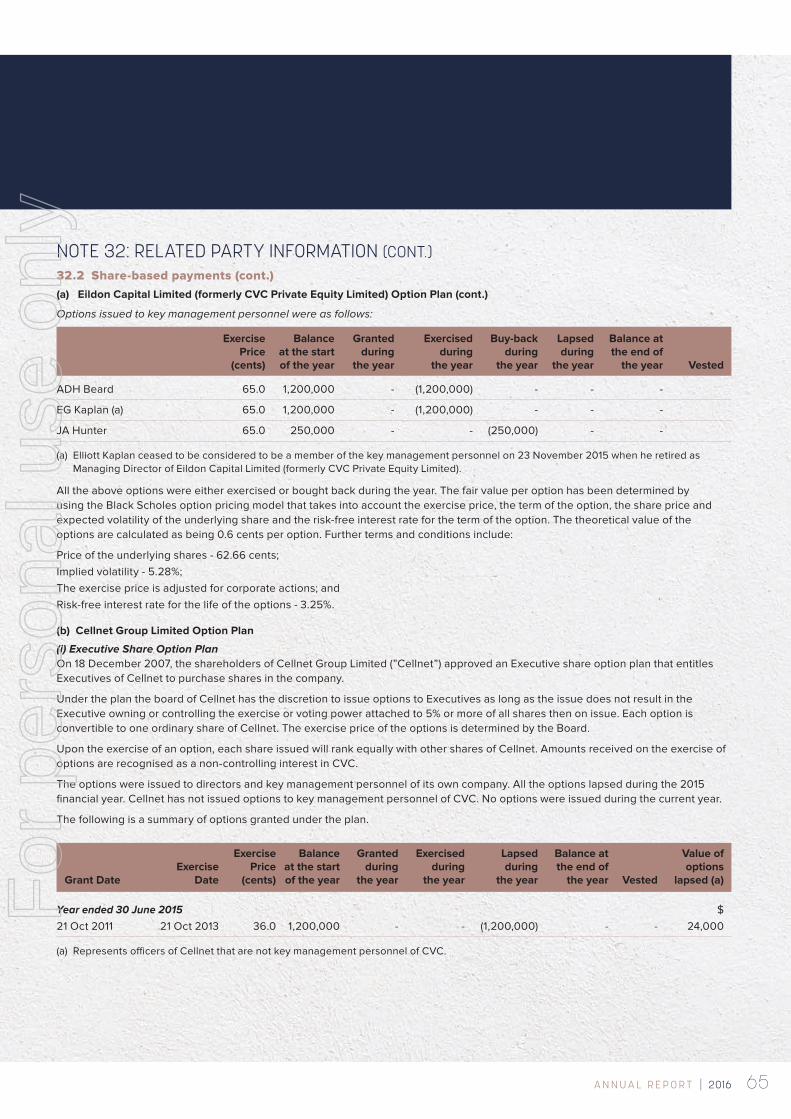
65A N N U A L R E P O R T | 2016
NOTE 32: RELATED PARTY INFORMATION (CONT.)32.2 Share-based payments (cont.)(a) Eildon Capital Limited (formerly CVC Private Equity Limited) Option Plan (cont.)
Options issued to key management personnel were as follows:
Exercise Balance Granted Exercised Buy-back Lapsed Balance at Price at the start during during during during the end of (cents) of the year the year the year the year the year the year Vested
ADH Beard 65.0 1,200,000 - (1,200,000) - - -
EG Kaplan (a) 65.0 1,200,000 - (1,200,000) - - -
JA Hunter 65.0 250,000 - - (250,000) - -
(a) Elliott Kaplan ceased to be considered to be a member of the key management personnel on 23 November 2015 when he retired as Managing Director of Eildon Capital Limited (formerly CVC Private Equity Limited).
All the above options were either exercised or bought back during the year. The fair value per option has been determined by using the Black Scholes option pricing model that takes into account the exercise price, the term of the option, the share price and expected volatility of the underlying share and the risk-free interest rate for the term of the option. The theoretical value of the options are calculated as being 0.6 cents per option. Further terms and conditions include:
Price of the underlying shares - 62.66 cents; Implied volatility - 5.28%; The exercise price is adjusted for corporate actions; and Risk-free interest rate for the life of the options - 3.25%.
(b) Cellnet Group Limited Option Plan
(i) Executive Share Option PlanOn 18 December 2007, the shareholders of Cellnet Group Limited (”Cellnet”) approved an Executive share option plan that entitles Executives of Cellnet to purchase shares in the company.
Under the plan the board of Cellnet has the discretion to issue options to Executives as long as the issue does not result in the Executive owning or controlling the exercise or voting power attached to 5% or more of all shares then on issue. Each option is convertible to one ordinary share of Cellnet. The exercise price of the options is determined by the Board.
Upon the exercise of an option, each share issued will rank equally with other shares of Cellnet. Amounts received on the exercise of options are recognised as a non-controlling interest in CVC.
The options were issued to directors and key management personnel of its own company. All the options lapsed during the 2015 financial year. Cellnet has not issued options to key management personnel of CVC. No options were issued during the current year.
The following is a summary of options granted under the plan.
Exercise Balance Granted Exercised Lapsed Balance at Value of Exercise Price at the start during during during the end of options Grant Date Date (cents) of the year the year the year the year the year Vested lapsed (a)
Year ended 30 June 2015 $21 Oct 2011 21 Oct 2013 36.0 1,200,000 - - (1,200,000) - - 24,000
(a) Represents officers of Cellnet that are not key management personnel of CVC.
For
per
sona
l use
onl
y
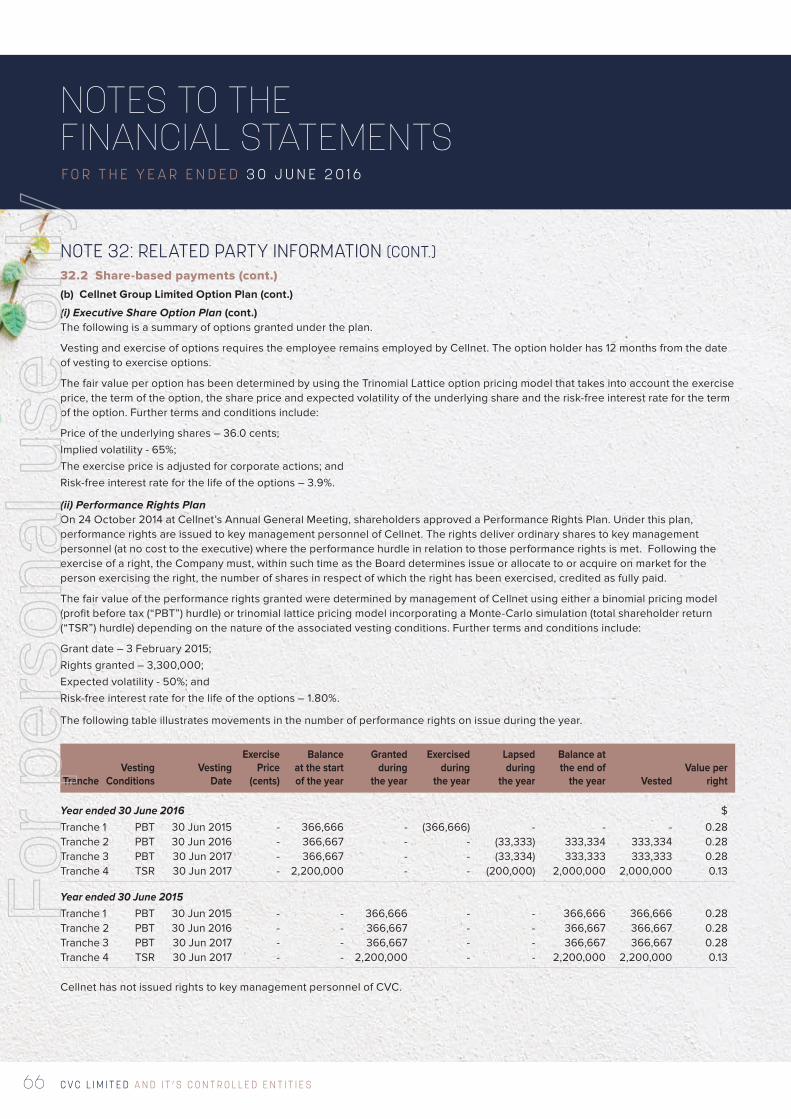
C V C L I M I T E D A N D I T ’ S C O N T R O L L E D E N T I T I E S66
NOTES TO THE FINANCIAL STATEMENTSF O R T H E Y E A R E N D E D 3 0 J U N E 2 0 1 6
NOTE 32: RELATED PARTY INFORMATION (CONT.)32.2 Share-based payments (cont.)(b) Cellnet Group Limited Option Plan (cont.)
(i) Executive Share Option Plan (cont.)The following is a summary of options granted under the plan.
Vesting and exercise of options requires the employee remains employed by Cellnet. The option holder has 12 months from the date of vesting to exercise options.
The fair value per option has been determined by using the Trinomial Lattice option pricing model that takes into account the exercise price, the term of the option, the share price and expected volatility of the underlying share and the risk-free interest rate for the term of the option. Further terms and conditions include:
Price of the underlying shares – 36.0 cents; Implied volatility - 65%; The exercise price is adjusted for corporate actions; and Risk-free interest rate for the life of the options – 3.9%.
(ii) Performance Rights PlanOn 24 October 2014 at Cellnet’s Annual General Meeting, shareholders approved a Performance Rights Plan. Under this plan, performance rights are issued to key management personnel of Cellnet. The rights deliver ordinary shares to key management personnel (at no cost to the executive) where the performance hurdle in relation to those performance rights is met. Following the exercise of a right, the Company must, within such time as the Board determines issue or allocate to or acquire on market for the person exercising the right, the number of shares in respect of which the right has been exercised, credited as fully paid.
The fair value of the performance rights granted were determined by management of Cellnet using either a binomial pricing model (profit before tax (“PBT”) hurdle) or trinomial lattice pricing model incorporating a Monte-Carlo simulation (total shareholder return (“TSR”) hurdle) depending on the nature of the associated vesting conditions. Further terms and conditions include:
Grant date – 3 February 2015;Rights granted – 3,300,000;Expected volatility - 50%; andRisk-free interest rate for the life of the options – 1.80%.
The following table illustrates movements in the number of performance rights on issue during the year.
Exercise Balance Granted Exercised Lapsed Balance at Vesting Vesting Price at the start during during during the end of Value per Tranche Conditions Date (cents) of the year the year the year the year the year Vested right
Year ended 30 June 2016 $ Tranche 1 PBT 30 Jun 2015 - 366,666 - (366,666) - - - 0.28Tranche 2 PBT 30 Jun 2016 - 366,667 - - (33,333) 333,334 333,334 0.28Tranche 3 PBT 30 Jun 2017 - 366,667 - - (33,334) 333,333 333,333 0.28Tranche 4 TSR 30 Jun 2017 - 2,200,000 - - (200,000) 2,000,000 2,000,000 0.13
Year ended 30 June 2015 Tranche 1 PBT 30 Jun 2015 - - 366,666 - - 366,666 366,666 0.28Tranche 2 PBT 30 Jun 2016 - - 366,667 - - 366,667 366,667 0.28Tranche 3 PBT 30 Jun 2017 - - 366,667 - - 366,667 366,667 0.28Tranche 4 TSR 30 Jun 2017 - - 2,200,000 - - 2,200,000 2,200,000 0.13
Cellnet has not issued rights to key management personnel of CVC.
For
per
sona
l use
onl
y
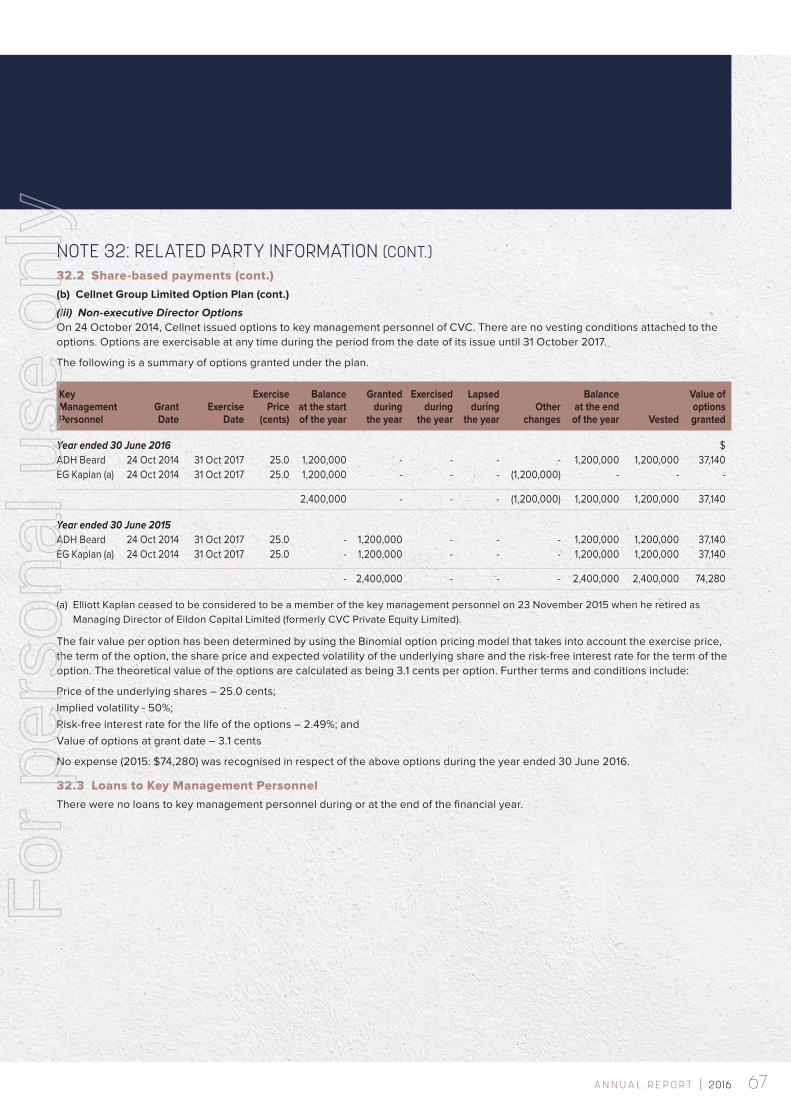
67A N N U A L R E P O R T | 2016
NOTE 32: RELATED PARTY INFORMATION (CONT.)32.2 Share-based payments (cont.)(b) Cellnet Group Limited Option Plan (cont.)
(iii) Non-executive Director OptionsOn 24 October 2014, Cellnet issued options to key management personnel of CVC. There are no vesting conditions attached to the options. Options are exercisable at any time during the period from the date of its issue until 31 October 2017.
The following is a summary of options granted under the plan.
Key Exercise Balance Granted Exercised Lapsed Balance Value of Management Grant Exercise Price at the start during during during Other at the end options Personnel Date Date (cents) of the year the year the year the year changes of the year Vested granted
Year ended 30 June 2016 $ADH Beard 24 Oct 2014 31 Oct 2017 25.0 1,200,000 - - - - 1,200,000 1,200,000 37,140EG Kaplan (a) 24 Oct 2014 31 Oct 2017 25.0 1,200,000 - - - (1,200,000) - - -
2,400,000 - - - (1,200,000) 1,200,000 1,200,000 37,140
Year ended 30 June 2015ADH Beard 24 Oct 2014 31 Oct 2017 25.0 - 1,200,000 - - - 1,200,000 1,200,000 37,140EG Kaplan (a) 24 Oct 2014 31 Oct 2017 25.0 - 1,200,000 - - - 1,200,000 1,200,000 37,140
- 2,400,000 - - - 2,400,000 2,400,000 74,280
(a) Elliott Kaplan ceased to be considered to be a member of the key management personnel on 23 November 2015 when he retired as Managing Director of Eildon Capital Limited (formerly CVC Private Equity Limited).
The fair value per option has been determined by using the Binomial option pricing model that takes into account the exercise price, the term of the option, the share price and expected volatility of the underlying share and the risk-free interest rate for the term of the option. The theoretical value of the options are calculated as being 3.1 cents per option. Further terms and conditions include:
Price of the underlying shares – 25.0 cents; Implied volatility - 50%; Risk-free interest rate for the life of the options – 2.49%; andValue of options at grant date – 3.1 cents
No expense (2015: $74,280) was recognised in respect of the above options during the year ended 30 June 2016.
32.3 Loans to Key Management PersonnelThere were no loans to key management personnel during or at the end of the financial year.
For
per
sona
l use
onl
y
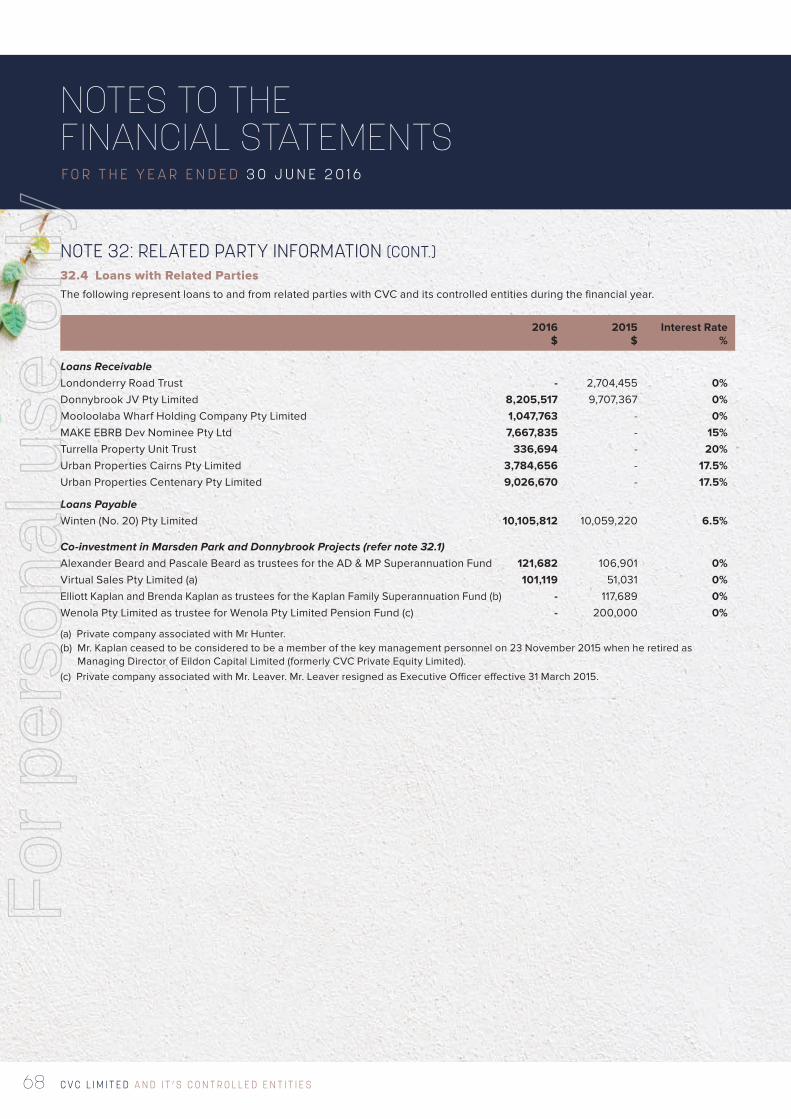
C V C L I M I T E D A N D I T ’ S C O N T R O L L E D E N T I T I E S68
NOTES TO THE FINANCIAL STATEMENTSF O R T H E Y E A R E N D E D 3 0 J U N E 2 0 1 6
NOTE 32: RELATED PARTY INFORMATION (CONT.)32.4 Loans with Related Parties The following represent loans to and from related parties with CVC and its controlled entities during the financial year.
2016 2015 Interest Rate $ $ %
Loans Receivable Londonderry Road Trust - 2,704,455 0%Donnybrook JV Pty Limited 8,205,517 9,707,367 0%Mooloolaba Wharf Holding Company Pty Limited 1,047,763 - 0%MAKE EBRB Dev Nominee Pty Ltd 7,667,835 - 15%Turrella Property Unit Trust 336,694 - 20%Urban Properties Cairns Pty Limited 3,784,656 - 17.5%Urban Properties Centenary Pty Limited 9,026,670 - 17.5%
Loans Payable Winten (No. 20) Pty Limited 10,105,812 10,059,220 6.5%
Co-investment in Marsden Park and Donnybrook Projects (refer note 32.1) Alexander Beard and Pascale Beard as trustees for the AD & MP Superannuation Fund 121,682 106,901 0%Virtual Sales Pty Limited (a) 101,119 51,031 0%Elliott Kaplan and Brenda Kaplan as trustees for the Kaplan Family Superannuation Fund (b) - 117,689 0%Wenola Pty Limited as trustee for Wenola Pty Limited Pension Fund (c) - 200,000 0%
(a) Private company associated with Mr Hunter.(b) Mr. Kaplan ceased to be considered to be a member of the key management personnel on 23 November 2015 when he retired as
Managing Director of Eildon Capital Limited (formerly CVC Private Equity Limited).(c) Private company associated with Mr. Leaver. Mr. Leaver resigned as Executive Officer effective 31 March 2015.
For
per
sona
l use
onl
y
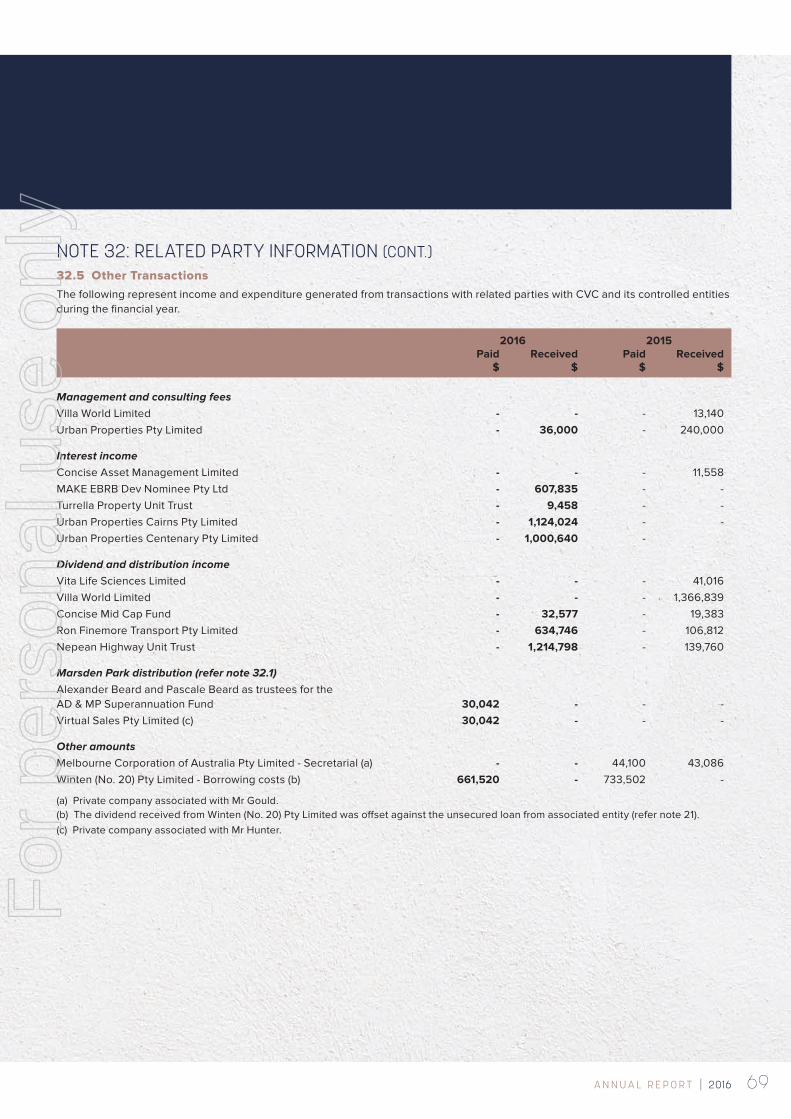
69A N N U A L R E P O R T | 2016
NOTE 32: RELATED PARTY INFORMATION (CONT.)32.5 Other TransactionsThe following represent income and expenditure generated from transactions with related parties with CVC and its controlled entities during the financial year.
2016 2015 Paid Received Paid Received $ $ $ $
Management and consulting fees Villa World Limited - - - 13,140Urban Properties Pty Limited - 36,000 - 240,000
Interest income Concise Asset Management Limited - - - 11,558MAKE EBRB Dev Nominee Pty Ltd - 607,835 - -Turrella Property Unit Trust - 9,458 - -Urban Properties Cairns Pty Limited - 1,124,024 - -Urban Properties Centenary Pty Limited - 1,000,640 -
Dividend and distribution income Vita Life Sciences Limited - - - 41,016Villa World Limited - - - 1,366,839Concise Mid Cap Fund - 32,577 - 19,383Ron Finemore Transport Pty Limited - 634,746 - 106,812Nepean Highway Unit Trust - 1,214,798 - 139,760
Marsden Park distribution (refer note 32.1) Alexander Beard and Pascale Beard as trustees for the AD & MP Superannuation Fund 30,042 - - -Virtual Sales Pty Limited (c) 30,042 - - -
Other amounts Melbourne Corporation of Australia Pty Limited - Secretarial (a) - - 44,100 43,086Winten (No. 20) Pty Limited - Borrowing costs (b) 661,520 - 733,502 -
(a) Private company associated with Mr Gould.(b) The dividend received from Winten (No. 20) Pty Limited was offset against the unsecured loan from associated entity (refer note 21).(c) Private company associated with Mr Hunter.
For
per
sona
l use
onl
y
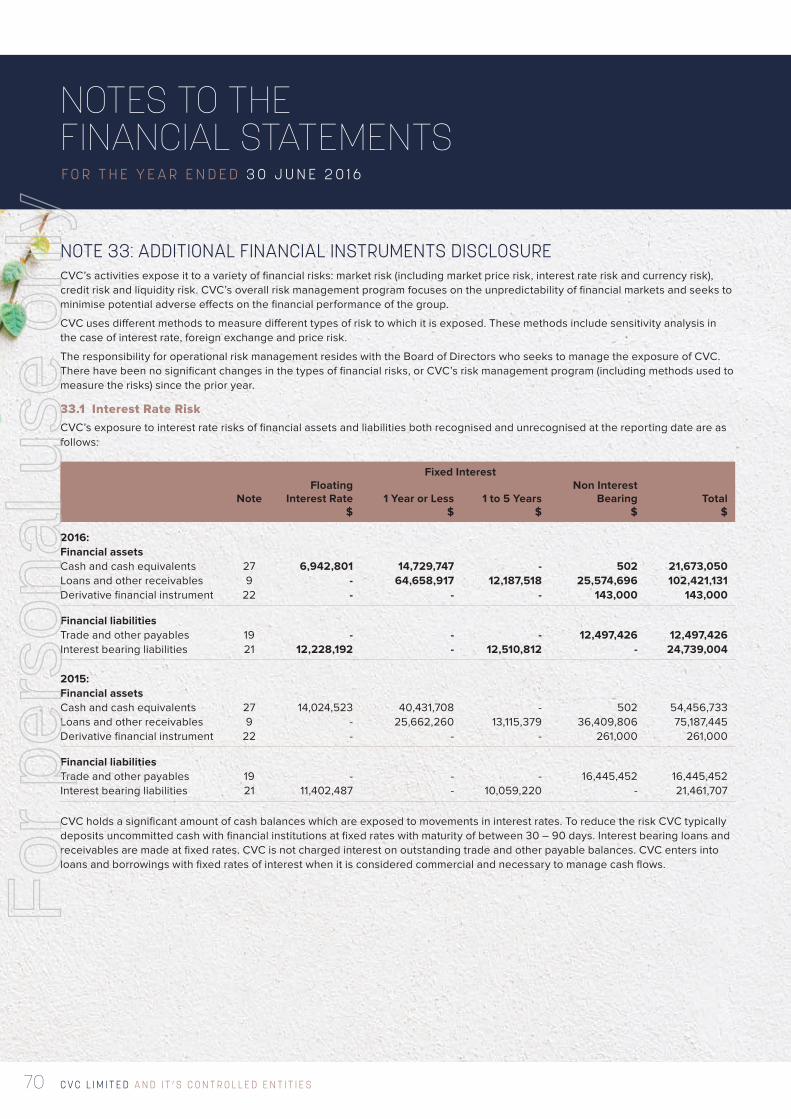
C V C L I M I T E D A N D I T ’ S C O N T R O L L E D E N T I T I E S70
NOTES TO THE FINANCIAL STATEMENTSF O R T H E Y E A R E N D E D 3 0 J U N E 2 0 1 6
NOTE 33: ADDITIONAL FINANCIAL INSTRUMENTS DISCLOSURECVC’s activities expose it to a variety of financial risks: market risk (including market price risk, interest rate risk and currency risk), credit risk and liquidity risk. CVC’s overall risk management program focuses on the unpredictability of financial markets and seeks to minimise potential adverse effects on the financial performance of the group.
CVC uses different methods to measure different types of risk to which it is exposed. These methods include sensitivity analysis in the case of interest rate, foreign exchange and price risk.
The responsibility for operational risk management resides with the Board of Directors who seeks to manage the exposure of CVC. There have been no significant changes in the types of financial risks, or CVC’s risk management program (including methods used to measure the risks) since the prior year.
33.1 Interest Rate RiskCVC’s exposure to interest rate risks of financial assets and liabilities both recognised and unrecognised at the reporting date are as follows:
Fixed Interest Floating Non Interest Note Interest Rate 1 Year or Less 1 to 5 Years Bearing Total $ $ $ $ $
2016:Financial assets Cash and cash equivalents 27 6,942,801 14,729,747 - 502 21,673,050Loans and other receivables 9 - 64,658,917 12,187,518 25,574,696 102,421,131Derivative financial instrument 22 - - - 143,000 143,000
Financial liabilities Trade and other payables 19 - - - 12,497,426 12,497,426Interest bearing liabilities 21 12,228,192 - 12,510,812 - 24,739,004
2015: Financial assets Cash and cash equivalents 27 14,024,523 40,431,708 - 502 54,456,733Loans and other receivables 9 - 25,662,260 13,115,379 36,409,806 75,187,445Derivative financial instrument 22 - - - 261,000 261,000
Financial liabilities Trade and other payables 19 - - - 16,445,452 16,445,452Interest bearing liabilities 21 11,402,487 - 10,059,220 - 21,461,707
CVC holds a significant amount of cash balances which are exposed to movements in interest rates. To reduce the risk CVC typically deposits uncommitted cash with financial institutions at fixed rates with maturity of between 30 – 90 days. Interest bearing loans and receivables are made at fixed rates. CVC is not charged interest on outstanding trade and other payable balances. CVC enters into loans and borrowings with fixed rates of interest when it is considered commercial and necessary to manage cash flows.
For
per
sona
l use
onl
y
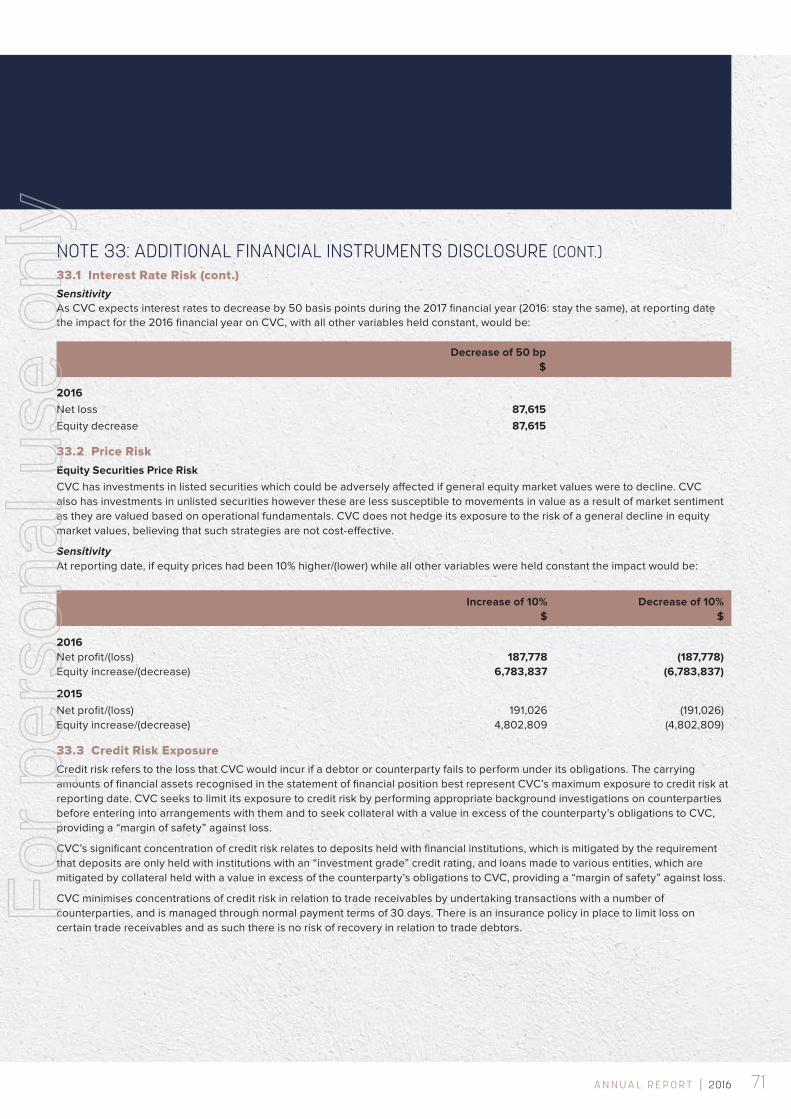
71A N N U A L R E P O R T | 2016
NOTE 33: ADDITIONAL FINANCIAL INSTRUMENTS DISCLOSURE (CONT.)33.1 Interest Rate Risk (cont.)Sensitivity As CVC expects interest rates to decrease by 50 basis points during the 2017 financial year (2016: stay the same), at reporting date the impact for the 2016 financial year on CVC, with all other variables held constant, would be:
Decrease of 50 bp $
2016 Net loss 87,615 Equity decrease 87,615
33.2 Price RiskEquity Securities Price RiskCVC has investments in listed securities which could be adversely affected if general equity market values were to decline. CVC also has investments in unlisted securities however these are less susceptible to movements in value as a result of market sentiment as they are valued based on operational fundamentals. CVC does not hedge its exposure to the risk of a general decline in equity market values, believing that such strategies are not cost-effective.
Sensitivity At reporting date, if equity prices had been 10% higher/(lower) while all other variables were held constant the impact would be:
Increase of 10% Decrease of 10% $ $
2016 Net profit/(loss) 187,778 (187,778)Equity increase/(decrease) 6,783,837 (6,783,837)
2015 Net profit/(loss) 191,026 (191,026)Equity increase/(decrease) 4,802,809 (4,802,809)
33.3 Credit Risk ExposureCredit risk refers to the loss that CVC would incur if a debtor or counterparty fails to perform under its obligations. The carrying amounts of financial assets recognised in the statement of financial position best represent CVC’s maximum exposure to credit risk at reporting date. CVC seeks to limit its exposure to credit risk by performing appropriate background investigations on counterparties before entering into arrangements with them and to seek collateral with a value in excess of the counterparty’s obligations to CVC, providing a “margin of safety” against loss.
CVC’s significant concentration of credit risk relates to deposits held with financial institutions, which is mitigated by the requirement that deposits are only held with institutions with an “investment grade” credit rating, and loans made to various entities, which are mitigated by collateral held with a value in excess of the counterparty’s obligations to CVC, providing a “margin of safety” against loss.
CVC minimises concentrations of credit risk in relation to trade receivables by undertaking transactions with a number of counterparties, and is managed through normal payment terms of 30 days. There is an insurance policy in place to limit loss on certain trade receivables and as such there is no risk of recovery in relation to trade debtors.
For
per
sona
l use
onl
y
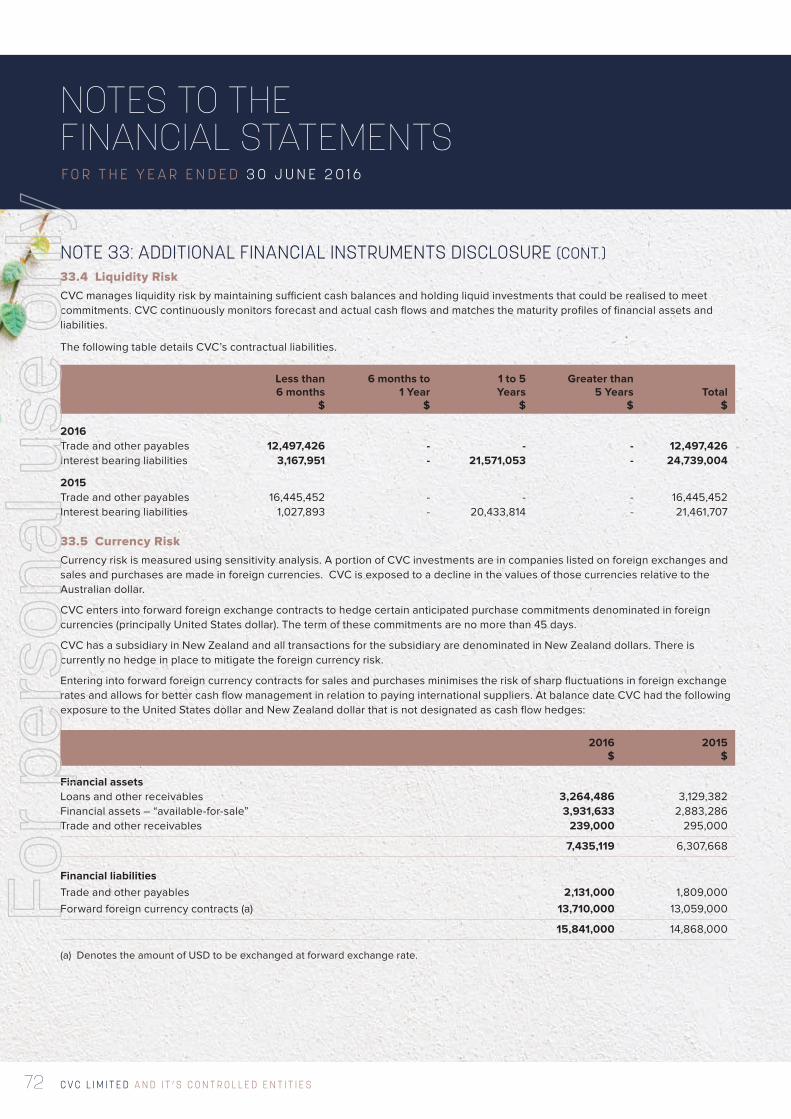
C V C L I M I T E D A N D I T ’ S C O N T R O L L E D E N T I T I E S72
NOTES TO THE FINANCIAL STATEMENTSF O R T H E Y E A R E N D E D 3 0 J U N E 2 0 1 6
NOTE 33: ADDITIONAL FINANCIAL INSTRUMENTS DISCLOSURE (CONT.)33.4 Liquidity Risk CVC manages liquidity risk by maintaining sufficient cash balances and holding liquid investments that could be realised to meet commitments. CVC continuously monitors forecast and actual cash flows and matches the maturity profiles of financial assets and liabilities.
The following table details CVC’s contractual liabilities.
Less than 6 months to 1 to 5 Greater than 6 months 1 Year Years 5 Years Total $ $ $ $ $
2016 Trade and other payables 12,497,426 - - - 12,497,426Interest bearing liabilities 3,167,951 - 21,571,053 - 24,739,004
2015 Trade and other payables 16,445,452 - - - 16,445,452Interest bearing liabilities 1,027,893 - 20,433,814 - 21,461,707
33.5 Currency Risk Currency risk is measured using sensitivity analysis. A portion of CVC investments are in companies listed on foreign exchanges and sales and purchases are made in foreign currencies. CVC is exposed to a decline in the values of those currencies relative to the Australian dollar.
CVC enters into forward foreign exchange contracts to hedge certain anticipated purchase commitments denominated in foreign currencies (principally United States dollar). The term of these commitments are no more than 45 days.
CVC has a subsidiary in New Zealand and all transactions for the subsidiary are denominated in New Zealand dollars. There is currently no hedge in place to mitigate the foreign currency risk.
Entering into forward foreign currency contracts for sales and purchases minimises the risk of sharp fluctuations in foreign exchange rates and allows for better cash flow management in relation to paying international suppliers. At balance date CVC had the following exposure to the United States dollar and New Zealand dollar that is not designated as cash flow hedges:
2016 2015 $ $
Financial assets Loans and other receivables 3,264,486 3,129,382Financial assets – “available-for-sale” 3,931,633 2,883,286Trade and other receivables 239,000 295,000
7,435,119 6,307,668
Financial liabilities Trade and other payables 2,131,000 1,809,000Forward foreign currency contracts (a) 13,710,000 13,059,000
15,841,000 14,868,000
(a) Denotes the amount of USD to be exchanged at forward exchange rate.
For
per
sona
l use
onl
y
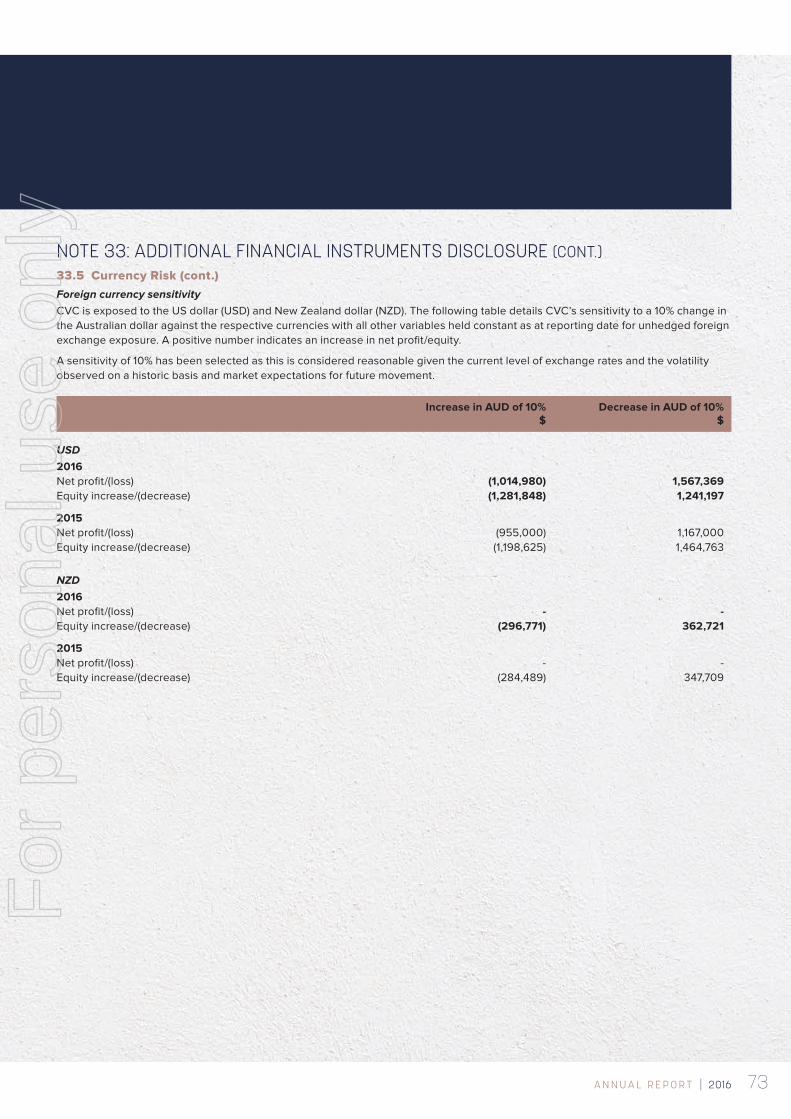
73A N N U A L R E P O R T | 2016
NOTE 33: ADDITIONAL FINANCIAL INSTRUMENTS DISCLOSURE (CONT.)33.5 Currency Risk (cont.)Foreign currency sensitivityCVC is exposed to the US dollar (USD) and New Zealand dollar (NZD). The following table details CVC’s sensitivity to a 10% change in the Australian dollar against the respective currencies with all other variables held constant as at reporting date for unhedged foreign exchange exposure. A positive number indicates an increase in net profit/equity.
A sensitivity of 10% has been selected as this is considered reasonable given the current level of exchange rates and the volatility observed on a historic basis and market expectations for future movement. Increase in AUD of 10% Decrease in AUD of 10% $ $
USD 2016 Net profit/(loss) (1,014,980) 1,567,369Equity increase/(decrease) (1,281,848) 1,241,197
2015 Net profit/(loss) (955,000) 1,167,000Equity increase/(decrease) (1,198,625) 1,464,763
NZD 2016 Net profit/(loss) - -Equity increase/(decrease) (296,771) 362,721
2015 Net profit/(loss) - -Equity increase/(decrease) (284,489) 347,709
For
per
sona
l use
onl
y
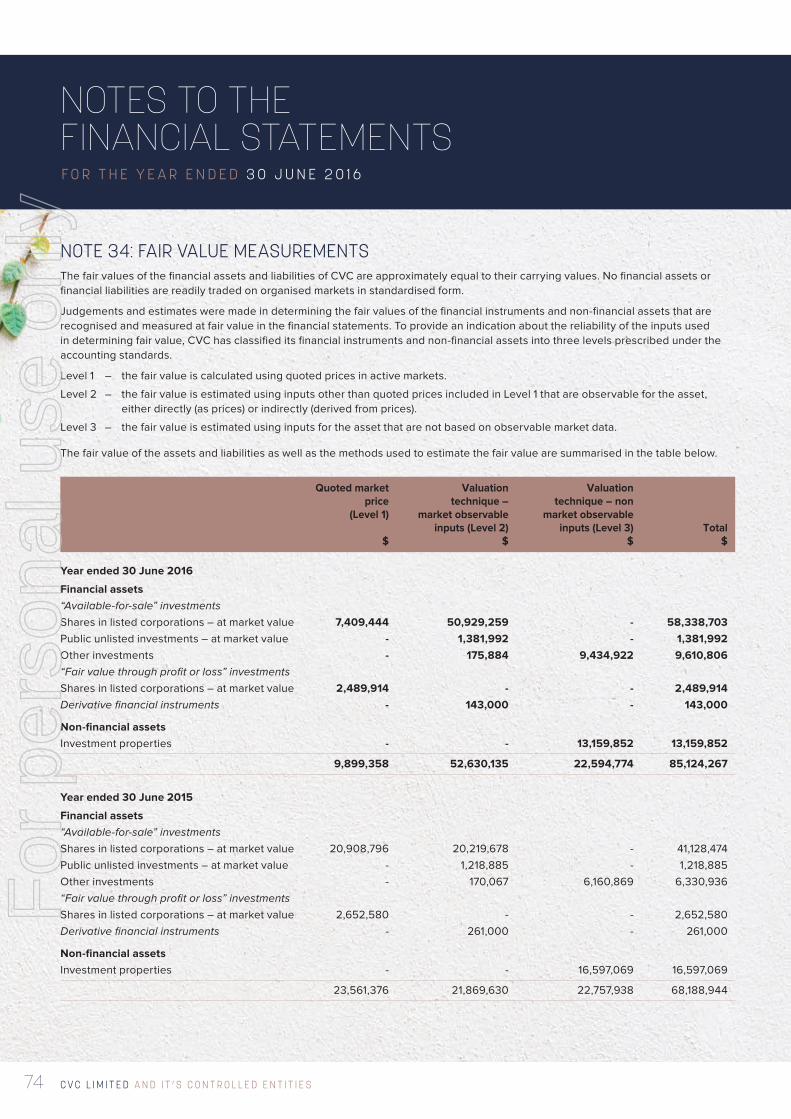
C V C L I M I T E D A N D I T ’ S C O N T R O L L E D E N T I T I E S74
NOTES TO THE FINANCIAL STATEMENTSF O R T H E Y E A R E N D E D 3 0 J U N E 2 0 1 6
NOTE 34: FAIR VALUE MEASUREMENTSThe fair values of the financial assets and liabilities of CVC are approximately equal to their carrying values. No financial assets or financial liabilities are readily traded on organised markets in standardised form.
Judgements and estimates were made in determining the fair values of the financial instruments and non-financial assets that are recognised and measured at fair value in the financial statements. To provide an indication about the reliability of the inputs used in determining fair value, CVC has classified its financial instruments and non-financial assets into three levels prescribed under the accounting standards.
Level 1 – the fair value is calculated using quoted prices in active markets.
Level 2 – the fair value is estimated using inputs other than quoted prices included in Level 1 that are observable for the asset, either directly (as prices) or indirectly (derived from prices).
Level 3 – the fair value is estimated using inputs for the asset that are not based on observable market data.
The fair value of the assets and liabilities as well as the methods used to estimate the fair value are summarised in the table below.
Quoted market Valuation Valuation price technique – technique – non (Level 1) market observable market observable inputs (Level 2) inputs (Level 3) Total $ $ $ $
Year ended 30 June 2016
Financial assets “Available-for-sale” investments Shares in listed corporations – at market value 7,409,444 50,929,259 - 58,338,703Public unlisted investments – at market value - 1,381,992 - 1,381,992Other investments - 175,884 9,434,922 9,610,806“Fair value through profit or loss” investments Shares in listed corporations – at market value 2,489,914 - - 2,489,914Derivative financial instruments - 143,000 - 143,000
Non-financial assets Investment properties - - 13,159,852 13,159,852
9,899,358 52,630,135 22,594,774 85,124,267
Year ended 30 June 2015
Financial assets “Available-for-sale” investments Shares in listed corporations – at market value 20,908,796 20,219,678 - 41,128,474Public unlisted investments – at market value - 1,218,885 - 1,218,885Other investments - 170,067 6,160,869 6,330,936“Fair value through profit or loss” investments
Shares in listed corporations – at market value 2,652,580 - - 2,652,580Derivative financial instruments - 261,000 - 261,000
Non-financial assets Investment properties - - 16,597,069 16,597,069
23,561,376 21,869,630 22,757,938 68,188,944
For
per
sona
l use
onl
y
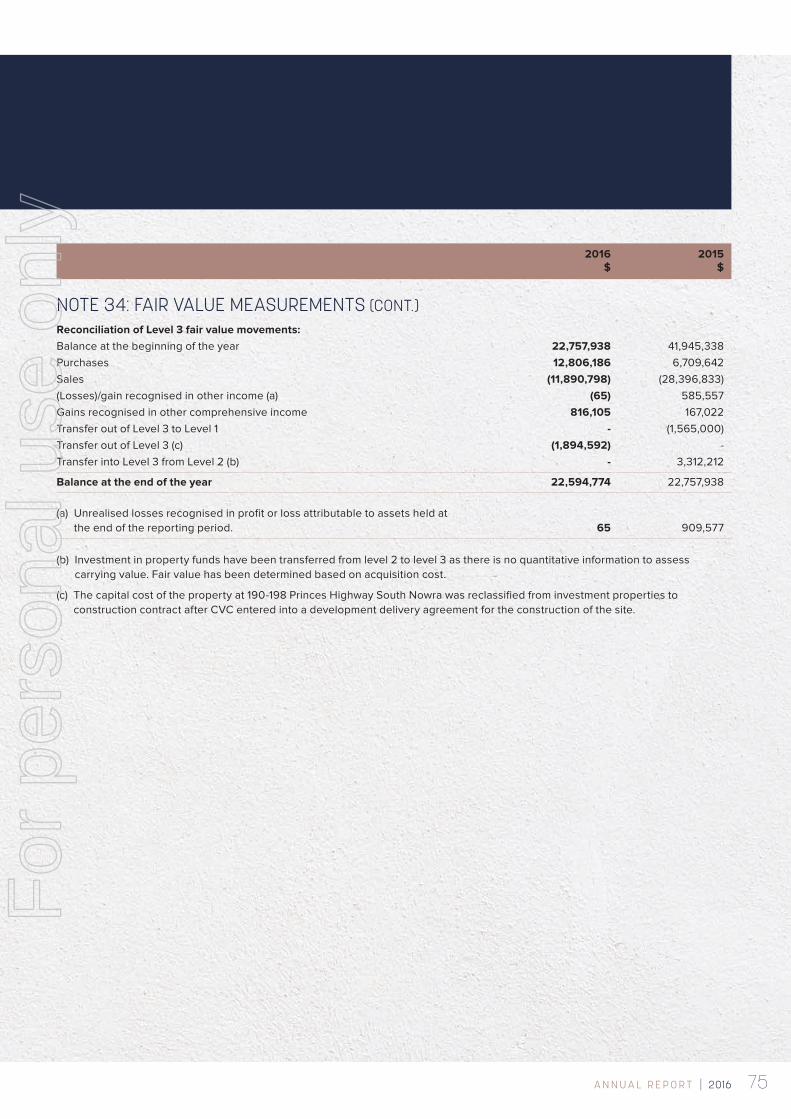
75A N N U A L R E P O R T | 2016
2016 2015 $ $
NOTE 34: FAIR VALUE MEASUREMENTS (CONT.)Reconciliation of Level 3 fair value movements:Balance at the beginning of the year 22,757,938 41,945,338Purchases 12,806,186 6,709,642Sales (11,890,798) (28,396,833)(Losses)/gain recognised in other income (a) (65) 585,557Gains recognised in other comprehensive income 816,105 167,022Transfer out of Level 3 to Level 1 - (1,565,000)Transfer out of Level 3 (c) (1,894,592) -Transfer into Level 3 from Level 2 (b) - 3,312,212
Balance at the end of the year 22,594,774 22,757,938 (a) Unrealised losses recognised in profit or loss attributable to assets held at
the end of the reporting period. 65 909,577
(b) Investment in property funds have been transferred from level 2 to level 3 as there is no quantitative information to assess carrying value. Fair value has been determined based on acquisition cost.
(c) The capital cost of the property at 190-198 Princes Highway South Nowra was reclassified from investment properties to construction contract after CVC entered into a development delivery agreement for the construction of the site.
For
per
sona
l use
onl
y
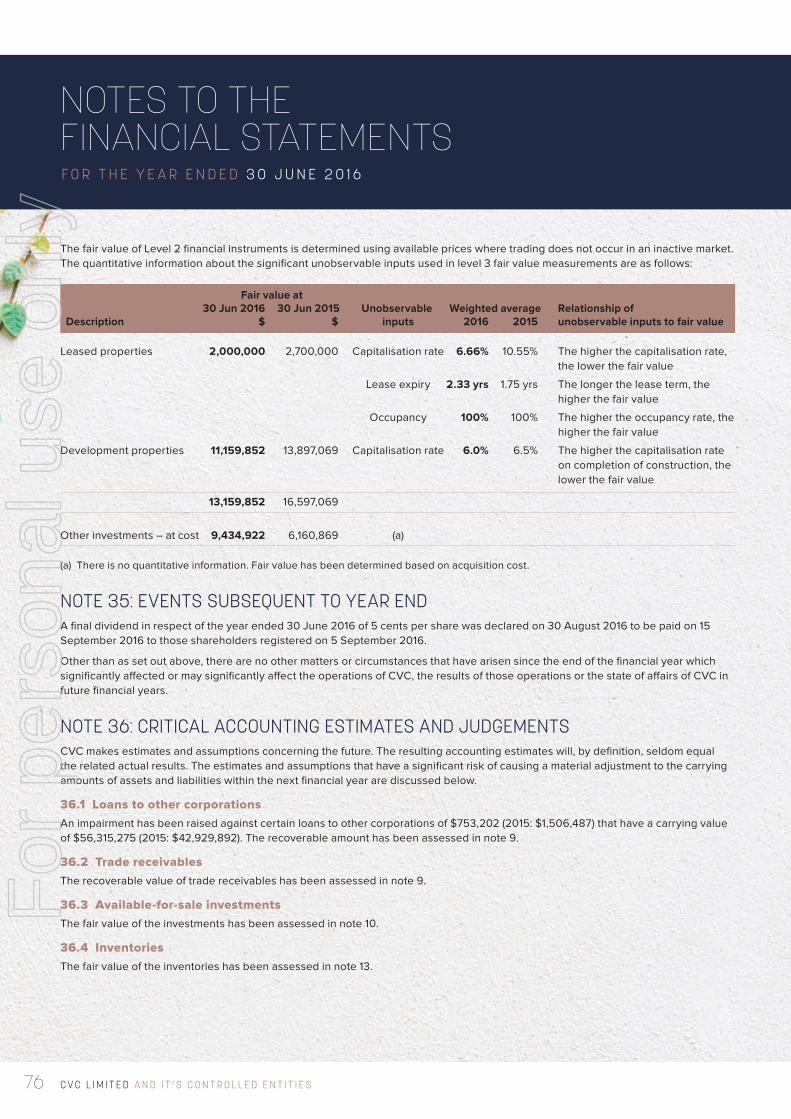
C V C L I M I T E D A N D I T ’ S C O N T R O L L E D E N T I T I E S76
NOTES TO THE FINANCIAL STATEMENTSF O R T H E Y E A R E N D E D 3 0 J U N E 2 0 1 6
The fair value of Level 2 financial instruments is determined using available prices where trading does not occur in an inactive market. The quantitative information about the significant unobservable inputs used in level 3 fair value measurements are as follows:
Fair value at 30 Jun 2016 30 Jun 2015 Unobservable Weighted average Relationship of Description $ $ inputs 2016 2015 unobservable inputs to fair value
Leased properties 2,000,000 2,700,000 Capitalisation rate 6.66% 10.55% The higher the capitalisation rate, the lower the fair value
Lease expiry 2.33 yrs 1.75 yrs The longer the lease term, the higher the fair value
Occupancy 100% 100% The higher the occupancy rate, the higher the fair value
Development properties 11,159,852 13,897,069 Capitalisation rate 6.0% 6.5% The higher the capitalisation rate on completion of construction, the lower the fair value
13,159,852 16,597,069
Other investments – at cost 9,434,922 6,160,869 (a)
(a) There is no quantitative information. Fair value has been determined based on acquisition cost.
NOTE 35: EVENTS SUBSEQUENT TO YEAR ENDA final dividend in respect of the year ended 30 June 2016 of 5 cents per share was declared on 30 August 2016 to be paid on 15 September 2016 to those shareholders registered on 5 September 2016.
Other than as set out above, there are no other matters or circumstances that have arisen since the end of the financial year which significantly affected or may significantly affect the operations of CVC, the results of those operations or the state of affairs of CVC in future financial years.
NOTE 36: CRITICAL ACCOUNTING ESTIMATES AND JUDGEMENTSCVC makes estimates and assumptions concerning the future. The resulting accounting estimates will, by definition, seldom equal the related actual results. The estimates and assumptions that have a significant risk of causing a material adjustment to the carrying amounts of assets and liabilities within the next financial year are discussed below.
36.1 Loans to other corporationsAn impairment has been raised against certain loans to other corporations of $753,202 (2015: $1,506,487) that have a carrying value of $56,315,275 (2015: $42,929,892). The recoverable amount has been assessed in note 9.
36.2 Trade receivablesThe recoverable value of trade receivables has been assessed in note 9.
36.3 Available-for-sale investmentsThe fair value of the investments has been assessed in note 10.
36.4 InventoriesThe fair value of the inventories has been assessed in note 13.
For
per
sona
l use
onl
y

77A N N U A L R E P O R T | 2016
NOTE 36: CRITICAL ACCOUNTING ESTIMATES AND JUDGEMENTS (CONT.)36.5 Absence of active marketIn calculating the fair value of Resource Generation Limited, Buru Energy Limited, Bionomics Limited, Grays Ecommerce Group Limited, Cyclopharm Limited, Heritage Brands Ltd, Lantern Hotel Group, MMA Offshore Limited, Mitchell Services Limited, Primary Opinion Limited, Spicers Limited, 360 Capital Total Return Fund, Universal Biosensors Inc, and Vita Life Sciences Limited CVC has determined that an active market may not exist for significant holdings because each company does not trade on a daily basis; each trade that is executed, excluding those by CVC, is small in size; and the market capitalisation is small such that larger institutions do not hold significant shareholdings. However the active market in small amounts of trading does provide a guide for valuation in that it indicates whether or not the market values the intangible assets of an entity. This factor has been used in determining the valuation of each company. The fair value of the investments has been assessed in note 10.
36.6 Investments accounted for using the equity method – unlisted investmentsGreen’s Foods Holdings Pty Limited had a carrying value of $14,660,528 as at 30 June 2015. CVC had discounted net tangible asset backing to reflect an estimate of the recoverable value of assets of the company to reflect the current trading environment. If the discount is +/- 10% the impact on the carrying value of Green’s Foods Holdings Pty Limited is +/- $1,466,053.
Concise Asset Management Limited has a carrying value of $1,125,489 (2015: $1,081,096).
JAK Investment Group Pty Limited has a carrying value of $352,654 (2015: $168,054).
LAC Unit Trust has a carrying value of $398,695 (2015: nil).
Urban Properties Pty Limited has a carrying value of nil (2015: $360,000).
The carrying value of MAKE EBRB Dev Nominee Pty has a carrying value of $3,486,434 (2015: nil).
36.7 Property, plant and equipmentThe recoverable value of property, plant and equipment have been assessed in note 16.
36.8 Investment propertiesThe recoverable value of investment properties have been assessed in note 17.
For
per
sona
l use
onl
y
C V C L I M I T E D A N D I T ’ S C O N T R O L L E D E N T I T I E S78
DIRECTORS’ DECLARATIONF O R T H E Y E A R E N D E D 3 0 J U N E 2 0 1 6
In the opinion of the Directors of CVC Limited:
(a) The financial statements and notes of the consolidated entity are in accordance with the Corporations Act 2001, including:
(i) giving a true and fair view of the consolidated entity’s financial position as at 30 June 2016 and of its performance for the year ended on that date; and
(ii) complying with Accounting Standards and the Corporations Regulations 2001.
(b) the financial statements and notes also comply with International Financial Reporting Standards as disclosed in Note 1.
(c) there are reasonable grounds to believe that the Company will be able to pay its debts as and when they become due and payable; and
(d) the audited remuneration disclosures set out on pages 15 to 17 of the Directors' Report comply with Accounting Standards AASB 124 Related Party Disclosures and the Corporations Regulations 2001.
This declaration has been made after receiving the declarations required to be made to the Directors in accordance with s. 295A of the Corporations Act 2001 for the financial period ended 30 June 2016.
Dated at Sydney 30 August 2016.
Signed in accordance with a resolution of the Board of Directors.
ADH Beard JD ReadDirector Director
For
per
sona
l use
onl
y
79A N N U A L R E P O R T | 2016
INDEPENDENT AUDITOR'S REPORTF O R T H E Y E A R E N D E D 3 0 J U N E 2 0 1 6
To the members of CVC Limited:
We have audited the accompanying financial report of CVC Limited (“the company”), which comprises the consolidated statement of financial position as at 30 June 2016, the consolidated statement of financial performance, the consolidated statement of comprehensive income, the consolidated statement of changes in equity and the consolidated statement of cash flows for the year then ended, notes comprising a summary of significant accounting policies and other explanatory information, and the directors’ declaration, for the consolidated entity. The consolidated entity comprises the company and the entities it controlled at the year’s end or from time to time during the financial year.
Directors’ Responsibility for the Financial ReportThe directors of the company are responsible for the preparation of the financial report that gives a true and fair view in accordance with Australian Accounting Standards and the Corporations Act 2001 and for such internal control as the directors determine is necessary to enable the preparation of the financial report that gives a true and fair view and is free from material misstatement, whether due to fraud or error.
In Note 1, the directors also state, in accordance with Accounting Standard AASB 101: Presentation of Financial Statements, that the consolidated financial statements comply with International Financial Reporting Standards.
Auditor’s ResponsibilityOur responsibility is to express an opinion on the financial report based on our audit. We conducted our audit in accordance with Australian Auditing Standards. Those standards require that we comply with relevant ethical requirements relating to audit engagements and plan and perform the audit to obtain reasonable assurance about whether the financial report is free from material misstatement.
An audit involves performing procedures to obtain audit evidence about the amounts and disclosures in the financial report. The procedures selected depend on the auditor’s judgement, including the assessment of the risks of material misstatement of the financial report, whether due to fraud or error. In making those risk assessments, the auditor considers internal control relevant to the company’s preparation of the financial report that gives a true and fair view in order to design audit procedures that are appropriate in the circumstances, but not for the purpose of expressing an opinion on the effectiveness of the company’s and its controlled entities’ internal control. An audit also includes evaluating the appropriateness of accounting policies used and the reasonableness of accounting estimates made by the directors, as well as evaluating the overall presentation of the financial report.
Our audit did not involve an analysis of the prudence of business decisions made by directors or management.
We believe that the audit evidence we have obtained is sufficient and appropriate to provide a basis for our audit opinion.
IndependenceIn conducting our audit, we have complied with the independence requirements of the Corporations Act 2001.
OpinionIn our opinion:
(a) the financial report of CVC Limited is in accordance with the Corporations Act 2001, including:
(i) giving a true and fair view of the consolidated entity’s financial position as at 30 June 2016 and its performance for the year ended on that date; and
(ii) complying with Australian Accounting Standards and the Corporations Regulations 2001; and
(b) the financial report also complies with International Financial Reporting Standards as disclosed in Note 1.
Report on the Remuneration ReportWe have audited the Remuneration Report included in the directors’ report for the year ended 30 June 2016. The directors of the company are responsible for the preparation and presentation of the Remuneration Report in accordance with section 300A of the Corporations Act 2001. Our responsibility is to express an opinion on the Remuneration Report, based on our audit conducted in accordance with Australian Auditing Standards.
OpinionIn our opinion, the Remuneration Report of CVC Limited for the year ended 30 June 2016 complies with section 300A of the Corporations Act 2001.
HLB MANN JUDD M. D. MULLERChartered Accountants Partner
Sydney, NSW 30 August 2016
Liability limited by a scheme approved under Professional Standards Legislation
For
per
sona
l use
onl
y
C V C L I M I T E D A N D I T ’ S C O N T R O L L E D E N T I T I E S80
CORPORATE GOVERNANCE STATEMENT
The Board of Directors of the Company is responsible for the corporate governance of CVC. It is required to act with integrity, honesty, in good faith and in the best interest of the Company as a whole in the execution of its duties including setting, guiding and monitoring the business and affairs of the Company, including risk management, and compliance with regulatory, legal and ethical standards. The Board is responsible for the oversight of reporting to the shareholders by whom they are elected and to whom they are accountable. It is responsible for ensuring there is adequate oversight and management of material business risks facing the Company and ensuring there are systems in place to identify, assess, monitor and manage market, operational and compliance risks. This is achieved via a control environment, accountability and review of risk profiles.
The Board has delegated to the Managing Director all of the necessary power and authority to manage the business of the Company on a day-to-day basis with the assistance of senior management. This includes execution of the strategy approved by the Board, managing performance, risk management and compliance of the Company. The Company has implemented a risk management framework which describes and sets out the risks (financial and non-financial) facing the business activities of the Company and controls surrounding those risks. The profiles are formally reviewed annually by management. The financial risks that may adversely impact the operations of the Company are described and analysed in the annual financial report.
At the date of this report the Directors in office are as follows:
Alexander Damien Beard (Managing Director) – Appointed 17 August 2000, member of the audit committee
John Douglas Read – Appointed 20 March 1989, member of the audit committee
Ian Houston Campbell – Appointed 16 March 2015, member of the audit committee
Appointment to the Company and the Board is dependent on skills, experience, character and other qualifications rather than solely on achieving a pre-specified diversity target. The Board seeks to ensure its members have an appropriate mix of skills, knowledge and experience to enable it to properly perform its duties, which have been detailed in the Directors’ Report, including numbers and attendances of Board and audit committee meetings. Given the size and scale of the organisation the Board has not adopted a policy and measurable targets in relation to diversity but notes that neither the Board nor the senior management have a woman appointed and currently 33% of the Company’s employees are women.
The Board considers that CVC seeks to comply, where appropriate, with the Corporate Governance Principles and Recommendations issued by the ASX Corporate Governance Council. Where CVC does not comply, this is primarily due to the current size, scale and nature of the operations. The Council recognises that “a one size fits all” approach may be inappropriate. Companies are at liberty to determine whether
each recommendation is appropriate. Different companies face different circumstances hence some recommendations are unnecessary or may even be counter-productive. In particular it acknowledged that it may be inappropriate or uneconomic for smaller companies, such as CVC, to follow the same rules as Australia’s largest listed companies. The Council has issued recommendations and require companies to adopt an ‘if not why not’ approach to reporting compliance, requiring companies to identify the recommendations that have not been followed and give reasons for not following them.
The Company chose to adopt selected recommendations throughout the financial year ended 30 June 2016, in particular those discussed in detail below:
Board Composition and Directors’ Experience The Board of the Company comprises three Directors.
Mr Beard, being Managing Director, is responsible for the management and operation of the Company and ensures that members of the Board are properly briefed on the operations of the Company. Those powers not specifically reserved to the Board and which are required for the management and operation of the Company, are conferred on the Managing Director.
Mr Read is a non-executive Director of the Board and Chairman of the audit committee. As he has been on the Board of the Company for more than twenty five years, he is not considered independent. Further information in relation to the audit committee can be found in the Directors’ Report to the financial report.
Mr Campbell is an independent non-executive Director and has extensive skills, experience and knowledge to perform his duties in that capacity.
The Board elects a member to chair each meeting and believe that the current structure of the Board operates effectively and efficiently, allowing the Board to collectively exercise its authority without the need for the appointment of additional independent directors or the creation of further sub-committees and is appropriate for the size and scale of the Company. The Board has considered the competencies and experience of each of the Directors and believes that it is not in the interest of shareholders to seek to replace or appoint Board members. The Board as a whole reviews Board succession planning and continuing development to ensure the members have an appropriate balance of skills. Directors are encouraged to undertake professional development to enable them to develop and maintain the skills and knowledge needed to effectively perform their roles as Directors, where considered appropriate for the oversight of the Company.
The Company Secretary supports the effectiveness of the Board by monitoring that Board policy and procedures are followed and deals with regulatory bodies on statutory matters.
For these reasons, the Company did not adopt the following recommendations throughout the financial year ended 30 June 2016:
For
per
sona
l use
onl
y
81A N N U A L R E P O R T | 2016
– Appointing a majority of independent Directors;
– Appointing an independent Chairman;
– Appointing an internal audit function, audit committee with an independent chairman, a majority of independent Directors or non-executive Directors;
– A nomination committee of the Board;
– A risk committee of the Board;
– Establishment of formal performance policies for Directors and senior management;
– Documentation of a Board skills matrix;
– Implementing a program for inducting new Directors;
– Implementing policies and processes for communication with shareholders and participation at meetings;
– A remuneration committee of the Board;
– Written agreement with directors and senior executives setting out terms of roles; and
– Adopting a policy and measurable targets to achieve gender diversity.
Performance of the Board and Senior ManagementThe Directors and senior management are regularly reviewed for measureable and qualitative performance. The Board as a whole has the responsibility to review its own performance and of individual directors. The Board undertakes an annual review at 30 June each year of the Managing Director and senior management.
The Board did not undertake a review of the performance of its members during the year ended 30 June 2016. Rather, the Board, mindful of its duties, considers it appropriate to monitor the performance on an ongoing basis and conduct a formal review as necessary.
When applicable, remuneration of non-executive Directors is in accordance with resolutions of shareholders at the general meeting. The Company does not have any schemes for retirement benefits, other than statutory superannuation for non-executive Directors.
The details of remuneration paid to Directors and senior management are disclosed in the Remuneration Report.
Costs and Benefits of ComplianceA number of the recommendations require the formal documentation of policies and procedures that the Company already substantially performs. The Company considered that to create such documentation independently and specifically for the Company, and create separate Boards and sub-committees to satisfy the requirements of the Corporate Governance Principles and Recommendations would have had minimal additional benefit but substantial additional expense. The Company is also mindful to not adopt such procedures and structures solely for the sake of adoption or where they could actually inhibit the proper function or development of the Company.
The Board has determined that the adoption of such formal policies and procedures must be tailored to the Company at minimal expense and must be appropriate for the Company, taking into account the size and complexity of its operations. The Company is currently considering the adoption and implementation of the following recommendations:
– A formal charter for the audit committee of the Company;
– Written policies and procedures to ensure compliance with ASX listing rules disclosure requirements; and
– A process for performance evaluation of the Board and individual Directors.
Other InformationThe Company has a policy of allowing Directors to take reasonable independent legal advice in the furtherance of their duties at the expense of the Company.
All members of the Board are members of the Audit Committee.
In respect of the year ended 30 June 2016, the Managing Director and the Chief Financial Officer have provided certifications to the Board that the financial records of the Company have been properly maintained and that the financial statements comply with the appropriate accounting standards and give a true and fair view of the financial position and performance of the Company and has a sound system of risk management and internal control which is operating effectively.
The Company has adopted policies in relation to conduct of Directors, senior management and employees of the Company. The policies require Directors, senior management and employees to act ethically, responsibly, honestly, in good faith, and in the best interest of the Company as a whole, whilst complying with laws and regulations.
The Company has adopted a Share Trading Policy, which must be complied with by all directors and employees. The policy summarises the insider trading prohibitions in the Corporations Act 2001 and provides information on trading windows, exceptional circumstances, excluded trading, and an obligation on directors and employees to disclose all trades in the Company’s shares.
The Company’s external auditor attends the annual general meeting and is available to answer questions from the shareholders relevant to the audit.
In accordance with the ASX Continuous Disclosure requirements, the Company ensures that price sensitive information is released to the market on a timely basis including through the annual and half-yearly reports. At the election of shareholders reports issued by the Company are provided electronically. Additional information regarding the operation of CVC can be found at www.cvc.com.au, by contacting the Company directly or by attending the annual general meeting.
CORPORATE GOVERNANCE STATEMENT
For
per
sona
l use
onl
y
C V C L I M I T E D A N D I T ’ S C O N T R O L L E D E N T I T I E S82
ADDITIONAL INFORMATION
The following information was current as at 25 August 2016.
Distribution schedule
The distribution of shareholders and their shareholdings was as follows:-
Category (size of holding) Number of ordinary shareholders
1 - 1,000 189 1,001 - 5,000 244 5,001 - 10,000 151 10,001 - 100,000 226 100,001 - over 84
Total 894
Minimum parcel size Number of shareholders
Unmarketable parcelsMinimum $500.00 parcel at $1.52 per share 329 69
On market share buy-backThe Company has a current on market share buy-back which commenced on 23 November 2015.
Substantial holders The names of the Company’s substantial holders and the number of ordinary shares in which each has a relevant interest as disclosed in substantial holder notices given to the Company are as follows:
Shareholder Number of ordinary shares in which interest held
Leagou Pty Limited 20,704,611Southsea (Aust.) Pty Limited 17,610,506Bennett Estates Limited 15,575,978Joseph David Ross 12,000,000Muk Min Fa Limited 7,280,246
For
per
sona
l use
onl
y
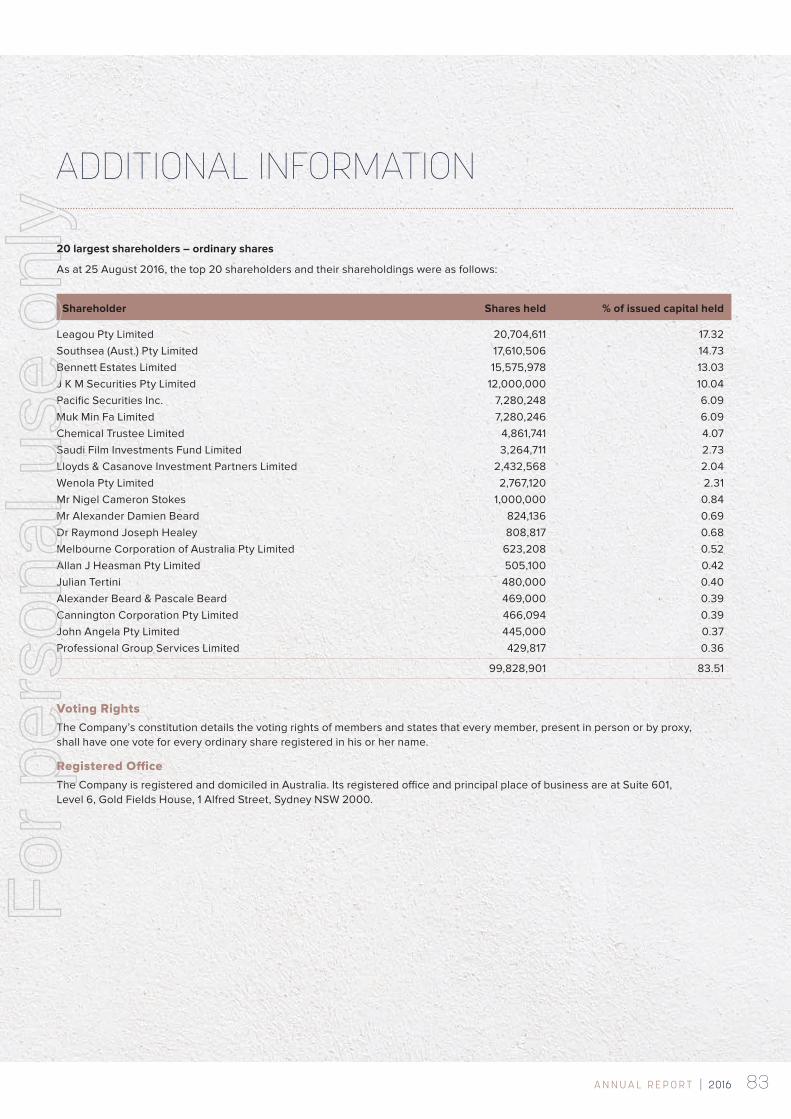
83A N N U A L R E P O R T | 2016
20 largest shareholders – ordinary shares
As at 25 August 2016, the top 20 shareholders and their shareholdings were as follows:
Shareholder Shares held % of issued capital held
Leagou Pty Limited 20,704,611 17.32Southsea (Aust.) Pty Limited 17,610,506 14.73Bennett Estates Limited 15,575,978 13.03J K M Securities Pty Limited 12,000,000 10.04Pacific Securities Inc. 7,280,248 6.09Muk Min Fa Limited 7,280,246 6.09Chemical Trustee Limited 4,861,741 4.07Saudi Film Investments Fund Limited 3,264,711 2.73Lloyds & Casanove Investment Partners Limited 2,432,568 2.04Wenola Pty Limited 2,767,120 2.31Mr Nigel Cameron Stokes 1,000,000 0.84Mr Alexander Damien Beard 824,136 0.69Dr Raymond Joseph Healey 808,817 0.68Melbourne Corporation of Australia Pty Limited 623,208 0.52Allan J Heasman Pty Limited 505,100 0.42Julian Tertini 480,000 0.40Alexander Beard & Pascale Beard 469,000 0.39Cannington Corporation Pty Limited 466,094 0.39John Angela Pty Limited 445,000 0.37Professional Group Services Limited 429,817 0.36
99,828,901 83.51
Voting RightsThe Company’s constitution details the voting rights of members and states that every member, present in person or by proxy, shall have one vote for every ordinary share registered in his or her name.
Registered OfficeThe Company is registered and domiciled in Australia. Its registered office and principal place of business are at Suite 601, Level 6, Gold Fields House, 1 Alfred Street, Sydney NSW 2000.
ADDITIONAL INFORMATION
For
per
sona
l use
onl
y

C V C L I M I T E D A N D I T ’ S C O N T R O L L E D E N T I T I E S84
For
per
sona
l use
onl
y

Printed on ECOSTAR 100% RECYCLEDAn environmentally responsible paper made Carbon Neutral and manufactured from 100% Post Consumer Recycled paper in a Process Chlorine Free environment under the ISO 14001 environmental management system.
For
per
sona
l use
onl
y

Level 6, Gold Fields House 1 Alfred Street, Sydney NSW Australia 2000
T +61 2 9087 8000 F +61 2 9087 8088 W www.cvc.com.au
ABN 34 002 700 361 AFSL 239665
Design Kettle of Fish Design
CVC LIMITEDFor
per
sona
l use
onl
y