nutrition support in children - european...
TRANSCRIPT
Nutrition Support in Children
Lyon
21 sept 2013
Malnutrition : why detecting it in children?
• Alters cognitive development
(observational or interventional studies)
• Responsible for prolongation of
hospitalisation (45%), aggravates causal
disease, increases the rate of complication
and increases the cost of hospitalisation
• In France, taken care of in only 1/3 of
cases.
Hankard et al, 2013
• No current data on the impact of
malnutrition on children diseases
• No widely acknowledged criteria of
malnutrition in children
Malnutrition :what impact on children diseases?
Hankard et al, 2013
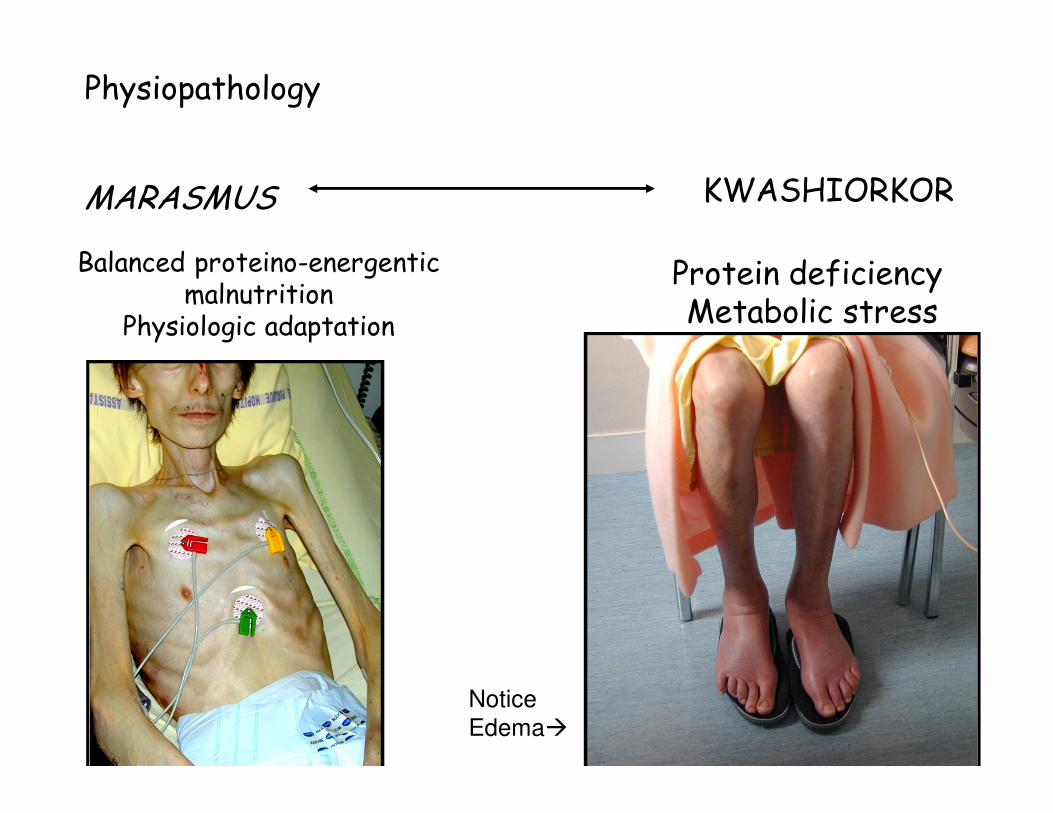
Physiopathology
MARASMUS KWASHIORKOR
Balanced proteino-energenticmalnutrition
Physiologic adaptation
Protein deficiency Metabolic stress
Notice
Edema�
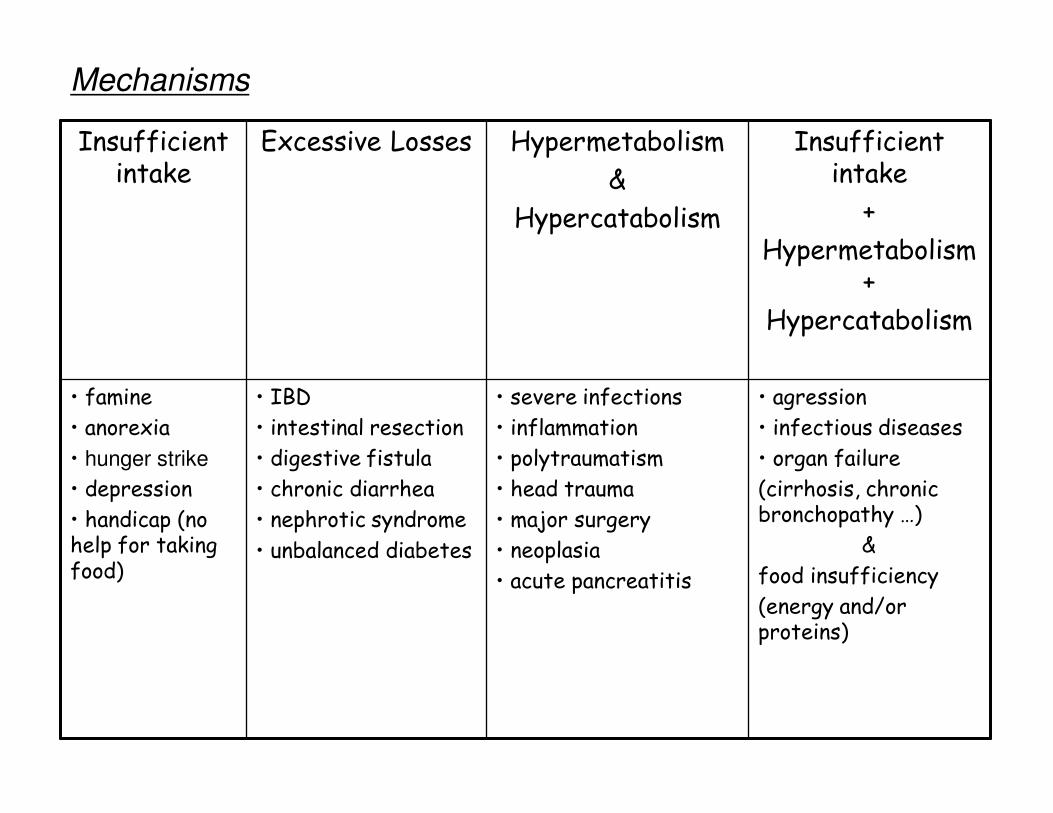
Mechanisms
Insufficient intake
Excessive Losses Hypermetabolism
&
Hypercatabolism
Insufficient intake
+
Hypermetabolism +
Hypercatabolism
• famine
• anorexia
• hunger strike
• depression
• handicap (no help for taking food)
• IBD
• intestinal resection
• digestive fistula
• chronic diarrhea
• nephrotic syndrome
• unbalanced diabetes
• severe infections
• inflammation
• polytraumatism
• head trauma
• major surgery
• neoplasia
• acute pancreatitis
• agression
• infectious diseases
• organ failure
(cirrhosis, chronic bronchopathy …)
&
food insufficiency
(energy and/or proteins)
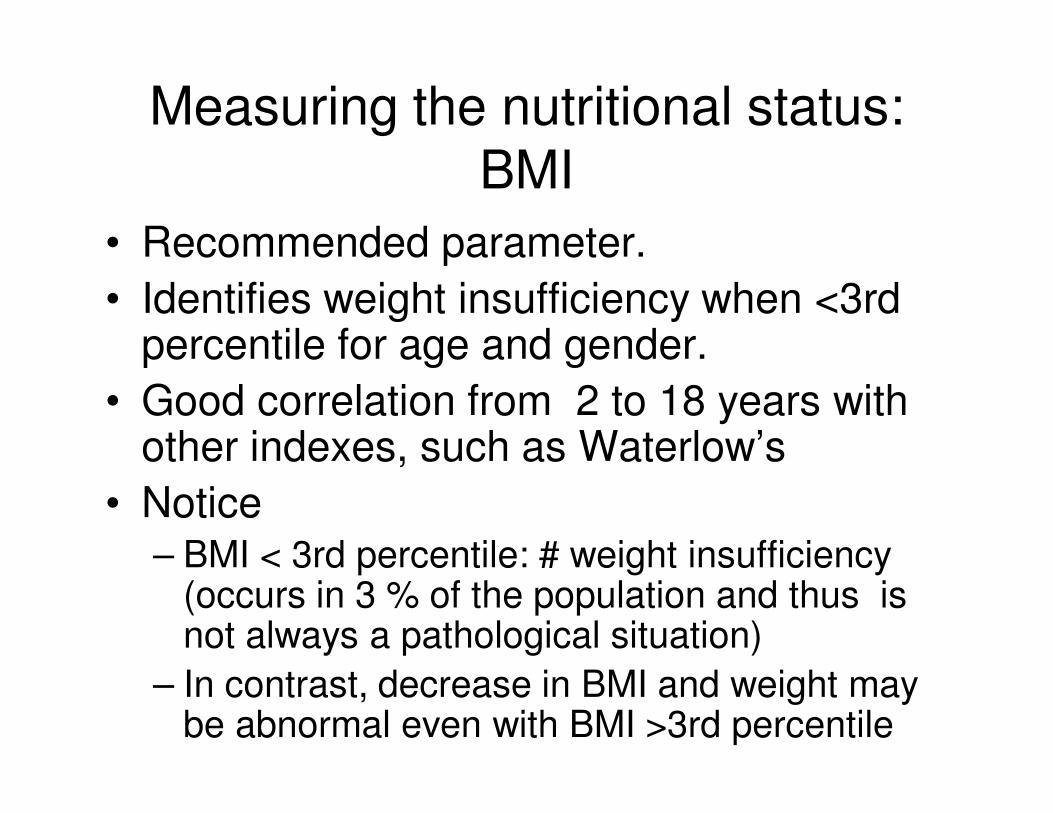
Measuring the nutritional status: BMI
• Recommended parameter.
• Identifies weight insufficiency when <3rd percentile for age and gender.
• Good correlation from 2 to 18 years with other indexes, such as Waterlow’s
• Notice– BMI < 3rd percentile: # weight insufficiency
(occurs in 3 % of the population and thus is not always a pathological situation)
– In contrast, decrease in BMI and weight may be abnormal even with BMI >3rd percentile
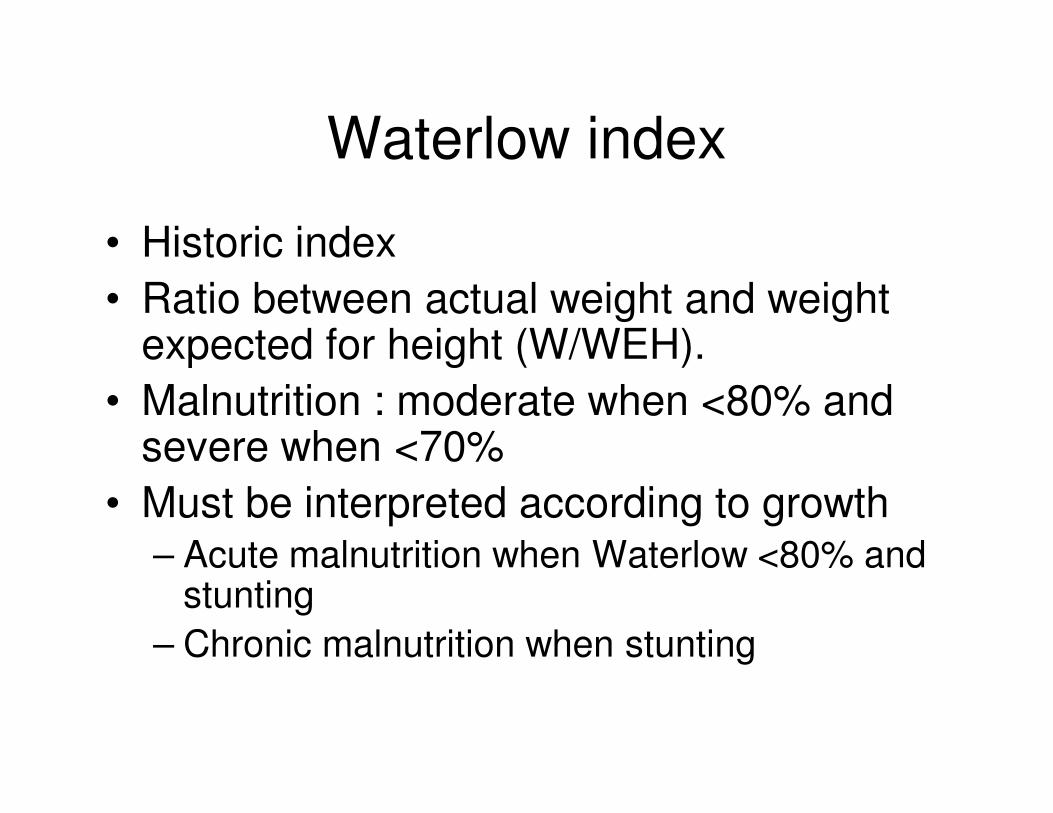
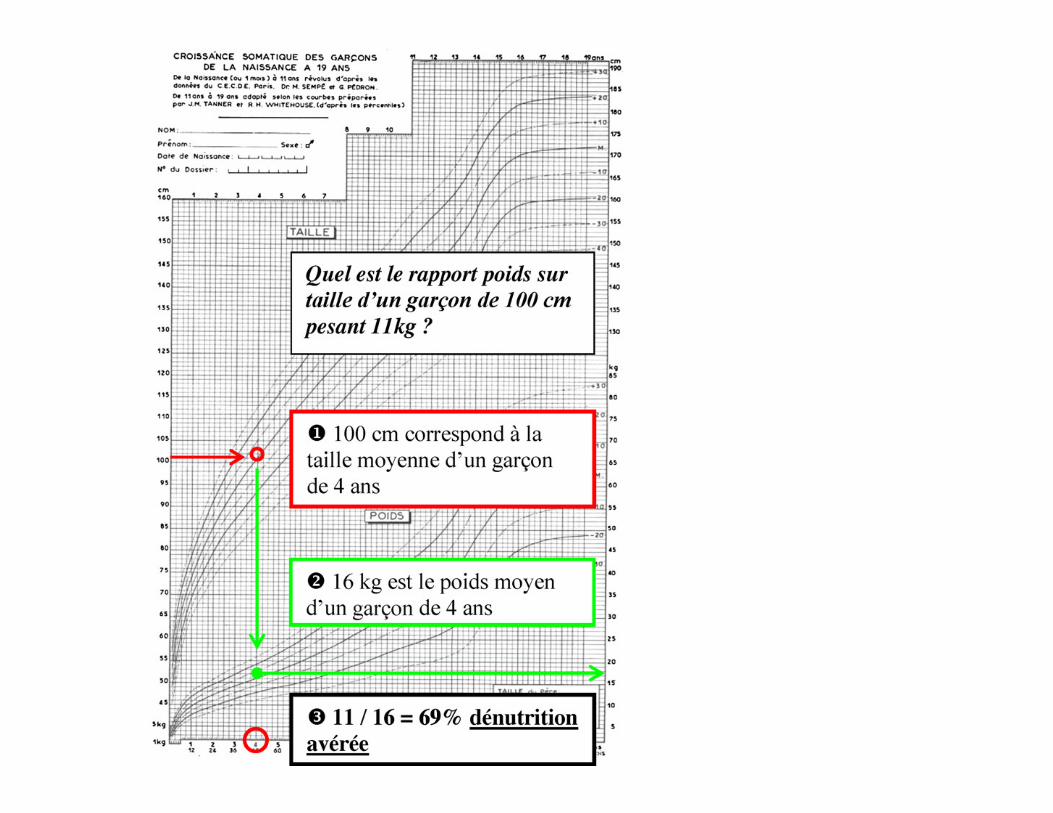
Waterlow index
• Historic index
• Ratio between actual weight and weight expected for height (W/WEH).
• Malnutrition : moderate when <80% and severe when <70%
• Must be interpreted according to growth– Acute malnutrition when Waterlow <80% and
stunting
– Chronic malnutrition when stunting
To help protect your privacy, PowerPoint has blocked automatic download of this picture.
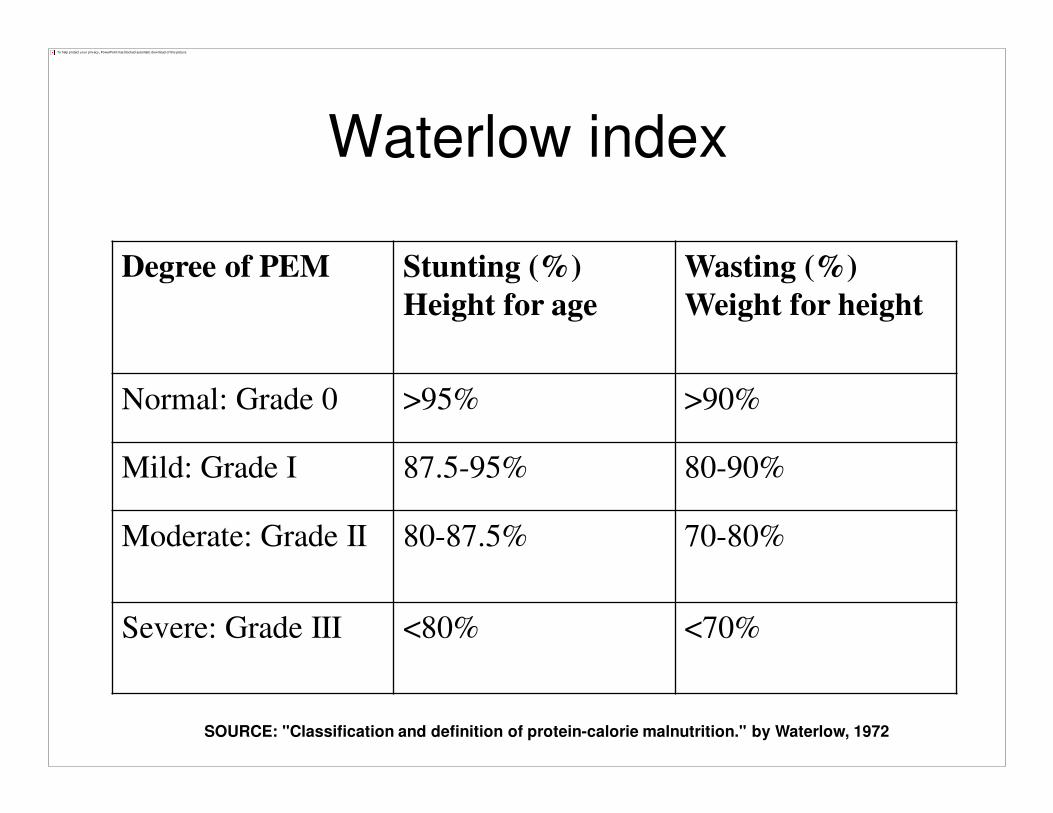
Waterlow index
Degree of PEM Stunting (%)
Height for age
Wasting (%)
Weight for height
Normal: Grade 0 >95% >90%
Mild: Grade I 87.5-95% 80-90%
Moderate: Grade II 80-87.5% 70-80%
Severe: Grade III <80% <70%
SOURCE: "Classification and definition of protein-calorie malnutrition." by Waterlow, 1972
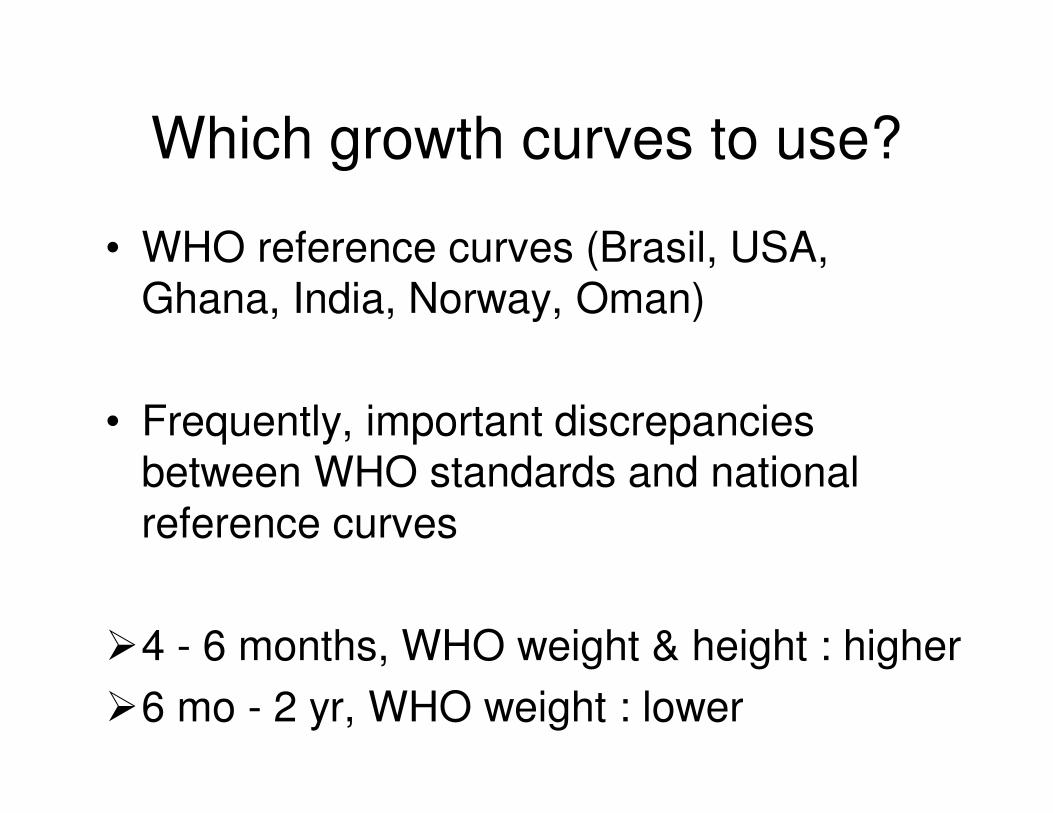
Which growth curves to use?
• WHO reference curves (Brasil, USA,
Ghana, India, Norway, Oman)
• Frequently, important discrepancies
between WHO standards and national
reference curves
�4 - 6 months, WHO weight & height : higher
�6 mo - 2 yr, WHO weight : lower
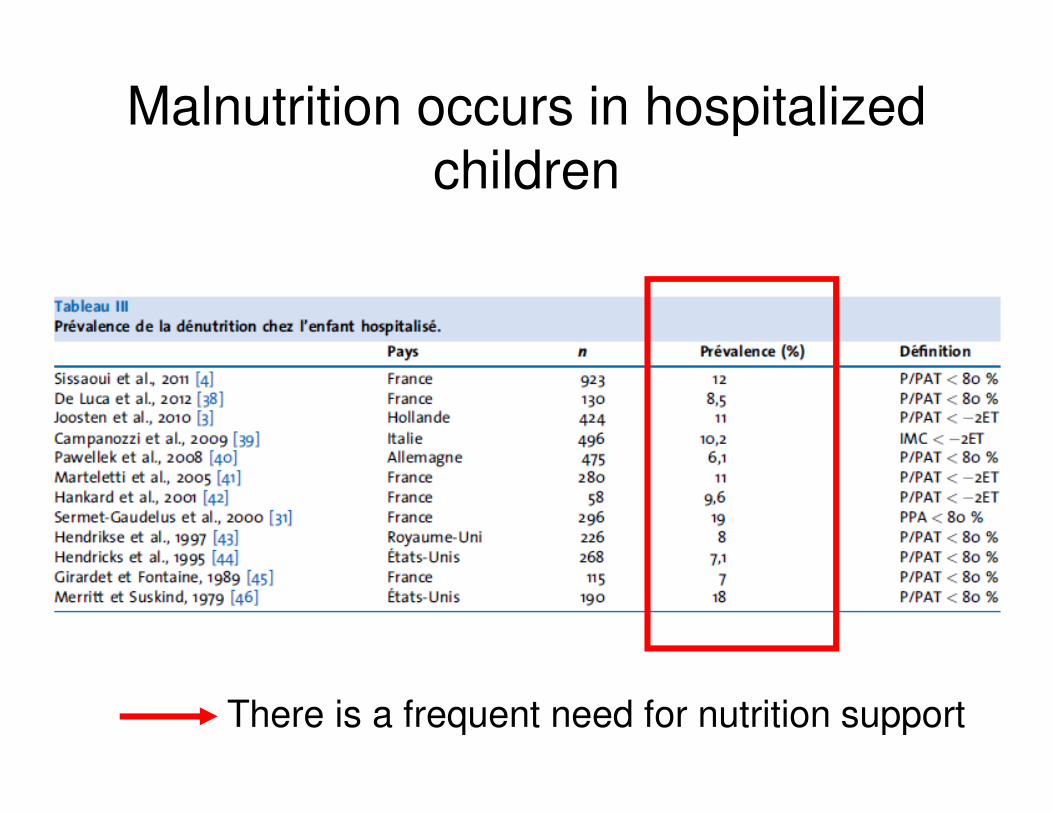
Malnutrition occurs in hospitalized children
There is a frequent need for nutrition support
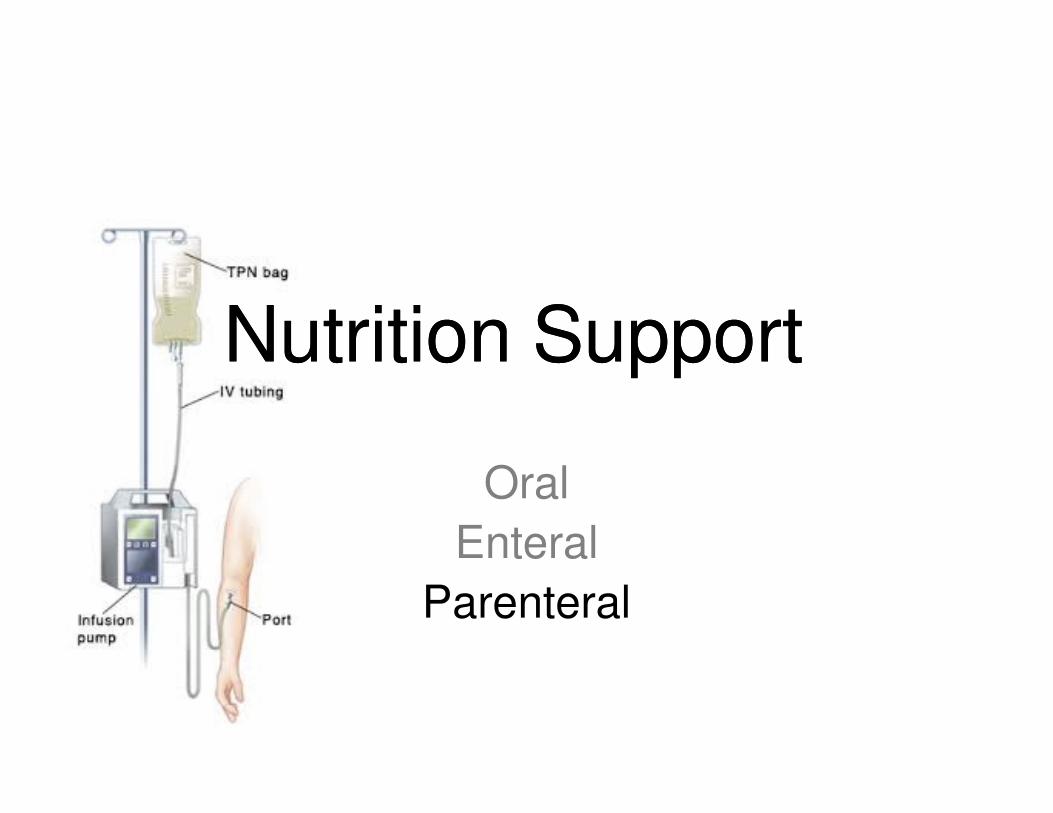
Nutrition SupportNutrition Support
Oral
Enteral
Parenteral
Nutrition SupportNutrition Support
Oral
Enteral
Parenteral
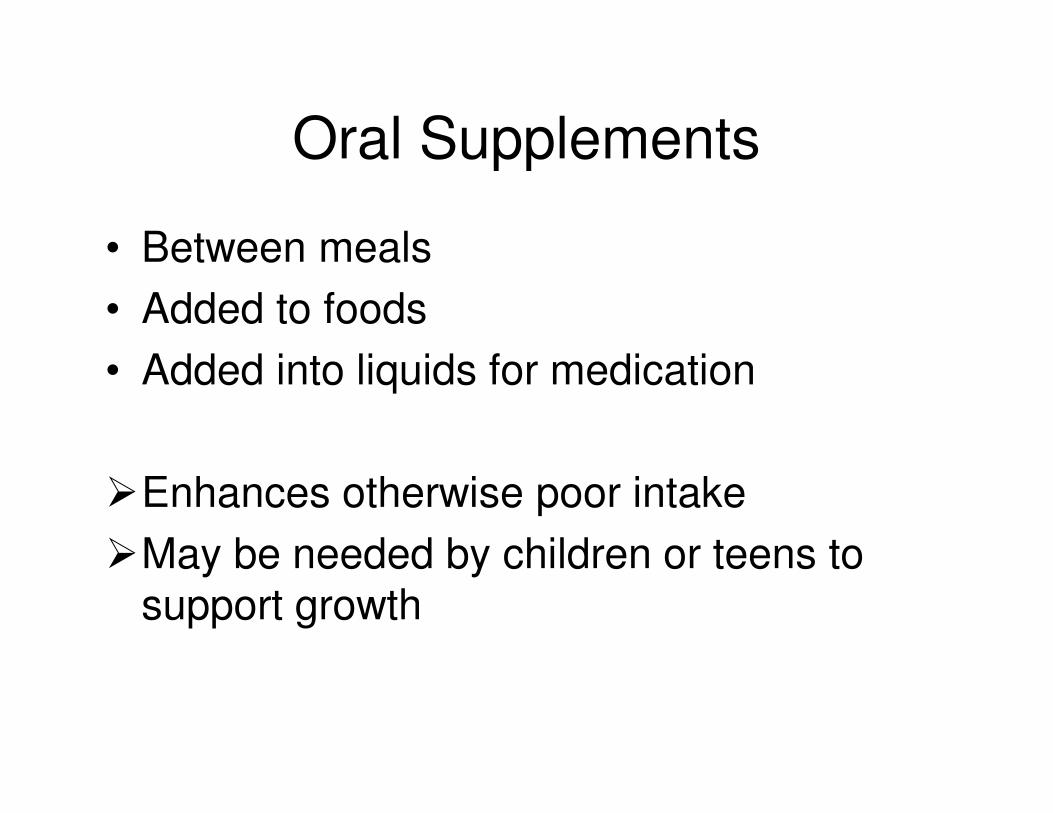
Oral Supplements
• Between meals
• Added to foods
• Added into liquids for medication
�Enhances otherwise poor intake
�May be needed by children or teens to
support growth
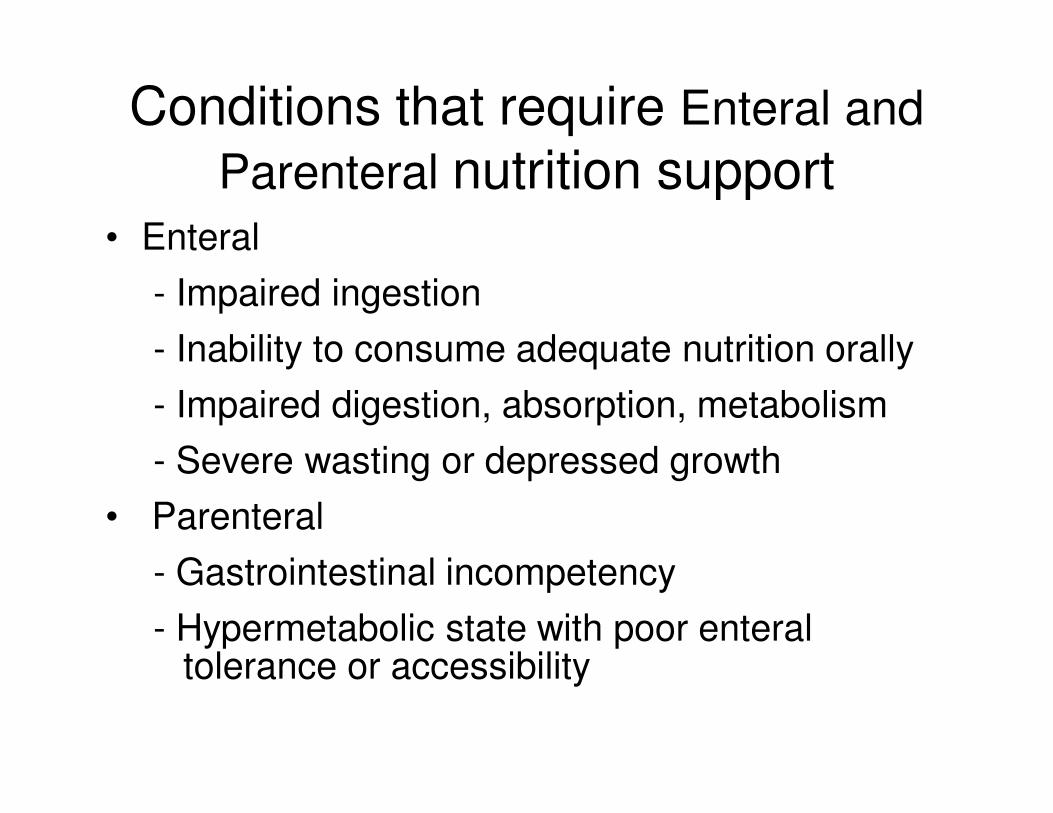
Conditions that require Enteral and
Parenteral nutrition support• Enteral
- Impaired ingestion
- Inability to consume adequate nutrition orally
- Impaired digestion, absorption, metabolism
- Severe wasting or depressed growth
• Parenteral
- Gastrointestinal incompetency
- Hypermetabolic state with poor enteral tolerance or accessibility
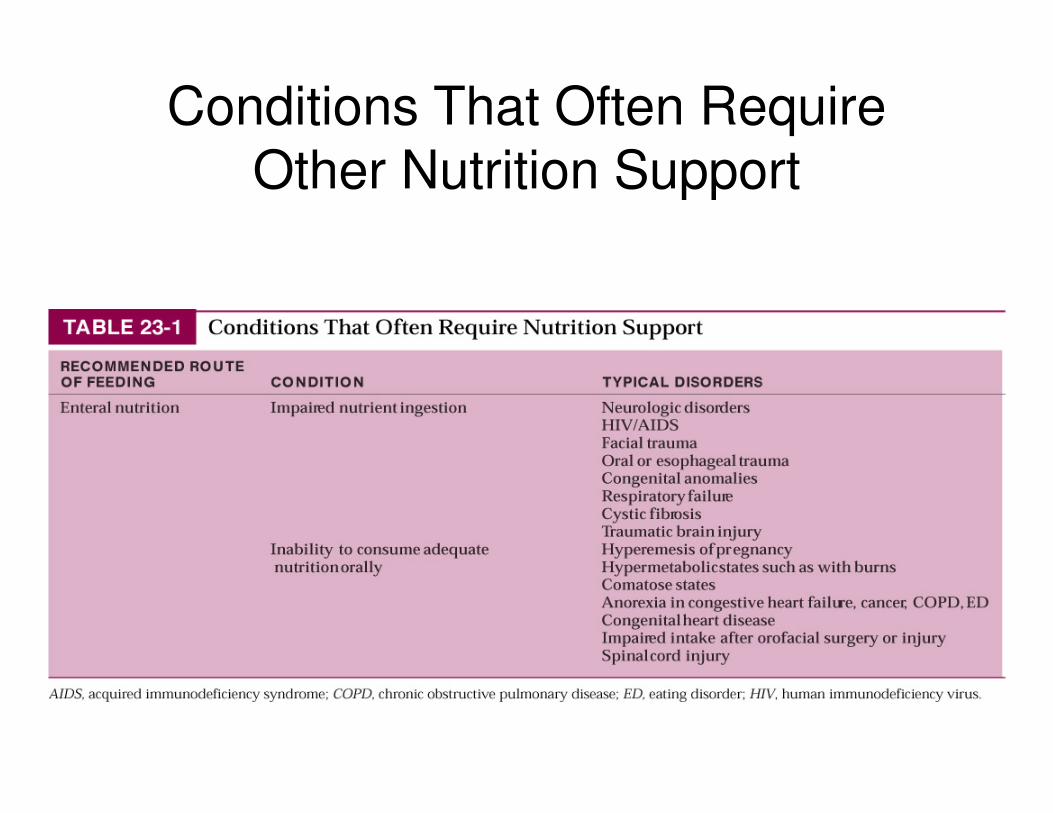
Conditions That Often Require Other Nutrition Support
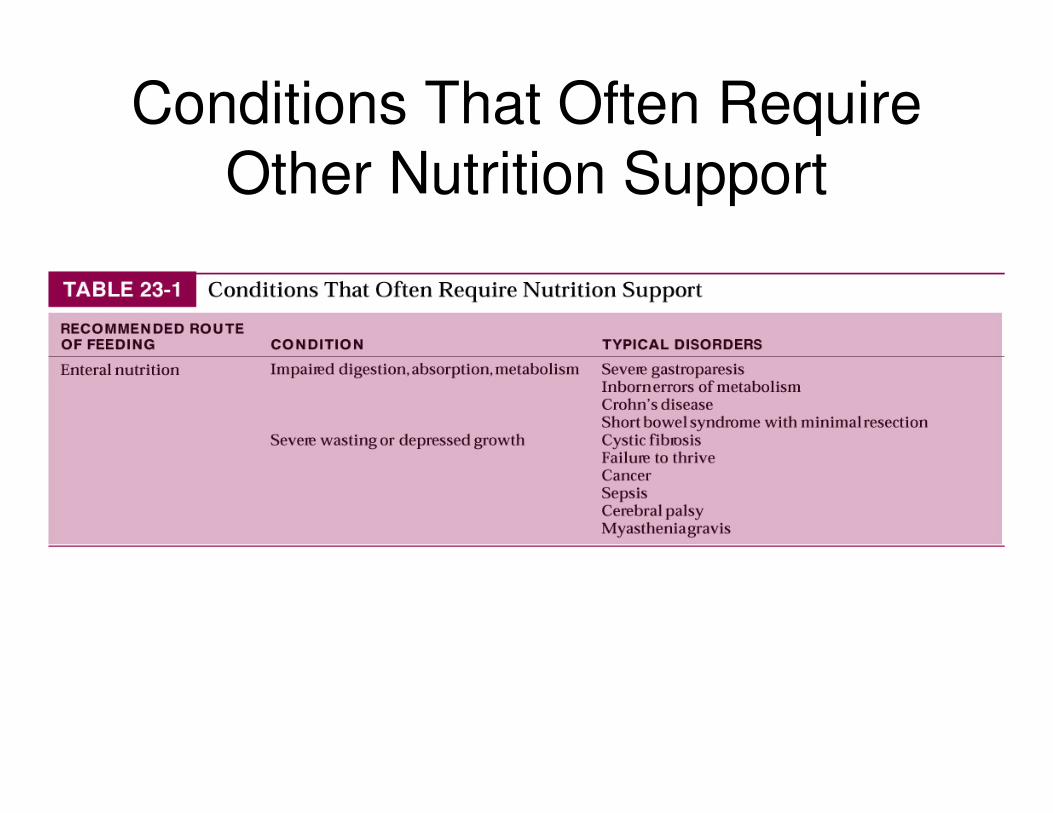
Conditions That Often Require
Other Nutrition Support
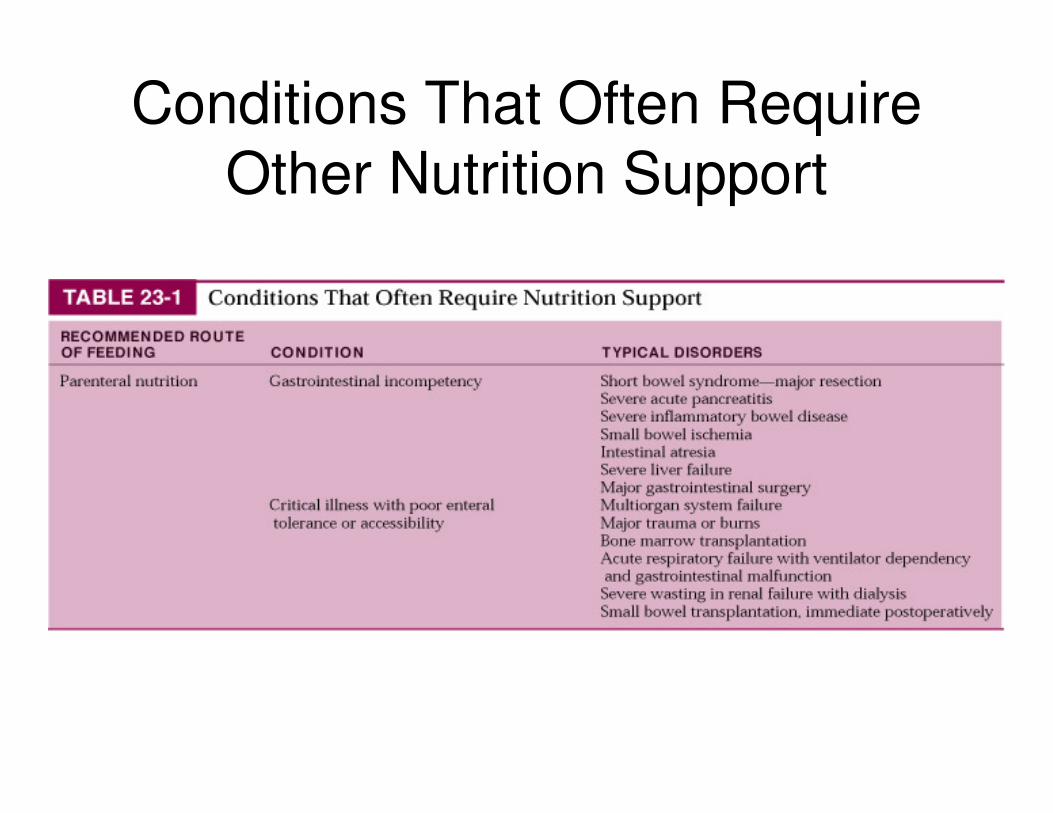
Conditions That Often Require
Other Nutrition Support
Nutrition SupportNutrition Support
Oral
Enteral
Parenteral
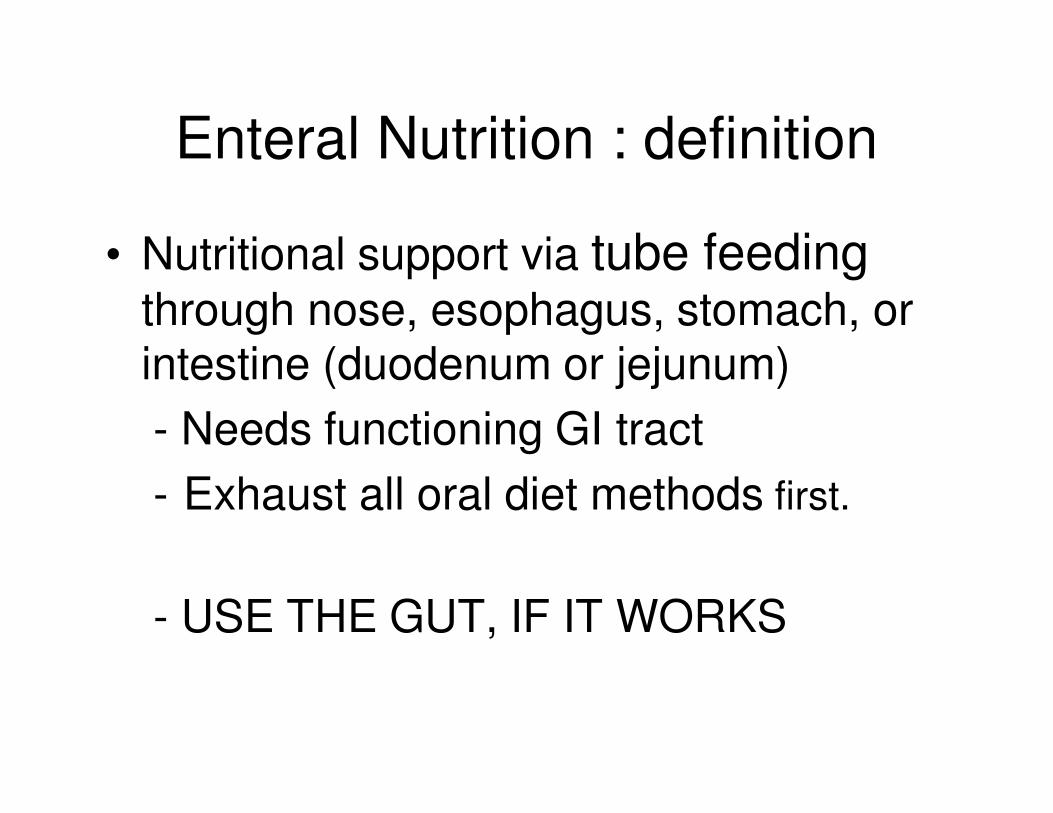
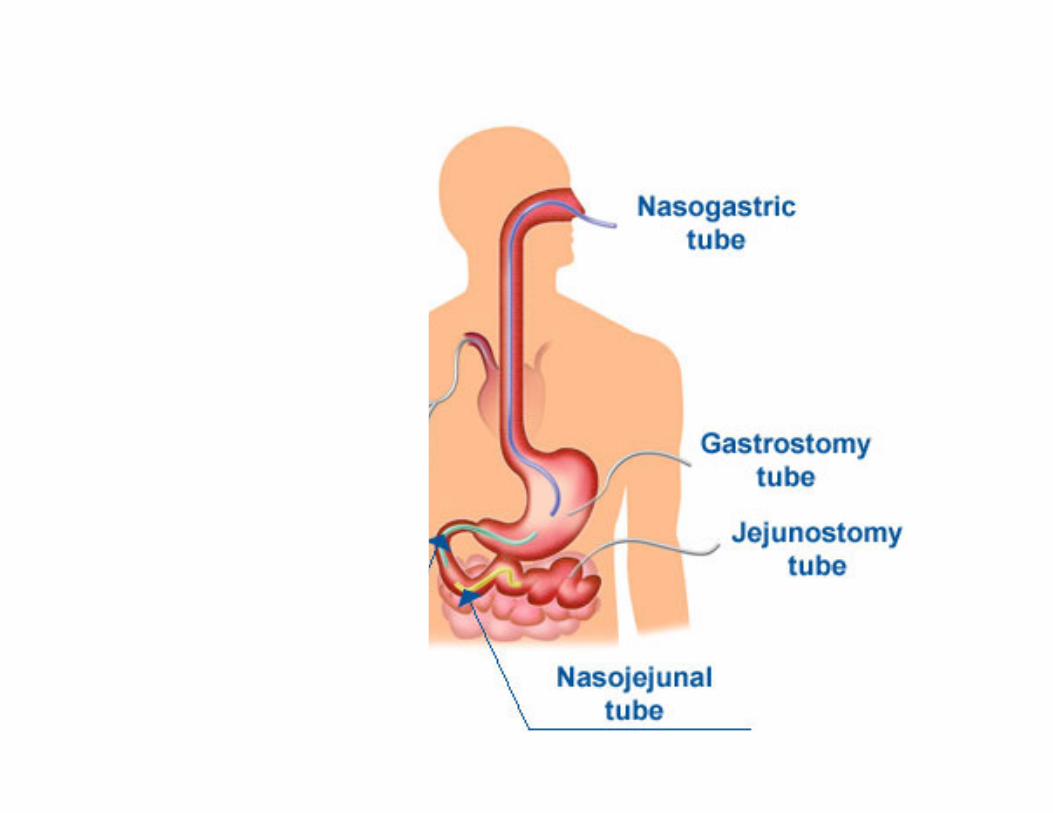
Enteral Nutrition : definition
• Nutritional support via tube feedingthrough nose, esophagus, stomach, or intestine (duodenum or jejunum)
- Needs functioning GI tract
- Exhaust all oral diet methods first.
- USE THE GUT, IF IT WORKS
Enteral nutrition: advantages
• Provides nutrition when oral is not possible or adequate
• Intake easily/accurately monitored
• Costs less than parenteral nutrition, supplies readily available
• Preserves gut integrity and immunologic function
• Decreases likelihood of bacterial translocation
• Increases compliance with intake
Enteral nutrition: disadvantages
• Costs >> oral diets
• Less “palatable/normal”
• Assessment, administration, monitoring
• Tube patency, site care
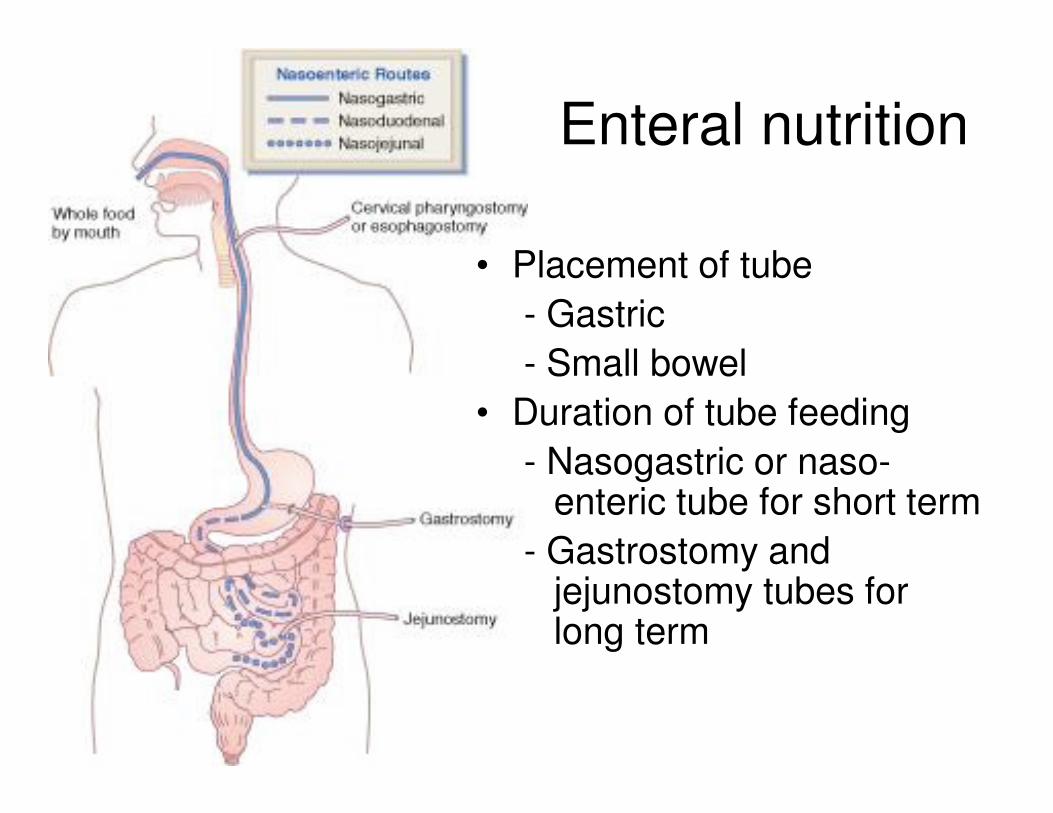
• Placement of tube
- Gastric
- Small bowel
• Duration of tube feeding
- Nasogastric or naso-enteric tube for short term
- Gastrostomy and jejunostomy tubes for long term
Enteral nutrition
Enteral nutrition: tube placement
Location in accordance with
• Duration
• Adequacy of GI functioning access
(medical status)
Check
• Tube measurements and durability
• Placement through radiographic
confirmation
Enteral nutrition: questions
� Applicability?
� Site placement?
� Formula selection?
� Nutritional/medical requirements?
� Rate and method of delivery?
� Tolerance?
Enteral Nutrition : formula selection
Suitability of a feeding formula based on:• Functional status of GI tract• Digestion and absorption capability of patient• Contribution of the feeding to fluid and electrolyte
needs or restriction• Specific metabolic needs
�Physical characteristics of formula (osmolality, fiber content, caloric density, viscosity)
�Macronutrient ratios�Cost effectiveness
Enteral nutrition: physical properties of formulas
• Residue
• Viscosity
- Size of tube is important
• Osmolality: consider protein source
- Intact (do not affect osmolality) : soy isolates; sodium or calcium casein; lactalbumin
- Hydrolyzed (more particles) : peptides or free amino acids
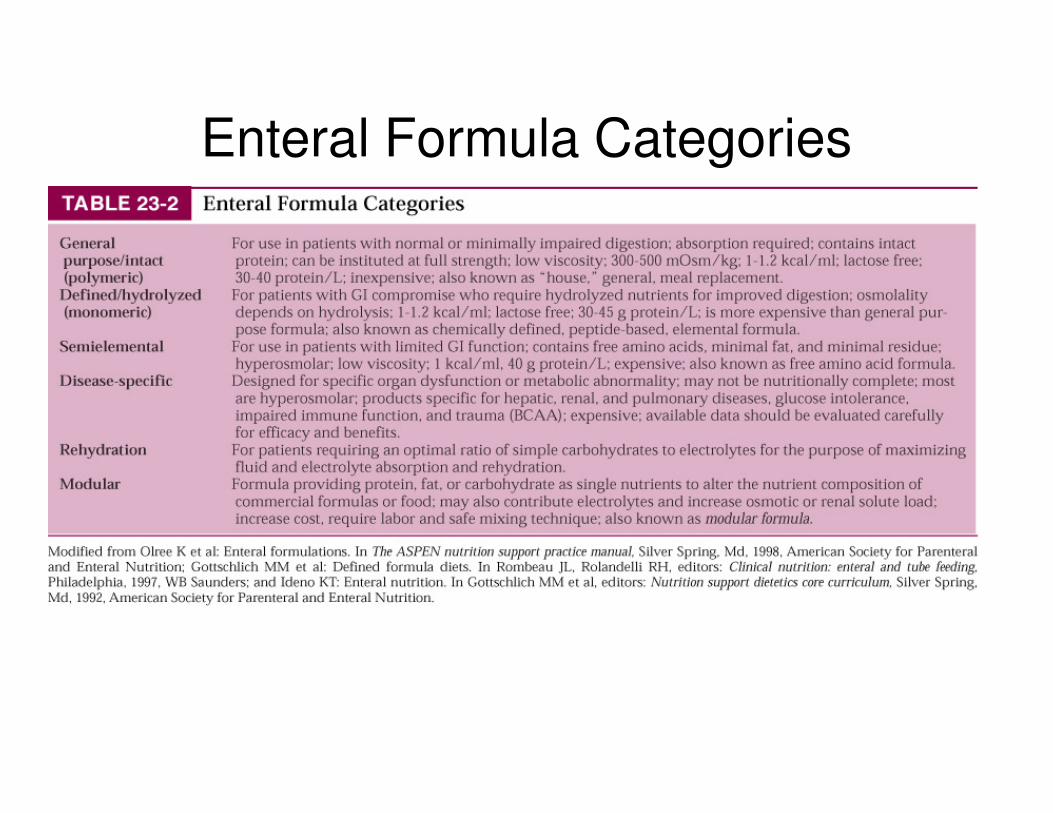
Enteral Formula Categories
Enteral NutitionRate and method of delivery
Determined by medical status, feeding route and volume, and nutritional goals
• Bolus, rapidly delivered via syringe, several times daily
• Intermittent, 20 to 30 minutes, several times/day via gravity drip or syringe
• Cyclic, via pump usually at night
• Continuous, via gravity drip or infusion pump
Enteral nutrition: complications
• Access problems (tube migration, tube
obstruction, increased risk of bacterial contamination, pneumothorax)
• Gastrointestinal (diarrhea)
• Metabolic (overhydration)
• Respiratory (aspiration): High-risk patients
- Poor gag reflex
- Depressed mental status
Enteral nutrition: bad tolerance
• Consciousness
• Hydration
• Nausea, gastro-esophageal reflux vomiting, diarrhea, abdominal distention, constipation, cramps
• Respiratory distress : aspiration
• Weight change
• Lactose/gluten intolerances
• Labs : Glucose fluctuations
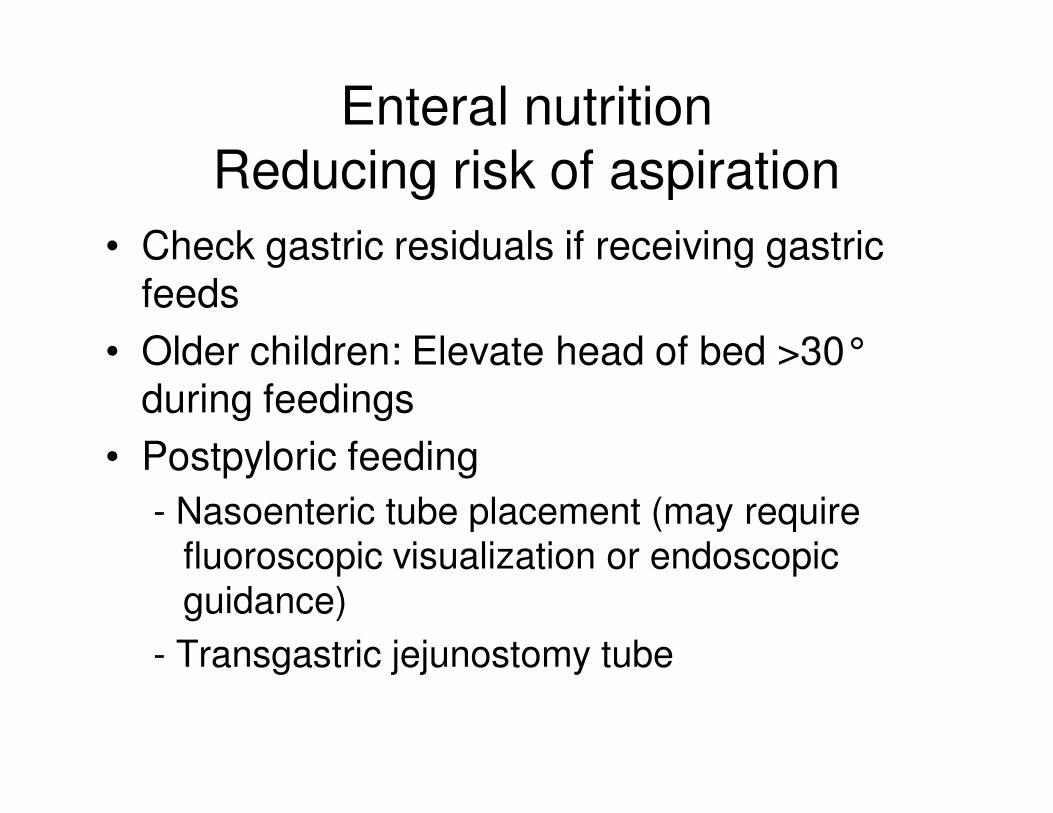
Enteral nutritionReducing risk of aspiration
• Check gastric residuals if receiving gastric
feeds
• Older children: Elevate head of bed >30°
during feedings
• Postpyloric feeding
- Nasoenteric tube placement (may require fluoroscopic visualization or endoscopic guidance)
- Transgastric jejunostomy tube
Nutrition SupportNutrition Support
Oral
Enteral
Parenteral
Advantages
• Provides nutrients when <60 -70cm of
small intestine remains
• Allows nutrition support when GI
intolerance prevents oral or enteral
support
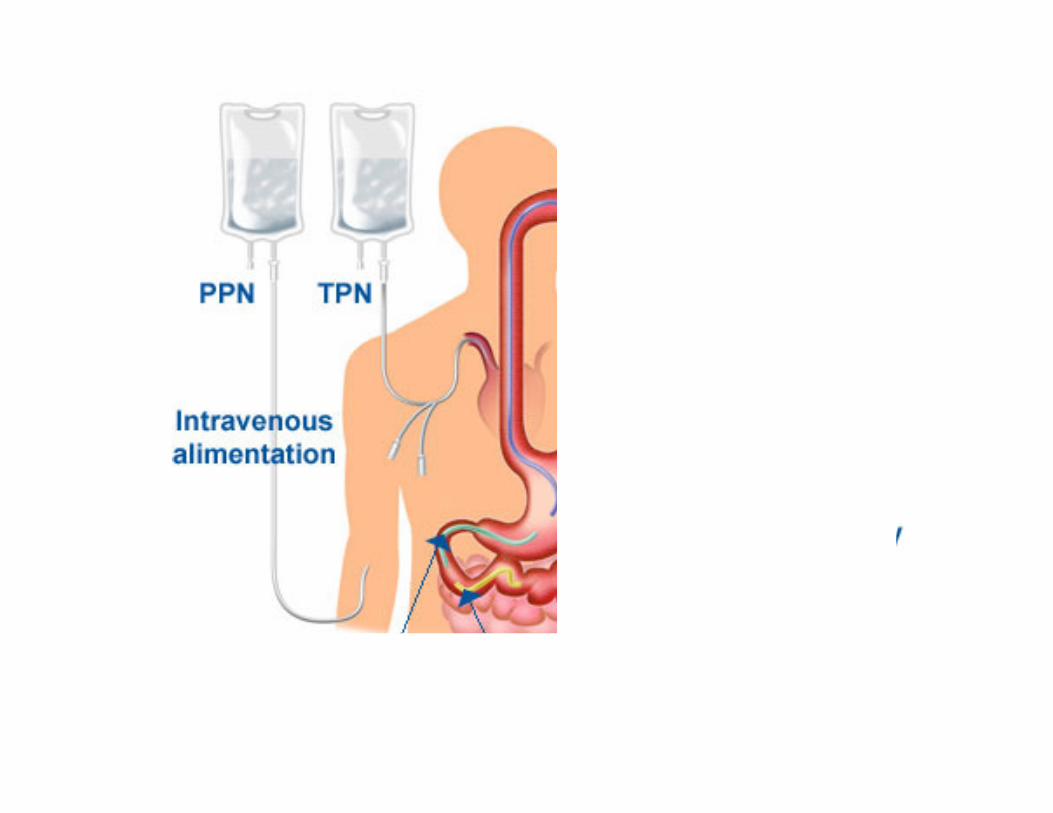
Parenteral nutrition: Routes
• Central access
- TPN both long- and short-term placement
• Peripheral or PPN
- New catheters allow longer support via this method limited to 800 to 900 mOsm/kg due to thrombophlebitis
- When <2000 kcal required or <10 days
PPN vs. TPN
• Lower duration
• Central line contra-indicated
• Less Kcal required
(max. PPN concentration 10% dextrose)
�Needs fluid tolerance
�Needs lower osmolarity
Indications for TPN
• NPO (not by mouth) >10 days
• GI non functioning
• GI fistula
• Acute pancreatitis
• Short bowel syndrome
• Malnutrition with >10% - 15 % weight loss
• Nutritional needs not met; patient refuses food
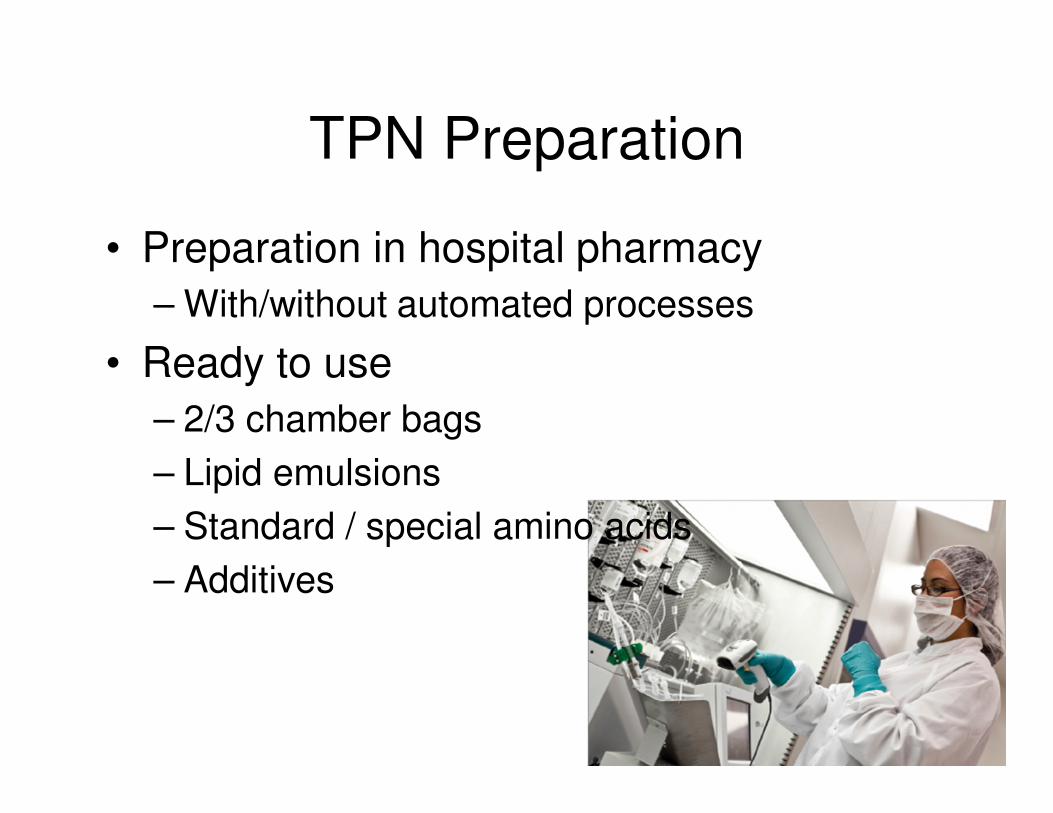
TPN Preparation
• Preparation in hospital pharmacy
– With/without automated processes
• Ready to use
– 2/3 chamber bags
– Lipid emulsions
– Standard / special amino acids
– Additives
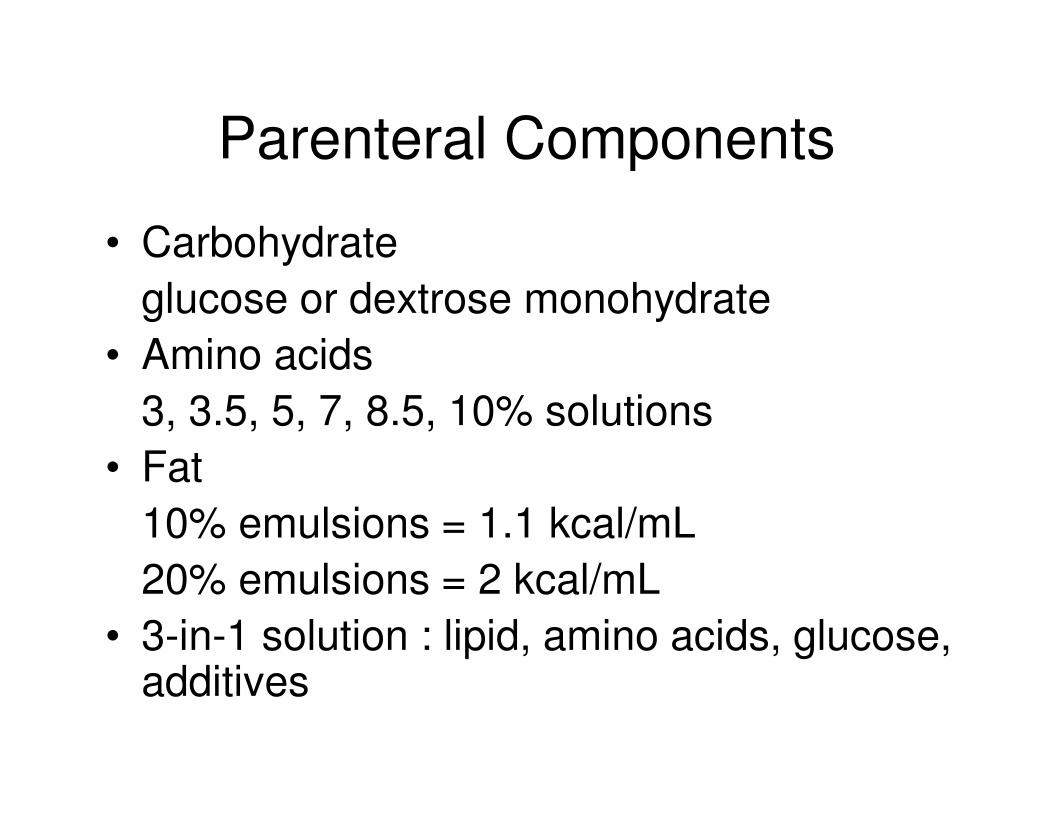
Parenteral Components
• Carbohydrate
glucose or dextrose monohydrate
• Amino acids
3, 3.5, 5, 7, 8.5, 10% solutions
• Fat
10% emulsions = 1.1 kcal/mL
20% emulsions = 2 kcal/mL
• 3-in-1 solution : lipid, amino acids, glucose, additives
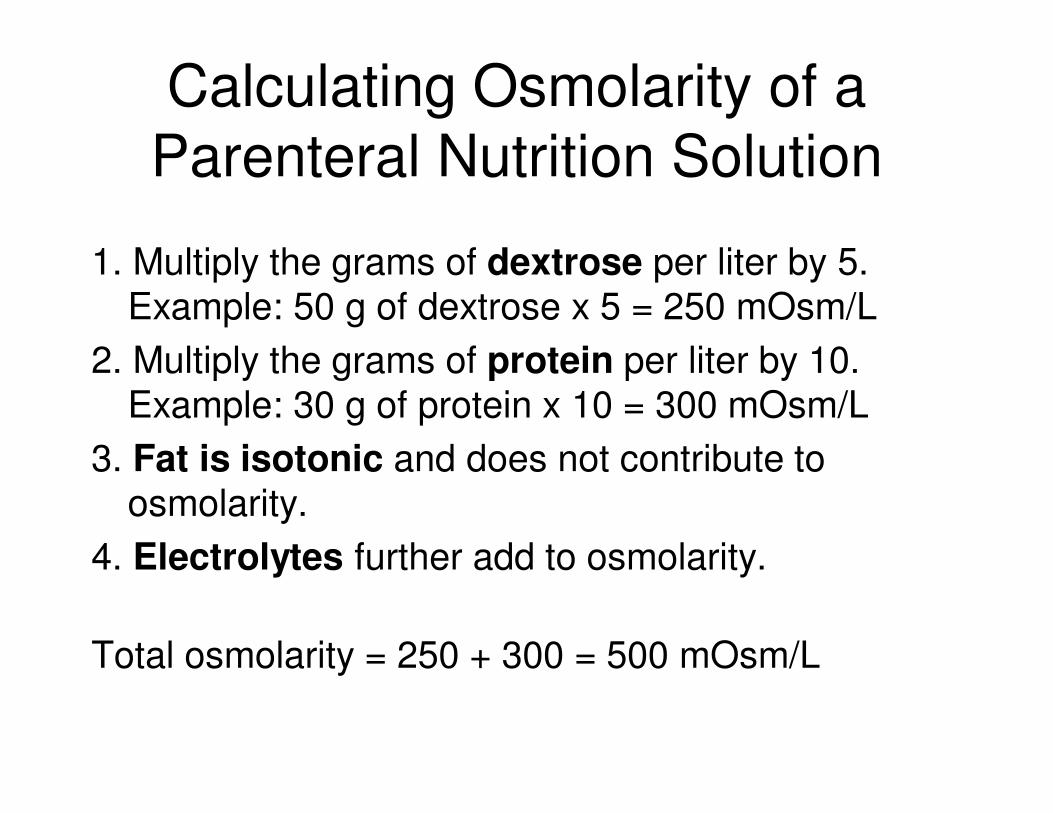
Calculating Osmolarity of a
Parenteral Nutrition Solution
1. Multiply the grams of dextrose per liter by 5. Example: 50 g of dextrose x 5 = 250 mOsm/L
2. Multiply the grams of protein per liter by 10. Example: 30 g of protein x 10 = 300 mOsm/L
3. Fat is isotonic and does not contribute to osmolarity.
4. Electrolytes further add to osmolarity.
Total osmolarity = 250 + 300 = 500 mOsm/L

Conclusion
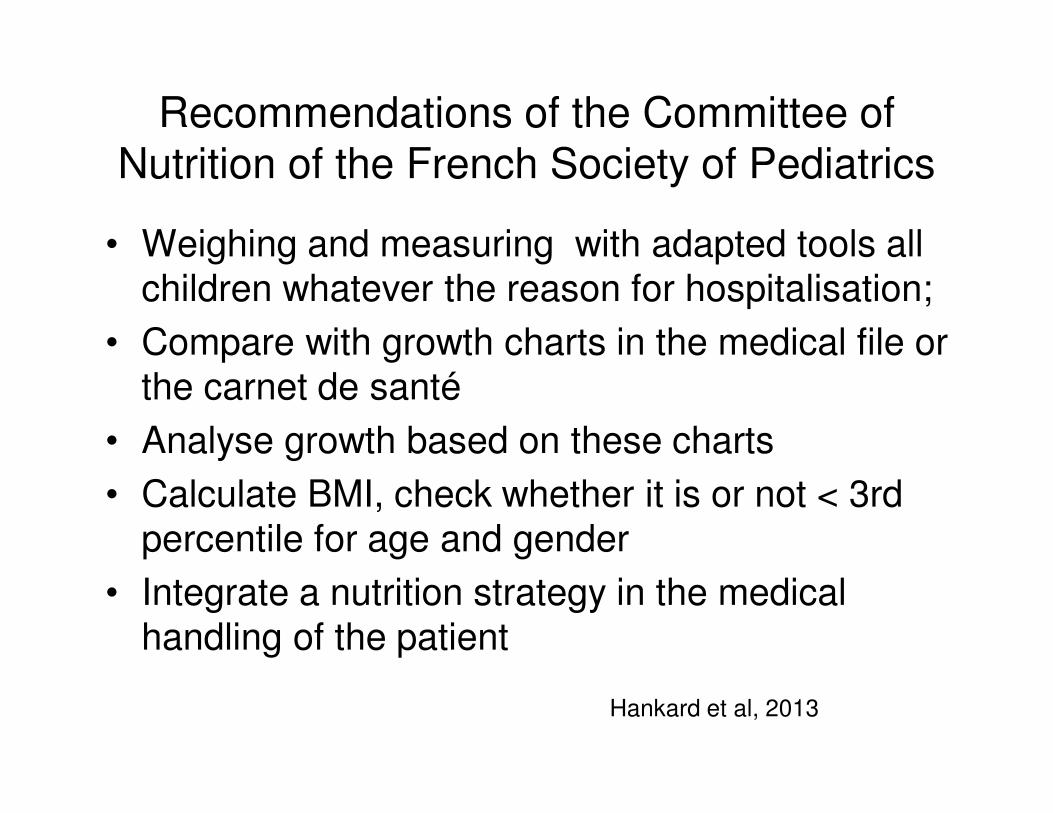
Recommendations of the Committee of
Nutrition of the French Society of Pediatrics
• Weighing and measuring with adapted tools all children whatever the reason for hospitalisation;
• Compare with growth charts in the medical file or the carnet de santé
• Analyse growth based on these charts
• Calculate BMI, check whether it is or not < 3rd percentile for age and gender
• Integrate a nutrition strategy in the medical handling of the patient
Hankard et al, 2013
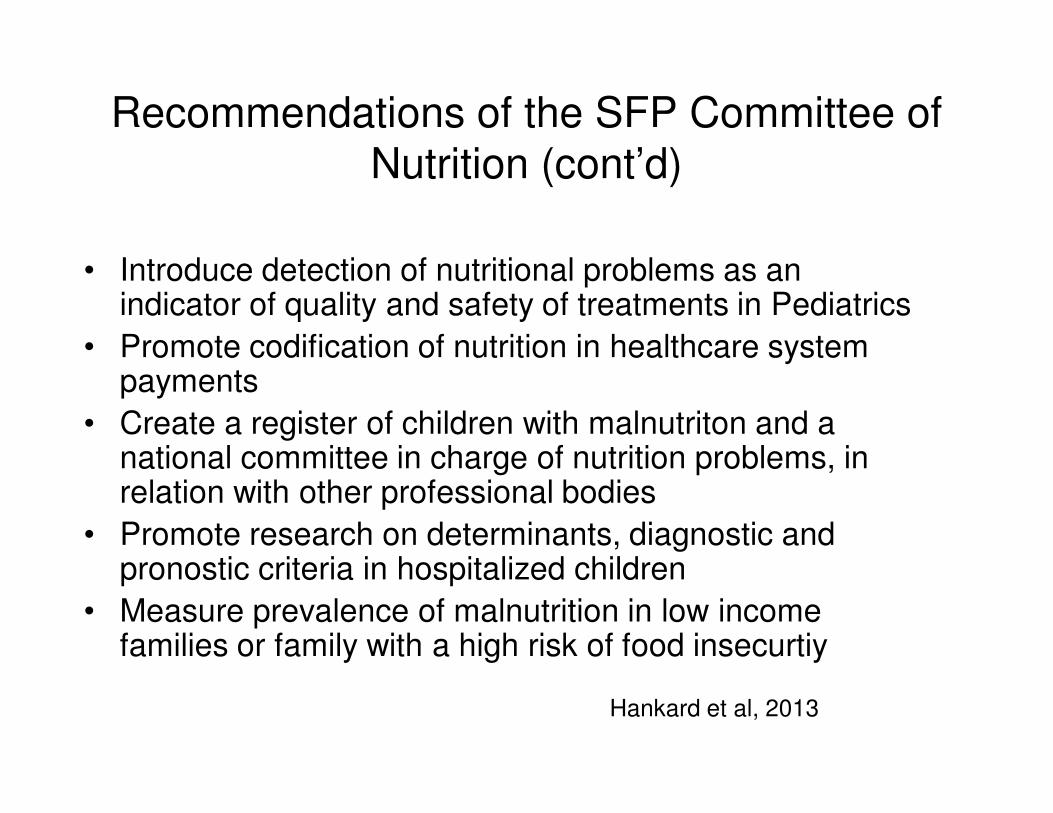
Recommendations of the SFP Committee of
Nutrition (cont’d)
• Introduce detection of nutritional problems as an indicator of quality and safety of treatments in Pediatrics
• Promote codification of nutrition in healthcare system payments
• Create a register of children with malnutriton and a national committee in charge of nutrition problems, in relation with other professional bodies
• Promote research on determinants, diagnostic and pronostic criteria in hospitalized children
• Measure prevalence of malnutrition in low income families or family with a high risk of food insecurtiy
Hankard et al, 2013

Enteral nutrition
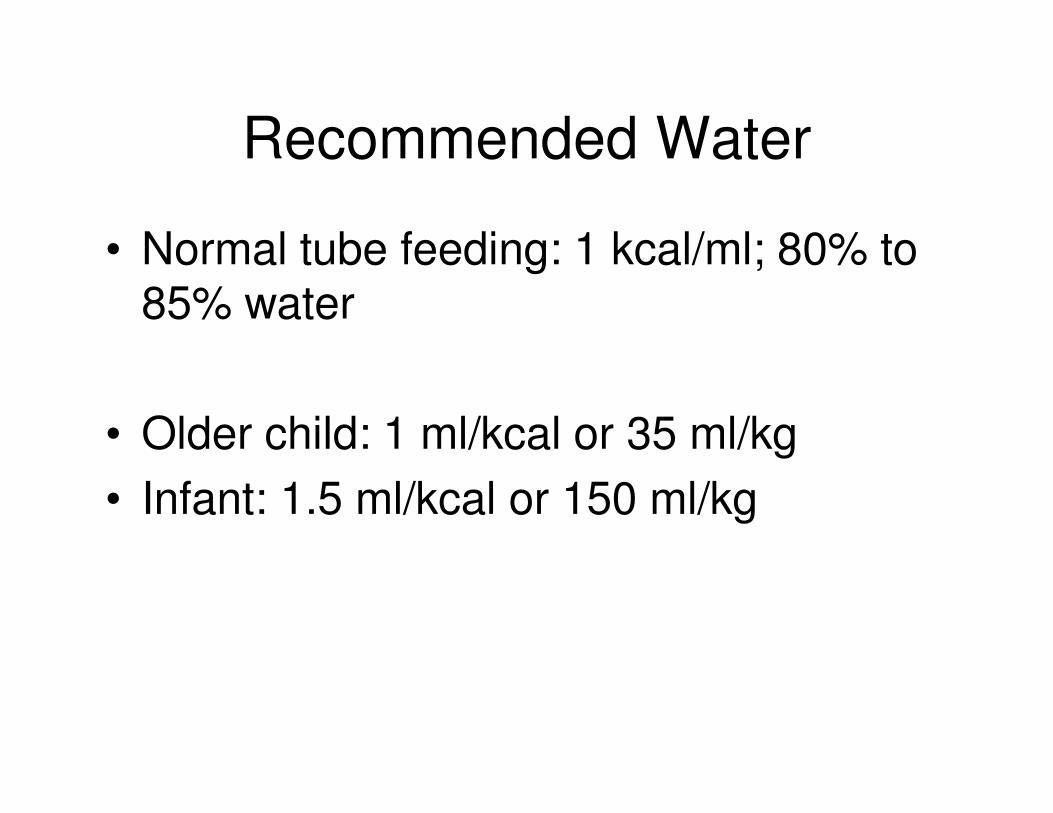
Recommended Water
• Normal tube feeding: 1 kcal/ml; 80% to 85% water
• Older child: 1 ml/kcal or 35 ml/kg
• Infant: 1.5 ml/kcal or 150 ml/kg
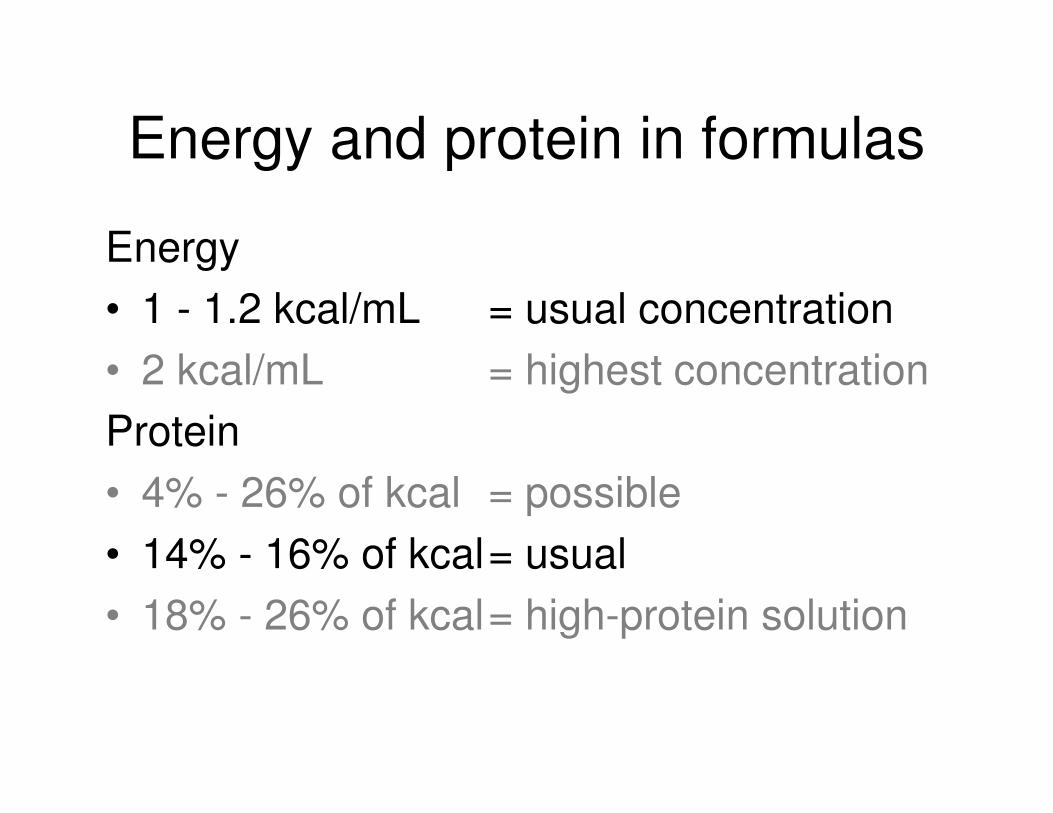
Energy and protein in formulas
Energy
• 1 - 1.2 kcal/mL = usual concentration
• 2 kcal/mL = highest concentration
Protein
• 4% - 26% of kcal = possible
• 14% - 16% of kcal= usual
• 18% - 26% of kcal= high-protein solution
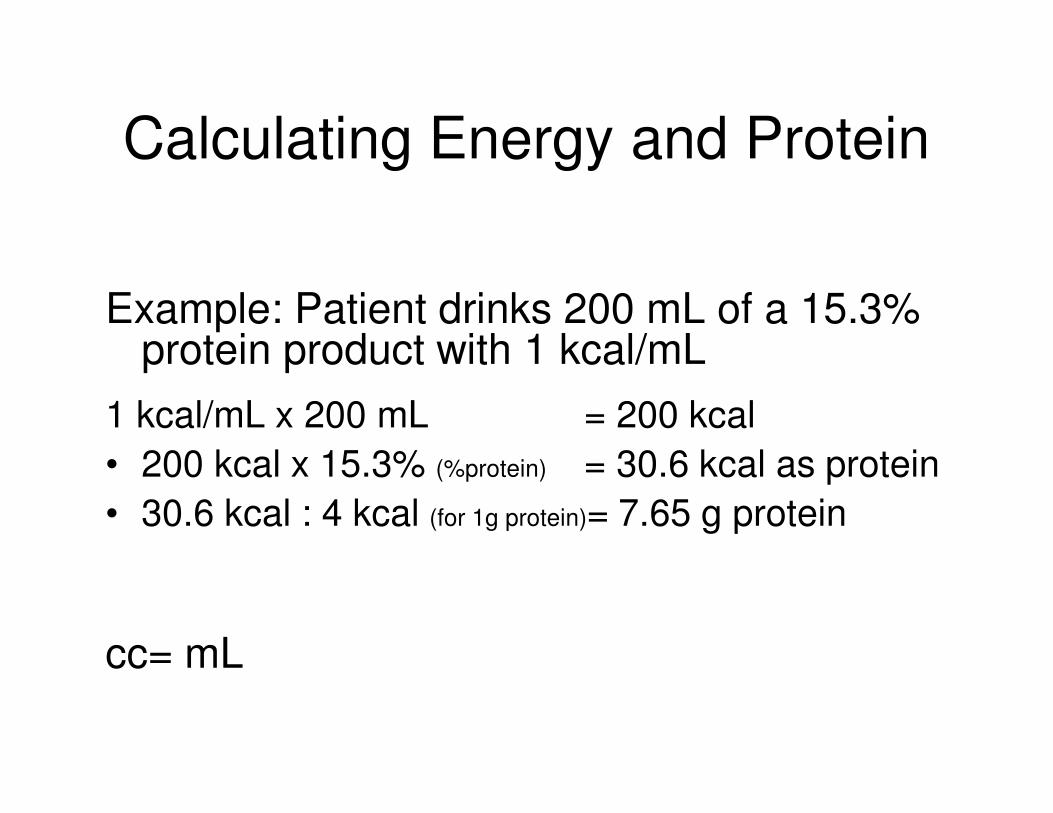
Calculating Energy and Protein
Example: Patient drinks 200 mL of a 15.3% protein product with 1 kcal/mL
1 kcal/mL x 200 mL = 200 kcal
• 200 kcal x 15.3% (%protein) = 30.6 kcal as protein
• 30.6 kcal : 4 kcal (for 1g protein)= 7.65 g protein
cc= mL
Parenteral nutrition
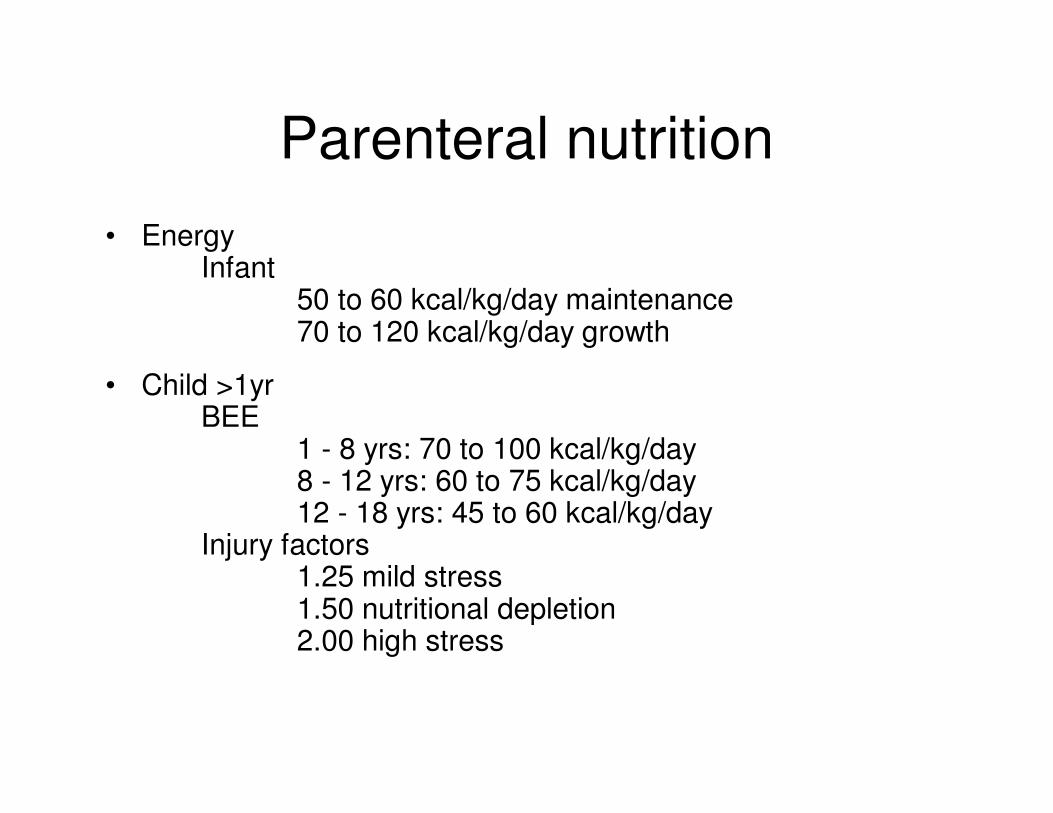
Parenteral nutrition
• EnergyInfant
50 to 60 kcal/kg/day maintenance70 to 120 kcal/kg/day growth
• Child >1yrBEE
1 - 8 yrs: 70 to 100 kcal/kg/day8 - 12 yrs: 60 to 75 kcal/kg/day12 - 18 yrs: 45 to 60 kcal/kg/day
Injury factors1.25 mild stress1.50 nutritional depletion2.00 high stress
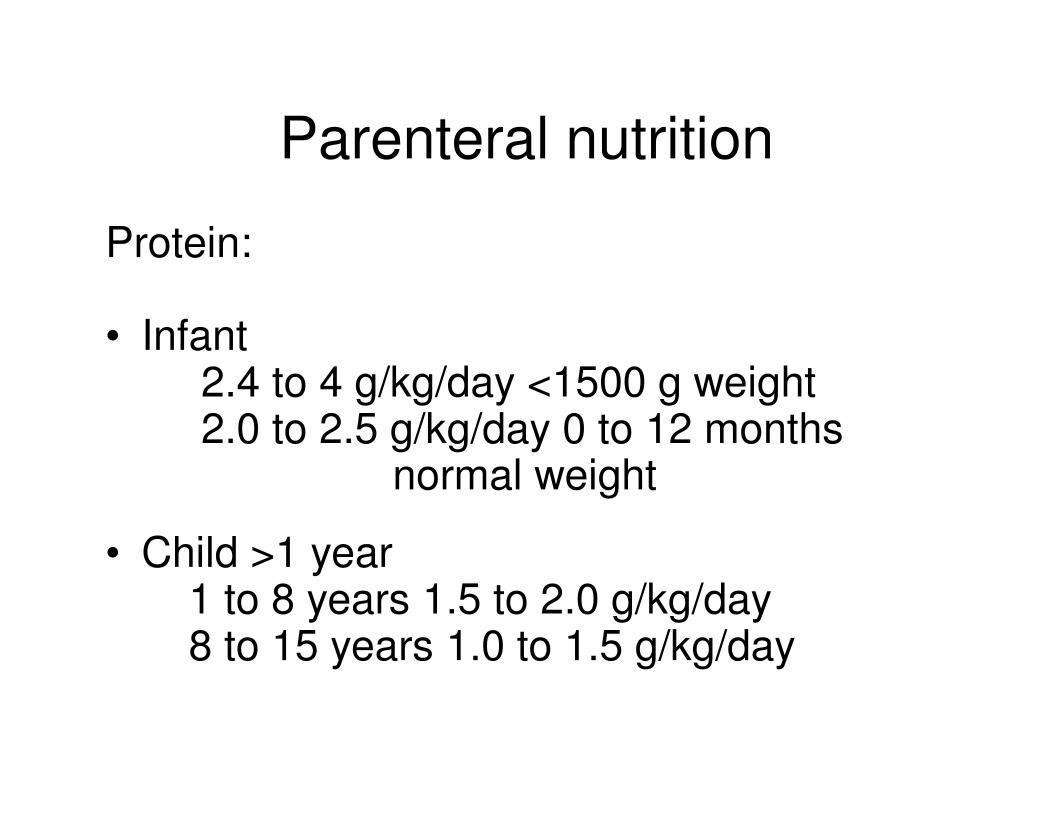
Parenteral nutrition
Protein:
• Infant 2.4 to 4 g/kg/day <1500 g weight2.0 to 2.5 g/kg/day 0 to 12 months
normal weight
• Child >1 year1 to 8 years 1.5 to 2.0 g/kg/day8 to 15 years 1.0 to 1.5 g/kg/day
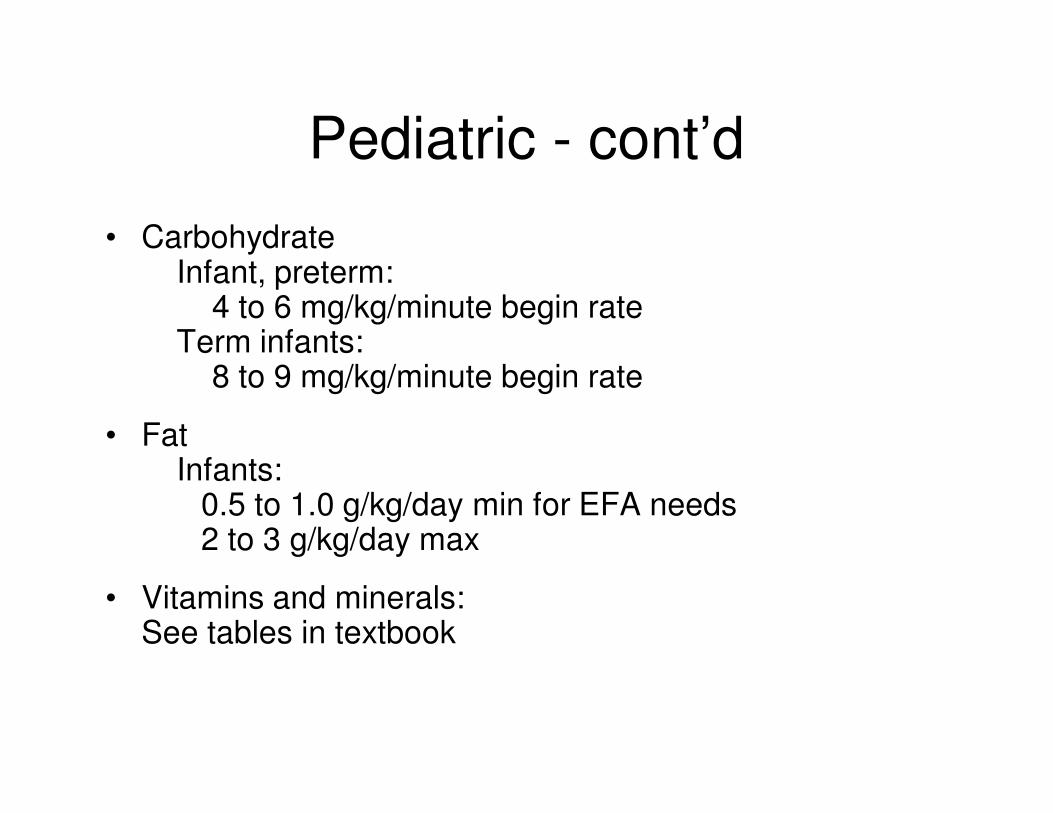
Pediatric - cont’d
• CarbohydrateInfant, preterm:
4 to 6 mg/kg/minute begin rateTerm infants:
8 to 9 mg/kg/minute begin rate
• FatInfants:
0.5 to 1.0 g/kg/day min for EFA needs2 to 3 g/kg/day max
• Vitamins and minerals:See tables in textbook
Fight against malnutrition
in hospital• Nutrition specialists with transversal
activity across medial departments
• Hospital clinical nutrition units
Administration
• Start slowly
(1 L 1st day; 2 L 2nd day)
• Stop slowly
(reduce rate by half every 1 to 2 hrs
or switch to dextrose IV)
• Cyclic give 12 to 18 hours per day
Monitoring and Complications
• Infection
• Hemodynamic stability
• Catheter care
• Refeeding syndrome
Refeeding Syndrome
• Hypophosphatemia
• Hyperglycemia
• Fluid retention
• Cardiac arrest
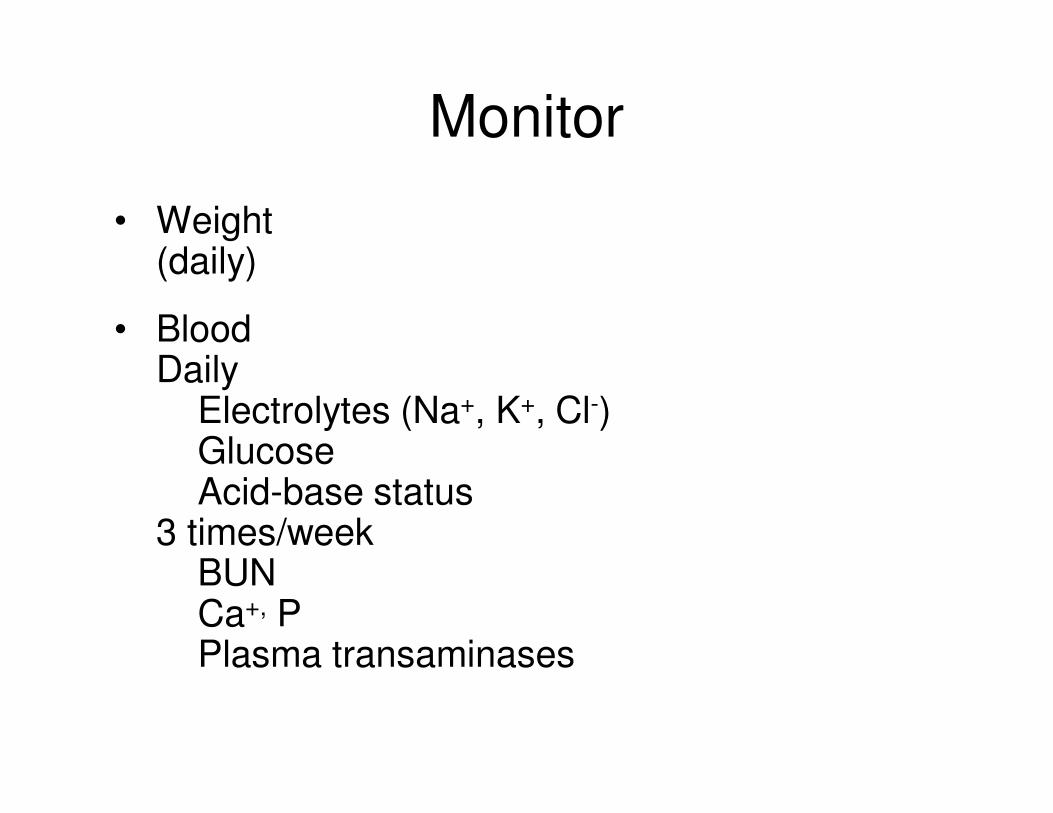
Monitor
• Weight(daily)
• BloodDaily
Electrolytes (Na+, K+, Cl-)GlucoseAcid-base status
3 times/weekBUNCa+, PPlasma transaminases
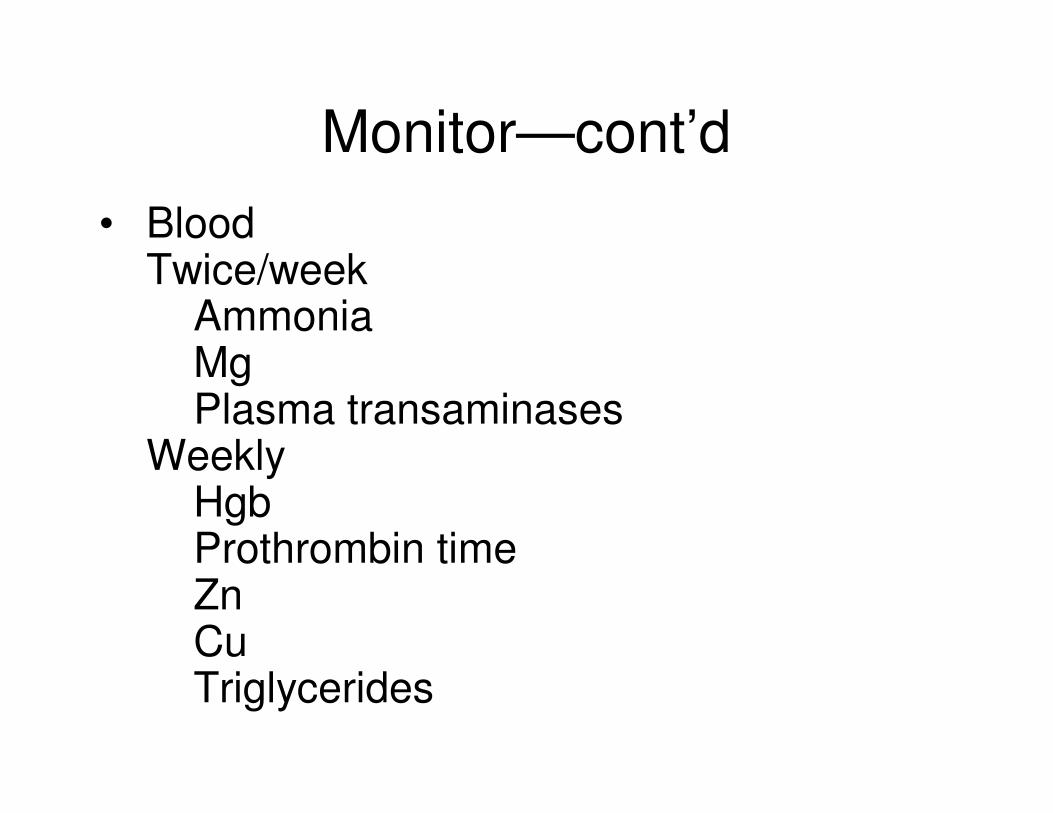
Monitor—cont’d
• BloodTwice/week
AmmoniaMgPlasma transaminases
WeeklyHgbProthrombin timeZnCuTriglycerides
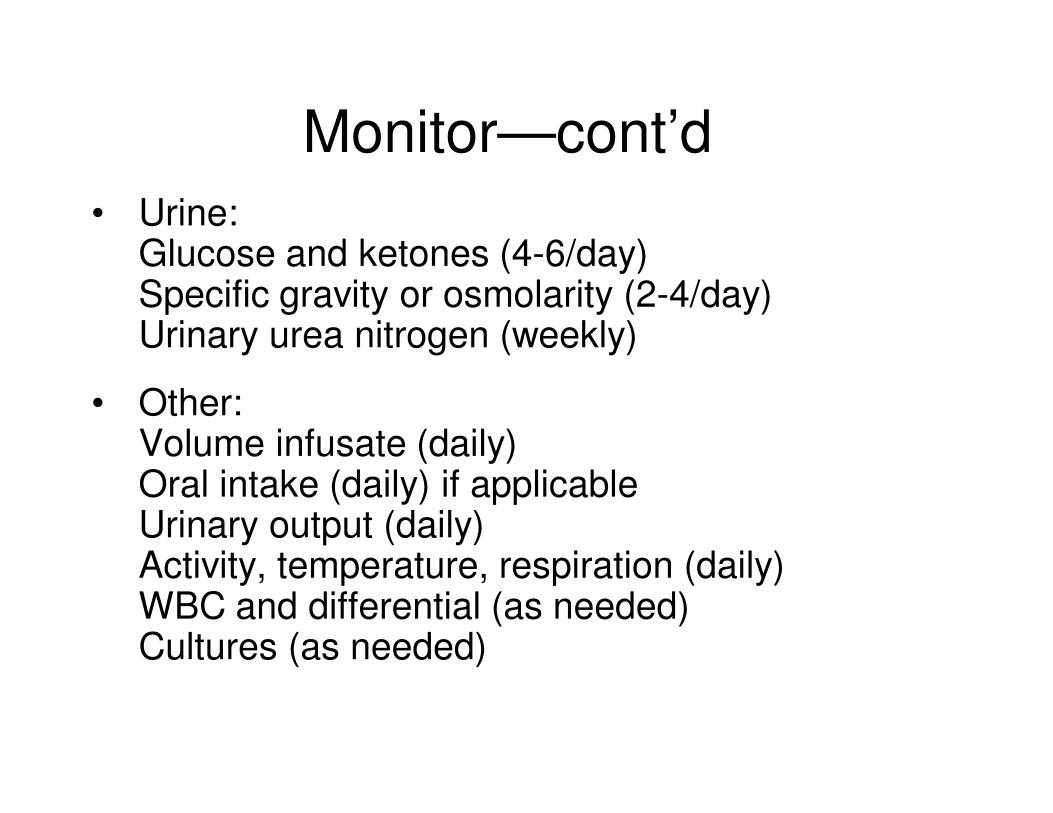
Monitor—cont’d
• Urine:Glucose and ketones (4-6/day)Specific gravity or osmolarity (2-4/day)Urinary urea nitrogen (weekly)
• Other:Volume infusate (daily)Oral intake (daily) if applicableUrinary output (daily)Activity, temperature, respiration (daily)WBC and differential (as needed)Cultures (as needed)
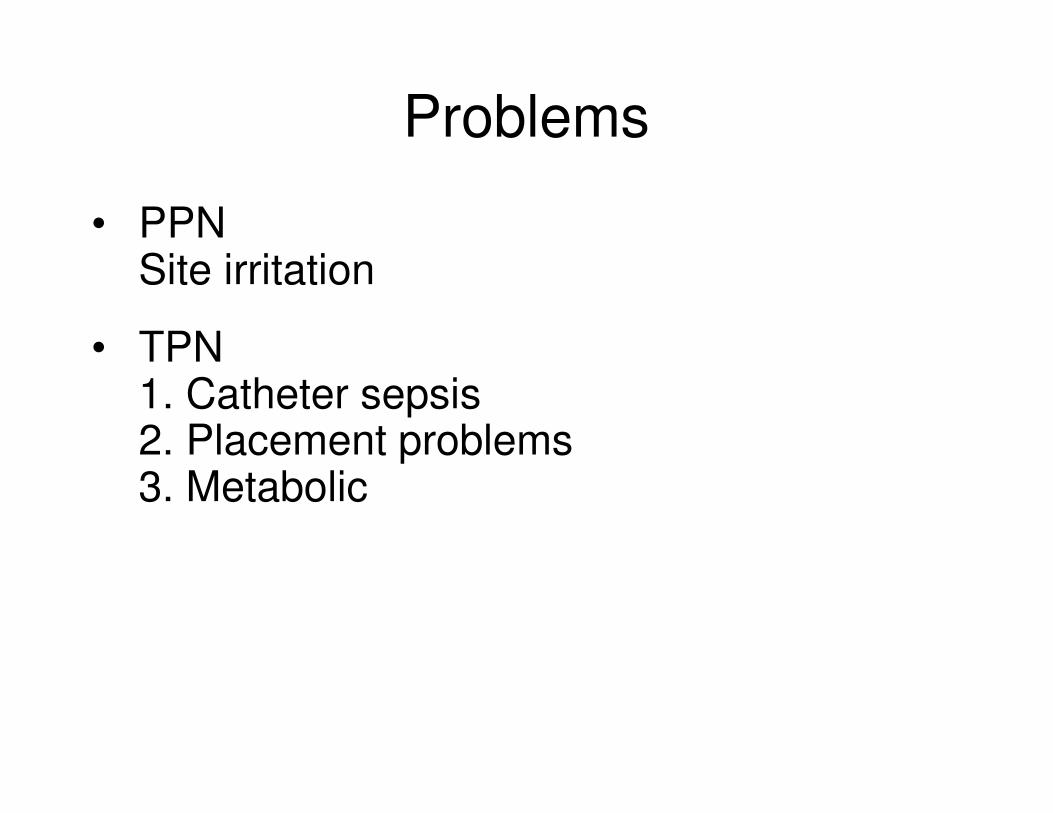
Problems
• PPNSite irritation
• TPN1. Catheter sepsis2. Placement problems3. Metabolic
Document in Chart
• Type of feeding formula and tube
• Method (bolus, drip, pump)
• Rate and water flush
• Intake energy and protein
• Tolerance, complications, and
corrective actions
• Patient education