nutrient characteristics of the water masses and their seasonal variability in the eastern...
TRANSCRIPT

lable at ScienceDirect
Marine Environmental Research 70 (2010) 272e282
Contents lists avai
Marine Environmental Research
journal homepage: www.elsevier .com/locate /marenvrev
Nutrient characteristics of the water masses and their seasonal variability in theeastern equatorial Indian Ocean
S. Sardessai a,*, Suhas Shetye b, M.V. Maya a, K.R. Mangala a, S. Prasanna Kumar a
aNational Institute of Oceanography,1 Dona-Paula, Goa 403004, IndiabNational Centre for Antarctic & Ocean Research,2 Headland Sada, Vasco da Gama, Goa 403804, India
a r t i c l e i n f o
Article history:Received 22 December 2009Received in revised form18 May 2010Accepted 24 May 2010
Keywords:Equatorial Indian OceanThermohaline characteristicsChemical propertiesWater massesNutrientsDissolved oxygenN/P ratioNitrate deficitSeasonal variability
* Corresponding author. Chemical Oceanography DOceanography, Dona-Paula, Goa 403004, India. Tel.: þ92450607.
E-mail addresses: [email protected] (S. Sardessai)[email protected] (M.V. Maya), [email protected] (S. Prasanna Kumar).
1 Council of Scientific & Industrial Research, New D2 Ministry of Earth Sciences, Government of India.
0141-1136/$ e see front matter � 2010 Elsevier Ltd.doi:10.1016/j.marenvres.2010.05.009
a b s t r a c t
Nutrient characteristics of four water masses in the light of their thermohaline properties are examinedin the eastern Equatorial Indian Ocean during winter, spring and summer monsoon. The presence of lowsalinity water mass with “Surface enrichments” of inorganic nutrients was observed relative to 20 m inthe mixed layer. Lowest oxygen levels of 19 mM at 3�N in the euphotic zone indicate mixing of low oxygenhigh salinity Arabian Sea waters with the equatorial Indian Ocean. The seasonal variability of nutrientswas regulated by seasonally varying physical processes like thermocline elevation, meridional and zonaltransport, the equatorial undercurrent and biological processes of uptake and remineralisation. Circu-lation of Arabian Sea high salinity waters with nitrate deficit could also be seen from low N/P ratio witha minimum of 8.9 in spring and a maximum of 13.6 in winter. This large deviation from Redfield N/P ratioindicates the presence of denitrified high salinity waters with a seasonal nitrate deficit ranging from�4.85 to 1.52 in the Eastern Equatorial Indian Ocean.
� 2010 Elsevier Ltd. All rights reserved.
1. Introduction
Seasonal thermohaline alteration in the equatorial IndianOcean caused by surface circulation, voluminous precipitationand fresh water flow is unique to this region due to the reversingannual wind patterns associated with Asian monsoon system(from 10�S to 10�N). Consequently the equatorial currents areseasonal and differ in character from those in the other oceans(Schott and McCreary, 2001). During the north-east monsoonfrom November to March there is an eastward flowing equatorialcounter current and a westward flowing north equatorial currentapart from the circulations in the northern Indian ocean. Duringsouth-west monsoon from May to September, equatorial countercurrent merges with the easterly flowing south-west monsooncurrent and continues to flow to the east. These zonal currents
ivision, National Institute of1 832 2450290; fax: þ91832
, [email protected] (S. Shetye),(K.R. Mangala), prasanna@
elhi, India.
All rights reserved.
along the hydrothermal front prevent any general meridionalexchange in the upper layers between the northern and thesouthern regions except at the eastern and western boundaries(Morales et al., 1996). They feed the waters drifting south fromthe central part of the Arabian Sea (Rochford, 1964). The lowsalinity surface water mass in the equatorial Indian ocean isformed due to excess precipitation over evaporation whichcharacterizes the northeastern part (Bay of Bengal) of the Indianocean (Rao and Jayaraman, 1968; Sengupta et al., 2006) andincursion of the Pacific ocean water through the Indonesianthrough flow (ITF) into the Indian ocean (Sharma et al., 1978). Thehigh salinity water mass (35e35.6) beneath the less saline surfacewater forms the shallow subsurface maximum and showsseasonal spatial variability. Based on an ocean general circulationmodel coupled to an atmospheric boundary layer model, Schiller(2003) reported that the seasonal cycle of the thermocline watermass transportation in the Indian waters is associated withseasonal density fluxes and interior mixing. This water mass isfound between 0 and 190 m. The depth of the salinity maximumdeepens where the low salinity water overlies it. The primarypurpose of the present study is to categorize the different watermasses and their seasonal changes, based on their temper-atureesalinity (TS) characteristics, the oxygen and nutrientscharacteristics in the upper 1000 m water column and to add to
S. Sardessai et al. / Marine Environmental Research 70 (2010) 272e282 273
the sparse information on the chemical features of the EasternEquatorial Indian Ocean.
2. Material and methods
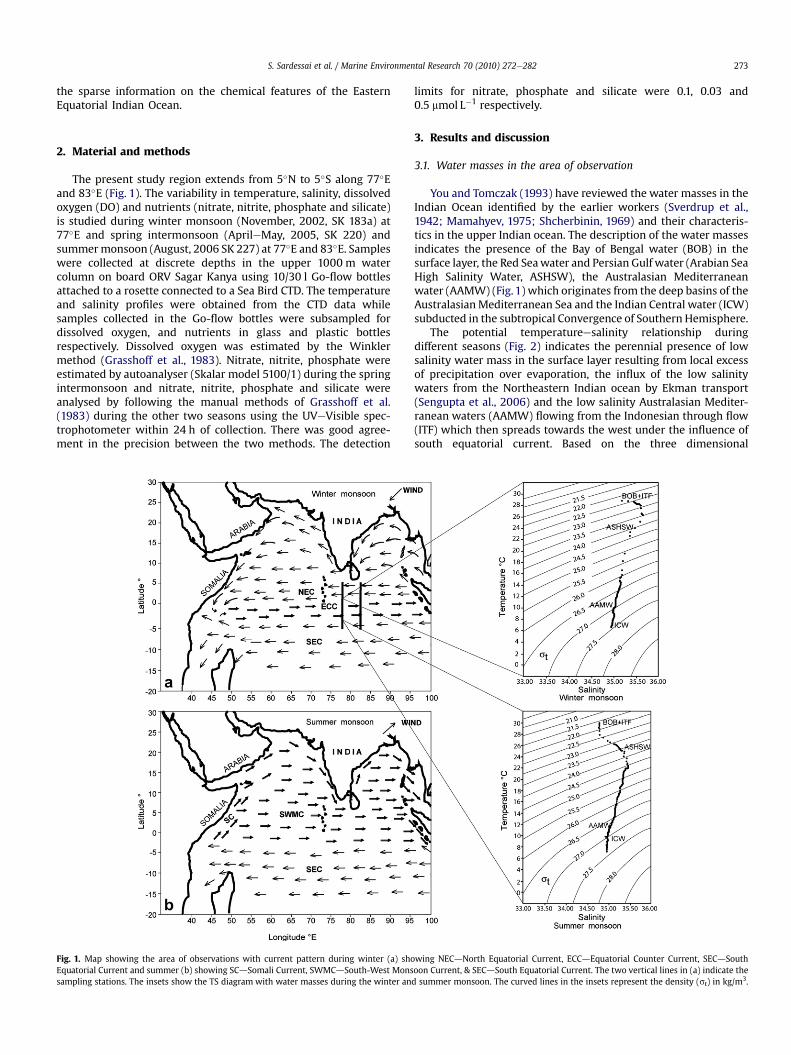
The present study region extends from 5�N to 5�S along 77�Eand 83�E (Fig. 1). The variability in temperature, salinity, dissolvedoxygen (DO) and nutrients (nitrate, nitrite, phosphate and silicate)is studied during winter monsoon (November, 2002, SK 183a) at77�E and spring intermonsoon (AprileMay, 2005, SK 220) andsummermonsoon (August, 2006 SK 227) at 77�E and 83�E. Sampleswere collected at discrete depths in the upper 1000 m watercolumn on board ORV Sagar Kanya using 10/30 l Go-flow bottlesattached to a rosette connected to a Sea Bird CTD. The temperatureand salinity profiles were obtained from the CTD data whilesamples collected in the Go-flow bottles were subsampled fordissolved oxygen, and nutrients in glass and plastic bottlesrespectively. Dissolved oxygen was estimated by the Winklermethod (Grasshoff et al., 1983). Nitrate, nitrite, phosphate wereestimated by autoanalyser (Skalar model 5100/1) during the springintermonsoon and nitrate, nitrite, phosphate and silicate wereanalysed by following the manual methods of Grasshoff et al.(1983) during the other two seasons using the UVeVisible spec-trophotometer within 24 h of collection. There was good agree-ment in the precision between the two methods. The detection
Fig. 1. Map showing the area of observations with current pattern during winter (a) shoEquatorial Current and summer (b) showing SCdSomali Current, SWMCdSouth-West Monssampling stations. The insets show the TS diagram with water masses during the winter an
limits for nitrate, phosphate and silicate were 0.1, 0.03 and0.5 mmol L�1 respectively.
3. Results and discussion
3.1. Water masses in the area of observation
You and Tomczak (1993) have reviewed the water masses in theIndian Ocean identified by the earlier workers (Sverdrup et al.,1942; Mamahyev, 1975; Shcherbinin, 1969) and their characteris-tics in the upper Indian ocean. The description of the water massesindicates the presence of the Bay of Bengal water (BOB) in thesurface layer, the Red Seawater and Persian Gulf water (Arabian SeaHigh Salinity Water, ASHSW), the Australasian Mediterraneanwater (AAMW) (Fig. 1) which originates from the deep basins of theAustralasianMediterranean Sea and the Indian Central water (ICW)subducted in the subtropical Convergence of Southern Hemisphere.
The potential temperatureesalinity relationship duringdifferent seasons (Fig. 2) indicates the perennial presence of lowsalinity water mass in the surface layer resulting from local excessof precipitation over evaporation, the influx of the low salinitywaters from the Northeastern Indian ocean by Ekman transport(Sengupta et al., 2006) and the low salinity Australasian Mediter-ranean waters (AAMW) flowing from the Indonesian through flow(ITF) which then spreads towards the west under the influence ofsouth equatorial current. Based on the three dimensional
wing NECdNorth Equatorial Current, ECCdEquatorial Counter Current, SECdSouthoon Current, & SECdSouth Equatorial Current. The two vertical lines in (a) indicate thed summer monsoon. The curved lines in the insets represent the density (st) in kg/m3.

Fig. 2. Temperatureesalinity diagrams during different seasons at 77�E. and 83�E. The abbreviations for water masses are: BOB e Bay of Bengal, ITF e Indonesian Through Flow,ASHSW e Arabian Sea High Salinity Water, AAMW e Australasian Mediterranean Water and ICW e Indian Central Water. Curved lines show density (st) in kg/m3.
S. Sardessai et al. / Marine Environmental Research 70 (2010) 272e282274
trajectories and tracer pathways Valsala and Ikeda (2007) observedthat the ITF resides in the shallow region of the northern IndianOcean owing to the major upwelling zones in the north and grad-ually deepens towards the equator. Jensen (2003) also confirmssouthern Indian ocean sources in themixed layer of the Arabian seawhich includes ITF. The through flow transport appears to varyseasonally with maximum values during northern summer(JulyeSeptember) and almost negligible values during northernwinter (JanuaryeMarch) (Fieux et al., 1994, 1996; Arief and Murrey,1996). The scatter in the data is largely due to the spatial variabilityin the influx of less saline waters during different seasons. The highsea surface salinity and low temperature in the Arabian Sea duringwinter increase the surface water density and lead to the formationof ASHSW. This ASHSW sinks to subsurface depth (50e100 m) andspreads southward in the Arabian Sea and equatorial region
(Prasanna Kumar and Prasad, 1999) The ASHSW is seen along iso-picnal surfaces (sigmaQ ¼ 23e24). The deeper layers between 200and 1000 m show two distinct water masses with marked salinitychanges. The water mass to the north of the equator with a salinityrange of 35e35.1 is seen at 200 m to the south and spreads down to1000 m to the north of the equator in all the three seasons. The lowsalinity water mass to the south of the equator is characterized bya salinity of �34.9 and is confined between 500 and 1000 m to thesouth of the equator during winter and summer monsoon whereasit occupied a narrow band between 2�S and 5�S during spring. Thiswater mass is identified as the intrusion of low salinity waters fromthe Australasian Mediterranean waters (AAMW) under the influ-ence of south equatorial counter current (Sharma et al., 1978). Thenorthern higher salinity water mass is a mixture of the Persian Gulfand Red Sea waters which is found at 200 m at 5�S in the

S. Sardessai et al. / Marine Environmental Research 70 (2010) 272e282 275
meridional region of our observations and flows down to 800 m tothe north and termed as Indian central water (ICW) (You andTomczak, 1993).
3.2. Seasonal variability of water masses
The seasonal variability of water masses is largely governed bythe seasonal physical forcings in the upper 120 m of the watercolumn. Duringwinter season (November 2002), starting at 60 m atthe southern end of the transect (5�S) the 28 �C isotherm graduallyslopes upwards with maximum elevation to 40 m at 2�S anddeepens to 70 m at the equator. The isotherm shoaled up to 50 m at
Fig. 3. Vertical distribution of temperature (a,b,c,) and salinity (d,e,f) d
3�N (Fig. 3a). The near surface water mass was less saline(34.4e35.0) and extended from equator to 5�S down to 40 m withisolines of increasing salinity shoaling up from 60 m towards theequator (Fig. 3d). The fall jet induced Arabian Sea high salinitywater core ranging from 35.2 to 35.6 was observed to the north ofthe equator and spread down to 120 m depth. During the springintermonsoon (May 2005) (Fig. 3b) the mixed layer depth wasgradually reduced from 60 m at the equator to 20 and 40 m towardsthe south and north of it respectively and shoaling up of the ther-mocline was observed at 3�N. The isothermal layer was warmer(>29 �C) compared to the winter season and the thermoclinedeepened to 250 m at 5�N. The core of high salinity water observed
uring winter, spring and summer monsoon respectively at 77�E.

Fig. 4. Vertical distribution of temperature (a,b) and salinity (c,d) during spring andsummer monsoon respectively at 83�E.
S. Sardessai et al. / Marine Environmental Research 70 (2010) 272e282276
to the north of the equator under the influence of fall jet shifted tothe south of it during spring intermonsoon and extended from 20to 120 m and the low salinity surface water mass (34.0e34.6) wasrestricted to the south and north of the equator up to 40 m (Fig. 3e).The summer monsoon (August 2006) was characterized by shoal-ing of the subsurface waters at 2�S and sinking at 2�N. Theisothermal layer was shallow towards the south and the 29 �Cisotherm was found almost up to the surface at 5�S and at 20 m at2�S and deepened to about 70 m at 2�N. A deep thermocline(225 m) was observed during this season towards the north of theequator and the presence of the Equatorial UnderCurrent between80 and 300 m during this season depressed the isotherms to deeperdepths (Fig. 3c). The low salinity waters (34.8e34.9) occupied theupper 40 m and extended from 4�S to 3�N whereas the core ofsubsurface salinity maximum (35.1e35.3) occupied the regionbetween 5�S and 2�N between 60 and 200 m. High salinity watermass was also observed from 4 to 5�N from surface to a depth ofabout 120 m (Fig. 3f).
Measurements carried out during spring intermonsoon andsummer monsoon at 83�E (Fig. 4) were found to be similar to thatobserved at 77�E. In this region the core of subsurface high salinitywater spreads from north to south during spring intermonsoon(Fig. 4c) whereas it is confined to the southern region duringsummer monsoon in the depth range of 40e120 m (Fig. 4d). Thedeeper water masses do not show temporal variability. Howeverthe extent of spreading of these two water masses in the deepwaters depends on the seasonally varying advection.
3.3. Oxygen
The oxygen variability in the upper 1000 m depth is plotted inthe regions of intense physical forcings i.e. in the region of ther-mocline shoaling up between 2�S and 5�S; in the region ofconvergence at the equator and corresponding upwelling at 3�Nduring winter and spring seasons at 77�E (Fig. 5a, b) and at 3�S,equator and 3�N at 83�E in spring season (Fig. 5c). The isothermallayer (>28 �C) down to 40 m at 2�S and the deeper convergencezone at the equator down to 70 m was characterized by highoxygen levels (>190 mM) during winter season. The top of thethermocline was associated with 194 mM of oxygen which rapidlydecreased to 32 mM at the bottom of the thermocline at 120 m. at3�N. This is the subsurface oxygen minima of 32 mM observed at3�N which is associated with high salinity Arabian Sea water(35.2e35.6) north of the equator. The oxygen levels increased to67 mMat the equator and at 2�S due to themixing of the lowoxygenand high salinity water with the low salinity (34.8e35) subsurfaceequatorial Indian Ocean water. The gradual decrease in the oxygenlevels in the deeper waters showed minimum oxygen of 50 mMconfined to the north of the equator whereas oxygen levels werehigher at similar depths towards the south. The warmer mixedlayer (>29 �C) during spring had 180 mM of oxygen in the surfacelayer. The upheaval of the thermocline at 5�S elevated the watermass with low oxygen (132 mM) to 40 m whereas the convergenceat the equator increased the oxygen to 167 mM down to 100 m(Fig. 5b). The shoaling up of the water mass at 3�N brought the lowoxygen waters of about 40 mM from deeper layers to shallowerdepths of 80e120 m. The oxygen minima of 19 mM (salinity 35.02)was found at 150 m at 3�N which gradually increased to 100 mM atthe equator and to 73 mmol at 5�S. Below 150 m, oxygen levels at3�N increased down to 300 m with a decreasing trend towardsgreater depths. At 83�E the oxygen profiles (Fig. 5c) show similarpattern of variations as that at 77�E, however the convergence atthe equator and up to 2e3�N resulted in higher levels of oxygen at100e120 m and the shoaling up of the thermocline at 3�S reducedthe oxygen levels compared to that at the equator. The signatures of
mixing of the ASHSW at 3�N are seen in the steep decrease inoxygen levels from 131 mM at 120 m to 32 mM at 150 m. In general,the deeper water mass showed distinct changes in the secondaryoxygen minima between 600 and 800 m to the south and north ofthe equator. During spring at 77�E oxygen concentration variedfrom 32.1 to 55.5 mM (Avg. 42 mM) to the north of the equatorwhereas to the south of the equator it varied from 45.9 to 86.8 mM(avg. 64 mM). At 83�E, it varied from 22.2 to 52.9 mM (Avg. 41.4 mM)to the north and 49.4e71.5 mM (Avg. 59 mM) to the south of theequator. Oxygen being a non conservative property an intermediateoxygenminimum associatedwith a salinity maximum indicates theinfluence of ASHSW. Oxygen levels were low towards the north andgradually increased towards the south. It is therefore evident thatthe high salinity water mass in the northern region i.e. the IndianCentral Water contained lower oxygen than the lower salinityAAMW in the south. The distribution of oxygen is influenced by thespatial and temporal variability of water masses present in thisregion which are regulated by the seasonally varying current

Fig. 5. Vertical profiles of oxygen in the regions of intense physical forcings during winter and spring intermonsoon at 77�E and Spring intermonsoon at 83�E.
S. Sardessai et al. / Marine Environmental Research 70 (2010) 272e282 277
pattern as well as utilization of oxygen for the oxidation of organicmatter at intermediate depths.
Fig. 6. Surface enrichment (difference between the surface and the minimumconcentration at 20 m depth) of nutrients during winter, spring and summer monsoonat 77�E and spring intermonsoon and summer monsoon at 83�E.
3.4. Nitrate, phosphate and silicate
The nutrients show asymmetric distribution in the meridionalsections at different depth levels and are regulated by seasonallyvarying physical processes like thermocline elevation meridionaland zonal transport, the equatorial undercurrent and elevation ofnutrient replete waters north of the equator and sinking of nutrientpoor water towards the equator driven by tropical instability waves(Evans et al., 2009). Generally the isothermal layer (depth varieswith stations and seasons) is devoid of nutrients but in the area ofour observations, enrichment of phosphate (0.01e1.77 mM), nitrate(0.02e3.0 mM), and silicate (0.01e2.3 mM) was found in the surfacewaters (w1 m) compared to the minimum at 20 m depth. Thedifference in the concentration between the two depths is referredto as “surface enrichments” of inorganic nutrients (Haury et al.,1994). Fig. 6 shows the enrichment levels of all the three nutri-ents during different seasons. Nitrate showed the least enrichmentduring spring intermonsoon and maximum enrichment duringsummer monsoon, phosphate enrichment was least in wintermonsoon and spring intermonsoon (83�E). Silicate enrichment wasthe maximum of all the three nutrients. Phosphate enrichment insurface waters has been reported over the past four decades andhas been variously attributed to bubble or atmospheric input viadry and wet precipitation (Harvey, 1955), bubble scavenging(Baylor et al., 1962), Langmuir circulations for bubble aggregatedphosphate in surface layers (Sutclifee et al., 1963) and atmosphericinput (Eppley and Koeve, 1990; Eppley et al., 1990; Karl and Tien,1992). Taylor et al. (1993) observed surface enrichment in nitratenorth of Bermuda whereas Haury and Shulenberger (1982) andHaury et al. (1994) observed the enrichment of three nutrients insurface waters over the subsurface waters. Haury et al. (1994) intheir analyses of the data on North Pacific Ocean observed that theenrichment is usually clearest and most frequent in silicate,weakest and least frequent in nitrate. This report on the surface

S. Sardessai et al. / Marine Environmental Research 70 (2010) 272e282278
enrichment of nutrients is believed to be the first of its kind in theIndian Ocean.
The distribution of nutrients down to 1000 m at both themeridional sections is shown in Figs. 7e9 for nitrate, phosphate andsilicate respectively. At 77�E section, the upheaval of the watermass towards south and north of the equator elevated the nitratelevels below the mixed layer whereas in the equatorial conver-gence zone, waters with low nitrates (1 mM) were extended downto 60 m in the northern region during winter season (Fig. 7a). Theisolines in this layer shoaled up towards the south, consistent withthe southward shallowing of the mixed layer. The thermocline wasbetween 40 and 120 m at 3�N and the shoaling up of the watermass elevated the nitrate levels from 1 mM at the top of the ther-mocline to 32 mM at 120 m. The intermediate waters showed
Fig. 7. Vertical distribution of nitrate during winter monsoon (a), spring intermonsoon (b) anat 83�E.
deepening of the isolines at 1�S between 200 and 700 m due to thepresence of the undercurrent in the equatorial region. The springintermonsoon showed higher nitrate at shallower depths at 3�Sand 3�N on either side of the equatorial convergence and nitratedepleted 60 m mixed layer at the equator (Fig. 7b). The subsurfaceundercurrent at 80e120 m depressed the nitrate isolines whichreduced the nitrate levels in the vicinity of the equatorial region.The summer monsoon season (Fig. 7c) showed deeper oligotrophiclayer (60 m) to the south compared to the north with subsurfacewater mass upheaval from the equatorial region to 3�N andpersistence of the subsurface undercurrent was seen in the equa-torial region. The nitrate levels were in general greater down to120 m to the north in all the three seasons which showed steepslopes to the south. At 83�E meridian the upheaval of the water
d summer monsoon (C) at 77�E and spring intermonsoon (d) and summer monsoon (e)

Fig. 8. Vertical distribution of phosphate during winter monsoon (a), spring intermonsoon (b) and summer monsoon (C) at 77�E and spring intermonsoon (d) and summermonsoon (e) at 83�E.
S. Sardessai et al. / Marine Environmental Research 70 (2010) 272e282 279
mass below the mixed layer during spring and summer monsoon(Fig. 7d,e) depressed the nitrate levels at the equator whereas theundercurrent to the north of the equator depressed the nitrateisolines to greater depths in the region of 100e200 m. The watersbelow 200 m showed higher nitrate towards the north and thedeepening of the same isolines towards the south during springand uniform distribution from north to south during summer. The
seasonal pattern of phosphate distribution at 77�E (Fig. 8) showedmarked changes compared to nitrate with steep rise in the isolinesin the upheaval region at 3�N in the upper 120 m during spring(Fig. 8b) and in the vicinity of the equator during summer (Fig. 8c).The signatures of the depression of the isolines in the region of theundercurrent are seen in the equatorial region during both theseasons and higher phosphates are also seen at shallower depths

Fig. 9. Vertical distribution of Silicate during winter monsoon (a), and summer monsoon (b) at 77�E and summer monsoon (c) at 83�E.
S. Sardessai et al. / Marine Environmental Research 70 (2010) 272e282280
(between 40 and 200 m) towards the north compared to the south.The pattern of distribution of phosphate at 83�E (Fig. 8d,e) wassimilar to that at 77�E. The signatures of physical forcings could beseen in the pattern of distribution of silicate (Fig. 9) but were not asconspicuous as that of the other two nutrients. There was noincrease of silicate to the north of the equator compared to thesouth of it during summer at 77�E. However significant increasetowards the north could be noticed during summer at 83�E.Dugdale et al. (2002) also observed asymmetric distribution ofnutrients in the equatorial Pacific upwelling system and attributedthese asymmetries to the south equatorial current that overridesthe equator in the shallow depths and is compensated by flow atdepth from the north. Thus the characteristics of ICW could be seenby the presence of higher nutrients in the northern regioncompared to the south.
3.5. N/P ratio and nitrate deficit
The oxidation of organic matter releases nutrients in a propor-tion given by the Redfield ratio (Redfield et al., 1963). Deviationsfrom these stoichiometric ratios have been reported in differentbiogeochemical provinces influenced by physical processes likeupwelling, convective mixing giving rise to oxygenminimum zones(Morrison et al., 1999) which give rise to chemical processes likedenitrification and production of nitrous oxide and nitrogen fixa-tion (Naqvi, 1994; Hype and Karstensen, 2000; Devol et al., 2006;Silva et al., 2009). Though these processes are highly localized thefingerprints of these processes are far removed and are detectedthrough nitrate deficits though there is mixing of the water masses.The N/P ratio in the equatorial Indian Ocean is influenced by theArabian Sea harbouring such biogeochemical provinces. Fig. 10shows the average N/P ratio during different seasons in the areaof our observations. It varied from 13.6 during winter to aminimumratio of 8.9 in spring. During summer a bimodal type of distributionin the N/P ratio was observed. At concentrations of <25 mM of
nitrate the N/P ratio was 14.6 and at concentrations >25 mM it was10.47 at 77�E. At 83�E the average N/P ratio was 9.81 duringsummer and 9.57 during spring. Naqvi et al. (1990) have reportedseasonal changes in the chemical composition of intermediatewaters with higher nitrate deficits during NE monsoon and lowdeficits during SW monsoon in the intermediate waters of theArabian Sea. Based on a three end member mixing model Li andPeng (2002) have reported N/P ratio of 10 for the deep equatorialIndian Ocean and 13 for the northern Pacific ocean and suggestproduction of gaseous N2O and N2 by bacteria during nitrification/denitrification processes in low oxygenated microenvironment.The nitrate deficit is calculated for the upper 1000 mwater columnbased on the equation DN¼ (NO�O2)/9.1�NO3�NO2 as given byNaqvi et al. (1990) and also by using the equationN*¼Nitrate� 16 * phosphateþ 2.9 mmol kg�1 as given by Deutschet al. (2001). A typical comparison has been made on the resultsobtained using the two formulations and given in Table 1. There isfound to be a significant difference in the nitrate deficits since oneused oxygen based and the other phosphate notations. However inview of the proximity of the Arabian Sea to our study areawe opt torely on the results obtained using the equation by Naqvi et al.(1990). The average seasonal nitrate deficit based on the equationby Naqvi et al. (1990) was �4.85, 1.52 and �3.27 during wintermonsoon, spring intermonsoon and summer monsoon respectivelyat 77�E and 1.52 for spring intermonsoon at 83�E. Based on theequation by Deutsch et al. (2001) it was �1.18, �10.48 and �6.82during winter monsoon, spring intermonsoon and summermonsoon respectively at 77�E and �9.46 and �8.06 for springintermonsoon and summer monsoon respectively at 83�E. Thenitrate deficits may not be as strong as that in the Arabian Seawaters due to the mixing of the water masses in the equatorialIndian Ocean region. Nevertheless the influence of denitrifiedwaters to the south is conspicuous since the Arabian Sea watersshow strong upward advection particularly during spring inter-monsoon even at 5�S (Fig. 2e).

Table 1Comparison of average nitrate deficits during different seasons at different depth intervals calculated using equations given by Naqvi et al. (1990) and Deutsch et al. (2001).
Season Latitude Depth range (m) Avg of (positive) NO3 deficit Avg of NO3 deficitNaqvi et al. (1990) Deutsch et al. (2001)
Winter monsoon 77�E 5�Se3�N 0e1000 m �4.85 (all negative) �1.18
Spring Intermonsoon 77�E 5�N 100e1000 5.25 �15.704� , 3� , 2.5�N 80e1000 4.98 �19.151.5�N 100e1000 4.48 �11.761�N, 0.5�N, equator & 0.5�S 120e1000 2.99 �10.451�S, 1.5�S 100e1000 4.15 �13.312.5� , 3�S 80e1000 4.70 �11.234�S 60e1000 6.91 �7.635�S 40e1000 6.51 �11.15
Summer Monsoon 77�E 4�S 60e100 2.54 �2.393�S 60e80 2.84 �3.221�S 80e100 & 200 0.79 �16.780.5�S 200 0.161 �16.500� 200 0.823 �5.601�N 120 & 200 5.52 �5.112�N 120& 150 2.29 �3.213�N 40e60 & 120e200 0.50 0.83
Spring Intermonsoon 83�E 5�N 60e1000 7.52 �11.904�N 100e1000 6.43 �12.513�N 80e1000 4.73 �6.612.5�N 120e1000 3.69 �15.631.5�N 150e1000 5.09 �5.231� , 0.5�N 120e1000 4.23 �7.600� 200e1000 2.84 �18.340.5�S 120e1000 7.70 �13.041�S 60e1000 5.27 �10.061.5� , 2.5� , 3�S 100e1000 4.55 �8.454�S 40e1000 5.53 �8.035�S 150e1000 7.87 �12.73
Summer monsoon 83�E 5�Se5�N 0e1000 m e �8.06
Fig. 10. Nitrate to phosphate ratio during different seasons at 77�E and 83�E.
S. Sardessai et al. / Marine Environmental Research 70 (2010) 272e282 281

S. Sardessai et al. / Marine Environmental Research 70 (2010) 272e282282
4. Conclusion
The physicochemical properties of the eastern Equatorial IndianOcean along 77�E and 83�E indicate the presence of 4 water masses.The surface layer with low salinity waters is dominated mainly bythe waters from the Northeastern Indian Ocean and the ITF. Thesurface waters were also enriched with nutrients with silicatesshowing the highest enrichment in all the three seasons which isattributed to bubble or atmospheric input and bubble scavenging.The subsurface waters, the depth of which varies temporally andspatially, are strongly influenced by the ASHSW and carries thesignatures of nitrate deficits and oxygenminimum layer and lowN/P ratio. Two distinct water masses are identified below thesubsurface waters (>200 m) towards the north and south of theequator. The Australasian MediterraneanWaters towards the southis identified with relatively less saline waters and higher oxygen,whereas thewatermass towards the north of the equator identifiedas Indian Central water is characterized by higher salinity andlower oxygen levels and higher nutrients at shallower depths. Ingeneral the nutrients are higher towards the north compared to thesouth of the equator and is attributed to physical forcing like zonalcurrents, equatorial under currents and elevation of the thermo-cline to shallower depths. The fingerprints of nitrate deficits andlow N/P ratio are seen down to 1000 m indicating advection ofnitrate deficient Arabian Sea waters to greater depths.
Acknowledgements
The authors would like to thank the Director, National Instituteof Oceanography, for his interest and support in this work. Theauthors are also thankful to the Ministry of Earth Sciences forproviding the ship time, financial and logistic support to carry outthe observations for this project. The authors are also grateful to Dr.M. Dileep Kumar and the two anonymous reviewers for theircomments and suggestions which greatly helped to improve themanuscript. The reprographical assistance given by Shri ArunMahale, Shri Shyam Akerkar and shri U.K. Kumar is greatfullyacknowledged. This is NIO contribution no. 4761.
References
Arief, D., Murrey, S., 1996. Low frequency fluctuations in the Indonesian through-flow through Lombok strait. Journal of Geophysical Research 101 (C5),12455e12464.
Baylor, E.R., Sutcliffe, W.H., Hirschfeid, D.S., 1962. Adsorption of phosphate ontobubbles. Deep Sea Research 9, 120e124.
Deutsch, C., Gruber, N., Key, R.M., Sarmiento, J.L., 2001. Denitrification and N2fixation in the Pacific Ocean. Global Biogeochemical Cycles 15 (2), 483e506.
Devol, A.H., Uhlenhopp, A.G., Naqvi, S.W.A., Brandes, J.A., Jayakumar, D.A., Naik, H.,Gaurin, S., Codispoti, L.A., Yoshinari, T., 2006. Dinitrification rates and excessnitrogen gas concentrations in the Arabian Sea oxygen deficient zone. Deep SeaResearch I 53, 1533e1547.
Dugdale, R.C., Wischmeyer, A.G., Wilkerson, F.P., Barber, R.T., Chai, F., Jiang, M.-S.,Peng, T.-H., 2002. Meridional asymmetry of source nutrients to the equatorialPacific upwelling ecosystem and its potential impact on oceaneatmosphere CO2flux: a data and modeling approach. Deep-Sea Research II 49, 2513e2531.
Eppley, R.W., Koeve, W., 1990. Nitrate use by plankton in the eastern subtropicalAtlantic. MarcheApril 1989. Limnology and Oceanography 35, 1781e1788.
Eppley, R.W., Garside, C., Renger, E.H., Orellana, E., 1990. Variability of nitrateconcentration in nitrogen-depleted subtropical surface waters. Marine Biology107, 53e60.
Evans, W., Strutton, P.G., Chavez, F.P., 2009. Impact of tropical Instability waves onnutrient and chlorophyll distributions in the equatorial Pacific. Deep SeaResearch I 56, 178e188.
Fieux, M., Andrie, C., Delecluse, P.A., Ilahude, G., Kartavtseff, A., Mantisi, F.,Molcard, R., Swallow, J.C., 1994. Measurements within the Pacific-Indian OceanThroughflow Region. Deep Sea Research I 41 (7), 1091e1130.
Fieux, M., Molcard, R., Ilahude, A.G., 1996. Geostrophic transport of the Pacific-Indian Oceans throughflow. Journal of Geophysical Research 101, 12421e12432.
Grasshoff, K., Ehrhardt, M., Kremling, K., 1983. Methods of Seawater Analysis. VerlagChemie, New York, NY, 419 pp.
Harvey, H.W., 1955. The Chemistry and Fertility of Sea Water, first ed. CambridgeUniversity Press, Cambridge, 240 pp.
Haury, L.R., Shulenberger, E., 1982. Horizontal transport of phosphorus in the Cal-ifornia Current. CalCOFI Reports 23, 149e159.
Haury, L.R., Fey, C.L., Shulenberger, E., 1994. Surface enrichment of inorganicnutrients in the North Pacific Ocean. Deep Sea Research I 41, 1191e1205.
Hype, A., Karstensen, J., 2000. Redfield stoichiometry in Arabian Sea subsurfacewaters. Global Biogeochemical Cycles 14 (1), 357e372.
Jensen, T.G., 2003. Cross-equatorial pathways of salt and tracers from the northernIndian Ocean: modelling results. Deep Sea Research II 50, 2111e2127.
Karl, D.M., Tien, G., 1992. MAGIC: a sensitive and precise method for measuringdissolved phosphorus in aquatic environments. Limnology and Oceanography37, 105e116.
Li, Y.-H., Peng, T.-H., 2002. Latitudinal change of remineralization ratios in theoceans and its implication for nutrient cycles. Global Biogeochemical Cycles 16,1130. doi:10.1029/2001GB001828.
Mamahyev, I.O., 1975. Temperature Salinity Analysis of World Ocean Waters.Elsevier, Amsterdam, p. 374.
Morales, R.A., Barton, E.D., Heywood, K.J., 1996. Variability of water masses in thewestern Indian Ocean. Journal of Geophysical Research 101, 14,027e14,038.
Morrison, J.M., Codispoti, L.A., Smith, S.L., Wishner, K., Flagg, C., Gardner, W.D.,Gaurin, S., Naqvi, S.W.A., Manghnani, V., Prosperie, L., Gundersen, J.S., 1999. Theoxygen minimum zone in the Arabian Sea during 1995. Deep Sea Research II 46,1903e1931.
Naqvi, S.W.A., 1994. Denitrification process in the Arabian Sea. In: Lal, D. (Ed.),Biogeochemistry of the Arabian Sea: Present Information and Gaps. Proceedingsof Indian Academy of Science (Earth and Planetary Sciences), vol. 103. IndianAcademy of Science, Bangalore, India, pp. 279e300.
Naqvi, S.W.A., Noronha, R.J., Somasundar, K., SenGupta, R., 1990. Seasonal changes inthe denitrification regime of the Arabian Sea. Deep Sea Research 37, 593e611.
Prasanna Kumar, S., Prasad, T.G., 1999. Formation and spreading of Arabian Seahigh-salinity water mass. Journal of Geophysical Research 104, 1455e1464.
Rao, L.V.G., Jayaraman, R., 1968. Hydrographic features of the southern and centralBay of Bengal during the transition period between winter and summer.Bulletin National Institute of Science India 38, 184e205.
Redfield, A.C., Ketchum, B.H., Richards, F.A., 1963. The influence of organisms on thecomposition of sea water. In: Hill, M.N. (Ed.), The Sea, 2. Interscience, New York,pp. 26e77.
Rochford, D.J., 1964. Salinity maxima in the upper 1000 m of the north IndianOcean. Australian Journal of Marine and Freshwater Research 15, 1e24.
Schiller, A., 2003. Seasonal to interannual water mass formation in the uppertropical Indian Ocean. Journal of Geophysical Research 108 (C4), 3110.doi:10.1029/2002JCOO1531.
Schott, F.A., McCreary Jr., J.P., 2001. The monsoon circulation of the Indian ocean.Progress in Oceanography 51, 1e123.
Sengupta, D., Bharath Raj, G.N., Shenoi, S.S.C., 2006. Surface fresh water from Bay ofBengal runoff and Indonesian throughflow in the tropical Indian Ocean.Geophysical Research Letters 33, L22609. doi:10.1029/2006GL027573.
Sharma, G.S., Gouveia, A.D., Sathendranath, Shubha, 1978. Incursion of the PacificOcean water into the Indian Ocean. Proceedings of Indian Academy of Science(Earth and Planetary Sciences) 87, 29e45.
Shcherbinin, A.D., 1969. Water structure of the Equatorial Indian Ocean. Oceanology9, 487e495.
Silva, N., Rojas, N.A., Fedele, A., 2009. Water masses in the Humboldt currentsystem: properties, distribution and the nitrate deficit as a chemical water masstracer for equatorial subsurface water off Chile. Deep Sea Research II 56,1004e1020.
Sutclifee, W.H., Baylor, E.R., Menzel, D.W., 1963. Sea surface chemistry and Langmuircirculation. Deep Sea Research 10, 23e243.
Sverdrup, H.U., Johnson, M.W., Fleming, R.H., 1942. The Oceans, Their Physics,Chemistry and General Biology. Prentice Hall, Englewood Cliffs, 1087 pp.
Taylor, C.D., Howes, B.L., Doherty, K.W., 1993. Automated instrumentation for time-series measurement of primary production and nutrient status in productionplatform-accessible environments. MTS Journal 27, 32e44.
Valsala, V.K., Ikeda, M., 2007. Pathways and effect of the Indonesian throughflowwater in the Indian Ocean using particle trajectory and tracers in an OGCM.Journal of Climate 20, 2994e3017.
You, Y., Tomczak, M., 1993. Thermocline circulation and ventilation in the IndianOcean derived from water mass analysis. Deep Sea Research I 40, 13e56.