numerical weather prediction for the arctic & the antarctic · arctic ice pack, arctic land,...
TRANSCRIPT

David Bromwich Polar Meteorology Group, Byrd Polar Research Center,
The Ohio State University
ECMWF-WWRP/THORPEX Workshop on Polar Prediction 24-27 June 2013
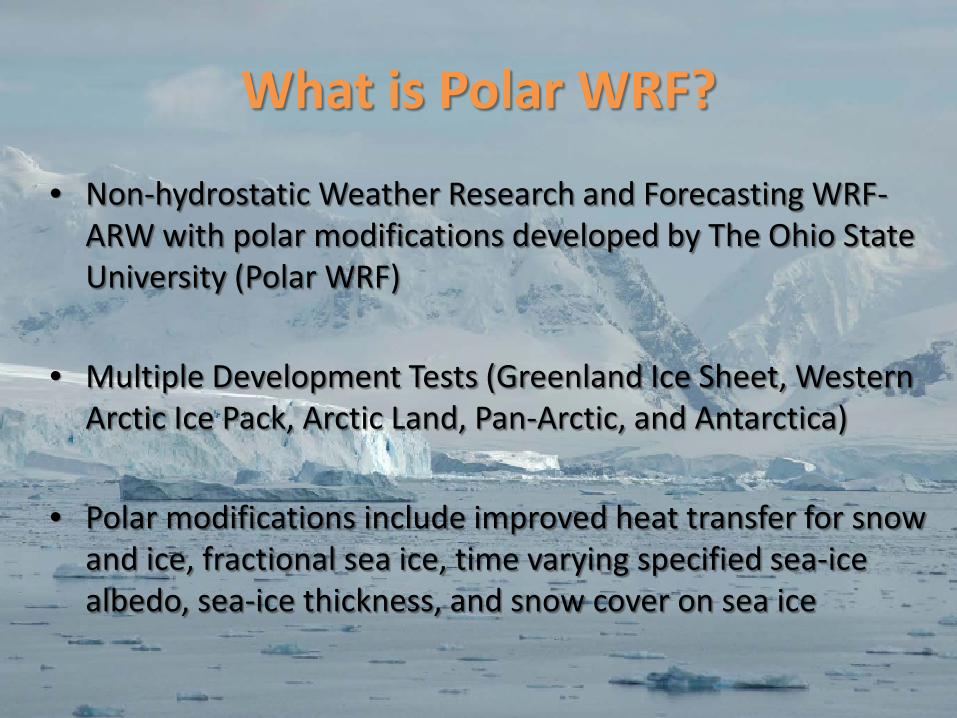
What is Polar WRF?
• Non-hydrostatic Weather Research and Forecasting WRF-ARW with polar modifications developed by The Ohio State University (Polar WRF)
• Multiple Development Tests (Greenland Ice Sheet, Western
Arctic Ice Pack, Arctic Land, Pan-Arctic, and Antarctica) • Polar modifications include improved heat transfer for snow
and ice, fractional sea ice, time varying specified sea-ice albedo, sea-ice thickness, and snow cover on sea ice
The Antarctic Mesoscale Prediction System (AMPS)
• Real-time, experimental NWP system for Antarctica, running since October 2000
• Stems from the need of high-resolution, polar-optimized model forecasts in Antarctica
• Primary purpose: provide NWP support for forecasters of the United States Antarctic Program (USAP)
• Funded by the National Science Foundation • Collaboration between NCAR and the Byrd Polar Research
Center of The Ohio State University • Real-time forecast products available on the AMPS web site • Recent overview of the AMPS project:
– Powers et al., 2012: A decade of Antarctic science support through AMPS. Bull. Amer. Meteor. Soc., 93, 1699-1712
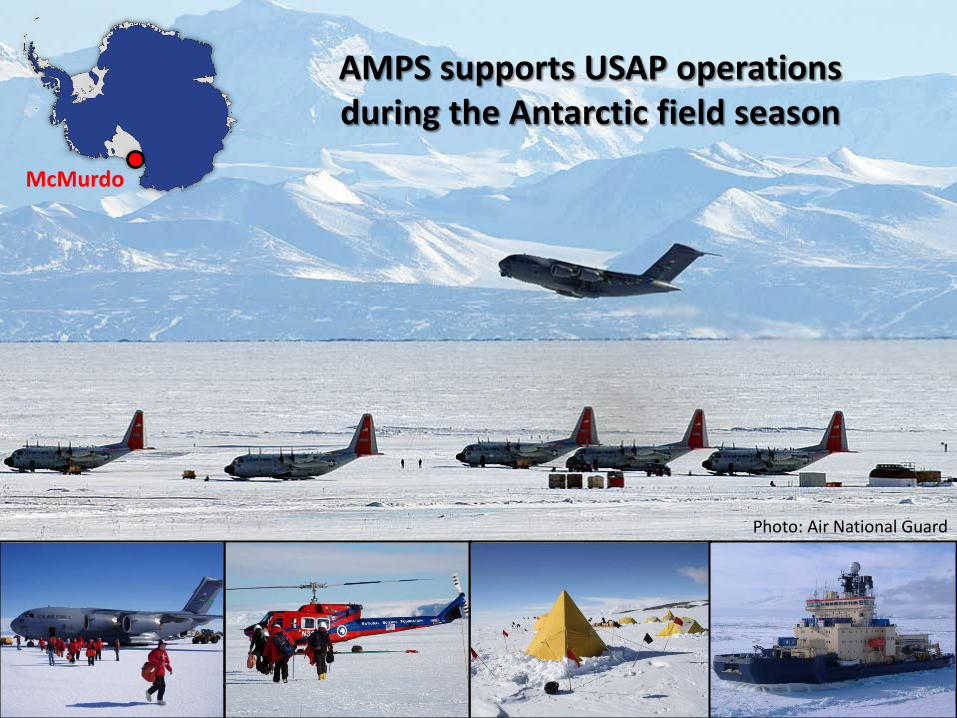
AMPS supports USAP operations during the Antarctic field season
McMurdo
Photo: Air National Guard

• Forecasting model: – Non-hydrostatic WRF-ARW with polar modifications (Polar WRF) – Forecast skill of Polar WRF in the Antarctic - Bromwich et al. (2013).
Issues with the forecast clouds and the stable boundary layer were the primary deficiencies.
• Model configuration: – 5 grids with two-way nested-domain setup – Horizontal grid-spacing from 30km for the outer domain to 1.1 km
around McMurdo Station – 60 eta vertical levels (top at 10 hPa)
• First-guess field and lateral boundary conditions from NCEP Global Forecast System
• Sea-ice concentrations specified from daily SSM/I data • 3D-Var data assimilation (WRFDA):
– Conventional observations: surface, upper-air, aircraft – Satellite: AMSU, COSMIC, atmospheric motion vectors
• Twice-daily forecasts out to 5 days initialized at 00 & 12 UTC

Grid 1 (30km)
Grid 2 (10km)
Grid 6 (3.3km)
Grid 3 (3.3km)
Grid 5 (1.1km)
AMPS domains
McMurdo
Configuration as of June 2013


Benefits of high resolution Example in the McMurdo region
AMPS (1.1km) GFS (0.5°)
12h forecast of 10m wind field for 12UTC 17 June 2013
Ross Island
m/s Byrd Gl.
Mulock Gl.
David Gl.
Reeves Gl.

• Common occurrence during summer forecasting season, and throughout the year
• Brings low cloud and precipitation affecting aviation operations
• Shallow, transient, mesoscale feature
• Successfully forecast by AMPS, not the global forecast models
AMPS surface wind field for 06UTC 22 Jan 2013
Mesolow near Amery Ice Shelf
AMPS sfc wind
Benefits of high resolution Example with the Prydz Bay Mesolow

AMPS cloud field for 06UTC 22 Jan 2013 showing low cloud associated with mesolow
AMPS 1km relative humidity for 06UTC 22 Jan 2013 showing low-level moisture wrapping around mesolow
MODIS satellite image for 0415UTC 22 Jan 2013 showing low cloud consistent with AMPS 1km RH but not with AMPS cloud forecasts
MODIS
AMPS clouds
AMPS RH
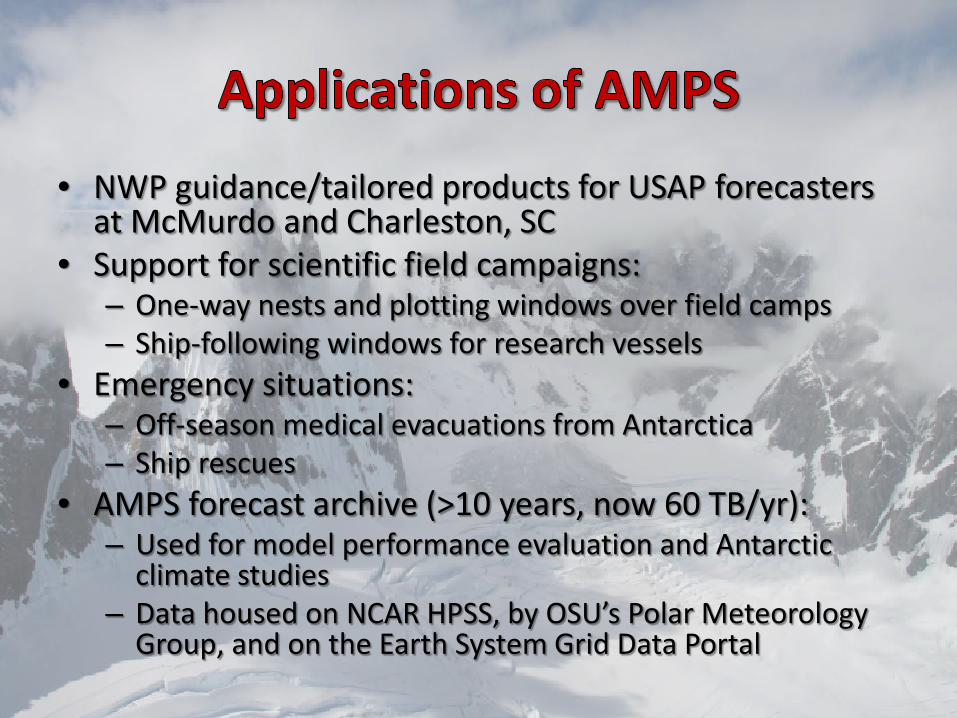
• NWP guidance/tailored products for USAP forecasters at McMurdo and Charleston, SC
• Support for scientific field campaigns: – One-way nests and plotting windows over field camps – Ship-following windows for research vessels
• Emergency situations: – Off-season medical evacuations from Antarctica – Ship rescues
• AMPS forecast archive (>10 years, now 60 TB/yr): – Used for model performance evaluation and Antarctic
climate studies – Data housed on NCAR HPSS, by OSU’s Polar Meteorology
Group, and on the Earth System Grid Data Portal

International use of AMPS • AMPS users extend beyond
USAP groups to Antarctic programs from other nations
• AMPS products tailored for international users: – Regional windows (e.g., Queen
Maud Land, Davis-Mawson, Casey-DDU)
– Station-specific data (e.g., soundings, meteograms)
• The annual Antarctic Meteorological Observation, Modeling, and Forecasting (AMOMF) Workshop serves as a forum for the U.S. and international community – June 2013: Madison, WI – June 2014: Charleston, SC – June 2015: Cambridge, UK

Under development: AMPS ensemble forecasting
• Approximately 10 members of the AMPS 30 and 10-km grids out to 5 days
• Same model physics – varying initial and boundary conditions – May later test different combinations of WRF physics
packages • Help quantify forecast uncertainty
– How to best present this information to forecasters?
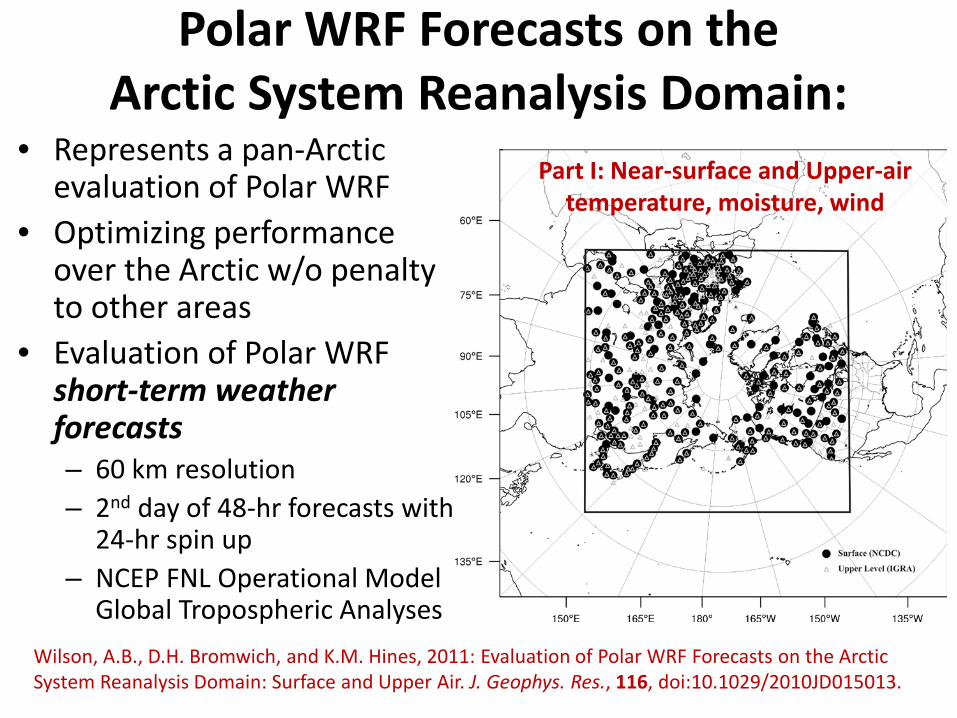
Polar WRF Forecasts on the Arctic System Reanalysis Domain:
• Represents a pan-Arctic evaluation of Polar WRF
• Optimizing performance over the Arctic w/o penalty to other areas
• Evaluation of Polar WRF short-term weather forecasts – 60 km resolution – 2nd day of 48-hr forecasts with
24-hr spin up – NCEP FNL Operational Model
Global Tropospheric Analyses
Part I: Near-surface and Upper-air temperature, moisture, wind
Wilson, A.B., D.H. Bromwich, and K.M. Hines, 2011: Evaluation of Polar WRF Forecasts on the Arctic System Reanalysis Domain: Surface and Upper Air. J. Geophys. Res., 116, doi:10.1029/2010JD015013.
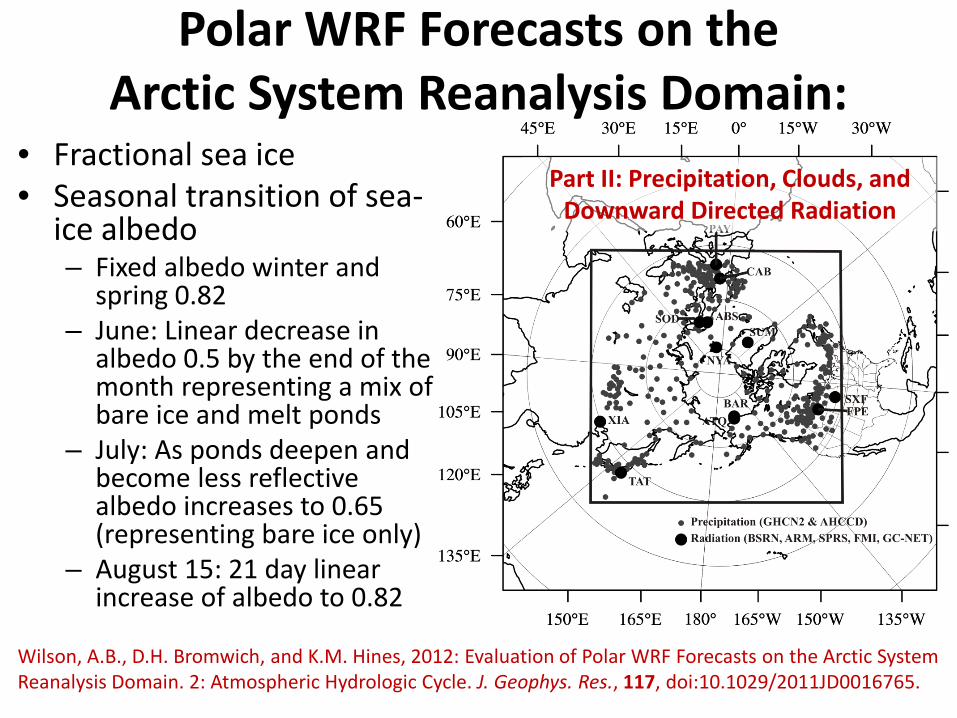
Part II: Precipitation, Clouds, and Downward Directed Radiation
Polar WRF Forecasts on the Arctic System Reanalysis Domain:
• Fractional sea ice • Seasonal transition of sea-
ice albedo – Fixed albedo winter and
spring 0.82 – June: Linear decrease in
albedo 0.5 by the end of the month representing a mix of bare ice and melt ponds
– July: As ponds deepen and become less reflective albedo increases to 0.65 (representing bare ice only)
– August 15: 21 day linear increase of albedo to 0.82
Wilson, A.B., D.H. Bromwich, and K.M. Hines, 2012: Evaluation of Polar WRF Forecasts on the Arctic System Reanalysis Domain. 2: Atmospheric Hydrologic Cycle. J. Geophys. Res., 117, doi:10.1029/2011JD0016765.
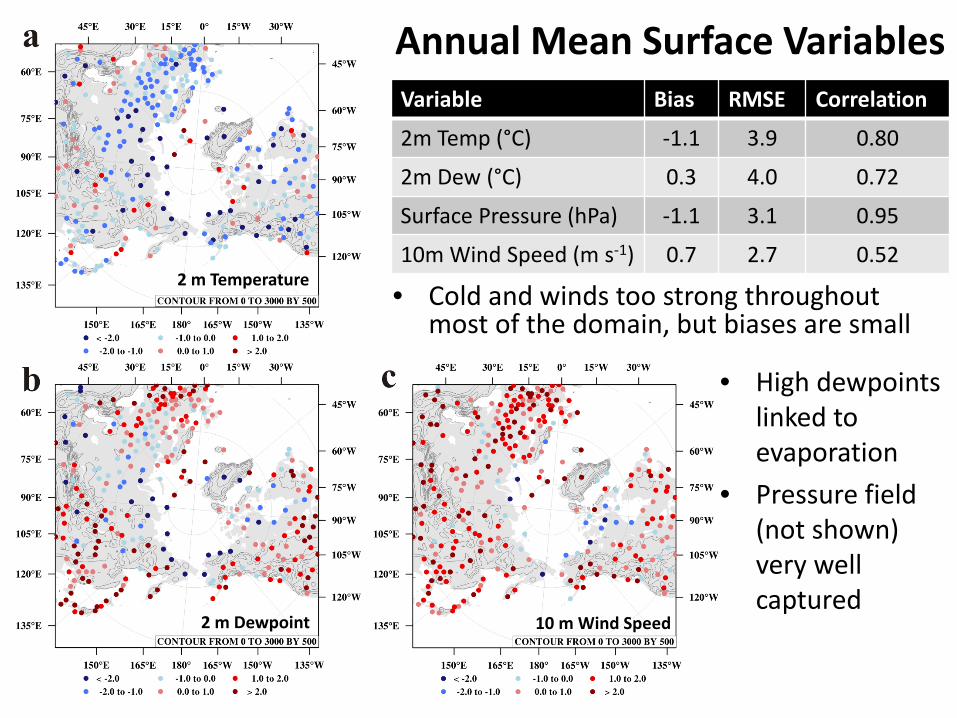
Annual Mean Surface Variables Variable Bias RMSE Correlation
2m Temp (°C) -1.1 3.9 0.80
2m Dew (°C) 0.3 4.0 0.72
Surface Pressure (hPa) -1.1 3.1 0.95
10m Wind Speed (m s-1) 0.7 2.7 0.52
• Cold and winds too strong throughout most of the domain, but biases are small
• High dewpoints linked to evaporation
• Pressure field (not shown) very well captured
2 m Dewpoint
2 m Temperature
10 m Wind Speed

Upper Level Winds in the Arctic
• PWRF mean profile compares well with IGRA • Differences are small and insignificant though all the profiles reflect strong
spread among individual stations
January 2007 July 2007

Annual Precipitation: Spatial Comparison
• Spatially consistent with ERA-Interim and GPCP – Highest Precipitation totals located throughout the mid-
latitudes and sub-polar storm track regions – Dry throughout the Canadian Archipelago
• Slightly higher totals in Pacific NW N. America – Both PWRF and ERA-Interim are higher than GPCP here
Polar WRF ERA-Interim GPCP
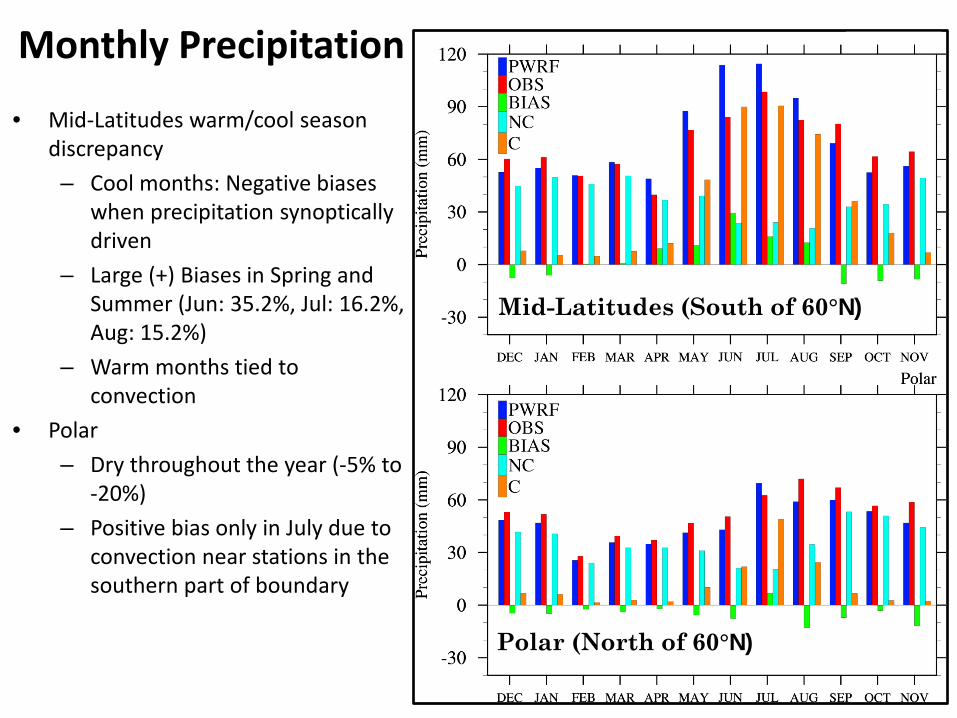
Monthly Precipitation
• Mid-Latitudes warm/cool season discrepancy – Cool months: Negative biases
when precipitation synoptically driven
– Large (+) Biases in Spring and Summer (Jun: 35.2%, Jul: 16.2%, Aug: 15.2%)
– Warm months tied to convection
• Polar – Dry throughout the year (-5% to
-20%) – Positive bias only in July due to
convection near stations in the southern part of boundary
Mid-Latitudes (South of 60°N)
Polar (North of 60°N)
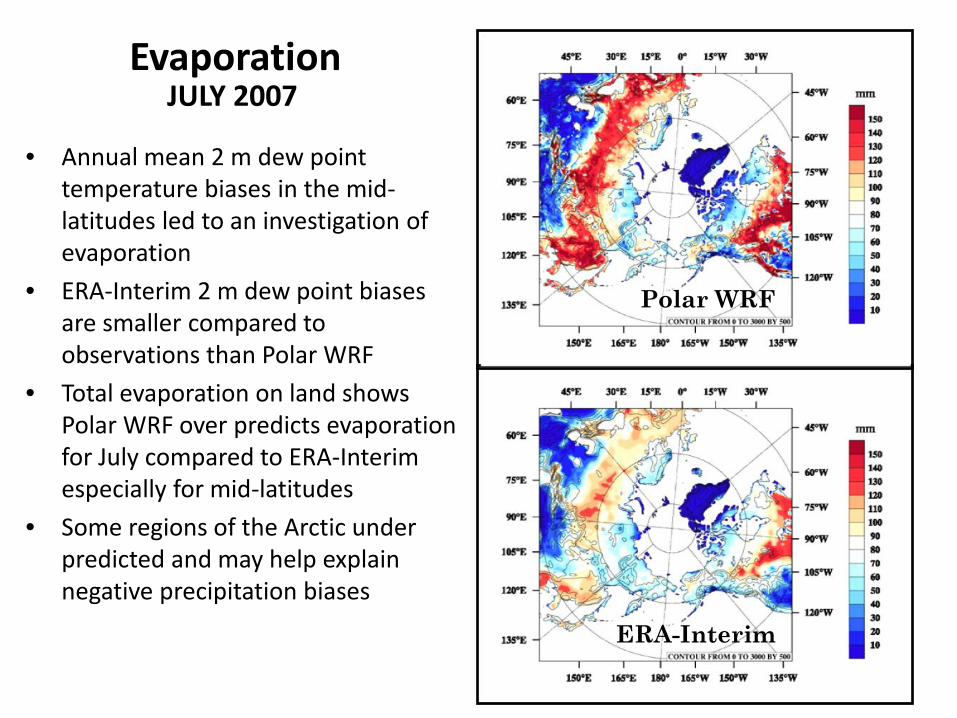
Evaporation
• Annual mean 2 m dew point temperature biases in the mid-latitudes led to an investigation of evaporation
• ERA-Interim 2 m dew point biases are smaller compared to observations than Polar WRF
• Total evaporation on land shows Polar WRF over predicts evaporation for July compared to ERA-Interim especially for mid-latitudes
• Some regions of the Arctic under predicted and may help explain negative precipitation biases
Polar WRF
ERA-Interim
JULY 2007

Convective Precipitation
• 3 Sensitivity Simulations (WRF6C, Morrison, Kain-Fritsch) – Little change in the overall total
and convective precipitation (WRF6C, Morrison, Kain-Fritsch)
• Grid-nudging of specific humidity towards a drier state in the lower atmosphere – yields negative precipitation bias
(25% decrease) and ~1/2 convection
• Other areas to investigate include soil moisture and interaction with PBL scheme
Sensitivity simulations for July 2007

Cloud Water/ Cloud Ice
• WRF 6-Class Microphysics Scheme • Scatter plots of Model LW vs. Observed
Longwave for various model cloud species – (a) Cloud water and/or cloud ice available – (b) No Cloud water or ice – (c) Cloud water regardless of cloud ice – (d) Cloud ice only
• Mid-latitudes – LW correlations are strong for all 4 cases – When cloud water or ice is available, model
biases are negative – “Model Clear Sky”: Correlations increase and
model agrees better with observations – Again, when cloud water is present (c) the model
performs worse (Cloud ice has a zero effect on switch in RRTM scheme)
• Polar Region – Model LW suffers greatly compared to
observations – Apparent insensitivity between cloud
water/cloud ice conditions and “clear sky”
JULY 2007

Operational Polar WRF http://polarmet.osu.edu/nwp/?model=arctic_wrf
Twice Daily 96-hr Forecasts @ 45 km


Extra Slides

2007 Annual Mean Temperature Comparison
with ERA-I • Polar WRF provides a higher degree
of detail across the domain, especially in regions of higher elevation.
• Coldest annual simulated mean surface air temperatures are found just north of the highest elevations over the Greenland ice sheet, with annual mean temperatures ranging from −25°C to −35°C.
• Spatially, agrees well with previous mesoscale modeling studies of Greenland using Polar MM5 [Cassano et al., 2001] as well as ERA-Interim.
• The warmest temperatures in the domain are found in the Persian Gulf region and deserts of Eurasia,with annual mean temperatures exceeding 15°C.
Polar WRF
ERA-Interim
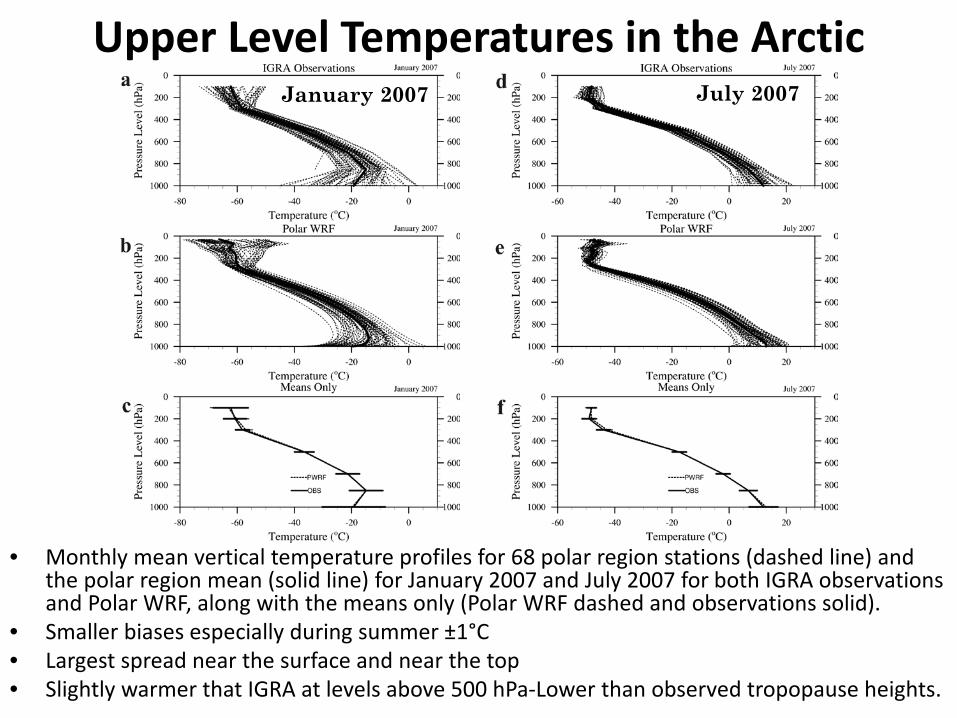
Upper Level Temperatures in the Arctic
• Monthly mean vertical temperature profiles for 68 polar region stations (dashed line) and the polar region mean (solid line) for January 2007 and July 2007 for both IGRA observations and Polar WRF, along with the means only (Polar WRF dashed and observations solid).
• Smaller biases especially during summer ±1°C • Largest spread near the surface and near the top • Slightly warmer that IGRA at levels above 500 hPa-Lower than observed tropopause heights.
January 2007 July 2007

Station Observations
• Mid-Latitudes (305): +37.3 mm (+4.6%) – 62% within ±50% (35% within 25%) – NA, Europe, Asian regions: similar results
• Polar (78): -58.8 mm (-9.4%) – 69% within ±50% (44% within 25%)
• Few stations within 5% • NOT spatially homogenous • Canadian Archipelago
– Dry throughout the entire year – Winds are inconsistent with equatorward
transport of water vapor in this region.

Arctic River Basins
• Important for the fresh water supply to the Arctic Ocean
• Headwaters begin as far south as 45ºN representing a strong link between mid-latitude atmospheric processes and effects in the Arctic.
• Arctic climate system and global ocean circulation
Ob Yenisei
Lena Mackenzie
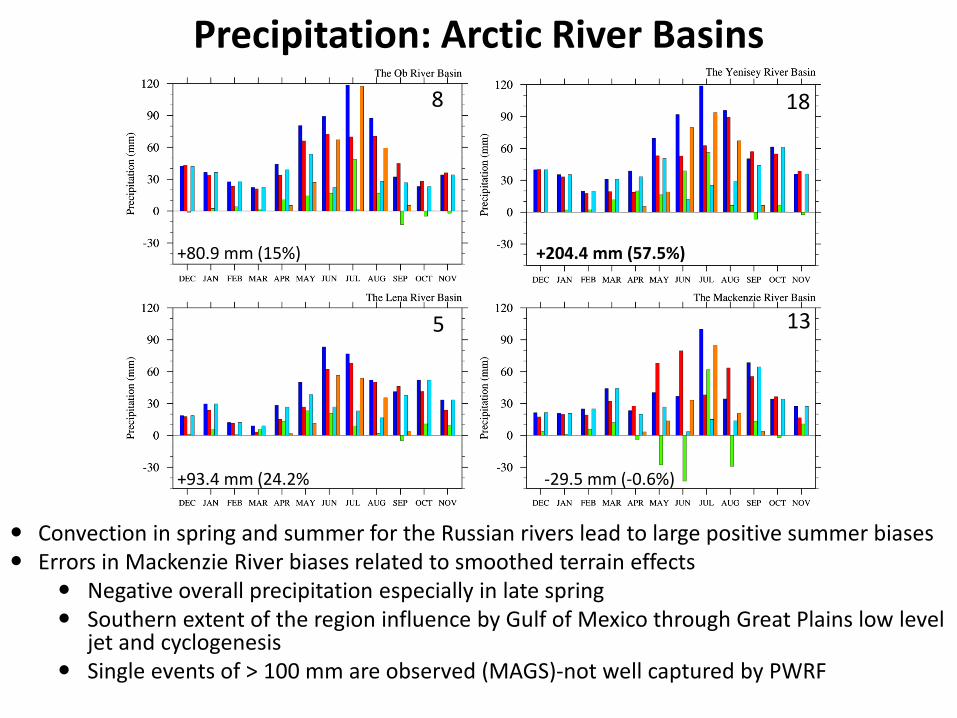
Precipitation: Arctic River Basins
Convection in spring and summer for the Russian rivers lead to large positive summer biases Errors in Mackenzie River biases related to smoothed terrain effects
Negative overall precipitation especially in late spring Southern extent of the region influence by Gulf of Mexico through Great Plains low level
jet and cyclogenesis Single events of > 100 mm are observed (MAGS)-not well captured by PWRF
8 18
5 13
+80.9 mm (15%) +204.4 mm (57.5%)
+93.4 mm (24.2% -29.5 mm (-0.6%)

Clouds • Summer 2007 had 2nd Lowest
Sea-ice Extent and Large Beaufort Sea High with Anomalously Few Clouds in the Western Arctic
• (a) Estimated Cloud Fraction
(CF) based on integrated cloud liquid water and cloud ice
• (b) Cloud frequency defined by
the ratio of the 3-hr forecasts where CF > 0
• Storm tracks well depicted • North Slope CF reasonably well
captured with MODIS and CloudSat/Calipso
– No increase in cloudiness adjacent to the coast as in MODIS
• Conservative method yields
results that approach observed MODIS CloudSAT/Calipso
PWRF (a) PWRF (b) JULY 2007