numerical study on the seismic interaction between 2d ... · numerical study on the seismic...
TRANSCRIPT
Numerical study on the seismic interaction between 2D seismic resisting frames and claddings
Riccardo Diaferia 1; Andrew Baird 2; Stefano Pampanin 3; Alessandro Palermo 4
Summary
Damage to non-structural components during recent earthquake events, such as the Darfield earthquake in
New Zealand (2010) have confirmed the need to better address the interaction between a structure and its
non-structural components.
This paper aims to numerically investigate the seismic behaviour of a typical newly designed reinforced
concrete multi-storey frame building with and without the interaction due to cladding panels. This interaction
is investigated by means of non-linear static and dynamic analyses for common typologies of cladding
systems. A seismic risk assessment analysis is also presented in order to develop fragility functions based
on damage limit states for cladding connection. These are used for assessing the probability of damage of
cladding systems after earthquake events of varying intensity.
Results confirm the high influence of cladding systems upon the seismic performance of multi-storey
buildings. Also revealed is the significant variation in possible levels of cladding damage throughout a
building. Further investigations are going to be developed, refining the use of fragility functions associated to
innovative low damage cladding solutions.
Keywords
numerical modelling, non-structural elements, facades, cladding, seismic design, fragility curves
Theme
buildings – analysis – earthquake – concrete
1. Introduction
Reconnaissance following past earthquakes has shown that damage of non-structural elements during
seismic events can cause significant economic losses and disruption to important or critical facilities.
Furthermore, failures can result in potential hazards to pedestrians around the building. Recent earthquakes
have further highlighted this concept, necessitating a detailed study in order to propose and develop
innovative solutions able to reduce the risk of damage to non-structural elements. This work is part of an
ongoing research effort with the aim of better understanding the interaction between facade systems and the
structure.
1 Master Student, Department of Building Environment and Science Technology, Politecnico di Milano, Milan, Italy,
2 PhD Student, Department of Civil and Natural Resources Engineering, University of Canterbury, Christchurch, New
Zealand, [email protected]
3 Associate Professor (Reader), Department of Civil and Natural Resources Engineering, University of Canterbury,
Christchurch, New Zealand, [email protected]
4 Senior Lecturer, Department of Civil and Natural Resources Engineering, University of Canterbury, Christchurch, New
Zealand, [email protected]
Numerical models of cladding systems have been defined using previous experimental investigations and
preliminary data from on-going experimental tests. A parametric analysis of a one-storey single bay frame
clad with a precast concrete panel, fully presented in a companion paper (Baird et al. [1]), has been used as
the foundation for this study on the seismic behaviour of multi-storey buildings with different cladding
distributions. The interaction with the facade has been investigated by use of non-linear analyses utilizing
both pushover and time-history analyses of typical cladding-structure systems.
In the first part of this paper, a parametric analysis has been performed, considering different distributions of
precast concrete panels and structure heights. In the second part of the paper, a probabilistic risk assessment
evaluation due to seismic hazard is presented for some of the claddings which compose the facade. This allows
the development of fragility functions based on damage limit states previously indentified in order to assess
the probability of achieving defined damage levels of the cladding system.
2. Background
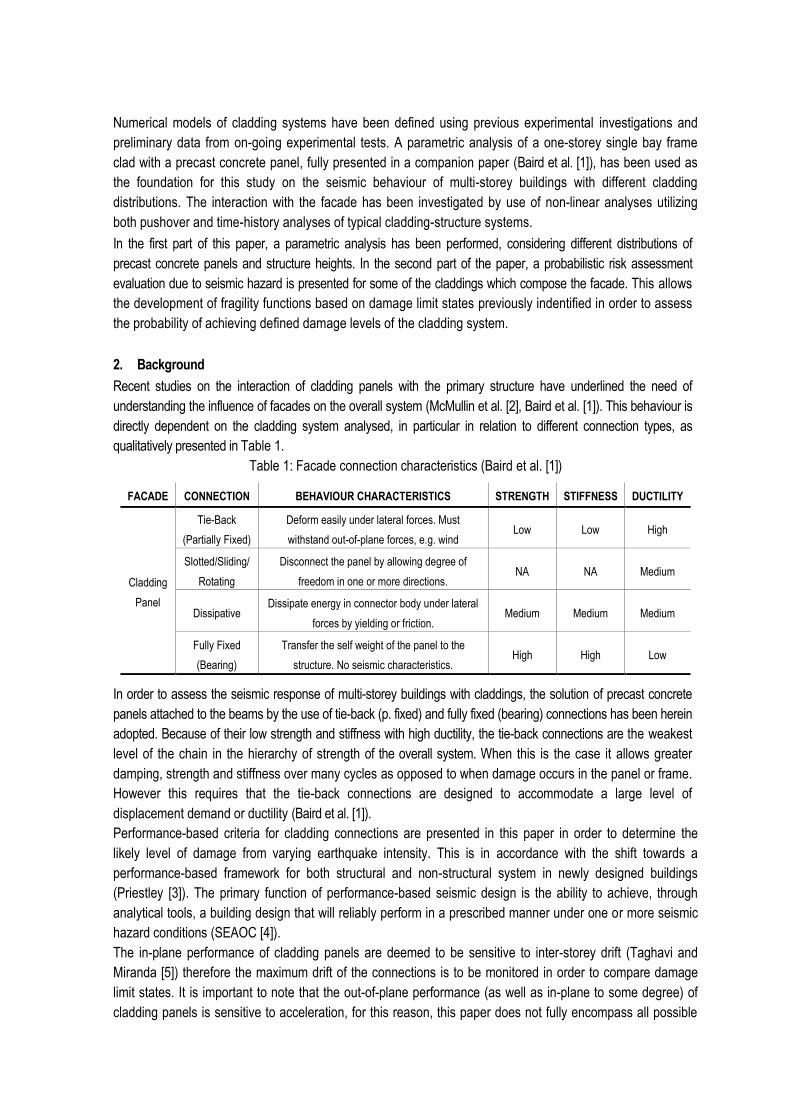
Recent studies on the interaction of cladding panels with the primary structure have underlined the need of
understanding the influence of facades on the overall system (McMullin et al. [2], Baird et al. [1]). This behaviour is
directly dependent on the cladding system analysed, in particular in relation to different connection types, as
qualitatively presented in Table 1.
Table 1: Facade connection characteristics (Baird et al. [1])
FACADE CONNECTION BEHAVIOUR CHARACTERISTICS STRENGTH STIFFNESS DUCTILITY
Cladding
Panel
Tie-Back
(Partially Fixed)
Deform easily under lateral forces. Must
withstand out-of-plane forces, e.g. wind Low Low High
Slotted/Sliding/
Rotating
Disconnect the panel by allowing degree of
freedom in one or more directions. NA NA Medium
Dissipative Dissipate energy in connector body under lateral
forces by yielding or friction. Medium Medium Medium
Fully Fixed
(Bearing)
Transfer the self weight of the panel to the
structure. No seismic characteristics. High High Low
In order to assess the seismic response of multi-storey buildings with claddings, the solution of precast concrete
panels attached to the beams by the use of tie-back (p. fixed) and fully fixed (bearing) connections has been herein
adopted. Because of their low strength and stiffness with high ductility, the tie-back connections are the weakest
level of the chain in the hierarchy of strength of the overall system. When this is the case it allows greater
damping, strength and stiffness over many cycles as opposed to when damage occurs in the panel or frame.
However this requires that the tie-back connections are designed to accommodate a large level of
displacement demand or ductility (Baird et al. [1]).
Performance-based criteria for cladding connections are presented in this paper in order to determine the
likely level of damage from varying earthquake intensity. This is in accordance with the shift towards a
performance-based framework for both structural and non-structural system in newly designed buildings
(Priestley [3]). The primary function of performance-based seismic design is the ability to achieve, through
analytical tools, a building design that will reliably perform in a prescribed manner under one or more seismic
hazard conditions (SEAOC [4]).
The in-plane performance of cladding panels are deemed to be sensitive to inter-storey drift (Taghavi and
Miranda [5]) therefore the maximum drift of the connections is to be monitored in order to compare damage
limit states. It is important to note that the out-of-plane performance (as well as in-plane to some degree) of
cladding panels is sensitive to acceleration, for this reason, this paper does not fully encompass all possible
cladding panel damage and failure mechanisms. The probability of damage of the connections has been
evaluated following the performance based earthquake engineering (PBEE) methodology used by Cornell et
al. [6].
The use of the Incremental Dynamic Analysis (IDA) procedure proposed by Vamvatsikos and Cornell [7] is
able to define the probability of different damage limit states being reached. This is done by subjecting a
structure to a suite of earthquake accelerograms with the intensity level varied from a low to high level. This
study builds on a defined procedure for such an analysis which is being extended and validated for non-
structural elements (Stojadinovic and Hunt [8]).
3. Case study: multi-storey frame systems
The case study proposed is based on the Red Book building (New Zealand Concrete Society [9]) which acts as a
design example of the New Zealand Concrete Code (NZS 3101 [10]). The building was originally designed for the
city of Christchurch, but for this study the building has been assumed to be located in the higher seismicity site of
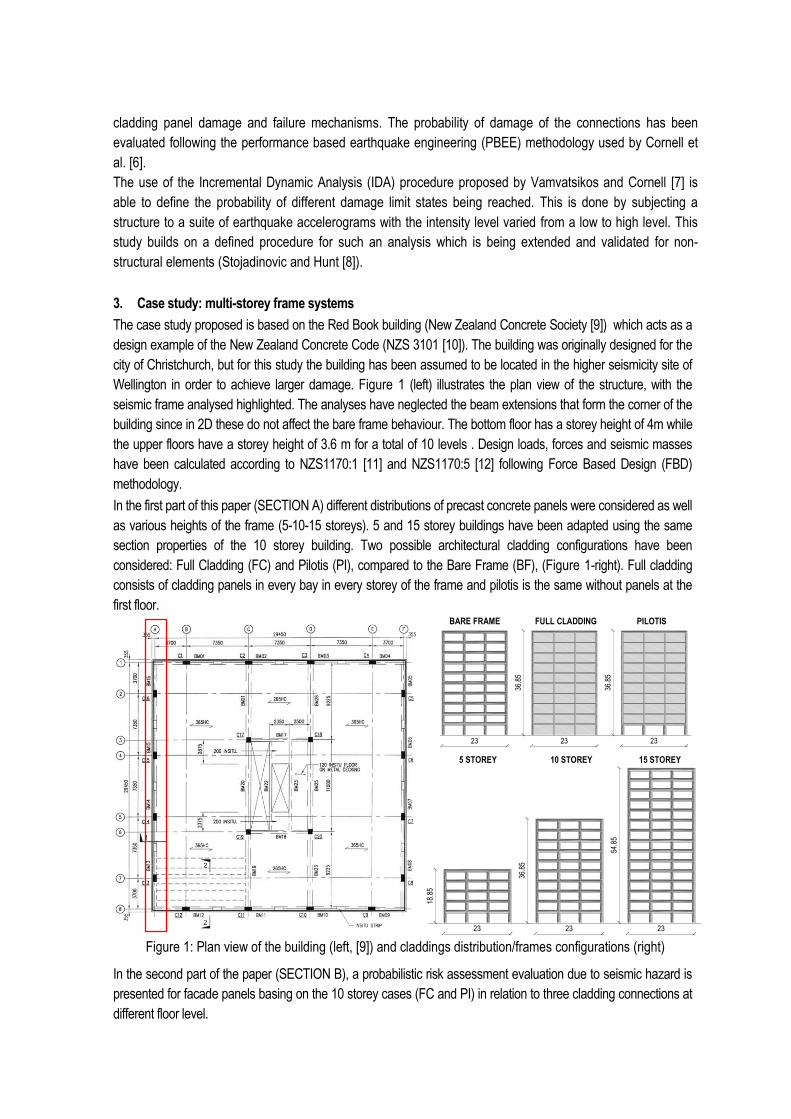
Wellington in order to achieve larger damage. Figure 1 (left) illustrates the plan view of the structure, with the
seismic frame analysed highlighted. The analyses have neglected the beam extensions that form the corner of the
building since in 2D these do not affect the bare frame behaviour. The bottom floor has a storey height of 4m while
the upper floors have a storey height of 3.6 m for a total of 10 levels . Design loads, forces and seismic masses
have been calculated according to NZS1170:1 [11] and NZS1170:5 [12] following Force Based Design (FBD)
methodology.
In the first part of this paper (SECTION A) different distributions of precast concrete panels were considered as well
as various heights of the frame (5-10-15 storeys). 5 and 15 storey buildings have been adapted using the same
section properties of the 10 storey building. Two possible architectural cladding configurations have been
considered: Full Cladding (FC) and Pilotis (PI), compared to the Bare Frame (BF), (Figure 1-right). Full cladding
consists of cladding panels in every bay in every storey of the frame and pilotis is the same without panels at the
first floor.
BARE FRAME FULL CLADDING PILOTIS
5 STOREY 10 STOREY 15 STOREY
Figure 1: Plan view of the building (left, [9]) and claddings distribution/frames configurations (right)
In the second part of the paper (SECTION B), a probabilistic risk assessment evaluation due to seismic hazard is
presented for facade panels basing on the 10 storey cases (FC and PI) in relation to three cladding connections at
different floor level.
54.8
5
232323
36.8
5
23 23
36.8
5
23
36.8
554
.85
232323
36.8
5
23 23
36.8
5
23
36.8
5
18.8
5
3.1 Cladding characteristics
The cladding system is represented by precast concrete panels of 0.2 m thickness attached to the primary
structure on the beam with tie-back connections at the top and with bearing connections at the bottom. The
panels have been treated as not having any window openings for simplicity. However it can safely be
assumed that correctly detailed panels with openings would behave nearly identically to the panels modelled
since both provide large in-plane stiffness. The system has been designed considering a suggested drift of
0.3% (Baird et al. [1]). For this study, damage limit states are related to the behaviour of the tie-back
connections based on various experimental behaviour (McMullin et al. [2], Stojadinovic and Hunt. [8]) and first
outcomes from the experimental test which is currently taking place in the laboratory of Civil Engineering of
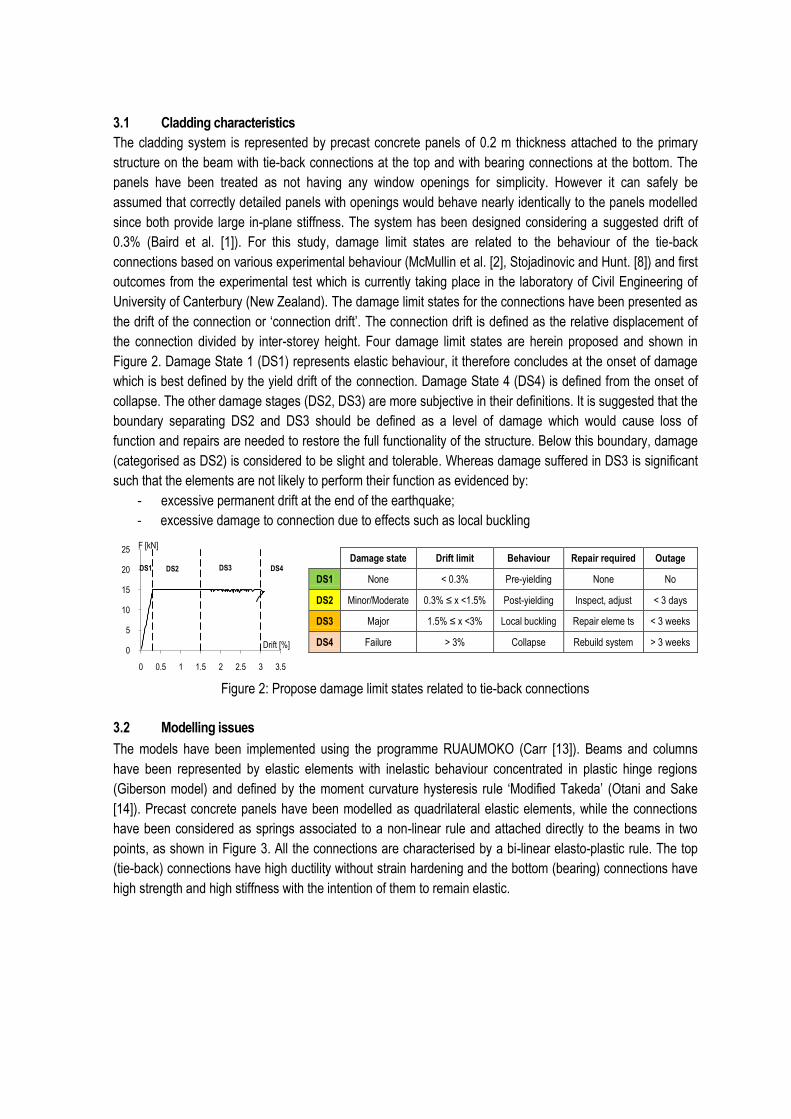
University of Canterbury (New Zealand). The damage limit states for the connections have been presented as
the drift of the connection or „connection drift‟. The connection drift is defined as the relative displacement of
the connection divided by inter-storey height. Four damage limit states are herein proposed and shown in
Figure 2. Damage State 1 (DS1) represents elastic behaviour, it therefore concludes at the onset of damage
which is best defined by the yield drift of the connection. Damage State 4 (DS4) is defined from the onset of
collapse. The other damage stages (DS2, DS3) are more subjective in their definitions. It is suggested that the
boundary separating DS2 and DS3 should be defined as a level of damage which would cause loss of
function and repairs are needed to restore the full functionality of the structure. Below this boundary, damage
(categorised as DS2) is considered to be slight and tolerable. Whereas damage suffered in DS3 is significant
such that the elements are not likely to perform their function as evidenced by:
- excessive permanent drift at the end of the earthquake;
- excessive damage to connection due to effects such as local buckling
Damage state Drift limit Behaviour Repair required Outage
DS1 None < 0.3% Pre-yielding None No
DS2 Minor/Moderate 0.3% ≤ x <1.5% Post-yielding Inspect, adjust < 3 days
DS3 Major 1.5% ≤ x <3% Local buckling Repair eleme ts < 3 weeks
DS4 Failure > 3% Collapse Rebuild system > 3 weeks
Figure 2: Propose damage limit states related to tie-back connections
3.2 Modelling issues
The models have been implemented using the programme RUAUMOKO (Carr [13]). Beams and columns
have been represented by elastic elements with inelastic behaviour concentrated in plastic hinge regions
(Giberson model) and defined by the moment curvature hysteresis rule „Modified Takeda‟ (Otani and Sake
[14]). Precast concrete panels have been modelled as quadrilateral elastic elements, while the connections
have been considered as springs associated to a non-linear rule and attached directly to the beams in two
points, as shown in Figure 3. All the connections are characterised by a bi-linear elasto-plastic rule. The top
(tie-back) connections have high ductility without strain hardening and the bottom (bearing) connections have
high strength and high stiffness with the intention of them to remain elastic.
0
5
10
15
20
25
0 0.5 1 1.5 2 2.5 3 3.5
F [kN]
Drift [%]
DS1 DS2 DS3 DS4
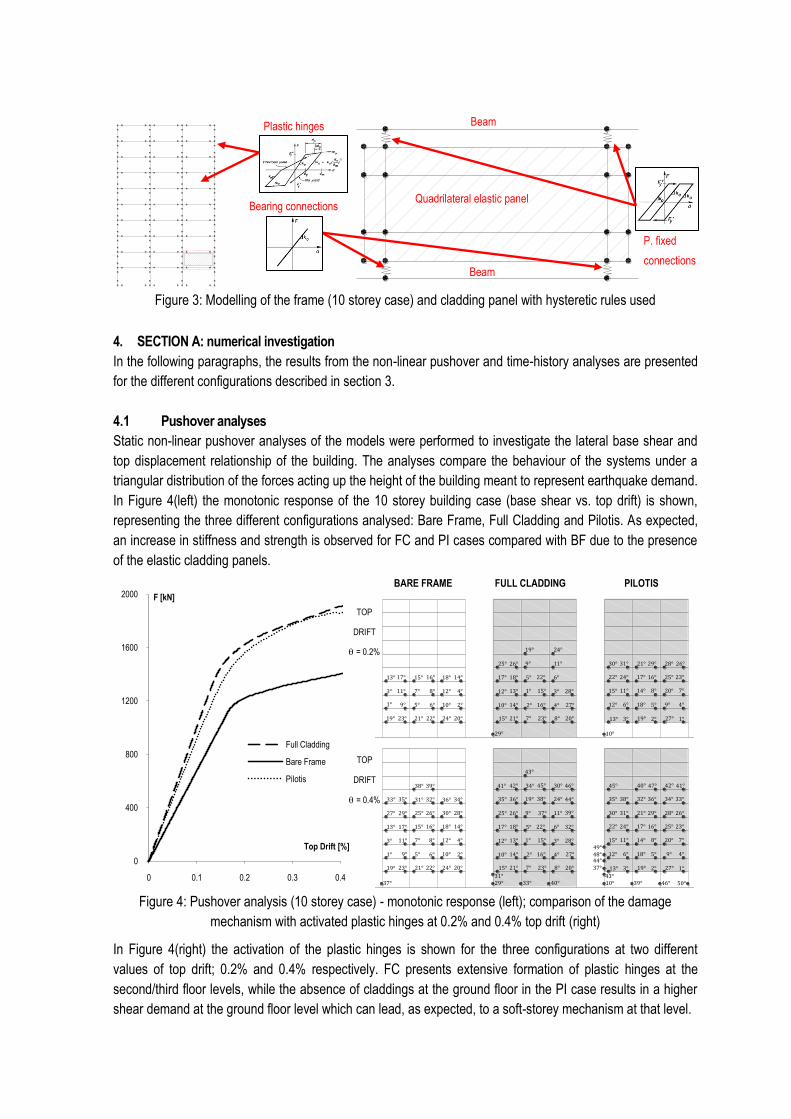
Figure 3: Modelling of the frame (10 storey case) and cladding panel with hysteretic rules used
4. SECTION A: numerical investigation
In the following paragraphs, the results from the non-linear pushover and time-history analyses are presented
for the different configurations described in section 3.
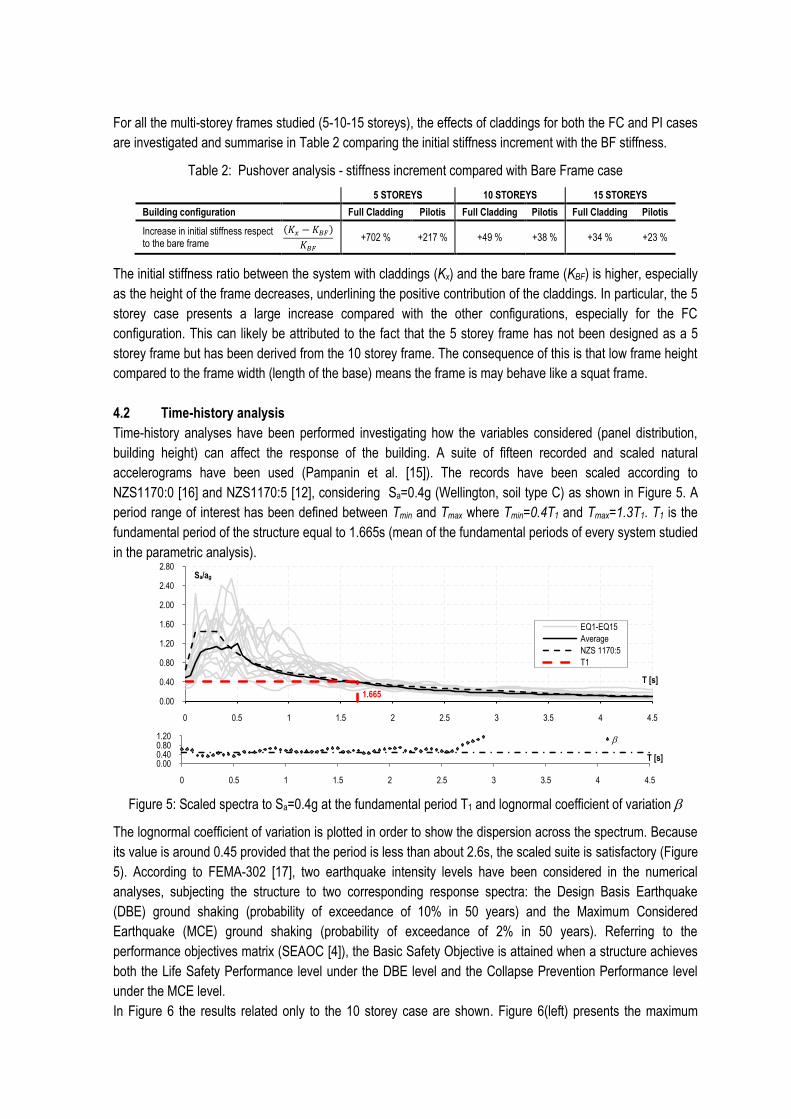
4.1 Pushover analyses
Static non-linear pushover analyses of the models were performed to investigate the lateral base shear and
top displacement relationship of the building. The analyses compare the behaviour of the systems under a
triangular distribution of the forces acting up the height of the building meant to represent earthquake demand.
In Figure 4(left) the monotonic response of the 10 storey building case (base shear vs. top drift) is shown,
representing the three different configurations analysed: Bare Frame, Full Cladding and Pilotis. As expected,
an increase in stiffness and strength is observed for FC and PI cases compared with BF due to the presence
of the elastic cladding panels.
BARE FRAME FULL CLADDING PILOTIS
Figure 4: Pushover analysis (10 storey case) - monotonic response (left); comparison of the damage
mechanism with activated plastic hinges at 0.2% and 0.4% top drift (right)
In Figure 4(right) the activation of the plastic hinges is shown for the three configurations at two different
values of top drift; 0.2% and 0.4% respectively. FC presents extensive formation of plastic hinges at the
second/third floor levels, while the absence of claddings at the ground floor in the PI case results in a higher
shear demand at the ground floor level which can lead, as expected, to a soft-storey mechanism at that level.
0
400
800
1200
1600
2000
0 0.1 0.2 0.3 0.4
F [kN]
Top Drift [%]
Full Cladding
Bare Frame
Pilotis
1° 9° 10° 2°
3° 11°
5° 6°
12° 4°7° 8°
13° 17° 18° 14°15° 16°
19° 23° 24° 20°21° 22°
1° 9° 10° 2°
3° 11°
5° 6°
12° 4°7° 8°
13° 17° 18° 14°15° 16°
19° 23° 24° 20°21° 22°
25° 26°27° 28°29° 30°
31° 32°33° 34°35° 36°
37°
38° 39°
29°
4°2°
3°1°
6°5°
8°7°
9°
10°
11°
12° 13°
15°
14°
15°
16°
17° 18°
19°
20°21°
22°
23°
24°
25° 26°
27°
28°
30°
31°
32°
33°
34°
35° 36°
37°
38°
39°
40°
41° 42°
43°
44°
45°
10°
1°2°3°
4°5°6°
7°8°11°
12°
13°
14°15°
16°17°
18°
19°
20°
21°
23°24°22° 25°
27°
9°
29° 28°31°30°
32°
26°
34°35° 36°
37°
38°
39°
40°
33°
42°
43°
44°
45°
46°
47°
48°49°
50°
29°
4°2°
3°1°
6°5°
8°7°
9°
10°
11°
12° 13°
15°
14°
15°
16°
17° 18°
19°
20°21°
22°
23°
24°
25° 26°
27°
28°
10°
1°2°3°
4°5°6°
7°8°11°
12°
13°
14°15°
16°17°
18°
19°
20°
21°
23°24°22° 25°
27°
26°29° 28°31°30°
9°
41°46°
TOP
DRIFT
= 0.2%
TOP
DRIFT
= 0.4%
Plastic hinges
Bearing connections
P. fixed
connections
Quadrilateral elastic panel
Beam
Beam
For all the multi-storey frames studied (5-10-15 storeys), the effects of claddings for both the FC and PI cases
are investigated and summarise in Table 2 comparing the initial stiffness increment with the BF stiffness.
Table 2: Pushover analysis - stiffness increment compared with Bare Frame case
5 STOREYS 10 STOREYS 15 STOREYS
Building configuration Full Cladding Pilotis Full Cladding Pilotis Full Cladding Pilotis
Increase in initial stiffness respect to the bare frame
+702 % +217 % +49 % +38 % +34 % +23 %
The initial stiffness ratio between the system with claddings (Kx) and the bare frame (KBF) is higher, especially
as the height of the frame decreases, underlining the positive contribution of the claddings. In particular, the 5
storey case presents a large increase compared with the other configurations, especially for the FC
configuration. This can likely be attributed to the fact that the 5 storey frame has not been designed as a 5
storey frame but has been derived from the 10 storey frame. The consequence of this is that low frame height
compared to the frame width (length of the base) means the frame is may behave like a squat frame.
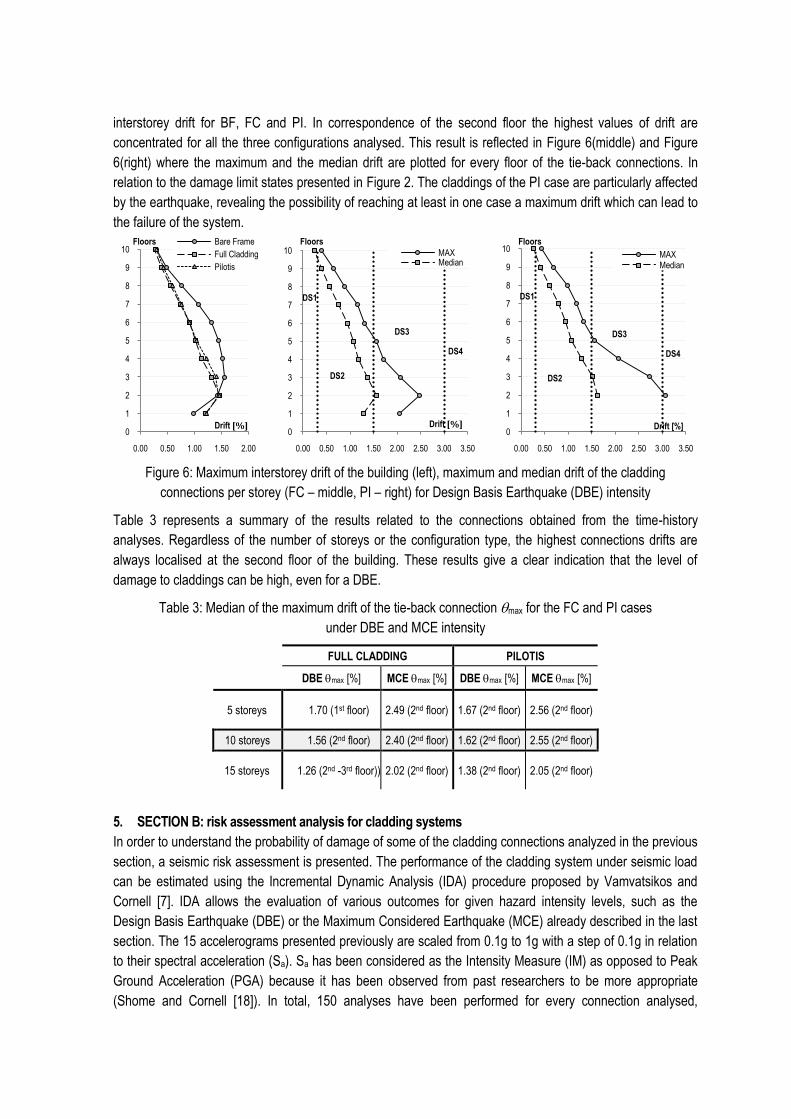
4.2 Time-history analysis
Time-history analyses have been performed investigating how the variables considered (panel distribution,
building height) can affect the response of the building. A suite of fifteen recorded and scaled natural
accelerograms have been used (Pampanin et al. [15]). The records have been scaled according to
NZS1170:0 [16] and NZS1170:5 [12], considering Sa=0.4g (Wellington, soil type C) as shown in Figure 5. A
period range of interest has been defined between Tmin and Tmax where Tmin=0.4T1 and Tmax=1.3T1. T1 is the
fundamental period of the structure equal to 1.665s (mean of the fundamental periods of every system studied
in the parametric analysis).
Figure 5: Scaled spectra to Sa=0.4g at the fundamental period T1 and lognormal coefficient of variation
The lognormal coefficient of variation is plotted in order to show the dispersion across the spectrum. Because
its value is around 0.45 provided that the period is less than about 2.6s, the scaled suite is satisfactory (Figure
5). According to FEMA-302 [17], two earthquake intensity levels have been considered in the numerical
analyses, subjecting the structure to two corresponding response spectra: the Design Basis Earthquake
(DBE) ground shaking (probability of exceedance of 10% in 50 years) and the Maximum Considered
Earthquake (MCE) ground shaking (probability of exceedance of 2% in 50 years). Referring to the
performance objectives matrix (SEAOC [4]), the Basic Safety Objective is attained when a structure achieves
both the Life Safety Performance level under the DBE level and the Collapse Prevention Performance level
under the MCE level.
In Figure 6 the results related only to the 10 storey case are shown. Figure 6(left) presents the maximum
1.6650.00
0.40
0.80
1.20
1.60
2.00
2.40
2.80
0 0.5 1 1.5 2 2.5 3 3.5 4 4.5
EQ1-EQ15
Average
NZS 1170:5
T1
0.000.400.801.20
0 0.5 1 1.5 2 2.5 3 3.5 4 4.5
T [s]
Sa/ag
T [s]
interstorey drift for BF, FC and PI. In correspondence of the second floor the highest values of drift are
concentrated for all the three configurations analysed. This result is reflected in Figure 6(middle) and Figure
6(right) where the maximum and the median drift are plotted for every floor of the tie-back connections. In
relation to the damage limit states presented in Figure 2. The claddings of the PI case are particularly affected
by the earthquake, revealing the possibility of reaching at least in one case a maximum drift which can lead to
the failure of the system.
Figure 6: Maximum interstorey drift of the building (left), maximum and median drift of the cladding
connections per storey (FC – middle, PI – right) for Design Basis Earthquake (DBE) intensity
Table 3 represents a summary of the results related to the connections obtained from the time-history
analyses. Regardless of the number of storeys or the configuration type, the highest connections drifts are
always localised at the second floor of the building. These results give a clear indication that the level of
damage to claddings can be high, even for a DBE.
Table 3: Median of the maximum drift of the tie-back connection max for the FC and PI cases
under DBE and MCE intensity
FULL CLADDING PILOTIS
DBE max [%] MCE max [%] DBE max [%] MCE max [%]
5 storeys 1.70 (1st floor) 2.49 (2nd floor) 1.67 (2nd floor) 2.56 (2nd floor)
10 storeys 1.56 (2nd floor) 2.40 (2nd floor) 1.62 (2nd floor) 2.55 (2nd floor)
15 storeys 1.26 (2nd -3rd floor)) 2.02 (2nd floor) 1.38 (2nd floor) 2.05 (2nd floor)
5. SECTION B: risk assessment analysis for cladding systems
In order to understand the probability of damage of some of the cladding connections analyzed in the previous
section, a seismic risk assessment is presented. The performance of the cladding system under seismic load
can be estimated using the Incremental Dynamic Analysis (IDA) procedure proposed by Vamvatsikos and
Cornell [7]. IDA allows the evaluation of various outcomes for given hazard intensity levels, such as the
Design Basis Earthquake (DBE) or the Maximum Considered Earthquake (MCE) already described in the last
section. The 15 accelerograms presented previously are scaled from 0.1g to 1g with a step of 0.1g in relation
to their spectral acceleration (Sa). Sa has been considered as the Intensity Measure (IM) as opposed to Peak
Ground Acceleration (PGA) because it has been observed from past researchers to be more appropriate
(Shome and Cornell [18]). In total, 150 analyses have been performed for every connection analysed,
0
1
2
3
4
5
6
7
8
9
10
0.00 0.50 1.00 1.50 2.00
Bare Frame
Full Cladding
Pilotis
Drift [%]
Floors
0
1
2
3
4
5
6
7
8
9
10
0.00 0.50 1.00 1.50 2.00 2.50 3.00 3.50
MAXMedian
Drift [%]
Floors
DS1
DS2
DS3
DS4
0
1
2
3
4
5
6
7
8
9
10
0.00 0.50 1.00 1.50 2.00 2.50 3.00 3.50
MAXMedian
Drift [%]
Floors
DS1
DS2
DS3
DS4
considering the maximum relative displacement between the frame and the cladding (cladding connection
drift) as the Engineering Demand Parameter (EDP). The damage limit state of the tie-back connections
defined in Figure 2 has been defined as the Damage Measure (DM). Three connections are herein considered
for the 10 storeys building already presented with two different cladding panels distributions (FC and PI). The
choice of the connections is related to the consideration from the analyses in Section A, as described in
Figure 7.
FULL CLADDING PILOTIS
- A: the most damaged connection found in
Section A
- B: the least damaged connection found in
Section A
- C: a typical connection found in Section A
Figure 7: Cladding connections monitored for the risk assessment analysis
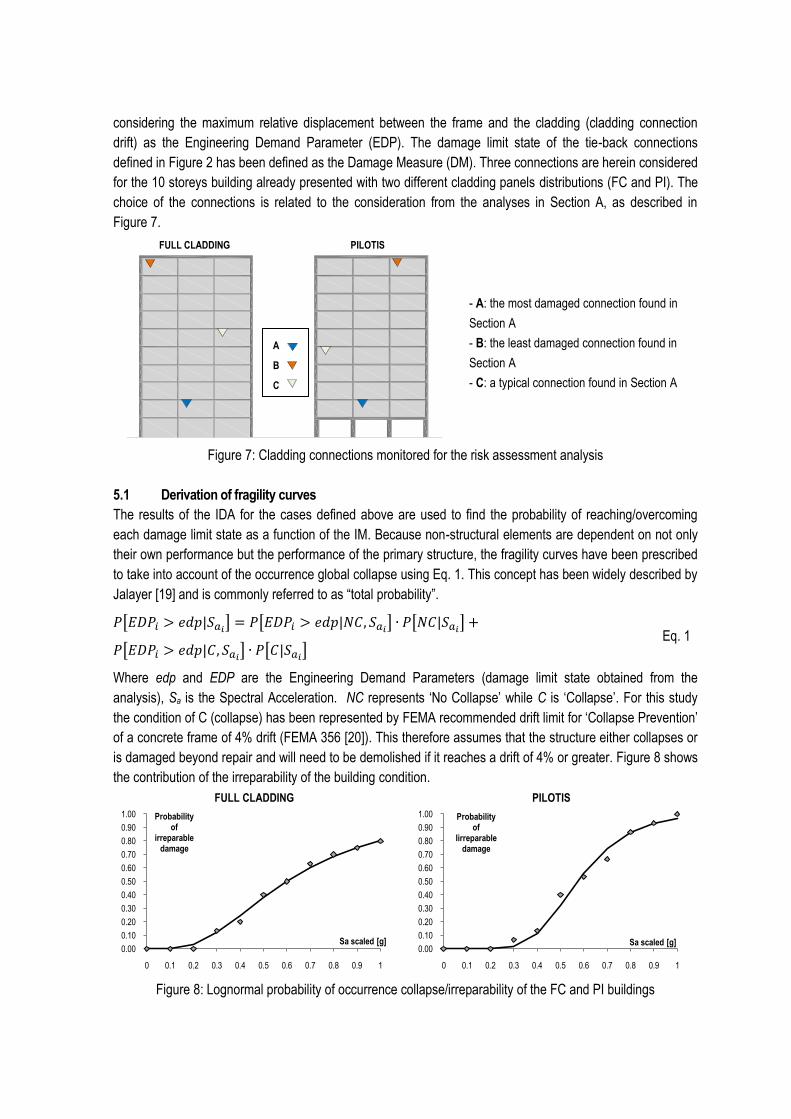
5.1 Derivation of fragility curves
The results of the IDA for the cases defined above are used to find the probability of reaching/overcoming
each damage limit state as a function of the IM. Because non-structural elements are dependent on not only
their own performance but the performance of the primary structure, the fragility curves have been prescribed
to take into account of the occurrence global collapse using Eq. 1. This concept has been widely described by
Jalayer [19] and is commonly referred to as “total probability”.
Eq. 1
Where edp and EDP are the Engineering Demand Parameters (damage limit state obtained from the
analysis), Sa is the Spectral Acceleration. NC represents „No Collapse‟ while C is „Collapse‟. For this study
the condition of C (collapse) has been represented by FEMA recommended drift limit for „Collapse Prevention‟
of a concrete frame of 4% drift (FEMA 356 [20]). This therefore assumes that the structure either collapses or
is damaged beyond repair and will need to be demolished if it reaches a drift of 4% or greater. Figure 8 shows
the contribution of the irreparability of the building condition.
FULL CLADDING PILOTIS
Figure 8: Lognormal probability of occurrence collapse/irreparability of the FC and PI buildings
0.00
0.10
0.20
0.30
0.40
0.50
0.60
0.70
0.80
0.90
1.00
0 0.1 0.2 0.3 0.4 0.5 0.6 0.7 0.8 0.9 1
Probability of
irreparabledamage
Sa scaled [g]0.00
0.10
0.20
0.30
0.40
0.50
0.60
0.70
0.80
0.90
1.00
0 0.1 0.2 0.3 0.4 0.5 0.6 0.7 0.8 0.9 1
Probability of
Iirreparable damage
Sa scaled [g]
A
B
C
This condition becomes particularly significant from 0.4g onwards when the probability overcomes 10-15%. At
0.6g half of the models are considered to be irreparably damaged for both building types. At 1.0g, the
probability of the buildings overcoming the irreparability limit is around 80% and 95% for FC and PI
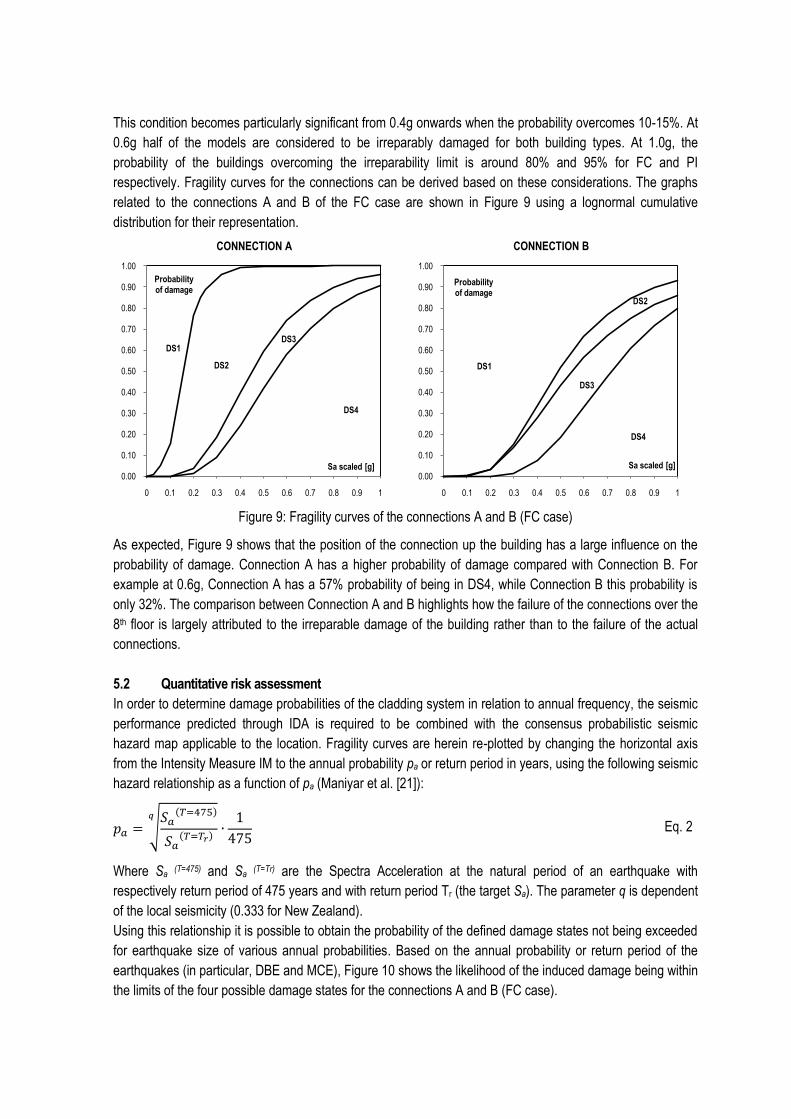
respectively. Fragility curves for the connections can be derived based on these considerations. The graphs
related to the connections A and B of the FC case are shown in Figure 9 using a lognormal cumulative
distribution for their representation.
CONNECTION A CONNECTION B
Figure 9: Fragility curves of the connections A and B (FC case)
As expected, Figure 9 shows that the position of the connection up the building has a large influence on the
probability of damage. Connection A has a higher probability of damage compared with Connection B. For
example at 0.6g, Connection A has a 57% probability of being in DS4, while Connection B this probability is
only 32%. The comparison between Connection A and B highlights how the failure of the connections over the
8th floor is largely attributed to the irreparable damage of the building rather than to the failure of the actual
connections.
5.2 Quantitative risk assessment
In order to determine damage probabilities of the cladding system in relation to annual frequency, the seismic
performance predicted through IDA is required to be combined with the consensus probabilistic seismic
hazard map applicable to the location. Fragility curves are herein re-plotted by changing the horizontal axis
from the Intensity Measure IM to the annual probability pa or return period in years, using the following seismic
hazard relationship as a function of pa (Maniyar et al. [21]):
Eq. 2
Where Sa (T=475) and Sa (T=Tr) are the Spectra Acceleration at the natural period of an earthquake with
respectively return period of 475 years and with return period Tr (the target Sa). The parameter q is dependent
of the local seismicity (0.333 for New Zealand).
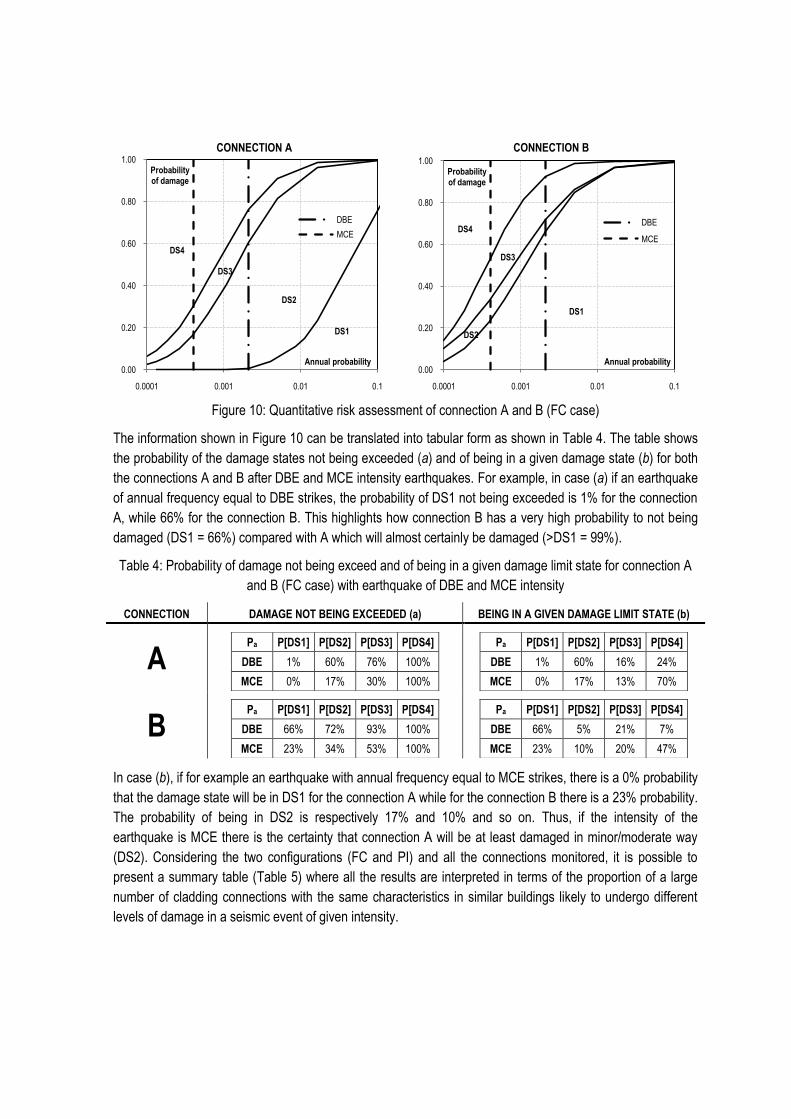
Using this relationship it is possible to obtain the probability of the defined damage states not being exceeded
for earthquake size of various annual probabilities. Based on the annual probability or return period of the
earthquakes (in particular, DBE and MCE), Figure 10 shows the likelihood of the induced damage being within
the limits of the four possible damage states for the connections A and B (FC case).
0.00
0.10
0.20
0.30
0.40
0.50
0.60
0.70
0.80
0.90
1.00
0 0.1 0.2 0.3 0.4 0.5 0.6 0.7 0.8 0.9 1
Probability of damage
Sa scaled [g]
DS1
DS2
DS3
DS4
0.00
0.10
0.20
0.30
0.40
0.50
0.60
0.70
0.80
0.90
1.00
0 0.1 0.2 0.3 0.4 0.5 0.6 0.7 0.8 0.9 1
Probability of damage
Sa scaled [g]
DS1
DS2
DS3
DS4
CONNECTION A CONNECTION B
Figure 10: Quantitative risk assessment of connection A and B (FC case)
The information shown in Figure 10 can be translated into tabular form as shown in Table 4. The table shows
the probability of the damage states not being exceeded (a) and of being in a given damage state (b) for both
the connections A and B after DBE and MCE intensity earthquakes. For example, in case (a) if an earthquake
of annual frequency equal to DBE strikes, the probability of DS1 not being exceeded is 1% for the connection
A, while 66% for the connection B. This highlights how connection B has a very high probability to not being
damaged (DS1 = 66%) compared with A which will almost certainly be damaged (>DS1 = 99%).
Table 4: Probability of damage not being exceed and of being in a given damage limit state for connection A
and B (FC case) with earthquake of DBE and MCE intensity
CONNECTION DAMAGE NOT BEING EXCEEDED (a) BEING IN A GIVEN DAMAGE LIMIT STATE (b)
A
Pa P[DS1] P[DS2] P[DS3] P[DS4]
DBE 1% 60% 76% 100%
MCE 0% 17% 30% 100%
Pa P[DS1] P[DS2] P[DS3] P[DS4]
DBE 1% 60% 16% 24%
MCE 0% 17% 13% 70%
B
Pa P[DS1] P[DS2] P[DS3] P[DS4]
DBE 66% 72% 93% 100%
MCE 23% 34% 53% 100%
Pa P[DS1] P[DS2] P[DS3] P[DS4]
DBE 66% 5% 21% 7%
MCE 23% 10% 20% 47%
In case (b), if for example an earthquake with annual frequency equal to MCE strikes, there is a 0% probability
that the damage state will be in DS1 for the connection A while for the connection B there is a 23% probability.
The probability of being in DS2 is respectively 17% and 10% and so on. Thus, if the intensity of the
earthquake is MCE there is the certainty that connection A will be at least damaged in minor/moderate way
(DS2). Considering the two configurations (FC and PI) and all the connections monitored, it is possible to
present a summary table (Table 5) where all the results are interpreted in terms of the proportion of a large
number of cladding connections with the same characteristics in similar buildings likely to undergo different
levels of damage in a seismic event of given intensity.
0.00
0.20
0.40
0.60
0.80
1.00
0.0001 0.001 0.01 0.1
Probability of damage
Annual probability
DBE
MCE
DS1
DS2
DS3
DS4
0.00
0.20
0.40
0.60
0.80
1.00
0.0001 0.001 0.01 0.1
Probability of damage
Annual probability
DBE
MCE
DS1
DS2
DS3
DS4
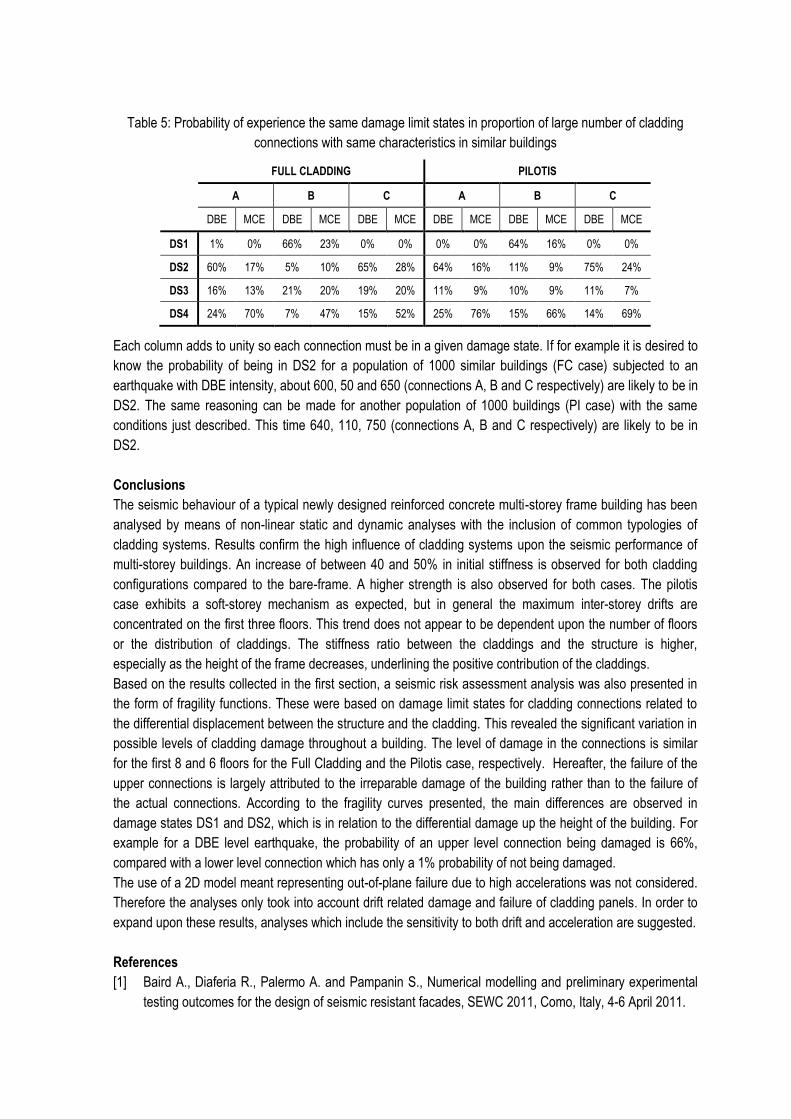
Table 5: Probability of experience the same damage limit states in proportion of large number of cladding
connections with same characteristics in similar buildings
FULL CLADDING PILOTIS
A B C A B C
DBE MCE DBE MCE DBE MCE DBE MCE DBE MCE DBE MCE
DS1 1% 0% 66% 23% 0% 0% 0% 0% 64% 16% 0% 0%
DS2 60% 17% 5% 10% 65% 28% 64% 16% 11% 9% 75% 24%
DS3 16% 13% 21% 20% 19% 20% 11% 9% 10% 9% 11% 7%
DS4 24% 70% 7% 47% 15% 52% 25% 76% 15% 66% 14% 69%
Each column adds to unity so each connection must be in a given damage state. If for example it is desired to
know the probability of being in DS2 for a population of 1000 similar buildings (FC case) subjected to an
earthquake with DBE intensity, about 600, 50 and 650 (connections A, B and C respectively) are likely to be in
DS2. The same reasoning can be made for another population of 1000 buildings (PI case) with the same
conditions just described. This time 640, 110, 750 (connections A, B and C respectively) are likely to be in
DS2.
Conclusions
The seismic behaviour of a typical newly designed reinforced concrete multi-storey frame building has been
analysed by means of non-linear static and dynamic analyses with the inclusion of common typologies of
cladding systems. Results confirm the high influence of cladding systems upon the seismic performance of
multi-storey buildings. An increase of between 40 and 50% in initial stiffness is observed for both cladding
configurations compared to the bare-frame. A higher strength is also observed for both cases. The pilotis
case exhibits a soft-storey mechanism as expected, but in general the maximum inter-storey drifts are
concentrated on the first three floors. This trend does not appear to be dependent upon the number of floors
or the distribution of claddings. The stiffness ratio between the claddings and the structure is higher,
especially as the height of the frame decreases, underlining the positive contribution of the claddings.
Based on the results collected in the first section, a seismic risk assessment analysis was also presented in
the form of fragility functions. These were based on damage limit states for cladding connections related to
the differential displacement between the structure and the cladding. This revealed the significant variation in
possible levels of cladding damage throughout a building. The level of damage in the connections is similar
for the first 8 and 6 floors for the Full Cladding and the Pilotis case, respectively. Hereafter, the failure of the
upper connections is largely attributed to the irreparable damage of the building rather than to the failure of
the actual connections. According to the fragility curves presented, the main differences are observed in
damage states DS1 and DS2, which is in relation to the differential damage up the height of the building. For
example for a DBE level earthquake, the probability of an upper level connection being damaged is 66%,
compared with a lower level connection which has only a 1% probability of not being damaged.
The use of a 2D model meant representing out-of-plane failure due to high accelerations was not considered.
Therefore the analyses only took into account drift related damage and failure of cladding panels. In order to
expand upon these results, analyses which include the sensitivity to both drift and acceleration are suggested.
References
[1] Baird A., Diaferia R., Palermo A. and Pampanin S., Numerical modelling and preliminary experimental
testing outcomes for the design of seismic resistant facades, SEWC 2011, Como, Italy, 4-6 April 2011.
[2] McMullin K., Wong Y., Choi C. and Chan K., Seismic performance thresholds of precast concrete
cladding connections, 13th World Conference on Earthquake Engineering, Vancouver, Canada, 2004.
[3] Priestley M.J.N., Performance Based Seismic Design, 12th World Conference on Earthquake
Engineering, Auckland, New Zealand, 2000.
[4] SEAOC Vision 2000 Committee, Performance-based seismic engineering, Sacramento, California:
Structural Engineers Associate of California, 1995.
[5] Taghavi S. and Miranda E., Response Assessment of Nonstructural Building Elements, PEER Report,
University of California, Berkeley, 2003, 96 pp.
[6] Cornell C.A, Jalayer F., Hamburger R.O. and Foutch D.A., Probabilistic Basis for 2000 SAC Federal
Emergency Management Agency Steel Moment Frame Guidelines, ASCE Journal of Structural
Engineering, pp 526-533, April 2002.
[7] Vamvatsikos D. and Cornell C.A., Incremental dynamic analysis, Earthquake Engineering and Structural
Dynamics, 31(3), p. 491–514, 2002.
[8] Stojadinovic B., Hunt J.P., Seismic performance assessment and probabilistic repair cost analysis of
precast concrete cladding systems for multi-storey buildings, PEER Report, University of California,
Berkeley, 2010, 364 pp.
[9] New Zealand Concrete Society, Examples of Concrete Structural Design to New Zealand Standards
3101, editors: Bull D.K. and Brunsdon D., New Zealand, 1998.
[10] Standards New Zealand, NZS 3101, Concrete Structures Standard – Part 1, Wellington, NZ, 1995.
[11] Standards New Zealand, NZS 1170.1, Structural Design Actions - Part 1, Wellington, NZ, 2002.
[12] Standards New Zealand, NZS 1170.5, Structural Design Actions - Part 5, Wellington, NZ, 2004.
[13] Carr, A., Ruaumoko Programme for Inelastic Dynamic Analysis - User Manual, Department of Civil
Engineering, University of Canterbury, New Zealand 2010.
[14] Otani S., Sake A., A Computer Program for Inelastic Response of R/C Frames to Earthquakes". Report
UILU-ENG-74-2029, Civil Engineering, 1974.
[15] Pampanin S., Christopoulos C. and Priestley M.J.N., Residual deformations in the performance-based
seismic assessment of frame structures, IUSS Press, Pavia, Italy, 2002.
[16] Standards New Zealand, NZS 1170.0, Structural Design Actions - Part 0, Wellington, NZ, 2002.
[17] NEHRP, Recommended Provisions for Seismic Regulations for New Buildings and Other Structures –
Part 1 – Provisions (FEMA 302), Federal Emergency Management Agency, Washington D.C., 1997.
[18] Shome N. and Cornell C.A., Probabilistic seismic demand analysis of nonlinear structures, Report N.
RMS-35, Stanford University, Stanford, CA, 1999.
[19] Jalayer F., Direct probabilistic seismic analysis: Implementing non-linear dynamic assessments, Ph.D.
Thesis, Stanford University, 2003.
[20] FEMA 356, Prestandard and Commentary for the Seismic Rehabilitation of Building. FEMA, 2000.
[21] Maniyar M., Khare R.K. and Dhakal R.P., Probabilistic Seismic Performance Evaluation of Non Seismic
RC Frame buildings, Structural Engineering and Mechanics, N 33(6), 2009.