numerical modelling of tsunamis and tsunami vulnerability...
TRANSCRIPT

Research Article
MathematicalMethods in theApplied Sciences
Received XXXX
(www.interscience.wiley.com) DOI: 10.1002/sim.0000
MOS subject classi�cation: XXX; XXX
Numerical modelling of tsunamis and tsunamivulnerability analysis for Heraklion, Crete
Evangelia T. Flouri1;2;�, Vassilios A. Dougalis1;3,Costas E. Synolakis2
Tsunamis are rare events compared to other extreme natural hazards, but the growth of population along coastlines has
increased their potential impact. Tsunamis are often generated by earthquake-induced dislocations of the sea oor which
displace a large mass of water. They can be simulated e�ectively as long waves whose propagation is modelled by the
nonlinear shallow water equations. In this note, we present a brief assessment of earthquake-generated tsunami hazards
for the city of Heraklion, Crete. Our approach is based on numerical hydrodynamic simulations, including inundation
computations with the model MOST, using accurate bathymetry and topography data of the study area. MOST implements
a splitting method in space to reduce the system of shallow water equations in two successive systems, one for each spatial
variable, and uses a dispersive, Godunov-type �nite di�erence method to solve the equations in characteristic form. We
consider a probabilistic scenario for assessing the in uence of the earthquake epicenter location on the tsunami, for time
windows of 100, 500 and 1000 years. The tsunami hazard is assessed through computed values of the maximum inundation
range and maximum ow depth. Finally, we present a brief vulnerability analysis for the city of Heraklion. The data needed to
identify tsunami{vulnerable areas are obtained by combining remote sensing techniques and GIS technology with surveyed
observations and estimates of population data.
Copyright c 2016 John Wiley & Sons, Ltd.
Keywords: tsunami, shallow water equations, tsunami vulnerability of Heraklion.
1. Introduction
The Aegean Sea has one of the most complicated seismotectonic structures worldwide and in the past its coastlines experienced
several tsunamis, [1],[3]. While the occurrence of tsunamis is relatively rare in the Aegean Sea, the hazard needs to be taken
into account since many of the Aegean coastal areas are densely populated and highly developed. After the 2004 Indian Ocean
tsunami, increased attention has been focused in past and possible future tsunami events in the broader Mediterranean region
and in the Aegean Sea, and to the assessment of the associated hazard, [5],[8]. Crete has been struck by devastating tsunamis
possibly in prehistoric times, [7], and in historic times by the large events of 365 BC and 1303 AD, [5], [13]. Nowadays, the
potential impact due to an extreme event will be much greater, since the population of the island in coastal areas is large and
there is great economic and touristic activity and infrastructure.
In this note, we present a brief analysis of tsunami vulnerability for the city of Heraklion in Crete. For the simulation of
the evolution of a tsunami we use e�cient numerical modelling coupled with recent and highly accurate bathymetric and
topographic data. For the hydrodynamic simulations, we used the model MOST by Titov and Synolakis, [15], which has been
extensively benchmarked, [14], and widely used by NOAA for real time tsunami forecasts. To assess the tsunami hazard we
adopt a probabilistic approach based on multiple tsunami scenarios for the purpose of producing inundation maps. In general, the
Probabilistic Tsunami Hazard Assessment (PTHA) is an alternative to the worst{case{scenario approach for estimating tsunami
impact in site-speci�c studies. Here, we focus on a computational method to produce multiple scenarios with MOST and derive
inundation statistics. We follow the methodology of [8] and assess the tsunami hazard for the city of Heraklion for time windows
of 100, 500 and 1000 years.
1Institute of Applied and Computational Mathematics, Foundation for Research and Technology Hellas, Heraklion, Greece2School of Environmental Engineering, Technical University of Crete, Chania, Greece3Mathematics Department, University of Athens, 15784 Zographou, Greece�Correspondence to: [email protected] ensure that you use the most up to date class �le, available from the MMA Home Page at
www3.interscience.wiley.com/journal/2197/home
Math. Meth. Appl. Sci. 2016, 00 1{6 Copyright c 2016 John Wiley & Sons, Ltd.
Prepared using mmaauth.cls [Version: 2009/09/02 v2.00]

MathematicalMethods in theApplied Sciences E.Flouri et al.
There are few studies on tsunami hazard in the general area under consideration. Indicatively, Papadopoulos and
Dermentzopoulos, [10], performed a qualitative tsunami risk pilot management study for Heraklion, with results based on
the analysis of a hypothetical tsunami of a particular magnitude with no numerical modelling. Papathoma et al., [11], proposed a
vulnerability approach incorporating various vulnerability factors in order to assign a so{called Relative Vulnerability Index to every
building located inside the inundation zone. The latter was not derived from simulations but rather de�ned as the area between
the coastline and the 5 m elevation contour. The authors applied their methodology to a coastal segment of the western part
of Heraklion. Recently, Flouri et al., [4], presented a vulnerability and risk analysis for the city of Rhodes, wherein the tsunami
hazard was assessed by means of the outcome of multiple numerical simulations of tsunami events of [8]. In the study at hand
we follow the methodology of [4] and [8] and perform a vulnerability analysis for the city of Heraklion.
2. The numerical model
The tsunami simulation in MOST, [15], has three parts:
(a) The initial stage of deformation, in which we determine an initial condition for the tsunami by calculating the deformation
of the seabed due to an earthquake. The process is based on a fault model for the seismic source, which considers the
ocean as an incompressible uid layer located above an elastic half-space representing the earth's crust.
(b) The propagation phase, where the nonlinear shallow water equations are solved numerically using a �nite di�erence
scheme to simulate the evolution of the tsunami in the open sea. The system models long wave propagation over actual
bathymetry; the wave runup is simulated by a special empirical algorithm. The shallow water equations are given by
ht + (uh)x + (vh)y = 0 ;
ut + uux + vuy + ghx = gdx ;
vt + uvx + vvy + ghy = gdy ;
where h = �(x; y ; t) + d(x; y) is the water depth, �(x; y ; t) is the elevation of the surface wave above an undisturbed
water level, d(x; y) is the depth of the undisturbed surface, u(x; y ; t), v(x; y ; t) are the depth-averaged velocities in the
x and y directions, and g is the acceleration of gravity.
A splitting technique technique is used for the solution of the above system. Under the assumption of a mild coupling
mechanism between the two space variables, an application of the fractional step method reduces the problem to solving
two one-dimensional systems
ht + (uh)x = 0 ;
ut + uux + ghx = gdx ;
vt + uvx = 0 ;
ht + (vh)y = 0 ;
vt + vvy + ghy = gdy ;
vt + vuy = 0 :
These are quasilinear hyperbolic systems with real and distinct eigenvalues and can be written in characteristic form, [15].
For example, the �rst system reduces to
(p1)t + �1(p1)x = gdx ;
(p2)t + �2(p2)x = gdx ;
(p3)t + �3(p3)x = 0 ;
(1)
where p1 = u + 2pgh, p2 = u � 2
pgh, p3 = v are the Riemann invariants, and �1 = u +
pgh, �2 = u �pgh, �3 = u
are the associated eigenvalues.
The characteristic equations are discretized by a Godunov type method using a second-order accurate explicit �nite
di�erence scheme in space and a �rst-order accurate in time
�tpni
�t+
1
�xi�1 + �xi
[�ni (��x + �x)p
ni � 2�t�n
i �x
(�x
�xi
)�ni p
ni
]=
g
�xi�1 + �xi
[(�
�x + �x)dni � 2�t�n
i �x
(�x
�xi
)dni
]where f ni = f (xi ; tn), and �t f
ni = f (xi ; tn + �t)� f (xi ; tn), �x f
ni = f (xi + �x; tn)� f (xi ; tn), ��x f
ni = f (xi ; tn)� f (xi �
�x); tn). The scheme is presented in detail by Titov and Synolakis in [15].
The boundary conditions that render the system (1) well{posed in a bounded domain are deduced according the value
of the Froude number Fr = u=pgh. Since here Fr < 1, we have �1 > 0 and �2 < 0, in the computational domain, while
�3 can be positive or negative. Therefore, one or two boundary conditions (depending on the sign of �3) are needed on
each boundary, for the incoming characteristics and the associated Riemann invariants. Boundaries are characterized as
re ective or transmissive, and suitable formulations of the boundary conditions are used, respectively, [15]. For example,
the characteristic de�ned by �2 is incoming on the right boundary. Therefore p2 is determined by the boundary condition.
2 Copyright c 2016 John Wiley & Sons, Ltd. Math. Meth. Appl. Sci. 2016, 00 1{6
Prepared using mmaauth.cls

E.Flouri et al.
MathematicalMethods in theApplied Sciences
However, p1 should be computed from (1) using an appropriate discretization on the boundary. This is accomplished by
applying the upwind scheme
(p1)n+1b = (p1)
nb �
�t
�xb[�n
1(��x(p1)nb)� g(�
�xdnb )] ; (2)
where the subscript b indicates values on the boundary.
(c) In order to model tsunami propagation in the near shore zone MOST uses several nested grids to model shorter waves
over complex bathymetry. The interpolation algorithms needed to de�ne values on the several grids are described in [15].
Very close to the shoreline, the description of the evolution of the wave on the dry bed needs the use of a moving boundary
condition. Proper handling of the wet-dry front in a �nite di�erence context, is described in [15]; the general idea is (since
the shallow water approximation is violated and maybe Fr > 1) to approximate boundary values from previous space nodes.
The use of variable (time dependent) meshlength, guarantees that the front is placed where the horizontal extension of
the values at the last wet point meets the bed topography.
It is evident that the simulation of an earthquake-generated tsunami in a realistic environment by MOST requires a detailed
description of the seismic source mechanism for the generation phase, and high resolution bathymetric and topographic data
to produce the grid for the evolution and inundation phases. Here, the main data sources used for the bathymetry-topography
reconstruction needed by the code were as follows: Bathymetry/topography dataset of 1 min resolution from GEBCO, nautical
charts of various scales and resolutions, bathymetry binary data extracted from Electronic Nautical Charts, and shoreline data
provided by the Hellenic Navy Hydrographic Service. These sets were registered and corrected, where appropriate, according to a
common and consistent georeference. Using an accurate shoreline dataset, the topographic and bathymetric grids were merged
into the �nal Digital Elevation Model (DEM), from which three raster ASCII nested grid �les were extracted. The resolution of
the �nest grid was 30 m; this captures the inundation characteristics of waves of a scale expected from extreme events.
3. The probabilistic approach
Following [8], we consider the following problem: Suppose that an earthquake occurs in a region denoted by , a bounded subset
of R2, and let the point x of denote the epicenter location. Let Y (x) be the maximum waveheight of a tsunami generated at
epicenter x at a given location on land.
Assuming that Y is a random �eld, so that Y (x1); Y (x2); : : : , are independent identically distributed random variables, for
xi 2 our aim is to estimate statistically the quantity U = max Y (x), for x in . Let xk , k = 1; : : : ; N be random points uniformly
distributed in . For each xk we run MOST for an appropriate earthquake size, which we will discuss below, and compute Y (xk).
Then, we estimate U by the quantity UN = maxfY (x1); Y (x2); : : : ; Y (xN)g : Under the above assumptions, it is easy to show
(see [8]) that UN will converge to U, as N grows.
To apply our methodology to the case of Heraklion, we consider a rectangle around Crete enclosing the area between 22o
and 27.63o East and 34.17o and 36.3o North, as shown in Figure 1. As in [9] and [12], Greece and the surrounding area, are
divided into 67 risk areas (as shown in Figure 1), where seismicity regarding surface earthquakes is almost homogeneous and
characterized by typical focal mechanisms. Moratto et al., [9], have evaluated full seismic properties (i.e. strike, dip, rake) for
these 67 seismic zones (see. Table 1, Fig. 2 of [9]).
Our aim is to estimate the e�ect of the epicenter location on the potential hazard assuming that the location of the epicenter
is random and keeping the other seismic parameters constant. Thus, in each sub-region we need a measure of the seismicity for
a certain time period. For this purpose we use the most probable maximum size �M = (a + log t)=b from [8]. The parameters
a, b are the parameters of the Gutenberg-Richter distribution (see Table 7.1, p. 120 of [12]).
For each epicenter location x in , we assume a seismic event with magnitude equal to the most probable maximum
magnitude of the sub-region to which it belongs. Using a random point generator we choose N (N = 100) epicenter locations
and we perform N simulations with MOST for each time period using the epicenter locations and the seismic parameters of the
speci�c region. For each time window, we calculated the maximum range of the inundation, and the maximum waveheight over
the 100 simulations. In Figure 2 we present the maximum tsunami inundation lines for 100, 500, and 1000{year time windows
for Heraklion. We observe that, in all cases the tsunami a�ects all coastal areas of Heraklion including the commercial port. The
greater penetration ashore is observed for a tsunami of 1000 years. In Figure 3 we present the maximum (over 100 simulations)
tsunami wave height for the 1000-year time window for the wider area of Heraklion. We observe that the maximum waveheight
exceeds 13 meters in the area of Ammoudara (west of Heraklion, an area of high commercial development), as well as in the
beach of Karteros (east of Heraklion). We also note that the tsunami arrival time is in every case less than 20 minutes.
4. Vulnerability analysis
Vulnerability refers to the exposure or the degree of resistance to a hazard and may be de�ned, [2], as a set of objects, conditions,
variables and processes resulting from physical, social, economic and environmental factors that increase the exposure of a
community to the impact of a tsunami. For our purposes, we will follow the methodology of [4] and study vulnerability by means
Math. Meth. Appl. Sci. 2016, 00 1{6 Copyright c 2016 John Wiley & Sons, Ltd. 3Prepared using mmaauth.cls

MathematicalMethods in theApplied Sciences E.Flouri et al.
Figure 1. Seismogenic sources of shallow eartquakes in Greece and surrounding area, after Papazachos and Papazachou (1997), and the rectangular area around
Crete de�ning .
Figure 2. Maximum tsunami inundation lines for the 100{year (red line), 500{year (yellow line) and 1000{year (green line) time windows for the wider area of
Heraklion.
Figure 3. Maximum tsunami waveheight for the 1000-year time window for the wider area of Heraklion.
4 Copyright c 2016 John Wiley & Sons, Ltd. Math. Meth. Appl. Sci. 2016, 00 1{6
Prepared using mmaauth.cls
E.Flouri et al.
MathematicalMethods in theApplied Sciences
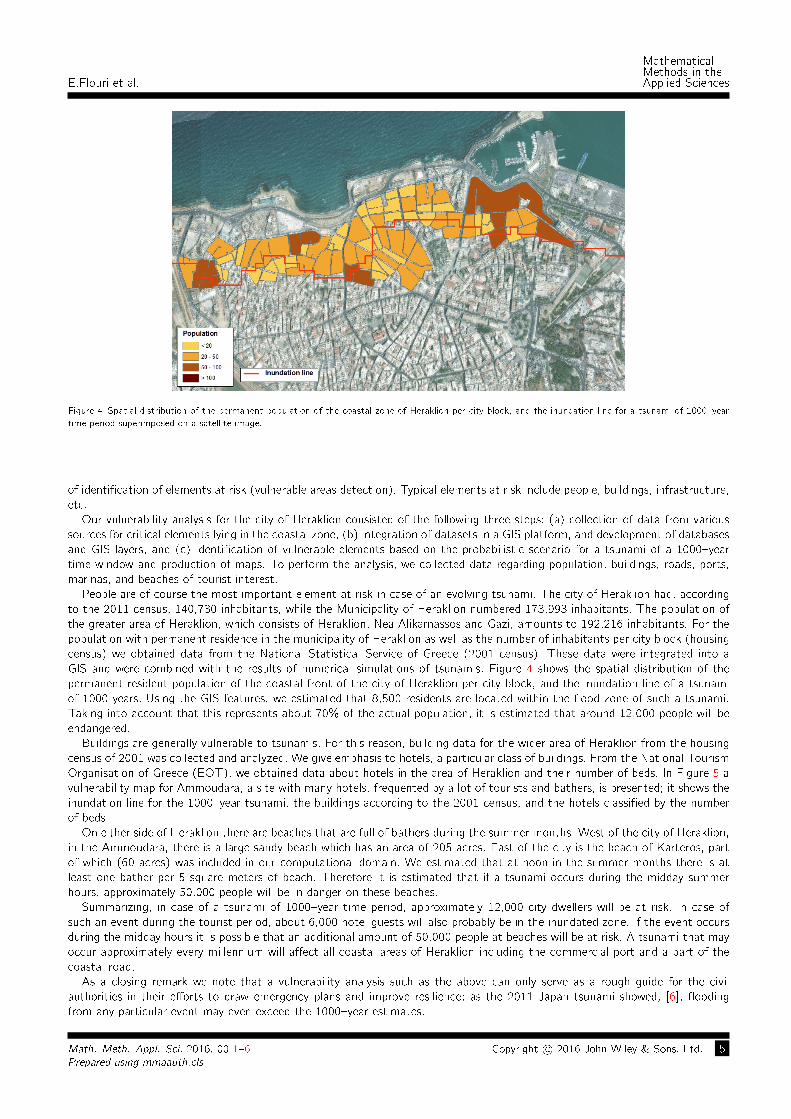
Figure 4. Spatial distribution of the permanent population of the coastal zone of Heraklion per city block, and the inundation line for a tsunami of 1000{year
time period superimposed on a satellite image.
of identi�cation of elements at risk (vulnerable areas detection). Typical elements at risk include people, buildings, infrastructure,
etc.
Our vulnerability analysis for the city of Heraklion consisted of the following three steps: (a) collection of data from various
sources for critical elements lying in the coastal zone, (b) integration of datasets in a GIS platform, and development of databases
and GIS layers, and (c) identi�cation of vulnerable elements based on the probabilistic scenario for a tsunami of a 1000{year
time window and production of maps. To perform the analysis, we collected data regarding population, buildings, roads, ports,
marinas, and beaches of tourist interest.
People are of course the most important element at risk in case of an evolving tsunami. The city of Heraklion had, according
to the 2011 census, 140,730 inhabitants, while the Municipality of Heraklion numbered 173,993 inhabitants. The population of
the greater area of Heraklion, which consists of Heraklion, Nea Alikarnassos and Gazi, amounts to 192,216 inhabitants. For the
population with permanent residence in the municipality of Heraklion as well as the number of inhabitants per city block (housing
census) we obtained data from the National Statistical Service of Greece (2001 census). These data were integrated into a
GIS and were combined with the results of numerical simulations of tsunamis. Figure 4 shows the spatial distribution of the
permanent resident population of the coastal front of the city of Heraklion per city block, and the inundation line of a tsunami
of 1000 years. Using the GIS features, we estimated that 8,500 residents are located within the ood zone of such a tsunami.
Taking into account that this represents about 70% of the actual population, it is estimated that around 12,000 people will be
endangered.
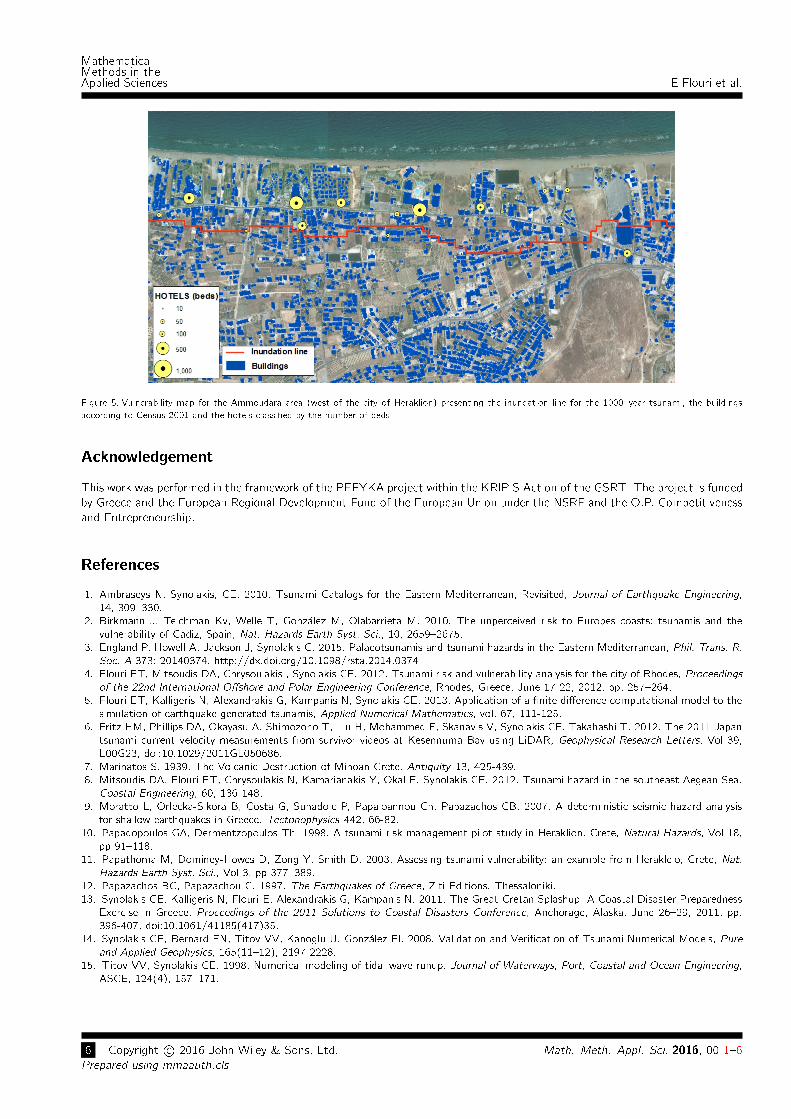
Buildings are generally vulnerable to tsunamis. For this reason, building data for the wider area of Heraklion from the housing
census of 2001 was collected and analyzed. We give emphasis to hotels, a particular class of buildings. From the National Tourism
Organisation of Greece (EOT), we obtained data about hotels in the area of Heraklion and their number of beds. In Figure 5 a
vulnerability map for Ammoudara, a site with many hotels, frequented by a lot of tourists and bathers, is presented; it shows the
inundation line for the 1000{year tsunami, the buildings according to the 2001 census, and the hotels classi�ed by the number
of beds.
On either side of Heraklion there are beaches that are full of bathers during the summer months. West of the city of Heraklion,
in the Ammoudara, there is a large sandy beach which has an area of 205 acres. East of the city is the beach of Karteros, part
of which (60 acres) was included in our computational domain. We estimated that at noon in the summer months there is at
least one bather per 5 square meters of beach. Therefore it is estimated that if a tsunami occurs during the midday summer
hours, approximately 50,000 people will be in danger on these beaches.
Summarizing, in case of a tsunami of 1000{year time period, approximately 12,000 city dwellers will be at risk. In case of
such an event during the tourist period, about 6,000 hotel guests will also probably be in the inundated zone. If the event occurs
during the midday hours it is possible that an additional amount of 50,000 people at beaches will be at risk. A tsunami that may
occur approximately every millennium will a�ect all coastal areas of Heraklion including the commercial port and a part of the
coastal road.
As a closing remark we note that a vulnerability analysis such as the above can only serve as a rough guide for the civil
authorities in their e�orts to draw emergency plans and improve resilience; as the 2011 Japan tsunami showed, [6], ooding
from any particular event may even exceed the 1000{year estimates.
Math. Meth. Appl. Sci. 2016, 00 1{6 Copyright c 2016 John Wiley & Sons, Ltd. 5Prepared using mmaauth.cls
MathematicalMethods in theApplied Sciences E.Flouri et al.
Figure 5. Vulnerability map for the Ammoudara area (west of the city of Heraklion) presenting the inundation line for the 1000{year tsunami, the buildings
according to Census 2001 and the hotels classi�ed by the number of beds.
Acknowledgement
This work was performed in the framework of the PEFYKA project within the KRIPIS Action of the GSRT. The project is funded
by Greece and the European Regional Development Fund of the European Union under the NSRF and the O.P. Competitiveness
and Entrepreneurship.
References
1. Ambraseys N, Synolakis, CE, 2010. Tsunami Catalogs for the Eastern Mediterranean, Revisited, Journal of Earthquake Engineering,
14, 309{330.
2. Birkmann J, Teichman Kv, Welle T, Gonz�alez M, Olabarrieta M. 2010. The unperceived risk to Europes coasts: tsunamis and the
vulnerability of Cadiz, Spain, Nat. Hazards Earth Syst. Sci., 10, 2659{2675.
3. England P, Howell A, Jackson J, Synolakis C. 2015. Palaeotsunamis and tsunami hazards in the Eastern Mediterranean, Phil. Trans. R.
Soc. A 373: 20140374. http://dx.doi.org/10.1098/rsta.2014.0374
4. Flouri ET, Mitsoudis DA, Chrysoulakis , Synolakis CE. 2012. Tsunami risk and vulnerability analysis for the city of Rhodes, Proceedings
of the 22nd International O�shore and Polar Engineering Conference, Rhodes, Greece, June 17-22, 2012, pp. 257{264.
5. Flouri ET, Kalligeris N, Alexandrakis G, Kampanis N, Synolakis CE. 2013. Application of a �nite di�erence computational model to the
simulation of earthquake generated tsunamis, Applied Numerical Mathematics, vol. 67, 111-125.
6. Fritz HM, Phillips DA, Okayasu A, Shimozono T, Liu H, Mohammed F, Skanavis V, Synolakis CE, Takahashi T. 2012. The 2011 Japan
tsunami current velocity measurements from survivor videos at Kesennuma Bay using LiDAR, Geophysical Research Letters, Vol 39,
L00G23, doi:10.1029/2011GL050686.
7. Marinatos S. 1939. The Volcanic Destruction of Minoan Crete. Antiquity 13, 425-439.
8. Mitsoudis DA, Flouri ET, Chrysoulakis N, Kamarianakis Y, Okal E, Synolakis CE. 2012. Tsunami hazard in the southeast Aegean Sea.
Coastal Engineering, 60, 136-148.
9. Moratto L, Orlecka-Sikora B, Costa G, Suhadolc P, Papaioannou Ch, Papazachos CB. 2007. A deterministic seismic hazard analysis
for shallow earthquakes in Greece. Tectonophysics 442, 66-82.
10. Papadopoulos GA, Dermentzopoulos Th. 1998. A tsunami risk management pilot study in Heraklion. Crete, Natural Hazards, Vol 18,
pp 91{118.
11. Papathoma M, Dominey-Howes D, Zong Y, Smith D. 2003. Assessing tsunami vulnerability: an example from Herakleio, Crete, Nat.
Hazards Earth Syst. Sci., Vol 3, pp 377{389.
12. Papazachos BC, Papazachou C. 1997. The Earthquakes of Greece, Ziti Editions. Thessaloniki.
13. Synolakis CE, Kalligeris N, Flouri E, Alexandrakis G, Kampanis N. 2011. The Great Cretan Splashup A Coastal Disaster Preparedness
Exercise in Greece, Proceedings of the 2011 Solutions to Coastal Disasters Conference, Anchorage, Alaska, June 26{29, 2011, pp.
396-407, doi:10.1061/41185(417)35.
14. Synolakis CE, Bernard EN, Titov VV, Kanoglu U, Gonz�alez FI. 2008. Validation and Veri�cation of Tsunami Numerical Models, Pure
and Applied Geophysics, 165(11{12), 2197-2228.
15. Titov VV, Synolakis CE. 1998. Numerical modeling of tidal wave runup. Journal of Waterways, Port, Coastal and Ocean Engineering,
ASCE, 124(4), 157{171.
6 Copyright c 2016 John Wiley & Sons, Ltd. Math. Meth. Appl. Sci. 2016, 00 1{6
Prepared using mmaauth.cls