nucor’s - covering steel, scrap metal, stainless ... · pdf filerebar steel cold...
TRANSCRIPT

2
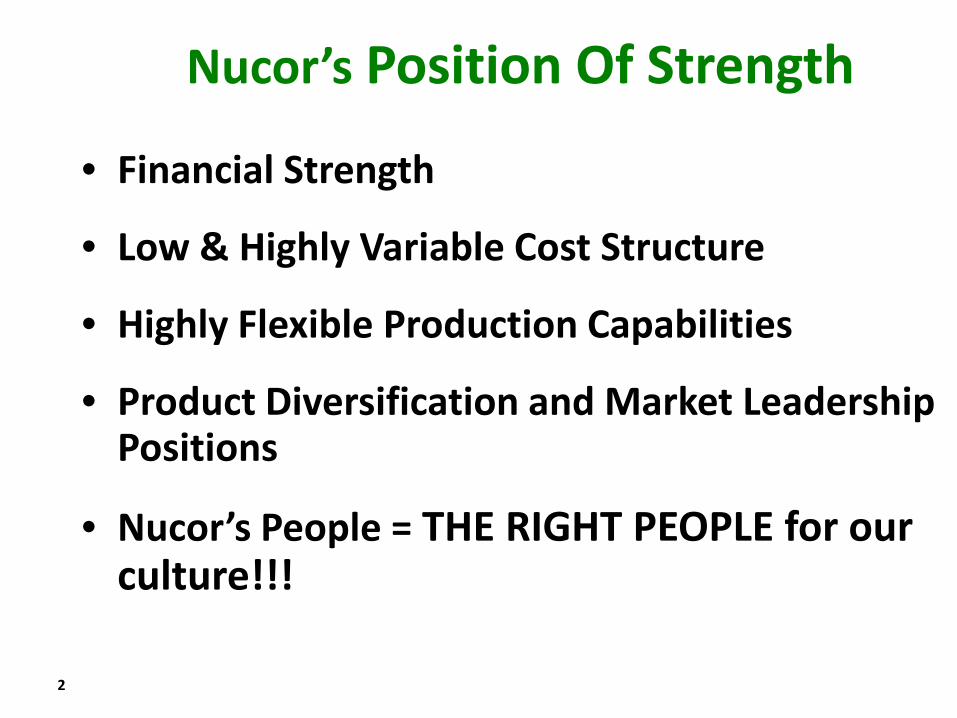
Nucor’s Position Of Strength
• Financial Strength
• Low & Highly Variable Cost Structure
• Highly Flexible Production Capabilities
• Product Diversification and Market Leadership Positions
• Nucor’s People = THE RIGHT PEOPLE for our culture!!!
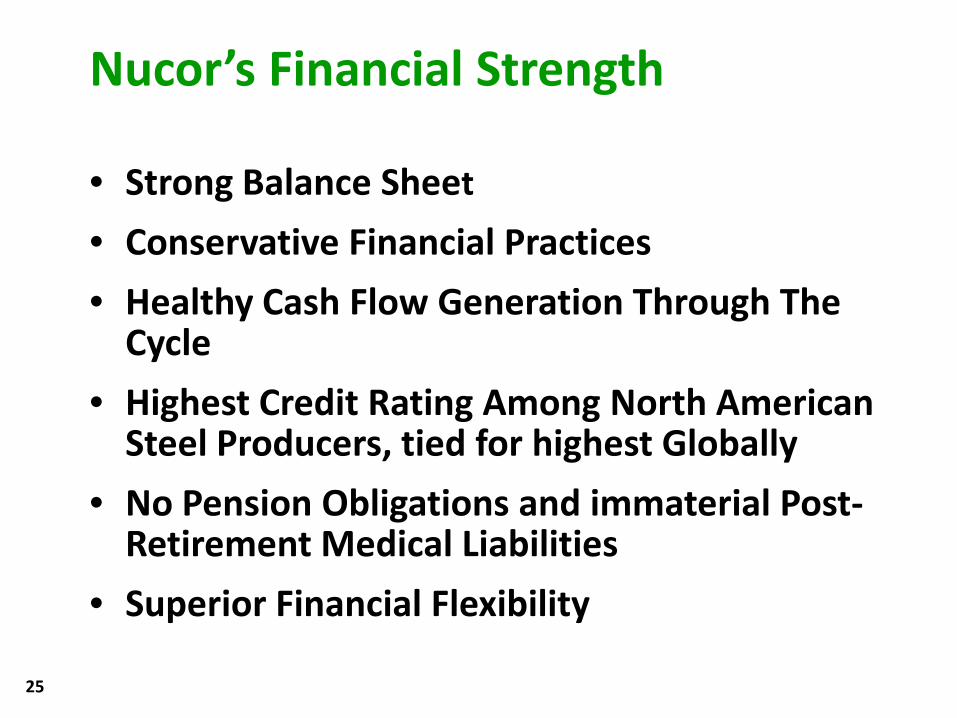
• Strong Balance Sheet
• Conservative Financial Practices
• Healthy Cash Flow Generation Through The Cycle
• Highest Credit Rating Among North American Steel Producers, tied for highest Globally
• No Pension Obligations and immaterial Post-Retirement Medical Liabilities
• Superior Financial Flexibility
25
Nucor’s Financial Strength
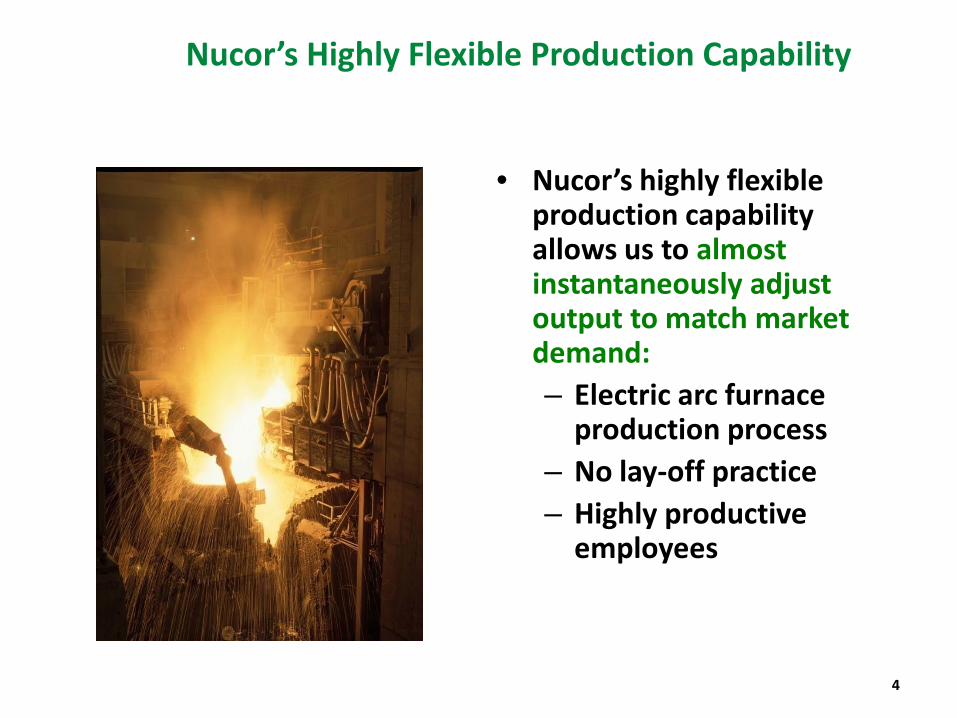
Nucor’s Highly Flexible Production Capability
• Nucor’s highly flexible production capability allows us to almost instantaneously adjust output to match market demand:– Electric arc furnace
production process – No lay-off practice– Highly productive
employees
4

Nucor’s People –Our Biggest Competitive Advantage
5
Our Culture Drives Nucor’s Success
• A LONG-TERM FOCUS!!!
• SAFETY FIRST, ALWAYS!!!
• A DEEP COMMITMENT TO EMPLOYEES!!!
• TEAMWORK
• PAY FOR PERFORMANCE / INNOVATION / CONTINUAL IMPROVEMENT
• A DECENTRALIZED STRUCTURE WITH FEW LAYERS OF MANAGEMENT
• NUCOR’S EMPLOYEES TAKE OWNERSHIP OF TAKING CARE OF OUR CUSTOMERS, & OUR SHAREHOLDERS, AND EACH OTHER!!!
6
7
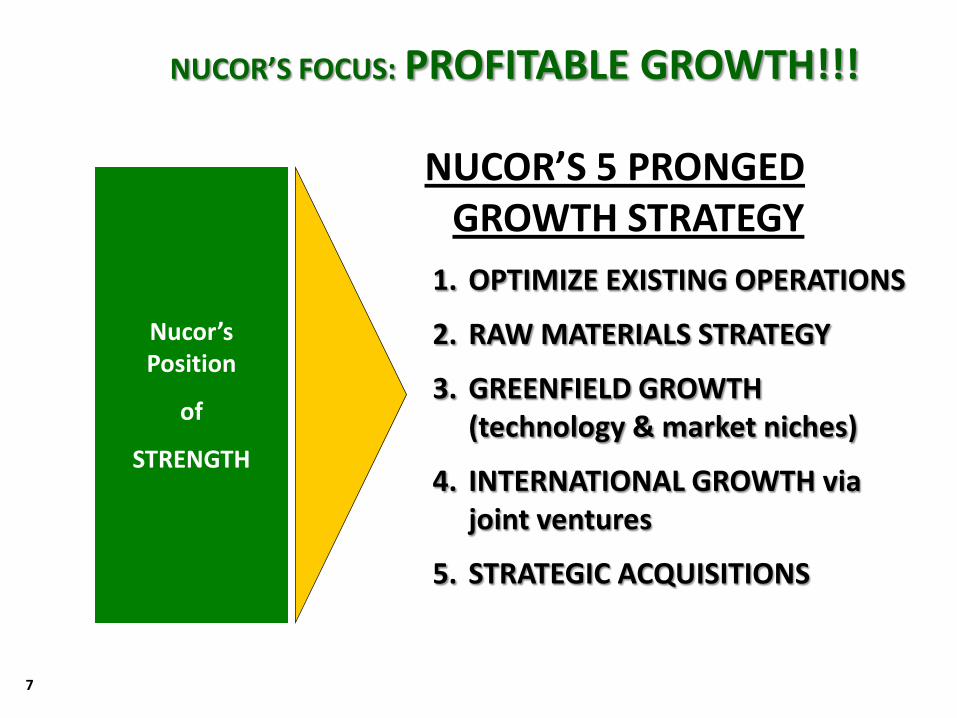
NUCOR’S FOCUS: PROFITABLE GROWTH!!!
NUCOR’S 5 PRONGED GROWTH STRATEGY
Nucor’s Position
of
STRENGTH
1. OPTIMIZE EXISTING OPERATIONS
2. RAW MATERIALS STRATEGY
3. GREENFIELD GROWTH (technology & market niches)
4. INTERNATIONAL GROWTH via joint ventures
5. STRATEGIC ACQUISITIONS
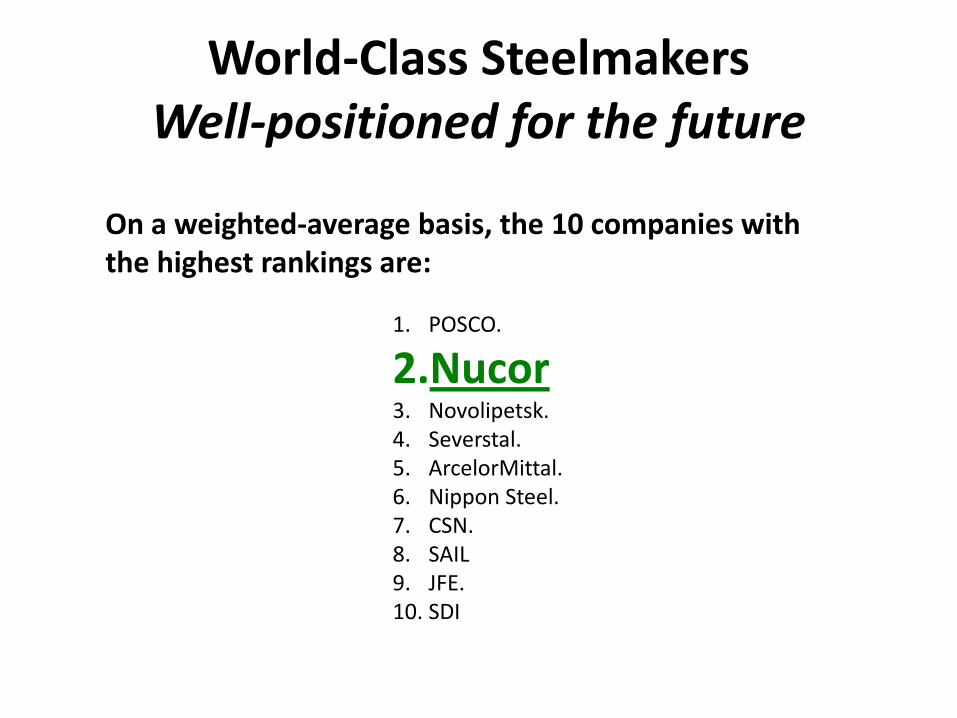
World-Class SteelmakersWell-positioned for the future
On a weighted-average basis, the 10 companies with the highest rankings are:
1. POSCO.
2.Nucor3. Novolipetsk. 4. Severstal. 5. ArcelorMittal. 6. Nippon Steel.7. CSN. 8. SAIL9. JFE. 10. SDI
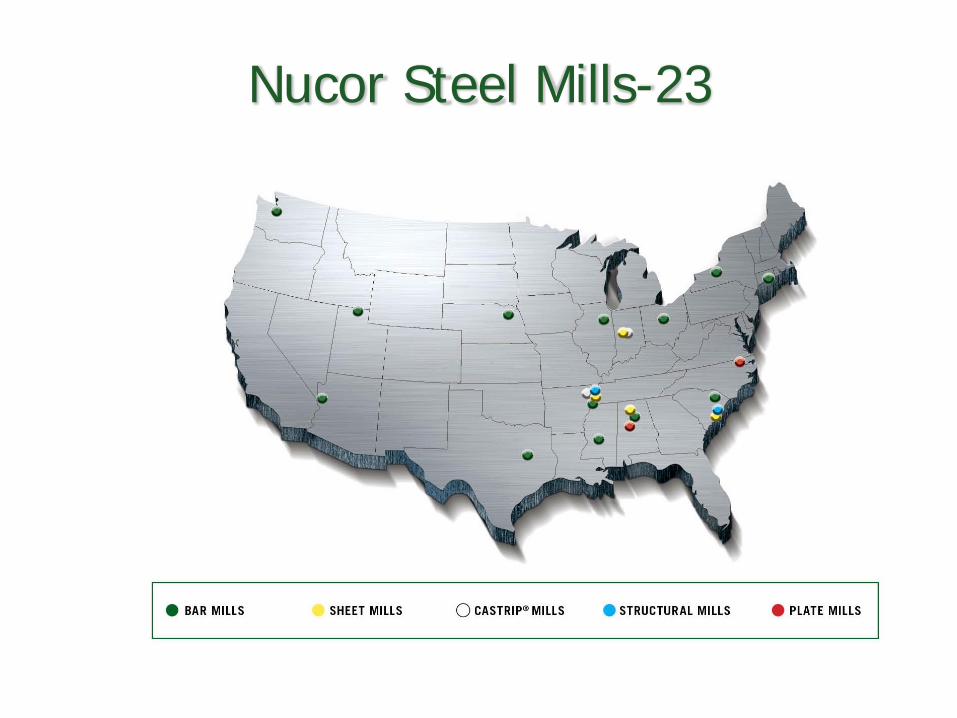
Nucor Steel Mills-23
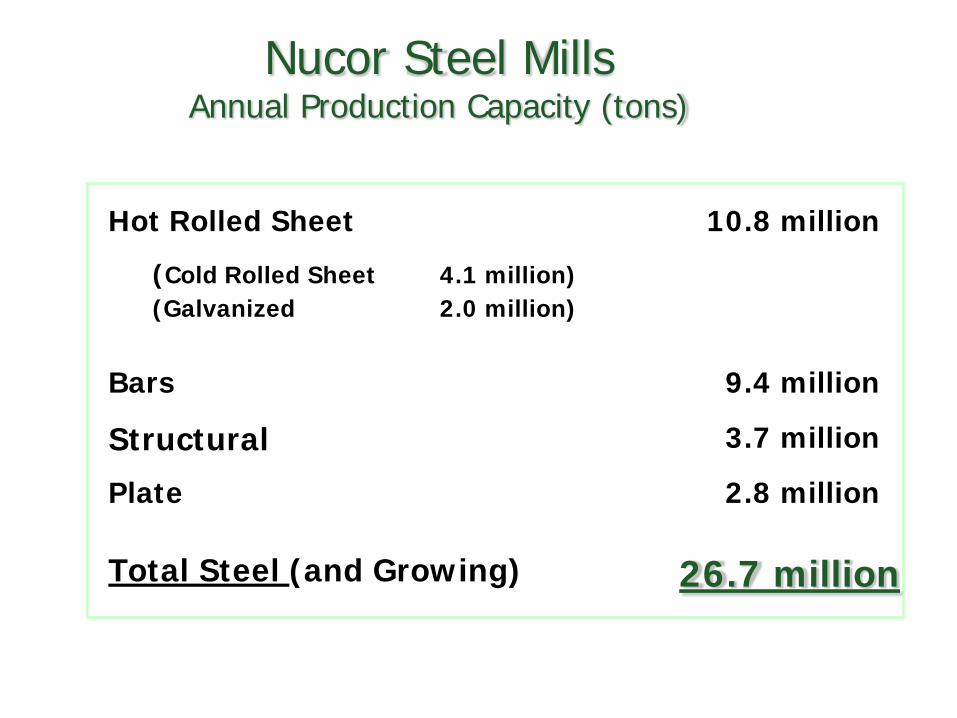
Nucor Steel Mills Annual Production Capacity (tons)
Hot Rolled Sheet
(Cold Rolled Sheet 4.1 million)(Galvanized 2.0 million)
10.8 million
Bars 9.4 million
Structural 3.7 million
Plate 2.8 million
Total Steel (and Growing) 26.7 million
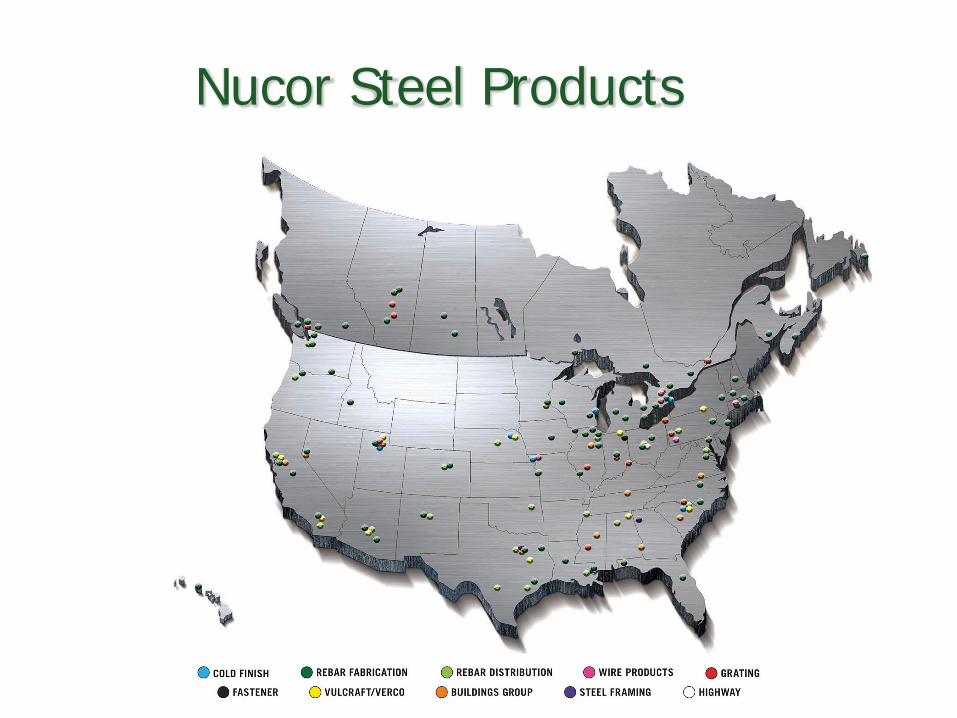
Nucor Steel Products
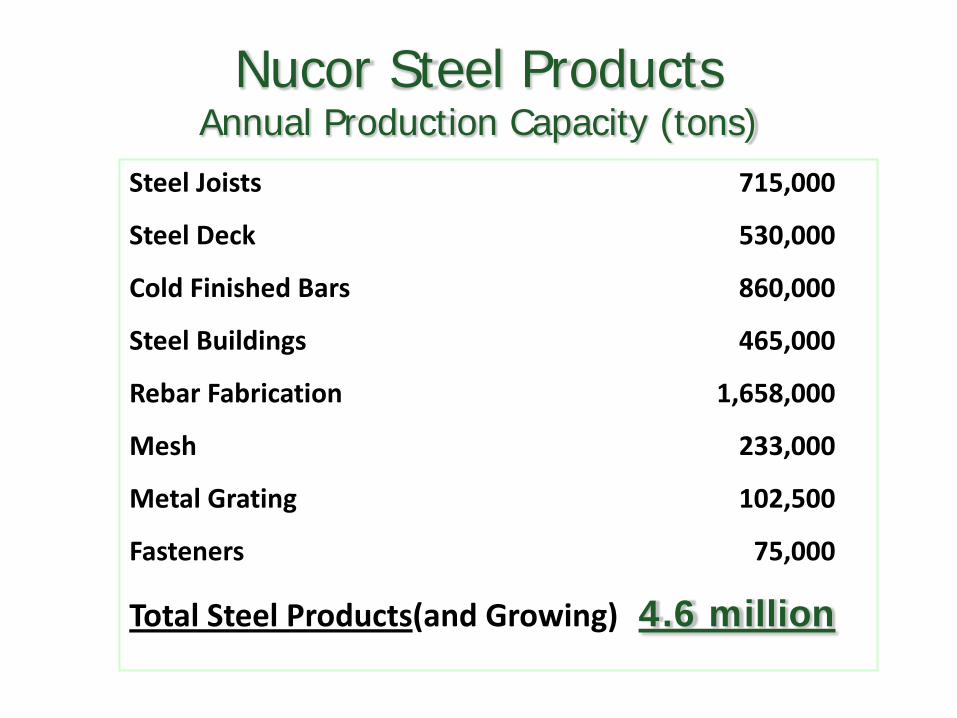
Nucor Steel Products Annual Production Capacity (tons)
Steel Joists 715,000
Steel Deck 530,000
Cold Finished Bars 860,000
Steel Buildings 465,000
Rebar Fabrication 1,658,000
Mesh 233,000
Metal Grating 102,500
Fasteners 75,000
Total Steel Products(and Growing) 4.6 million
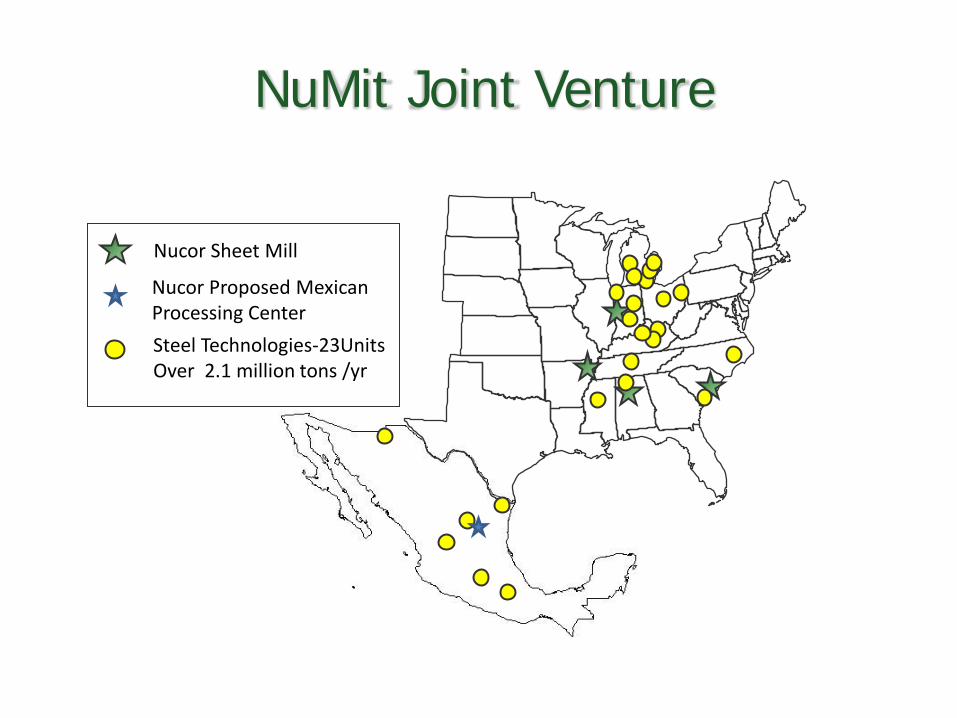
Nucor Proposed MexicanProcessing Center
NuMit Joint Venture
Nucor Sheet Mill
Steel Technologies-23UnitsOver 2.1 million tons /yr
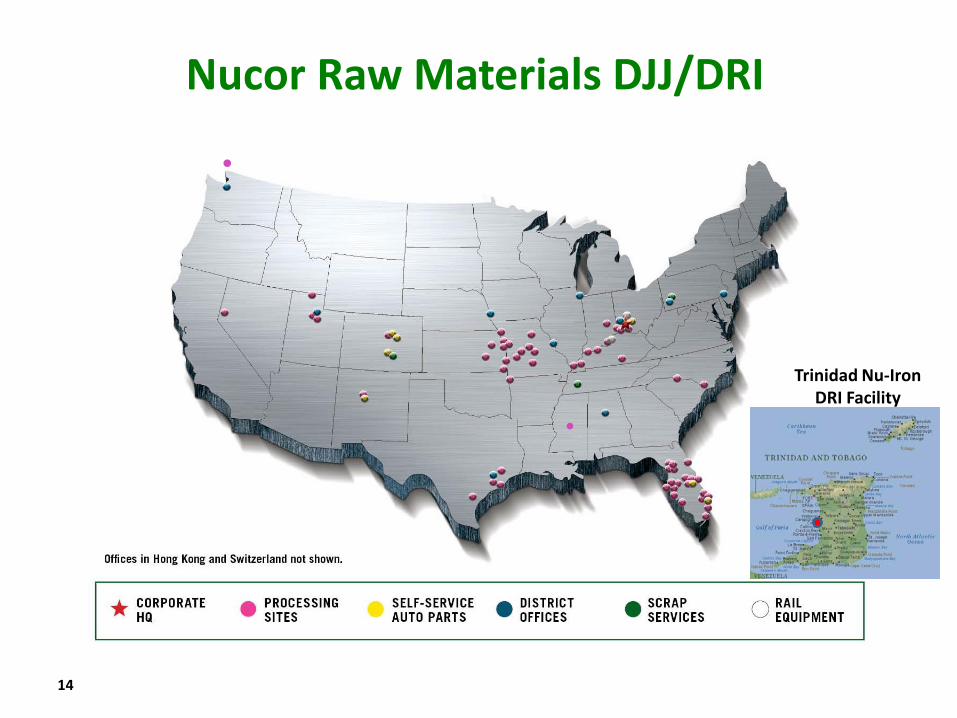
Nucor Raw Materials DJJ/DRI
14
Trinidad Nu-Iron DRI Facility
Nucor Steel Louisiana • Selected St. James Parrish, Louisiana for construction of $750 million iron making
facility. 2.5 million tons annual capacity of direct reduced iron (DRI). First phase of a multi-phase plan that may include an additional DRI facility, coke plant, blast furnace, & steel mill.
• Next step implementing Nucor’s raw materials strategy’s goal of controlling 6 to 7 million tons-per-year supply of high quality scrap substitutes (builds on 2.0 million tons at Trinidad DRI plant, Nu-Iron).
• Leverages strong skill set established by our Nu-Iron Team in applying direct reduction technology – achieved world class DRI quality levels in metallization rates, iron content, and productivity.
• Consistent with Nu-Iron’s highly successful business model, Nucor has secured for the Louisiana DRI facility a long-term supply of natural gas at an attractive cost by means of E&P drilling (on-shore) partnership with one of North America’s largest natural gas producers.
16
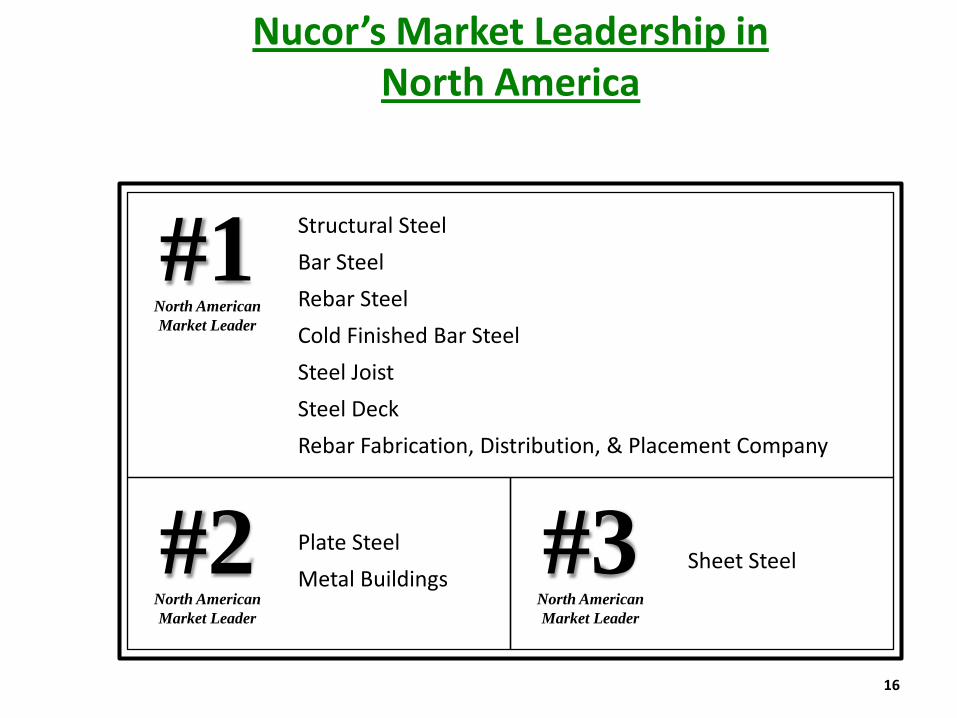
Nucor’s Market Leadership in North America
Structural Steel
Bar Steel
Rebar Steel
Cold Finished Bar Steel
Steel Joist
Steel Deck
Rebar Fabrication, Distribution, & Placement Company
Sheet SteelPlate Steel
Metal Buildings
#1North AmericanMarket Leader
#2North American Market Leader
#3North American Market Leader
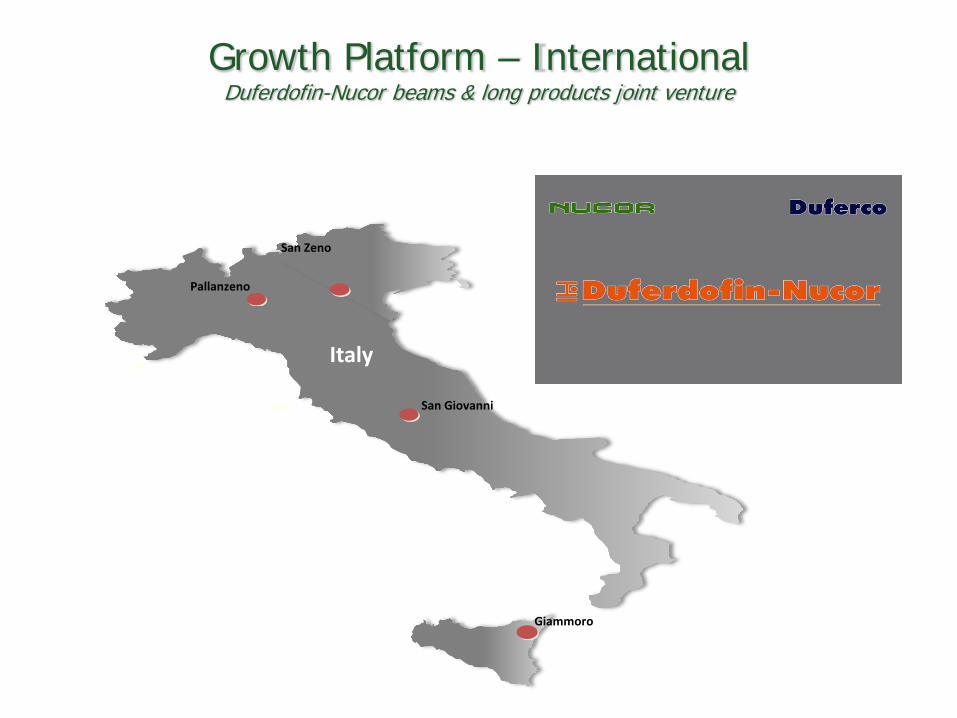
Growth Platform – International Duferdofin-Nucor beams & long products joint venture
San Giovanni
San Zeno
Pallanzeno
Italy
SicilyGiammoro
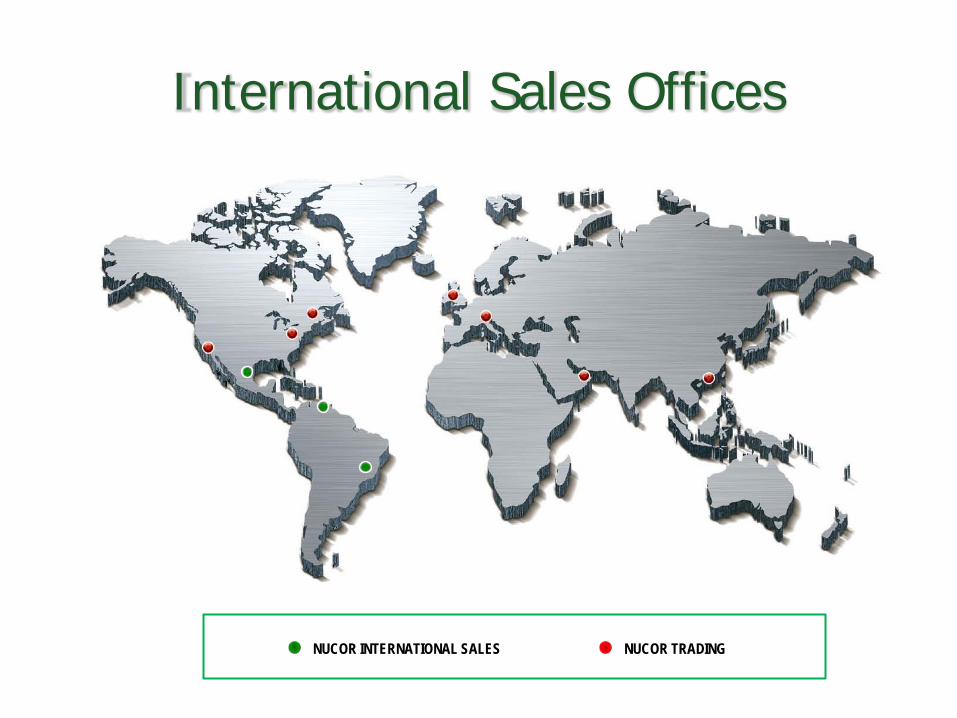
International Sales Offices
NUCOR TRADINGNUCOR INTERNATIONAL SALES
USA’s biggest economic problem today that is NOT being dealt with:
JOB CREATION
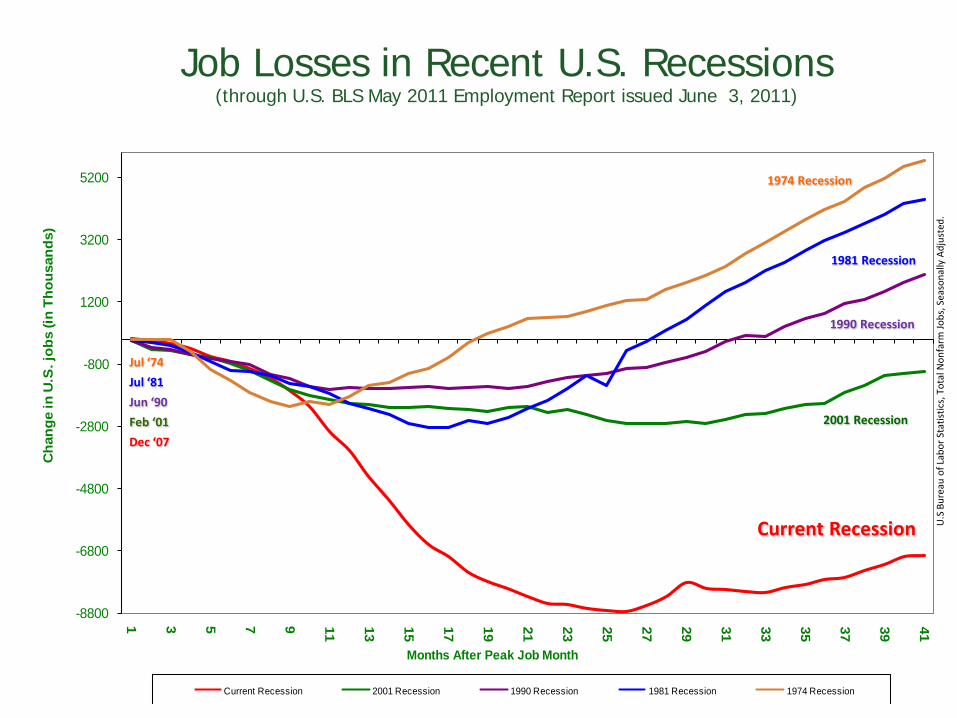
Job Losses in Recent U.S. Recessions(through U.S. BLS May 2011 Employment Report issued June 3, 2011)
-8800
-6800
-4800
-2800
-800
1200
3200
5200
1 3 5 7 9 11 13 15 17 19 21 23 25 27 29 31 33 35 37 39 41C
hang
e in
U.S
. job
s (in
Tho
usan
ds)
Months After Peak Job Month
Current Recession 2001 Recession 1990 Recession 1981 Recession 1974 Recession
2001 Recession
Current Recession
1990 Recession
1981 Recession
1974 Recession
Jul ‘74
Jul ‘81
Jun ‘90
Feb ‘01
Dec ‘07
U.S
Bur
eau
of L
abor
Sta
tistic
s, T
otal
Non
farm
Jobs
, Sea
sona
lly A
djus
ted.
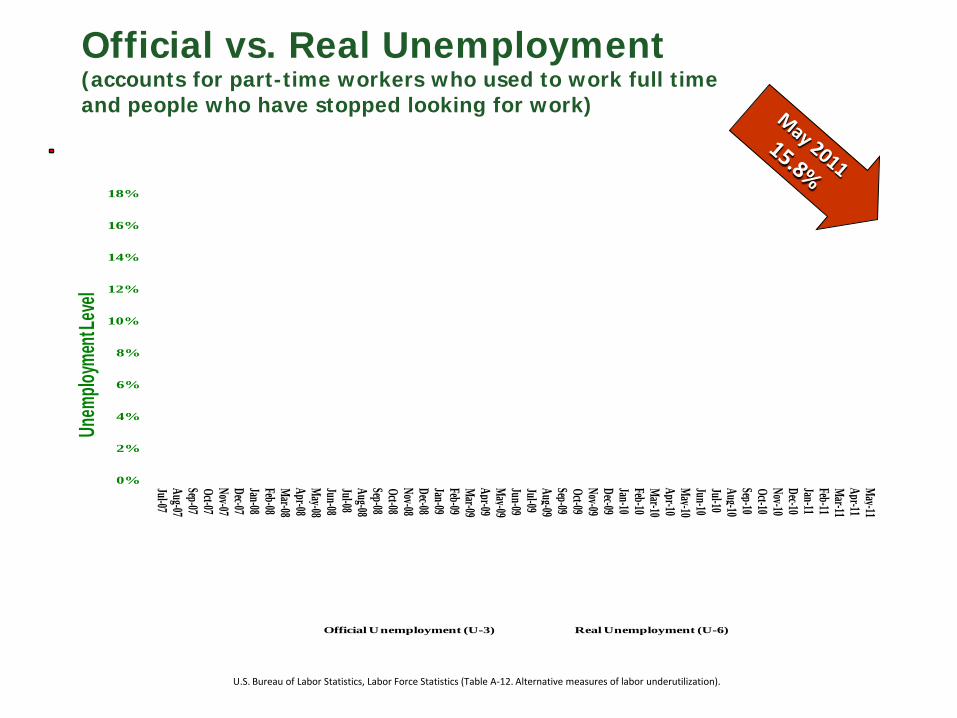
Official vs. Real Unemployment(accounts for part-time workers who used to work full timeand people who have stopped looking for work)
U.S. Bureau of Labor Statistics, Labor Force Statistics (Table A-12. Alternative measures of labor underutilization).
0%
2%
4%
6%
8%
10%
12%
14%
16%
18%
Jul-07Aug-07Sep-07Oct-07Nov-07Dec-07Jan-08Feb-08Mar-08Apr -08May-08Jun-08Jul-08Aug-08Sep-08Oct- 08Nov-08Dec-08Jan-09Feb-09Mar-09Apr-09May-09Jun-09Jul-09Aug-09Sep-09Oct-09Nov-09Dec-09Jan-10Feb-10Mar-10Apr-10May-10Jun-10Jul-10Aug-10Sep-10Oct-10Nov-10Dec-10Jan-11Feb-11Mar-11Apr-11May-11
Unem
ploym
entL
evel
Official Unemployment (U-3) Real Unemployment (U-6)
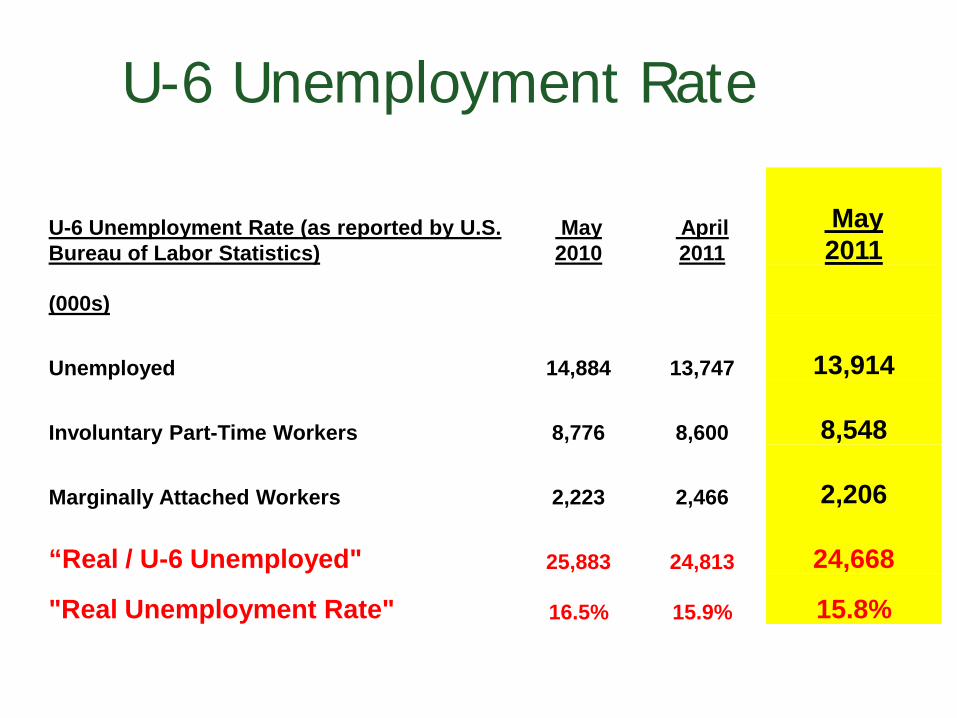
U-6 Unemployment Rate
U-6 Unemployment Rate (as reported by U.S. Bureau of Labor Statistics)
May 2010
April2011
May 2011
(000s)
Unemployed 14,884 13,747 13,914
Involuntary Part-Time Workers 8,776 8,600 8,548
Marginally Attached Workers 2,223 2,466 2,206
“Real / U-6 Unemployed" 25,883 24,813 24,668
"Real Unemployment Rate" 16.5% 15.9% 15.8%
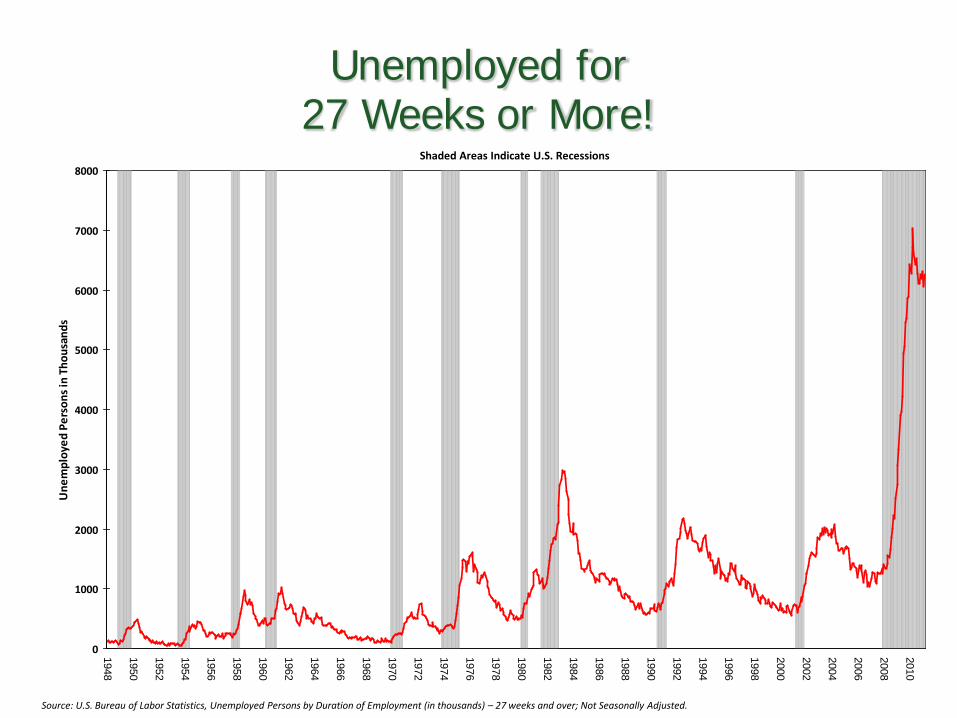
Unemployed for 27 Weeks or More!
0
1000
2000
3000
4000
5000
6000
7000
8000
1948
1950
1952
1954
1956
1958
1960
1962
1964
1966
1968
1970
1972
1974
1976
1978
1980
1982
1984
1986
1988
1990
1992
1994
1996
1998
2000
2002
2004
2006
2008
2010U
nem
ploy
ed P
erso
ns in
Tho
usan
ds
Source: U.S. Bureau of Labor Statistics, Unemployed Persons by Duration of Employment (in thousands) – 27 weeks and over; Not Seasonally Adjusted.
Shaded Areas Indicate U.S. Recessions
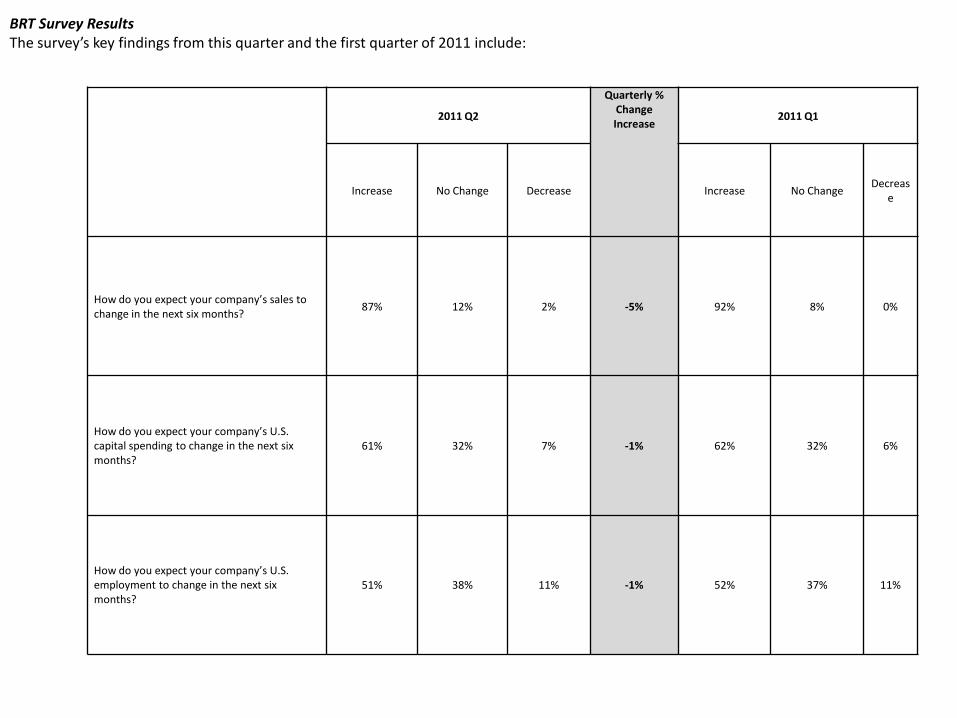
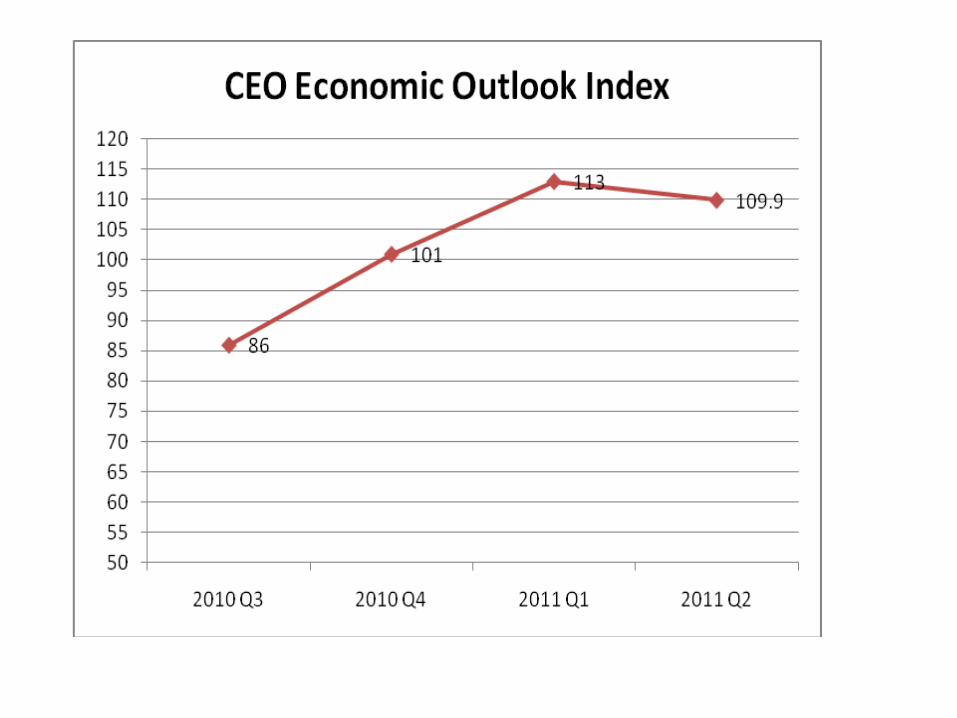
2011 Q2
Quarterly % Change Increase
2011 Q1
Increase No Change Decrease Increase No ChangeDecreas
e
How do you expect your company’s sales to change in the next six months?
87% 12% 2% -5% 92% 8% 0%
How do you expect your company’s U.S. capital spending to change in the next six months?
61% 32% 7% -1% 62% 32% 6%
How do you expect your company’s U.S. employment to change in the next six months?
51% 38% 11% -1% 52% 37% 11%
BRT Survey ResultsThe survey’s key findings from this quarter and the first quarter of 2011 include:
SOLUTIONS
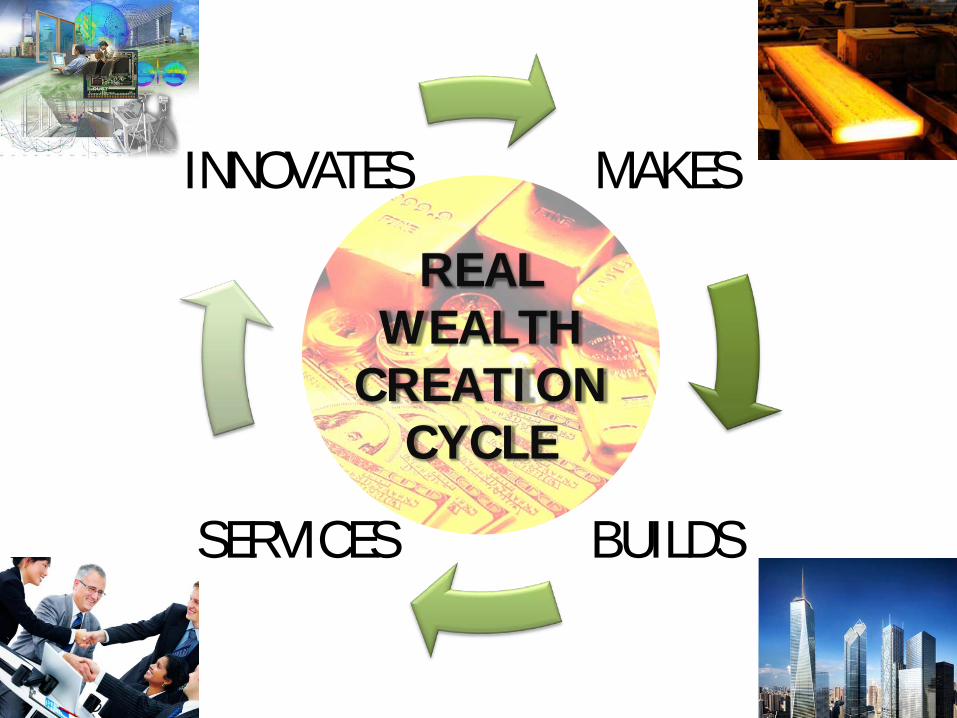
MAKES
BUILDSSERVICES
INNOVATESREAL
WEALTH CREATION
CYCLE
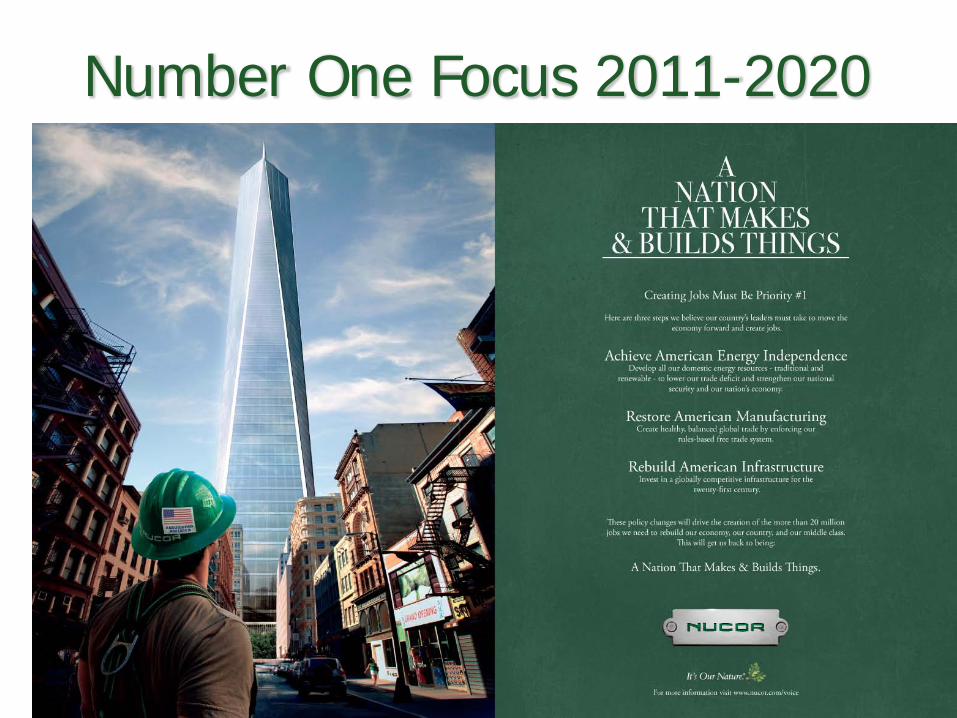
Number One Focus 2011-2020
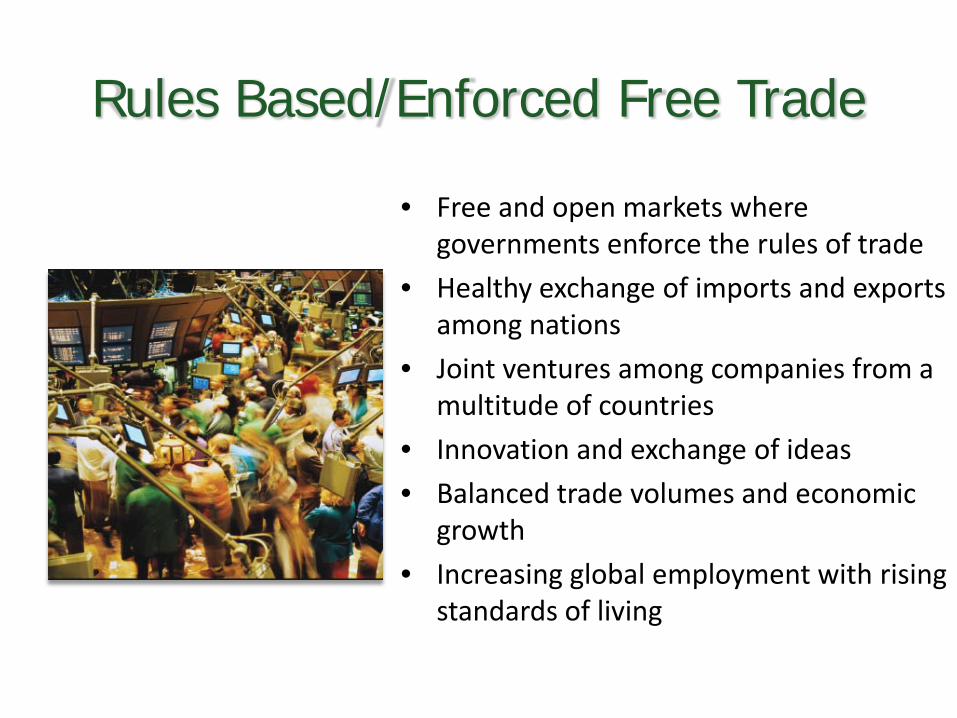
Rules Based/Enforced Free Trade
• Free and open markets where governments enforce the rules of trade
• Healthy exchange of imports and exports among nations
• Joint ventures among companies from a multitude of countries
• Innovation and exchange of ideas
• Balanced trade volumes and economic growth
• Increasing global employment with rising standards of living
BARRIERS TO SOLUTIONS
• INTERNAL—MULTIPLE, SELF-INFLICTED
• EXTERNAL—TRADE MERCANTILISM, SOE’s
WORLD STEEL ASSOCIATION ANNUAL MEETING-PANELTHE 3 GREATEST CHALLENGES FACING THE GLOBAL
STEEL INDUSTRY OVER THE NEXT 10 YEARS
• SOE’s
• RAW MATERIAL/COMMODITY PRICES
• ENVIRONMENTAL ISSUES---CARBON, etc.
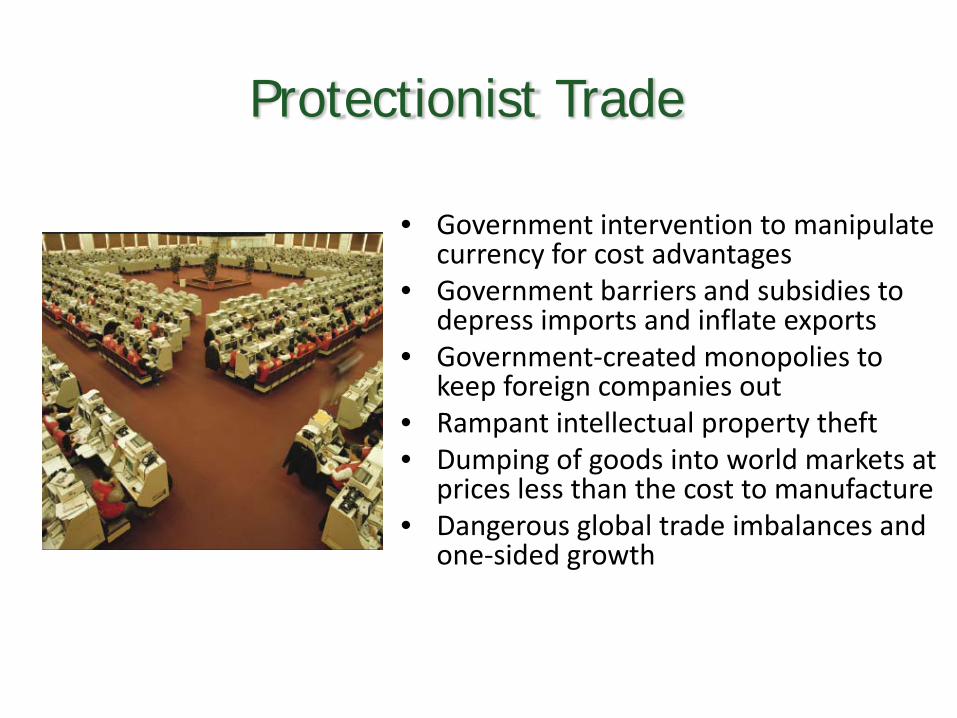
Protectionist Trade
• Government intervention to manipulate currency for cost advantages
• Government barriers and subsidies to depress imports and inflate exports
• Government-created monopolies to keep foreign companies out
• Rampant intellectual property theft• Dumping of goods into world markets at
prices less than the cost to manufacture• Dangerous global trade imbalances and
one-sided growth
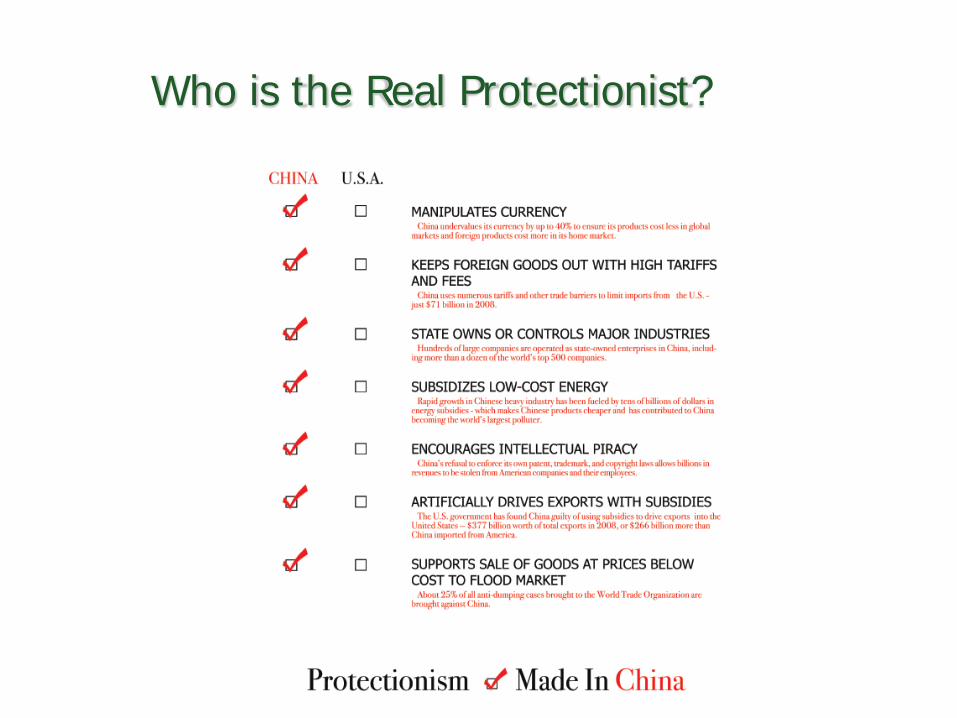
Who is the Real Protectionist?
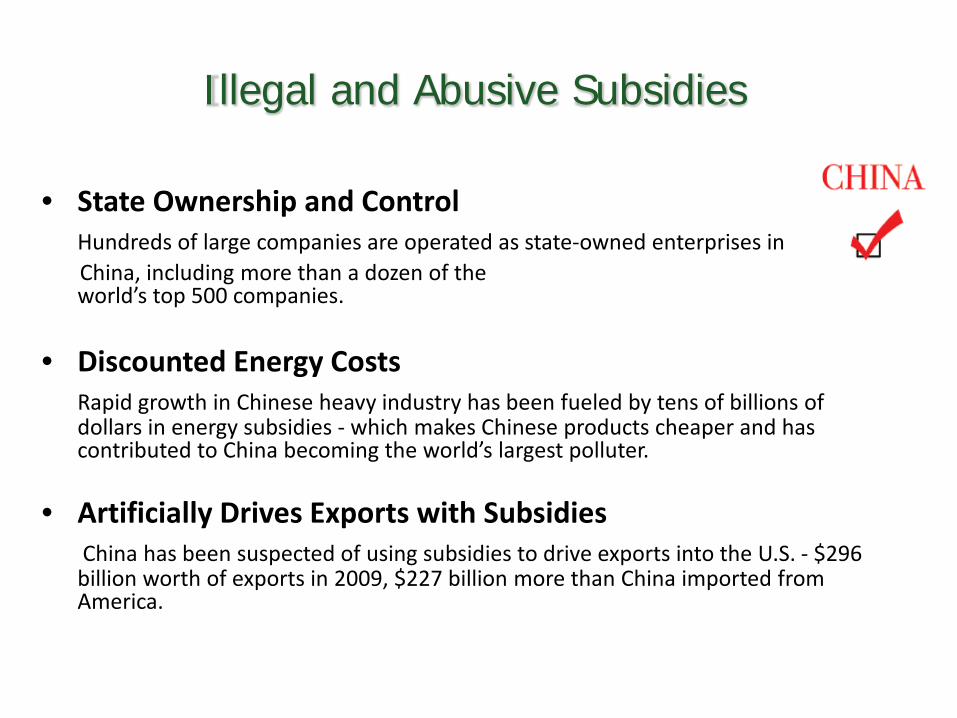
Illegal and Abusive Subsidies
• State Ownership and ControlHundreds of large companies are operated as state-owned enterprises in China, including more than a dozen of the world’s top 500 companies.
• Discounted Energy CostsRapid growth in Chinese heavy industry has been fueled by tens of billions of dollars in energy subsidies - which makes Chinese products cheaper and has contributed to China becoming the world’s largest polluter.
• Artificially Drives Exports with SubsidiesChina has been suspected of using subsidies to drive exports into the U.S. - $296 billion worth of exports in 2009, $227 billion more than China imported from America.
• SOE’s—State Owned Enterprises
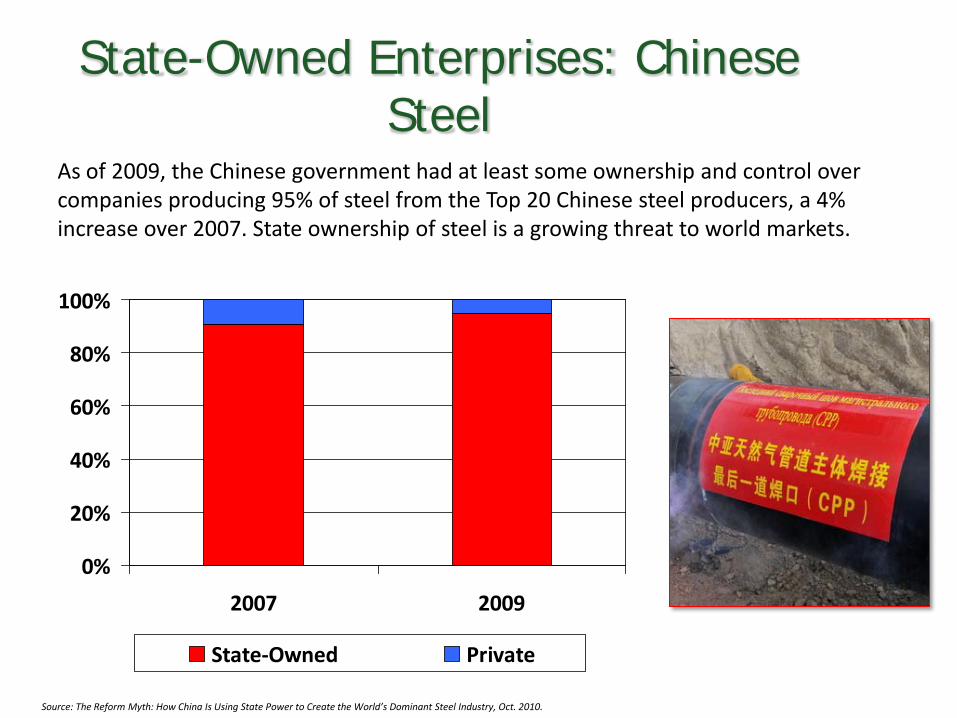
State-Owned Enterprises: Chinese Steel
As of 2009, the Chinese government had at least some ownership and control over companies producing 95% of steel from the Top 20 Chinese steel producers, a 4% increase over 2007. State ownership of steel is a growing threat to world markets.
Source: The Reform Myth: How China Is Using State Power to Create the World’s Dominant Steel Industry, Oct. 2010.
0%
20%
40%
60%
80%
100%
2007 2009
State-Owned Private
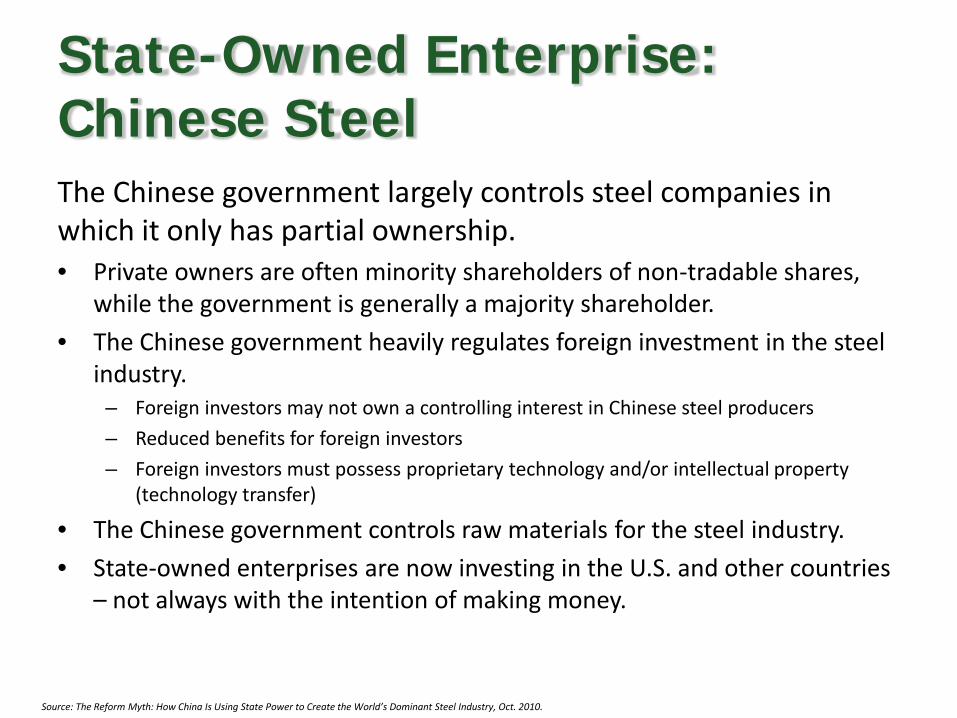
The Chinese government largely controls steel companies in which it only has partial ownership.• Private owners are often minority shareholders of non-tradable shares,
while the government is generally a majority shareholder.
• The Chinese government heavily regulates foreign investment in the steel industry.
– Foreign investors may not own a controlling interest in Chinese steel producers
– Reduced benefits for foreign investors
– Foreign investors must possess proprietary technology and/or intellectual property (technology transfer)
• The Chinese government controls raw materials for the steel industry.
• State-owned enterprises are now investing in the U.S. and other countries – not always with the intention of making money.
State-Owned Enterprise: Chinese Steel
Source: The Reform Myth: How China Is Using State Power to Create the World’s Dominant Steel Industry, Oct. 2010.
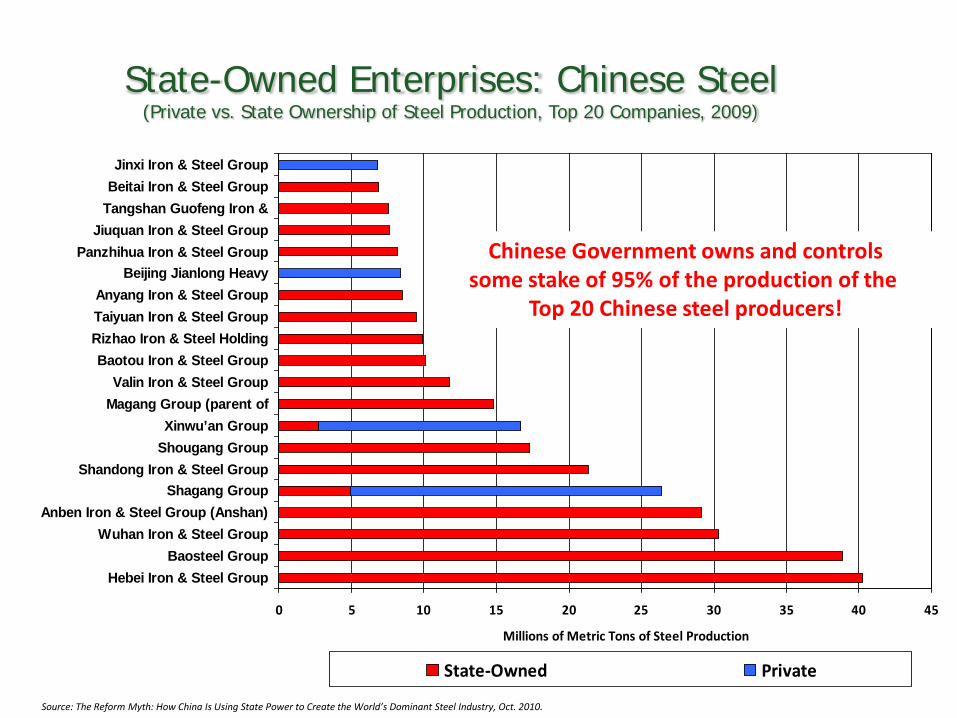
State-Owned Enterprises: Chinese Steel(Private vs. State Ownership of Steel Production, Top 20 Companies, 2009)
0 5 10 15 20 25 30 35 40 45
Hebei Iron & Steel GroupBaosteel Group
Wuhan Iron & Steel GroupAnben Iron & Steel Group (Anshan)
Shagang GroupShandong Iron & Steel Group
Shougang GroupXinwu’an Group
Magang Group (parent ofValin Iron & Steel Group
Baotou Iron & Steel GroupRizhao Iron & Steel HoldingTaiyuan Iron & Steel GroupAnyang Iron & Steel Group
Beijing Jianlong HeavyPanzhihua Iron & Steel Group
Jiuquan Iron & Steel GroupTangshan Guofeng Iron &Beitai Iron & Steel GroupJinxi Iron & Steel Group
Millions of Metric Tons of Steel Production
State-Owned Private
Chinese Government owns and controlssome stake of 95% of the production of the
Top 20 Chinese steel producers!
Source: The Reform Myth: How China Is Using State Power to Create the World’s Dominant Steel Industry, Oct. 2010.
Illegal and Abusive Subsidies
• State Ownership and ControlHundreds of large companies are operated as state-owned enterprises in China, including more than a dozen of the world’s top 500 companies.
• Discounted Energy CostsRapid growth in Chinese heavy industry has been fueled by tens of billions of dollars in energy subsidies - which makes Chinese products cheaper and has contributed to China becoming the world’s largest polluter.
• Artificially Drives Exports with SubsidiesChina has been suspected of using subsidies to drive exports into the U.S. - $296 billion worth of exports in 2009, $227 billion more than China imported from America.
• Foreign government subsidies are a major cause of overcapacity in the global steel
industry and steel-related industries
• Subsidies to steel and steel-related industries that 1) support inefficient and excess
capacity and/or 2) distort trade; are continuing, and remain a strong concern
• Examples include:
– Fundamental currency misalignment/undervalued currencies
– Preferential financing to add new capacity
– Loan forgiveness/equity infusions to prop up obsolete capacity
Steel
40
RAW MATERIALS
BARRIERS TO OPEN MARKETS
• Governments, including China, Russia, the Ukraine and
India, have become increasingly involved in the race for raw
materials.
•These governments provide subsidized government
investment, and control the movement of raw materials
through trade barriers, most of which directly violate WTO
agreements.
NUCOR
Raw Materials
Rules Associated with Raw Material Cost and Availability is a top Issue for U.S. Steel Producers
• Many countries continue to impose a variety of restrictions on exports of vital raw materials
– Export prohibitions
– Export duties
– Export quotas
– Other measures
• Trade-distorting restrictions on exports of raw materials
– Give domestic producers in the exporting country an unfair advantage
– Increase worldwide costs of production
– Place a heavy burden on steel industries in developing countries that do not have substantial iron ore reserves or steel scrap supplies
Raw Materials
43