nsw economic update spring 2017 - parliament of nsw · • nsw economic update: ... lifting...
TRANSCRIPT

NSW Economic Update Spring 2017
Statistical Indicators 05/17 By Chris Angus

RELATED PUBLICATIONS
• NSW Economic Update: Winter 2017, NSW Parliamentary Research Service Statistical Indicators 03/2017 by Chris Angus
• NSW Economic Update: Autumn 2017, NSW Parliamentary Research Service Statistical Indicators 02/2017 by Chris Angus
ISSN 1838-0190
October 2017
© 2017
Except to the extent of the uses permitted under the Copyright Act 1968, no part of this document may be reproduced or transmitted in any form or by any means including information storage and retrieval systems, without the prior consent from the Manager, NSW Parliamentary Research Service, other than by Members of the New South Wales Parliament in the course of their official duties.
NSW Economic Update Spring 2017
by
Chris Angus
NSW PARLIAMENTARY RESEARCH SERVICE
Matthew Dobson (BA (Psych Hons), PhD), Manager, Health, Media and Communications ............................. (02) 9230 2356 Daniel Montoya (BEnvSc (Hons), PhD), Senior Research Officer, Environment/Planning ......................... (02) 9230 2003 Lenny Roth (BCom, LLB), Senior Research Officer, Law ....................................................... (02) 9230 2768 Christopher Angus (BA(Media&Comm), LLM(Juris Doctor)), Research Officer, Law .................................................................. (02) 9230 2906 Laura Ismay (BIGS, GCert Mig Law), Research Officer, Law .................................................................. (02) 9230 2484 Tom Gotsis (BA, LLB, Dip Ed, Grad Dip Soc Sci) Research Officer, Law .................................................................. (02) 9230 3085 John Wilkinson (MA, PhD), Research Officer, Economics ...................................................... (02) 9230 2006
Should Members or their staff require further information about this publication please contact the author.
Information about Research Publications can be found online.
Advice on legislation or legal policy issues contained in this paper is provided for use in parliamentary debate and for related parliamentary purposes. This paper is not professional legal opinion.

CONTENTS
Summary ............................................................................................................ 2
Interest rates ...................................................................................................... 7
State demand and gross state product ............................................................... 8
Household Consumption .................................................................................... 9
Business investment ........................................................................................ 11
Exchange rate .................................................................................................. 12
International trade ............................................................................................ 13
Consumer price index ...................................................................................... 15
Employment ..................................................................................................... 16
Unemployment, underemployment and underutilisation ................................... 17
Youth unemployment ....................................................................................... 19
Labour force participation ................................................................................. 20
Job Vacancies .................................................................................................. 21
Wages .............................................................................................................. 22
Bankruptcies ..................................................................................................... 23
Mineral exploration expenditure ....................................................................... 24
Turnover of retail trade ..................................................................................... 25
Vehicle sales .................................................................................................... 26
House prices .................................................................................................... 27
Dwelling approvals ........................................................................................... 28
Housing finance ................................................................................................ 29
Rent .................................................................................................................. 31
Glossary ........................................................................................................... 32

NSW Economic Update Spring 2017
2
SUMMARY
The state of the NSW economy
For the seventh consecutive quarter, New South Wales has been the best performing State in Australia. Commsec’s October 2017 State of the States Report found that NSW retained its top ranking on retail trade, and dwelling starts, and is now top on equipment investment and unemployment. In fact, the lowest ranking for the state—housing finance—is third after the ACT and Victoria.
The NSW 2017-18 Budget Papers reported that the State economy outperformed the rest of the nation in 2016-17 and forecast a similar performance in 2017-18, with above-trend economic growth forecast over the next three years:
• In 2017-18, Gross State Product (GSP) is forecast to rise by 3 per cent. Above-trend growth of 2¾ per cent is anticipated in 2018-19 and 2019-20. The new GSP outlook is a ¼ of a percentage point stronger in all years than was expected at the 2016-17 Half-Yearly Review (HYR).
• Business investment, public infrastructure and dwelling construction are all showing significant strength, lifting construction activity and employment to record levels. The State’s $72.7 billion, four-year infrastructure program is expected to boost economic growth by an average of ½ a percentage point a year over the next two years.
• The labour market is forecast to improve in line with the strength in economic activity, with above-trend employment growth of 1¾ per cent forecast for 2017-18 and 2018-19. The unemployment rate is expected to remain low at slightly under 5 per cent over the next two years.1
Based on the latest quarterly movements,2 the strengthened and weakened areas of the NSW economy are summarised in the following table. It should be noted that these indicators are subject to cyclical variations and may not be completely illustrative of a fundamental shift in economic growth.
Stronger Weaker State final demand (up 0.7%)
Unemployment rate (down 0.1%)
Mining investment (up 11.4%)
Business investment (no change)
Gross State Product (up 3.5%)
Youth unemployment (down 0.2%) Retail trade (up 1.0%) Business investment (no
change) Household consumption (up 0.8%)
Participation rate (up 0.3%)
Motor vehicle sales (up 0.6%) Bankruptcies (up 0.4%)
Trade deficit (down $97m)
Job vacancies (up 9.7%)
Dwelling approvals (up 2.7%)
Sydney median house price (down 0.3%)
Employment (up 0.9%) Wages (up 0.3%) Housing finance (up 9.6%)
1 NSW Treasury, Budget Paper No 1: Budget Statement, 2017-18, p 3-1. 2 For the most recent quarter in which data is available. Note that rolling averages are excluded from this table.

NSW Economic Update Spring 2017
3
The state of the Australian economy
The Reserve Bank of Australia’s (RBA) national economic growth forecasts have lowered slightly since that reported in May 2017.
In its August 2017 Statement on Monetary Policy, the RBA forecast Gross Domestic Product (GDP) growth to be in the 2-3% range by December 2017, increasing to 2.75-3.75% by December 2018.3 Short term growth estimates were lower than those made in previous forecasts, which had anticipated GDP growth of 2.5-3.5% by December 2017.
Key factors which may influence national growth over the forecast period, as outlined by the RBA, include:4
• An end to the drag on domestic activity caused by falls in investment in the resources sector, expected by the second half of next year;
• Rising resource exports, supported by higher production from Australia’s low-cost iron ore producers and the ramp-up in liquefied natural gas production;
• Stronger growth in household consumption and household disposable income;
• Falling levels of residential building work and minimal GDP growth from dwelling investment over the forecast period; and
• A gradual pickup in wage growth over 2018 and 2019, although growth will continue to be affected by ongoing spare capacity5 in the labour market.
The financial sector has made diverging forecasts as to future economic growth in the coming financial years. The Commonwealth Bank has forecast GDP growth of 2.8% over the 2017-18 financial year, and 3.1% in 2018-19. In contrast, NAB has forecast economic growth of 3.2% for 2017-18, falling to 2.5% the following fiscal year. Similarly, BIS Shrapnel anticipates GDP growth of 2.5% in 2018, reducing slightly to 2.3% in 2019.
Despite these forecasts, there are concerns that GDP growth does not accurately reflect the state of the Australian economy. As noted in the previous Economic Update, the Commonwealth Bank has reported that while strong population growth has boosted Australia’s aggregate growth rate—more people means more spending—GDP per capita growth has stagnated, growing by just 0.2% in the year to March 2017. The CBA argued that, in order to achieve better outcomes for households, policymakers must place greater emphasis on measures of living standards (i.e. GDP per capita) rather than aggregate growth rates.6
3 Reserve Bank of Australia, Statement on Monetary Policy, August 2017, p 61. 4 Ibid p 60-63. 5 See Glossary. For a detailed overview, see: Ballantyne A, De Voss D and Jacobs D, Unemployment and Spare Capacity in the Labour Market, Reserve Bank of Australia, September 2014. 6 Aird G, An update on how the Australian economy looks on a per capita basis, Commonwealth Bank, 12 July 2017, p 1.

NSW Economic Update Spring 2017
4
Commentary: Descending the dwelling approval heights
2016 saw record levels of residential dwelling approvals in NSW, with an average of 6,725 approvals granted each month during the June 2016 quarter. These approvals subsequently created a construction boom in the State.
According to NAB’s October 2017 State Economic Handbook, construction activity has been a major driver of growth and employment in NSW. The Commonwealth Bank gave a detailed overview of events leading up to the construction boom, and the various benefits that accrue:
Residential construction tends to be very sensitive to interest rates. So falling interest rates from late 2011, combined with strong population growth, increased foreign demand and pent up demand from underbuilding in previous years meant that a boom was inevitable. This building boom came at a very beneficial time and helped to offset some of the negative effects from the decline in business investment as the mining construction boom wound down. … A typical residential construction upturn has both direct and second-round benefits. The direct benefits include the additional building activity as well as the jobs created to undertake the additional building work. Second-round benefits include additional spending elsewhere in the economy as a result of this new construction employment. For example, spending on furnishings and household appliances for use in the new dwellings. And then the additional employment as a result of this spending.7
Unfortunately, it appears that all good things must come to an end. As of June 2017, the average monthly number of dwellings approved in NSW had fallen to 5,755 approvals: a 14.4% drop compared to 12 months earlier. This was the second largest annual fall after Queensland (-17.5%), and slightly above the national fall reported over the same period (-13.8%).
However, the Commonwealth Bank has commented that, despite the recent falls, NSW approval levels remain at relatively high levels (see above right).
In its August 2017 Statement on Monetary Policy, the RBA commented that the decline in building approvals likely reflects a number of factors, including:8
• Moderation of demand for off-the-plan apartments (partly reflecting weaker demand from foreign buyers); and
7 Commonwealth Bank, Residential construction: will boom lead to bust?, 15 August 2017, p 1-2. 8 Reserve Bank of Australia, Statement on Monetary Policy, August 2017, p 35.
3000
4000
5000
6000
7000
Jun-
2012
Nov
-201
2
Apr-
2013
Sep-
2013
Feb-
2014
Jul-2
014
Dec-
2014
May
-201
5
Oct
-201
5
Mar
-201
6
Aug-
2016
Jan-
2017
Jun-
2017
NSW dwelling approvals, Jun 2012 to Jun 2017
Source: ABS 8731.0
NSW Economic Update Spring 2017
5
• Developers experiencing tightening access to bank finance, particularly in geographic regions at risk of oversupply.
St George Bank affirmed the RBA’s view that the decline in approvals reflects a pullback in unit approvals, and also commented that tighter conditions on home lending have negatively impacted on demand, which in time will flow on to weaker residential construction.
The fall in approvals will eventually lead to a fall in dwelling construction: as noted by observers, there are emerging signs that a peak in housing construction may soon arrive, with the consequence that residential construction will likely have less of an impact on economic growth than experienced in recent years.9
The RBA forecasts an ongoing slowdown in approvals, with future contributions to GDP growth from dwelling investment expected to be minimal.10 Similarly, BIS Oxford Economics has predicted that, along with falls in investment and weakness in consumer spending, moderation in residential construction activity will hold back domestic demand in the short term. NAB has also noted that the potential oversupply of apartments remains a concern, although apartment approvals are returning to more sustainable levels.
The good news is that this slowdown is likely to be gradual and reasonably shallow, with an ongoing high level of residential construction reducing the risk of a large drag on the economy.11 NSW is in an especially good position to withstand the negative consequences of a slowdown, as explained by Commonwealth Bank:12
• While the jobs downturn will be largest in NSW and other eastern States, high population growth and a strong labour market will minimise disruption;
• NSW has seen a lift in non-residential building approvals, which may provide a partial offset to some of the jobs losses in residential construction; and
• There remains a large pipeline of infrastructure spending still to come which should also add to jobs growth, especially construction.
BIS Oxford Economics also believes that private non-dwelling building will grow strongly over the next two years as a result of Sydney office construction, hotel building and casino investments, work on airport terminals and, to a lesser extent, retail investment.
9 NAB, State Handbook: New South Wales, October 2017, p 3; St George Bank, Building Approvals: In a Holding Pattern For Now, 3 October 2017. 10 Ibid p 62. 11 Commonwealth Bank, Building approvals – August 2017, 3 October 2017; St George Bank, Building Approvals: In a Holding Pattern For Now, 3 October 2017. 12 Commonwealth Bank, Residential construction: will boom lead to bust?, 15 August 2017, p 2-3.
NSW Economic Update Spring 2017
6
About the paper
This paper presents statistical information on key economic indicators, providing an updated snapshot of the NSW economy and relevant points of comparison with other Australian States and Territories. Statistics are updated to the end of the most recent quarter available. Most indicators have been updated to include the June or September 2017 quarters.
Data sources used
Data presented in this paper is primarily sourced from the Australian Bureau of Statistics (ABS). Sources other than the ABS have been used where relevant and are identified in the paper. Analysis and forecasts from the RBA and major private banks (including Westpac, NAB, the Commonwealth Bank and St George Bank) are also presented.
The Economic Update presents ABS trend estimates where available; trend data is preferred by the ABS for the analysis of monthly or quarterly changes, as they remove potentially misleading seasonal patterns, residual noise and irregular influences. All ABS data are trend estimates unless otherwise identified as original or seasonally adjusted data.

NSW Economic Update Spring 2017
7
INTEREST RATES
As of October 2017, the RBA has held the cash rate at 1.5%: it has remained at this level since August 2016. In assessing whether to adjust the cash rate, the RBA Board considers strengths and weaknesses in the domestic economy, as well as international economic factors. The RBA Board noted a range of factors influencing the Australian economy in their October meeting.
The Board noted that, in line with the Bank’s forecasts, the Australian economy grew by 0.8% over the June quarter. The Board stated that the impacts of reduced mining investment had mostly passed: indeed, because of recent increases in resource exports, the mining sector had actually contributed to overall growth.
Although wage growth remained limited, the Board expected wages to increase gradually as spare capacity13 in the labour market diminished, leading to a gradual rise in inflation over time. The Board also expressed some concern over housing debt, commenting that this debt had outpaced slow growth in household incomes for some time.
After considering available information, the Board judged that holding the stance of monetary policy unchanged at this meeting would be consistent with sustainable growth in the economy and achieving the inflation target over time.
While the Board noted that overseas central banks were reducing the degree of monetary stimulus or were considering doing so, monetary policy in Australia would ultimately be dependent on domestic economic conditions.
The Commonwealth Bank has commented that weak wage growth and a cooling in house price and lending growth will likely result in the cash rate remaining on hold until well into 2018. NAB and St George Bank also expect the cash rate to remain at 1.5% into 2018, while Westpac and BIS Oxford Economics forecast the cash rate to remain unchanged until mid-2019. However, chief economist at Goldman Sachs, Andrew Boak, has taken the contrary position that the RBA will raise interest rates in February 2018.
13 Essentially, that there are more workers than available jobs for them to fill.
%
1
2
3
4
Sep-
12De
c-12
Mar
-13
Jun-
13Se
p-13
Dec-
13M
ar-1
4Ju
n-14
Sep-
14De
c-14
Apr-
15Ju
l-15
Oct
-15
Jan-
16Ap
r-16
Jul-1
6O
ct-1
6Ja
n-17
Apr-
17Ju
l-17
Cash rate target
Source: RBA
NSW Economic Update Spring 2017
8
STATE DEMAND AND GROSS STATE PRODUCT
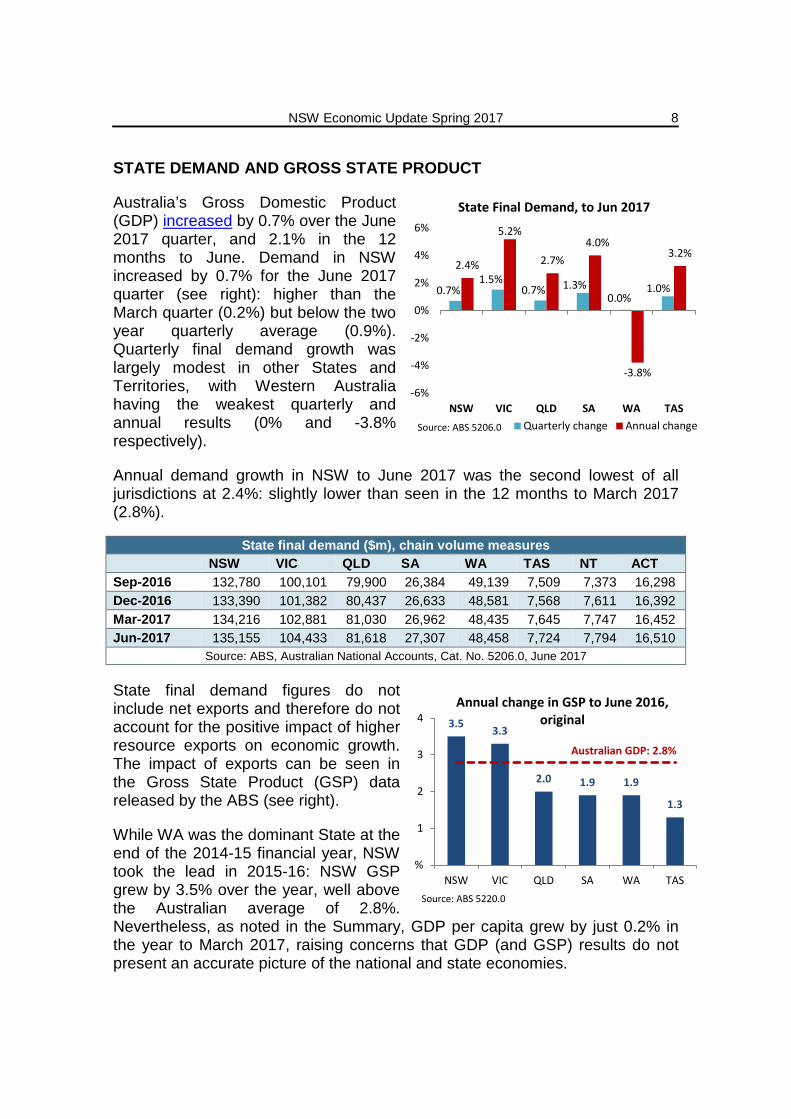
Australia’s Gross Domestic Product (GDP) increased by 0.7% over the June 2017 quarter, and 2.1% in the 12 months to June. Demand in NSW increased by 0.7% for the June 2017 quarter (see right): higher than the March quarter (0.2%) but below the two year quarterly average (0.9%). Quarterly final demand growth was largely modest in other States and Territories, with Western Australia having the weakest quarterly and annual results (0% and -3.8% respectively).
Annual demand growth in NSW to June 2017 was the second lowest of all jurisdictions at 2.4%: slightly lower than seen in the 12 months to March 2017 (2.8%).
State final demand figures do not include net exports and therefore do not account for the positive impact of higher resource exports on economic growth. The impact of exports can be seen in the Gross State Product (GSP) data released by the ABS (see right).
While WA was the dominant State at the end of the 2014-15 financial year, NSW took the lead in 2015-16: NSW GSP grew by 3.5% over the year, well above the Australian average of 2.8%. Nevertheless, as noted in the Summary, GDP per capita grew by just 0.2% in the year to March 2017, raising concerns that GDP (and GSP) results do not present an accurate picture of the national and state economies.
State final demand ($m), chain volume measures
NSW VIC QLD SA WA TAS NT ACT Sep-2016 132,780 100,101 79,900 26,384 49,139 7,509 7,373 16,298 Dec-2016 133,390 101,382 80,437 26,633 48,581 7,568 7,611 16,392 Mar-2017 134,216 102,881 81,030 26,962 48,435 7,645 7,747 16,452 Jun-2017 135,155 104,433 81,618 27,307 48,458 7,724 7,794 16,510
Source: ABS, Australian National Accounts, Cat. No. 5206.0, June 2017
3.5 3.3
2.0 1.9 1.9
1.3
%
1
2
3
4
NSW VIC QLD SA WA TAS
Annual change in GSP to June 2016, original
Source: ABS 5220.0
Australian GDP: 2.8%
0.7% 1.5%
0.7% 1.3% 0.0%
1.0%
2.4%
5.2%
2.7% 4.0%
-3.8%
3.2%
-6%
-4%
-2%
0%
2%
4%
6%
NSW VIC QLD SA WA TAS
State Final Demand, to Jun 2017
Quarterly change Annual changeSource: ABS 5206.0

NSW Economic Update Spring 2017
9
HOUSEHOLD CONSUMPTION
Nationally, household consumption grew by 0.7% over the June 2017 quarter. This was slightly above the five year average of 0.6% (see right). Household spending increased in NSW by 0.8% over the quarter: the second highest of all States after Victoria (see below right). On an annual basis, NSW consumption increased by 2.7%: again, the highest growth rate after Victoria (3.5%).
Household final consumption ($m), chain volume measures
NSW VIC QLD SA WA TAS NT ACT Sep-2016 80,452 59,284 46,158 15,646 25,708 4,466 2,665 4,157 Dec-2016 80,974 59,828 46,469 15,742 25,755 4,455 2,691 4,179 Mar-2017 81,588 60,397 46,756 15,838 25,817 4,453 2,725 4,205 Jun-2017 82,203 60,942 47,006 15,928 25,890 4,460 2,758 4,232
Source: ABS, Australian National Accounts, Cat. No. 5206.0, June 2017
Analysts have noted that household consumption has made positive contributions to economic growth. The RBA noted in its August 2017 Statement on Monetary Policy that despite slowing in the March quarter, household consumption was likely to strengthen in the period ahead. However, St George Bank commented that the 0.7% quarterly growth rate was weaker than expected given retail spending had the strongest June quarter results in over four years.
The Commonwealth Bank also noted that weak wages growth has meant that households are lowering their savings in order to maintain spending growth, which may weigh on further growth in household spending.
Gross State Product ($m), chain volume measures, original
NSW VIC QLD SA WA TAS NT ACT Jun-2012 479,485 346,133 288,233 94,897 216,029 25,112 19,001 33,398 Jun-2013 488,691 349,871 295,096 96,483 228,425 24,925 21,999 34,278 Jun-2014 500,306 352,512 304,874 97,336 241,579 25,370 22,591 34,567 Jun-2015 513,529 361,669 308,448 99,237 250,377 25,695 23,032 35,029 Jun-2016 531,323 373,624 314,569 101,096 255,214 26,039 23,648 36,225
Source: ABS, Australian National Accounts, Cat. No. 5220.0, June 2016
0.6%
0.0%
0.5%
1.0%
Jun-
2012
Sep-
2012
Dec-
2012
Mar
-201
3Ju
n-20
13Se
p-20
13De
c-20
13M
ar-2
014
Jun-
2014
Sep-
2014
Dec-
2014
Mar
-201
5Ju
n-20
15Se
p-20
15De
c-20
15M
ar-2
016
Jun-
2016
Sep-
2016
Dec-
2016
Mar
-201
7Ju
n-20
17
National household consumption Quarterly change5 year quarterly average
Source: ABS 5206.0
0.8% 0.9% 0.5% 0.6%
0.3% 0.2%
2.7%
3.5%
2.4% 2.4%
1.0%
-0.4% -1%
0%
1%
2%
3%
4%
NSW VIC QLD SA WA TAS
Household consumption, to Jun 2017
Quarterly change Annual changeSource: ABS 5206.0
NSW Economic Update Spring 2017
10
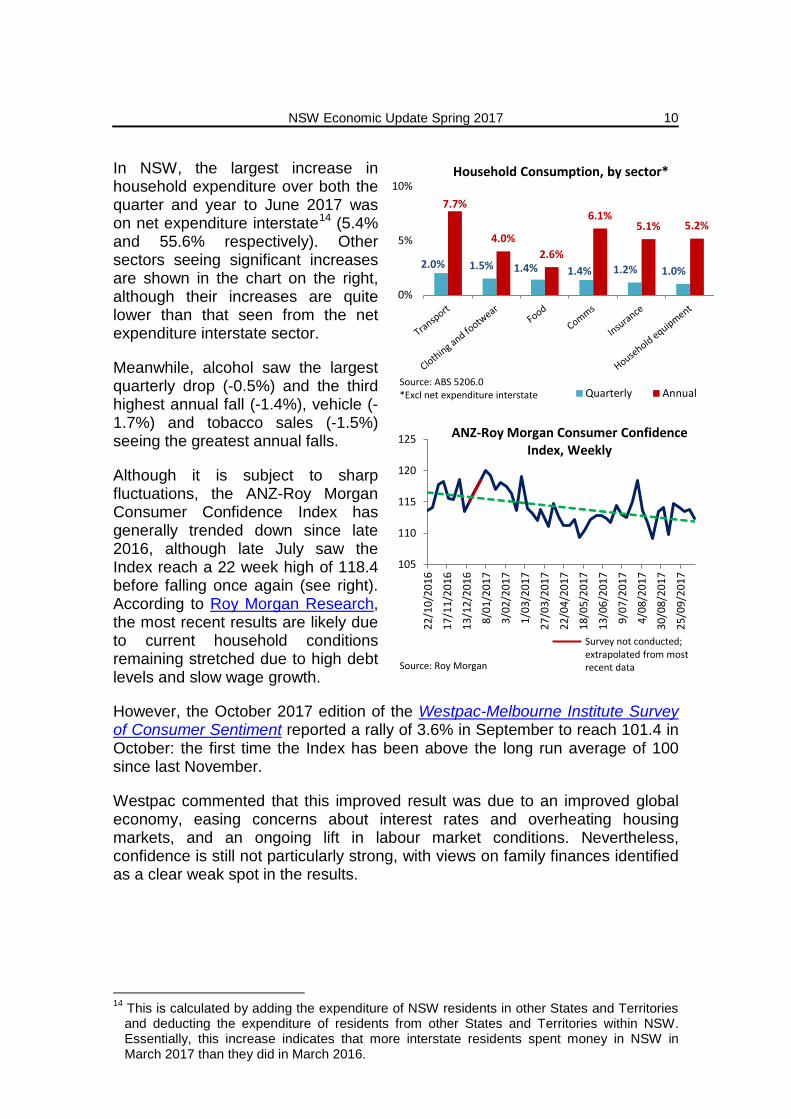
In NSW, the largest increase in household expenditure over both the quarter and year to June 2017 was on net expenditure interstate14 (5.4% and 55.6% respectively). Other sectors seeing significant increases are shown in the chart on the right, although their increases are quite lower than that seen from the net expenditure interstate sector.
Meanwhile, alcohol saw the largest quarterly drop (-0.5%) and the third highest annual fall (-1.4%), vehicle (-1.7%) and tobacco sales (-1.5%) seeing the greatest annual falls.
Although it is subject to sharp fluctuations, the ANZ-Roy Morgan Consumer Confidence Index has generally trended down since late 2016, although late July saw the Index reach a 22 week high of 118.4 before falling once again (see right). According to Roy Morgan Research, the most recent results are likely due to current household conditions remaining stretched due to high debt levels and slow wage growth.
However, the October 2017 edition of the Westpac-Melbourne Institute Survey of Consumer Sentiment reported a rally of 3.6% in September to reach 101.4 in October: the first time the Index has been above the long run average of 100 since last November.
Westpac commented that this improved result was due to an improved global economy, easing concerns about interest rates and overheating housing markets, and an ongoing lift in labour market conditions. Nevertheless, confidence is still not particularly strong, with views on family finances identified as a clear weak spot in the results.
14 This is calculated by adding the expenditure of NSW residents in other States and Territories
and deducting the expenditure of residents from other States and Territories within NSW. Essentially, this increase indicates that more interstate residents spent money in NSW in March 2017 than they did in March 2016.
2.0% 1.5% 1.4% 1.4% 1.2% 1.0%
7.7%
4.0% 2.6%
6.1% 5.1% 5.2%
0%
5%
10%Household Consumption, by sector*
Quarterly AnnualSource: ABS 5206.0 *Excl net expenditure interstate
105
110
115
120
12522
/10/
2016
17/1
1/20
16
13/1
2/20
16
8/01
/201
7
3/02
/201
7
1/03
/201
7
27/0
3/20
17
22/0
4/20
17
18/0
5/20
17
13/0
6/20
17
9/07
/201
7
4/08
/201
7
30/0
8/20
17
25/0
9/20
17
ANZ-Roy Morgan Consumer Confidence Index, Weekly
Source: Roy Morgan
Survey not conducted; extrapolated from most recent data

NSW Economic Update Spring 2017
11
BUSINESS INVESTMENT
Nationally, business investment increased by 1.0% over the June 2017 quarter, although falling 2.7% over the 12 months to June. Nevertheless, this is the third straight quarter of positive results, following 17 consecutive quarters of decline in business investment between September 2012 and 2016.
Compared to the national results, business investment in NSW saw no change during the June quarter—the third poorest result of all jurisdictions—and a -2.7% annual result to June. Meanwhile, most other States recorded growth in investment levels over the quarter (see above), with only Western Australia suffering a greater fall in annual investment levels (down 7.4% for the year, and -1.0% over the quarter).
Commercial lending data is another proxy for measuring business investment and related activity. While this data is susceptible to volatility, commercial finance data indicates that commercial lending has been growing steadily since March 2017 (see right).
However, business confidence has continued to trend downwards. According to Roy Morgan’s Business Confidence survey, business confidence fell by 1.0% to 113.2 in September 2017: below the seven year average of 116.3.15
15 Roy Morgan Research, Business Confidence down again to 113.2, 6 October 2017.
Business investment ($m), chain volume measures
NSW VIC QLD SA WA TAS NT ACT Sep-2016 15,056 11,071 10,011 2,658 9,951 605 2,229 629 Dec-2016 14,781 11,387 10,226 2,775 9,474 624 2,459 631 Mar-2017 14,645 11,698 10,410 2,926 9,308 654 2,597 626 Jun-2017 14,642 11,907 10,594 3,061 9,219 684 2,657 622
Source: ABS, Australian National Accounts, Cat. No. 5206.0, June 2017
0.0%
1.8% 1.8% 4.6%
-1.0%
4.6%
-2.7%
7.6% 5.8%
15.2%
-7.4%
13.1%
-10%
0%
10%
20%
NSW VIC QLD SA WA TAS
Business investment, to Jun 2017
Quarterly change Annual changeSource: ABS 5206.0
35
40
45
50
Aug-
2014
Oct
-201
4De
c-20
14Fe
b-20
15Ap
r-20
15Ju
n-20
15Au
g-20
15O
ct-2
015
Dec-
2015
Feb-
2016
Apr-
2016
Jun-
2016
Aug-
2016
Oct
-201
6De
c-20
16Fe
b-20
17Ap
r-20
17Ju
n-20
17Au
g-20
17
Commercial lending, Australia ($b)
Source: ABS 5671.0
Apr 2015: commercial lending peak

NSW Economic Update Spring 2017
12
EXCHANGE RATE
The Australian dollar (AUD) remained steady over the past three months, hovering between 0.78-0.81 USD. However, following weaker-than-expected quarterly inflation results (see Consumer Price Index chapter), the AUD dropped to 0.772 USD as of 25 October 2017.
The trade-weighted index (TWI) used to measure the AUD’s value relative to the currencies of Australia's trading partners,16 has largely tracked the currency’s fluctuations (see right).
The RBA commented in its August 2017 Statement on Monetary Policy that falling levels of international unemployment could lead to unexpected increases in inflation in these countries, consequently reducing the value of the AUD. However, the RBA cautioned that were the dollar to appreciate for an extended period, Australia would see a slowdown in economic activity and inflation:
The Australian dollar has appreciated by 5 per cent on a trade-weighted basis since the May Statement, and by 7 per cent against the US dollar. This has been incorporated into the current forecasts. It is possible that the Australian dollar could appreciate further, which if sustained, would be expected to result in a slower pick-up in economic activity and inflation than currently forecast. Based on historical relationships, a 10 per cent appreciation of the trade-weighted exchange rate (that is not associated with higher commodity prices) would be expected to lower year-ended inflation by a little less than ½ percentage point over each of the following two years or so. Output would be expect to be lower by ½–1 per cent in around two years’ time.17
The major banks have made variable forecasts for the AUD for the remainder of 2017 and into 2018. The Commonwealth Bank has forecast the AUD to rise to 0.80 USD by the end of the year, before slowly increasing to 0.87 USD by June 2019. Other banks are more cautious: Westpac expects the dollar to lower to 0.70 USD by June 2019, while NAB has predicted the AUD to remain around 0.75 USD through to September 2018.
16 Austrade, The dollar and competitiveness, February 2015; Reserve Bank of Australia, Glossary, no date [website – accessed 11 July 2017]. Note that the base level was set at 100 in May 1970. 17 Reserve Bank of Australia, Statement on Monetary Policy, August 2017, p 65-66.
60
65
70
0.65
0.7
0.75
0.8
0.85
26-O
ct-2
016
22-N
ov-2
016
19-D
ec-2
016
18-Ja
n-20
1715
-Feb
-201
714
-Mar
-201
710
-Apr
-201
710
-May
-201
706
-Jun-
2017
04-Ju
l-201
731
-Jul-2
017
28-A
ug-2
017
22-S
ep-2
017
20-O
ct-2
017
AUD/USD vs TWI, daily rates
USD (LHS) TWI (RHS)Source: RBA

NSW Economic Update Spring 2017
13
INTERNATIONAL TRADE
Since October 2016 Australia has reported monthly trade surpluses, although since reaching a peak surplus of $2.86 billion in February 2017 the surplus has since fallen to $740 million as of August (see right).
St George Bank has commented that the narrowing of trade surpluses largely reflects some retreat in commodity prices, which have a strong influence on trade outcomes.
However, due to higher oil prices and an increase in production capacity in recent years, St George Bank expects Australia’s trade position to remain reasonably well-supported over the medium term. Additionally, the Commonwealth Bank noted that the services trade balance is also shifting towards consistent surpluses as Australia sees higher levels of inbound tourism.
The remainder of this section presents, in turn, the most recent quarterly averages (June 2017); and the most recent three month rolling average and original monthly data (both August 2017). Note that in the case of Western Australia these figures are substantially different due to a large increase in the State’s exports in July 2017.
Following a 3.2% fall in the March 2017 quarter, the average monthly value of NSW merchandise exports increased by 7.1% in the June 2017 quarter to total $3.9 billion. This was the fourth highest quarterly increase after Tasmania (19.6%), Victoria (17.2%) and South Australia (9.7%), but above the Australian result (no change).
In contrast, imports grew less strongly over the quarter. Following a 6.4% drop in the March 2017 quarter, the average monthly value of NSW merchandise imports rose by 1.9% over the quarter to June to $8.6 billion. This was the second lowest State/Territory result after Western Australia (-1.6%, although the State saw a huge increase in July) and well below the national average of 9.9%.
-5-4-3-2-1$b
12345
Aug-
2012
Feb-
2013
Aug-
2013
Feb-
2014
Aug-
2014
Feb-
2015
Aug-
2015
Feb-
2016
Aug-
2016
Feb-
2017
Aug-
2017
National trade balance
Source: ABS 5368.0
NSW Economic Update Spring 2017
14
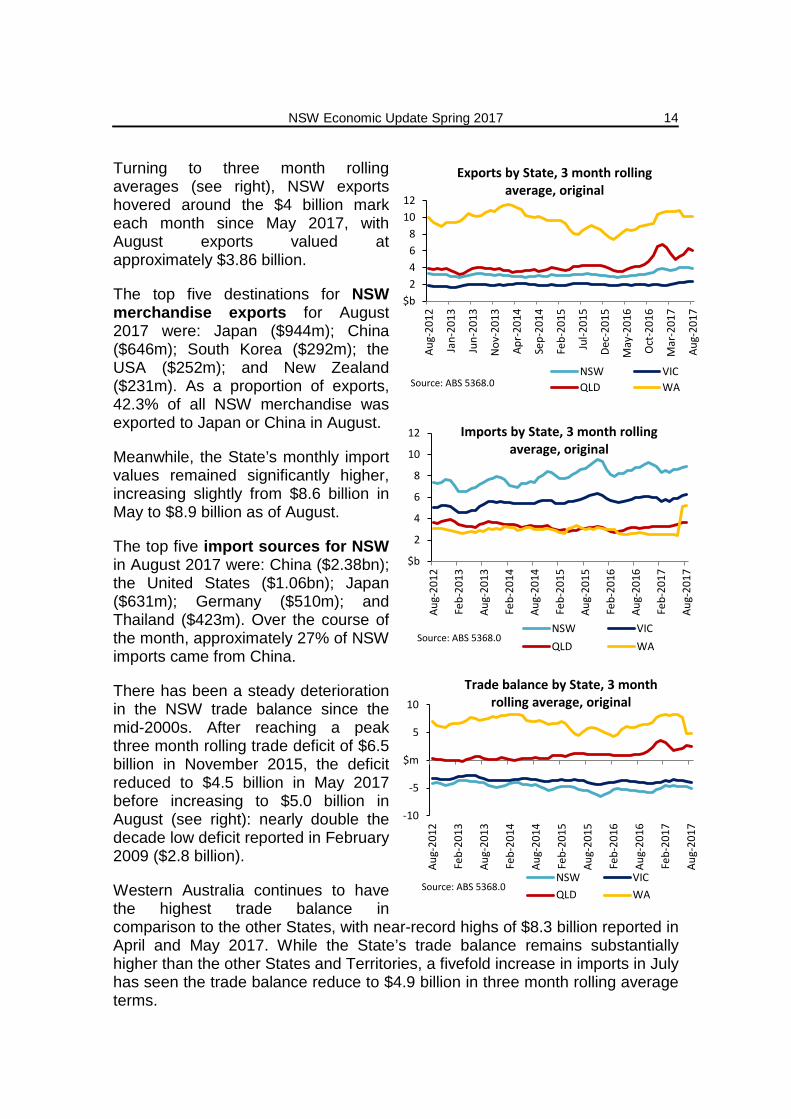
Turning to three month rolling averages (see right), NSW exports hovered around the $4 billion mark each month since May 2017, with August exports valued at approximately $3.86 billion.
The top five destinations for NSW merchandise exports for August 2017 were: Japan ($944m); China ($646m); South Korea ($292m); the USA ($252m); and New Zealand ($231m). As a proportion of exports, 42.3% of all NSW merchandise was exported to Japan or China in August.
Meanwhile, the State’s monthly import values remained significantly higher, increasing slightly from $8.6 billion in May to $8.9 billion as of August.
The top five import sources for NSW in August 2017 were: China ($2.38bn); the United States ($1.06bn); Japan ($631m); Germany ($510m); and Thailand ($423m). Over the course of the month, approximately 27% of NSW imports came from China.
There has been a steady deterioration in the NSW trade balance since the mid-2000s. After reaching a peak three month rolling trade deficit of $6.5 billion in November 2015, the deficit reduced to $4.5 billion in May 2017 before increasing to $5.0 billion in August (see right): nearly double the decade low deficit reported in February 2009 ($2.8 billion).
Western Australia continues to have the highest trade balance in comparison to the other States, with near-record highs of $8.3 billion reported in April and May 2017. While the State’s trade balance remains substantially higher than the other States and Territories, a fivefold increase in imports in July has seen the trade balance reduce to $4.9 billion in three month rolling average terms.
$b2468
1012
Aug-
2012
Jan-
2013
Jun-
2013
Nov
-201
3
Apr-
2014
Sep-
2014
Feb-
2015
Jul-2
015
Dec-
2015
May
-201
6
Oct
-201
6
Mar
-201
7
Aug-
2017
Exports by State, 3 month rolling average, original
NSW VICQLD WASource: ABS 5368.0
$b
2
4
6
8
10
12Au
g-20
12
Feb-
2013
Aug-
2013
Feb-
2014
Aug-
2014
Feb-
2015
Aug-
2015
Feb-
2016
Aug-
2016
Feb-
2017
Aug-
2017
Imports by State, 3 month rolling average, original
NSW VICQLD WA
Source: ABS 5368.0
-10
-5
$m
5
10
Aug-
2012
Feb-
2013
Aug-
2013
Feb-
2014
Aug-
2014
Feb-
2015
Aug-
2015
Feb-
2016
Aug-
2016
Feb-
2017
Aug-
2017
Trade balance by State, 3 month rolling average, original
NSW VICQLD WA
Source: ABS 5368.0

NSW Economic Update Spring 2017
15
CONSUMER PRICE INDEX
The Australian consumer price index (CPI) rose by 0.6% over the September 2017 quarter: a larger rise than the 0.2% recorded in the June 2017 quarter, but below analysts’ expectations of a 0.8% rise.18 Indeed, one commentator noted that if not for rising electricity and gas bills, as well as tax hikes on alcohol and tobacco, inflation may have been even lower.
Over the 12 months to September 2017 the CPI rose by 1.8% nationally.19
In Sydney the CPI increased by 1.9% over the year to September: the fourth highest increase after Melbourne (2.2%), Canberra (2.1%) and Hobart (2.0%). The largest price increases in Sydney over the last 12 months were seen for alcohol and tobacco (6.7%); housing (4.3%); and health (3.9%).
In response to the most recent results, the Commonwealth Bank commented “that price pressures remain comatose with no need for the RBA to reach for the rate hike lever anytime soon.” Nevertheless, the Commonwealth Bank believed that inflation will rise in the coming quarters:
Today’s data confirms that the grind higher in underlying inflation rates is at a snail’s pace (1.8% pa) and stuck below the bottom end of the RBA’s 2-3% target. Nevertheless, we believe that we are past the inflation low point. How quickly the cycle turns, however, will depend on the trajectory for wages and labour costs – which are currently very benign and non-threatening to the inflation outlook.20
Headline and underlying inflation (both 1.8%) remain at the lower end of the RBA’s target band (see table below), which the Commonwealth Bank argues will prevent the RBA increasing the cash rate until the fourth quarter in 2018.
Reserve Bank of Australia inflation forecasts (%)
Dec-17 Jun-18 Dec-18 Jun-19 CPI inflation 1.5–2.5 1.75–2.75 1.75–2.75 2–3
Underlying inflation 1.5–2.5 1.5–2.5 1.5–2.5 2–3 Source: RBA, Statement on Monetary Policy, August 2017, Table 6.1.
18 Commonwealth Bank, CPI – September Quarter 2017, 25 October 2017. 19 Australian Bureau of Statistics, Inflation rose 0.6 per cent in the September quarter 2017, Media Release, 25 October 2017. 20 Commonwealth Bank, CPI – September Quarter 2017, 25 October 2017, p 1.
%
1
2
3
4
5
Dec-
2007
Sep-
2008
Jun-
2009
Mar
-201
0
Dec-
2010
Sep-
2011
Jun-
2012
Mar
-201
3
Dec-
2013
Sep-
2014
Jun-
2015
Mar
-201
6
Dec-
2016
Sep-
2017
Annual change in CPI, all groups
SYD AUSSource: ABS 6401.0

NSW Economic Update Spring 2017
16
EMPLOYMENT
Nationally, employment grew by 0.9% in the September 2017 quarter, with approximately 103,000 new jobs created since March. According to the ABS, this was the 12th straight month of employment growth, which is further strengthened by the lowest unemployment rate seen since March 2013 (see following chapter).
The average number of people employed in NSW also increased by 0.9% over the quarter, from 3.84 million to 3.88 million employed. Over the 12 months to September 2017, NSW employment levels increased by 1.8%.
Number of persons employed (‘000), quarterly average NSW VIC QLD SA WA TAS NT ACT AUS Dec-16 3,800 3,086 2,343 816 1,332 239 137 216 11,968 Mar-17 3,805 3,110 2,362 818 1,342 241 140 216 12,042 Jun-17 3,843 3,140 2,394 821 1,356 244 137 216 12,152 Sep-17 3,879 3,163 2,428 826 1,367 246 132 219 12,255
Source: ABS, Labour Force, Australia, Cat. No. 6202.0, September 2017
National full-time employment increased for the 12th consecutive month in the September results. According to ABS data, national part-time employment grew by 13.9% between June 2012 and June 2017, while full-time employment grew by only 4.9% over the same period (see right).
There was a 1.0% increase in full-time work and a 0.5% increase in part-time jobs between June and September 2017, which may indicate that the labour market is slowly reversing the decline in full-time employment growth that has occurred since the Global Financial Crisis (GFC).
In NSW, there has been a significant jump in cumulative full-time employment growth. Between September 2012 and September 2017, there was a 8.1% cumulative increase in full-time work in NSW: well above the national average and second only to Victoria (see right).
8.1 8.9
0.8 0.6
-1.4
3.1 4.9
-4-2%2468
10
NSW VIC QLD SA WA TAS
5 year quarterly cumulative full-time jobs growth, Sep 2012 to Sep 2017
Source: ABS 6202.0
4.9
13.9
-5
%
5
10
15
Sep-
12Ja
n-13
May
-13
Sep-
13Ja
n-14
May
-14
Sep-
14Ja
n-15
May
-15
Sep-
15Ja
n-16
May
-16
Sep-
16Ja
n-17
May
-17
Sep-
17
Cumulative quarterly jobs growth in Australia, full-time vs part-time (%)
Full-time Part-timeSource: ABS 6202.0
NSW Economic Update Spring 2017
17
UNEMPLOYMENT, UNDEREMPLOYMENT AND UNDERUTILISATION
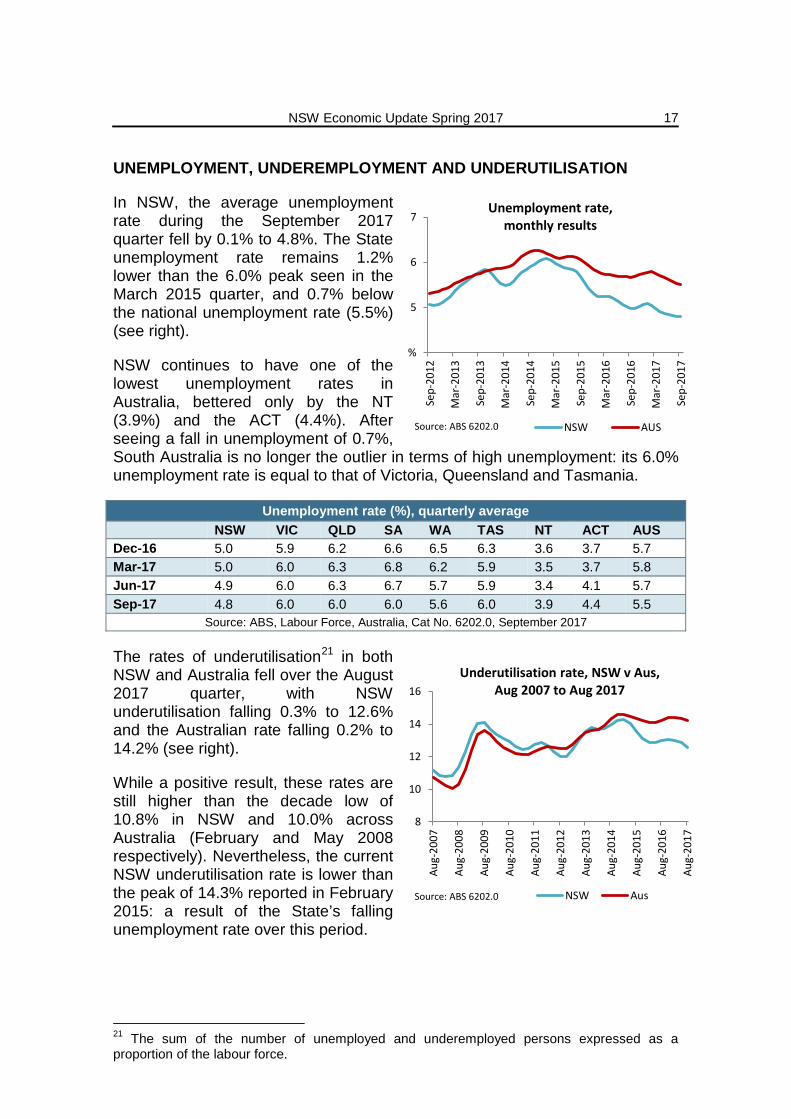
In NSW, the average unemployment rate during the September 2017 quarter fell by 0.1% to 4.8%. The State unemployment rate remains 1.2% lower than the 6.0% peak seen in the March 2015 quarter, and 0.7% below the national unemployment rate (5.5%) (see right).
NSW continues to have one of the lowest unemployment rates in Australia, bettered only by the NT (3.9%) and the ACT (4.4%). After seeing a fall in unemployment of 0.7%, South Australia is no longer the outlier in terms of high unemployment: its 6.0% unemployment rate is equal to that of Victoria, Queensland and Tasmania.
Unemployment rate (%), quarterly average
NSW VIC QLD SA WA TAS NT ACT AUS Dec-16 5.0 5.9 6.2 6.6 6.5 6.3 3.6 3.7 5.7 Mar-17 5.0 6.0 6.3 6.8 6.2 5.9 3.5 3.7 5.8 Jun-17 4.9 6.0 6.3 6.7 5.7 5.9 3.4 4.1 5.7 Sep-17 4.8 6.0 6.0 6.0 5.6 6.0 3.9 4.4 5.5
Source: ABS, Labour Force, Australia, Cat No. 6202.0, September 2017
The rates of underutilisation21 in both NSW and Australia fell over the August 2017 quarter, with NSW underutilisation falling 0.3% to 12.6% and the Australian rate falling 0.2% to 14.2% (see right).
While a positive result, these rates are still higher than the decade low of 10.8% in NSW and 10.0% across Australia (February and May 2008 respectively). Nevertheless, the current NSW underutilisation rate is lower than the peak of 14.3% reported in February 2015: a result of the State’s falling unemployment rate over this period.
21 The sum of the number of unemployed and underemployed persons expressed as a proportion of the labour force.
%
5
6
7
Sep-
2012
Mar
-201
3
Sep-
2013
Mar
-201
4
Sep-
2014
Mar
-201
5
Sep-
2015
Mar
-201
6
Sep-
2016
Mar
-201
7
Sep-
2017
Unemployment rate, monthly results
NSW AUSSource: ABS 6202.0
8
10
12
14
16
Aug-
2007
Aug-
2008
Aug-
2009
Aug-
2010
Aug-
2011
Aug-
2012
Aug-
2013
Aug-
2014
Aug-
2015
Aug-
2016
Aug-
2017
Underutilisation rate, NSW v Aus, Aug 2007 to Aug 2017
NSW AusSource: ABS 6202.0

NSW Economic Update Spring 2017
18
Underutilisation rate (%), quarterly average NSW Australia
Male Female Persons Male Female Persons Nov-2016 11.5 14.9 13.1 12.6 16.5 14.4 Feb-2017 11.3 15.0 13.0 12.5 16.6 14.4 May-2017 11.2 14.8 12.9 12.4 16.6 14.4 Aug-2017 11.0 14.5 12.6 12.3 16.4 14.2
Source: ABS, Labour Force, Australia, Cat No. 6202.0, August 2017
This ongoing fall notwithstanding, underutilisation rates have increased primarily as a result of greater levels of underemployment—the proportion of employees aged over 15 who want, and are available for more hours of work than they currently have—as opposed to rises in the unemployment rate.
Between August 2007 and August 2017, the NSW underemployment rate increased from a May 2008 low of 6.4% to the current rate of 8.1%. Australian underemployment also increased over the decade, rising from a low of 6.2% in May 2008 to 9.2% today (see above right).
ABS data for the August 2000 to August 2017 period (see right) shows that while the NSW unemployment rate has fallen from a high of 6.4% in August 2009 to 4.9%, the underemployment rate increased from 5.8% to 8.1% over the same period.
Underutilisation rates also differ by gender (see right), with NSW women more likely to either be unemployed or underemployed (14.5%) compared to men (11.0%). However, as with the underutilisation rate for NSW persons, the underutilisation rates for NSW women and men were both lower than their national averages of 16.4% and 12.3% respectively.
5
6
7
8
9
10
Aug-
2007
Aug-
2008
Aug-
2009
Aug-
2010
Aug-
2011
Aug-
2012
Aug-
2013
Aug-
2014
Aug-
2015
Aug-
2016
Aug-
2017
Underemployment as % of employed, Aug 2007 to Aug 2017
NSW AUSSource: ABS 6202.0
4
6
8
10
Aug-
2000
Aug-
2001
Aug-
2002
Aug-
2003
Aug-
2004
Aug-
2005
Aug-
2006
Aug-
2007
Aug-
2008
Aug-
2009
Aug-
2010
Aug-
2011
Aug-
2012
Aug-
2013
Aug-
2014
Aug-
2015
Aug-
2016
Aug-
2017
Unemployment v underemployment, NSW, Aug 2000 to Aug 2017 (%)
UnemployedUnderemployedSource: ABS 6202.0
8
10
12
14
16
18
Aug-
2007
Aug-
2008
Aug-
2009
Aug-
2010
Aug-
2011
Aug-
2012
Aug-
2013
Aug-
2014
Aug-
2015
Aug-
2016
Aug-
2017
NSW underutilisation rate by gender, Aug 2007 to Aug 2017 (%)
Male FemaleSource: ABS 6202.0
NSW Economic Update Spring 2017
19
YOUTH UNEMPLOYMENT
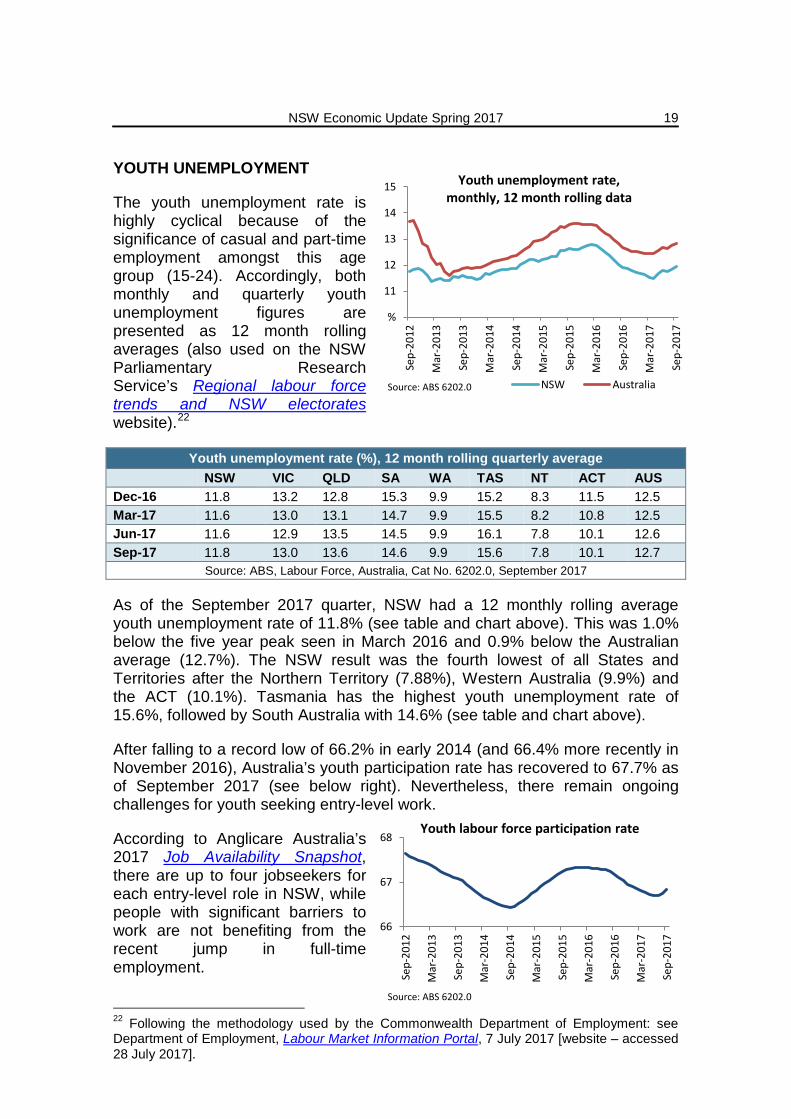
The youth unemployment rate is highly cyclical because of the significance of casual and part-time employment amongst this age group (15-24). Accordingly, both monthly and quarterly youth unemployment figures are presented as 12 month rolling averages (also used on the NSW Parliamentary Research Service’s Regional labour force trends and NSW electorates website).22
Youth unemployment rate (%), 12 month rolling quarterly average
NSW VIC QLD SA WA TAS NT ACT AUS Dec-16 11.8 13.2 12.8 15.3 9.9 15.2 8.3 11.5 12.5 Mar-17 11.6 13.0 13.1 14.7 9.9 15.5 8.2 10.8 12.5 Jun-17 11.6 12.9 13.5 14.5 9.9 16.1 7.8 10.1 12.6 Sep-17 11.8 13.0 13.6 14.6 9.9 15.6 7.8 10.1 12.7
Source: ABS, Labour Force, Australia, Cat No. 6202.0, September 2017
As of the September 2017 quarter, NSW had a 12 monthly rolling average youth unemployment rate of 11.8% (see table and chart above). This was 1.0% below the five year peak seen in March 2016 and 0.9% below the Australian average (12.7%). The NSW result was the fourth lowest of all States and Territories after the Northern Territory (7.88%), Western Australia (9.9%) and the ACT (10.1%). Tasmania has the highest youth unemployment rate of 15.6%, followed by South Australia with 14.6% (see table and chart above).
After falling to a record low of 66.2% in early 2014 (and 66.4% more recently in November 2016), Australia’s youth participation rate has recovered to 67.7% as of September 2017 (see below right). Nevertheless, there remain ongoing challenges for youth seeking entry-level work.
According to Anglicare Australia’s 2017 Job Availability Snapshot, there are up to four jobseekers for each entry-level role in NSW, while people with significant barriers to work are not benefiting from the recent jump in full-time employment.
22 Following the methodology used by the Commonwealth Department of Employment: see Department of Employment, Labour Market Information Portal, 7 July 2017 [website – accessed 28 July 2017].
%
11
12
13
14
15
Sep-
2012
Mar
-201
3
Sep-
2013
Mar
-201
4
Sep-
2014
Mar
-201
5
Sep-
2015
Mar
-201
6
Sep-
2016
Mar
-201
7
Sep-
2017
Youth unemployment rate, monthly, 12 month rolling data
NSW AustraliaSource: ABS 6202.0
66
67
68
Sep-
2012
Mar
-201
3
Sep-
2013
Mar
-201
4
Sep-
2014
Mar
-201
5
Sep-
2015
Mar
-201
6
Sep-
2016
Mar
-201
7
Sep-
2017
Youth labour force participation rate
Source: ABS 6202.0

NSW Economic Update Spring 2017
20
LABOUR FORCE PARTICIPATION
Over the September 2017 quarter, the NSW labour force participation rate rose by 0.3% to 63.7%: 1.5% below the Australian average of 65.2% (see right).
Only Tasmania and South Australia had lower participation rates than NSW (61.2% and 62.2% respectively), while the participation rate was highest in the Northern Territory despite seeing a 2.2% drop over the quarter (73.6%).
Labour force participation rate (%), quarterly average
NSW VIC QLD SA WA TAS NT ACT AUS Dec-16 63.4 65.6 64.0 62.1 67.3 59.8 76.1 70.3 64.6 Mar-17 63.1 65.8 64.4 62.2 67.5 59.9 77.7 70.1 64.7 Jun-17 63.4 66.0 64.9 62.3 67.7 60.7 75.8 70.4 64.9 Sep-17 63.7 66.2 65.4 62.2 68.0 61.2 73.6 71.1 65.2
Source: ABS, Labour Force, Australia, Cat No. 6202.0, September 2017
In NSW, the male participation rate has declined steadily over the past five years, reaching a low of 68.9% in January 2017 before recovering to 69.5% as at September 2017 (see right). However, female participation increased over the quarter. While still below the high of 59% reported between November 2015 and April 2016, female participation rates increased from a low of 57.5% in March to 58.3% as of September.
At the national level, Roy Morgan Research has commented that strong increases in Australian employment since 2000 has been driven by large increases in employment for women, with overall female employment up by 1.9 million persons since the turn of the century. While men have continued to contribute to overall growth, the analysis concluded that rising part-time employment is being driven by men: part-time workers now comprise 23.5% of all employed men, up from 15.7% in 2000.
%
63
64
65
66
Sep-
2012
Mar
-201
3
Sep-
2013
Mar
-201
4
Sep-
2014
Mar
-201
5
Sep-
2015
Mar
-201
6
Sep-
2016
Mar
-201
7
Sep-
2017
Labour force participation rate
NSW AUSSource: ABS 6202.0
56.056.557.057.558.058.559.059.560.0
68.0
68.5
69.0
69.5
70.0
70.5
71.0
Sep-
2012
Mar
-201
3
Sep-
2013
Mar
-201
4
Sep-
2014
Mar
-201
5
Sep-
2015
Mar
-201
6
Sep-
2016
Mar
-201
7
Sep-
2017
Labour force participation, by gender, NSW
Male (LHS) Female (RHS)Source: ABS 6202.0

NSW Economic Update Spring 2017
21
JOB VACANCIES
The number of NSW job vacancies rose by 9.7% to 76,600 in the June 2017 quarter, and remains 23% higher than the three year average of 62,300. However, NSW had the fourth lowest change in the number of reported job vacancies across jurisdictions after South Australia (-12.5%), Tasmania (-7.4%) and Western Australia (1.0%), and was below the national average for the quarter (14.2%).
Number of job vacancies (‘000), original
NSW Vic QLD SA WA TAS NT ACT AUS Nov-2016 69.0 45.4 33.6 9.6 17.7 2.0 2.7 5.7 185.8 Feb-2017 68.1 50.4 29.7 9.5 17.8 2.6 2.9 5.9 186.9 May-2017 69.8 44.6 27.1 10.4 19.1 2.7 3.1 5.7 182.5 Aug-2017 76.6 55.9 35.0 9.1 19.3 2.5 3.8 6.2 208.4
Source: ABS, Job Vacancies, Australia, Cat No. 6354.0, August 2017
According to ABS trend data, the number of job vacancies increased nationally for the 16th consecutive quarter in August 2017 to reach 201,300, surpassing the previous record set from November 1991 through to November 1994.23
In line with broader economic trends at the national level,24 vacancies have generally increased in a number of services industries over the past five years, such as education and training (118.2% increase), health care and social assistance (70.4%) and public administration (66.2%).
In contrast, mining fell by 47.5% over the same period, while the wholesale trade and construction sectors also experienced considerable falls in job vacancy rates (see right).
23 Jericho G, The latest job vacancy figures should be good news, but consumers don’t agree, The Guardian, 4 April 2017. 24 See Angus C, NSW Economic Update: Winter 2016, NSW Parliamentary Research Service, SI 3/2016, July 2016, p 19; Angus C, Future workforce trends in NSW: Emerging technologies and their potential impact, NSW Parliamentary Research Service, Briefing Paper 13/2015, December 2015, Ch 4.
9.7
25.3 29.2
-12.5
1.0
-7.4 -20
-10
%
10
20
30
NSW Vic QLD SA WA TAS
Job vacancies by State, quarterly change, original
Source: ABS 6354.0
Australian vacancies: 14.2%
118.2%
70.4% 66.2%
-20.2% -45.0% -47.5% -60%
0%
60%
120%
Change in no of job vacancies, Aug 2012 to Aug 2017, original data
Source: ABS 6354.0
NSW Economic Update Spring 2017
22
WAGES
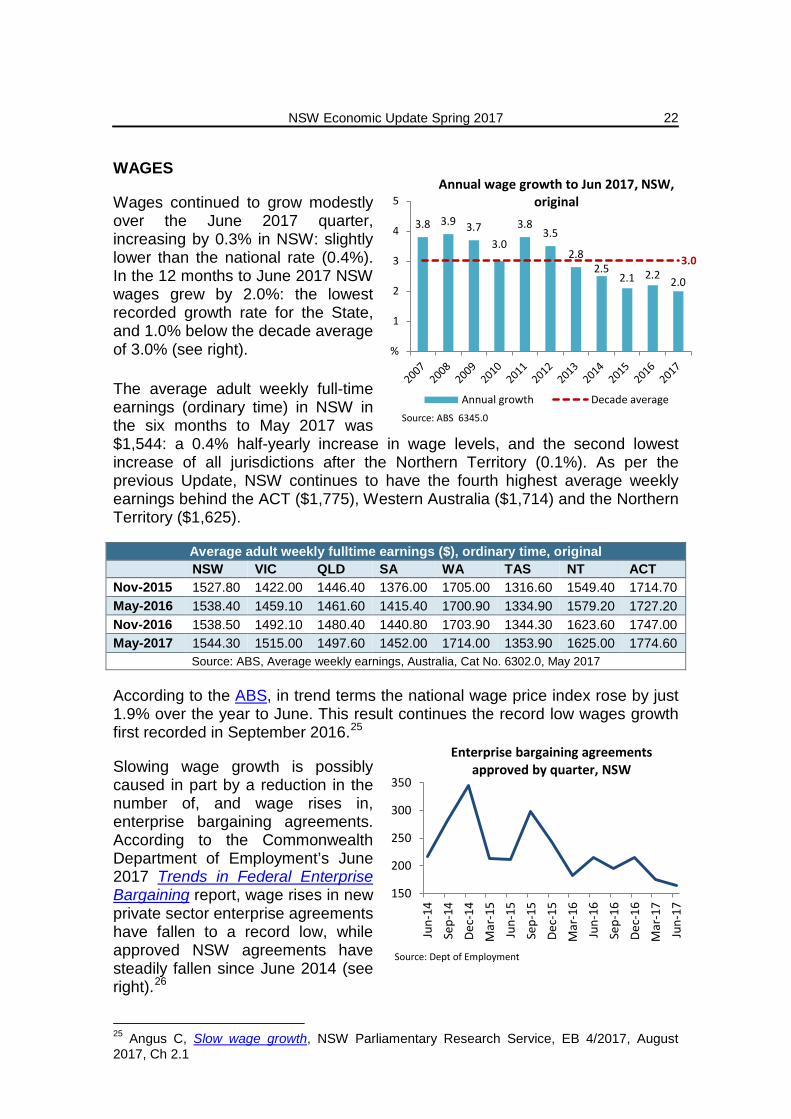
Wages continued to grow modestly over the June 2017 quarter, increasing by 0.3% in NSW: slightly lower than the national rate (0.4%). In the 12 months to June 2017 NSW wages grew by 2.0%: the lowest recorded growth rate for the State, and 1.0% below the decade average of 3.0% (see right).
The average adult weekly full-time earnings (ordinary time) in NSW in the six months to May 2017 was $1,544: a 0.4% half-yearly increase in wage levels, and the second lowest increase of all jurisdictions after the Northern Territory (0.1%). As per the previous Update, NSW continues to have the fourth highest average weekly earnings behind the ACT ($1,775), Western Australia ($1,714) and the Northern Territory ($1,625).
Average adult weekly fulltime earnings ($), ordinary time, original
NSW VIC QLD SA WA TAS NT ACT Nov-2015 1527.80 1422.00 1446.40 1376.00 1705.00 1316.60 1549.40 1714.70 May-2016 1538.40 1459.10 1461.60 1415.40 1700.90 1334.90 1579.20 1727.20 Nov-2016 1538.50 1492.10 1480.40 1440.80 1703.90 1344.30 1623.60 1747.00 May-2017 1544.30 1515.00 1497.60 1452.00 1714.00 1353.90 1625.00 1774.60
Source: ABS, Average weekly earnings, Australia, Cat No. 6302.0, May 2017
According to the ABS, in trend terms the national wage price index rose by just 1.9% over the year to June. This result continues the record low wages growth first recorded in September 2016.25
Slowing wage growth is possibly caused in part by a reduction in the number of, and wage rises in, enterprise bargaining agreements. According to the Commonwealth Department of Employment’s June 2017 Trends in Federal Enterprise Bargaining report, wage rises in new private sector enterprise agreements have fallen to a record low, while approved NSW agreements have steadily fallen since June 2014 (see right).26
25 Angus C, Slow wage growth, NSW Parliamentary Research Service, EB 4/2017, August 2017, Ch 2.1
3.8 3.9 3.7 3.0
3.8 3.5
2.8 2.5
2.1 2.2 2.0
3.0
%
1
2
3
4
5Annual wage growth to Jun 2017, NSW,
original
Annual growth Decade averageSource: ABS 6345.0
150
200
250
300
350
Jun-
14Se
p-14
Dec-
14M
ar-1
5Ju
n-15
Sep-
15De
c-15
Mar
-16
Jun-
16Se
p-16
Dec-
16M
ar-1
7Ju
n-17
Enterprise bargaining agreements approved by quarter, NSW
Source: Dept of Employment

NSW Economic Update Spring 2017
23
Whatever the cause, weak national wages growth has affected the majority of Australian industry sectors (see right). Across many sectors annual wage growth to May 201727 has been well below their respective 10 year averages. For example, annual wage growth for the mining sector was -1.8% over the 12 months to May 2017, compared to a decade average annual growth rate of 4.6% (a -6.4% difference).
Other sectors also saw annual wage growth lower than their decade average, including manufacturing (-5.3% below average), transport (-3.7%), finance and insurance (-2.9%) and retail trade (-2.2%). Nevertheless, some areas have seen higher than average growth, such as health (0.9% above the average) and real estate services (1.5%).
BANKRUPTCIES
Bankruptcies in NSW have trended down in recent years, and are 24.0% lower than three years earlier. Over the quarter to September 2017 the number of bankruptcies in NSW rose slightly by 0.4%, from 1,081 to 1,085 (see right).
However, NSW saw the lowest increase of all jurisdictions. The NT experienced the greatest jump in bankruptcies (28.1%), followed by Tasmania (25.8%), although both jurisdictions have substantially smaller populations than other States (see table below).
Bankruptcies per quarter (Parts IV and XI of the Bankruptcy Act 1966 (Cth))
NSW VIC QLD SA WA TAS NT ACT Dec-16 1,078 823 1,190 277 443 88 27 50 Mar-17 1,127 836 1,295 305 470 108 26 58 Jun-17 1,081 765 1,117 282 475 97 32 39 Sep-17 1,085 837 1,297 298 480 122 41 47
Source: Australian Financial Security Authority, September 2017
26 Hannan E, Wage rises fall to record low, data shows, The Australian, 23 October 2017. 27 The most recent available results.
-4%-2%0%2%4%6%
Wage growth, by industry, Australia
Annual growth to Nov 2016 10 year annual growth to Nov 2016
Source: ABS 6302.0
1,000
1,200
1,400
1,600
1,800
-25
-20
-15
-10
-5
%
5
10
15
20Quarterly bankruptcies in NSW
Quarterly change (LHS)No of bankruptcies (RHS)Source: AFSA

NSW Economic Update Spring 2017
24
MINERAL EXPLORATION EXPENDITURE
There is no comprehensive quarterly or annual dataset available for the gross value of mining production for the States and Territories in Australia.
Mineral exploration expenditure is the only comprehensive quarterly dataset available through the ABS and is considered to be the best proxy measure for the level of mining activity taking place in NSW and elsewhere in Australia (see right).
NSW petroleum and mineral exploration expenditure increased by 11.4% over the quarter to June 2017. However, expenditure remains 30.9% below the previous high, recorded during the December 2011 reporting period.
Nationally, mining sector investment has declined during the decade, with mineral exploration expenditure down by 36.2 % ($243.4m) since the March 2012 peak. A significant share of this decline is attributable to Western Australia; although the State has seen increases over the past year, over the past five years exploration expenditure has declined by 47.5% ($257.7m).
Mineral exploration expenditure ($m)
NSW VIC QLD SA WA TAS NT AUS Sep-2016 30.3 7.8 47.2 13.1 233.2 3.3 20.0 354.8 Dec-2016 33.1 9.0 49.5 12.4 249.0 3.3 19.1 375.4 Mar-2017 37.7 10.8 51.9 11.9 267.5 3.4 18.8 402.1 Jun-2017 42.0 12.8 54.1 12.3 284.9 3.5 18.9 428.5
Source: ABS, Mineral and Petroleum Exploration, Australia, Cat No. 8412.0, June 2017
Nevertheless, the RBA commented in its most recent cash rate decision that the effect of the decline in mining investment had mostly passed and, with recent increases in resource exports, the mining sector had in fact been contributing to overall national growth.
$m
200
400
600
800
1000
1200
$m
20
40
60
80
Dec-
2006
Sep-
2007
Jun-
2008
Mar
-200
9De
c-20
09Se
p-20
10Ju
n-20
11M
ar-2
012
Dec-
2012
Sep-
2013
Jun-
2014
Mar
-201
5De
c-20
15Se
p-20
16Ju
n-20
17
Mineral exploration expenditure, NSW v Australia, monthly results
NSW (LHS) AUS (RHS)Source: ABS 8412.0
NSW Economic Update Spring 2017
25
TURNOVER OF RETAIL TRADE
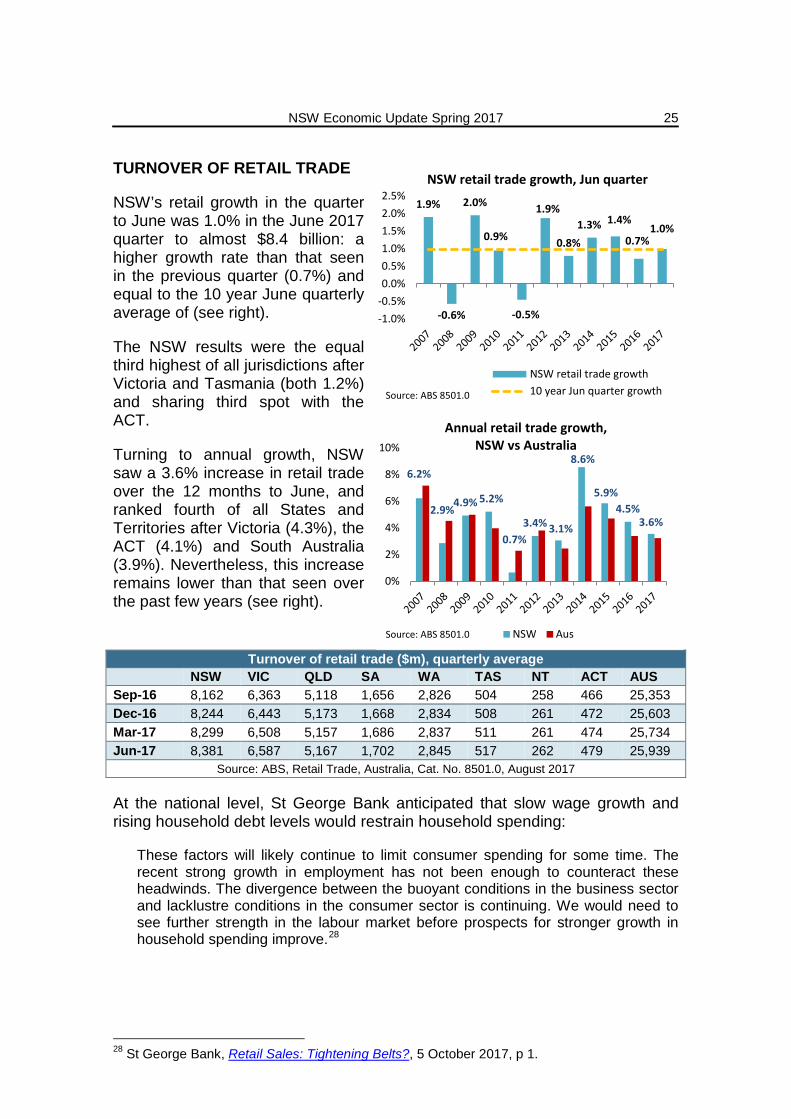
NSW’s retail growth in the quarter to June was 1.0% in the June 2017 quarter to almost $8.4 billion: a higher growth rate than that seen in the previous quarter (0.7%) and equal to the 10 year June quarterly average of (see right).
The NSW results were the equal third highest of all jurisdictions after Victoria and Tasmania (both 1.2%) and sharing third spot with the ACT.
Turning to annual growth, NSW saw a 3.6% increase in retail trade over the 12 months to June, and ranked fourth of all States and Territories after Victoria (4.3%), the ACT (4.1%) and South Australia (3.9%). Nevertheless, this increase remains lower than that seen over the past few years (see right).
Turnover of retail trade ($m), quarterly average
NSW VIC QLD SA WA TAS NT ACT AUS Sep-16 8,162 6,363 5,118 1,656 2,826 504 258 466 25,353 Dec-16 8,244 6,443 5,173 1,668 2,834 508 261 472 25,603 Mar-17 8,299 6,508 5,157 1,686 2,837 511 261 474 25,734 Jun-17 8,381 6,587 5,167 1,702 2,845 517 262 479 25,939
Source: ABS, Retail Trade, Australia, Cat. No. 8501.0, August 2017
At the national level, St George Bank anticipated that slow wage growth and rising household debt levels would restrain household spending:
These factors will likely continue to limit consumer spending for some time. The recent strong growth in employment has not been enough to counteract these headwinds. The divergence between the buoyant conditions in the business sector and lacklustre conditions in the consumer sector is continuing. We would need to see further strength in the labour market before prospects for stronger growth in household spending improve.28
28 St George Bank, Retail Sales: Tightening Belts?, 5 October 2017, p 1.
1.9%
-0.6%
2.0%
0.9%
-0.5%
1.9%
0.8% 1.3% 1.4%
0.7% 1.0%
-1.0%-0.5%0.0%0.5%1.0%1.5%2.0%2.5%
NSW retail trade growth, Jun quarter
NSW retail trade growth10 year Jun quarter growthSource: ABS 8501.0
6.2%
2.9% 4.9% 5.2%
0.7% 3.4% 3.1%
8.6%
5.9% 4.5%
3.6%
0%
2%
4%
6%
8%
10%
Annual retail trade growth, NSW vs Australia
NSW AusSource: ABS 8501.0

NSW Economic Update Spring 2017
26
VEHICLE SALES
NSW, along with most other States and Territories, saw a modest rise in motor vehicle sales over the September 2017 quarter. The average number of new vehicles sold in NSW increased by 0.6% to approximately 33,560 sales per month during the quarter. However, this was the fourth lowest result of all jurisdictions.
National sales rose by 0.7% over the quarter, with Tasmania (3.7%), Western Australia (2.6%) and the Northern Territory (1.4%) recording the largest increases in sales.
Number of new vehicle sales, quarterly average
NSW VIC QLD SA WA TAS NT ACT AUS Dec-16 32,964 27,607 18,911 5,953 7,965 1,700 856 1,561 97,518 Mar-17 32,917 27,433 18,972 5,910 7,875 1,587 864 1,558 97,116 Jun-17 33,364 28,162 19,632 6,071 8,007 1,581 930 1,566 99,312 Sep-17 33,566 28,376 19,645 6,093 8,215 1,638 943 1,559 100,036
Source: ABS, Sales of new motor vehicles, Australia, Cat. No. 9314.0, September 2017
Over the 12 months to September, vehicle sales in NSW rose by 1.7%: above the national average of 1.6% and the third largest increase after Victoria (4.9%) and South Australia (2.5%).
In terms of future outlook, St George Bank made the following comments: Sales of motor vehicles provide some indication as to the health of consumer spending. While July saw a retreat in motor vehicle sales, it was from a record high in June. Therefore, new motor vehicle sales still remain relatively firm in an encouraging sign for consumer spending. However, weak wages growth, high household debt and low consumer-confidence readings provide a threat to the outlook for the growth of new motor vehicle sales (and consumer spending more generally). Low interest rates and the improvement underway in the labour market remain supporting factors.29
The Commonwealth Bank has also reported a slowdown in luxury vehicle sales, with its CommSec Luxury Vehicle Index showing a 1.8% decrease in the year to August and the rolling annual total of luxury vehicle sales reaching 15 month lows. According to the Bank:
• In the past, when the ‘top-end’ of the new vehicle market has peaked it has signalled slowdowns – not just in the car market – but also in other asset markets such as the housing market. Those trends are lining up at present with the monthly growth rate in home prices slowing since late last year.
• Rather than a leading or lagging indicator, luxury vehicle sales have been shown to be a coincident or confirmation indicator of home prices. Home prices are slowing and this has consequence for a range of other consumer spending and asset markets.
29 St George Bank, New Motor Vehicle Sales: Consumers Prefer SUVs, 15 August 2017, p 2.

NSW Economic Update Spring 2017
27
HOUSE PRICES
According to CoreLogic, Sydney’s median house price reached $1.07m in September 2017 following a 0.3% quarterly decline: the second largest fall after Darwin (-2.2%). However, Sydney’s house prices still saw an 11% increase over the past year, with only Hobart (15%) and Melbourne (13%) seeing greater year on year increases.
The ABS’s Residential Property Price Index for Sydney30 recorded a 2.3% increase over the June 2017 quarter (see right). Between June 2016 and 2017, the Sydney Index increased by 13.8%, sharing the highest growth rate with Melbourne. Over the 12 months to June, the Index for Sydney’s established houses rose by 14.8% (the second highest growth rate after Melbourne’s 16% increase), while the attached dwellings index increased by 11.7% (second to Hobart’s 13.8%).
House price indexes: eight capital cities, original
SYD MEL BRIS ADE PER HOB DAR CAN Weighted Average
Sep-2016 159.3 132.9 118.8 113.3 106.3 113.4 104.0 113.5 135.0 Dec-2016 167.6 140.0 121.4 115.3 106.6 118.5 102.4 116.7 140.6 Mar-2017 172.7 144.4 121.4 117.0 105.5 122.5 101.5 120.0 143.7 Jun-2017 176.6 148.7 122.1 117.9 104.7 124.7 100.1 121.5 146.5
Source: ABS, Residential Property Price Indexes: Eight Capital Cities, Cat. No. 6416.0, June 2017
There remains considerable community concern over Sydney’s house prices despite the recent slowdown, with Ipsos’s June 2017 Issues Monitor reporting that housing remained the top issue facing NSW. With first home ownership falling by more than one third over the past 25 years, and the Housing Industry Association reporting that Sydneysiders need more than two average full-time wages to affordably service a home loan, such concern is unsurprising.
30 Which measures price changes of residential dwelling stock.
9.0
9.3
-1.3 15.0
-2.9
5.5
4.0
13.0
11.0
-5 % 5 10 15 20
Combined Capitals*
Canberra
Darwin
Hobart
Perth
Adelaide
Brisbane
Melbourne
Sydney
Median house price growth, by capital city, to Sep 2017
Year on year QuarterSource: CoreLogic *Eight capital cities
2.3% 3.0% 0.6% 0.8%
-0.8%
1.8%
-1.4%
1.3%
13.8% 13.8%
3.0% 5.0%
-3.1%
12.4%
-4.9%
7.9%
-8%-4%0%4%8%
12%16%
Sydn
ey
Mel
bour
ne
Brisb
ane
Adel
aide
Pert
h
Hoba
rt
Darw
in
Canb
erra
Change in residential property prices, Jun 2017, original
Quarterly change Annual changeSource: ABS 6416.0
NSW Economic Update Spring 2017
28
DWELLING APPROVALS
Following a 14% decline in the December 2016 quarter and 2% fall in the quarter to March 2017, the average monthly number of dwellings approved in NSW increased by 2.7% by the end of June, with an average of 5,755 approvals made each month of the quarter. This represented a 14.4% drop compared to the quarterly average in June 2016 (approximately 6,725 approvals per month).
National dwelling approvals were, on average, up 1.1% for the June quarter: this result appears to have been affected by declines in quarterly approvals in Victoria (-5.5%) and Western Australia (-2.1%). In contrast, Queensland and Tasmania saw increases of 7.5% and 7.1% respectively.
Number of dwellings approved, quarterly average
NSW VIC QLD SA WA TAS AUS Sep-16 6,622 5,592 3,858 939 1,714 162 19,554 Dec-16 5,697 5,528 3,283 914 1,711 173 17,884 Mar-17 5,601 5,519 3,253 938 1,637 191 17,535 Jun-17 5,755 5,215 3,498 1,004 1,602 199 17,721
Source: ABS, Building Approvals, Australia, Cat. No. 8731.0, August 2017
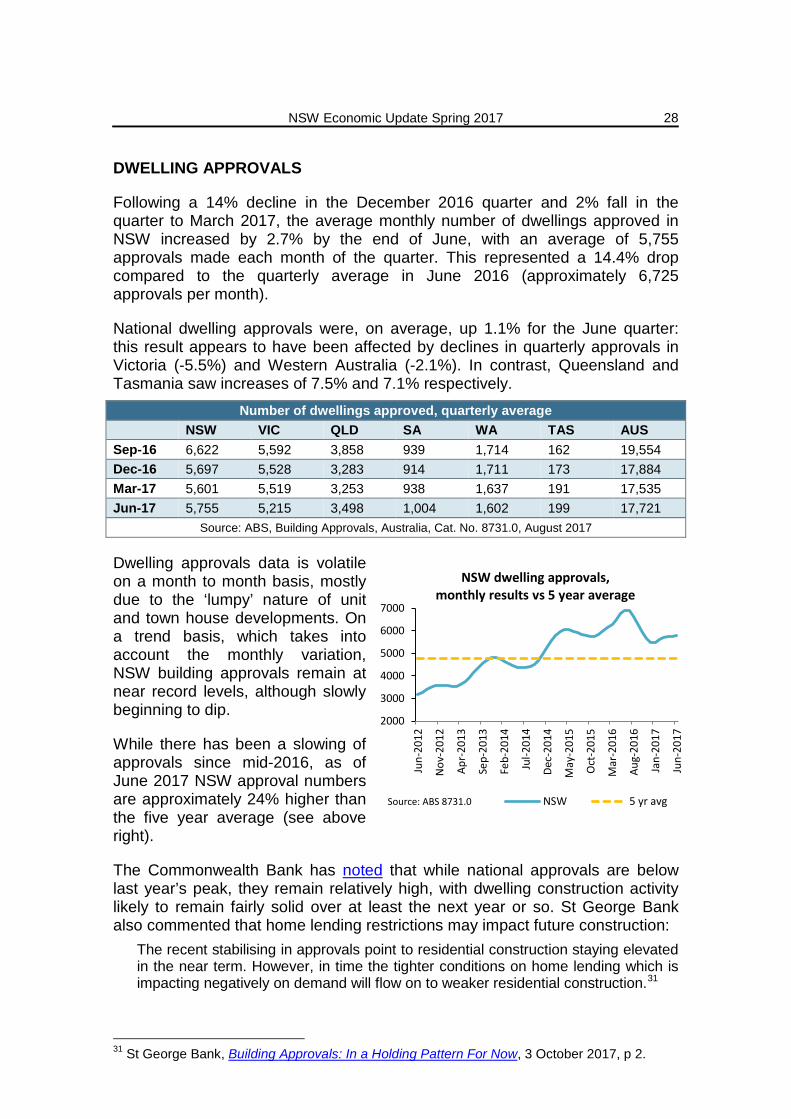
Dwelling approvals data is volatile on a month to month basis, mostly due to the ‘lumpy’ nature of unit and town house developments. On a trend basis, which takes into account the monthly variation, NSW building approvals remain at near record levels, although slowly beginning to dip.
While there has been a slowing of approvals since mid-2016, as of June 2017 NSW approval numbers are approximately 24% higher than the five year average (see above right).
The Commonwealth Bank has noted that while national approvals are below last year’s peak, they remain relatively high, with dwelling construction activity likely to remain fairly solid over at least the next year or so. St George Bank also commented that home lending restrictions may impact future construction:
The recent stabilising in approvals point to residential construction staying elevated in the near term. However, in time the tighter conditions on home lending which is impacting negatively on demand will flow on to weaker residential construction.31
31 St George Bank, Building Approvals: In a Holding Pattern For Now, 3 October 2017, p 2.
2000
3000
4000
5000
6000
7000
Jun-
2012
Nov
-201
2
Apr-
2013
Sep-
2013
Feb-
2014
Jul-2
014
Dec-
2014
May
-201
5
Oct
-201
5
Mar
-201
6
Aug-
2016
Jan-
2017
Jun-
2017
NSW dwelling approvals, monthly results vs 5 year average
NSW 5 yr avgSource: ABS 8731.0

NSW Economic Update Spring 2017
29
HOUSING FINANCE
The average number of owner-occupier (including first home owner) dwellings financed in NSW increased by 9.6% during the June 2017 quarter to approximately 17,000 per month. This increase appears to have come primarily from a dramatic surge in first home buyers: after a 16.2% drop in financing in the March quarter, the June 2017 quarter saw a substantial 19.4% growth.
Nevertheless, there has been little change in the level of first home buyer demand in the four years to June 2017. Between June 2013 and June 2017 overall owner-occupier demand in NSW saw a cumulative increase of 22%. In contrast, first home buyer financing saw a 2% cumulative fall over this period (see right).
The issue of low first home buyer levels continues to worry observers. The Australian Institute of Health and Welfare reported in October 2017 that, consistent with a decline in ownership rates among younger Australians, first home buyers are now older than they were a decade ago:
In 2000–01, 61% of first home buyers were aged between 25–34; by 2013–14, this proportion had dropped to less than half (49.6%). At least in part, the financial impacts of higher education costs and compulsory superannuation contributions on younger generations have been implicated in their deferral into home ownership, as they save for a deposit in a market of increasing house prices. In the absence of real income growth, the effect of increased house prices on the time taken to save for a deposit is significant, particularly in Sydney and Melbourne. Estimates reveal that since 2006, the average number of years required to save for a deposit in Sydney increased from 5 to 8 years and in Melbourne, 4 to 6 years.32
According to the ANZ Bank, this delay is reducing current demand for homes. The ANZ bank suggests that while this allows new supply coming onto the market to better match existing demand, it nevertheless:
… masks the deteriorating picture of affordability for first home buyers, and adds to arguments that effective state government handouts in Victoria and NSW to first-time buyers in the form of stamp duty exemptions will do little to address a growing structural problem in Australia.33
32 Australian Institute of Health and Welfare, Australia's welfare 2017, 19 October 2017, p 201. 33 Bleby M, Australians buy homes later, delaying demand and preventing price drop: ANZ, Australian Financial Review, 26 September 2017.
-20%
0%
20%
40%
Jun-
13
Oct
-13
Feb-
14
Jun-
14
Oct
-14
Feb-
15
Jun-
15
Oct
-15
Feb-
16
Jun-
16
Oct
-16
Feb-
17
Jun-
17
Cumulative change in owner-occupier demand since Jun 2013, original
First home buyer Other owner-occupierTotal owner-occupier
Source: ABS 5609.0
NSW Economic Update Spring 2017
30
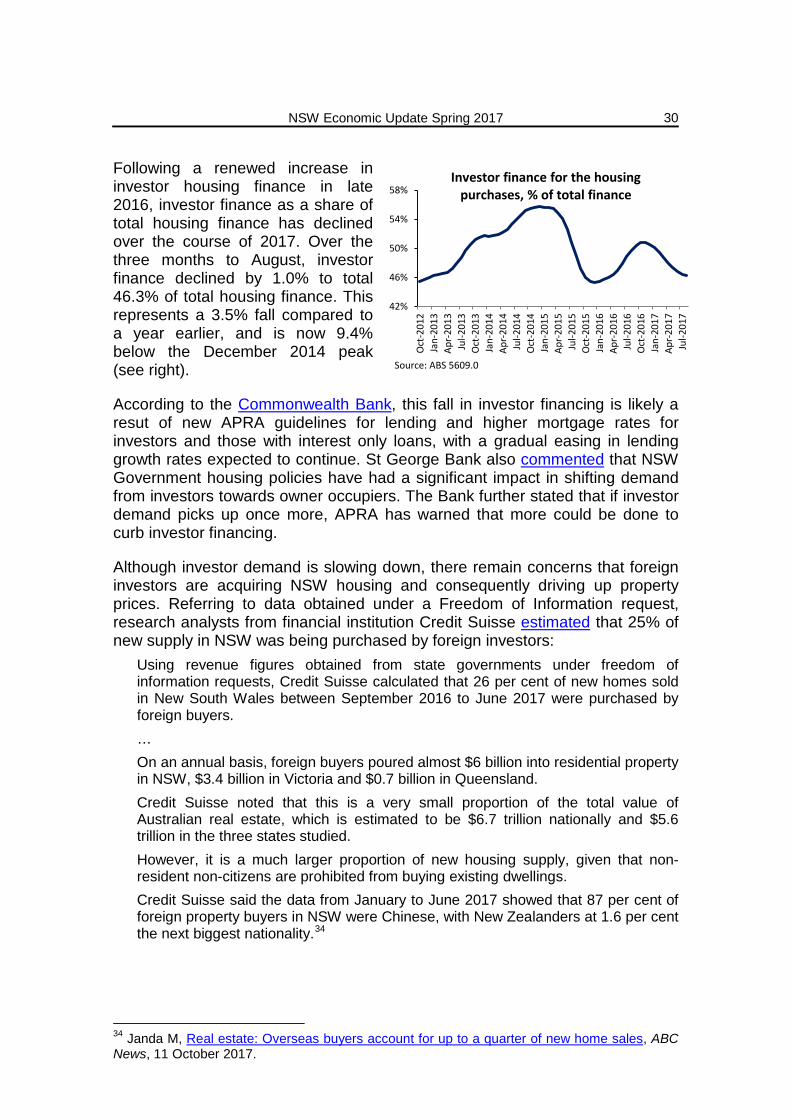
Following a renewed increase in investor housing finance in late 2016, investor finance as a share of total housing finance has declined over the course of 2017. Over the three months to August, investor finance declined by 1.0% to total 46.3% of total housing finance. This represents a 3.5% fall compared to a year earlier, and is now 9.4% below the December 2014 peak (see right).
According to the Commonwealth Bank, this fall in investor financing is likely a resut of new APRA guidelines for lending and higher mortgage rates for investors and those with interest only loans, with a gradual easing in lending growth rates expected to continue. St George Bank also commented that NSW Government housing policies have had a significant impact in shifting demand from investors towards owner occupiers. The Bank further stated that if investor demand picks up once more, APRA has warned that more could be done to curb investor financing.
Although investor demand is slowing down, there remain concerns that foreign investors are acquiring NSW housing and consequently driving up property prices. Referring to data obtained under a Freedom of Information request, research analysts from financial institution Credit Suisse estimated that 25% of new supply in NSW was being purchased by foreign investors:
Using revenue figures obtained from state governments under freedom of information requests, Credit Suisse calculated that 26 per cent of new homes sold in New South Wales between September 2016 to June 2017 were purchased by foreign buyers. … On an annual basis, foreign buyers poured almost $6 billion into residential property in NSW, $3.4 billion in Victoria and $0.7 billion in Queensland. Credit Suisse noted that this is a very small proportion of the total value of Australian real estate, which is estimated to be $6.7 trillion nationally and $5.6 trillion in the three states studied. However, it is a much larger proportion of new housing supply, given that non-resident non-citizens are prohibited from buying existing dwellings. Credit Suisse said the data from January to June 2017 showed that 87 per cent of foreign property buyers in NSW were Chinese, with New Zealanders at 1.6 per cent the next biggest nationality.34
34 Janda M, Real estate: Overseas buyers account for up to a quarter of new home sales, ABC News, 11 October 2017.
42%
46%
50%
54%
58%
Oct
-201
2Ja
n-20
13Ap
r-20
13Ju
l-201
3O
ct-2
013
Jan-
2014
Apr-
2014
Jul-2
014
Oct
-201
4Ja
n-20
15Ap
r-20
15Ju
l-201
5O
ct-2
015
Jan-
2016
Apr-
2016
Jul-2
016
Oct
-201
6Ja
n-20
17Ap
r-20
17Ju
l-201
7
Investor finance for the housing purchases, % of total finance
Source: ABS 5609.0

NSW Economic Update Spring 2017
31
RENT
After a 2.4% fall the previous quarter, rents in Sydney’s Inner Ring suburbs jumped by 4.8% in the June 2017 quarter; 3.8% above the region’s two year quarterly average (1.0%). Meanwhile, the city’s Middle Ring suburbs and the Rest of GMR region saw growth rates higher than their two year quarterly averages, while Outer Ring suburbs and the Rest of NSW saw no change in rents over the quarter (see right).
Median weekly rents by NSW region ($), all dwellings – all bedroom numbers
Greater Sydney
Sydney – Inner Ring
Sydney – Middle Ring
Sydney – Outer Ring
Rest of GMR*
Rest of NSW
NSW total
Sep-16 520 610 530 450 380 300 450 Dec-16 520 635 520 450 390 310 460 Mar-17 530 620 530 460 390 320 460 Jun-17 540 650 540 460 400 320 470
Source: Housing NSW, Rent and Sales Reports, Issue 120 *Greater Metropolitan Region
On an annual basis, rental growth remains most pronounced in the Rest of NSW region, increasing by 6.7% in the 12 months to June 2017. By way of comparison, no growth occurred in this region in the 12 months to March 2016.
Rents in Sydney’s Inner Ring suburbs have also increased compared to the previous 12 months. Middle Ring suburbs have grown at approximately the same rate as in June 2016, while Outer Ring suburb rents have had their growth rate slow by over half (see right).
4.8%
1.9%
0.0%
2.6%
0.0%
1.0% 0.9% 0.8% 1.0% 0.7%
0%
1%
2%
3%
4%
5%
6%
Inner Ring – Syd
Middle Ring – Syd
Outer Ring – Syd
Rest ofGMR
Rest ofNSW
Quarterly rent price growth, June 2017, by region
Jun 2017 quarter 2 year quarterly average
Source: Housing NSW
5.7%
3.8%
2.2%
5.3%
6.7%
3.4% 4.0%
4.7% 4.1%
0.0% 0%
2%
4%
6%
8%
Inner Ring – Syd
Middle Ring – Syd
Outer Ring – Syd
Rest ofGMR
Rest ofNSW
Annual rent price growth, June 2017, by region
Jun-17 Jun-16Source: Housing NSW

NSW Economic Update Spring 2017
32
GLOSSARY
The following definitions are those used by the Australian Bureau of Statistics, unless otherwise stated.
Average weekly earnings: Average gross (before tax) earnings of employees. Estimates of average weekly earnings are derived by dividing estimates of weekly total earnings by estimates of number of employees.
Cash target rate: Monetary policy decisions are expressed in terms of a target for the cash rate, which is the overnight money market interest rate.
Chain volume measures: Estimates that exclude the direct effects of changes in prices. Unlike current measure estimates, they take account of changes to price relativities that occur from one year to the next. Annually re-weighted chain volume indexes are referenced to the current price values in a chosen reference year.
Consumer price index: The Consumer Price Index (CPI) measures quarterly changes in the price of a 'basket' of goods and services which account for a high proportion of expenditure by the CPI population group (i.e. metropolitan households). This 'basket' covers a wide range of goods and services, arranged in the following eleven groups: food; alcohol and tobacco; clothing and footwear; housing; household contents and services; health; transportation; communication; recreation; education; and financial and insurance services.
Employed: All persons aged 15 years and over who, during the reference week: worked for one hour or more for pay, profit, commission or payment in kind in a job or business, or on a farm (comprising employees, employers and own account workers); or worked for one hour or more without pay in a family business or on a farm (i.e. contributing family workers); or were employees who had a job but were not at work and were: away from work for less than four weeks up to the end of the reference week; or away from work for more than four weeks up to the end of the reference week and received pay for some or all of the four week period to the end of the reference week; or away from work as a standard work or shift arrangement; or on strike or locked out; or on workers' compensation and expected to return to their job; or were employers or own account workers, who had a job, business or farm, but were not at work.
Free on board (FOB): The value of goods measured on a free on board (f.o.b.) basis includes all production and other costs incurred up until the goods are placed on board the international carrier for export. Free on board values exclude international insurance and transport costs. They include the value of the outside packaging in which the product is wrapped, but do not include the value of the international freight containers used for transporting the goods.
NSW Economic Update Spring 2017
33
Gross Domestic Product (GDP): Is the total market value of goods and services produced in Australia within a given period after deducting the cost of goods and services used up in the process of production but before deducting allowances for the consumption of fixed capital. It is equivalent to gross national expenditure plus exports of goods and services less imports of goods and services.
Gross State Product (GSP): GSP is defined equivalently to gross domestic product (GDP) but refers to production within a State or Territory rather than to the nation as a whole.
Labour force: For any group, persons who were employed or unemployed, as defined.
Original estimates: Original collected data containing seasonal patterns, residual noise and irregular influences.
Participation rate: For any group, the labour force expressed as a percentage of the civilian population aged 15 years and over in the same group.
Private business investment: Investment in non-dwelling construction, plus machinery and equipment, plus cultivated biological resources, plus intellectual property products.
Seasonally adjusted estimates: Seasonally adjusted estimates are derived by estimating and removing from the original series systematic calendar related effects, such as seasonal (e.g. Christmas), trading day and moving holiday (e.g. Easter) influences. Seasonal adjustment does not aim to remove the irregular or non-seasonal influences which may be present in any particular month. These irregular influences may reflect both random economic events and difficulties of statistical recording.
Spare capacity: The balance of demand for goods and services relative to the economy’s potential to produce them. In the labour market, a key indicator of spare capacity is the unemployment rate, but a range of other factors also play a significant role.
State Final Demand: A proxy for economic growth that measures the total value of goods and services that are sold in a State to buyers who wish to either consume them or retain them in the form of capital assets. It excludes sales made to buyers who use them as inputs to a production activity, export sales and sales that lead to accumulation of inventories.
Trade weighted index: The weighted average value of the Australian dollar in relation to the currencies of Australia's trading partners.
Trend estimates: A smoothed seasonally adjusted series of estimates.
Underutilisation rate: The sum of the number of persons unemployed and the number of persons in underemployment, expressed as a proportion of the labour force.

NSW Economic Update Spring 2017
34
Underemployment rate: The number of underemployed workers expressed as a percentage of total employed persons.
Underemployed workers: Employed persons aged 15 years and over who want, and are available for, more hours of work than they currently have.
Unemployed: Persons aged 15 years and over who were not employed during the reference week, and: had actively looked for full time or part time work at any time in the four weeks up to the end of the reference week and were available for work in the reference week; or were waiting to start a new job within four weeks from the end of the reference week and could have started in the reference week if the job had been available then.
Unemployment rate: For any group, the number of unemployed persons expressed as a percentage of the labour force in the same group.
Weekly ordinary time earnings: One week's earnings of employees for the reference period, attributable to award, standard or agreed hours of work. It is calculated before taxation and any other deductions (e.g. superannuation, board and lodging) have been made.