nsgold corporation · toronto, on m5h 3v5 telephone: 416-703-6258 toll-free: 1-877-856-0765 upfront...
TRANSCRIPT
eResearch Corporation www.eresearch.ca
Initiating Report June 13, 2011 . . . . . . . . . 3
NSGOLD CORPORATION
(TSX-V: NSX) Recommendation
Speculative Buy
Risk
High
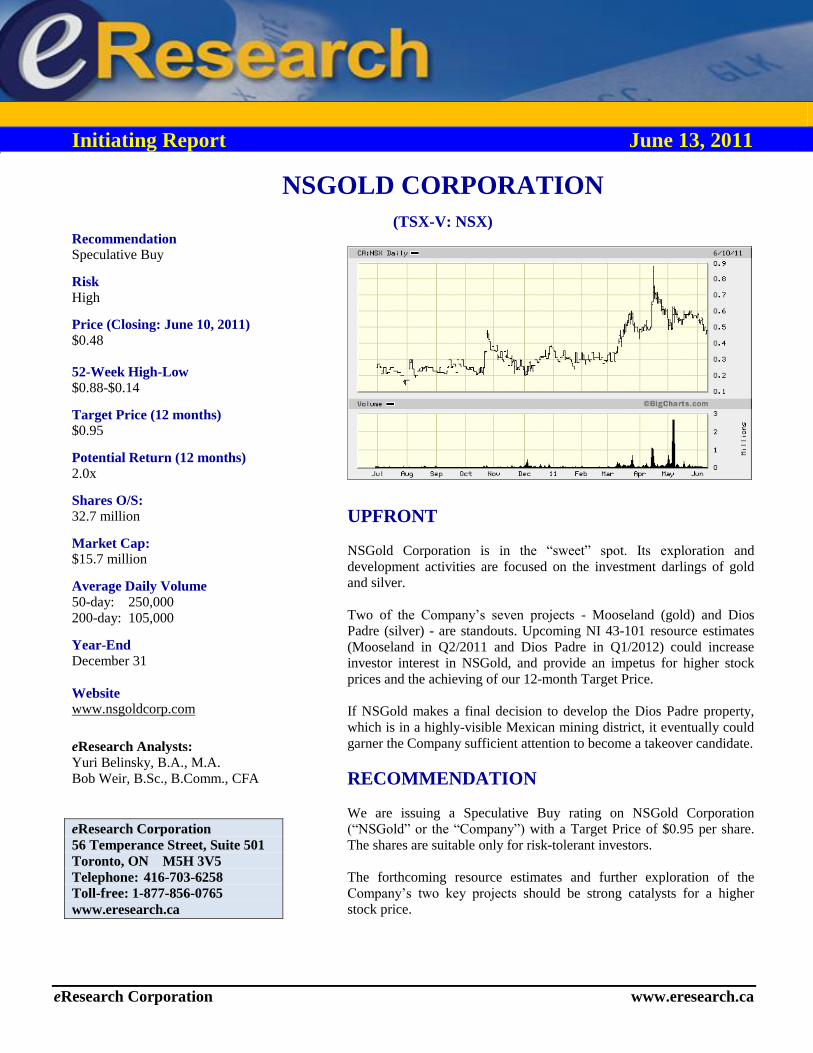
Price (Closing: June 10, 2011)
$0.48
52-Week High-Low
$0.88-$0.14
Target Price (12 months) $0.95
Potential Return (12 months)
2.0x
Shares O/S:
32.7 million
Market Cap: $15.7 million
Average Daily Volume
50-day: 250,000
200-day: 105,000
Year-End
December 31
Website www.nsgoldcorp.com
eResearch Analysts:
Yuri Belinsky, B.A., M.A.
Bob Weir, B.Sc., B.Comm., CFA
eResearch Corporation
56 Temperance Street, Suite 501
Toronto, ON M5H 3V5
Telephone: 416-703-6258
Toll-free: 1-877-856-0765
www.eresearch.ca
UPFRONT
NSGold Corporation is in the “sweet” spot. Its exploration and
development activities are focused on the investment darlings of gold
and silver.
Two of the Company’s seven projects - Mooseland (gold) and Dios
Padre (silver) - are standouts. Upcoming NI 43-101 resource estimates
(Mooseland in Q2/2011 and Dios Padre in Q1/2012) could increase
investor interest in NSGold, and provide an impetus for higher stock
prices and the achieving of our 12-month Target Price.
If NSGold makes a final decision to develop the Dios Padre property,
which is in a highly-visible Mexican mining district, it eventually could
garner the Company sufficient attention to become a takeover candidate.
RECOMMENDATION
We are issuing a Speculative Buy rating on NSGold Corporation
(“NSGold” or the “Company”) with a Target Price of $0.95 per share.
The shares are suitable only for risk-tolerant investors.
The forthcoming resource estimates and further exploration of the
Company’s two key projects should be strong catalysts for a higher
stock price.
NSGold Corporation Initiating Report
eResearch Corporation: www.eresearch.ca June 10, 2011 Page 2
COMPANY PROFILE
NSGold Corporation is an exploration company with properties in Canada and Mexico:
The Company’s flagship project is the Mooseland gold property. It has an historic resource estimate of 640,070
tonnes, at 16.1 g/t, containing 304,000 oz of gold.
The Company’s other Canadian projects are less developed.
Since April 2011, NSGold has held a definitive option to acquire 100% of the Dios Padre project in Mexico. The
project’s historic resource estimates are between 45 M oz and 75 M oz of silver.
INVESTMENT CONSIDERATIONS A. Strengths
NSGold recently obtained a NI 43-101 resource estimate for Mooseland’s West Zone, and is actively
working to get an estimate for the whole project before the end of June 2011. The estimate for the West Zone
indicates that Mooseland’s resource estimate may grow by more than 70% as compared to the historic
estimate.
The Mooseland gold project has good infrastructure that includes substantial underground workings.
The Company has published a Technical Report on the Dios Padre project and is working on an NI 43-101
resource estimate, which may be ready in Q1/2012. The project is a promising one as it hosts an historic
silver mine and has gold mineralization.
The Company is also going ahead with its third project, Leipsigate. This gold project should benefit from
$300,000 of exploration in 2011.
NSGold has enough options/warrants in-the-money and expiring in 2011-early 2012 to finance its next 12
months’ $3.5 million capex program. The Company’s cash and cash equivalents position is strong, about $1
million in cash and $0.8 million in Guaranteed Investment Certificates (end of May 2011).
B. Challenges
NSGold does not have a NI 43-101 compliant resource estimate for all of its projects.
The Company will need to raise financing for its 2012 exploration program.
It is uncertain whether the Company will exercise its option to purchase the Dios Padre project.
There will continue to be volatility in gold and silver prices.
Table 1: NSGold's Properties
Properties Location Size, ha Ownership Metal
Mooseland Nova Scotia 1,182 100%* Gold
Leipsigate Nova Scotia 2,168 100%* Gold
Cheticamp Nova Scotia 2,362 100%* Gold Indian Path Nova Scotia NA 100%* Gold
Blockhouse Nova Scotia 162 100%* Gold
French Village Nova Scotia NA 100%* Lead, zinc, gold, copper
Dios Padre Sonora, Mexico 285 optioned Silver
* All of the properties denoted by * were purchased from the same vendor. Transfer of ownership requires a final payment of
$250,000 for all six properties by September 1, 2011
NSGold Corporation Initiating Report
eResearch Corporation: www.eresearch.ca June 10, 2011 Page 3
KEY PROPERTIES
1. Mooseland Gold Property, Nova Scotia
(a) An updated resource estimate for Mooseland is expected to come later in June. In 2010, NSGold completed
phase 1 (26 diamond drill holes, 6,500 metres) of a drilling program at its flagship Mooseland gold project. The
Company has published assay results showing drilling results for both the West and East zones of the project, as well as
an NI 43-101 compliant resource estimate for the West Zone only (see below).
COMMENT: We estimate that the updated NI 43-101 resource estimate for the project as a whole will most likely be
published before the end of June 2011.
Table 2. NI 43-101 Resource Estimate for the West Zone, 2011
Cut-off Grade
(g/tonne)
Tonnes Above
Cut-off
Average Diluted
Grade (g/tonne)
Inferred
Ounces
4.0 930,000 5.2 160,000
3.0 1,400,000 4.6 210,000
Source: Company
COMMENT: The historic resource estimate for Mooseland, as a whole, (not shown) is 640,070 tonnes (uncut) @ 16.1 g/t containing 304,000 oz of gold. The new estimate for the West Zone alone (shown above) is 210,000 oz at a 3.0 g/t
cut-off. In the previous estimate, the West Zone accounted for 40% of the total Mooseland resource. If this ratio holds,
the new estimate for the project, as a whole, will be 525,000 oz, or 73% higher than the historic estimate.
(b) Mooseland to receive further exploration in 2011. To expand the claim blocks and increase the resource
estimate, NSGold plans to conduct airborne geophysical surveys and surface drilling later in 2011. The next phase of
the exploration program at Mooseland could cost up to $1 million.
COMMENT: We expect that NSGold will have sufficient funds for the expanded exploration program (see Financial
Review and Outlook on page 10).
(c) Acquisition of Mooseland should finalize in 2011, and surface rights should be acquired. By September 1,
2011, NSGold should complete the final payment of $250,000 (out of a total of $750,000) to Globex Mining
Enterprises Inc. to acquire a 100% interest in Mooseland and five other early-stage projects (see Appendix 1 on Page
14). The surface rights to Mooseland are owned by individuals, companies, and the Crown. The Company intends
either to acquire land rights or receive permission from the current owners to develop the property. Underground
exploration, which may resume in 2012 at the Azure decline, will require approval from various government agencies.
2. Leipsigate Gold Property, Nova Scotia
Leipsigate continues to promise future success. In 2010, NSGold completed three diamond drill holes (281 metres)
on its Leipsigate property (see Appendix 1). The holes intersected some anomalous gold values and identified targets
for further exploration. These results reaffirm that Leipsigate hosts several historic shafts within a gold-bearing “Main
Fissure Vein”. The Company intends to drill 4-5 new holes on the property in 2011. The 2011 exploration budget for
the property, which also includes an airborne survey, comes to around $300,000.
3. Dios Padre Silver Property, Sonora, Mexico
(a) The Dios Padre project is the other major focus of NSGold. In April 2011, NSGold signed a definitive option
agreement with Cia Minera Pena Blanca to acquire 100% of the Dios Padre property in Mexico that includes an historic
silver mine. NSGold made a $70,000 payment at the date of execution of the agreement. Payments to the vendor should
total US$6 million in cash, and 1,250,000 common shares paid in ten equal installments over five years.
NSGold Corporation Initiating Report
eResearch Corporation: www.eresearch.ca June 10, 2011 Page 4
COMMENT: NSGold has just published an NI 43-101 compliant Technical Report, but without a resource estimate,
on the property, and we expect that the Company will continue exploring the property and making option payments.
(b) Resource estimate should come next year. We expect that, in 2011, NSGold will spend up to $1 million on Dios
Padre exploration that should involve surface mapping and sampling, as well as underground drilling and twinning of
the previously drilled 20 holes. This should allow the Company to obtain an NI 43-101 compliant resource estimate.
COMMENT: We expect that a NI 43-101 resource estimate for the Dios Padre project will be published in 1Q-2012. Management expects that the new estimate will confirm or exceed historic estimates for the project, which range
between 45 million oz and 75 million oz of recoverable silver in M+I+I resources.
(c) Technical Report recommends searching for gold and extending the exploration area. The Technical Report
summarized historic exploration and mining at the property as well as a field examination conducted in 2011. Surface
samples taken in 2011 yielded silver values of 103 g/t silver and 2.08% lead over 35 meters and 178 g/t silver with
3.3% lead over 30 meters.
The Report’s major finding is that there is gold mineralization at the property, as hand-picked samples brought up to 3
g/t of gold grades. Gold mineralization at the property does not coincide with previously-identified silver zones, and the
Report calls for more comprehensive exploration of the gold zones.
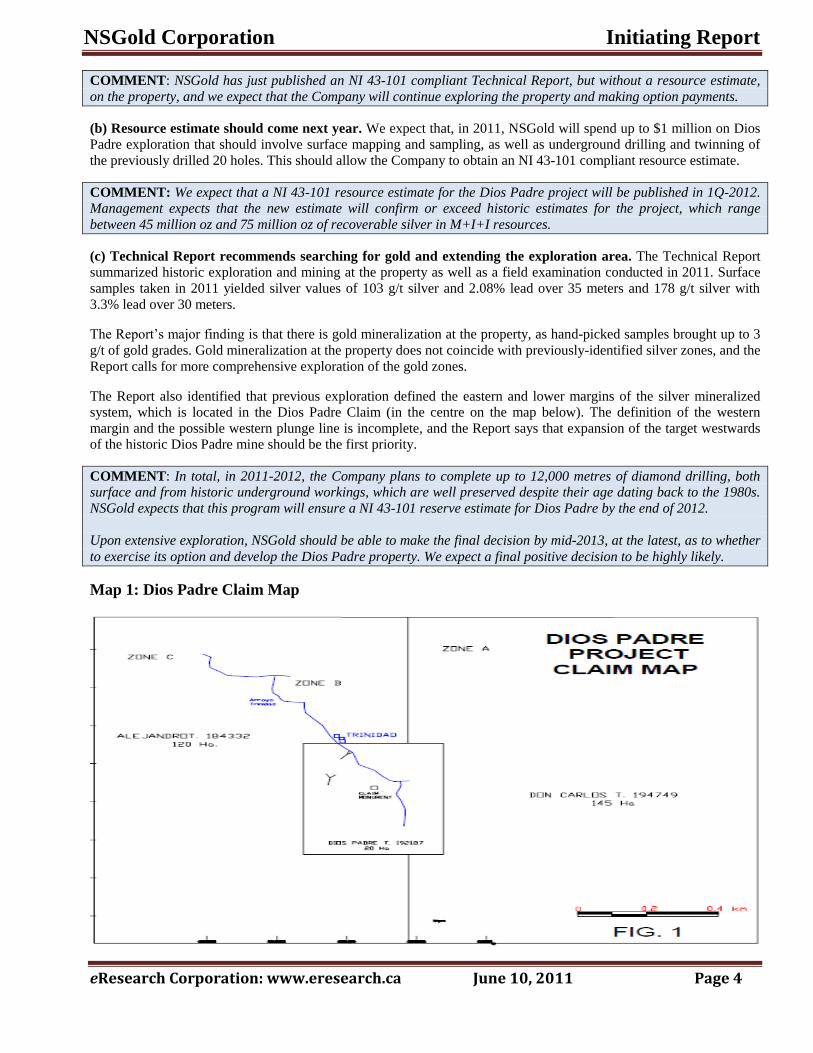
The Report also identified that previous exploration defined the eastern and lower margins of the silver mineralized
system, which is located in the Dios Padre Claim (in the centre on the map below). The definition of the western
margin and the possible western plunge line is incomplete, and the Report says that expansion of the target westwards
of the historic Dios Padre mine should be the first priority.
COMMENT: In total, in 2011-2012, the Company plans to complete up to 12,000 metres of diamond drilling, both surface and from historic underground workings, which are well preserved despite their age dating back to the 1980s.
NSGold expects that this program will ensure a NI 43-101 reserve estimate for Dios Padre by the end of 2012.
Upon extensive exploration, NSGold should be able to make the final decision by mid-2013, at the latest, as to whether
to exercise its option and develop the Dios Padre property. We expect a final positive decision to be highly likely.
Map 1: Dios Padre Claim Map
NSGold Corporation Initiating Report
eResearch Corporation: www.eresearch.ca June 10, 2011 Page 5
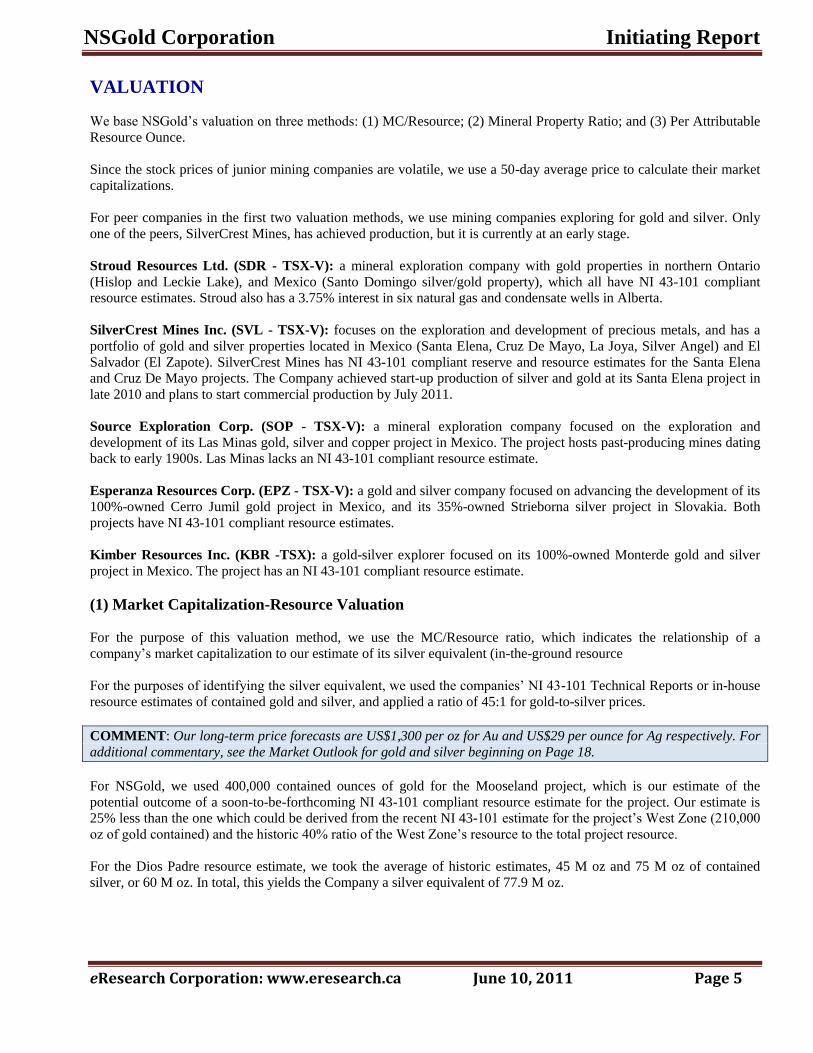
VALUATION
We base NSGold’s valuation on three methods: (1) MC/Resource; (2) Mineral Property Ratio; and (3) Per Attributable
Resource Ounce.
Since the stock prices of junior mining companies are volatile, we use a 50-day average price to calculate their market
capitalizations.
For peer companies in the first two valuation methods, we use mining companies exploring for gold and silver. Only
one of the peers, SilverCrest Mines, has achieved production, but it is currently at an early stage.
Stroud Resources Ltd. (SDR - TSX-V): a mineral exploration company with gold properties in northern Ontario
(Hislop and Leckie Lake), and Mexico (Santo Domingo silver/gold property), which all have NI 43-101 compliant
resource estimates. Stroud also has a 3.75% interest in six natural gas and condensate wells in Alberta.
SilverCrest Mines Inc. (SVL - TSX-V): focuses on the exploration and development of precious metals, and has a
portfolio of gold and silver properties located in Mexico (Santa Elena, Cruz De Mayo, La Joya, Silver Angel) and El
Salvador (El Zapote). SilverCrest Mines has NI 43-101 compliant reserve and resource estimates for the Santa Elena
and Cruz De Mayo projects. The Company achieved start-up production of silver and gold at its Santa Elena project in
late 2010 and plans to start commercial production by July 2011.
Source Exploration Corp. (SOP - TSX-V): a mineral exploration company focused on the exploration and
development of its Las Minas gold, silver and copper project in Mexico. The project hosts past-producing mines dating
back to early 1900s. Las Minas lacks an NI 43-101 compliant resource estimate.
Esperanza Resources Corp. (EPZ - TSX-V): a gold and silver company focused on advancing the development of its
100%-owned Cerro Jumil gold project in Mexico, and its 35%-owned Strieborna silver project in Slovakia. Both
projects have NI 43-101 compliant resource estimates.
Kimber Resources Inc. (KBR -TSX): a gold-silver explorer focused on its 100%-owned Monterde gold and silver
project in Mexico. The project has an NI 43-101 compliant resource estimate.
(1) Market Capitalization-Resource Valuation
For the purpose of this valuation method, we use the MC/Resource ratio, which indicates the relationship of a
company’s market capitalization to our estimate of its silver equivalent (in-the-ground resource
For the purposes of identifying the silver equivalent, we used the companies’ NI 43-101 Technical Reports or in-house
resource estimates of contained gold and silver, and applied a ratio of 45:1 for gold-to-silver prices.
COMMENT: Our long-term price forecasts are US$1,300 per oz for Au and US$29 per ounce for Ag respectively. For
additional commentary, see the Market Outlook for gold and silver beginning on Page 18.
For NSGold, we used 400,000 contained ounces of gold for the Mooseland project, which is our estimate of the
potential outcome of a soon-to-be-forthcoming NI 43-101 compliant resource estimate for the project. Our estimate is
25% less than the one which could be derived from the recent NI 43-101 estimate for the project’s West Zone (210,000
oz of gold contained) and the historic 40% ratio of the West Zone’s resource to the total project resource.
For the Dios Padre resource estimate, we took the average of historic estimates, 45 M oz and 75 M oz of contained
silver, or 60 M oz. In total, this yields the Company a silver equivalent of 77.9 M oz.
NSGold Corporation Initiating Report
eResearch Corporation: www.eresearch.ca June 10, 2011 Page 6
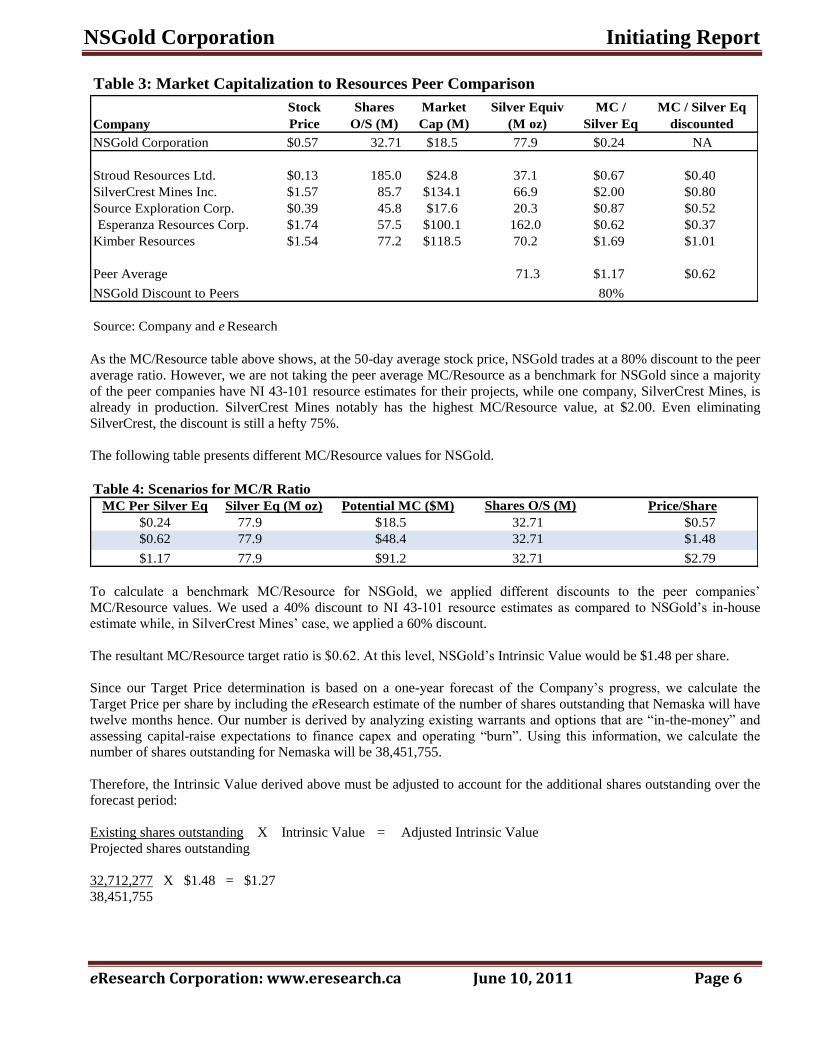
Table 3: Market Capitalization to Resources Peer Comparison
Company
Stock
Price
Shares
O/S (M)
Market
Cap (M)
Silver Equiv
(M oz)
MC /
Silver Eq
MC / Silver Eq
discounted
NSGold Corporation $0.57 32.71 $18.5 77.9 $0.24 NA
Stroud Resources Ltd. $0.13 185.0 $24.8 37.1 $0.67 $0.40
SilverCrest Mines Inc. $1.57 85.7 $134.1 66.9 $2.00 $0.80
Source Exploration Corp. $0.39 45.8 $17.6 20.3 $0.87 $0.52
Esperanza Resources Corp. $1.74 57.5 $100.1 162.0 $0.62 $0.37
Kimber Resources $1.54 77.2 $118.5 70.2 $1.69 $1.01
Peer Average 71.3 $1.17 $0.62
NSGold Discount to Peers 80%
Source: Company and e Research
As the MC/Resource table above shows, at the 50-day average stock price, NSGold trades at a 80% discount to the peer
average ratio. However, we are not taking the peer average MC/Resource as a benchmark for NSGold since a majority
of the peer companies have NI 43-101 resource estimates for their projects, while one company, SilverCrest Mines, is
already in production. SilverCrest Mines notably has the highest MC/Resource value, at $2.00. Even eliminating
SilverCrest, the discount is still a hefty 75%.
The following table presents different MC/Resource values for NSGold.
Table 4: Scenarios for MC/R Ratio
MC Per Silver Eq Silver Eq (M oz) Potential MC ($M) Shares O/S (M) Price/Share
$0.24 77.9 $18.5 32.71 $0.57
$0.62 77.9 $48.4 32.71 $1.48
$1.17 77.9 $91.2 32.71 $2.79
To calculate a benchmark MC/Resource for NSGold, we applied different discounts to the peer companies’
MC/Resource values. We used a 40% discount to NI 43-101 resource estimates as compared to NSGold’s in-house
estimate while, in SilverCrest Mines’ case, we applied a 60% discount.
The resultant MC/Resource target ratio is $0.62. At this level, NSGold’s Intrinsic Value would be $1.48 per share.
Since our Target Price determination is based on a one-year forecast of the Company’s progress, we calculate the
Target Price per share by including the eResearch estimate of the number of shares outstanding that Nemaska will have
twelve months hence. Our number is derived by analyzing existing warrants and options that are “in-the-money” and
assessing capital-raise expectations to finance capex and operating “burn”. Using this information, we calculate the
number of shares outstanding for Nemaska will be 38,451,755.
Therefore, the Intrinsic Value derived above must be adjusted to account for the additional shares outstanding over the
forecast period:
Existing shares outstanding X Intrinsic Value = Adjusted Intrinsic Value
Projected shares outstanding
32,712,277 X $1.48 = $1.27
38,451,755
NSGold Corporation Initiating Report
eResearch Corporation: www.eresearch.ca June 10, 2011 Page 7
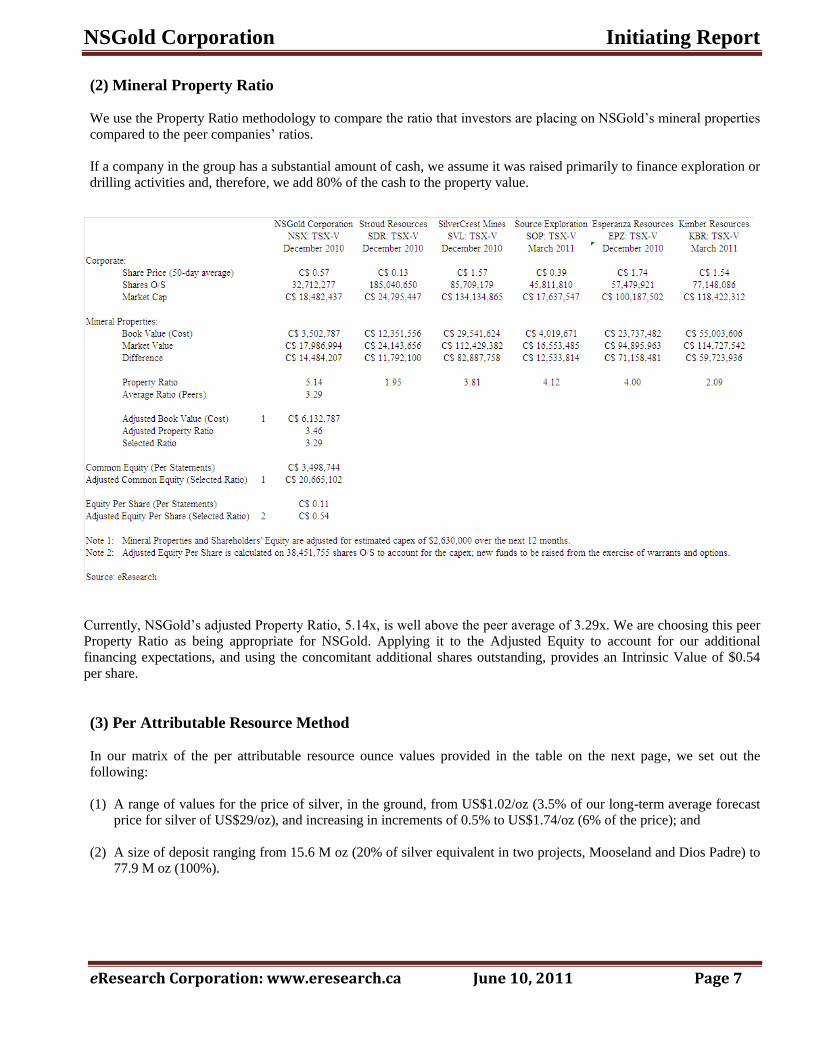
(2) Mineral Property Ratio
We use the Property Ratio methodology to compare the ratio that investors are placing on NSGold’s mineral properties
compared to the peer companies’ ratios.
If a company in the group has a substantial amount of cash, we assume it was raised primarily to finance exploration or
drilling activities and, therefore, we add 80% of the cash to the property value.
Currently, NSGold’s adjusted Property Ratio, 5.14x, is well above the peer average of 3.29x. We are choosing this peer
Property Ratio as being appropriate for NSGold. Applying it to the Adjusted Equity to account for our additional
financing expectations, and using the concomitant additional shares outstanding, provides an Intrinsic Value of $0.54
per share.
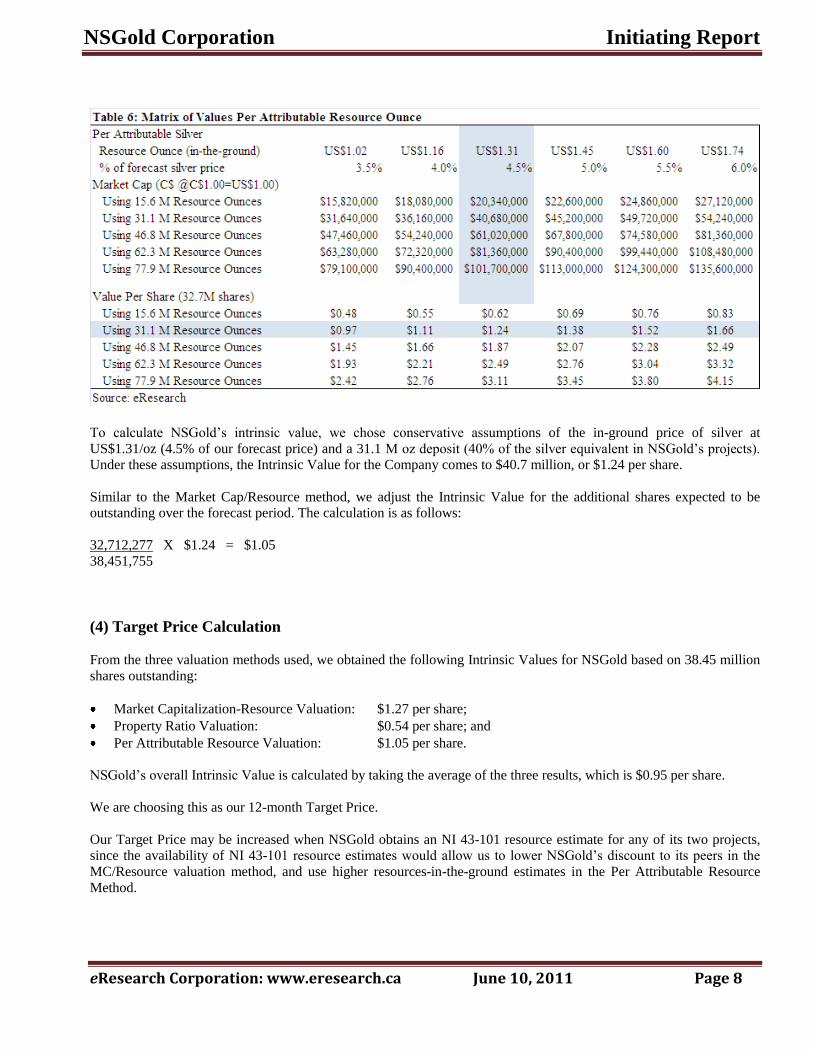
(3) Per Attributable Resource Method
In our matrix of the per attributable resource ounce values provided in the table on the next page, we set out the
following:
(1) A range of values for the price of silver, in the ground, from US$1.02/oz (3.5% of our long-term average forecast
price for silver of US$29/oz), and increasing in increments of 0.5% to US$1.74/oz (6% of the price); and
(2) A size of deposit ranging from 15.6 M oz (20% of silver equivalent in two projects, Mooseland and Dios Padre) to
77.9 M oz (100%).
NSGold Corporation Initiating Report
eResearch Corporation: www.eresearch.ca June 10, 2011 Page 8
To calculate NSGold’s intrinsic value, we chose conservative assumptions of the in-ground price of silver at
US$1.31/oz (4.5% of our forecast price) and a 31.1 M oz deposit (40% of the silver equivalent in NSGold’s projects).
Under these assumptions, the Intrinsic Value for the Company comes to $40.7 million, or $1.24 per share.
Similar to the Market Cap/Resource method, we adjust the Intrinsic Value for the additional shares expected to be
outstanding over the forecast period. The calculation is as follows:
32,712,277 X $1.24 = $1.05
38,451,755
(4) Target Price Calculation
From the three valuation methods used, we obtained the following Intrinsic Values for NSGold based on 38.45 million
shares outstanding:
Market Capitalization-Resource Valuation: $1.27 per share;
Property Ratio Valuation: $0.54 per share; and
Per Attributable Resource Valuation: $1.05 per share.
NSGold’s overall Intrinsic Value is calculated by taking the average of the three results, which is $0.95 per share.
We are choosing this as our 12-month Target Price.
Our Target Price may be increased when NSGold obtains an NI 43-101 resource estimate for any of its two projects,
since the availability of NI 43-101 resource estimates would allow us to lower NSGold’s discount to its peers in the
MC/Resource valuation method, and use higher resources-in-the-ground estimates in the Per Attributable Resource
Method.
NSGold Corporation Initiating Report
eResearch Corporation: www.eresearch.ca June 10, 2011 Page 9
RATING AND RISKS
We rate the stock a Speculative Buy.
The Company’s risks stem from:
Commodity Markets: NSGold’s future cash flows depend on the trends in silver and gold prices.
Early Business Stage: The Company still has not made a final decision on the acquisition of the Dios Padre
project, and lacks NI 43-101 resource estimates for any of its (complete) projects. These factors exacerbate risks
pertinent to early-stage exploration companies.
Financing Risk: The ability to raise capital is an issue for the Company. To obtain resource estimates for its two
key properties and further explore them, the Company needs to raise about $3.5 million in 2011. Of this amount, it
has already raised over $1 million. In 2012, the Company will need to raise up to $2 million to continue major
exploration programs at the Mooseland and Dios Padre projects and potential sources for this financing at the
moment are less definite.
NSGold Corporation Initiating Report
eResearch Corporation: www.eresearch.ca June 10, 2011 Page 10
FINANCIAL REVIEW AND OUTLOOK
Year End: December 31. NSGold changed its reporting date in Q1/2011. Currently, comparative financial statements
date back only as far as 2010.
Revenues: NSGold is an early-stage exploration company. It has not yet generated any operating revenues and is not
likely to have any for the next few years. In 2010, it had $3,504 in interest income from cash balances, and we expect
that this income will remain relatively flat in 2011.
Burn Rate: NSGold’s average monthly burn rate, which includes non-discretionary expenses, was approximately
$22,500 in 2010.The annual rate amounted to around $270,000. We expect that, in 2011, the burn rate will rise by 25%
to $28,300 monthly, or $340,000 for the year, as a result of the expected acquisition of the Dios Padre property.
Cash: The Company’s cash and cash equivalents position as of December 31, 2010 was $1.3 million. As of May 31,
2011, it grew to $1.8 million, of which the Company had $1 million in cash and $0.8 million in short term investments
(GIC).
Capital Expenditures (Capex) on Exploration Activities: We expect that the Company’s capex in 2011 will amount
to $2.625 million, including $1 million for Mooseland, $1 million for Dios Padre, and $0.3 million for Leipsigate. In
addition, we expect that $75,000 will be paid for Dios Padre’s option and $250,000 as a final payment for Mooseland.
We expect that the 2012 capex program’s budget will in the same range as in 2011.
Financing: NSGold raised around $3.78 million in 2010. We expect the Company will raise $3.5 million in 2011. All of
these funds will likely come from the exercise of options/warrants (see below). NSGold has already raised just over $1
million from options/warrants in 2011. Alternatively, the Company could draw down on its $1.2 million short-term
investment position (held in Guaranteed Investment Certificates) and/or raise the funds in the open market. As we
expect that the Company will have just over $200,000 in cash left at the end of 2011, it will need to raise around $2
million to continue its exploration programs in 2012.
Warrants and Options: In our calculation of the number of warrants/options to be exercised during 2011, we assume
that holders exercise their warrants and options near to the expiry dates. Using this assumption, and given our Target
Price for the stock ($0.95), some 9.7 million warrants and options could be exercised in 2011 for as much as $4.4
million (see italicized entries in the table on the next page).
COMMENT: Of the 9.7 million maximum, we assume that about 80% of these warrants/options will be exercised, or 7.7 million. This, and 250,000 shares which NSGold could issue for Dios Padre in 2011, would bring the number of
shares outstanding at the end of 2011 to 38.5 million.
NSGold Corporation Initiating Report
eResearch Corporation: www.eresearch.ca June 10, 2011 Page 11
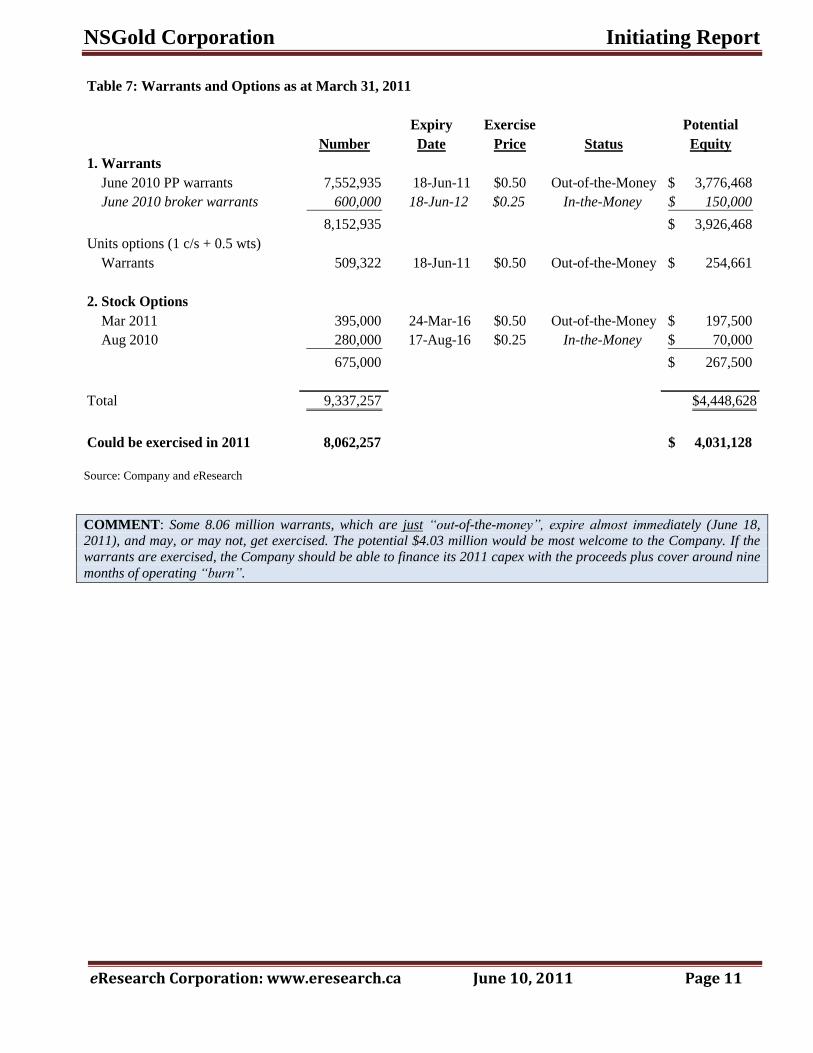
Table 7: Warrants and Options as at March 31, 2011
Expiry Exercise Potential
Number Date Price Status Equity
1. Warrants
June 2010 PP warrants 7,552,935 18-Jun-11 $0.50 Out-of-the-Money 3,776,468$
June 2010 broker warrants 600,000 18-Jun-12 $0.25 In-the-Money 150,000$
8,152,935 3,926,468$
Units options (1 c/s + 0.5 wts)
Warrants 509,322 18-Jun-11 $0.50 Out-of-the-Money 254,661$
2. Stock Options
Mar 2011 395,000 24-Mar-16 $0.50 Out-of-the-Money 197,500$
Aug 2010 280,000 17-Aug-16 $0.25 In-the-Money 70,000$
675,000 267,500$
Total 9,337,257 $4,448,628
Could be exercised in 2011 8,062,257 4,031,128$
Source: Company and eResearch
COMMENT: Some 8.06 million warrants, which are just “out-of-the-money”, expire almost immediately (June 18, 2011), and may, or may not, get exercised. The potential $4.03 million would be most welcome to the Company. If the
warrants are exercised, the Company should be able to finance its 2011 capex with the proceeds plus cover around nine
months of operating “burn”.
NSGold Corporation Initiating Report
eResearch Corporation: www.eresearch.ca June 10, 2011 Page 12
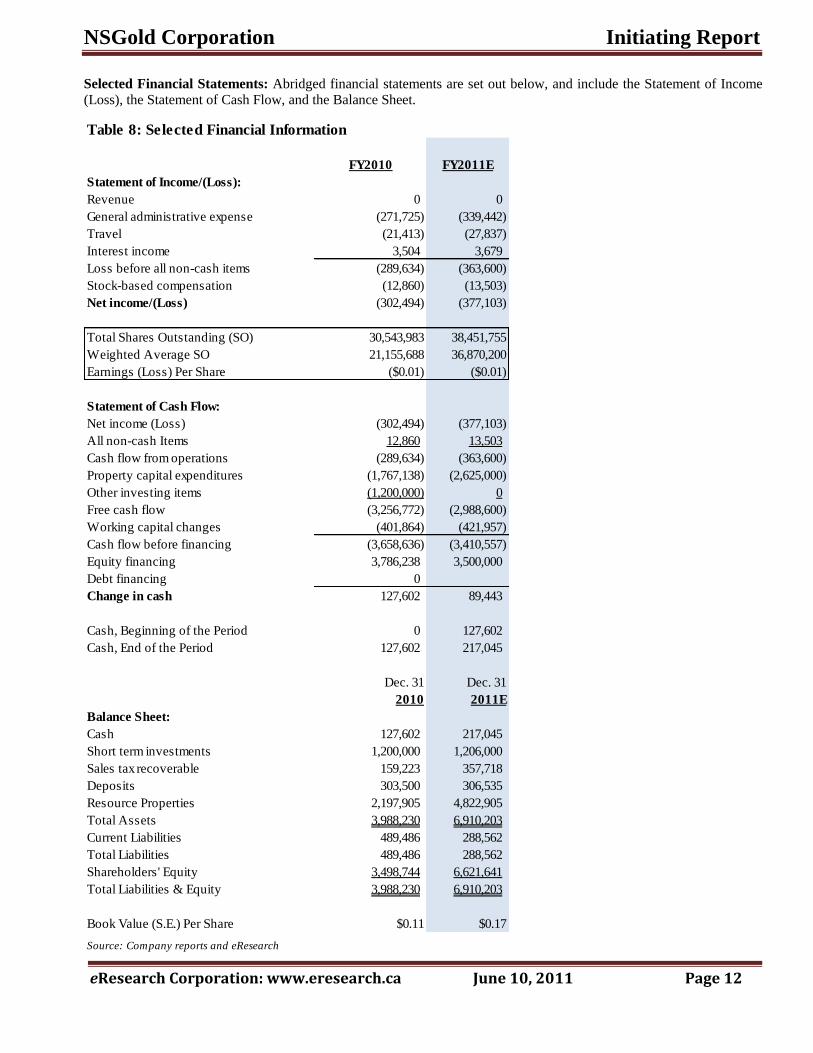
Selected Financial Statements: Abridged financial statements are set out below, and include the Statement of Income
(Loss), the Statement of Cash Flow, and the Balance Sheet.
Table 8: Selected Financial Information
FY2010 FY2011E
Statement of Income/(Loss):
Revenue 0 0
General administrative expense (271,725) (339,442)
Travel (21,413) (27,837)
Interest income 3,504 3,679
Loss before all non-cash items (289,634) (363,600)
Stock-based compensation (12,860) (13,503)
Net income/(Loss) (302,494) (377,103)
Total Shares Outstanding (SO) 30,543,983 38,451,755
Weighted Average SO 21,155,688 36,870,200
Earnings (Loss) Per Share ($0.01) ($0.01)
Statement of Cash Flow:
Net income (Loss) (302,494) (377,103)
All non-cash Items 12,860 13,503
Cash flow from operations (289,634) (363,600)
Property capital expenditures (1,767,138) (2,625,000)
Other investing items (1,200,000) 0
Free cash flow (3,256,772) (2,988,600)
Working capital changes (401,864) (421,957)
Cash flow before financing (3,658,636) (3,410,557)
Equity financing 3,786,238 3,500,000
Debt financing 0
Change in cash 127,602 89,443
Cash, Beginning of the Period 0 127,602
Cash, End of the Period 127,602 217,045
Dec. 31 Dec. 31
2010 2011E
Balance Sheet:
Cash 127,602 217,045
Short term investments 1,200,000 1,206,000
Sales tax recoverable 159,223 357,718
Deposits 303,500 306,535
Resource Properties 2,197,905 4,822,905
Total Assets 3,988,230 6,910,203
Current Liabilities 489,486 288,562
Total Liabilities 489,486 288,562
Shareholders' Equity 3,498,744 6,621,641
Total Liabilities & Equity 3,988,230 6,910,203
Book Value (S.E.) Per Share $0.11 $0.17
Source: Company reports and eResearch
NSGold Corporation Initiating Report
eResearch Corporation: www.eresearch.ca June 10, 2011 Page 13
MANAGEMENT & DIRECTORS The following biographies have been sourced from the Company’s website:
Johannes H.C. van Hoof: President, CEO and Chairman of the Board of Directors Johannes (Hans) van Hoof has 22 years of experience in finance and investment. He has held senior positions at various
European financial institutions, including PVF Pension Funds, Paribas Capital Markets and Bankers Trust. Mr. van Hoof
has been senior Portfolio Manager, senior Risk Manager, Deputy Head of global equity derivatives, Managing Director
responsible for M&A arbitrage, derivatives arbitrage and venture capital investments as well as Chairman and Senior
Executive Officer of Soros Funds Limited in London. In 2002, Mr. van Hoof founded VHC Partners Alternative
Investment Management Group, which is active in hedge fund management, corporate and project finance advisory
services, private equity investments, and charitable projects.
COMMENT: For better governance, we believe there should be a separation of the Chairman and President/CEO positions. Combining the positions weakens the strength of executive management. Centralized management control
denies a company the advantage of diversified executive management and their extensive knowledge and experience.
Glenn A. Holmes: Vice-President, Finance and CFO Glenn Holmes is a mining executive with experience in the financial management of listed junior mining companies.
His work experience includes equity financings, flow-through share financings, debt financings, corporate acquisitions,
mining feasibility studies and financial restructurings. Mr. Holmes joined NovaGold Resources Inc. in 1987 as
Corporate Controller. From 2004 to December 2009, Mr. Holmes was CFO and Vice-President Finance of Etruscan
Resources Inc. Mr. Holmes has a B. Comm degree and a C.A. designation.
Neil Wiener: Secretary
Neil Wiener is a partner with the law firm Heenan Blaikie LLP. He practices in the area of securities law, with an
emphasis on public financings. Mr. Wiener has been involved in public offerings, for both issuers and underwriters, as
well as private placements, take-over bids, reverse take-overs, going-private transactions, stock exchange listings, and a
broad range of other securities matters. He is a director of Quest Uranium Corporation and Dianor Resources Inc., and a
former director of Freewest Resources Canada Inc.
Grant Loon: Director
Grant Loon has experience in financial services, in operations and trading execution roles. He has worked for
institutional sell-side proprietary trading and buy-side hedge fund management companies. As COO of the VHC Group,
Mr. Loon was responsible for its operations, and maintained multi-office trading and operational infrastructure. Most
recently, Mr. Loon has established a multi-fund operations infrastructure and risk management framework for a
European-based hedge fund management company. Prior to joining the VHC Group, Mr. Loon worked at Soros Funds
Limited and Commerzbank Global Equities.
James M. Proudfoot: Director
James M. Proudfoot’s experience is with the mining industry as a mining engineer and independent consultant. In the
last 45 years, he has held senior production management positions with several mining companies, including Noranda
Mines as a production engineer and Mine Superintendent, and Chief Engineer for Anaconda America Brass Ltd. Mr.
Proudfoot has experience in all segments of mining: from exploration through project design and construction to
operations management. Since 1976, Mr. Proudfoot has been President of James M. Proudfoot Limited, an independent
consulting mining engineering firm. He is currently a director of Lovitt Resources Inc. Mr. Proudfoot is a Qualified
Person and holds a B.Sc. degree, Geology and Mathematics, from Acadia University (1957), a B.Eng. degree, Mining
Engineering, from McGill University (1959) and a CMA Society of Industrial Accountant (1970).
NSGold Corporation Initiating Report
eResearch Corporation: www.eresearch.ca June 10, 2011 Page 14
APPENDIX 1: CORPORATE PROPERTIES
1. MOOSELAND
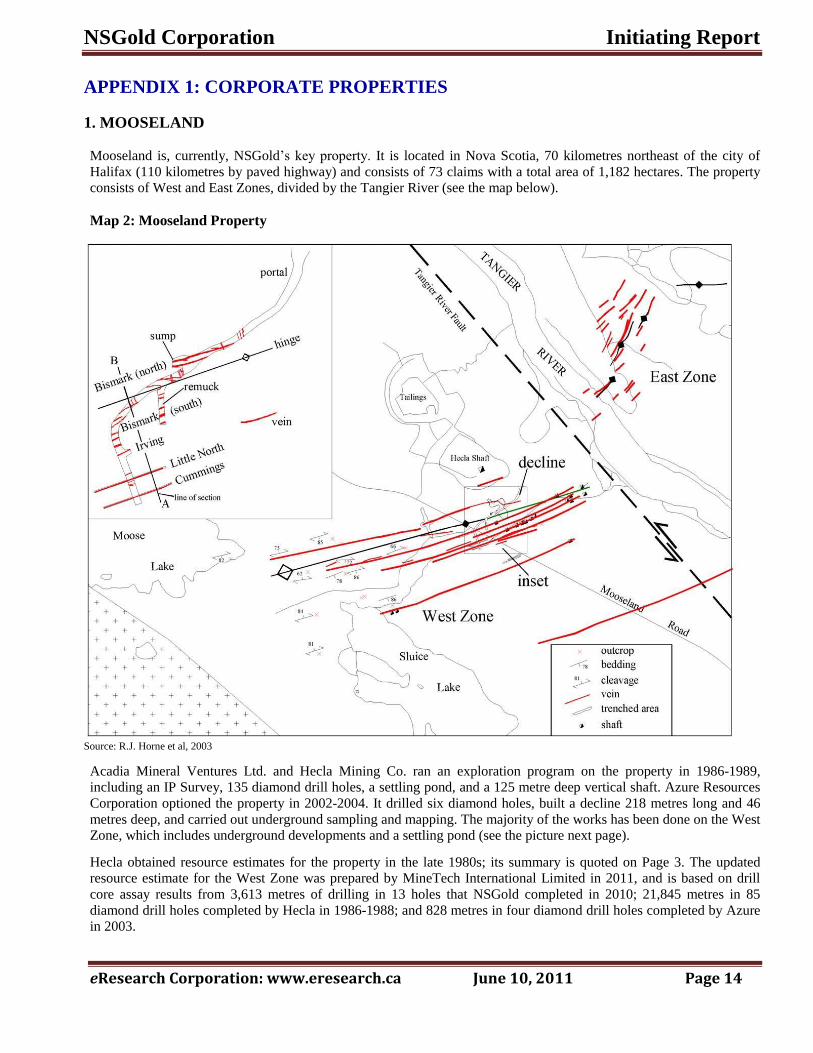
Mooseland is, currently, NSGold’s key property. It is located in Nova Scotia, 70 kilometres northeast of the city of
Halifax (110 kilometres by paved highway) and consists of 73 claims with a total area of 1,182 hectares. The property
consists of West and East Zones, divided by the Tangier River (see the map below).
Map 2: Mooseland Property
Source: R.J. Horne et al, 2003
Acadia Mineral Ventures Ltd. and Hecla Mining Co. ran an exploration program on the property in 1986-1989,
including an IP Survey, 135 diamond drill holes, a settling pond, and a 125 metre deep vertical shaft. Azure Resources
Corporation optioned the property in 2002-2004. It drilled six diamond holes, built a decline 218 metres long and 46
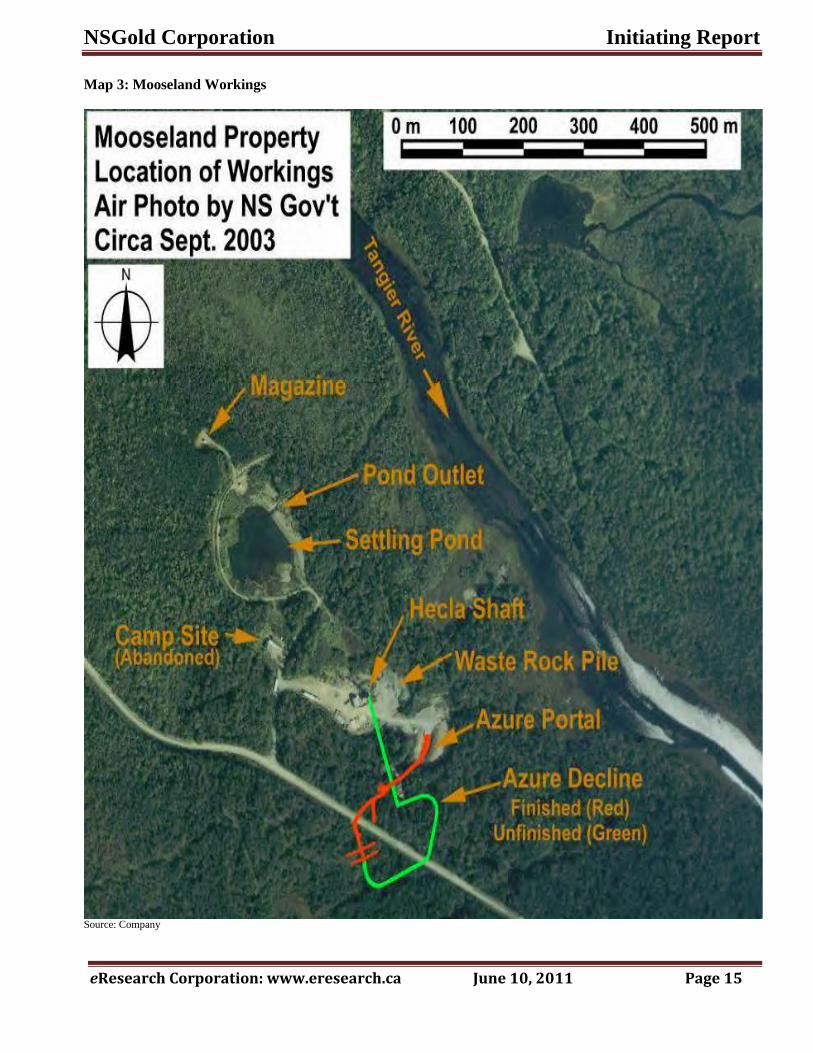
metres deep, and carried out underground sampling and mapping. The majority of the works has been done on the West
Zone, which includes underground developments and a settling pond (see the picture next page).
Hecla obtained resource estimates for the property in the late 1980s; its summary is quoted on Page 3. The updated
resource estimate for the West Zone was prepared by MineTech International Limited in 2011, and is based on drill
core assay results from 3,613 metres of drilling in 13 holes that NSGold completed in 2010; 21,845 metres in 85
diamond drill holes completed by Hecla in 1986-1988; and 828 metres in four diamond drill holes completed by Azure in 2003.
NSGold Corporation Initiating Report
eResearch Corporation: www.eresearch.ca June 10, 2011 Page 15
Map 3: Mooseland Workings
Source: Company
NSGold Corporation Initiating Report
eResearch Corporation: www.eresearch.ca June 10, 2011 Page 16
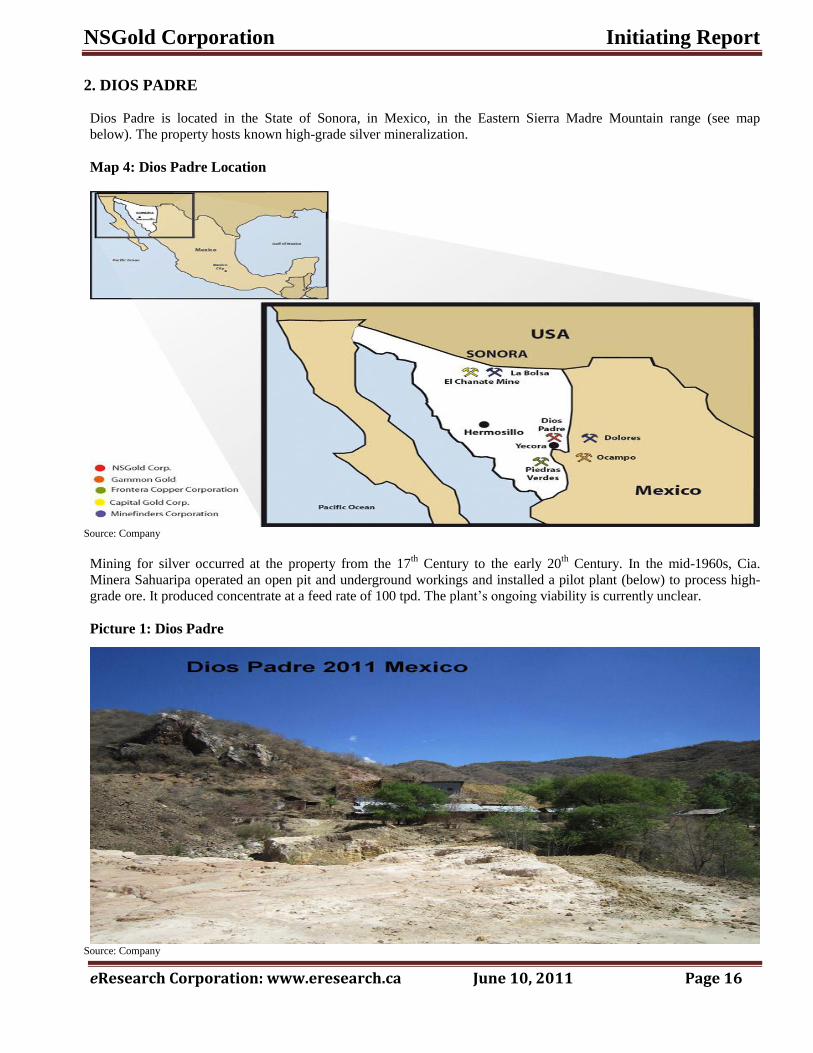
2. DIOS PADRE
Dios Padre is located in the State of Sonora, in Mexico, in the Eastern Sierra Madre Mountain range (see map
below). The property hosts known high-grade silver mineralization.
Map 4: Dios Padre Location
Source: Company
Mining for silver occurred at the property from the 17th Century to the early 20
th Century. In the mid-1960s, Cia.
Minera Sahuaripa operated an open pit and underground workings and installed a pilot plant (below) to process high-
grade ore. It produced concentrate at a feed rate of 100 tpd. The plant’s ongoing viability is currently unclear.
Picture 1: Dios Padre
Source: Company
NSGold Corporation Initiating Report
eResearch Corporation: www.eresearch.ca June 10, 2011 Page 17
The pilot testing demonstrated that the Dios Padre ore responds well to conventional milling and flotation, yielding a
concentrate with 87% recovery of silver and 80% recovery of copper and lead. Smelter receipts also included credits
for gold and zinc, which were not assayed for in the mill feed (ore).
3. LEIPSIGATE
Leipsigate covers 2,168 hectares and consists of 134 claims. It is located in Lunenburg County, Nova Scotia, and hosts
a 9-km-long gold-bearing “Main Fissure Vein”. The property has at least seven historic shafts, of which the deepest is
about 100 metres. Historic mining recovered up to 9,650 ounces of gold from an estimated 30,000 tons of ore.
Only a part of the Main Fissure Vein has been tested, since the vein is covered by overburden. In 2010, NSGold drilled
three diamond holes totalling 281 meters. Drill holes L-1-10 and L-2-10 were planned to intersect the vein, while drill
hole L-3-10 tested the extension of the vein approximately 1,300 metres from the nearest historic workings and 1,900
metres from the nearest previous drilling. NSGold reported that this hole intersected the targeted structure.
4. OTHER EXPLORATION PROJECTS IN NOVA SCOTIA
Cheticamp: Consists of 146 mining claims totalling 2,362 hectares in Inverness County. Historic workings show
potential for sulphide and gold deposits.
Indian Path: Includes 31 claims in Lunenburg County. Hosts numerous historic trenches and shafts, of which
the deepest one is 70 meters. The property was used for scheelite during the Second World War. Scheelite occurs
in quartz veins along with gold.
Blockhouse: Consists of 10 claims spanning over 162 hectares in Lunenburg County. Includes a 95-metre shaft
that provided access and production haulage to extract ore prior to 1935.
French Village: Consists of 116 mining claims located in Cape Breton County. NSGold believes that the project
has lead, zinc, gold, and copper potential.
NSGold Corporation Initiating Report
eResearch Corporation: www.eresearch.ca June 10, 2011 Page 18
APPENDIX 2: GOLD MARKET OUTLOOK
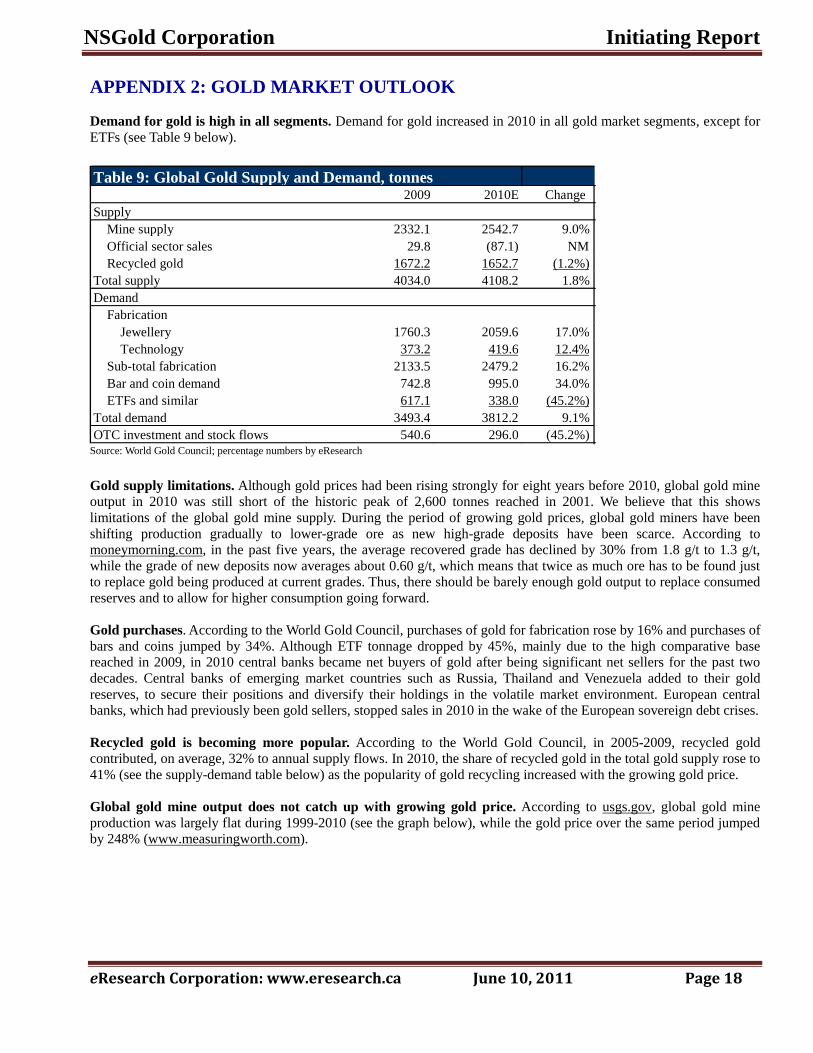
Demand for gold is high in all segments. Demand for gold increased in 2010 in all gold market segments, except for
ETFs (see Table 9 below).
Source: World Gold Council; percentage numbers by eResearch
Gold supply limitations. Although gold prices had been rising strongly for eight years before 2010, global gold mine
output in 2010 was still short of the historic peak of 2,600 tonnes reached in 2001. We believe that this shows
limitations of the global gold mine supply. During the period of growing gold prices, global gold miners have been
shifting production gradually to lower-grade ore as new high-grade deposits have been scarce. According to
moneymorning.com, in the past five years, the average recovered grade has declined by 30% from 1.8 g/t to 1.3 g/t,
while the grade of new deposits now averages about 0.60 g/t, which means that twice as much ore has to be found just
to replace gold being produced at current grades. Thus, there should be barely enough gold output to replace consumed
reserves and to allow for higher consumption going forward.
Gold purchases. According to the World Gold Council, purchases of gold for fabrication rose by 16% and purchases of
bars and coins jumped by 34%. Although ETF tonnage dropped by 45%, mainly due to the high comparative base
reached in 2009, in 2010 central banks became net buyers of gold after being significant net sellers for the past two
decades. Central banks of emerging market countries such as Russia, Thailand and Venezuela added to their gold
reserves, to secure their positions and diversify their holdings in the volatile market environment. European central
banks, which had previously been gold sellers, stopped sales in 2010 in the wake of the European sovereign debt crises.
Recycled gold is becoming more popular. According to the World Gold Council, in 2005-2009, recycled gold
contributed, on average, 32% to annual supply flows. In 2010, the share of recycled gold in the total gold supply rose to
41% (see the supply-demand table below) as the popularity of gold recycling increased with the growing gold price.
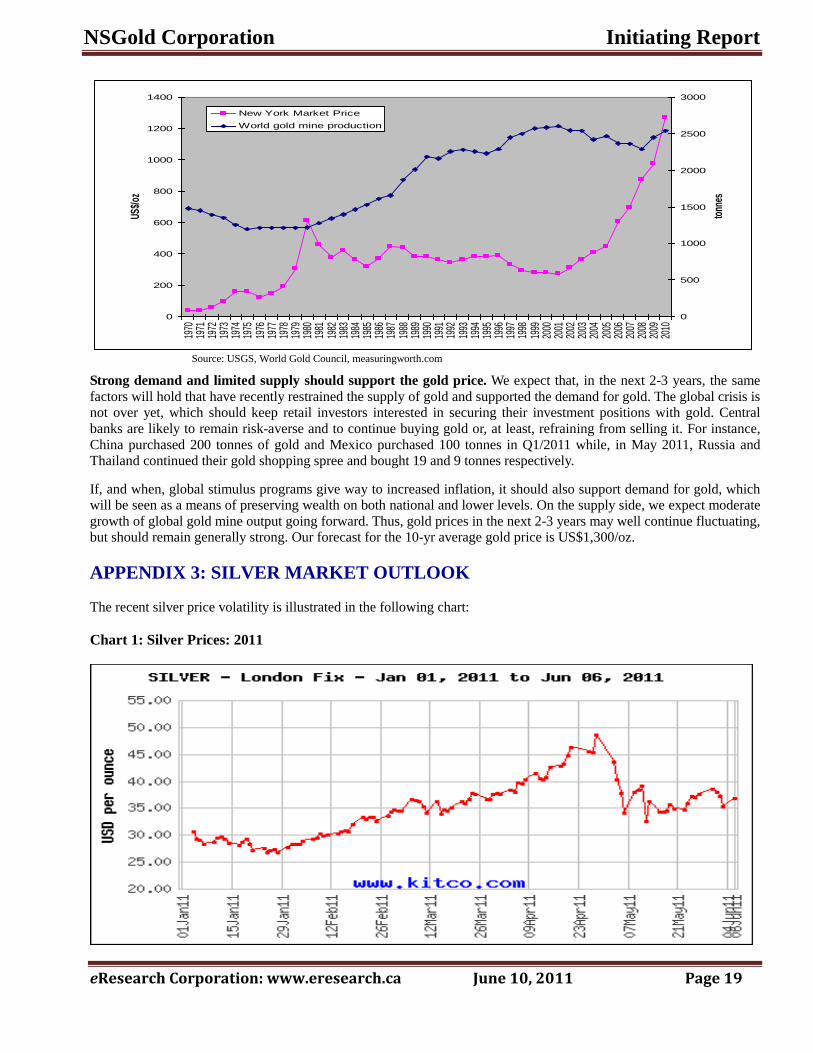
Global gold mine output does not catch up with growing gold price. According to usgs.gov, global gold mine
production was largely flat during 1999-2010 (see the graph below), while the gold price over the same period jumped
by 248% (www.measuringworth.com).
Table 9: Global Gold Supply and Demand, tonnes 2009 2010E Change
Supply Mine supply 2332.1 2542.7 9.0% Official sector sales 29.8 (87.1) NM Recycled gold 1672.2 1652.7 (1.2%)
Total supply 4034.0 4108.2 1.8% Demand
Fabrication Jewellery 1760.3 2059.6 17.0% Technology 373.2 419.6 12.4%
Sub-total fabrication 2133.5 2479.2 16.2% Bar and coin demand 742.8 995.0 34.0% ETFs and similar 617.1 338.0 (45.2%)
Total demand 3493.4 3812.2 9.1% OTC investment and stock flows 540.6 296.0 (45.2%)
NSGold Corporation Initiating Report
eResearch Corporation: www.eresearch.ca June 10, 2011 Page 19
0
200
400
600
800
1000
1200
1400
1970
1971
1972
1973
1974
1975
1976
1977
1978
1979
1980
1981
1982
1983
1984
1985
1986
1987
1988
1989
1990
1991
1992
1993
1994
1995
1996
1997
1998
1999
2000
2001
2002
2003
2004
2005
2006
2007
2008
2009
2010
US$/
oz
0
500
1000
1500
2000
2500
3000
tonn
es
New York Market Price
World gold mine production
Source: USGS, World Gold Council, measuringworth.com
Strong demand and limited supply should support the gold price. We expect that, in the next 2-3 years, the same
factors will hold that have recently restrained the supply of gold and supported the demand for gold. The global crisis is
not over yet, which should keep retail investors interested in securing their investment positions with gold. Central
banks are likely to remain risk-averse and to continue buying gold or, at least, refraining from selling it. For instance,
China purchased 200 tonnes of gold and Mexico purchased 100 tonnes in Q1/2011 while, in May 2011, Russia and
Thailand continued their gold shopping spree and bought 19 and 9 tonnes respectively.
If, and when, global stimulus programs give way to increased inflation, it should also support demand for gold, which
will be seen as a means of preserving wealth on both national and lower levels. On the supply side, we expect moderate
growth of global gold mine output going forward. Thus, gold prices in the next 2-3 years may well continue fluctuating,
but should remain generally strong. Our forecast for the 10-yr average gold price is US$1,300/oz.
APPENDIX 3: SILVER MARKET OUTLOOK
The recent silver price volatility is illustrated in the following chart:
Chart 1: Silver Prices: 2011
NSGold Corporation Initiating Report
eResearch Corporation: www.eresearch.ca June 10, 2011 Page 20
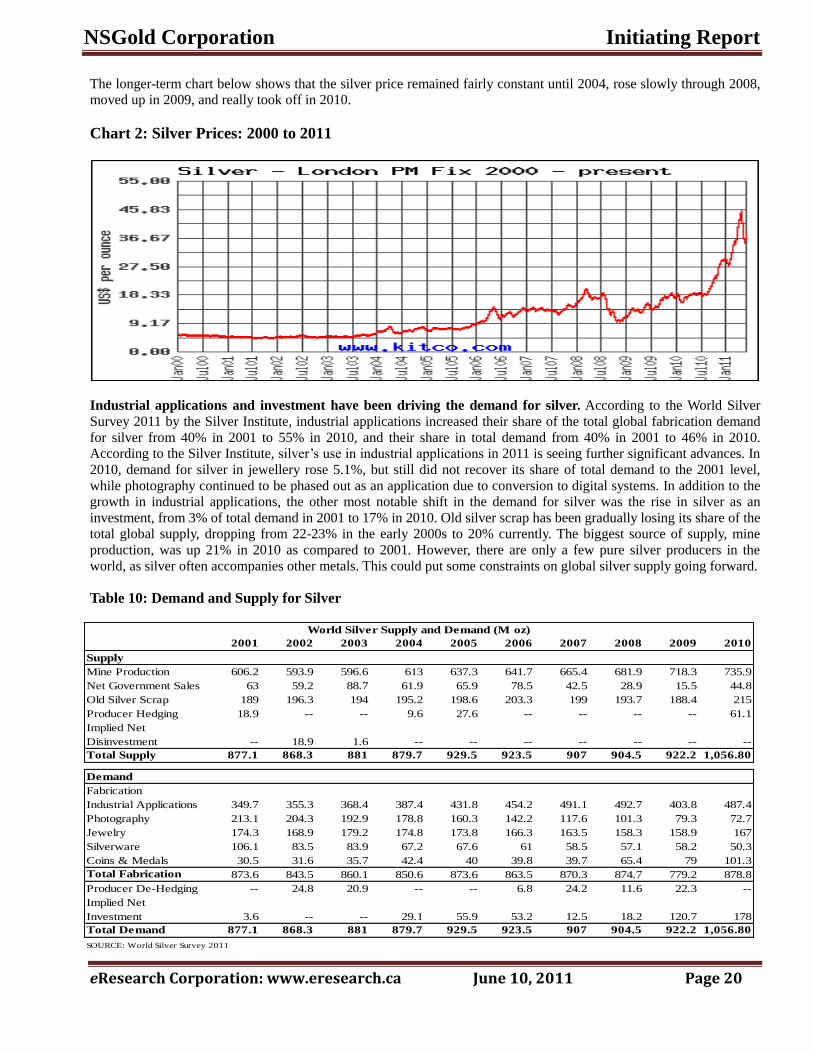
The longer-term chart below shows that the silver price remained fairly constant until 2004, rose slowly through 2008,
moved up in 2009, and really took off in 2010.
Chart 2: Silver Prices: 2000 to 2011
Industrial applications and investment have been driving the demand for silver. According to the World Silver
Survey 2011 by the Silver Institute, industrial applications increased their share of the total global fabrication demand
for silver from 40% in 2001 to 55% in 2010, and their share in total demand from 40% in 2001 to 46% in 2010.
According to the Silver Institute, silver’s use in industrial applications in 2011 is seeing further significant advances. In
2010, demand for silver in jewellery rose 5.1%, but still did not recover its share of total demand to the 2001 level,
while photography continued to be phased out as an application due to conversion to digital systems. In addition to the
growth in industrial applications, the other most notable shift in the demand for silver was the rise in silver as an
investment, from 3% of total demand in 2001 to 17% in 2010. Old silver scrap has been gradually losing its share of the
total global supply, dropping from 22-23% in the early 2000s to 20% currently. The biggest source of supply, mine
production, was up 21% in 2010 as compared to 2001. However, there are only a few pure silver producers in the
world, as silver often accompanies other metals. This could put some constraints on global silver supply going forward.
Table 10: Demand and Supply for Silver
2001 2002 2003 2004 2005 2006 2007 2008 2009 2010
Mine Production 606.2 593.9 596.6 613 637.3 641.7 665.4 681.9 718.3 735.9
Net Government Sales 63 59.2 88.7 61.9 65.9 78.5 42.5 28.9 15.5 44.8
Old Silver Scrap 189 196.3 194 195.2 198.6 203.3 199 193.7 188.4 215
Producer Hedging 18.9 -- -- 9.6 27.6 -- -- -- -- 61.1
Implied Net
Disinvestment -- 18.9 1.6 -- -- -- -- -- -- --
Total Supply 877.1 868.3 881 879.7 929.5 923.5 907 904.5 922.2 1,056.80
Fabrication
Industrial Applications 349.7 355.3 368.4 387.4 431.8 454.2 491.1 492.7 403.8 487.4
Photography 213.1 204.3 192.9 178.8 160.3 142.2 117.6 101.3 79.3 72.7
Jewelry 174.3 168.9 179.2 174.8 173.8 166.3 163.5 158.3 158.9 167
Silverware 106.1 83.5 83.9 67.2 67.6 61 58.5 57.1 58.2 50.3
Coins & Medals 30.5 31.6 35.7 42.4 40 39.8 39.7 65.4 79 101.3
Total Fabrication 873.6 843.5 860.1 850.6 873.6 863.5 870.3 874.7 779.2 878.8
Producer De-Hedging -- 24.8 20.9 -- -- 6.8 24.2 11.6 22.3 --
Implied Net
Investment 3.6 -- -- 29.1 55.9 53.2 12.5 18.2 120.7 178
Total Demand 877.1 868.3 881 879.7 929.5 923.5 907 904.5 922.2 1,056.80
SOURCE: World Silver Survey 2011
World Silver Supply and Demand (M oz)
Supply
Demand
NSGold Corporation Initiating Report
eResearch Corporation: www.eresearch.ca June 10, 2011 Page 21
Industrial applications should remain strong, while investment may waver. The strength of industrial demand for
silver has been the result of the diversity of silver’s industrial applications. One of the major silver uses, in electronic
devices, because of its conductivity, should continue enjoying a strong market for the foreseeable future. We believe
that the same applies to silver’s use in batteries, bearings, brazing and catalysts. Silver’s emerging applications in
medicine and water purification, photovoltaic systems, and coatings should add to a solid foundation for future growth
in demand. On the other hand, as the spring 2011 fluctuations in silver’s price show (see the graphic below), investment
and speculative demand for silver may be quite volatile going forward as investors look for the “right” gold/silver ratio
(see below).
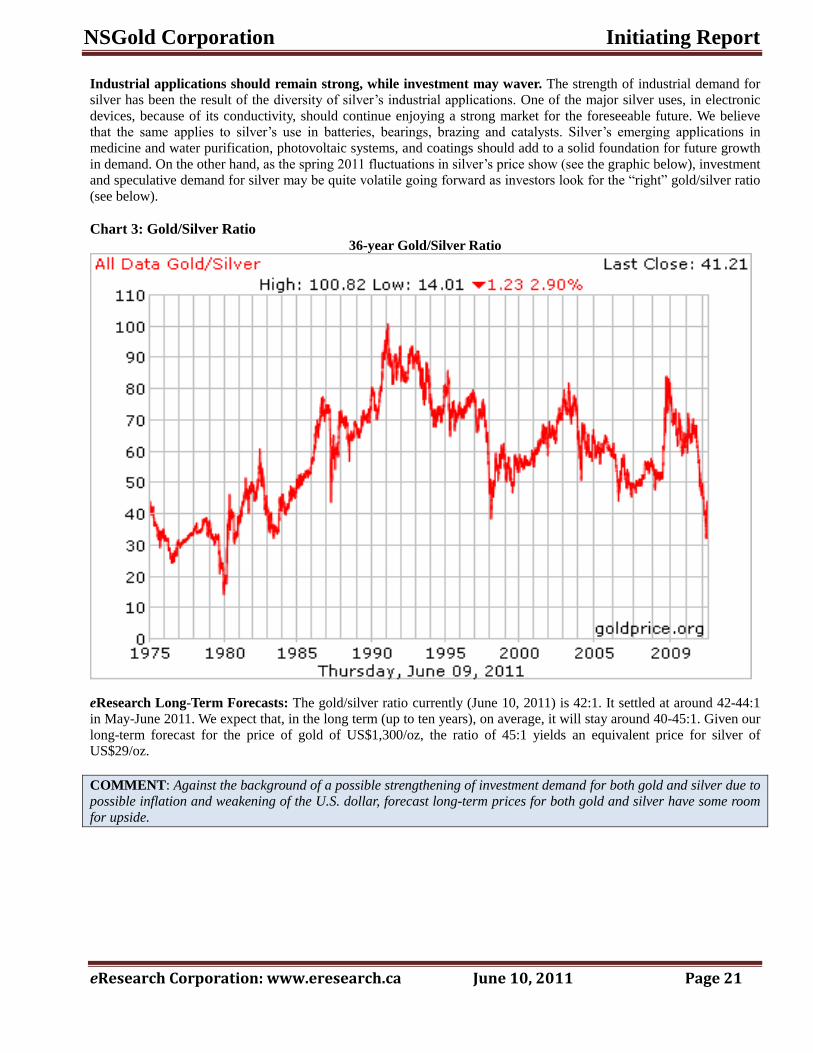
Chart 3: Gold/Silver Ratio 36-year Gold/Silver Ratio
eResearch Long-Term Forecasts: The gold/silver ratio currently (June 10, 2011) is 42:1. It settled at around 42-44:1
in May-June 2011. We expect that, in the long term (up to ten years), on average, it will stay around 40-45:1. Given our
long-term forecast for the price of gold of US$1,300/oz, the ratio of 45:1 yields an equivalent price for silver of
US$29/oz.
COMMENT: Against the background of a possible strengthening of investment demand for both gold and silver due to
possible inflation and weakening of the U.S. dollar, forecast long-term prices for both gold and silver have some room
for upside.
NSGold Corporation Initiating Report
eResearch Corporation: www.eresearch.ca June 10, 2011 Page 22
CORPORATE INFORMATION
NSGold Corporation
1055 West Hastings Street
Suite 2200
Vancouver, British Columbia
V6E 2E9
Telephone: 902-483-2308
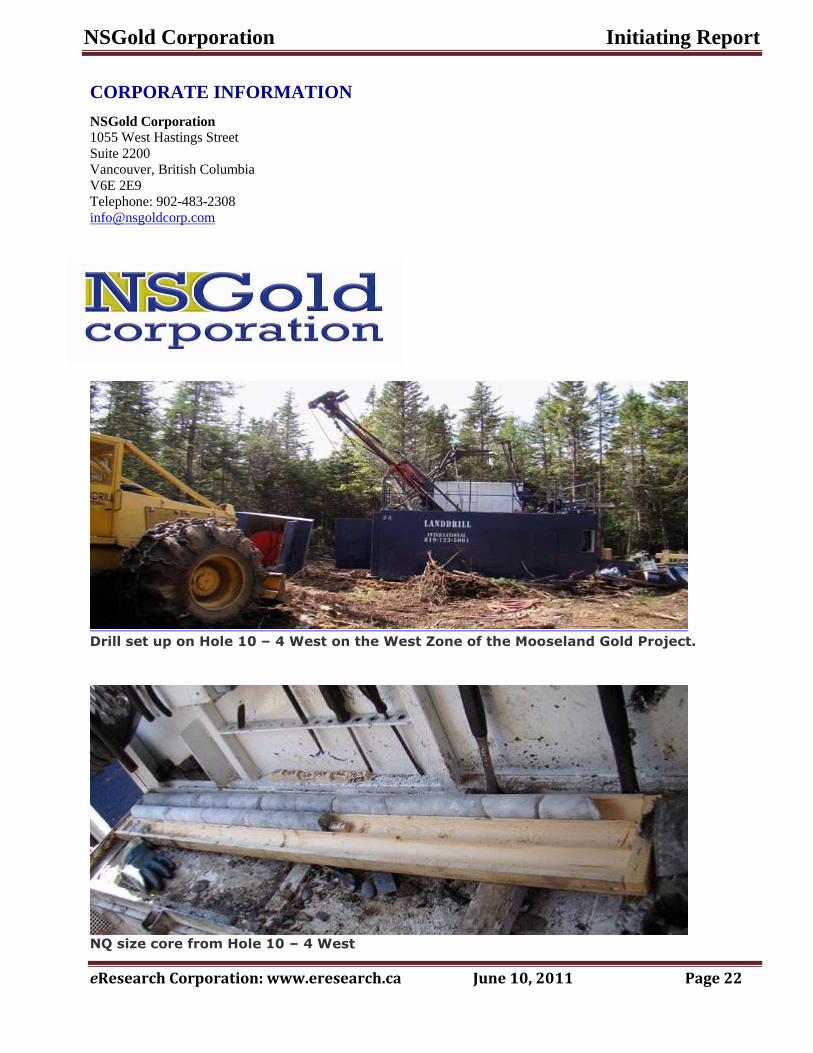
Drill set up on Hole 10 – 4 West on the West Zone of the Mooseland Gold Project.
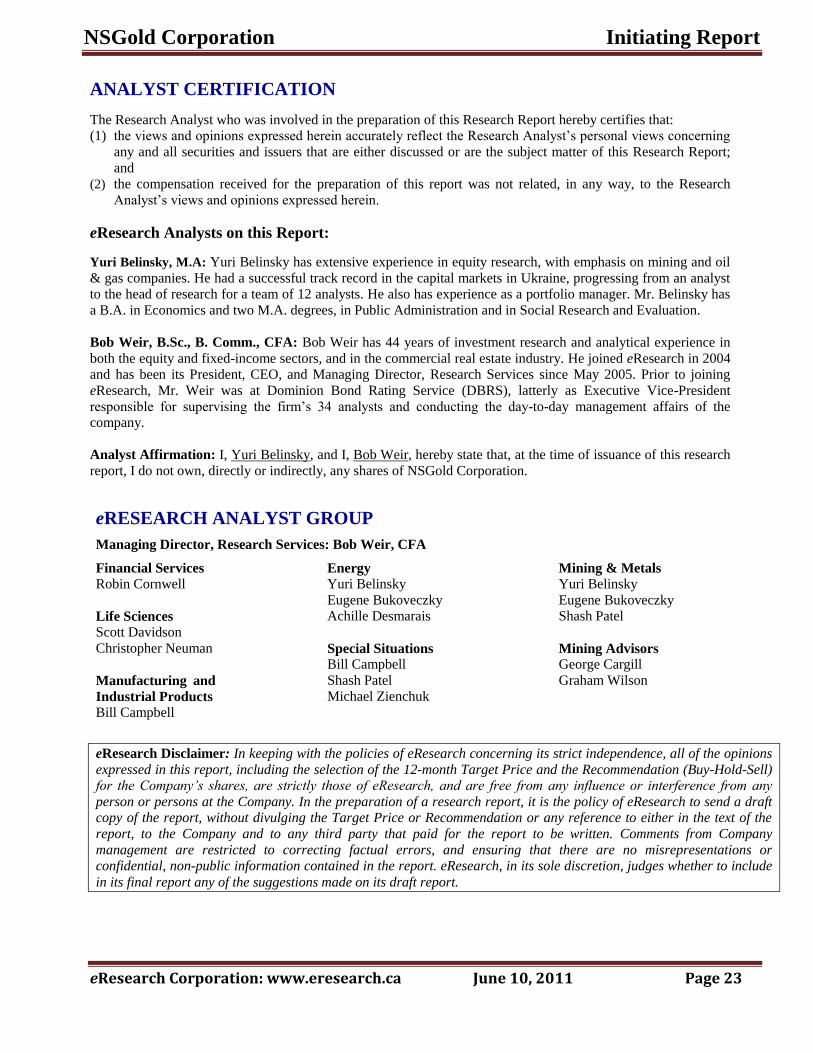
NQ size core from Hole 10 – 4 West
NSGold Corporation Initiating Report
eResearch Corporation: www.eresearch.ca June 10, 2011 Page 23
ANALYST CERTIFICATION
The Research Analyst who was involved in the preparation of this Research Report hereby certifies that:
(1) the views and opinions expressed herein accurately reflect the Research Analyst’s personal views concerning
any and all securities and issuers that are either discussed or are the subject matter of this Research Report;
and
(2) the compensation received for the preparation of this report was not related, in any way, to the Research
Analyst’s views and opinions expressed herein.
eResearch Analysts on this Report:
Yuri Belinsky, M.A: Yuri Belinsky has extensive experience in equity research, with emphasis on mining and oil
& gas companies. He had a successful track record in the capital markets in Ukraine, progressing from an analyst
to the head of research for a team of 12 analysts. He also has experience as a portfolio manager. Mr. Belinsky has
a B.A. in Economics and two M.A. degrees, in Public Administration and in Social Research and Evaluation.
Bob Weir, B.Sc., B. Comm., CFA: Bob Weir has 44 years of investment research and analytical experience in
both the equity and fixed-income sectors, and in the commercial real estate industry. He joined eResearch in 2004
and has been its President, CEO, and Managing Director, Research Services since May 2005. Prior to joining
eResearch, Mr. Weir was at Dominion Bond Rating Service (DBRS), latterly as Executive Vice-President
responsible for supervising the firm’s 34 analysts and conducting the day-to-day management affairs of the
company.
Analyst Affirmation: I, Yuri Belinsky, and I, Bob Weir, hereby state that, at the time of issuance of this research
report, I do not own, directly or indirectly, any shares of NSGold Corporation.
eRESEARCH ANALYST GROUP
Managing Director, Research Services: Bob Weir, CFA
Financial Services
Robin Cornwell
Life Sciences
Scott Davidson
Christopher Neuman
Manufacturing and
Industrial Products
Bill Campbell
Energy
Yuri Belinsky
Eugene Bukoveczky
Achille Desmarais
Special Situations Bill Campbell
Shash Patel
Michael Zienchuk
Mining & Metals
Yuri Belinsky
Eugene Bukoveczky
Shash Patel
Mining Advisors George Cargill
Graham Wilson
eResearch Disclaimer: In keeping with the policies of eResearch concerning its strict independence, all of the opinions
expressed in this report, including the selection of the 12-month Target Price and the Recommendation (Buy-Hold-Sell) for the Company’s shares, are strictly those of eResearch, and are free from any influence or interference from any
person or persons at the Company. In the preparation of a research report, it is the policy of eResearch to send a draft copy of the report, without divulging the Target Price or Recommendation or any reference to either in the text of the
report, to the Company and to any third party that paid for the report to be written. Comments from Company
management are restricted to correcting factual errors, and ensuring that there are no misrepresentations or confidential, non-public information contained in the report. eResearch, in its sole discretion, judges whether to include
in its final report any of the suggestions made on its draft report.
NSGold Corporation Initiating Report
eResearch Corporation www.eresearch.ca Page 24
eResearch Recommendation System
Strong Buy: Expected total return within the next 12 months is at least 40%.
Buy: Expected total return within the next 12 months is between 10% and 40%.
Speculative Buy: Expected total return within the next 12 months is substantial, but Risk is High (see below).
Hold: Expected total return within the next 12 months is between 0% and 10%.
Sell: Expected total return within the next 12 months is negative. _________________________________________________________________________________________________________________
eResearch Risk Rating System
A company may have some, but not necessarily all, of the following characteristics of a specific risk rating to qualify for that
rating:
High Risk: Financial - Little or no revenue and earnings, limited financial history, weak balance sheet, negative free cash
flows, poor working capital solvency, no dividends.
Operational - Weak competitive market position, early stage of development, unproven operating plan, high
cost structure, industry consolidating, business model/technology unproven or out-of-date.
Medium Risk: Financial - Several years of revenue and positive earnings, balance sheet in line with industry average,
positive free cash flow, adequate working capital solvency, may or may not pay a dividend.
Operational - Competitive market position and cost structure, industry stable, business model/technology is
well established and consistent with current state of industry.
Low Risk: Financial - Strong revenue growth and earnings over several years, stronger than average balance sheet, strong
positive free cash flows, above average working capital solvency, company may pay (and stock may yield)
substantial dividends or company may actively buy back stock.
Operational - Dominant player in its market, below average cost structure, company may be a consolidator,
company may have a leading market/technology position. _________________________________________________________________________________________________________________ eResearch Disclosure Statement
eResearch operates two business segments: (1) the provision of equity research to the investment community; and (2) the offering of
its abilities to assist companies raise capital. The research activities and operations of eResearch are carried out solely by its Research
Services division, which provides published research and analysis to its Subscribers on its website (www.eresearch.ca), and to the
general investing public through both its extensive electronic distribution network and newswire agencies. With regards to
distribution, eResearch makes all reasonable efforts to provide its research, via e-mail, simultaneously to all of its Subscribers. The
capital raise activities and operations of eResearch are carried out solely by its Capital Services division, which engages only in capital
market services with Corporate Issuers and Accredited Investors.
eResearch does not manage money or trade with the general public which, combined with the full disclosure of all fee arrangements,
the strict application of its Best Practices Guidelines, and the creation of an effective "Ethical Wall" between the Research Services
and the Capital Services divisions, should eliminate potential conflicts of interest.
eResearch accepts fees from the companies it researches (the “Covered Companies”), and from financial institutions or other third
parties. The purpose of this policy is to defray the cost of researching small and medium capitalization stocks which otherwise receive
little or no research coverage.
To ensure complete independence and editorial control over its research, eResearch follows certain business practices and compliance
procedures. For instance, fees from Covered Companies are due and payable prior to the commencement of research.
NSGold Corporation paid eResearch a fee of $20,000+HST to conduct research on the Company on an Annual Continual Basis.
All Analysts are required to sign a contract with eResearch prior to engagement, and agree to adhere at all times to the CFA Institute
Code of Ethics and Standards of Professional Conduct. eResearch analysts are compensated on a per-report, per-company basis and
not on the basis of his/her recommendations. Analysts are not allowed to accept any fees or other consideration from the companies
they cover for eResearch. Analysts are allowed to trade in the shares, warrants, convertible securities or options of companies they
cover for eResearch only under strict, specified conditions, which are no less onerous than the guidelines postulated by IIROC.
Similarly, eResearch, its officers and directors, are allowed to trade in shares, warrants, convertible securities or options of any of the
Covered Companies under identical restrictions.