nov dec 2015_508_col.pdf
TRANSCRIPT

the
eart
h o
bse
rver
National Aeronautics and Space Administration
The Earth Observer. November - December 2015. Volume 27, Issue 6.
Editor’s CornerSteve PlatnickEOS Senior Project Scientist
Quicker than seems possible, another year is drawing to a close. For NASA’s Earth Science Division, the year began with three successful launches—CATS to the ISS to study clouds and aerosols, SMAP to study soil moisture and freeze-thaw state from space, and NOAA’s DSCOVR mission, which includes two NASA Earth Science instruments now transmitting data from the Lagrange point 1 (L11). CATS is functioning nominally, and is now providing Level-1B and Level-2 products—including the heritage CALIPSO algorithm, as well as browse imagery (all available at cats.gsfc.nasa.gov/data). As reported in our last issue, the SMAP radar ceased operations in early July, however the mission will be able to continue to provide soil moisture and other impor-tant science quality products. Preliminary Level-2 and Level-3 SMAP radiometer data are now available—see the Announcement on page 11 for details. With regard to DSCOVR, NASA launched a new website in late October for the world to see full sunlit browse images of the Earth from the Earth Polychromatic Imaging Camera (EPIC2)—epic.gsfc.nasa.gov. This site will post at least a dozen color composite images of Earth acquired 12 to 36 hours earlier by EPIC. The success of our Earth Science endeavors is a tribute to all the mission and instrument teams that work so hard, often behind the scenes, to keep these missions operating smoothly.
continued on page 2
1 Please refer to the Editorials written during 2015 in The Earth Observer for more information on the launches and subse-quent progress of the missions referred to throughout this article. 2 EPIC measures in the ultraviolet, visible and near-infrared areas of the spectrum. The data from all 10 wavelengths are posted at eosweb.larc.nasa.gov/project/dscovr/dscovr_table. All images are in the public domain.
October 15, 2014
Columbia
Congaree River
Shadow
2 kmN Cloud
October 8, 2015
After record-breaking rains pounded South Carolina in early October 2015, severe floods overwhelmed many parts of the state. This pair of images shows the interior of South Carolina on October 15, 2014 [left], as observed by the Operational Land Imager (OLI) on Landsat 8 compared to the same region during the flooding on October 8, 2015 [right], as observed by the Advanced Land Imager (ALI) on NASA’s Earth Observing-1 (EO-1) satellite. Floodwater covered broad swaths of farmland, forests, and wetlands east of the Congaree River in 2015. Note that the dark areas in the 2014 image are cloud shadows. Credit: NASA’s Earth Observatory
Columbia
Congaree River
2 kmN
Flood Water
www.nasa.gov

The Earth Observer November - December 2015 Volume 27, Issue 602ed
itor's
cor
ner
In This Issue
Editor’s Corner Front Cover Kudos
Feature Article Congratulations to AGU and AMS Award Winners! 20
SAGE III on ISS: Continuing the Data Record 4In the News
Meeting SummariesArctic Sea Ice Summertime Minimum Is
Landsat Science Team Meeting: Summer 2015 12 Fourth Lowest on Record 30Summary of the Nineteenth OMI Science NASA Study: Mass Gains of Antarctic
Team Meeting 18 Ice Sheet Greater than Losses 32Summary of the Twenty-Fourth CERES-II NASA Studying 2015 El Niño Event As
Science Team Meeting—Fall 2015 21 Never Before 34Summary of the GOFC-GOLD SEARRIN Regular Features
Workshop: Assessing Land Use/Cover Changes and Air Quality in Asia 26 NASA Earth Science in the News 36
Announcements NASA Science Mission Directorate – Science Education and Public Outreach Update 38
Preliminary Level-2 and Level-3 SMAP Radiometer Data Now Available 11 Science Calendars 39
Storytelling and More: NASA Science at the Reminder: To view newsletter images in color, visit 2015 Fall AGU Meeting 17 eospso.nasa.gov/earth-observer-archive.
Deep Blue Aerosol Project Website Now Live 31
The Earth Observatory Natural Event Tracker 35
Initiation of the 2017-2027 Earth Science Decadal Survey 37
NASA’s Earth Observing-1 (EO-1) mission reached an impressive milestone in 2015, celebrating its fifteenth anniversary on November 21. Launched during the era of “faster, better, cheaper” as part of NASA’s New Millennium Program, it far exceeded its original one-year mission and has served as an on-orbit testbed for new technologies, imaging techniques, and targeted data acquisitions.
Two of EO-1’s instruments successfully demonstrated new technologies that are now being used in NASA’s current and/or planned missions. The Advanced Land Imager (ALI) demonstrated then-new pushbroom techniques for multispectral imagery. The technol-ogy worked well and the results influenced the design of the Operational Land Imager (OLI) that now flies onboard the joint NASA–USGS Landsat 8 mission, and is planned for flight on Landsat 9. The Hyperion imaging spectrometer (aka hyperspectral imager)
measures more than 200 adjacent wavelength bands, providing more complete—and spectrally continu-ous—coverage than multispectral imagers. Hyperion has given the science community invaluable experi-ence working with complex hyperspectral data that are being incorporated into the design of future instru-ments, such as the imaging spectrometer on NASA’s Earth Science Decadal Survey Hyperspectral Infrared Imager (HyspIRI) mission concept.
Perhaps the innovation that has been most essential to EO-1’s longevity beyond the initial technology dem-onstration phase was its onboard computer, which provided excess onboard computing capability that allowed the EO-1 team to attempt activities not ini-tially planned as part of the mission. The first such was the Autonomous Science Experiment, an onboard intelligent scheduling tool that allowed the satellite to determine which images Hyperion and ALI should

The Earth Observer November - December 2015 Volume 27, Issue 6 03
edito
r's c
orne
racquire—a novel “customer-driven” approach to image acquisition—see image on page 1 for example.
On the occasion of the fifteenth anniversary of its launch, our congratulations to the entire EO-1 team! The mission’s longevity is testimony to their hard work and dedication. The Earth Observer plans more complete coverage of EO-1’s achievements in an upcoming article.
Two missions came to an end in 2015. The TRMM mission ceased operations this year after a phenom-enal 17-year run3, leaving behind a remarkable legacy. The GPM Mission, with its Core observatory and nine Constellation members, is nearing its second anniver-sary in space, continuing the precipitation measure-ments begun by TRMM, but also offering observational capabilities beyond those of its predecessor, such as the ability to study mid-latitude storms and lighter pre-cipitation. Likewise, the Aquarius mission ended this year, after more than three years in orbit—exceeding its planned lifetime4. The sea surface salinity measurements from Aquarius add another to NASA’s considerable list of multiyear time series of important climate param-eters. Analysis of the almost-four-year data record from Aquarius has already led to advances in our understand-ing of the dynamics and interannual changes of the salinity field and links between salinity and other phe-nomena such as El Niño. Studies will surely continue for many years to come.
Another important measurement will resume in 2016. For nearly thirty years, NASA’s Stratospheric Aerosol and Gas Experiment (SAGE) family of remote-sens-ing-satellite instruments continuously measured strato-spheric ozone (O3) concentrations, aerosols, water vapor, and other trace gases. However, there has been a nearly decade-long gap in SAGE measurements since the SAGE III Meteor-3M (launched in 2001) ended on March 6, 2006. I am happy to report that SAGE III on ISS is tentatively scheduled to launch on June 10, 2016, which will resume the SAGE measurement record. The article on page 4 of this issue provides details on the plans for SAGE III on ISS including its launch, installa-tion on the ISS, the ground system, planned data prod-ucts, and more.
Also planned for 2016 is the launch of Jason-3, which aims to continue the decades long record of sea surface
3 To learn more about the circumstances surrounding the end of the TRMM mission please refer to the Editorial in the May–June 2015 issue of The Earth Observer [Volume 27, Issue 3, pp. 1-2].4 To learn more about the circumstances surrounding the end of the Aquarius mission please refer to the Editorial in the July–August 2015 issue of The Earth Observer [Volume 27, Issue 4, pp. 2-3].
topography that began with TOPEX/Poseidon and continued with Jason-1 and OSTM/Jason-2. One key application of sea surface height data has been moni-toring the progress of ENSO events in the tropical Pacific, such as the current El Niño that is unfolding in a very similar way to some of the strongest ones on record—e.g., 1982-83 and 1997-98 events. The 2015-16 El Niño is the first major El Niño to unfold under the watchful “eyes” of our EOS fleet—all of which launched since 1999. Once launched, Jason-3 will join Jason-2 in making observations of sea surface topogra-phy. As reported in our last issue, the Jason-3 launch was delayed from August 2015 because of the loss of the SpaceX Falcon 9 resupply mission to the ISS on June 28. NASA has been working with NOAA, CNES, SpaceX, and the Western Test Range at Vandenberg Air Force Base (the launch site) to reschedule the launch; dates in early 2016 are under consideration, but as of this writing the exact date has not been set. Read more about NASA plans to monitor the El Niño in the News story on page 34.
Each year the AGU Fall Meeting in San Francisco, CA provides scientists from around the world a forum to showcase the latest results from their research. If you are planning to attend, we invite you to visit us at the NASA booth in the exhibit hall, December 14-18. More than 40 Hyperwall talks are scheduled through-out the week, as well as several other in-booth science “flash talks” that will demonstrate data tips, tools, and tutorials. There will also be a wide range of other dem-onstrations, printed materials, and scientists and out-reach personnel to interact with5. For more information on AGU, see the Announcement on page 17. We hope to see you there!
On behalf of The Earth Observer staff, our sincere appreciation to those of you who provided content for the newsletter over the past year. From its earliest days, contributions from our readers have been crucial to the success of our publication. While things look consider-ably different than when we began in 1989, it remains true that there would not be a newsletter without our community of authors contributing features, summa-ries, and other content on a regular basis. Thank you and best wishes to all in the coming year.
5 A schedule of Hyperwall presentations and other events taking place at the NASA exhibit will be posted at eospso.gsfc.nasa.gov.
Note: List of undefined acronyms from the Editor’s Corner and the Table of Contents can be found on page 39.

The Earth Observer November - December 2015 Volume 27, Issue 604tic
les
e ar
feat
urSAGE III on ISS: Continuing the Data Record Heather Hanson, NASA’s Goddard Space Flight Center, [email protected] Damadeo, NASA’s Langley Research Center, [email protected]
Introduction
NASA’s Stratospheric Aerosol and Gas Experiment (SAGE) family of remote-sensing-satellite instruments has long measured ozone (O3) concentrations, stratospheric aerosols, water vapor, and other trace gases that influence Earth’s atmosphere1. The first SAGE mis-
sion (SAGE I) launched February 18, 1979, on the Applications Explorer
Mission-B (AEM-B) satellite. The mis-sion collected valuable data for nearly three years until the satellite’s power system failed. SAGE II launched onboard the Earth Radiation Budget Satellite (ERBS) in October 1984, and observed stratospheric O3 from 1984 until 2005. Data from SAGE II were integral in confirming human-
driven changes to O3 concentrations in the stratosphere, and thus influenced
the decisions to negotiate the Montreal Protocol in 1987. Later, observations from
SAGE II showed that O3 in the stratosphere stopped decreasing in response to the actions
agreed to in the treaty.
Building on previous successes, a third-generation instrument was developed to ensure continuous measurements and to generate new data products. When SAGE III was developed, three identical instruments were built: one was launched on the Russian Meteor-3M spacecraft on December 10, 2001; one was built specifically to be flown on the International Space Station (ISS); and another is a spare. The SAGE III Meteor-3M mission ended on March 6, 2006, when the Meteor-3M spacecraft lost pressure and electrical subsystems failed; this left a gap in the invaluable SAGE data record. Planned for launch in 2016, SAGE III on the ISS will continue the legacy of accurate SAGE measurements. 1 Before the first SAGE mission in 1979 there were two Stratospheric Aerosol Measurement (SAM) missions—SAM I and SAM II. To learn more about the historic measurements leading up to SAGE III on the International Space Station, read “The SAGE Legacy’s Next Chapter: SAGE III on the International Space Station” in the September-October 2013 issue of The Earth Observer [Volume 25, Issue 5, pp. 4-8].
SAGE III on ISS is led by NASA’s Langley Research Center with the cooperation of partners around the world including several NASA field centers (Johnson Space Center, Marshall Space Flight Center, Goddard Space Flight Center, and Kennedy Space Center), NASA’s White Sands Facility, Ball Aerospace & Technology Corp., Thales Alenia Space-Italy, and the European Space Agency. Image credit: NASA
The first SAGE mission was launched in 1979. In 1990 the U.S. Clean Air Act mandated that NASA continue to moni-tor O3. As a result, the SAGE family of instruments observed O3 concentrations, along with water vapor, aerosols, and trace gases continuously from 1979 to 2006. Image credit: NASA

The Earth Observer November - December 2015 Volume 27, Issue 6 05
feat
ure
artic
lesMission Overview
The SAGE III instrument that was meant to be flown on the space station went into storage until the station’s construction was complete. Work to prepare SAGE III for installation on the ISS began in 2011. Designed to operate for no fewer than three years, SAGE III will measure the composition of the stratosphere and troposphere—see Science Goals on page 6. Onboard the station, SAGE III will orbit between 385 km (~239 mi) and 415 km (~258 mi) above Earth’s surface. The station’s orbital inclina-tion of 51.6° provides coverage between 70° N and 70° S latitude with a nearly three-day repeat cycle.
SAGE III on ISS is among a small number of Earth-observing, continuous-measurement systems to be installed on the space station to demonstrate ISS-based operational science capa-bilities. Two other Earth-observing instruments, the Rapid Scatterometer (RapidScat) and Cloud-Aerosol Transport System (CATS), were installed on the station in September 2014 and January 2015, respectively. More are planned for the future. Image credit: NASA
Similar to its predecessors, SAGE III on ISS will provide vertical profiles of O3, aero-sols, nitrogen dioxide (NO2), and water vapor in Earth’s atmosphere by taking occulta-tion measurements when the sun or moon is rising or setting, about 15-16 times each day—see Figure 1. In addition to light from the sun, the moon will also be used as a light source to detect O3. The station’s unique orbital path will allow SAGE III to observe O3 during all seasons and over a large portion of the globe. SAGE III on ISS will also mea-sure O3 concentrations deeper into the atmosphere than previous SAGE measurements, reaching down into the troposphere. Another benefit of flying onboard the ISS is that sci-entists and engineers will also have near-continuous communications with the payload.
Figure 1. By using the sun and the moon as light sources, SAGE can detect O3, aerosols, and other trace gases in the atmosphere. Image credit: NASAatmosphere
line-of-sight to sun
SAGE on ISS
Sun
Earth
Measurements from SAGE III on ISS will be used to observe long-term trends of strato-spheric O3 concentrations. Combined with data from mapping instruments such as the Ozone Mapping Profiler Suite (OMPS2), scientists will be able to determine whether the ozone layer is recovering as expected. In addition, data from SAGE III on ISS will 2 The Ozone Mapping and Profiler Suite (OMPS) is the next generation of back-scattered ultraviolet radiation sensors, following on the instruments that flew onboard Nimbus and NOAA Polar Operational Environmental Satellites (POES). The first OMPS is currently flying onboard the Suomi National Polar-orbiting Partnership satellite. OMPS builds on the success of the Ozone Monitoring Instrument (OMI) onboard Aura and Solar Backscatter Ultraviolet (SBUV/2) instruments that flew from 1984–2009 on several NOAA satellites..

The Earth Observer November - December 2015 Volume 27, Issue 606fe
atur
e ar
ticle
s be used to help refine the accuracy of three-dimensional models used to understand the atmosphere and predict future atmospheric changes. SAGE III on ISS is a key part of NASA’s mission to provide crucial, long-term measurements that will help humans better understand and care for Earth’s atmosphere, providing the foundation for sound environmental policy.
Instrument Overview
SAGE III on ISS consists of two separate payloads—the Instrument Payload and the Nadir Viewing Platform. Combined, the SAGE III payloads have a mass of 527 kg (~1162 lbs) and a data rate of 2150 MB per day.
Instrument Payload
The Instrument Payload includes a Sensor Assembly, Interface Adapter Module, a Disturbance Monitoring Package, the Hexapod Pointing System (Hexapod Electronics Unit and Hexapod Mechanical Assembly), two Contamination Monitoring Packages, and the Instrument Control Electronics box—see Figure 2. Building on the success of its predecessors, SAGE III
has a few upgrades. The new design incorporates a charge coupled device (CCD) array detector that enhances measurement capability and may allow for new experi-mental data products like methane (CH4), bromine monoxide (BrO), and iodine monoxide (IO).
The SAGE III Sensor Assembly—a grating spectrometer that measures ultraviolet (UV) and visible light and has a two-axis pointing system—consists of three subsys-tems: the scan head, imaging optics, and the spectrometer detector—see Figure 3. These subsystems are employed to acquire light from either the sun or moon by verti-cally scanning across them. Once the instrument is powered on, light that is brought into the spectrometer by the telescope is broken up into UV, visible, and infrared wavelengths from 280 to 1040 nm by the grating spectrometer and sent to the CCD array. The measurements are made using a ratio: the amount of light passing through the atmosphere compared to the amount of light coming directly from the sun out-side the atmosphere. By measuring the amount of absorption of radiation at various heights throughout the atmosphere at different wavelengths, SAGE III can infer the vertical profiles of O3, aerosols, water vapor, and NO2. Additional aerosol information is provided by a discrete photodiode at 1550 nm.
Science Goals
The science goals of the mission are to:
• Assess the state of recovery in the distribu-tion of O3;
• re-establish the aerosol measurementsneeded by both climate and O3 models; and
• gain further insight into key processes con-tributing to O3 and aerosol variability.
Sensor Assembly (SA)
Instrument Control Electronics (ICE)
Hexapod Hexapod Electronics Unit (HEU)Mechanical
Assembly (HMA)
Contamination Monitoring Package (CMP)
Contamination Monitoring
Package (CMP)Interface Adapter Module (IAM)
Disturbance Monitoring
Package (DMP) ExPRESS* Payload Adapter (ExPA)
Figure 2. Illustration of the components that make up the SAGE III Instrument Payload. *ExPRESS stands for EXpedite the PRocessing of Experiments for Space Station. Image credit: NASA

The Earth Observer November - December 2015 Volume 27, Issue 6 07
feat
ure
artic
lesSpectrometer Subsystem
Diffraction CCDgrating Measures solar radiation from
InGaAs 280 to 1040 nm at 1 to 2 nm detector spectral resolution. An additional
photodetector measures radia-tion at 1550 nm.Folding mirror
Imaging Subsystem Figure 3.Primary mirror Pictured here are the three subsystems that make up
Produces a focused image of theSecondary mirror the SAGE III Sensor Assembly. target at a focal plane where the Image credit: NASA
Solar attenuator instrument’s field of view is deter-mined. Light passing through a tiny slit located here enters the spectrometer.
Pointing SubsystemScan mirror
Consists of a scan mirror, which acquires the radiant target and performs vertical scanning across the target.
Several busy operations onboard the ISS can interfere with science observations, e.g., visiting instrument traffic and thruster operations. To avoid contamination from such operations, the Instrument Payload includes two Contamination Monitoring Packages to monitor the environment surrounding the instrument. If the space station environ-ment contains elevated contamination levels, a transparent contamination door will close to protect the instrument’s sensors while allowing measurements to continue.
The Interface Adapter Module acts as the “brain” of the instrument payload, pro-viding power and computing to the payload and acting as the interface between the instrument and the space station. The Disturbance Monitoring Package is a minia-ture inertial measurement unit that will measure all small motions from space sta-tion operations. These measurements will be used to help identify and reduce noise in the instrument signal caused by the space station’s vibrations. The Hexapod Pointing System supports the payload and keeps the instrument level with respect to Earth while in orbit.
Nadir Viewing Platform
To orient SAGE III facing nadir, or toward Earth, a special L-shaped mounting bracket called the Nadir Viewing Platform was designed, built, and tested at LaRC. The Nadir Viewing Platform will attach to ExPRESS Logistics Carrier-4 (ELC-4) onboard the station, perpendicular to the plane of the ELC, providing the nadir-ori-entation needed by the Instrument Payload. It replicates the standard ELC exposed-payload attachment. The ELC-4 will provide electrical power and command and data-handling services, and the Nadir Viewing Platform provides electrical power and data services to the SAGE III instrument. Other space station-based payloads have already used the Nadir Viewing Platform’s design, turning a traditional ELC site into a nadir-oriented site.
Launch and Installation
SAGE III on ISS is scheduled to launch on June 10, 2016, onboard the SpaceX Cargo Resupply-10 mission, or SpaceX-10, from NASA’s Kennedy Space Center atop a SpaceX Falcon 9 rocket. About 10 minutes after liftoff, the SpaceX Dragon will sepa-rate from the launch vehicle upper stage and begin a two-day trip to reach the ISS. For their ride to the space station, the SAGE III Instrument Payload and Nadir Viewing Platform will be installed in the unpressurized section of the SpaceX Dragon “Trunk”
SAGE III on ISS is scheduled to launch on June, 10, 2016, onboard the SpaceX Cargo Resupply-10 mission, or SpaceX-10, from NASA’s Kennedy Space Center atop a SpaceX Falcon 9 rocket.

The Earth Observer November - December 2015 Volume 27, Issue 608fe
atur
e ar
ticle
s as separate payloads—see Figure 4. Prior to launch, the Dragon will provide power to the Instrument Payload to power its heaters, which are necessary to maintain the temperature of the SAGE Instrument Payload and its other sensitive electronics at safe levels. The Nadir Viewing Platform does not require heater power during transfer to the ISS.
After Dragon reaches the ISS, the Canadarm2 robotic arm will grapple Dragon and secure it to the ISS. Extraction of the SAGE III payloads will require the use of Canadarm2 and also Dextre, a smaller robotic element (also Canadian built) that attaches to Canadarm2. The process to install the SAGE III payloads to their planned location on ELC-4 begins when Dextre removes the Instrument Payload from the Dragon Trunk and installs it onto Dextre’s temporary platform. After extraction, the Instrument Payload heaters will not receive power until the payload is installed on the temporary platform. The duration of the robotic maneuvers are carefully coordinated to ensure that the Instrument Payload does not get too cold. Next, the Nadir Viewing Platform is removed from the Trunk by Dextre, but it does not need to be installed on the temporary platform since it does not need heater power. Once both payloads are removed from the Trunk, Canadarm2 and Dextre, with the SAGE III payloads attached, will be moved out to the starboard end of the main ISS truss, where ELC-4 is located.
The Nadir Viewing Platform will be installed to ELC-4 by Dextre first; then the Instrument Payload will be removed from Dextre’s temporary platform and installed to the Nadir Viewing Platform. During transfer from the temporary platform to the Nadir Viewing Platform, the Instrument Payload heaters will not have access to power, so the duration of the transfer will be closely controlled and monitored. After the Instrument Payload is installed—see Figure 5 on the next page—ISS control-lers on the ground will command the ELC-4 to enable heater power to the assembled SAGE III payload. After approximately three to four days, the SAGE III Mission Operations Team will work with the ISS Operations Team to enable operational power to SAGE III and begin checkout and commissioning of the payload.
Space X Dragon Configuration for the Nadir Viewing Platform and the Instrument Payload mounted inside the Dragon Trunk
Dragon Trunk
Figure 4. Prior to launch, the SAGE III Instrument Payload and Nadir Viewing Platform will be mounted inside the Dragon Trunk on SpaceX. Image credit: NASA
After approximately three to four days, the SAGE III Mission Operations Team will work with the ISS Operations Team to enable operational power to SAGE III and begin checkout and commissioning of the payload.

The Earth Observer November - December 2015 Volume 27, Issue 6 09
feat
ure
artic
les
Figure 5. This illustration shows the Instrument Payload attached to the Nadir Viewing Platform on the ECL-4. Image credit: NASA
ELC-4
Ground System and Data
With reference to Figure 6, the Flight Mission Support Center (FMSC) at LaRC (see photo on page 10), together with the ISS Command and Control group at the Mission Control Center-Houston (MCC-H) at NASA’s Johnson Space Center and the Payload Operations Integration Center (POIC) at NASA’s Marshall Space Flight Center, will command and operate the instrument, as well as manage and distribute data. This includes oversight of the installation and instrument checkout, managing routine planning and command loads, data analysis, and resolution of any issues that may arise.
Figure 6. This graphic shows how data travel from SAGE III on ISS to the SCF and get released through the ASDC. Image credit: NASA
SAGE III Mission Architecture

The Earth Observer November - December 2015 Volume 27, Issue 610fe
atur
e ar
ticle
s
To communicate with SAGE III on ISS, the SAGE III Payload Operations Center (SPOC) at the FMSC will send software commands to NASA’s Tracking and Data Relay Satellite System (TDRSS3). Once data are transmitted and collected, they will be processed at the Science Computing Facility (SCF) and released to the public directly through the Atmospheric Science Data Center (ASDC).
Measurements from SAGE III on ISS will be validated as they have been during previ-ous SAGE missions: Data from a number of independent instruments using a variety of techniques will be used to assess sensor biases and precision. Validation plans for SAGE III on ISS include working with ongoing ground-based operations, includ-ing the Network for the Detection of Atmospheric Composition Change, spaceborne sensors, and balloon-based O3 measurements, including those from the Southern Hemisphere Additional Ozonesondes (SHADOZ) network.
Data will be freely available for download at eosweb.larc.nasa.gov. The Table below lists the expected data products from the mission.3 TDRSS is a system of satellites used by NASA to communicate with satellite platforms.
Once on orbit, SAGE III on ISS will be controlled from the Flight Mission Support Center—a new mission opera-tions facility at LaRC. Photo credit: NASA
Table. Expected data products from SAGE III on ISS.
Product
Measurement Vertical Range Vertical Resolution Precision Description Type (km) (km) (%)
Level 1B Transmissions Solar 0* - 100 0.75 0.1**
Level 2 Aerosol Extinction Solar 0* - 40 0.75 5
CoefficientsLevel 2 Aerosol Optical Depth Solar 0* - 40 0.75 5
Level 2 O 3Concentration Solar 0* - 50 0.75 5
Level 2 Water Vapor Solar 5* - 45 0.75 10
ConcentrationLevel 2 NO 2
Concentration Solar TP, plus 2 – 45 0.75 10
Level 2 O 3Concentration Lunar 15* - 45 1.5 5
*Denotes vertical range of zero or cloud-top altitude. **Defined as 600 nm. ***TP denotes altitude of the tropopause.

The Earth Observer November - December 2015 Volume 27, Issue 6 11
feat
ure
artic
lesConclusion
Data from SAGE III on ISS, coupled with model results, will allow scientists to moni-tor the health of the ozone layer and track the recovery of stratospheric O3 since rati-fication of the Montreal Protocol. By the 2020s, expectations are that O3 will recover to about half of the amount lost from pre-1980 levels. SAGE III on ISS will also be valuable in assessing the performance of OMPS flying on the Suomi National Polar-orbiting Partnership satellite and planned for additional flights on the Joint Polar Satellite System. In addition, data from SAGE III on ISS will help to reinstitute aerosol measurements crucial for more-accurate, long-term climate and O3 concentration and distribution models. Finally, if there are any new threats to the ozone layer, SAGE III on ISS data will help the scientific community identify the cause and assess the threat.
After SAGE III on ISS, a new generation of instruments will be needed to continue the long-term record of stratospheric O3 and aerosol concentrations. For more infor-mation about the mission, visit sage.nasa.gov.
Preliminary Level-2 and Level-3 SMAP Radiometer Data
Now AvailableThe beta version of Level-2 (L2) and Level-3 (L3) radiometer data from NASA’s Soil Moisture Active Passive (SMAP) mission is now available at the NASA National Snow and Ice Data Center (NSIDC) Distributed Active Archive Center (DAAC). These data use L-band brightness temperature measurements retrieved from the SMAP radiometer to produce global soil moisture estimates.
As of September 9, 2015, the SMAP Science Data System (SDS) began forward processing the beta (Version 1) L2 and L3 radiometer data, which will be made available at the NSIDC within 24 hours of satellite observa-tion for the L2 data, and within 50 hours for the L3 data. Note that reprocessing of the data from March 31, 2015, to September 9, 2015, to Version 1 will begin at the end of October 2015.
The beta (Version 1) SMAP L2 and L3 datasets now available at the NSIDC include:
• SMAP L2 Radiometer Half-Orbit 36 km EASE-Grid Soil Moisture; Digital Object Identifier (DOI):dx.doi.org/10.5067/HF1KOE0Q85V7
• SMAP L3 Radiometer Global Daily 36 km EASE-Grid Soil Moisture; DOI: dx.doi.org/10.5067/NTZW5L0XYP38
Users should be aware that these beta data use preliminary algorithms that are still being validated and are thus subject to uncertainties. The calibrated and validated release (Version 2) of these L2 and L3 datasets is expected to take place at the end of April 2016.
To access data, documentation, and tools, visit nsidc.org/data/smap.
Note also that the Level-1 SMAP radar data are accessible through the Alaska Satellite Facility Center DAAC at www.asf.alaska.edu/smap.
Additional questions can be directed to NSIDC User Services at [email protected].
anno
unce
men
t

The Earth Observer November - December 2015 Volume 27, Issue 612m
eetin
g su
mm
arie
s Landsat Science Team Meeting: Summer 2015 Todd A. Schroeder, U.S. Geological Survey, Earth Resources Observation and Science Center/Arctic Slope Regional Corporation Federal InuTeq, [email protected] R. Loveland, U.S. Geological Survey’s Earth Resources Observation and Science Center, [email protected] A. Wulder, Canadian Forest Service, Pacific Forestry Centre, Natural Resources Canada, [email protected] R. Irons, NASA’s Goddard Space Flight Center, [email protected]
Introduction
The summer meeting of the joint U.S. Geological Survey (USGS)–NASA Landsat Science Team (LST) was held at the USGS’s Earth Resources Observation and Science (EROS) Center July 7-9, 2015, in Sioux Falls, SD. The LST co-chairs, Tom Loveland [EROS—Senior Scientist] and Jim Irons [NASA’s Goddard Space Flight Center (GSFC)—Landsat 8 Project Scientist], opened the three-day meeting on an upbeat note following the recent successful launch of the European Space Agency’s Sentinel-2 mission on June 23, 2015 (see image on page 14), and the news that work on Landsat 9 has begun, with a projected launch date of 2023.
With over 60 participants in attendance, this was the largest LST meeting ever held. Meeting topics on the first day included Sustainable Land Imaging and Landsat 9 development, Landsat 7 and 8 operations and data archiving, the Landsat 8 Thermal Infrared Sensor (TIRS) stray-light issue, and the successful Sentinel-2 launch. In addition, on days two and three the LST members presented updates on their Landsat science and applications research. All presentations are available at landsat.usgs.gov/science_LST_Team_Meetings.php.
Sustainable Land Imaging
David Jarrett [NASA Headquarters—Landsat Data Continuity Mission Program Executive for Earth Science] and Tim Newman [USGS—Land Remote Sensing Program Coordinator] provided an update on the Sustainable Land Imaging (SLI) program. With fund-ing secure for FY16, Jarrett expanded on NASA’s Earth science research, flight, applied science, and technology objectives, which include broader use of the International Space Station, as demonstrated by the Global Ecosystem Dynamics Investigation (GEDI) spaceborne lidar system and the ECOsystem Spaceborne Thermal Radiometer Experiment on Space Station (ECOSTRESS1). The goal of flying multiple satellites to prevent gaps and improve coverage remains a top priority for the land imaging community. In this light, opportunities to accelerate the launch of Landsat 9 are being investigated. Both Jarrett
1 GEDI (pronounced jedi) and ECOSTRESS were the win-ning proposals chosen in the Earth Venture Instrument-2 announcement of opportunity. For more information, visit science.nasa.gov/missions/gedi and science.nasa.gov/missions/ecostress, respectively.
and Newman emphasized that the Landsat program (and SLI) is on solid footing, demonstrated by strong administration backing and broad bipartisan support in Congress. Finally, Newman reported that plans for USGS to archive and distribute Sentinel-2 data through EROS are still on track.
Landsat 9 Update
Jeff Masek [GSFC—Landsat 9 Project Scientist] pre-sented an update on the status of Landsat 9 planning. Landsat 9 will be based on the same requirements and instruments as Landsat 8. As with Landsat 8, the Operational Land Imager (OLI) on Landsat 9 (referred to as OLI-2) will tentatively be built by Ball Aerospace & Technology Corp., while the Thermal Infrared Sensor on Landsat 9 (TIRS-2) will be built at GSFC—both with five-year design lives. The stray-light issue impacting TIRS on Landsat 8 has been identified and is increasingly understood to be due to a manufactur-ing issue that will be corrected on TIRS-2. The LST members discussed several key issues pertaining to the minimum design specifications for Landsat 9 includ-ing: daily acquisition rates; priority and off-nadir imag-ing capabilities; increasing nighttime retrievals; and the possibility of increasing the data structure from 12-bit (the current quantization of Landsat 8 data) to 14-bit measurements. LST members voiced their preliminary support for moving to a 14-bit data structure as the improved signal-to-noise ratio could benefit a number of applications aimed at sensing dark targets. Masek then showed several examples of nighttime imagery, including mapping optical water quality, shallow water bathymetry, benthic substrate, old-growth forests, and glacier ice. Having higher number of scenes is particu-larly useful for applications such as emergency and disaster response. However, the request rate for these so-called high-priority applications is relatively low. Thus, after a lively discussion LST members supported main-taining the number of scenes acquired per day at ~725 (similar to the current rate for Landsat 8).
In addition, Masek reported that over the next five-to-six years NASA will be evaluating options for Landsat 10. They will be weighing tradeoffs between continuity with previous missions and incorporating new tech-nologies (e.g., increased nighttime imaging, hyperspec-tral capabilities), synergy with international systems to improve temporal resolution, and options to minimize instrumentation size in an effort to reduce costs, which may help accelerate future launch dates.

The Earth Observer November - December 2015 Volume 27, Issue 6 13
mee
ting
sum
mar
iesLandsat 7-8 Operations and Archive Update
Brian Sauer [EROS—Landsat Sustaining Engineering Project Manager] reported that the status of Landsat 7 remains unchanged from the previous LST meeting at GSFC in February 20152. Plans for decommissioning Landsat 7 are currently being reviewed. Lowering the orbit by 4 to 10 km (~2.5 to 6.2 mi) instead of the orig-inally proposed 20 km (~12.4 mi) could help prolong the life of the mission to approximately 2021, thereby providing continuity with Landsat 9. Since lowering Landsat 7’s orbit would shift mean collection times to earlier in the day (closer to 9:15 AM, local time) the LST will investigate the impact this will have on time-series studies. Currently, Landsat 7 is collecting ~450 scenes per day—with the primary focus on continen-tal land masses. The Landsat archive is now up to ~ 5.8 million scenes, and continues to rapidly expand due in part to the rise in daily acquisitions from Landsat 8 and continued effort by the Landsat Global Archive Consolidation (LGAC) to repatriate historical scenes from international ground stations. Of the ~3 million scenes that have been added so far, nearly 69% are new to the Landsat archive. As the archive continues to grow so do the number of downloads, which are on track to reach a record high in 2015. As a way to improve the value of the Landsat archive, the LST continues to push for improved processing of Level-1G (L1G3) scenes with the hope that some can be processed to the preci-sion- and terrain-corrected Level-1T (L1T) level appro-priate for time-series analyses.
Sauer also provided an update on the status of several Landsat product improvements. A Quality Assessment (QA) band, which will include information on land-based cloud cover, shadow, snow and ice, and water (from the Fmask algorithm4), has been developed for Landsat 7 and 8 with the hope of release in the spring/summer of 2016. A metadata file containing per-pixel solar illumination and sensor-viewing angle coeffi-cients was released for Landsat 8 in spring 2015, and there should be a similar product for Landsat 5 and 7 released in spring or summer 2016. The Landsat opera-tions team is also considering changing the product file type from GeoTiff to JPEG2000. This change would offer users the ability to download individual spec-tral band data, and would improve compression ratios that would save storage space, as well as promote faster download speeds. The Team had some discussion; some 2 For a summary of this meeting, see the May–June 2015 issue of The Earth Observer [Volume 27, Issue 3, pp. 19-24].3 Note on Nomenclature for USGS Data: Level-1G data are data that have been radiometrically and geometrically corrected; Level-1T data are data that have been terrain cor-rected. For more details on levels of processing for data archived at USGS, please visit landsat.usgs.gov/descriptions_for_the_levels_of_processing.php.4 Fmask is an automated code for clouds, cloud shadow, snow masking of Landsat 4, 5, 7, and 8 images. To learn more visit code.google.com/p/fmask.
of the LST members voicing concerns that the pro-posed changes could cause problems with their batch processing scripts. To better understand the issue, Sauer agreed to provide a tool kit and a series of test images so that Landsat users can investigate whether the benefits of changing file types will outweigh potential problems. Test results will be discussed at the winter 2016 LST meeting. Sauer also noted that Landsat 8 scenes affected by the TIRS stray-light anomaly are still being evalu-ated for potential reprocessing.
Sentinel-2 Mission Update
Benjamin Koetz [European Space Agency (ESA)—Earth Observation Engineer] provided an update on the successful launch of Sentinel-2. Part of ESA’s Copernicus program, Sentinel-2 has a 290-km (~180-mi) swath width with 13 spectral bands covering the visible, near-infrared, and shortwave-infrared regions of the elec-tromagnetic spectrum, recorded at 10-, 20-, and 60-m (~33-, 66-, and 197-ft) spatial resolutions, and deliv-ered in a 12-bit, top of atmosphere (TOA), orthorecti-fied format. The sensor appears to be functioning well and is currently undergoing internal calibration. Data for North America are scheduled for release in summer 2016. Combining Landsat and Sentinel-2 data will pro-vide a two-to-three-day revisit for anywhere on Earth’s surface. Several topic areas were suggested for joint stud-ies with LST researchers: The LST emphasized the need to collect overlapping scenes with Landsat 8 to foster col-laborations between ESA, NASA, USGS, and the LST.
Landsat/Sentinel-2 DIRSIG Modeling
John Schott [Rochester Institute of Technology—Landsat Science Team Member] provided an overview of the Digital Imaging and Remote Sensing Image Generation (DIRSIG) model, which can produce vari-ous types of passive synthetic images for cross-sensor calibration and algorithm testing. Images have been derived for a series of biome testing sites including desert, agricultural, coastal dune, sparse vegetation, deciduous forest, marsh and wetlands, and water. The synthetic scenes will be available to study resolution, radiometry, sun angle, and data acquisition crossing-time effects on time-series datasets built from different sensors. For more information, see www.dirsig.org.
NASA/USGS Sentinel-2 Plans
Jeff Masek and John Dwyer [EROS—Landsat Project Scientist] updated the LST on plans for archiving and distributing a global copy of Sentinel-2 Level-1C5 data at EROS. In anticipation of a pending agreement with ESA, USGS is currently increasing disk space and 5 This is an ESA data classification (as opposed to USGS types listed earlier). Level-1C data consists of top-of-atmosphere reflectances in cartographic geometry. For more information of ESA Data Classifications, please visit sentinel.esa.int/web/sentinel/user-guides/sentinel-2-msi/product-types.
The Earth Observer November - December 2015 Volume 27, Issue 614m
eetin
g su
mm
arie
s building up infrastructure to begin data archiving in fall 2015. The plan is to develop harmonized Landsat 8 and Sentinel-2 composited products using the best pixels (in other words, clearest atmosphere) from each sensor every five days. Processing will involve adjust-ing all view angles to nadir, cloud masking with Fmask and spectral adjustments to modify spectral radi-ance from Sentinel-2’s Multispectral imager (MSI) to OLI surface reflectance. Testing for 20 sites with detailed atmospheric data will begin in fall 2015 on NASA’s Earth Exchange (NEX) supercomputer. To help advance the access and development of harmo-nized data products from Landsat, Sentinel, and other sensors, the NASA Land-Cover/Land-Use Change (LCLUC) Program has funded several multisource land-imaging science investigations to address the challenges associated with generating higher-order data products for the broader user community.
Other Reports
Kass Green [Kass Green and Associates] summa-rized the recent activities of the Landsat Advisory Group (LAG), which is part of the Department of the Interior-sponsored National Geospatial Advisory Committee. The LAG advises the federal government on the requirements, objectives, and actions of the Landsat Program as they apply to ongoing delivery of societal benefits for the nation and the global Earth-observation community. (LAG recently circulated a
web-based survey to collect information from non-federal Landsat users for feedback to the SLI program.) The group is also in the process of gathering informa-tion to help make future recommendations on user experiences in accessing and using data from Sentinel-1 and -2 and other small satellite sensors, and emerging cloud-computing applications and products.
Rich Lawrence [Montana State University—AmericaView Liaison] gave an update on AmericaView university consortium activities. He reported on sev-eral recently held congressional visits to educate policy makers on satellite remote sensing topics. Lawrence said that the consortium found strong interest in Landsat, particularly on how it can be used to address state and local topics including educational uses, natural resources management, economic development planning, and disaster monitoring.
Landsat Science Team Member Presentations
The majority of the second and third days of the meet-ing consisted of Landsat science and applications pre-sentations from members of the LST team. The LST scientists and engineers provided detailed summaries of their research that included evidence of the strengths and weaknesses of the Landsat archive and new applica-tions of Landsat data. These are summarized on Tables 1 and 2 on next two pages.
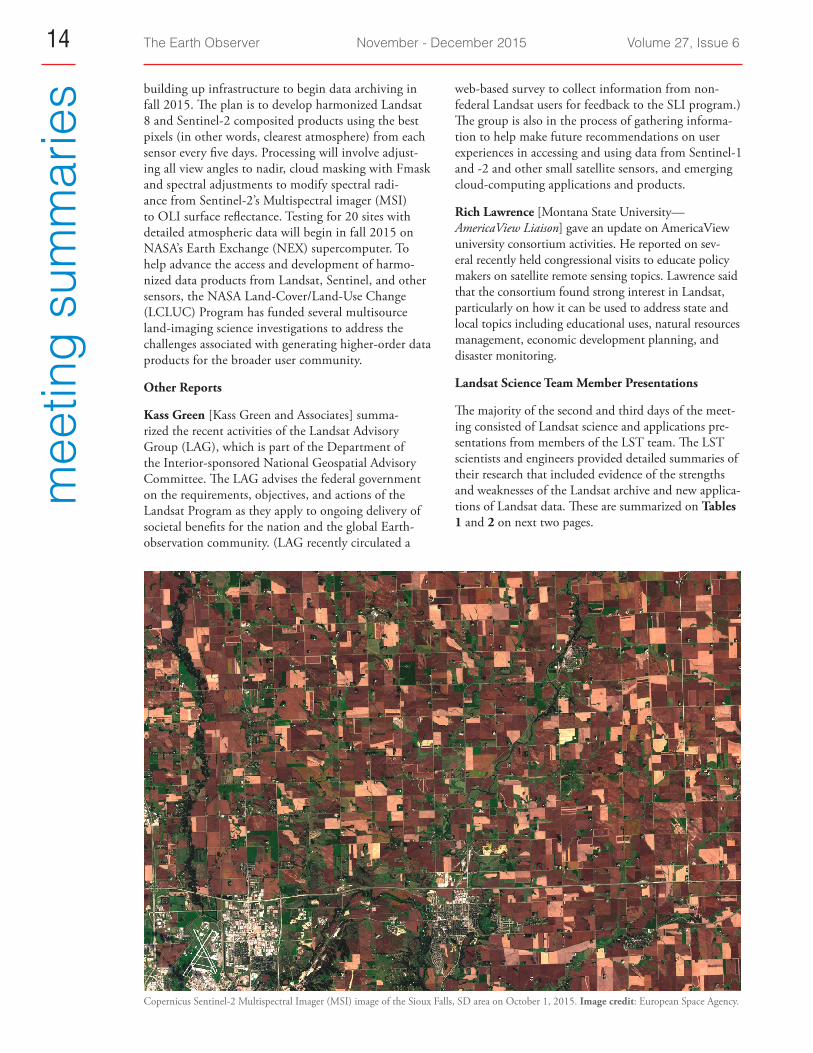
Copernicus Sentinel-2 Multispectral Imager (MSI) image of the Sioux Falls, SD area on October 1, 2015. Image credit: European Space Agency.

The Earth Observer November - December 2015 Volume 27, Issue 6 15
mee
ting
sum
mar
iesTable 1. Landsat Science Team-member presentations from day two (July 8, 2015).
Presenter(s) [Affiliation] Highlights
Leo Lymburner [Geoscience A temporal classification approach was used to produce historical water Australia] extent maps to detect periods of drought across Australia. John Schott (for Aaron Gerace) Landsat 8 and the HydroLight model were used to map terrestrial water’s [Rochester Institute of three main coloring agents: chlorophyll, total suspended sediments, and Technology (RIT)] colored dissolved organic matter.Yongwei Sheng [University of An adaptive hierarchical mapping approach was used to identify lakes 0.5 California, Los Angeles] hectares and larger across the globe.Alan Belward [European A supervised decision-tree approach is being applied in Google Earth Engine to Commission Joint Research Centre] map global surface-water extent in two epochs: 1985-1999 and 2000-2015.
Ted Scambos [University of Colorado]
Improved data acquisition rate of Landsat 8 is helping to advance global ice mapping at high latitudes. New methods are being used to track retreat of mountain glaciers and flux of ice breaking off into the oceans.
Joel McCorkel [NASA’s Goddard Landsat 7 and 8 intercalibration study results were shown, along with a new Space Flight Center (GSFC)] laser-based calibration technique being devised for Landsat 9.
David Roy [South Dakota State University (SDSU)]
Plans presented for integrating Sentinel-2 with Landsat 8 under the Web-enabled Landsat Data (WELD) project. Future development of automated burned area and crop mapping applications were also discussed.Landsat 8 surface reflectance was compared with Aerosol Robotic Network
Eric Vermote [GSFC] (AERONET), Moderate Resolution Imaging Spectroradiomter (MODIS), and flux tower data, with positive results. Also discussed the need to retrofit radiometric processing to older sensors to benefit time-series analyses.
Dennis Helder [SDSU] Absolute pseudo-invariant calibration sites are being developed for use in a reflectance-based cross-calibration of the entire Landsat archive.
John Schott [RIT] Work continues on developing a land-surface temperature product for North America, including an uncertainty layer based on distance to clouds.
Crystal Schaaf [University of Narrow-to-broadband albedo coefficients for Landsat 8 were developed and Massachusetts, Boston] used as inputs into a surface-energy model. David Johnson [U.S. Department of Agriculture (USDA)’s National Agricultural Statistics Service]
Landsat data are being used to develop a U.S. national cropland data layer (CDL) for crop production reports and to study cropland abandonment.
Rick Allen [University of Idaho] Discussed evapotranspiration retrievals from Google Earth Engine and how Landsat is helping to resolve field-scale water rights issues.
Justin Huntington [Desert Research Institute]
Showed how the Landsat archive and cloud computing have transformed the way hydrologic monitoring is performed. Examples of groundwater pump-ing effects on vegetation and effects on sage grouse habitat were presented.Presented a continental-U.S.-wide Google Earth Engine application that
Ayse Kilic [University of Nebraska] uses Landsat and National Agriculture Imagery Program (NAIP) imagery to help homeowners estimate the amount of irrigation necessary to maintain their yards and landscaping.
Randy Wynne [Virginia Polytechnic Institute and State University]
A crowdsourcing approach for mapping clouds was presented along with other topics, including the interchangeable use of Landsat 7 and 8 data for leaf area index (LAI) mapping, surface mine classification, and an update on the National Land Cover Data (NLCD) 2016 Tree Canopy Cover product. The LandTrendr algorithm is being used to develop methods that can con-
Robert Kennedy and Joe Hughes sistently map change and spectrally separable land cover classes through [Oregon State University] time. Results indicated that adding spring imagery to annual time-series
stacks can help improve separation of barren and urban classes. A 28-year, Landsat-based, per-pixel normalized difference vegetation index
Jeff Masek [GSFC] (NDVI) peak greenness time series for Canada and Alaska (1984-2012) was analyzed. Excluding fire effects, nearly 40% of the area was found to be greening while only 6% was browning.

The Earth Observer November - December 2015 Volume 27, Issue 616m
eetin
g su
mm
arie
s Table 2. Landsat Science Team-member presentations from day three (July 9, 2015).
Presenter(s) [Affiliation] Highlights
Martha Anderson [USDA’s Agricultural Research Service]
Crop condition and water use maps are being produced using land sur-face temperature from Geostationary Operational Environmental Satellite (GOES) data, LAI from MODIS data, and a fusion of Landsat/MODIS data from the Spatial and Temporal Adaptive Reflectance Fusion Model (STARFM). Relationships between water use variability and stand age and land use are being explored.
Mark Friedl [Boston University]
A sample-based Landsat time-series approach was used to investigate trends in temperate and boreal forest phenology over the last 20-30 years. Preliminary results showed eastern temperate forests shifting toward an ear-lier start to spring, while the onset of spring may be delayed for central and western boreal forests.
Warren Cohen [USDA’s Forest Service]
Discussed the Landscape Change Monitoring System’s (LCMS) use of an empirical modeling approach to integrate multiple disturbance maps into one change product. Also discussed progress integrating Multi Spectral Scanner (MSS) with other Landsat sensors for time-series analyses.
Patrick Hostert [Humboldt University of Berlin]
Discussed efforts to map deforestation dynamics in the tropics with Landsat time series. Yearly deforestation maps since the 1980s indicate a new surge of deforestation starting in the mid-2000s. The importance of using dry-season imagery for differentiating pasture was also discussed.
Mike Wulder [Canadian Forest Service]
Discussed development of an image composting approach for Canada that uses a proxy interpolation to fill in missing data. Mapping efforts are focused on distinguishing between stand-replacing and non-stand-replacing distur-bance, long-versus-short-term changes, and locating areas of deforestation.
Jim Vogelmann [U.S. Geological Survey (USGS)]
Discussed efforts to map gradual ecosystem changes such as vegetation growth and succession, damage by insects and decline due to drought using 30+ years of Landsat observations.
Curtis Woodcock [Boston University]
Discussed the use of spectral-temporal signatures to classify change with the Continuous Change Detection and Classification algorithm (CCDC). Found a significant difference between Landsat 7 and 8 spectral response using Landsat 7 and 8 underflight data. Stressed the need for consistent cal-ibration across the archive, as well as an increased effort to maximize usabil-ity of L1G data.
Tom Loveland [USGS]
Presented an overview of how EROS science and applications activi-ties are being integrated into a common vision through the Land Change Monitoring Assessment and Projection (LCMAP) project. Stressed the importance of tracking land use, cover, and condition over time to best explain how, where, and why the landscape is changing.
Zhe Zhu [USGS/Arctic Slope Regional Corporation Federal InuTeq]
Demonstrated how using all available Landsat data with the CCDC algo-rithm can help detect gradual and abrupt changes, as well as produce annual land cover maps.
Landsat Product Updates
John Dwyer concluded the meeting with an update on the current status of Landsat Science Products. Derived from L1T data, these products will be in an “analysis-ready” format to support direct quantitative analysis for scientific investigations. The first collections are being produced for the U.S. and will feature advanced correc-tions and consistent calibration applied across all Landsat sensors, with the ability to identify cloud-free stackable pixels for time-series analyses. Seamless mosaics of surface reflectance and brightness temperature will be the base
products with a QA band included for pixel-level trace-ability. With decisions regarding the product line needed by the fall of 2016, the LST has been asked to weigh in on several topics including which QA bands are needed, which radiometric calibration process to implement, what projection system to use, and how best to indicate processing changes to individual scenes (i.e., versioning) versus changes made to the entire product cache (i.e., col-lections). Answers to these and other questions involving development of analysis-ready data will be explored in more detail at the next LST meeting.

The Earth Observer November - December 2015 Volume 27, Issue 6 17
mee
ting
sum
mar
iesConclusion
Landsat science and applications took center stage dur-ing the summer LST meeting. There is now clear evi-dence that Landsat 8’s improved geometry and radiom-etry are leading to advances in understanding Earth’s land and water dynamics. Because of the Landsat data continuity dating back to mid-1972, Landsat investiga-tions are increasingly focused on the use of time-series analyses spanning larger geographic areas. The growing
reliance on time-series investigations highlights the need to continue to improve image geometry and radiometry across the Landsat record. Data from the Sentinel-2 mis-sions are expected to become an important augmenta-tion to the Landsat record and early evidence suggests that studies of vegetation dynamics will benefit from the higher observation frequency.
The next LST meeting is January 12-14, 2016, in Blacksburg, VA.
Storytelling and More: NASA Science at the 2015 AGU Fall MeetingPlease plan to visit the NASA booth (# 335) during the American Geophysical Union’s (AGU) forty-eighth annual Fall Meeting! This year’s exhibit hall will open on Monday, December 14, and will continue through Friday, December 18.
NASA Science has a story to tell and, at AGU, you can be part of it. Visit our nine-screen Hyperwall, where scientists will cover a diverse range of topics including Earth science, planetary science, and heliophysics. The exhibit will also feature a wide range of science demonstrations, printed material, and tutorials on various data tools and services.
A daily agenda will be posted on the Earth Observing System Project Science Office website—eospso.nasa.gov—in early-to-mid December.
We hope to see you in San Francisco!
A NASA Science presentation using the dynamic Hyperwall display during the 2014 AGU Fall Meeting. Image credit: NASA anno
unce
men
t

The Earth Observer November - December 2015 Volume 27, Issue 618m
eetin
g su
mm
arie
s Summary of the Nineteenth OMI Science Team Meeting Joanna Joiner, NASA’s Goddard Space Flight Center, [email protected]
Introduction
The nineteenth Ozone Monitoring Instrument (OMI) Science Team Meeting was held August 31 to September 2, 2015, in De Bilt, Netherlands, at the Netherlands Royal Meteorological Institute [Koninklijk Nederlands Meteorologisch Instituut (KNMI)]. There were nearly 80 participants from more than 25 different research, educational, and industrial organizations. With 11 years of OMI data now available, the goal of this meeting was to provide an update to the user commu-nity on the current status of OMI and the various OMI datasets, and to present new scientific results includ-ing trends and longer-terms records1. This meeting also highlighted how OMI data will be used in conjunction with data from future missions such as the European Space Agency (ESA)’s Sentinel-52 Precursor, scheduled for launch in 2016, that will have the TROPOspheric Monitoring Instrument (TROPOMI) onboard. Similar to OMI, TROPOMI is designed to have higher spa-tial resolution and additional wavelength coverage. The complete list of presentations given during the meet-ing can be viewed on the Meeting Agenda page posted at projects.knmi.nl/omi/research/project/meetings/ostm19.
Highlights
The first day of the meeting focused on instrument and algorithm status. OMI has proven to be one of the most radiometrically stable ultraviolet/visible spectrom-eters ever launched. Apart from an anomaly outside
1 To read a detailed account of the tenth anniversary OMI Science Team Meeting, see “Celebrating Ten Years of OMI Observations” in the May–June 2014 issue of The Earth Observer [Volume 26, Issue 4, pp. 23-30].2 The Sentinel missions are summarized in “An Overview of Europe’s Expanding Earth Observation Capabilities” in the July–August 2013 issue of The Earth Observer [Volume 25, Issue 4, pp. 4-15—see esp pp. 11-12].
the instrument (known as the row anomaly3) that has reduced coverage, the instrument continues to perform well. With the row anomaly, what had been planned and implemented as daily coverage early in the mission now takes two days. The anomalous data do not pres-ent a problem, however, because they can be detected and eliminated for the purpose of scientific studies. Some of the presentations highlighted OMI algorithm updates. Algorithms have continued to improve even after 11 years in orbit. There are several new products available (and others in the works) including research products for aerosol above cloud, water vapor col-umn, and collocation of Moderate Resolution Imaging Spectroradiometer (MODIS) aerosol products on the OMI footprint, expected to be released late this year or early 2016. There was also a poster session held at the end of the day. Thirteen posters covered a variety of research topics including abrupt trend changes in nitrogen dioxide (NO2) over the Middle East and a link between enhanced Arctic tropospheric BrO observed by OMI and meteorological conditions.
The second day began with several invited presenta-tions, including reports from Dutch experts on air qual-ity policies and epidemiology—particularly the health effects of NO2, a species that OMI measures. Folkert Boersma [KNMI] showed that the shipping industry has implemented slow steaming (reducing the speed of the ships), which has resulted in reduced nitrogen oxide (NOx) emissions. Bryan Duncan [NASA’s Goddard Space Flight Center (GSFC)] showed how the effects of regional policies and conflicts are reflected in OMI NO2 data. Willem Verstraeten [KNMI] described how
3 The row anomaly is so-named because it affects about half of the OMI swath (i.e., around half of its 60 rows across the swath). It is thought to have been caused when material outside of the instrument shifted to block a portion of the incoming light. This material also reflects light from outside of its field-of-view into the instrument.
Participants at the nineteenth OMI Science Team Meeting at KNMI. Photo credit: Maarten Sneep [KNMI]

The Earth Observer November - December 2015 Volume 27, Issue 6 19
mee
ting
sum
mar
ies
rapid increases in tropospheric ozone levels over China are tied to NO2 emissions and how this pollution may impact air quality in North America.
Vitali Fioletov [Environment Canada] described how OMI can be used to track and monitor sul-fur dioxide (SO2) emission sources worldwide. SO2 is designated by the U.S. Environmental Protection Agency (EPA) as a criteria pollutant and is a contribu-tor to acid rain. It also plays a role in climate change because it is a precursor of sulfate aerosols that reflect sunlight back to space, thereby cooling Earth’s sur-face. Fioletov provided a global catalog of SO2 sources derived from OMI—see Figure above. The recently improved OMI SO2 algorithm is now more sensitive and can detect sources half the size of those detectable using previous versions. Nickolay Krotkov [GSFC] demonstrated how SO2 and NO2 pollution is increas-ing in some parts of the world and decreasing in oth-ers. Simon Carn [Michigan Technological University] showed how OMI measurements of SO2 can be used to track volcanic degassing, globally. Jos de Laat [KNMI] showed how volcanic haze from the Bárðarbunga Mountain volcanic eruption in Iceland, which began in August 2014, is monitored from space4. Iolanda Ialongo [Finnish Meteorological Institute (FMI)] showed how OMI SO2 data collected from the nearby Icelandic Holuhraun fissure eruption compared with ground-based observations in northern Finland.
On the third day there was a session on future missions and instruments relevant to OMI, such as TROPOMI onboard ESA’s Sentinel-5 Precursor mission, as well as upcoming geostationary missions, which include the Korean Geostationary Environment Monitoring Spectrometer (GEMS), the European Sentinel-4 mission, and the NASA’s Tropospheric Emissions: 4 The eruption officially ended on February 28, 2015, but pollution from the emitted gases persists.
Monitoring of Pollution (TEMPO) instrument5. The meeting closed with presentations on applications and assimilation of OMI data, which included an overview of the Monitoring Atmospheric Composition and Climate-III (MACC-III) from Vincent Huijnen [KNMI]. MACC-III provides data records on atmospheric compo-sition for recent years, data for monitoring present condi-tions, and forecasts of the distribution of key constituents for a few days ahead. Huijen also discussed the Copernicus Atmosphere Monitoring Service (CAMS) that provides global services in near-real-time, in a delayed-mode con-figuration, and as a reanalysis. Satellite data, including data from OMI, are crucial inputs to these systems.
Conclusion
OMI continues to perform well after more than ten years in orbit and data processing algorithms continue to improve. A number of long-term OMI data records are being used for studies on atmospheric composition and chemistry, air quality, and climate. OMI and Aura science team meetings provide an opportunity for team members and collaborators from all over the world to share recent results and discuss future plans. The OMI team will meet again as a group next year at the larger Aura Science Team Meeting that is planned for the week of August 30, 2016, in Utrecht, the Netherlands. That meeting will occur shortly after the twelfth anni-versary of the launch of Aura. The Aura satellite is in excellent health and should be able to continue observa-tions into the next decade.
5 For more on the instruments/missions mentioned here, please refer to “Geostationary Orbit as a New Venue for Earth Science Collaboration” in the July–August 2015 issue of The Earth Observer [Volume 27, Issue 4, pp. 17-22]. For an article focusing more on TEMPO, refer to “NASA Ups the TEMPO on Monitoring Air Pollution” in the March–April 2013 issue of The Earth Observer [Volume 25, Issue 2, pp. 10-15, 35].
Figure. The Ozone Monitoring Instrument (OMI) has a new and improved SO2 detection algorithm that allows it to detect and monitor emis-sion sources with outputs greater than 30 kilotons (kt)—which means that it can now monitor approximately 500 of the top SO2 sources around the world. The map shows the emissions estimates derived using OMI data. Some sources are manmade—such as smelters (e.g., the large dot in Siberia) and power plants (e.g., the numerous small dots over the Ohio river valley in the U.S.)—while others are natural—such as volcanoes (e.g., the dot over Hawaii). This capability is a significant improvement over the previous algorithm, which had a detection threshold of 70 kt, and thus could only monitor about 100 of the top SO2 sources. Credit: Vitali Fioletov

The Earth Observer November - December 2015 Volume 27, Issue 620ku
dos
Congratulations to AGU and AMS Award Winners!The Earth Observer is pleased to recognize the following Earth scientists from NASA Centers who will be receiving awards from the American Geophysical Union (AGU) and American Meteorological Society (AMS) at their annual meetings in December 2015 and January 2016, respectively.
AGU Winners
Brent Holben [NASA’s Goddard Space Flight Center (GSFC)] has been selected to receive the American Geophysical Union’s (AGU) 2015 Yoram J. Kaufman Unselfish Cooperation in Research Award. The award recognizes broad influence in atmospheric science through exceptional creativity, inspiration of younger scientists, mentoring, international collaborations, and unselfish cooperation in research. Holben is cited for his seminal theoretical and experimental contributions to the remote sensing of clouds and aerosol properties, particularly in the development of AERONET. His selection is particularly poignant as he worked closely with Yoram Kaufman at GSFC.
Anne M. Thompson [GSFC] has been selected to receive the AGU 2015 Roger Revelle Medal. This medal is given annually to one honoree in recognition of outstanding contributions in atmospheric sciences, atmosphere-ocean coupling, atmosphere-land coupling, biogeochemical cycles, climate, or related aspects of the Earth system.
Cynthia Rosenzweig and Larry D. Travis [both from NASA’s Goddard Institute for Space Studies] have been named 2015 Fellows of the AGU. The AGU Fellows program recognizes members who have made exceptional contributions to Earth and space sciences as valued by their peers and vetted by section and focus group committees. This honor may be bestowed on only 0.1% of the membership in any given year.
To see the full list of AGU honorees, visit honors.agu.org.
AMS Winners
Steve Platnick [GSFC] has been chosen to receive the American Meteorological Society’s (AMS) 2015 Verner E. Suomi Award for cutting-edge research and leadership in spaceborne observations of the atmo-sphere, particularly remote sensing of cloud properties.
Randal D. Koster [GSFC] has been chosen to receive the AMS 2015 Hydrologic Sciences Medal for groundbreaking contributions to the understanding of land-atmosphere interactions and their effects on hydroclimatic predictability and prediction.
Joshua Willis [NASA/Jet Propulsion Laboratory] has been chosen to receive the AMS 2015 Nicholas P. Fofonoff Award for creative research in determining the circulation and heat content of the ocean and their contribution to sea level change.
Norman G. Loeb [NASA’s Langley Research Center] and Steve Platnick [GSFC] have been named 2015 Fellows of the AMS. To be elected a Fellow of the AMS is a special tribute for those who have made out-standing contributions to the atmospheric or related oceanic or hydrologic sciences or their applications during a substantial period. This designation is conferred upon not more than 0.2% of all AMS members in any given year.
To see the full list of AMS award winners, visit www2.ametsoc.org/ams/index.cfm/about-ams/ams-awards-honors/2016-ams-award-winners.
cong
ratu
latio
ns!

The Earth Observer November - December 2015 Volume 27, Issue 6 21
mee
ting
sum
mar
iesSummary of the Twenty-Fourth CERES-II Science
Team Meeting—Fall 2015 Ed Kizer, NASA’s Langley Research Center/Science Systems and Applications, Inc., [email protected] Walter Miller, NASA’s Langley Research Center/Science Systems and Applications, Inc., [email protected]
Overview
The fall 2015 Clouds and the Earth’s Radiant Energy System (CERES) Science Team Meeting was held September 1-3, 2015, at University of Washington in Seattle, WA. Norman Loeb [NASA’s Langley Research Center (LaRC)—CERES Principal Investigator] hosted and conducted the meeting. The major objectives of the meeting were to review the status of CERES instru-ments1 and data products, and to highlight the creation and improvement of key ancillary datasets used to gen-erate CERES-based Earth radiation budget climate data records (CDRs).
Meeting presentations can be downloaded from the CERES website (ceres.larc.nasa.gov ) by clicking the “CERES Science Team Meetings” button under the “Documentation” navigation dropdown list.
Programmatic and Technical Presentations
The agenda for the first day of the meeting consisted of a series of programmatic and technical presentations.
Norman Loeb gave the opening “State of CERES” address. He covered a number of different topics, begin-ning with the results of the 2015 Earth Science Senior Review (SR) in which 10 Earth Science missions that were operating in (or about to enter) extended operations were reviewed2. Among those were two missions that CERES flies on—Aqua and Terra—and both received a “Very High” utility rating. He also discussed Terra’s plan for exiting the Morning Constellation (one of the issues raised by the SR Science Panel and discussed further in its report referenced above). Originally the plan had been to lower Terra 19 km (~11.8 mi) from its current 705-km (~438-mi) orbit but that plan was controversial because such a maneuver could change its mean local time (MLT, or equator crossing time) enough to dis-rupt continuity of stable long-term climate data records. Subsequently, a new proposal has been put forth that would only require Terra to lower its orbit by 4 km (~2.5 mi) and still have sufficient fuel onboard to be able to maintain the same MLT for an additional three
1 The first CERES instrument was launched in December of 1997 aboard NASA’s Tropical Rainfall Measurement Mission (TRMM). CERES instruments on Terra, Aqua, and the Suomi National Polar-orbiting Partnership are simultaneously collecting observations.2 A full report, including appendices with subpanel reports, can be found at science.nasa.gov/media/mediali-brary/2015/07/15/2015_ESDSeniorReviewReport_FINAL.pdf.
years, i.e., within one minute of its original early mis-sion times. In addition to the SR, the Earth’s Radiation Budget Science Planning, Programming, Budgeting, and Execution (PPBE) and Science Team review were successfully completed this spring. Loeb reported that the number of published journal articles and citations using CERES data products has continued to increase significantly over the past several years. Loeb summa-rized the status of major software deliveries for Terra and Aqua Edition 4 and Suomi National Polar-orbiting Partnership (NPP) Edition 1, and provided the sched-ule of when data products will be publically available. He also presented the new CERES website design, now with dropdown menus and the addition of a CERES publication search engine.
Kory Priestley [LaRC] then gave an update on CERES Flight Model 6 (FM63), which is scheduled for flight on the first Joint Polar Satellite System (JPSS-1) mission no later than 2017. Priestley summarized the satellite integration and testing activities for JPSS-1: FM6 has been integrated, and the satellite is entering environ-mental testing and will be shipped to Vandenberg Air Force Base (the launch site) in May 2016, with launch readiness in October 2016. Priestley also presented an overview of the “successor” to CERES, the Radiation Budget Instrument (RBI), showing drawings of the instrument modules and how it meets CERES proj-ect requirements. The new instrument is scheduled to be completed no later than May 2018 with delivery no later then April 2019, and first flight (onboard JPSS-2) tentatively scheduled for 2021.
Susan Thomas [Science Systems and Applications, Inc. (SSAI)] provided calibration trends on the CERES FM1 through FM5 instruments. She reported that the instrument gain and spectral response functions for Edition 3 of FM1 through FM4 have been delivered for production processing through May 2015, and Edition 4 through December 2014. Thomas also presented CERES FM5 (for Suomi NPP) and FM34 (for Aqua) 3 CERES has had seven Flight Models (FM), meaning seven “copies” of the same instrument were built. Proto-Flight Model (PFM) flew onboard the now defunct Tropical Rainfall Measuring Mission; FM1 and 2 are onboard Terra; FM3 and 4 are onboard Aqua; FM5 is onboard Suomi NPP; and FM6 will fly onboard JPSS-1. 4 While Aqua carries two CERES instruments (FM 3 and FM 4), FM4 experienced an anomaly on March 30, 2005, after which the shortwave channel could no longer be used to obtain daytime observations. Thus, only FM3 is used for flux comparisons.

The Earth Observer November - December 2015 Volume 27, Issue 622m
eetin
g su
mm
arie
s matched-footprint and nadir-dwell comparisons, which show that FM5 shortwave (SW) measurements are higher than FM3, and that FM5 longwave (LW) mea-surements are statistically the same as FM3.
Patrick Minnis [LaRC] summarized the recent activ-ity of the Clouds Working Group, and also reported on removing a coding error that resulted in a signifi-cantly improved clear-sky skin temperature calculation for Suomi NPP Edition 1A. Aqua and Suomi NPP both have afternoon (local time) equator-crossing-time orbits, which allowed comparison of the February 2012 cloud fraction measurements, showing that they were within 3% of each other, globally—with most the differences over Tropical Western Pacific and Arctic night. Minnis also reported on a ten-year climatol-ogy of cloud fractions and trends. Minnis also showed that CERES cloud properties obtained from geosta-tionationary imagers (GEO5) data were consistent with those obtained using the Moderate Resolution Imaging Spectroradiometer (MODIS).
Sunny Sun-Mack [SSAI] presented material on enhanced cloud properties that used Cloud-Aerosol Lidar and Infrared Pathfinder Satellite Observation (CALIPSO) extinction for single cloud layers to rederive the MODIS-based cloud effective height and then cal-culate other parameters, e.g., effective temperature, effective pressure, base height, phase, optical depth, and radius. The addition of CALIPSO data increased cloud fraction by 5% over values derived using MODIS data alone and placed clouds at higher altitudes.
Wenying Su [LaRC] reported on the recent activities of the CERES Angular Distribution Models (ADM) Working Group. She presented the team’s efforts to determine how effective ADMs developed using Aqua data are at removing the directional dependence of radiative fluxes measured using CERES on Suomi NPP. Su presented comparisons of sigmoidal fits over the ocean, developed using Aqua and Suomi NPP data. The impact of increasing the footprint6 size in Suomi NPP (over that of Aqua) was investigated by increas-ing the amount of Aqua MODIS data included, doing a narrowband-to-broadband conversion on radiance, and then applying ADMs. The global monthly mean instantaneous SW and LW fluxes differed by 0.6 and 0.2 W/m2, respectively. These results are only one part of understanding how well the Aqua ADMs will work for Suomi NPP data.
5 This includes data from NOAA’s Geostationary Operational Environmental Satellites (GOES) and Japanese Meteorological Satellites (MTSAT).6 Since Suomi NPP flies at a higher orbit than Aqua (and also Terra) the CERES instrument on Suomi NPP has a larger footprint than those of Aqua (and Terra).
David Kratz [LaRC] provided a report on the sta-tus of the Shortwave Surface-Only Flux Algorithms (SOFA) and Total Solar Irradiance (TSI) data. He pre-sented comparisons of derived SW and LW fluxes from Suomi NPP FM5 and Aqua FM3, and concluded that the largest observed differences in SW surface fluxes were attributable to the differences in orbital param-eters associated with the time of observations and solar zenith angles. Kratz also concluded that the largest dif-ferences in LW surface fluxes for both day and night were attributable to the differences in cloud amount.
Seiji Kato [LaRC] presented an update on the activi-ties of the Surface and Atmospheric Radiation Budget Working Group. He reported that the Edition 4 Synoptic Radiative Fluxes and Clouds (SYN) produc-tion processing had begun. Results over the first few months show less SW surface insolation and more LW downward flux as compared with Edition 3. Kato also reported that the team has started comparing com-puted SW spectral radiances with Scanning Imaging Absorption Spectrometer for Atmospheric Cartography (SCIAMACHY) observations over Dome-C7 and broadband measurements with data from CERES.
Dave Doelling [LaRC] reported on the activi-ties of the Time Interpolation and Space Averaging (TISA) Working Group. The Gridded Geostationary (GGEO) product is being processed at a rate of six months of acquired data per week, including qual-ity control of hourly radiances. Plots of the Monthly Regional (one-degree, equal-angle) Single Scanner Footprint (SSF1deg8) CERES-only SW and LW values and SYN1deg-lite GEO enhanced SW and LW val-ues were shown along with the differences between the two products. The SSF1deg-Month Edition 4A and Edition 3A global mean fluxes showed good consistency over the period 2005 through 2009. Additionally, the SYN1deg Edition 4 and Edition 3 clear-sky LW flux differences (-2.5 W/m2) is greater than what is seen in the SSF1deg (-1.5 W/m2), This difference is a result of the presence of more clouds in Edition 4A. Doelling also announced a new Flux by Cloud-Type Product that should be available in 2016.
Norman Loeb discussed upcoming improvements to the Energy Balanced and Filled Top of Atmosphere (EBAF-TOA) Edition 4.0 product. This version will be based upon the latest algorithm improvements used in CERES processing, and incorporates refine-ments to the EBAF high-resolution, clear-sky, TOA
7 Dome-C is one of a series of high points on Antarctica, and is one of Earth’s coldest locations.8 The SSF1deg and SYN1deg products provide CERES-observed temporally interpolated top-of-atmosphere (TOA) radiative fluxes and coincident MODIS-derived cloud and aerosol properties, differing in assumptions about meteorolog-ical conditions and radiative properties.

The Earth Observer November - December 2015 Volume 27, Issue 6 23
mee
ting
sum
mar
iesfluxes (e.g., see Figure below), particularly for foot-
prints with snow and sea-ice. Loeb presented expected results using multiple channels in converting clear imager radiance to a clear flux on partially cloudy footprints. The current plan is to release five years of EBAF Edition 4.0 (covering 2005 through 2010) in early 2016. He also discussed improvements to the upcoming EBAF-Surface Edition 4 in light of plans to account for downward LW and outgoing longwave radiation (OLR) bias corrections.
Paul Stackhouse [LaRC] presented an update on the CERES Fast Longwave and Shortwave Radiative Fluxes (FLASHFlux) product. He reported the ongoing pro-duction of the newest version (Version 3B), available via the CERES subsetter and Atmospheric Science Data Center (ASDC). Stackhouse presented data vali-dation efforts with comparisons of CERES observa-tions to Baseline Surface Radiation Network (BSRN), Atmospheric Radiation Measurement (ARM), and ocean buoy data products. He also reported the use of CERES FLASHFlux data in the special annual Bulletin of the American Meteorological Society (BAMS) report on the “State of the Climate in 2014.” Stackhouse also discussed first efforts to provide CERES data using Geographic Information System (GIS) tools for FLASHFlux products.
Jonathan Gleason [LaRC] presented the CERES Data Management Team’s (DMT) report, including the 22 soft-ware and data deliveries the DMT has made since May 5, 2015. He also announced that the CERES AuTomAted job Loading sYSTem (CATALYST) Release 2.0 was
delivered on August 28, 2015. It contains significant improvements, including enhancements to the opera-tor’s console graphical user interface. The processing, logging, monitoring, and security capabilities have also all been enhanced in the new version.
Megan McKeown [Universities Space Research Association (USRA)] provided the CERES Education and Outreach Overview, which included a Students’ Cloud Observations On-Line (S’COOL) project update. She reported that they have attracted over 1000 schools and over 350 roving participants who are now providing ground observations.To date, the S’COOL community has reported over 76,000 observations of clouds (type, cover, opacity), visibility, sky color, and surface cover. These observations have been matched to CERES satellite overpasses. McKeown also showed an analysis of when S’COOL and CERES observations disagree and where CALIPSO data have been used to understand the vertical structure of clouds.
Invited Science Presentations
Three invited presentations were given Wednesday, September 2, to discuss climate processes and how they might change in the future.
Qiang Fu [University of Washington (UW)] described the change in global aridity derived using the Coupled Model Intercomparison Project Phase 5 (CMIP5) model outputs with historical forcing between 1948 and 2006 and Representative Concentration Pathways (RCPs) 8.5 and 4.5 from 2006 until 2100. The model results show a precipitation increase of some 1.5% per
Figure. These graphs show CERES TOA all-sky radiation anomalies (deviations from 15-year mean values for March 2000 through May 2015) based on the Energy Balanced and Filled (EBAF) product for: absorbed solar radiation [top], emitted longwave radiation [middle], and net radiation [bottom]. The thin line is the monthly deviation and the dark line is a twelve-month running mean. Image credit: Norman Loeb
Global TOA All-Sky Radiation Anomalies (CERES_EBAF_Ed2.8; 03/2000 – 05/2015

The Earth Observer November - December 2015 Volume 27, Issue 624m
eetin
g su
mm
arie
s degree Celsius, and land-surface temperature warm-ing about 50% greater than ocean surface tempera-ture. Also, relative humidity decreased over land, but increased over ocean. The net result of the model out-put is a decrease in average aridity index, and a 10% increase in world dryland area between the 1990 clima-tology and the end of the century (2100).
Robert Wood [UW] showed the impact of macro-physical and microphysical processes on albedo, dis-tinguishing between clear air and cloudy fractions. The cloudy albedo is a function of cloud optical thickness and solar zenith angle, where the liquid water path (LWP) and cloud droplet concentration (Nd) are key contributors to the cloud optical thickness. A proxy albedo is then constructed from MODIS values for these and related retrievals. The results show that low cloud cover is responsible for more of the albedo vari-ance than higher cloud albedo, and the variance in LWP accounts for more of the albedo variation than Nd. Further analysis isolating several components yielded geographically coherent albedo patterns, with high albedo and Nd concentrations near continents, and with lower values in open ocean. The low-albedo
regions are associated with warm rain (where aerosols are being washed out of the atmosphere).
Dargan Frierson [UW] discussed new connections between radiance and distant circulations. Specifically, he addressed the connection occurring between clouds and extratropical storm tracks and tropical rain belts. A Budkyo-Sellers-North energy balance model captures most of the variation in General Circulation Models (GCMs). The model shows that cross-equatorial trans-port is linked to the precipitation in the Intertropical Convergence Zone (ITCZ) and that the ITCZ will shift toward the heating caused by greater landmass (i.e., toward the Northern Hemisphere).
Contributed Science Presentations
A variety of topics were covered during the contributed science presentations that took place on the second and third days of the meeting and are summarized in Tables 1 and 2, respectively. These included climate model assess-ments, validation efforts, and discussions about algorithm improvements. Refer to the URL in the Overview section on page 21 for specific details on each presentation.
Table 1: CERES contributed science presentations from day two (Wednesday, September 2).
Speaker [Institution] Topic
Aaron Donohoe [University of Washington SW and LW contributions to global warming under increasing (UW)] carbon dioxide (CO )2
Stephen Po-Chedley [UW] Can CERES data help constrain cloud feedback?
Kuan-Man Xu [LaRC]Sensitivity of tropical water and energy cycle to sea surface temperature increase and doubling CO as simulated with an 2upgraded Multiscale Modeling Framework
Tom Ackerman [UW] Responding to climate change: Is climate engineering an option?
Norman Loeb [LaRC] Observation-based constraints on atmospheric and oceanic cross-equatorial heat transport
Isabel McCoy [UW] Understanding the radiative impacts of open and closed meso-scale cellular convection
Ryan Eastman [UW] The evolution of subtropical stratocumulus cloud properties from multiple satellites using a new Lagrangian approach
Dependencies of subtropical low clouds diagnosed from Aqua Atmospheric Infrared Sensor (AIRS), MODIS, and European
Casey Wall [UW] Centre for Medium-Range Weather Forecasts (ECMWF)-interim reanalysis and the inferred changes in low cloud fraction in a warming climate
Zachary Eitzen [SSAI] A new CERES flux-by-cloud-type simulator
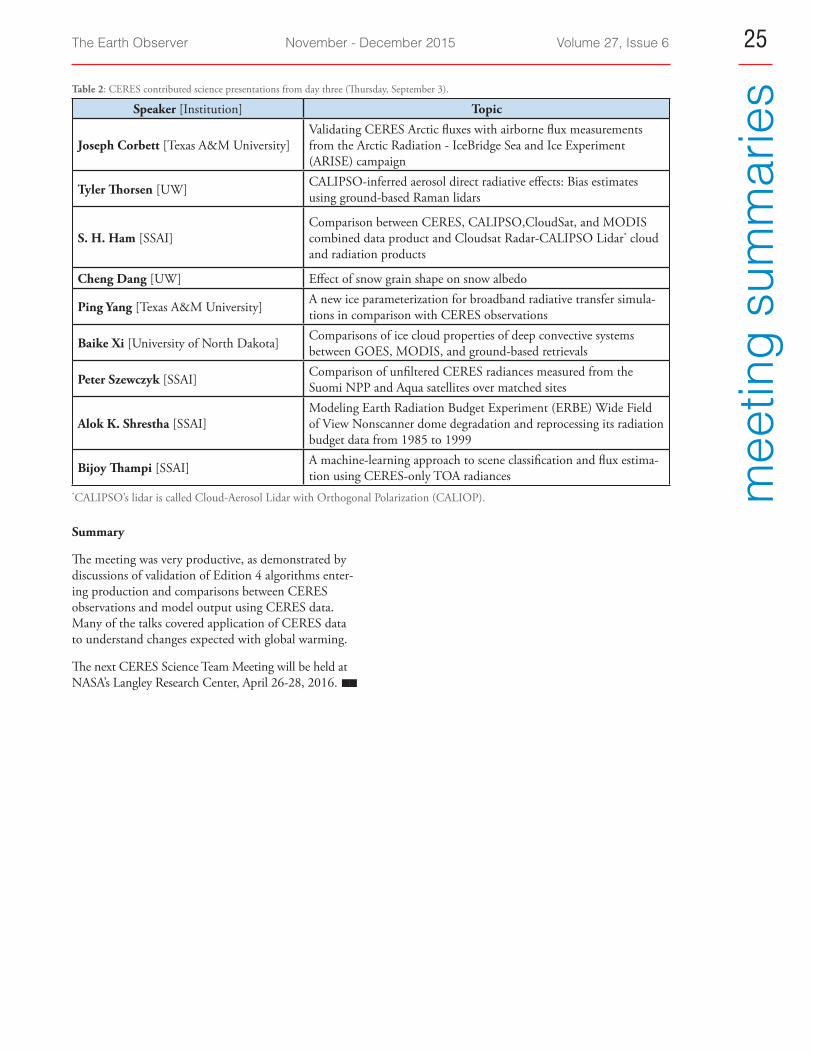
The Earth Observer November - December 2015 Volume 27, Issue 6 25
mee
ting
sum
mar
iesTable 2: CERES contributed science presentations from day three (Thursday, September 3).
Speaker [Institution] Topic
Validating CERES Arctic fluxes with airborne flux measurements Joseph Corbett [Texas A&M University] from the Arctic Radiation - IceBridge Sea and Ice Experiment
(ARISE) campaign
Tyler Thorsen [UW] CALIPSO-inferred aerosol direct radiative effects: Bias estimates using ground-based Raman lidars
Comparison between CERES, CALIPSO,CloudSat, and MODIS S. H. Ham [SSAI] combined data product and Cloudsat Radar-CALIPSO Lidar* cloud
and radiation products
Cheng Dang [UW] Effect of snow grain shape on snow albedo
Ping Yang [Texas A&M University] A new ice parameterization for broadband radiative transfer simula-tions in comparison with CERES observations
Baike Xi [University of North Dakota] Comparisons of ice cloud properties of deep convective systems between GOES, MODIS, and ground-based retrievals
Peter Szewczyk [SSAI] Comparison of unfiltered CERES radiances measured from the Suomi NPP and Aqua satellites over matched sitesModeling Earth Radiation Budget Experiment (ERBE) Wide Field
Alok K. Shrestha [SSAI] of View Nonscanner dome degradation and reprocessing its radiation budget data from 1985 to 1999
Bijoy Thampi [SSAI] A machine-learning approach to scene classification and flux estima-tion using CERES-only TOA radiances
*CALIPSO’s lidar is called Cloud-Aerosol Lidar with Orthogonal Polarization (CALIOP).
Summary
The meeting was very productive, as demonstrated by discussions of validation of Edition 4 algorithms enter-ing production and comparisons between CERES observations and model output using CERES data. Many of the talks covered application of CERES data to understand changes expected with global warming.
The next CERES Science Team Meeting will be held at NASA’s Langley Research Center, April 26-28, 2016.

The Earth Observer November - December 2015 Volume 27, Issue 626m
eetin
g su
mm
arie
s Summary of the GOFC-GOLD SEARRIN Workshop: Assessing Land Use/Cover Changes and Air Quality in Asia Krishna Prasad Vadrevu, University of Maryland, College Park, [email protected] Justice, University of Maryland, College Park, [email protected] Gutman, NASA Headquarters, [email protected]
Introduction
Global Observation of Forest and Land Cover Dynamics (GOFC-GOLD)—a project of the Global Terrestrial Observing System program sponsored by the international Integrated Global Observing Strategy—has the overall objective of improving the availability and utility of Earth observations of forests, land cover, and fire at global and regional scales, for a variety of user communities. The main themes of the GOFC-GOLD program are fire monitoring and land-cover characterization and change. GOFC-GOLD activities are guided by an executive committee, with support and coordination from two thematic project offices supported by NASA and the European Space Agency (ESA). Over a period of years, GOFC-GOLD has facil-itated the development of several regional networks that act as a forum for exchange of information, data, tech-nology, and methods within and between regions.
This article summarizes a meeting of the GOFC–GOLD Southeast Asia Regional Research and Information Network (SEARRIN) workshop that took place August 4-7, 2015, in Bogor, Indonesia. Meeting sponsors included GOFC–GOLD, the U.S.-based international global change SysTem for Analysis, Research and Training (START), the Japanese National Institute of Environmental Studies (NIES), NASA’s Land Cover Land Use Change (LCLUC) program, the University of Maryland, College Park (UMD), and Bogor Agricultural University (BAU) in Indonesia. The workshop lasted four days, including a fieldtrip to Gudung Gede national park to study local land use and cover change (LUCC) and biodiversity.
The main objective of the workshop was to discuss LUCC and their impacts on greenhouse gas emis-sions (GHG) and aerosols over Asia. The workshop was organized into six sessions, with session chairs that included international leaders in the discipline, invited keynote speakers, and other presenters. The sessions were as follows:
• Regional and National Science Initiatives
• LUCC, Forests, and GHG Emissions
• Inventories, Monitoring, and Modeling of GHGsand Air Pollution
• Vegetation Fires and Biomass Burning Emissions
• Aerosols and Radiation
• Regional Science Summary and Research Prioritiesfor the South East Asia Regional Research andInformation Network (SEARRIN)
The workshop was highly successful and brought together 120 researchers from the region, including representatives from Vietnam, Malaysia, Singapore, Thailand, India, China, Japan, Cambodia, Myanmar, the Philippines, and Indonesia. This article will summa-rize the content of each of the sessions. Workshop pre-sentations can be accessed at gofc-fire.umd.edu/meeting/static/Indonesia_Workshop_2015/index.php.
Opening Presentations
After an introductory welcome address from the local host, Bambang Saharjo [Bogor Agricultural University, Indonesia], Chris Justice [UMD] provided a brief overview of the GOFC-GOLD program.
Krishna Vadrevu [UMD] presented the workshop objectives. He highlighted how increasing human pop-ulation with consequent changes in energy demand and land use have the most impact on concentrations of GHGs and short-lived climate pollutants (SLCPs) in the Asian region. Six of the world’s most polluted cit-ies are in Asia and the region generates a third of the world’s carbon dioxide (CO2) emissions; thus, emis-sions reductions in Asia can have a significant impacts at global scales. In addition, Vadrevu discussed trans-boundary pollution from biomass burning and the need for effective long-term solutions. He also stressed the need to develop robust regional emission inventories and impact assessments.
Garik Gutman [NASA Headquarters] delivered a key-note address on the NASA LCLUC program, focusing on Southeast Asia. He highlighted several important issues that require immediate attention, such as for-est clearing for plantations, emissions and pollution from deforestation and fires, industrial pollution, and climate change. He described how climate events such as El Niño impact weather in Indonesia. He described his own research on the 1997-98 El Niño event, point-ing out how satellite retrievals can monitor such events.

The Earth Observer November - December 2015 Volume 27, Issue 6 27
mee
ting
sum
mar
iesGutman also described previous and current LCLUC
projects in South/Southeast Asia.
Regional and National Science Initiatives
One of the important regional initiatives in the Southeast Asia region is the Seven South East Asian Studies (7-SEAS1) project, in place since 2007. The project addresses interdisciplinary research in the fields of aerosol-meteorology-climate interaction, from Java through the Malay Peninsula, and from Southeast Asia to Taiwan. Phase-III of 7-SEAS is scheduled to take place from 2016 through 2018. Other impor-tant regional activities pertain to the Indonesian National Institute and Aeronautics and Space [Lembaga Penerbangan dan Antariksa Nasional (LAPAN)] remote sensing agency activities, which is involved in land resources, mapping, and monitoring; coastal and marine resource assessments; and environment and disaster mitigation. The LAPAN ground station in Rumpin, Bogor (Indonesia), receives data appli-cable to these areas from a variety of well-established and trusted instruments on orbiting platforms from the U.S., Europe, Japan, and France. A satellite that is particularly noteworthy for applications in Asia is the Vietnam Natural Resource, Environment and Disaster monitoring Satellite (VNREDSAT-1), from the Vietnam Academy of Science and Technology (VAST). Launched on May 7, 2013, VNREDSAT-1 has a life-time of about five years. The satellite’s measuring swath is 17.5 km (~11 mi) with a resolution of 2.5 m (8.2 ft) for panchromatic data and 10-m (~33-ft) resolu-tion for its four multispectral bands, and has a revisit time of three days. Data from VNREDSAT-1 are being used for urban management and natural resource moni-toring, including hazards and disasters in Vietnam. Relating to capacity building and networking in the South/Southeast Asia region, the Asia-Pacific Network (APN) for global change research has been leading such activities. APN was originally established in 1996 as a U.S.-Japan initiative and is now funded by Japan, theRepublic of Korea, and New Zealand. (More informa-tion about APN can be found at www.apn-gcr.org.)
Land Use/Cover Changes (LUCC), Forests, and GHG Emissions
Specific to Indonesia, using fires for forest and peatland clearing for industrial oil palm plantations is pervasive. Since 2008 Indonesia has been the largest oil palm pro-ducer worldwide. Peatlands harbor rich carbon stocks; therefore, forest clearing on peat soils results in signifi-cant carbon losses. Specific to Kalimantan, the area devoted to oil palm production increased 278% since
1 A whitepaper describing 7-SEAS can be found at 7-seas.gsfc.nasa.gov/; more information is also available at www.nrlmry.navy.mil/aerosol_web/7seas/7seas.html.
2000. Expansion of oil palm production is often held responsible for biodiversity loss and increased green-house gas emissions, and causes land rights conflicts between oil palm companies and the local populace. If this practice is not stopped or significantly curtailed, currently allocated leases for oil palm plantations will increase deforestation and near-term carbon emissions. It is therefore crucial to consider deforestation, peatland conservation, and local livelihood issues while framing land-use and forest protection policies2. This is all the more important when one considers that in Indonesia, peatlands (and mangroves) are the key ecosystems for carbon emissions mitigation. Peatland vegetation types, peat depths, water table levels, and soil organic carbon contents are highly variable from location to location. This means that in order to minimize uncertainty in emission estimates, developing emission factors based on detailed peat land stratification in several locations is necessary. Structural information retrieved from PALSAR3 data can provide additional information on above-ground biomass useful for carbon assessments. Further, improvements to model-based estimates of car-bon emissions in South/Southeast Asia due to LUCC will come about as improved data become available on rates and patterns of LUCC, biomass estimates for dif-ferent vegetation types, and soil carbon pool estimates.
Most often, the value of forests to the livelihoods—and food security—of the world’s poorest peoples has remained largely underestimated. Existing tools that assess poverty and income often fail to adequately cap-ture the importance of income from natural resources. Furthermore, generalizations about links between migration, urbanization, and forest cover are often crude and uninformed. As a result, more robust case studies are needed to understand diversity and com-plexity in migration, urbanization, and the effects on forests. The Poverty and Environment Network (PEN4) is helping to mitigate this problem. It is the largest quantitative, global, comparative research project on forest and rural livelihoods to date; the PEN global database includes 24 countries and more than 17 mil-lion data cells.
Inventories, Monitoring, and Modeling of GHGs and Air Pollution
This session highlighted the need for improved emis-sion inventories in the region. In the South/Southeast 2 To learn more about this topic please see “NASA Satellite Data Used to Study the Impact of Oil Palm Expansion Across Indonesian Borneo” in the September–October 2013 issue of The Earth Observer [Volume 25, Issue 5, pp. 12-16]. 3 PALSAR stands for Phased Array type L-band Synthetic Aperture Radar; this is an active microwave instrument onboard Japan’s Advanced Land Observation Satellite (ALOS).4 To learn more about PEN, visit www1.cifor.org/pen.

The Earth Observer November - December 2015 Volume 27, Issue 628m
eetin
g su
mm
arie
s Asia, air pollution from ozone (O3) and particulate matter (PM) of various sizes5 is a severe environmen-tal issue with human health concerns. In contrast to CO2 mitigation, mitigation of SLCPs (like O3 and PM) might be achieved on much shorter time scales; therefore, emission inventories are needed to address emission reduction policies in the region. The Regional Emission Inventory in Asia (REAS) data-base is being updated to account for historical (1950 through 2011) and recent (from 2011 onward) emis-sions, using a top-down approach. Relating to emis-sions data collection, in Indonesia, as part of Global Atmospheric Watch (GAW), the Indonesian Agency for Meteorology, Climatology and Geophysics [Badan Meteorologi, Klimatologi, dan Geofisika (BMKG)] is involved in measurements of surface O3, solar radia-tion, and meteorological parameters such as tempera-ture and rainfall from 1996 to the present. Carbon monoxide (CO) has been measured since 2000, whereas PM10 and GHGs have been measured since 2004. In Vietnam an online air pollution manage-ment system has been developed that provides PM2.5 maps at 10-km (~6.2-mi) resolution using data from the Moderate Resolution Imaging Spectroradiometer (MODIS6) from December 2010 through September 2014. However, cloud cover is still a major problem impacting satellite data retrievals. In Malaysia, PM is a major cause of air pollution due to mostly local urban and transboundary pollution from fires.
Vegetation Fires and Biomass Burning Emissions
This session addressed some of the ongoing issues in remote sensing fire research. Remote sensing can help to answer vegetation-fire related questions such as amount of fuel availability, fire start and end periods, area burnt, and the amount of biomass burnt. Fire monitoring from satellites began in the 1990s to develop algorithms and global datasets at 1-km (~0.6-mi) resolution using data from the Advanced Very High Resolution Radiometer (AVHRR7) Since then, major advances in fire monitor-ing have been achieved by using data from MODIS and Landsat. Currently operational, data from the Suomi National Polar-orbiting Partnership (NPP) Visible Infrared Imager Radiometer Suite (VIIRS) are provid-ing another step forward in space-based fire monitoring capability. In addition, future instruments onboard the Joint Polar Satellite System (JPSS), the Geostationary Operational Environmental Satellite (GOES)-R, the European Space Agency’s Sentinels, and the Japan Aerospace Exploration Agency’s Global Change 5 PM10 is particulate matter 10 micrometers or less in diam-eter, PM2.5 is particulate matter 2.5 micrometers or less in diameter. PM2.5 is generally described as fine particles. By way of comparison, a human hair is about 100 µm, so roughly 40 fine particles could be placed on its width.6 MODIS flies onboard NASA’s Terra and Aqua satellites.7 AVHRR flies onboard the U.S. National Oceanic and Atmospheric Administration’s (NOAA) Polar Orbiting Environmental Satellites (POES).
Observation Mission—Climate (GCOM-C1) all have potential fire monitoring capabilities. Among South/Southeast Asian countries, biomass burning is preva-lent in Myanmar, India, Indonesia, and China, and fires in broadleaved deciduous forests and shrub lands and rain-fed croplands dominate the region. Trend analysis suggests that fires in China increased by a factor of two, whereas in India they increased by a factor of one-and-a-half between 2003 and 2014. Fire counts (FC) and fire radiative power (FRP) data products show stronger cor-relations with aerosol indices derived using information from ultraviolet wavelengths than they do with aero-sol indices derived using optical (visible) wavelengths. Smoke plume heights also have an impact on the corre-lations between FC and FRP and aerosol indices.
Specific to peatland fires, development of robust meth-odologies to measure burned areas (and depths) of peatland fires is necessary for more accurate carbon accounting. A distinction should be made regard-ing peatland fires, which are mostly surface fires on peat-dominated sites, and peat fires, which are mostly ground fires burning into peat soils. Most of the fires in Indonesia are manmade; however, fire intensity increases during the El Niño Southern Oscillation (ENSO) because of drier conditions. In addition, short droughts (i.e., those lasting less than two months) impede fire forecasts. From the discussions, the con-sensus was that the focus of activities should be more on fire prevention than firefighting.
Aerosols and Radiation
The technical presentations from this session highlighted both potential gains and pitfalls of satellite aerosol and radiation research. Discrimination of aerosol types—such as mineral dust, smoke, and anthropogenic pol-lutants—from satellite data is possible through valida-tion from ground-based measurement networks such as the Aerosol Robotic Network (AERONET8) and SKYNET9. However, more accurate characterization of aerosols from satellites depends on improved error bud-get analysis. For atmospheric correction of satellite data, careful absolute calibration through cross-comparison over specific sites (e.g., deserts) is also needed. In order to meaningfully compare different reflectance products, it will be necessary to better understand several data characteristics, including spatial characteristics, spectral differences, and directional effects. In addition to robust radiative transfer codes, cloud/cloud-shadow screening is a must for generating accurate atmospherically corrected products. New sensors with high spatial, spectral, and radiometric resolution can be used for improved cirrus detection and air quality studies. These sensors include Operational Land Imager (OLI) onboard Landsat 8, and Multispectral Imager (MSI) onboard Sentinel 2.8 For more information about AERONET, visit aeronet.gsfc.nasa.gov.9 For more information about SKYNET, visit atmos2.cr.chiba-u.jp/skynet.

The Earth Observer November - December 2015 Volume 27, Issue 6 29
mee
ting
sum
mar
iesAerosol emissions from peatland fires can result in
high aerosol optical depth (AOD) (values greater than 5.0); therefore, it is important to improve our ability to observe and quantify these emissions. Average PM2.5aerosol levels emitted from peatland fires vary consid-erably and are primarily composed of organic carbon. Variability in clouds among global circulation models can cause important differences in estimated sulfur distri-butions, so accurate cloud parameterizations are needed. With respect to radiation data, Downward Surface Solar Radiation (DSSR) datasets with high temporal and spa-tial resolution are needed over South/Southeast Asia to accurately assess energy and water cycles.
Summary
The workshop was very productive and the partici-pants unanimously acknowledged that studying trans-boundary movement of pollutants requires a regional approach. Such an approach will support advancing
the science to better understand the sources, processes, and trends; developing and evaluating approaches to mitigate the adverse effects of GHGs and aerosol pol-lutants from different sources; and providing scientific information to policy makers in a timely manner to aid policy-based solutions. In addition, the workshop participants recommended increased communication between scientists within the region through collab-orative projects and workshops to enable sharing of local knowledge and data; the development of com-mon methods increasing capacity of scientists across the region to address common problems; synthesis of scien-tific results and findings; and packaging scientific infor-mation in ways that can inform policy and the public at both the regional and national levels. The workshop results will comprise a special issue of Environmental Research Letters as well as a book—see Input for Special Issue of Environmental Research Letters and Springer Book Requested.
Input for Special Issue of Environmental Research Letters and Springer Book RequestedThere will be two upcoming publications that will provide opportunities to further promote the results from the GOFC-GOLD SEARRIN workshop.
• An “In Focus Issue” of Environmental Research Letters, edited by Krishna Vadrevu [UMD] andToshimasa Ohara [NIES]. To learn more, visit iopscience.iop.org/1748-9326/focus/Land%20Use%20Cover%20Changes.
• A book titled Land-Atmospheric Interactions in Asia to be published in 2016 by Springer and editedby Vadrevu, Ohara, and Chris Justice [UMD]. For more details, contact Krishna Vadrevu [email protected].
The content of these publications is not limited to the presentations from this meeting. All researchersworking in LUCC, GHGs, and aerosols in the Asian region are invited to contribute to the journal’sspecial issue and book.
The GOFC-GOLD SEARRIN workshop participants. Photo credit: Bogor Agricultural University staff

The Earth Observer November - December 2015 Volume 27, Issue 6
Arctic Sea Ice Summertime Minimum Is Fourth Lowest on RecordSteve Cole, NASA Headquarters, [email protected] Rani Gran, NASA’s Goddard Space Flight Center, [email protected]
30in
the
new
s
EDITOR’S NOTE: This article is taken from nasa.gov. While it has been modified slightly to match the style used in The Earth Observer, the intent is to reprint it with its original form largely intact.
According to a NASA analysis of satellite data, the 2015 Arctic sea ice minimum extent is the fourth lowest on record since observations from space began.
The analysis by NASA and the NASA-supported National Snow and Ice Data Center (NSIDC) at the University of Colorado at Boulder showed that on September 11, 2015, the Arctic sea ice reached its annual minimum extent of 1.70 million mi2 (4.41 mil-lion km2). This year’s minimum is 699,000 mi2 (1.81 million km2) lower than the average for 1981 through 2010—see Figure below.
Arctic sea ice cover, made of frozen seawater that floats on top of the ocean, helps regulate the planet’s tempera-ture by reflecting solar energy back to space. The sea ice cap grows and shrinks cyclically with the seasons. Its minimum summertime extent, which occurs at the end of the melt season, has been decreasing since the late 1970s in response to warming temperatures.
In some recent years, low sea-ice minimum extent has been at least in part exacerbated by meteorological fac-tors, but that was not the case this year.
“This year is the fourth lowest, and yet we haven’t seen any major weather event or persistent weather pattern in the Arctic this summer that helped push the extent lower as often happens,” said Walt Meier [NASA’s Goddard Space Flight Center (GSFC)—Sea Ice Scientist]. “It was a bit warmer in some areas than last year, but it was cooler in other places, too.”
In contrast, in 2012—the year of the record sea ice minimum—a powerful August cyclone fractured the ice cover, accelerating its decline.
The sea ice decline has accelerated since 1996. The 10 lowest minimum extents in the satellite record have occurred in the last 11 years. The 2014 minimum was 1.94 million mi2 (5.03 million km2)—the seventh low-est on record.
“The ice cover becomes less and less resilient, and it doesn’t take as much to melt it as it used to,” Meier said. “The sea ice cap, which used to be a solid sheet of ice, now is fragmented into smaller floes that are more exposed to warm ocean waters. In the past, Arctic sea ice was like a fortress. The ocean could only attack it from
Figure. The 2015 Arctic sea ice summertime minimum is 699,000 mi2 (1.81 million km2) below the average for 1981 through 2010, shown here as a white line. Image credit: NASA’s Scientific Visualization Studio

The Earth Observer November - December 2015 Volume 27, Issue 6 31
in th
e ne
wsthe sides. Now it’s like the invaders have tunneled in
from underneath and the ice pack melts from within.”
Some analyses have hinted the Arctic’s multiyear sea ice—the oldest and thickest ice that survives the sum-mer melt season—appeared to have recuperated partially after the 2012 record low. But according to Joey Comiso [GSFC—Sea Ice Scientist], the recovery flattened last winter and will likely reverse after this melt season.
“The thicker ice will likely continue to decline,” Comiso said. “There might be some recoveries during some years, especially when the winter is unusually cold, but it is expected to go down again because the surface tem-perature in the region continues to increase.”
This year, the Arctic sea ice cover experienced rela-tively slow rates of melt in June, which is the month the Arctic receives the most solar energy. However, the rate of ice loss picked up during July, when the sun is still strong. Faster than normal ice loss rates contin-ued through August, a transition month when ice loss typically begins to slow. During August, a big “hole” appeared in the ice pack in the Beaufort and Chukchi seas, north of Alaska, when thinner seasonal ice sur-rounded by thicker, older ice melted. The huge open-ing allowed for the ocean to absorb more solar energy, accelerating the melt.
It’s unclear whether this year’s strong El Niño event1, which is a naturally occurring phenomenon that 1 See related news story on page 34 of this issue.
typically occurs every two to seven years where the surface water of the eastern equatorial Pacific Ocean warms, has had any impact on the Arctic sea ice mini-mum extent.
“Historically, the Arctic had a thicker, more rigid sea ice that covered more of the Arctic basin, so it was dif-ficult to tell whether El Niño had any effect on it,” said Richard Cullather [GSFC—Climate Modeler]. “Although we haven’t been able to detect a strong El Niño impact on Arctic sea ice yet, now that the ice is thinner and more mobile, we should begin to see a larger response to atmospheric events from lower latitudes.”
In comparison, research has found a strong link between El Niño and the behavior of the sea ice cover around Antarctica. El Niño causes higher sea level pressure, warmer air temperature, and warmer sea surface tem-perature in west Antarctica that affect sea ice distribu-tion. This could explain why this year the growth of the Antarctic sea ice cover, which currently is headed toward its yearly maximum extent and was at much higher than normal levels throughout much of the first half of 2015, dipped below normal levels in mid-August2.
Starting in late September 2015, NASA’s Operation IceBridge, an airborne survey of polar ice, will be carry-ing science flights over sea ice in the Arctic, to help vali-date satellite readings and provide insight into the impact of the summer melt season on land and sea ice.
2 See related news story on page 32 of this issue.
Deep Blue Aerosol Project Website Now LiveThe Deep Blue aerosol project now has its own website: deepblue.gsfc.nasa.gov.
Deep Blue is the name of an algorithm that uses measurements made by Earth-orbiting instruments to deter-mine the amount and properties of aerosols in the atmosphere. In this context, the term aerosols describes par-ticles suspended in the atmosphere, including—but not limited to—desert dust, smoke, volcanic ash, indus-trial smog, and sea spray. Improving our understanding of aerosols is important for reasons related to Earth’s climate, human health, ecology, and more.
The site is intended to act as a single resource for the various current and forthcoming Deep Blue satellite aero-sol data products, based on retrievals from the Sea-viewing Wide Field-of-View Sensor (SeaWiFS), Moderate Resolution Imaging Spectroradiometer (MODIS), and Visible-Infrared Imager Radiometer Suite (VIIRS). The site includes information on and links related to the data products, such as file formats, publications, and data access locations, and some background information on aerosols and aerosol remote sensing for the non-specialist. There is also an RSS feed, to which you can subscribe for information relating to the project, such as new publications or data version updates.
Please direct questions to Andrew Sayer of the Deep Blue Project at [email protected].
anno
unce
men
t
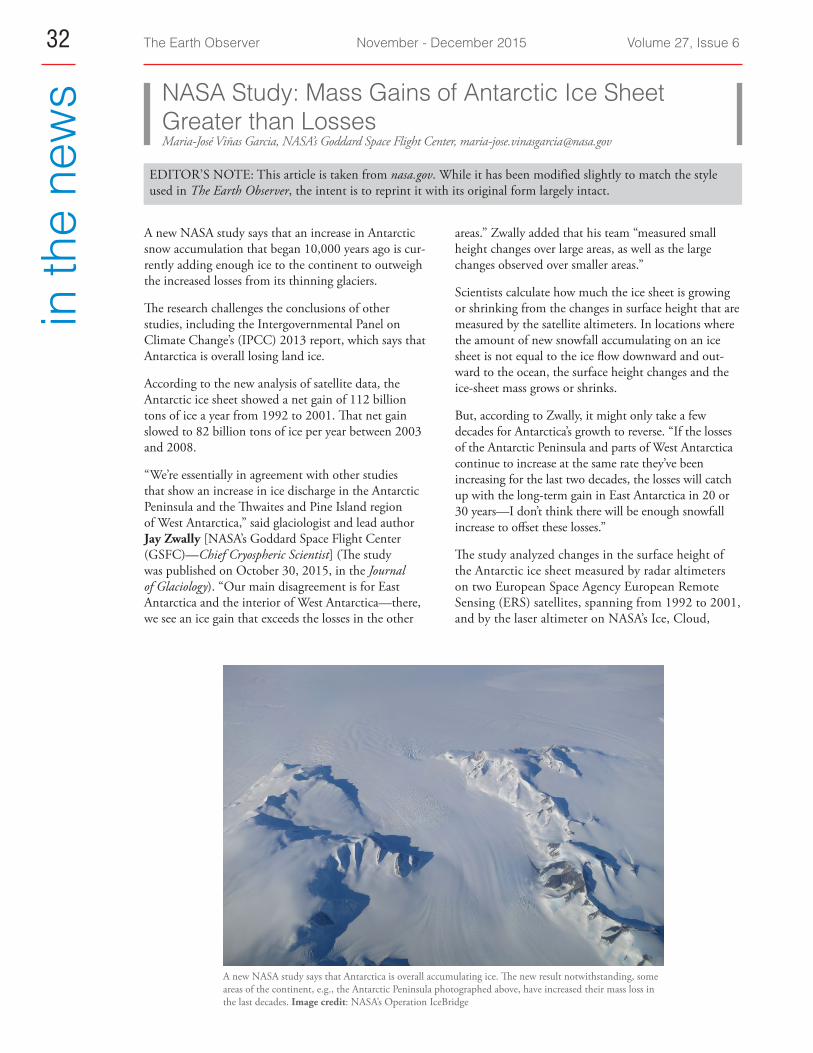
The Earth Observer November - December 2015 Volume 27, Issue 632in
the
new
s NASA Study: Mass Gains of Antarctic Ice Sheet Greater than LossesMaria-José Viñas Garcia, NASA’s Goddard Space Flight Center, [email protected]
EDITOR’S NOTE: This article is taken from nasa.gov. While it has been modified slightly to match the style used in The Earth Observer, the intent is to reprint it with its original form largely intact.
A new NASA study says that an increase in Antarctic snow accumulation that began 10,000 years ago is cur-rently adding enough ice to the continent to outweigh the increased losses from its thinning glaciers.
The research challenges the conclusions of other studies, including the Intergovernmental Panel on Climate Change’s (IPCC) 2013 report, which says that Antarctica is overall losing land ice.
According to the new analysis of satellite data, the Antarctic ice sheet showed a net gain of 112 billion tons of ice a year from 1992 to 2001. That net gain slowed to 82 billion tons of ice per year between 2003 and 2008.
“We’re essentially in agreement with other studies that show an increase in ice discharge in the Antarctic Peninsula and the Thwaites and Pine Island region of West Antarctica,” said glaciologist and lead author Jay Zwally [NASA’s Goddard Space Flight Center (GSFC)—Chief Cryospheric Scientist] (The study was published on October 30, 2015, in the Journal of Glaciology). “Our main disagreement is for East Antarctica and the interior of West Antarctica—there, we see an ice gain that exceeds the losses in the other
areas.” Zwally added that his team “measured small height changes over large areas, as well as the large changes observed over smaller areas.”
Scientists calculate how much the ice sheet is growing or shrinking from the changes in surface height that are measured by the satellite altimeters. In locations where the amount of new snowfall accumulating on an ice sheet is not equal to the ice flow downward and out-ward to the ocean, the surface height changes and the ice-sheet mass grows or shrinks.
But, according to Zwally, it might only take a few decades for Antarctica’s growth to reverse. “If the losses of the Antarctic Peninsula and parts of West Antarctica continue to increase at the same rate they’ve been increasing for the last two decades, the losses will catch up with the long-term gain in East Antarctica in 20 or 30 years—I don’t think there will be enough snowfall increase to offset these losses.”
The study analyzed changes in the surface height of the Antarctic ice sheet measured by radar altimeters on two European Space Agency European Remote Sensing (ERS) satellites, spanning from 1992 to 2001, and by the laser altimeter on NASA’s Ice, Cloud,
A new NASA study says that Antarctica is overall accumulating ice. The new result notwithstanding, some areas of the continent, e.g., the Antarctic Peninsula photographed above, have increased their mass loss in the last decades. Image credit: NASA’s Operation IceBridge

The Earth Observer November - December 2015 Volume 27, Issue 6 33
in th
e ne
ws
Figure. Map showing the rates of mass changes over Antarctica from ICESat data between 2003 and 2008. Sums are for all of Antarctica: East Antarctica (EA, 2-17); interior West Antarctica (WA2, 1, 18, 19, and 23); coastal West Antarctica (WA1, 20-21); and the Antarctic Peninsula (24-27). A gigaton (Gt) corresponds to a billion metric tons, or 1.1 billion U.S. tons. To view this image in color, visit go.nasa.gov/1Y2RsFM. Image credit: Jay Zwally/Journal of Glaciology
and land Elevation Satellite (ICESat) from 2003 to 2008—see Figure above.
Zwally said that while other scientists have assumed that the gains in elevation seen in East Antarctica are due to recent increases in snow accumulation, his team used meteorological data beginning in 1979 to show that the snowfall in East Antarctica actually decreased by 11 billion tons per year during both the ERS and ICESat periods. They also used information on snow accumulation for tens of thousands of years, derived by other scientists from ice cores, to conclude that East Antarctica has been thickening for a very long time.
“At the end of the last Ice Age, the air became warmer and carried more moisture across the continent, dou-bling the amount of snow dropped on the ice sheet,” Zwally said.
The extra snowfall that began 10,000 years ago has been slowly accumulating on the ice sheet and compacting into solid ice over millennia, thickening the ice in East Antarctica and the interior of West Antarctica by an average of 0.7 in (1.7 cm) per year. This small thicken-ing, sustained over thousands of years and spread over the vast expanse of these sectors of Antarctica, corre-sponds to a very large gain of ice—enough to outweigh the losses from fast-flowing glaciers in other parts of the continent and reduce global sea level rise.
Zwally’s team calculated that the mass gain from the thickening of East Antarctica remained steady at a rate of 200 tons per year during the period from 1992 to 2008,
while the ice losses from the coastal regions of West Antarctica and the Antarctic Peninsula increased by 65 billion tons per year.
“The good news is that Antarctica is not currently contributing to sea level rise, but is taking 0.23 mm (slightly less than 0.01 in) per year away,” Zwally said. “But this is also bad news. If the 0.27 mm (slightly more than 0.01 in) per year of sea level rise attributed to Antarctica in the IPCC report is not really coming from Antarctica, there must be some other contribution to sea level rise that is not accounted for.”
“The new study highlights the difficulties of measur-ing the small changes in ice height happening in East Antarctica,” said glaciologist Ben Smith [University of Washington], who was not involved in Zwally’s study. “Doing altimetry accurately for very large areas is extraordinarily difficult, and there are measurements of snow accumulation that need to be done indepen-dently to understand what’s happening in these places,” Smith said.
To help accurately measure changes in Antarctica, NASA is developing the successor to the ICESat mis-sion, ICESat-2, which is scheduled to launch in 2018. “ICESat-2 will measure changes in the ice sheet within the thickness of a No. 2 pencil,” said glaciologist Tom Neumann [GSFC—Deputy Project Scientist for ICESat-2]. “It will contribute to solving the problem of Antarctica’s mass balance by providing a long-term record of elevation changes.”

The Earth Observer November - December 2015 Volume 27, Issue 634in
the
new
s NASA Studying 2015 El Niño Event As Never BeforeKasha Patel, NASA’s Goddard Space Flight Center, [email protected]
EDITOR’S NOTE: This article is taken from nasa.gov. While it has been modified slightly to match the style used in The Earth Observer, the intent is to reprint it with its original form largely intact.
Every two to seven years, an unusually warm pool of water—sometimes between 2 and 3° C (3.6 to 5.4° F) higher than normal—develops across the eastern tropi-cal Pacific Ocean to create a natural short-term climate change event. This warm condition, known as El Niño, affects the local aquatic environment, but also spurs extreme weather patterns around the world, from flood-ing in California to droughts in Australia. This winter, the 2015-16 El Niño event will be better observed from space than any previous El Niño.
According to the World Meteorological Organization, this year’s El Niño is already strong and appears likely to equal the event of 1997-98—the strongest El Niño on record—see Figure below. All 19 of NASA’s current Earth-observing missions were launched after the last major El Niño in 1997. In the past two decades, NASA has made tremendous progress in gathering and analyz-ing data that help researchers understand more about the mechanics and global impacts of El Niño.
“El Niño is a fascinating phenomenon because it has such far-reaching and diverse impacts. The fact that fires in Indonesia are linked with circulation pat-terns that influence rainfall over the U.S. shows how
complex and interconnected the Earth system is,” said Lesley Ott [NASA’s Goddard Space Flight Center—Research Meteorologist].
Using NASA satellite observations in tandem with supercomputer processing power for modeling systems, scientists have a comprehensive suite of tools to analyze El Niño events and their global impacts as never before. Throughout this winter, NASA will share the latest sci-entific insights and imagery updates related to El Niño1.
For instance, scientists are learning how El Niño affects the year-to-year variability for fire seasons in the west-ern U.S., the Amazon, and Indonesia. El Niño may also affect the yearly variability of the ground-level pollutant ozone that severely affects human health. Researchers will be keenly focused on how the current El Niño will affect the drought in California.
“We still have a lot to learn about these connections, and NASA’s suite of satellites will help us understand these processes in a new and deeper way,” said Ott.
1To keep up with the latest progress, visit NASA’s El Niño watch page at sealevel.jpl.nasa.gov/science/elninopdo/latestdata.
Figure. This side-by-side comparison shows the Pacific Ocean sea surface height (SSH) anomalies measured on October 17, 1997—during the strongest El Niño on record—versus those measured on October 16, 2015. Notice how similar the two images are leading to speculation the cur-rent El Niño event will likely equal or exceed what was experienced in 1997-98. These images were made from data collected by the TOPEX/Poseidon [left] and the OSTM/Jason-2 satellites [right], respectively. Image credit: NASA/Jet Propulsion Laboratory

The Earth Observer November - December 2015 Volume 27, Issue 6 35
in th
e ne
wsMany NASA satellites observe environmental factors that
are associated with El Niño evolution and its impacts, including sea surface temperature, sea surface height, surface currents, atmospheric winds, and ocean color. The joint NASA/National Oceanic and Atmospheric Administration (NOAA)/Centre National d’Études Spatiales (CNES)/European Organisation for the Exploitation of Meteorological Satellites (EUMETSAT) Ocean Surface Topography Mission (OSTM)/Jason-2 satellite measures sea surface height (see Figure on page 34), which is especially useful in quantifying the heat stored and released by the ocean during El Niño years. The Jason-3 mission is expected to join Jason-2 in the near future.
NASA satellites also help scientists see the global impact of El Niño. The warmer than normal eastern Pacific Ocean has far-reaching effects worldwide. These events spur disasters like fires and floods. They change storm
anno
unce
men
t
tracks, cloud cover, and other weather patterns, and they have devastating effects on fisheries and other industries.
NASA’s Earth-observing satellites help monitor those and other impacts by measuring land and ocean con-ditions that both influence and are affected by El Niño. For instance, NASA’s Global Precipitation Measurement (GPM) mission provides worldwide pre-cipitation measurements every three hours. NASA’s Soil Moisture Active Passive (SMAP) mission measures soil moisture in the top layer of land. Both of these satel-lites are useful for monitoring drought, improving flood warnings, and watching crop and fishing industries.
“NASA is at the forefront in providing key observa-tions of El Niño and advancing our understanding of its role in shaping Earth’s weather and climate pat-terns,” said Duane Waliser [NASA/Jet Propulsion Laboratory (JPL)—Chief Scientist of the Earth Science and Technology Directorate].
The Earth Observatory Natural Event TrackerIncreasingly, NASA Earth-observing satellite imagery is being made available via web services [e.g., Web Mapping Service (WMS) and Web Map Tile Service (WMTS)]. Of further utility, a significant percentage of such imagery is being produced and published in near-real-time (NRT)—within a few hours after acquisition. These capabilities make it easy for several communities to use NASA imagery to examine natural events as they happen. However, currently available client applications—such as NASA’s Worldview1—are by design neces-sity, tailored and therefore restrictive.
To overcome these restrictions, an application programming interface (API)—NASA’s Earth Observatory Natural Event Tracker (EONET)—is now available. EONET provides a continuously updated, curated list of natural events and associated metadata, and provides a way to link those events to event-related, NRT image layers via thematically related, web-service-enabled image sources, as described earlier.
To learn how to use the EONET web services, visit eonet.sci.gsfc.nasa.gov/eonet-project.
1 The Worldview tool from NASA’s Earth Observing System Data and Information System (EOSDIS) provides the capa-bility to interactively browse global, full-resolution satellite imagery and then download the underlying data. To learn more see “Seeing is Believing: EOSDIS Worldview Helps Lower Barriers for NASA Earth Observing Data Discovery and Analysis” in the May–June 2015 issue of The Earth Observer [Volume 27, Issue 3, pp. 4-8].

The Earth Observer November - December 2015 Volume 27, Issue 636N
ASA
ear
th s
cien
ce in
the
new
sNASA Earth Science in the NewsSamson Reiny, NASA’s Earth Science News Team, [email protected]
*NASA Study: Net Gains for Antarctic Ice Sheets,October 31; United Press International. According to anew NASA study, Antarctic ice sheet gains outweighlosses. These findings conflict with projections by theIntergovernmental Panel on Climate Change, which in2013 suggested gains would not keep up with losses.The new study, published in the Journal of Glaciology,doesn’t totally undermine the handful of studies show-ing significant glacier, ice sheet, and sea ice shrinkage.Instead, it offers evidence of previously unaccountedfor gains—see Figure on page 33. “Our main disagree-ment is for East Antarctica and the interior of WestAntarctica—there, we see an ice gain that exceeds thelosses in the other areas,” said lead study author andglaciologist Jay Zwally [NASA’s Goddard Space FlightCenter (GSFC)]. The gains came in the form of icethickening—thickening researchers have previouslydismissed as snow accumulations. But Zwally’s studylooked at meteorological records to show that snowaccumulations have actually dropped off over the lasttwo decades. He and his colleagues also looked at his-torical meteorological data gleaned from ice cores, andfound that snowfall from 10,000 years ago has beenslowly compacted and turned into ice over the last sev-eral millennia.
Magnitude 5.0 Earthquake 99 Percent Likely To Strike Los Angeles Within Next Three Years: NASA Researchers, October 21; Tech Times. A team of researchers from NASA/Jet Propulsion Laboratory (JPL) reports there is a 99.9% chance that an earthquake with at least a 5.0 magnitude will hit Los Angeles (LA) within the next two and a half years. For their study, published in Earth and Space Science on September 30, geophysicist Andrea Donnellan [JPL] and colleagues used radar and GPS to measure the surface deformation in Earth’s crust produced by the March 28, 2014, magnitude 5.1 earth-quake in La Habra, CA. Donnellan explained that, when the La Habra tremor struck, it relieved some of the stress in the fault system and moved some of the upper sedi-ments in the LA basin. However, she pointed out that those strains have enough power to set off an even-larger earthquake in the same epicenter, estimating the energy stored is still enough to produce about a 6.1 to 6.3-mag-nitude earthquake. The researchers looked at the earth-quakes that struck the region over the past eight decades
and found 32 cases with a magnitude of at least 5.0. From this, they were able to estimate the likelihood of a sizable earthquake hitting Southern California.
*Near-Record El Niño Will Shake Up WinterWeather, October 15; Discover News. A new set of mapspublished by NASA’s Earth Observatory shows that theocean is getting close to replicating the 1997-98 El Niñothat’s referred to as “the climate event of the [twentieth]century.” The maps compare sea level heights of thatfamous El Niño to the one currently ramping up in thetropical Pacific. Ocean temperatures are the most com-mon metric to define the intensity of an El Niño, butocean heights also provide a valuable measure. BothEl Niños show sea level anomalies of up to 8 in (~20cm) across the eastern tropical Pacific with correspond-ing drops in other parts of the ocean basin. An El Niñoevent generally favors rainy weather over the southerntier of the U.S. and warm weather from Alaska throughthe Northern Rockies. The “super El Niño” in 1997-98also helped unleash mudslides in California—a majorconcern this year since increased rainfall could lead tomudslides under current drought conditions in the state.It’s worth stressing that no two El Niños are alike how-ever; an El Niño doesn’t guarantee specific impacts, butrather tips the odds in their favor.
Decline in Microscopic Plant Life Could Affect the Atmosphere, September 25; Science World News. A recent study by NASA published in Global Biogeochemical Cycles has found a significant decline in several forms of microscopic plant life. This was the first study to look at global, long-term, phytoplankton community trends—from their currents to the amount of sunlight and nutrients available in different ocean basins—using NASA’s Ocean Biogeochemical Model, which recreates the conditions in the ocean. From 1998 to 2012, there has been a 1% per year global decrease in the largest of the phytoplankton algae, known as diatoms. Significant losses have occurred in the North Pacific, North Indian, and Equatorial Indian oceans. This reduction could reduce the amount of carbon dioxide (CO2) that’s pulled from the atmosphere and pulled into the ocean’s depths for long-term storage, said lead author and oceanographer Cecile Rousseaux [GSFC]. A phytoplankton bloom can span hundreds

The Earth Observer November - December 2015 Volume 27, Issue 6 37
NA
SA e
arth
sci
ence
in th
e ne
wsof miles, and can be seen from space. Such blooms take
CO2 that has dissolved in cold ocean water and convert it into organic carbon that forms the base of the marine food web. Rousseaux said that while the diatom decline is not yet considered severe, it should be monitored into the future. Ocean conditions change, whether due to natural variation or climate change, and that may cause future declines around the globe.
*See news story in this issue.
Interested in getting your research out to the general pub-lic, educators, and the scientific community? Please contact Samson Reiny on NASA’s Earth Science News Team at [email protected] and let him know of upcom-ing journal articles, new satellite images, or conference pre-sentations that you think would be of interest to the reader-ship of The Earth Observer.
Initiation of the 2017-2027 Earth Science Decadal Survey The next Earth Science Decadal Survey for Earth Science and Applications from Space (ESAS2017), cov-ering the period 2017-2027, is now underway; it is again sponsored by NASA, the National Oceanic and Atmospheric Administration, and the U.S. Geological Survey. ESAS2017 will be conducted by the National Academy of Science’s Space Studies Board in collaboration with other boards of the Academies, including the Boards on Atmospheric Sciences and Climate, Polar Research, Ocean Studies, Earth Sciences and Resources, and Water Science and Technology. In August 2015, the Academies appointed Antonio Busalacchi, Jr. [University of Maryland] and Waleed Abdalati [University of Colorado] as the co-chairs of what is expected to be an approximately 18-person steering committee that will oversee the Survey’s execution.
A website for the Survey (www.nas.edu/esas2017) has been created to provide a link for communications from the research community. Linked to the website are two online submission forms: The first—a Call for Nominations—allows a community member to volunteer or suggest a colleague for service on the various Survey committees that will be formed later this fall. The second—a Request for Community Whitepapers—seeks input on the top-level challenges and opportunities that should guide the work of the Survey. The “pre-ferred” response date was November 2, 2015; however, the links to the submission forms will stay active through December.
Town Hall Sessions to support the Survey will be held in conjunction with the Fall Meeting of the American Geophysical Union in December 2015 in San Francisco, CA, the 96th American Meteorological Society Annual Meeting in January 2016 in New Orleans, LA, and the 2016 Ocean Sciences meeting in February 2016, also in New Orleans. Additional outreach activities are being planned and will be announced on the Survey website. Community members will also soon have the opportunity to sign-up for a newsletter that will be published periodically and will report on activities and progress in the Survey. an
noun
cem
ent

NASA Science Mission Directorate – Science Education and Public Outreach UpdateTheresa Schwerin, Institute for Global Environmental Strategies, [email protected] Clark, Institute for Global Environmental Strategies, [email protected]
NASA Wavelength Blog Post: Ever Wondered?
Students and the public can engage in the very kind of thinking that is required to truly understand science concepts by focusing on important scientific questions. A recent NASA Wavelength blog post invites learners of all ages to wonder about the world and start asking useful questions. For more information, visit nasawave-length.org/blog/ever-wondered.
Climate Bits: Fast Carbon, Slow Carbon
Designed for implementation on the National Oceanic and Atmospheric (NOAA) Science On a Sphere projection system, this video—narrated by NASA scien tist Paul Griffith—explains fast and slow carbon cycling on Earth. Visit nasawavelength.org/resource/nw-000-000-004-188.
UV Kid!
In this activity, children (elementary-middle school ages) use common craft materials and ultraviolet (UV)-sensitive beads to construct a “UV Kid” (or other life form). Participants will use sunscreen, foil, paper, and more to test materials that might protect their UV Kid from being exposed to too much UV radiation. Visit nasawavelength.org/resource/nw-000-000-004-195.
New on the Climate Kids Website: 10 Things You Didn’t Know About Energy
You should always turn off the light when you leave a room to save energy. Or should you? It turns out that if you have compact fluorescent light bulbs, you may be better off leaving them on—under certain conditions: Turning them on and off too many times can actually shorten their lifespans. Learn about this and other inter-esting energy facts at climatekids.nasa.gov/10-things-energy.
New on the SciJinks Websites: Storm Surge?
When we think of powerful hurricanes, we picture the strong winds. But often, the biggest danger in a hur-ricane is not damage from the wind, but from storm surge—the rise of coastal water that can accompany a big tropical storm, causing dangerous flooding. Learn more about it today at scijinks.gov/storm-surge.
What’s Up in the Atmosphere?
There is a new elementary-school-level GLOBE book on aerosols called What’s Up in the Atmosphere? Exploring Colors in the Sky. To download the storybook, which includes four learning activities, visit nasawave-length.org/resource/nw-000-000-004-181.
NASA Seeks Student Experiments for Edge-of-Space Balloon Flight
NASA is accepting applications from graduate and undergraduate students to fly their science and tech-nology experiments to the edge of space on a scientific balloon mission. A fall 2016 launch is planned for the next High Altitude Student Platform (HASP) mission, a joint project between NASA and the Louisiana Space Consortium (LaSPACE) in Baton Rouge, LA. HASP can support up to 12 student-built payloads. It houses the instruments and provides power, mechanical sup-port, interfacing, data downlink, and command uplink communications for the payload. Launched from NASA’s balloon-launch facility in Fort Sumner, NM, flights typically last 12 to 15 hours, reaching an altitude of approximately 23 mi (~37 km).
A panel of experts from NASA’s Wallops Flight Facility in Virginia, Columbia Scientific Balloon Facility in Palestine, TX, and LaSPACE, will review the applications and select the finalists for the 2016 flight opportunity. The deadline for applications is December 18, 2015. Interested school teams should contact Greg Guzik at [email protected] for more information.
NASA eClips: Real World
NASA eClips™ are short, Earth-science-relevant, edu-cational video segments designed to inspire and engage students, and to help them see connections between real-world phenomena. The Real World series of NASA eClips™ connects classroom mathematics to twenty-first century careers and innovations and are designed for middle-school students to help them to develop an appreciation for mathematics through real-world prob-lem solving. New NASA eClips™ available in the NASA Wavelength catalogue include:
• Ozone Alerts: nasawavelength.org/resource/nw-000-000-004-185.
• ICESat-2 and Earth’s Cryosphere: nasawavelength.org/resource/nw-000-000-004-186.
• Soil Moisture: nasawavelength.org/resource/nw-000-000-004-187.
• Global Cloud Observation Day: nasawavelength.org/resource/nw-000-000-004-182.
• Lightning Protection System for Launch Complex 39:nasawavelength.org/resource/nw-000-000-004-183.
• History of Winter—Abiotic Conditions: nasawave-length.org/resource/nw-000-000-004-184.
The Earth Observer November - December 2015 Volume 27, Issue 638ed
ucat
ion
and
publ
ic o
utre
ach
upda
te

The Earth Observer November - December 2015 Volume 27, Issue 6 39
scie
nce
cale
ndar
sEOS Science CalendarJanuary 6–8, 2016 ESIP Federation Winter Meeting, Washington, DC. commons.esipfed.org/2016WinterMeeting
January 12–14, 2016 Landsat Science Team Meeting, Blacksburg, VA. landsat.usgs.gov
January 12–18, 2016 Land Cover Land Use Change Science Team Meeting, Yangon, Burma. lcluc.umd.edu/meetings.php?mid=69
April 26–28, 2016 CERES Science Team Meeting, Hampton, VA. ceres.larc.nasa.gov
Global Change CalendarDecember 14–18, 2015 American Geophysical Union Fall Meeting, San Francisco, CA. fallmeeting.agu.org/2015
January 10–14, 2016 American Meteorological Society Annual Meeting, New Orleans, LA. annual.ametsoc.org/2016
January 19–21, 2016 NCSE National Meeting, Washington, DC. www.ncseonline.org/national-conference
February 11–15, 2016 AAAS Annual Meeting, Washington, DC. meetings.aaas.org
February 21–26, 2016 2016 Ocean Sciences Meeting, New Orleans, LA. osm.agu.org/2016
April 17–22, 2016 European Geosciences Union General Assembly, Vienna, Austria. www.egu2016.eu
May 6–7, 2016 Second EARSeL SIG LU/LC and NASA LCLUC Joint Workshop, Prague, Czech Republic. lcluc.umd.edu/Documents/Announcements/Leaflet_work-shop.pdf
May 22–26, 2016 Japan Geoscience Union Meeting, Makuhari Messe, Japan. www.jpgu.org/meeting_e2016/greeting.html
Undefined Acronyms Used in the Editorial and Article Titles
AGU American Geophysical Union GPM Global Precipitation MeasurementAMS American Meteorological Society ISS International Space StationCALIPSO Cloud–Aerosol Lidar and Infrared NOAA National Oceanic and
Pathfinder Satellite Observations Atmospheric AdministrationCATS Cloud–Aerosol Transport System OMI Ozone Monitoring InstrumentCERES Clouds and the Earth’s Radiant OSTM Ocean Surface Topography Mission
Energy System SAGE Stratospheric Aerosol and Gas ExperimentCNES Centre National d’Études Spatiale SEARRIN Southeast Asia Regional Research and
[French Space Agency] Information Network DSCOVR Deep Space Climate Observatory SMAP Soil Moisture Active/PassiveENSO El Niño and Southern Oscillation USGS U.S. Geological Survey EOS Earth Observing System TOPEX Ocean Surface Topography ExperimentGOFC–GOLD Global Observation of Forest and TRMM Tropical Rainfall Measuring Mission
Land Cover Dynamics

Code 610 National Aeronautics and Space Administration
Goddard Space Flight Center Greenbelt, MD 20771
PRSRT STD Postage and Fees Paid National Aeronautics and Space Administration Permit 396
Official Business Penalty for Private Use: $300
(affix mailing label here)
eos.nasa.govThe Earth Observer
The Earth Observer is published by the EOS Project Science Office, Code 610, NASA’s Goddard Space Flight Center, Greenbelt, Maryland 20771, telephone (301) 614-5561, FAX (301) 614-6530, and is available in color at eospso.nasa.gov/earth-observer-archive. Black and white hard copies can be obtained by writing to the above address.
Articles, contributions to the meeting calendar, and suggestions are welcomed. Contributions to the calendars should contain loca-tion, person to contact, telephone number, and e-mail address. Newsletter content is due on the weekday closest to the 15th of the month preceding the publication—e.g., December 15 for the January–February issue; February 15 for March–April, and so on.
To subscribe to The Earth Observer, or to change your mailing address, please call Cindy Trapp at (301) 614-5559, or send a message to [email protected], or write to the address above. If you would like to stop receiving a hard copy and be noti-fied via email when future issues of The Earth Observer are available for download as a PDF, please send an email with the sub-ject “Go Green” to [email protected]. Your name and email address will then be added to an electronic distribution list and you will receive a bi-monthly email indicating that the next issue is available for download. If you change your mind, the email notification will provide an option for returning to the printed version.
The Earth Observer Staff
Executive Editor: Alan B. Ward ([email protected])
Assistant/Technical Editors: Heather H. Hanson ([email protected]) Mitchell K. Hobish ([email protected])
Technical Editor: Ernest Hilsenrath ([email protected])
Design, Production: Deborah McLean ([email protected])Scan code to access The Earth Observer archive online
Printed on Recycled Paper NP-2015-1-239-GSFC