notetaking strategies and their relationship to ... · notetaking strategies and their relationship...
TRANSCRIPT

ISSN 1556-9012

Notetaking Strategies and Their Relationship to Performance on Listening Comprehension
and Communicative Assessment Tasks
Patricia L. Carrell
Southern Illinois University, Carbondale
RR-07-01
ETS is an Equal Opportunity/Affirmative Action Employer.
As part of its educational and social mission and in fulfilling the organization's non-profit Charter and Bylaws, ETS has and continues to learn from and also to lead research that furthers educational and measurement research to advance quality and equity in education and assessment for all users of the organization's products and services.
Copyright © 2007 by ETS. All rights reserved.
No part of this report may be reproduced or transmitted in any form or by any means, electronic or mechanical, including photocopy, recording, or any information storage and retrieval system, without permission in writing from the publisher. Violators will be prosecuted in accordance with both U.S. and international copyright laws.
ETS, the ETS logos, TOEFL, the TOEFL logo, and TSE are registered trademarks of Educational Testing Service (ETS). THE TEST OF ENGLISH AS A FOREIGN LANGUAGE and the TEST OF SPOKEN ENGLISH are trademarks of ETS.
To obtain more information about the TOEFL programs and services, use one of the following:
E-mail: [email protected] Web site: www.ets.org/toefl
Foreword
The TOEFL® Monograph Series features commissioned papers and reports for TOEFL 2000 and other Test of English as a Foreign Language™ (TOEFL) test development efforts. As part of the foundation for the development of the TOEFL Internet-based test (TOEFL iBT), papers and research reports were commissioned from experts within the fields of measurement, language teaching, and testing through the TOEFL 2000 project. The resulting critical reviews, expert opinions, and research results have helped to inform TOEFL program development efforts with respect to test construct, test user needs, and test delivery. Opinions expressed in these papers are those of the authors and do not necessarily reflect the views or intentions of the TOEFL program.
These monographs are also of general scholarly interest, and the TOEFL program is pleased to make them available to colleagues in the fields of language teaching and testing and international student admissions in higher education.
The TOEFL 2000 project was a broad effort under which language testing at ETS® would evolve into the 21st century. As a first step, the TOEFL program revised the Test of Spoken English™ (TSE®) and introduced a computer-based version of the TOEFL test. The revised TSE test, introduced in July 1995, is based on an underlying construct of communicative language ability and represents a process approach to test validation. The computer-based TOEFL test, introduced in 1998, took advantage of new forms of assessment and improved services made possible by computer-based testing, while also moving the program toward its longer-range goals, which included:
• the development of a conceptual framework that takes into account models of communicative competence
• a research program that informs and supports this emerging framework • a better understanding of the kinds of information test users need and want from the
TOEFL test • a better understanding of the technological capabilities for delivery of TOEFL tests
into the next century
Monographs 16 through 20 were the working papers that laid out the TOEFL 2000 conceptual frameworks with their accompanying research agendas. The initial framework document, Monograph 16, described the process by which the project was to move from identifying the test domain to building an empirically based interpretation of test scores. The subsequent framework documents, Monographs 17-20, extended the conceptual frameworks to the domains of reading, writing, listening, and speaking (both as independent and interdependent domains). These conceptual frameworks guided the research and prototyping studies described in subsequent monographs that resulted in the final test model. The culmination of the TOEFL 2000 project is the TOEFL iBT, which was introduced in September 2005.
TOEFL Program ETS
iii

Abstract
Utilizing a pre- and posttest research design, with an instructional intervention of good practices
in notetaking, the notes taken by examinees during a computer-based listening comprehension
test prior to and following the instructional intervention were examined for particular notetaking
strategies. Questionnaires probed perceptions of the frequency of use and helpfulness of the
notetaking strategies. Also investigated were relationships between the strategies and
performance on a multiple-choice listening comprehension measure and integrated
listening/writing and listening/speaking tasks and whether the brief instructional intervention
affected examinees’ notes and performance on the three tasks.
Results showed that examinees made little use of efficiency and marked organizational
notetaking strategies. While the intervention had no effect on examinees’ notetaking strategies or
on their task performance, students’ posttest notetaking strategies and task performance were
significantly related to their pretest notetaking strategies and task performance. Moreover,
notetaking and test performance were moderately related: Two notetaking strategies that most
consistently related to performance on all three tasks were the number of content words in the
notes and the number of test answers recorded in the notes. Efficiency strategies represented a
cognitively complex category worthy of further investigation.
Key words: Testing, listening comprehension, notetaking, content analysis of notes, integrated
tasks
v
Acknowledgments
No study as extensive as this one could be accomplished without the assistance of a number of
people. This is especially true for a researcher who is retired from full-time university
employment and who, therefore, no longer enjoys institutional support. This project could not
have been accomplished without the following individuals. Sara Cushing Weigle, associate
professor of applied linguistics/ESL and director of TESL test research and development at
Georgia State University (GSU), served as overall consultant, providing invaluable advice on all
aspects of the research design, instruments (especially the good practices in notetaking
guidelines), and interpretation of the results. In addition, she trained the writing and speaking
raters and served as the third rater on both the writing and speaking tasks. Matt McCrudden,
assistant professor at the University of North Florida, served as statistician and also provided
helpful input with design of the questionnaires. Donna Murray and Chizu Jaret, doctoral students
at the University of Nevada—Las Vegas (UNLV), provided many hours of helpful discussions
about the content analysis of the notes and served as the two content analysts of the notes.
I also wish to thank the consultants at the cooperating universities who were responsible
for overseeing installation of the computer-based test on their respective campus, recruitment of
participants, and administration of the study materials to participants: Alfred D. Stover
(University of Arizona), John Haught (UNLV), and Heather Boldt and Jennifer Murphy (GSU). I
wish to single out for particular thanks Beverly Ruiz (University of Indiana), who single-
handedly tested more participants than anyone else at great personal expenditure of her time. She
has my undying thanks for her efforts, which went above and beyond the call of duty. Thanks
also go to those at GSU who rated the written and spoken responses: Jennifer Murphy (writing),
Margareta Larsson (writing and speaking), and Frank Smith (speaking). At ETS, I wish to thank
Mary Enright, Susan Nissan, Tom Florek, Daniel Eignor, and Jan Rotolo.
Finally, I wish to acknowledge the support of and thank my husband, J. Craig Carrell,
who provided financial accounting support to the project, computer support, assistance in
formatting the final report, and, most importantly, helped keep me sane throughout the 3-year-
plus tenure of the project.
vi
Table of Contents
Page
Introduction..................................................................................................................................... 1
Literature Review............................................................................................................................ 1
Research Questions......................................................................................................................... 6
Methodology and Design................................................................................................................ 6
Participants .............................................................................................................................. 6
Materials Used in the Study..................................................................................................... 8
Procedures.............................................................................................................................. 10
Content Analysis of Notes ..................................................................................................... 11
Scoring of Other Instruments................................................................................................. 15
Statistical Analyses................................................................................................................ 17
Results........................................................................................................................................... 17
Research Question 1—The Prevalence of the Notetaking Strategies.................................... 17
Research Question 2——Effects of Intervention on Notetaking Strategies ......................... 19
Research Question 3a—Perceptions of Notetaking Strategies .............................................. 25
Research Question 3b—Effects of the Intervention on Perceptions of
Notetaking Strategies........................................................................................................ 27
Research Question 4—Relationships Between Notetaking and Performance on
LanguEdge Listening Comprehension Tasks .................................................................. 33
Research Question 5—Effects of the Intervention on LanguEdge Assessment Tasks ......... 39
Summary and Interpretation of Findings ...................................................................................... 41
Discussion—Implications for the Field ........................................................................................ 43
Discussion—Implications for TOEFL.......................................................................................... 45
References..................................................................................................................................... 47
Notes ............................................................................................................................................. 51
Appendixes
A - Session 1 Questionnaire on Notetaking Strategies ........................................................... 52
B - Instructional Intervention—Good Practices in Notetaking............................................... 55
vii

List of Tables
Page
Table 1 Relevant Participant Characteristics ............................................................................... 7
Table 2 Results of Interrater Reliabilities Tests......................................................................... 14
Table 3 Useful Benchmarks for the Sufficiency of Interrater Agreement With Cohen’s
Kappa Coefficient...................................................................................................... 14
Table 4 Ratings of Integrated Speaking and Written Responses............................................... 16
Table 5 The 22 Questionnaires Items and Their Composite Categories ................................... 16
Table 6 Descriptive Statistics for Notetaking Strategies, by Session and by Group ................. 18
Table 7 Overlap Among Notetaking Strategies as Evidenced by Intercorrelations, by Session
and by Group................................................................................................................ 20
Table 8 Repeated Measures ANOVA of the Effects of Group (Intervention Versus No
Intervention) and Session (Pretest Versus Posttest Session) on the Notetaking
Strategy: Total Notations ............................................................................................. 21
Table 9 Repeated Measures ANOVA of the Effects of Group (Intervention Versus No
Intervention) and Session (Pretest Versus Posttest Session) on the Notetaking
Strategy: Content Words .............................................................................................. 22
Table 10 Repeated Measures ANOVA of the Effects of Group (Intervention Versus No
Intervention) and Session (Pretest Versus Posttest Session) on the Notetaking
Strategy: Abbreviations................................................................................................ 22
Table 11 Repeated Measures ANOVA of the Effects of Group (Intervention Versus No
Intervention) and Session (Pretest Versus Posttest Session) on the Notetaking
Strategy: Test Answers ................................................................................................ 23
Table 12 Repeated Measures ANOVA of the Effects of Group (Intervention Versus No
Intervention) and Session (Pretest Versus Posttest Session) on the Notetaking
Strategy: Diagrams....................................................................................................... 23
Table 13 Repeated Measures ANOVA of the Effects of Group (Intervention Versus No
Intervention) and Session (Pretest Versus Posttest Session) on the Notetaking
Strategy: Arrows .......................................................................................................... 24
viii

Table 14 Repeated Measures ANOVA of the Effects of Group (Intervention Versus No
Intervention) and Session (Pretest Versus Posttest Session) on the Notetaking
Strategy: Lists .............................................................................................................. 24
Table 15 Repeated Measures ANOVA of the Effects of Group (Intervention Versus No
Intervention) and Session (Pretest Versus Posttest Session) on the Notetaking
Strategy: Circles ........................................................................................................... 25
Table 16 Perceptions of Frequency and Helpfulness of Notetaking Strategies: Descriptive
Statistics, by Session and by Group ............................................................................. 26
Table 17 Overlap Among Questionnaire Frequency Subscales as Evidenced by
Intercorrelations, by Session and by Group ................................................................. 28
Table 18 Overlap Among Questionnaire Helpfulness Subscales as Evidenced by
Intercorrelations, by Session and by Group ................................................................. 29
Table 19 Reliability of the Questionnaire Data as Measured by Coefficient Alpha, by Session
and by Group................................................................................................................ 30
Table 20 Repeated Measures ANOVA of the Effects of Group (Intervention Versus No
Intervention) and Session (Pretest Versus Posttest Session) on the Perceptions of
Frequency of General Notetaking Strategies ............................................................... 31
Table 21 Repeated Measures ANOVA of the Effects of Group (Intervention Versus No
Intervention) and Session (Pretest Versus Posttest Session) on the Perceptions of
Frequency of Content Notetaking Strategies ............................................................... 31
Table 22 Repeated Measures ANOVA of the Effects of Group (Intervention Versus No
Intervention) and Session (Pretest Versus Posttest Session) on the Perceptions of
Frequency of Efficiency Notetaking Strategies ........................................................... 32
Table 23 Repeated Measures ANOVA of the Effects of Group (Intervention Versus No
Intervention) and Session (Pretest Versus Posttest Session) on the Perceptions of
Frequency of Organization Notetaking Strategies ....................................................... 32
Table 24 Repeated Measures ANOVA of the Effects of Group (Intervention Versus No
Intervention) and Session (Pretest Versus Posttest Session) on the Perceptions of
Frequency of Review Notetaking Strategies................................................................ 33
ix
Table 25 Repeated Measures ANOVA of the Effects of Group (Intervention Versus No
Intervention) and Session (Pretest Versus Posttest Session) on the Perceptions of
Helpfulness of General Notetaking Strategies ............................................................. 34
Table 26 Repeated Measures ANOVA of the Effects of Group (Intervention Versus No
Intervention) and Session (Pretest Versus Posttest Session) on the Perceptions of
Helpfulness of Content Notetaking Strategies ............................................................. 34
Table 27 Repeated Measures ANOVA of the Effects of Group (Intervention Versus No
Intervention) and Session (Pretest Versus Posttest Session) on the Perceptions of
Helpfulness of Efficiency Notetaking Strategies ......................................................... 35
Table 28 Repeated Measures ANOVA of the Effects of Group (Intervention Versus No
Intervention) and Session (Pretest versus Posttest Session) on the Perceptions of
Helpfulness of Organization Notetaking Strategies..................................................... 35
Table 29 Repeated Measures ANOVA of the Effects of Group (Intervention Versus No
Intervention) and Session (Pretest Versus Posttest Session) on the Perceptions of
Helpfulness of Review Notetaking Strategies.............................................................. 36
Table 30 Overlap Among the LanguEdge Assessment Measures as Evidenced by
Intercorrelations, by Session and by Group ................................................................. 37
Table 31 Pearson Product-Moment Correlations Between the Multiple-Choice Listening
Comprehension Task and the Notetaking Strategies, by Session and by Group ......... 38
Table 32 Pearson Product-Moment Correlations Between the Integrated Listening/Writing Task
and the Notetaking Strategies, by Session and by Group ............................................ 38
Table 33 Pearson Product-Moment Correlations Between the Integrated Listening/Speaking
Task and the Notetaking Strategies, by Session and by Group ................................... 39
Table 34 Estimated Marginal Means and Standard Errors of Posttest Assessment Tasks, by
Group ........................................................................................................................... 40
Table 35 Effects of Intervention on Performance on LanguEdge Posttest Multiple-Choice
Listening Comprehension Task—One-Way ANCOVA With Pretest Multiple-Choice
Task as Covariate ......................................................................................................... 40
Table 36 Effects of Intervention on Performance on LanguEdge Posttest Integrated
Listening/Speaking Comprehension Task—One-Way ANCOVA With Pretest
Integrated Listening/Speaking Task as Covariate........................................................ 40
x
Table 37 Effects of Intervention on Performance on LanguEdge Posttest Integrated
Listening/Writing Comprehension Task—One-Way ANCOVA With Pretest
Integrated Listening/Writing Task as Covariate .......................................................... 41
xi
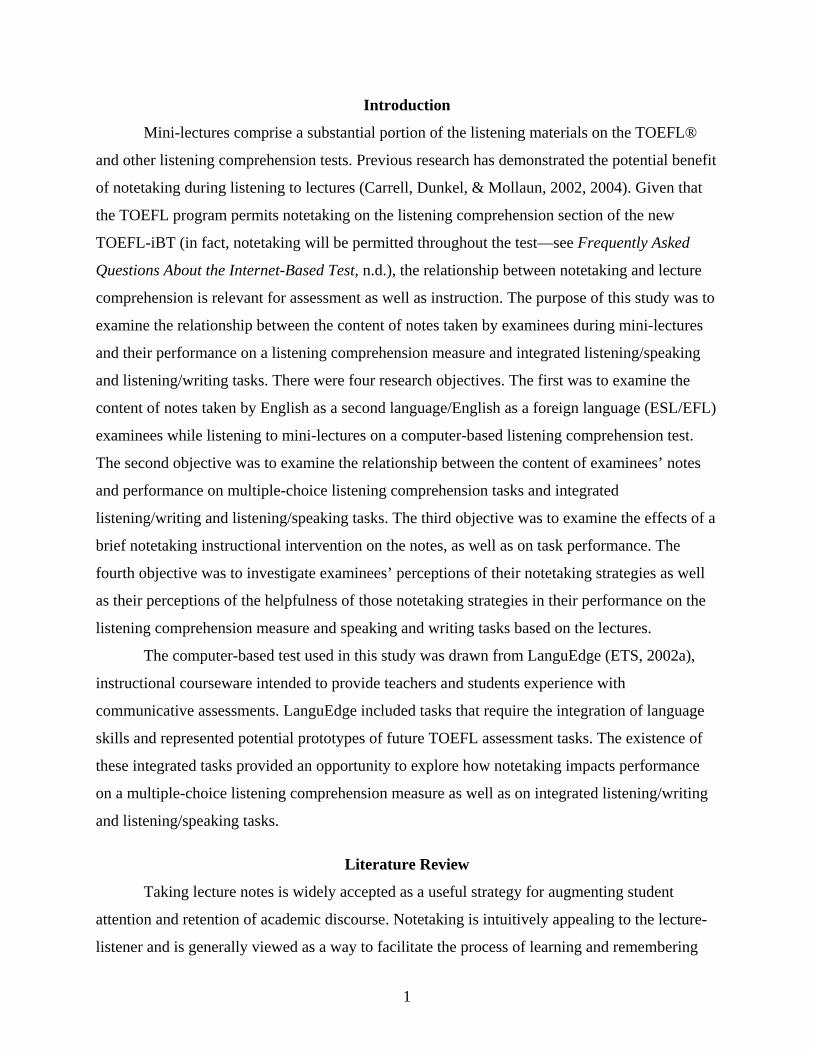
Introduction
Mini-lectures comprise a substantial portion of the listening materials on the TOEFL®
and other listening comprehension tests. Previous research has demonstrated the potential benefit
of notetaking during listening to lectures (Carrell, Dunkel, & Mollaun, 2002, 2004). Given that
the TOEFL program permits notetaking on the listening comprehension section of the new
TOEFL-iBT (in fact, notetaking will be permitted throughout the test—see Frequently Asked
Questions About the Internet-Based Test, n.d.), the relationship between notetaking and lecture
comprehension is relevant for assessment as well as instruction. The purpose of this study was to
examine the relationship between the content of notes taken by examinees during mini-lectures
and their performance on a listening comprehension measure and integrated listening/speaking
and listening/writing tasks. There were four research objectives. The first was to examine the
content of notes taken by English as a second language/English as a foreign language (ESL/EFL)
examinees while listening to mini-lectures on a computer-based listening comprehension test.
The second objective was to examine the relationship between the content of examinees’ notes
and performance on multiple-choice listening comprehension tasks and integrated
listening/writing and listening/speaking tasks. The third objective was to examine the effects of a
brief notetaking instructional intervention on the notes, as well as on task performance. The
fourth objective was to investigate examinees’ perceptions of their notetaking strategies as well
as their perceptions of the helpfulness of those notetaking strategies in their performance on the
listening comprehension measure and speaking and writing tasks based on the lectures.
The computer-based test used in this study was drawn from LanguEdge (ETS, 2002a),
instructional courseware intended to provide teachers and students experience with
communicative assessments. LanguEdge included tasks that require the integration of language
skills and represented potential prototypes of future TOEFL assessment tasks. The existence of
these integrated tasks provided an opportunity to explore how notetaking impacts performance
on a multiple-choice listening comprehension measure as well as on integrated listening/writing
and listening/speaking tasks.
Literature Review
Taking lecture notes is widely accepted as a useful strategy for augmenting student
attention and retention of academic discourse. Notetaking is intuitively appealing to the lecture-
listener and is generally viewed as a way to facilitate the process of learning and remembering
1

lecture material. According to Kiewra (1989), notetaking is beneficial for at least two reasons.
First, notetaking aids lecture learning by activating attentional mechanisms and engaging the
learner’s cognitive processes of coding, integrating, synthesizing, and transforming aurally
received input into a personally meaningful form. Second, notetaking is seen as beneficial
because the notes taken serve as an external repository of information that permits later revision
and review to stimulate recall of the information heard.
A number of researchers, focusing principally on native English-speaking (L1) students,
have investigated the issue of lectures and student learning (Armel & Shrock, 1996; Barnett,
DiVesta, & Rogozinski, 1981; Cohn, Cohn, & Bradley, 1995; Fisher & Harris, 1973; Kiewra,
1983, 1987, 1989; Kiewra, Benton, Kim, Risch, & Christensen, 1995; Kiewra, DuBois,
Christensen, Kim, & Lindberg, 1989; Kiewra, Mayer, Christensen, Kim, & Risch, 1991).
Researchers studying nonnative-English speakers (L2) have also examined whether or not taking
notes facilitates lecture learning and what kind of notes listeners take when listening to mini-
lectures (Bilbow, 1989; Carrell, Dunkel, & Mollaun, 2002, 2004; Chaudron, Cook, & Loschky,
1988; Chaudron, Loschky, & Cook, 1994; Clerehan, 1995; Cushing, 1991, 1993; Dunkel, 1985,
1988a, 1988b; Dunkel & Davy, 1989; Hale & Courtney, 1994; Liu, 2001; Faraco, Barbier, &
Piolat, 2002). A few researchers have looked at cultural aspects of lecture listening from an
ethnographic perspective, noting that notetaking is only one of many strategies used for lecture
comprehension and may not be an important strategy in many contexts (e.g, Benson, 1994;
Flowerdew & Miller, 1992, 1995).
In one of the first investigations of the relationship between L2 learners’notetaking and
listening comprehension, Chaudron, Cook, and Loschky (1988) investigated the effect on
comprehension tests of the availability of notes taken during lecture listening. Chaudron et al.
found that retaining or not retaining notes taken while listening to short (six- or seven-minute)
lectures did not affect performance on multiple-choice or cloze listening comprehension
measures. They further investigated a number of quantitative and qualitative measures of the
notes and their relationships to successful short-term recall. Utilizing multiple choice and cloze
comprehension tests, Chaudron et al. concluded that “certain [notetaking] measures are more
related to successful comprehension performance than others, on a lecture-specific basis” (p. 15).
For example, three measures (symbols, abbreviations, and total words) were significantly
2
correlated with multiple-choice test scores on one lecture, but not with multiple-choice test
scores on two other lectures.
In another early investigation, Dunkel (1988a) examined the relationship between the
content of L2 students’ lecture notes and test performance. Dunkel scored the notes taken by L1
and L2 listeners during a 23-minute mini-lecture for five quality indices. Dunkel’s results
suggested that, when considered together as one group, L1 and L2 notetakers who scored high on
the postlistening test had incorporated a large amount of information in their notes and had
detected and noted information that subsequently appeared on the post lecture quiz. Interestingly,
for both L1 and L2 test takers, the index total number of words was inversely related to the
dependent variable, suggesting that test achievement was not directly related to the quantity of
the notes taken “but rather to (a) terseness of notations (embodied in the information units) and
(b) inclusion of potential test information (embodied in the test-answerability index)...” (pp. 269-
270). For the L2 learners considered as a separate group, with respect to questions about general
concepts from the lecture (not details), only total number of words and information units were
statistically significantly related to test performance, the former negatively and the latter
positively. With respect to questions about details from the lecture, only the number of
information units and completeness were statistically significantly related to test performance,
the former positively and the latter negatively. These results demonstrated that the quality of
notes taken by L2 learners affects performance on tests that assess different types of learning.
Notetaking is apparently also related to individual differences among L2 learners.
Cushing (1993) examined the relationship between academic status (noncredit, undergraduate, or
graduate student), language proficiency, and notetaking. Similar to Dunkel’s (1988a) findings,
good notes were those that contained the most information in the fewest number of words. These
results suggested that individual differences, such as listening comprehension proficiency (high
versus low) and academic status affect the content and quality of notes taken and the retention of
information heard.
In another study of the content of notes, Cushing (1991) employed a qualitative analysis
of sets of the notes taken by the high and low proficiency L2 listeners when students were
provided an outline of the lecture to guide their notetaking. Her results indicated the following:
(a) high proficiency students tended to take more complete notes than low proficiency students;
(b) high proficiency students made somewhat better use of the notetaking guide than did low
3
proficiency students; (c) overall, there was not a great deal of incorrect information in the notes,
although 40% of the low proficiency students had written wrong or incomplete information in
blanks in the notetaking guide; (d) lower proficiency students did not distinguish between
relevant and irrelevant information as well as higher proficiency students; (e) graduate students
tended to fill in the blanks on the notetaking guide more completely (although not always more
accurately) than did either undergraduate or noncredit students, suggesting perhaps that they
approached the task more seriously.
Cushing provided suggestions for future qualitative analyses of notes. She suggested that
future investigations of the content of notes should include analysis of: (a) content (main ideas,
important details, mention of the connection between ideas, and inclusion of the
presence/absence of trivial details and unconnected words from the lecture); (b) organization
(i.e., the macro-level strategies or organization that indicates progression of ideas throughout the
text, as well as the micro-level strategies or organization that suggest the relationship between
the main ideas and details; and (c) notetaking efficiency (abbreviations, symbols, content versus
function words, paraphrasing versus verbatim transcription, complete sentences versus key
phrases); and (d) features of notetaking specific to L2 speakers (e.g., use of the L1, problems
with understanding content, and problems of understanding the structure of the text).
Noting that “with the exception of Dunkel’s work, the literature has not offered a cross
cultural focus on the lecture notetaking of groups of L1 and L2 students” (p. 137), Clerehan
(1995) pointed out that after years of research on a vast array of features of students’ academic
English, we actually have little idea of what is being taken down in lectures, and whether it
matters. To address the situation, Clerehan analyzed the hierarchical propositional structure of
notes taken by L1 and L2 students from a lecture on commercial law and compared those to the
hierarchical propositional structure of the original lecture. The investigation was based on the
identification of the different levels of the lecture discourse to see how much of the propositional
structure (Level 1: headings; Level 2: propositions related to the headings (rules of law); Level 3:
illustrative case examples) students were recording. In general, L2 notetakers recorded
significantly fewer of the top-level elements than did L1 students. Moreover, Clerehan found that
the L2 group failed to adequately record 19% of Level 1, 43% of Level 2, and 43% of Level 3
elements. The researcher posited if the L2 law notetakers “were revising the topic from their
lecture notes and from the textbook, these students, unlike their L1 peers, would need to perform
4
what resembles a jigsaw operation to retrieve the full meaning” (p. 145). By contrast, the L1
students consistently recorded 99-100% of the principal elements, and they did not show an
increase in their omissions down the hierarchy from Level 1 to Level 3, as the L2 students did.
The study by Carrell, Dunkel, and Mollaun (2002, 2004) was the first to show a
facilitating effect on L2 listening comprehension when a group of examinees with heterogeneous
L1s was allowed to take and refer to notes during mini-lecture listening. This study, however, did
not examine the content of the notes taken by examinees, nor, therefore, the relationship of the
content of the notes to test performance.
In a more recent study of the functions of notetaking and the content of L2 listeners’
notes in the context of a group of Chinese EFL learners, Liu (2001) found that taking and having
one’s notes available during question answering had a significant effect on the recognition of
specific information (but not general information) in both immediate and delayed multiple-
choice test performance. A follow-up study reported in the same thesis investigated the
relationship between three qualitative features of the Chinese students’ notes and test
performance: number of content words, number of words spelled out fully, and number of
notations. Liu found significant positive correlations between number of content words and
lecture-specific information (as opposed to general information), as well as significant negative
correlations between number of words in full spelling and lecture-specific information (again as
opposed to general information). Liu concluded that learners should be encouraged to “take
down more content words when required to recall specific information,” and as it might be a lost
cause to spell out words fully, to establish a “personalized shorthand system” (2001, abstract).
In another recent study comparing notetaking in French by L1 and L2 undergraduate
students from the perspective of cognitive load and working memory, Faraco, Barbier, and Piolat
(2002) scored notes taken during students’ listening to a 12-minute audiotaped lecture for
volume and content (i.e., number of words as a percentage of total words spoken by the lecturer
and as percentage of basic units, conceptual units, and major units) and procedures (i.e.,
abbreviations, icons [arrows, hyphens, etc.] and reformulations with words other than those
produced by the lecturer). For all participants taken together (native speakers of French, high
proficiency second language learners of French, and lower proficiency second language learners
of French) they found significant positive correlations between comprehension scores and both
abbreviations and icons and a significant negative correlation between comprehension and
5

reformulations. Presumably, if notetakers are taking time to reformulate or paraphrase they are
missing what’s coming next. Faraco et al. also found that high proficiency nonnative speakers
actually took down more content than native speakers or low proficiency nonnative speakers.
Research Questions
Research Question 1: What strategies do examinees use in taking notes on the academic
lectures in LanguEdge?
Research Question 2: Are these notetaking strategies affected by the instructional
intervention on notetaking?
Research Question 3: (a) What strategies do examinees report using in taking notes and
how helpful do they think these strategies are for their performance on the multiple-choice
listening comprehension task and the integrated listening/writing and listening/speaking tasks in
LanguEdge? (b) Are these reports affected by the instructional intervention?
Research Question 4: Are examinees’ notetaking strategies related to their performance
on the multiple-choice listening comprehension task and the integrated listening/writing and
listening/speaking tasks in LanguEdge?
Research Question 5: Is examinees’ performance on the multiple-choice listening
comprehension task and the integrated listening/writing and listening/speaking tasks in
LanguEdge affected by the instructional intervention?
Methodology and Design
Participants
A total of 216 participants generated sufficiently complete data to be included in the
study. Participants were international students studying in the United States; they ranged in
listening comprehension proficiency from low-intermediate to high, as measured by their scores
on the pretest listening comprehension measure (mean scale score = 13.89, S.D. = 5.221, range
1-25, maximum possible scale score = 25). Eligible participants were any nonnative speakers of
English who were ready to attempt TOEFL. Participants, who were paid for their participation,
were drawn from the international student enrollees in the intensive English program (IEP) or
matriculated ESL programs of several cooperating universities: The University of Indiana ( IU),
The University of Arizona ( UAZ), Georgia State University ( GSU), and the University of
Nevada—Las Vegas ( UNLV). Relevant participant characteristics are detailed in Table 1.
6
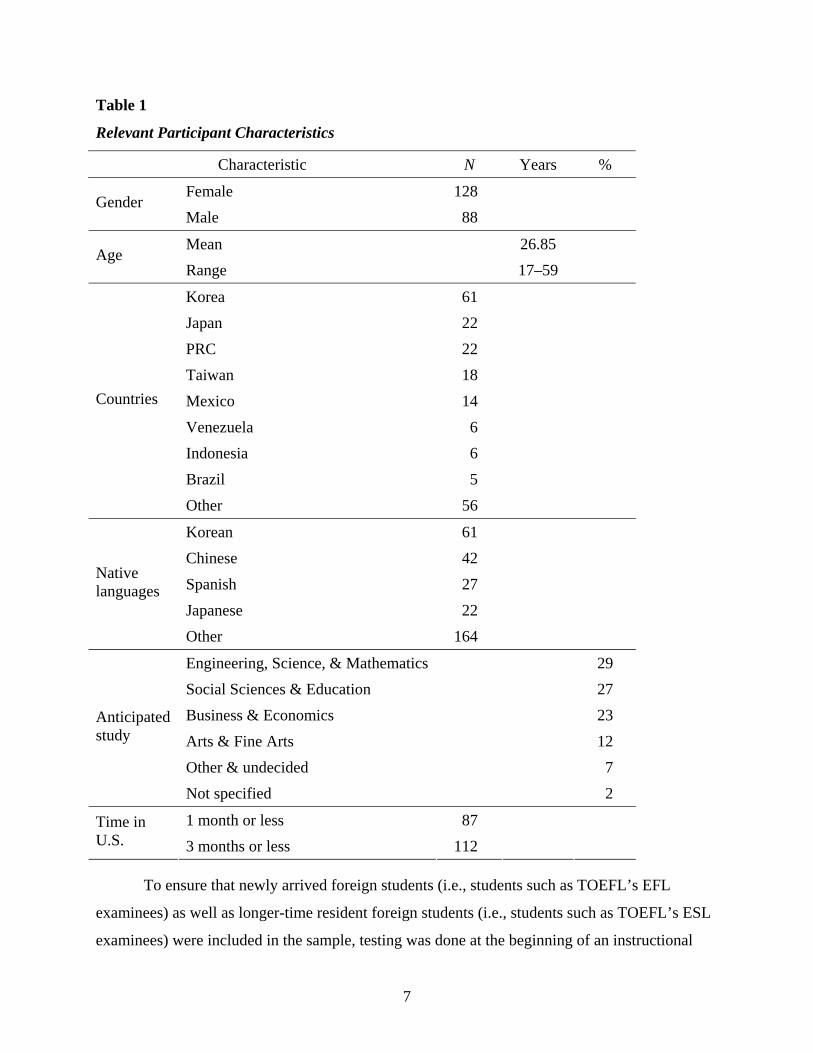
Table 1
Relevant Participant Characteristics
Characteristic N Years %
Female 128 Gender
Male 88
Mean 26.85 Age
Range 17–59
Korea 61 Japan 22 PRC 22 Taiwan 18 Mexico 14 Venezuela 6 Indonesia 6 Brazil 5
Countries
Other 56
Korean 61 Chinese 42 Spanish 27 Japanese 22
Native languages
Other 164
Engineering, Science, & Mathematics 29 Social Sciences & Education 27 Business & Economics 23 Arts & Fine Arts 12 Other & undecided 7
Anticipated study
Not specified 2
1 month or less 87 Time in U.S. 3 months or less 112
To ensure that newly arrived foreign students (i.e., students such as TOEFL’s EFL
examinees) as well as longer-time resident foreign students (i.e., students such as TOEFL’s ESL
examinees) were included in the sample, testing was done at the beginning of an instructional
7
term, when new students were arriving in the United States. This timing was also intended to
mitigate the effects of any instruction on notetaking in the institution's IEP/ESL curriculum.
Testing was done in the summer and fall of 2003 and winter of 2004.
Participants were each paid an incentive of $25 for their participation, in the form of a
gift certificate at their university bookstore. To motivate participants to do their best on the
posttest, they were told at the end of pretesting that if their posttest score equaled or exceeded
their pretest scores, they would receive an additional $25 bonus.1
Materials Used in the Study
The computer-based test. Pre- and posttests consisted of the listening comprehension
sections of two forms of the computer-based LanguEdge tests. Each test form consisted of two
conversations and four academic lectures; both the conversations and the lectures are based on
speech commonly found in North American colleges and universities and reflect that found in
introductory-level academic settings on a variety of academic subject matters (ETS, 2002a).
Each conversation was followed by five multiple-choice questions, and each lecture was
followed by six multiple-choice questions. In Form 2 of the test one lecture was followed by
only five multiple-choice questions, but one of those questions, with more than one correct
response, was worth 2 points. All other multiple-choice items were worth 1 point.
Multiple-choice questions included conventional four-choice questions; most of those
were one-correct-response multiple-choice items, but some were innovative items that required
more than one correct response. For example, one such item required the examinee to click on
two correct answers. The question, which was worth 2 points, required participants to correctly
categorize four examples. Partial credit (1 point) was given for correctly categorizing two of the
four examples.
In addition, an integrated speaking question followed the multiple-choice questions after
the third lecture, and an integrated writing question followed the multiple-choice questions after
the fourth lecture.
The topics of the conversations and lectures were as follows: Form 1: Conversation 1
(Applying to Graduate School); Conversation 2 (Review for Biology Exam on Genes); Lecture 1
(Botany/Root Systems); Lecture 2 (Business/Organization of Management); Lecture 3
(Environmental Science/Water Resources); Lecture 4 (Philosophy/ Ethics/Plato). Form 2:
8
Conversation 1 (Poetry Club); Conversation 2 (Research Paper); Lecture 1 (Astronomy/ Bode’s
Law); Lecture 2(Botany/Manila Hemp); Lecture 3 (Philosophy/Aristotle); Lecture 4
(Psychology/Behaviorism).
The conversations were delivered at speaking rates of between 185 and 206 words per
minute; the lectures were delivered at speaking rates between 143 and 208 words per minute.
Conversations and lectures were four to six minutes in length.
Students controlled the timing of the assessment tasks, within general parameters. They
had 25 minutes total in which to respond to the 33 or 34 multiple-choice comprehension
questions (time limit does not include the time used to deliver the six aural stimuli). To respond
to the integrated speaking question, students had 60 seconds to review their notes and prepare a
response and 90 seconds to record their oral response. To respond to the integrated writing
question, students had 15 minutes total within which to plan and to write a response based on the
information in the lecture, using the computer keyboard. They were informed that an effective
response would typically be between 125 and 200 words.
Each participant took one form as the pretest and the other form as the posttest.
Approximately one half of the participants (N = 107) took Form 1 as the pretest and Form 2 as
the posttest, and the other half (N = 109) vice versa.
Pre- and posttest questionnaires. A debriefing questionnaire was administered after the
pretest and again after the posttest. Utilizing a 1-5 scale, from least to most, the questionnaire
probed examinees’ perceptions about the frequency of various notetaking strategies they used
while taking the tests, as well as their perceptions about the helpfulness of those notetaking
strategies in their performance on the tests. (See Appendix A for a copy of the pretest
questionnaire.) At the end of the Session 1 questionnaire, participants were informed about the
bonus incentive if their scores on the Session 2 computer test equaled or exceeded their scores on
the Session 1 computer test. The posttest questionnaire was identical to the pretest questionnaire,
minus the statement about the incentive.
Instructional intervention. An instructional intervention detailing good practices in
notetaking was developed. It was designed to be used without any support from an instructor or
any discussion, similar to the written notetaking guidelines that might be provided to examinees
in advance of their taking the TOEFL. The tips or guidelines included were those that the
research literature has shown to help students take notes during a lecture. Many of the practices
9
were in the form of do’s and don’ts. Students were told that this advice could help them take
good notes and help them answer questions on a listening comprehension test that follows a
lecture. To ensure that they read and understood each of the good practices, students were asked
to place their initials in a space provided in the right margin next to each practice.
The good practices were drawn from various sources on effective notetaking during
lecture listening, and they were intended to represent the kind of notetaking advice that could be
presented to examinees in printed test preparation material. Moreover, the items on the
notetaking strategies questionnaire administered after the pretest and after the posttest were
carefully coordinated with the do’s and don’ts on the best practices intervention. (See Appendix
B for a copy of the instructional intervention.) There were no prior expectations about the effect
of the instructional intervention.
Other instruments. Additional instruments employed in the study included a handout of
information about the study for participant recruits, an informed consent form, a biodata form
soliciting relevant participant data, and a packet of notetaking paper with directions for use in
taking notes during each computer-based test. (Copies of these instruments are available from the
researcher.)
Procedures
The testing was conducted in the language resource centers or computer laboratories of
the cooperating universities. An ESL specialist affiliated with the IEP or ESL program at each of
these institutions functioned as the campus administrator for the study. These individuals were
responsible for getting the LanguEdge computer-based tests installed on university computers,
and they were also responsible for administering all tests and study materials at their institutions.
Campus coordinators were also instructed to schedule administration of pre- and posttests,
ideally with not longer than 2 weeks between the two. The mean number of days between pre
and posttesting was 8.68 days, while both the median and mode were 8 days. Seven participants
were posttested more than two but less than 3 weeks later.
Participants on each campus were randomly assigned a participant number. The
computer-based tests were set up so that odd-numbered participants automatically received Form
1 as the pretest and Form 2 as the posttest; even-numbered participants automatically received
Form 2 as the pretest and Form 1 as the posttest. Prior to posttesting, about 50% of the even-
numbered and 50% of the odd-numbered participants were randomly assigned to a notetaking
10

instructional intervention group (N = 110), and the other 50% were randomly assigned to the no-
intervention group (N = 106). Intervention and no-intervention participants were posttested at
different times.
Participants were tested in two sessions. During Session 1 campus coordinators first
administered and reviewed with participants the informed consent form, the biodata form, and
the information about the study packet. They then handed out and reviewed with participants the
packet of notetaking paper. Before beginning the computer test, students were permitted to stand
and stretch their legs. The computer-based test began with a self-paced tutorial followed by the
computer-based test. Upon completion of the computer-based test, students raised their hands
and turned in their notetaking packet. They were then given the Session 1 questionnaire on
notetaking strategies. At the end of the Session 1 questionnaire they were informed about the
possible bonus for equal or better performance on the Session 2 test. Session 1 ended for each
participant when they turned in the Session 1 questionnaire.
Session 2 for intervention participants began with the intervention. The good practices in
notetaking sheet (described in Appendix B) was handed out to participants who had been
randomly assigned to the intervention groups prior to taking the posttest. Participants took as
much time as they desired to study the handout, without any discussion or practice. Most
completed the intervention task in 15-20 minutes. When they were finished with the intervention,
they raised their hands and turned in the good practices handout. Intervention students were also
permitted to stand and stretch their legs before beginning the computer-based test. From this
point onward, Session 2 was the same for intervention and no-intervention participants. Session
2 continued with test administrators handing out new, clean notetaking packets and again
reviewing these with participants. Upon completion of the Session 2 computer test, students
raised their hands and turned in their notetaking packets. They were given the Session 2
questionnaire on notetaking strategies. Session 2 ended for each participant when they turned in
the Session 2 questionnaire.
Content Analysis of Notes
The notes taken by examinees on the pretest and on the posttest (lectures only) were
subjected to content analysis; notes taken on the conversations were not included in the analysis.
After an extensive review of the relevant literature on notetaking strategies relevant to second
language listening comprehension test performance (specifically Chaudron, Cook, & Loschky,
11

1988; Cushing, 1991, 1993; Dunkel, 1988a; Liu, 2001), eight categories were identified for the
analysis of examinees’ notes. The content analysis addressed many of the same notetaking
strategies addressed on the questionnaires and in the good practices intervention, including, for
example, the extensiveness of the notes, the content and efficiency of the notes, and the
organization of the notes.
1. Total notations of any kind for the lecture (words; numerals; symbols; abbreviations,
in the L1 or L2 or any other language), defined as any marks, legible or illegible, and
separated by spaces. This is a measure of the extensiveness or length of the notes.
2. Number of content words from the lecture (either recorded verbatim from the lecture
or correctly paraphrased). Content words from the lecture reflect a focus on lecture
content, as well as notetaking efficiency if, concomitantly, function words are
omitted.
3. Number of abbreviations, symbols, and paraphrases from the lecture. All of these
represent an encoding or transformation of verbatim information into the listener’s
own comprehension system.
4. Number of test questions answerable from idea units (IUs) found in the notes. This is
a measure of the recognition of important/main ideas and of an examinee’s test
wiseness. Answers to 21 multiple-choice questions on Form 1 and answers to 22
multiple-choice questions on Form 2 could be reasonably expected to be included in
participants’ notes. If a question had multiple correct responses, credit was given for
partial information in the notes.
The last four categories of the content analysis address several aspects of how
information in the notes was overtly organized or emphasized. These categories were scored on a
4-point ordinal scale, ranging from 0 = no use of or no evidence of the strategy in the notes, to
3 = very extensive use of, or very extensive evidence of the strategy in the notes.
5. Use of diagrams, outlining, and indentation.
6. Use of arrows.
7. Use of lists.
8. Use of circles, boxes, and underlining.
12
Categories 5, 6, and 7 reflect the notetaker’s overt visual organization of the lecture,2 and
Category 8 reflects the notetaker’s emphasis of particular ideas from the lecture.3
Notes for each of the lectures were coded separately. Variables were independently coded
by two raters and discrepancies resolved by a third rater. For the first four continuous variables,
if the difference between the two independent raters’ scores was 10% or less, then the final score
was the average of the two raters’ scores. If the difference between the two raters’ scores
exceeded 10%, then the third rater resolved the discrepancy. For the last four ordinal variables, if
the two raters were within a point of each other, then the final score was the average of the two
raters’ scores. If the two raters differed by more than 1 point, the third rater resolved the
differences. The third rater resolved differences by independently scoring the continuous or
ordinal variable and either agreeing with one of the two original raters or determining a score
between that of the two raters. The third rater’s score was used in the final analyses.
Pearson product-moment correlations were used to assess the interrater reliability4 for the
content analysis of the notes by the two principal raters for the four continuous variables: (a)
total notations; (b) number of content words; (c) number of abbreviations, etc.; (d) number of test
questions answerable from notes. Cohen’s (weighted) kappa coefficient was used to assess the
interrater reliability for the content analysis of the notes by the two principal raters for the four
rank-order or categorical variables (Cohen, 1960, 1968; Fleiss, 1981; Fleiss, Cohen & Everitt,
1969; Fleiss, Levin, & Paik, 2003): (e) use of diagrams, etc.; (f) use of arrows; (g) use of lists;
and (h) use of circles, etc. The results of these tests of interrater reliabilities for these content
analysis variables are shown in Table 2.
According to Landis & Koch (1977), the content in Table 3 provides “useful
benchmarks” (p. 165) for the sufficiency of interrater agreement with Cohen’s kappa coefficient.
In sum, all eight of these reliabilities in Table 2 are strong or substantial, indicating
acceptable levels of interrater reliability. Therefore, all eight of the variables were included in the
final analyses.
Scores on each of the continuous variables in the content analysis of the notes (total
notations, number of content words, number of abbreviations, and number of test questions
answerable from notes) were summed across all four lectures for each form of the test to arrive at
a score for that variable for the participant’s entire set of notes for that form of the test. These
total scores were used in the final data analyses.
13

Table 2
Results of Interrater Reliabilities Tests
Variables Pearson’s r Linear weighted
kappa
Std. error Interrater
reliability
Total notations .99* -- -- strong
Content words .94* -- -- strong
Abbreviations, etc. .83* -- -- strong
Test answers .85* -- -- strong
Diagrams, etc. -- .68 .0129 substantial
Arrows -- .77 .0108 substantial
Lists -- .63 .0206 substantial
Circles, etc. -- .79 .0094 substantial
Note. N = 1,728.
* p < .0001.
Table 3
Useful Benchmarks for the Sufficiency of Interrater Agreement With Cohen’s Kappa
Coefficient
Kappa Strength of agreement
< .00 Poor
.00 to .20 Slight
.21 to .40 Fair
.41 to .60 Moderate
.61 to .80 Substantial
.81 to 1.00 Almost perfect
Because of the difference between Form 1 and Form 2 of the test in the maximum
number of test questions potentially answerable from the notes (21 versus 22), the total numbers
of test answers found in participants’ notes were converted to proportions. Thus, for example, if
a participant’s notes contained information related to the answers to 10 of the 21 questions for
Form 1, their score in this category was converted to the proportion .476. If a participant’s notes
14

contained information related to the answers to 10 of the 22 questions for Form 2, their score in
this category was converted to the proportion .455. These proportion scores were used in the
final data analyses.
Scores on the ordinal variables in the content analysis of the notes (use of diagrams, etc.;
use of arrows; use of lists; and use of circles, etc.) were averaged across all four lectures for each
form of the test to arrive at a score for that variable for the entire set of notes for that form of the
test. These averaged scores were used in the final data analyses.
Scoring of Other Instruments
The raw listening comprehension scores of the computer-based tests’ multiple response
items (0-34) were converted to scale scores according to the Score Interpretation Guide:
LanguEdge Courseware (ETS, 2002b, p. 7). The scale scores, which ranged from 1-25, were
used in the final data analyses.
The integrated speaking and written responses were scored on 5-point holistic scales
according to the guidelines for each task in the Handbook for Scoring Speaking and Writing:
LanguEdge Courseware (ETS, 2002c). Two independent raters each rated all of the spoken
responses, and two other independent raters each rated all of the written responses. Raters were
experienced ESL teachers with master’s degrees in teaching English to speakers of other
languages and extensive experience in rating oral and written assessments for nonnative speakers
of English. They were trained with the information provided in the scoring handbook by a senior
rater (ETS, 2002c). This senior rater served as third rater in the rare cases of discrepancy
between the two initial raters. If the two independent raters differed by only 1 point, the scores
they arrived at were averaged. If the two independent raters differed by more than 1 point, the
score discrepancy was resolved by a third independent rater. It should be noted that cases in
which the two independent raters for each of the speaking and writing responses differed from
each other by more than 1 point were extremely rare. Interrater reliabilities for these ordinal
scales were measured by Spearman’s rho and linear weighted kappa coefficients. For the ratings
of the speaking and writing, see Table 4.
15
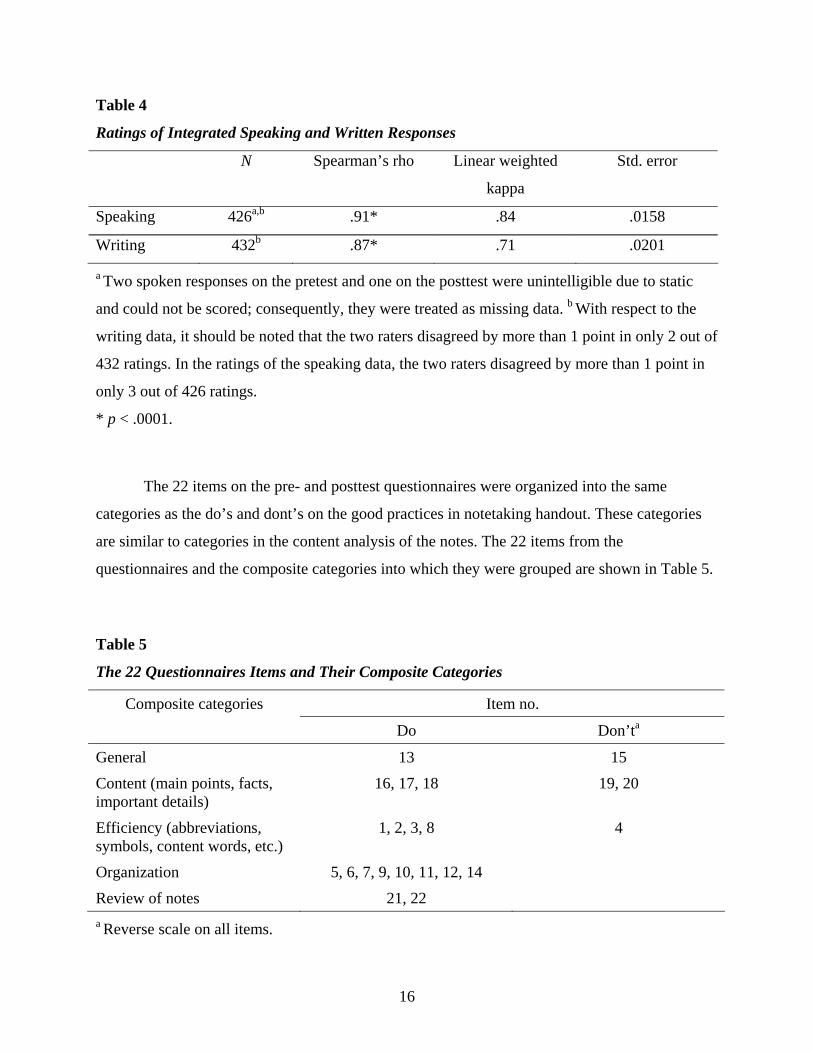
Table 4
Ratings of Integrated Speaking and Written Responses
N Spearman’s rho Linear weighted
kappa
Std. error
Speaking 426a,b .91* .84 .0158
Writing 432b .87* .71 .0201
a Two spoken responses on the pretest and one on the posttest were unintelligible due to static
and could not be scored; consequently, they were treated as missing data. b With respect to the
writing data, it should be noted that the two raters disagreed by more than 1 point in only 2 out of
432 ratings. In the ratings of the speaking data, the two raters disagreed by more than 1 point in
only 3 out of 426 ratings.
* p < .0001.
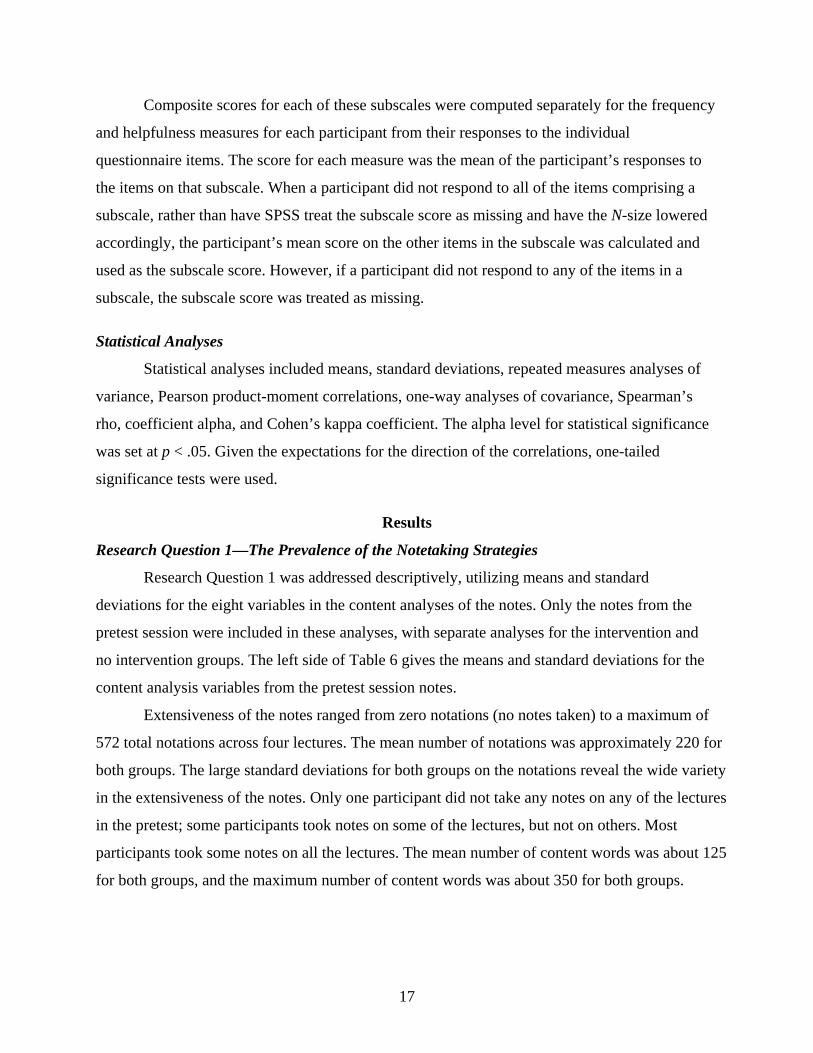
The 22 items on the pre- and posttest questionnaires were organized into the same
categories as the do’s and dont’s on the good practices in notetaking handout. These categories
are similar to categories in the content analysis of the notes. The 22 items from the
questionnaires and the composite categories into which they were grouped are shown in Table 5.
Table 5
The 22 Questionnaires Items and Their Composite Categories
Composite categories Item no.
Do Don’ta
General 13 15 Content (main points, facts, important details)
16, 17, 18 19, 20
Efficiency (abbreviations, symbols, content words, etc.)
1, 2, 3, 8 4
Organization 5, 6, 7, 9, 10, 11, 12, 14 Review of notes 21, 22 a Reverse scale on all items.
16
Composite scores for each of these subscales were computed separately for the frequency
and helpfulness measures for each participant from their responses to the individual
questionnaire items. The score for each measure was the mean of the participant’s responses to
the items on that subscale. When a participant did not respond to all of the items comprising a
subscale, rather than have SPSS treat the subscale score as missing and have the N-size lowered
accordingly, the participant’s mean score on the other items in the subscale was calculated and
used as the subscale score. However, if a participant did not respond to any of the items in a
subscale, the subscale score was treated as missing.
Statistical Analyses
Statistical analyses included means, standard deviations, repeated measures analyses of
variance, Pearson product-moment correlations, one-way analyses of covariance, Spearman’s
rho, coefficient alpha, and Cohen’s kappa coefficient. The alpha level for statistical significance
was set at p < .05. Given the expectations for the direction of the correlations, one-tailed
significance tests were used.
Results
Research Question 1—The Prevalence of the Notetaking Strategies
Research Question 1 was addressed descriptively, utilizing means and standard
deviations for the eight variables in the content analyses of the notes. Only the notes from the
pretest session were included in these analyses, with separate analyses for the intervention and
no intervention groups. The left side of Table 6 gives the means and standard deviations for the
content analysis variables from the pretest session notes.
Extensiveness of the notes ranged from zero notations (no notes taken) to a maximum of
572 total notations across four lectures. The mean number of notations was approximately 220 for
both groups. The large standard deviations for both groups on the notations reveal the wide variety
in the extensiveness of the notes. Only one participant did not take any notes on any of the lectures
in the pretest; some participants took notes on some of the lectures, but not on others. Most
participants took some notes on all the lectures. The mean number of content words was about 125
for both groups, and the maximum number of content words was about 350 for both groups.
17
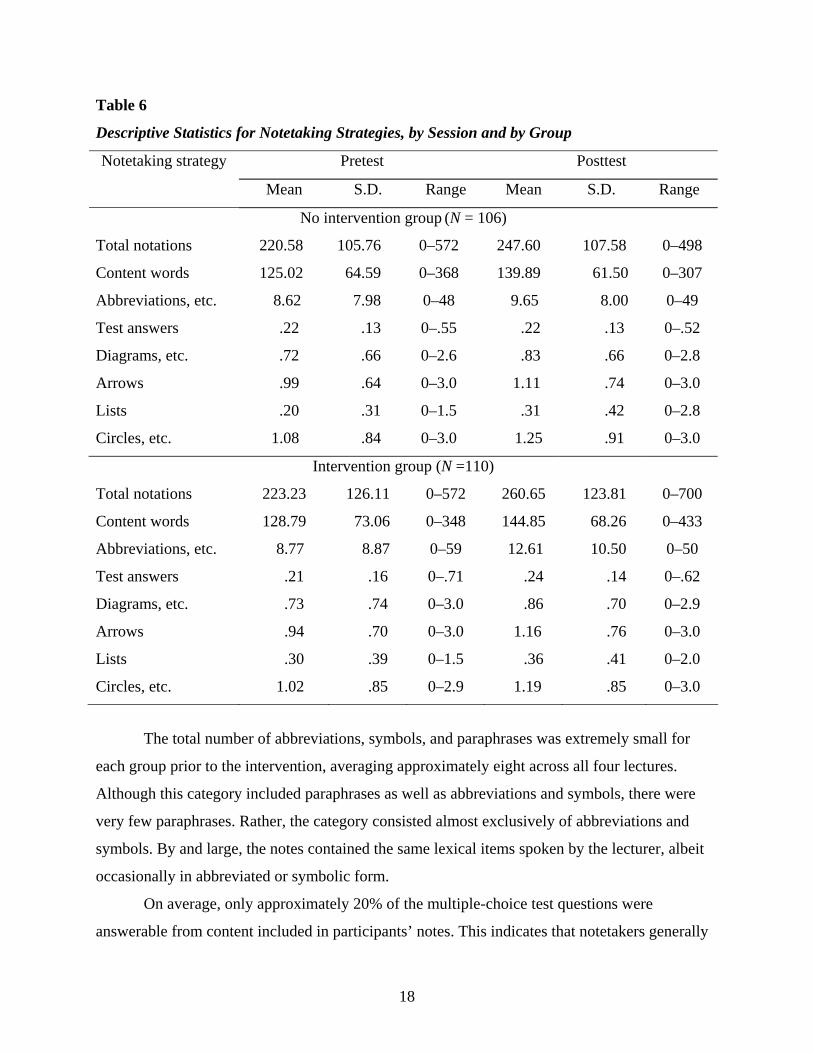
Table 6
Descriptive Statistics for Notetaking Strategies, by Session and by Group
Pretest Posttest Notetaking strategy
Mean S.D. Range Mean S.D. Range
No intervention group (N = 106)
Total notations 220.58 105.76 0–572 247.60 107.58 0–498
Content words 125.02 64.59 0–368 139.89 61.50 0–307
Abbreviations, etc. 8.62 7.98 0–48 9.65 8.00 0–49
Test answers .22 .13 0–.55 .22 .13 0–.52
Diagrams, etc. .72 .66 0–2.6 .83 .66 0–2.8
Arrows .99 .64 0–3.0 1.11 .74 0–3.0
Lists .20 .31 0–1.5 .31 .42 0–2.8
Circles, etc. 1.08 .84 0–3.0 1.25 .91 0–3.0
Intervention group (N =110)
Total notations 223.23 126.11 0–572 260.65 123.81 0–700
Content words 128.79 73.06 0–348 144.85 68.26 0–433
Abbreviations, etc. 8.77 8.87 0–59 12.61 10.50 0–50
Test answers .21 .16 0–.71 .24 .14 0–.62
Diagrams, etc. .73 .74 0–3.0 .86 .70 0–2.9
Arrows .94 .70 0–3.0 1.16 .76 0–3.0
Lists .30 .39 0–1.5 .36 .41 0–2.0
Circles, etc. 1.02 .85 0–2.9 1.19 .85 0–3.0
The total number of abbreviations, symbols, and paraphrases was extremely small for
each group prior to the intervention, averaging approximately eight across all four lectures.
Although this category included paraphrases as well as abbreviations and symbols, there were
very few paraphrases. Rather, the category consisted almost exclusively of abbreviations and
symbols. By and large, the notes contained the same lexical items spoken by the lecturer, albeit
occasionally in abbreviated or symbolic form.
On average, only approximately 20% of the multiple-choice test questions were
answerable from content included in participants’ notes. This indicates that notetakers generally
18
included content relevant to only about one fifth of the important ideas or supporting information
from the lecture.
The three notetaking strategies related to the organization of the notes (use of diagrams,
etc.; use of arrows; and use of lists) all show average utilization below the 1-level on the 4-level
scale (0, 1, 2, 3). Thus, these organizational devices were not used extensively in the notes. The
use of circles, boxes, and underlining (reflecting emphasis on important information) was utilized
on average slightly above the 1-level on the 4-level scale. This indicates that notetakers utilized
these devices to some extent. It should be noted, however, that in this content analysis of the notes,
no determination was made as to whether the words circled, boxed, or underlined were actually the
important information in the lecture. Thus, the use of this device cannot be assumed to necessarily
reflect correct recognition of the importance of ideas from the lecture. All one can assume is that
the circled, boxed, or underlined information was deemed to be important by the notetaker.
Research Question 2——Effects of Intervention on Notetaking Strategies
The overlap among the notetaking strategies is evidenced by their intercorrelations,
reported in Table 7. Obviously, the variables overlap to a great extent, so one would obviously
expect the number of total notations, that is, the number of content words and number of
abbreviations, and so on—and even the number of test answers found in the notes—to covary.
The pre- and posttest correlations for the notetaking strategies utilized by the no intervention
group, reported in the top of Table 7 along the diagonal, is a measure of the test-retest reliability
of the participants’ behavior vis-à-vis the notetaking strategies (as distinct from the reliability of
the ratings for these measures). Only the use of diagrams (for both groups) and arrows (for the no
intervention group) failed to significantly correlate between the pretest session and the posttest
session, suggesting otherwise consistent behavior on the part of participants with regard to the
use of the notetaking strategies.
To analyze the effects of the instructional intervention on notetaking strategies, a 2 x 2
( [pretest—posttest] × [intervention—no intervention] ) repeated measures (or mixed model)
analysis of variance was conducted for each pair of pretest-posttest notetaking variables, with
session (pretest versus posttest) being a repeated, within-subjects variable and group
(intervention versus no intervention) being a between-subjects variable. Given the large number
of significance tests, alpha levels were adjusted by the Bonferroni procedure and set at p < .006.
19

Both statistical and practical significance (measured by effect size, as indexed by eta-squared;
Kirk, 1996) were considered in evaluating the results (Wilkinson, 1999).
Table 7
Overlap Among Notetaking Strategies as Evidenced by Intercorrelations, by Session and by Group
Total
not.
Content Abbr. Test
ans.
Diag. Arrows Lists Circle
No intervention groupa
Total notations .59* .91* .46* .76* .17 .46* .13 .27*
Content words .87* .66* .45* .76* .26* .36* .10 .10
Abbreviations, etc. .36* .44* .61* .43* .08 .23 .11 .10
Test answers .60* .68* .36* .47* .06 .50* .07 .08
Diagrams, etc. .07 .23 .19 .07 –.20 .05 .25* .03
Arrows .54* .39* .18 .45* .08 .19 .07 .14
Lists .15 .21 .10 .19 .54* .15 .24* .02
Circles, etc. .46* .18 .05 .08 –.09 .29* .00 .72*
Intervention groupb
Total notations .75* .95* .56* .77* .52* .64* .36* .41*
Content words .92* .78* .54* .80* .55* .57* .35* .27*
Abbreviations, etc. .53* .54* .62* .44* .31* .51* .37* .03
Test answers .68* .70* .39* .53* .39* .55* .26* .20
Diagrams, etc. .22 .33* .27* .12 .03 .32* .59* .15
Arrows .53* .39* .40* .49* .04 .58* .12 .29*
Lists .31* .32* .21 .17 .47* .10 .29* .08
Circles, etc. .50* .33* .06 .25* .03 .28* –.01 .75*
Note. Pretest correlations are above the diagonal; posttest correlations are below the diagonal;
pretest-posttest correlations are along the diagonal.
a N = 106. b N =110.
* p < .006 (Bonferroni adjustment for multiple comparisons, one-tailed).
20
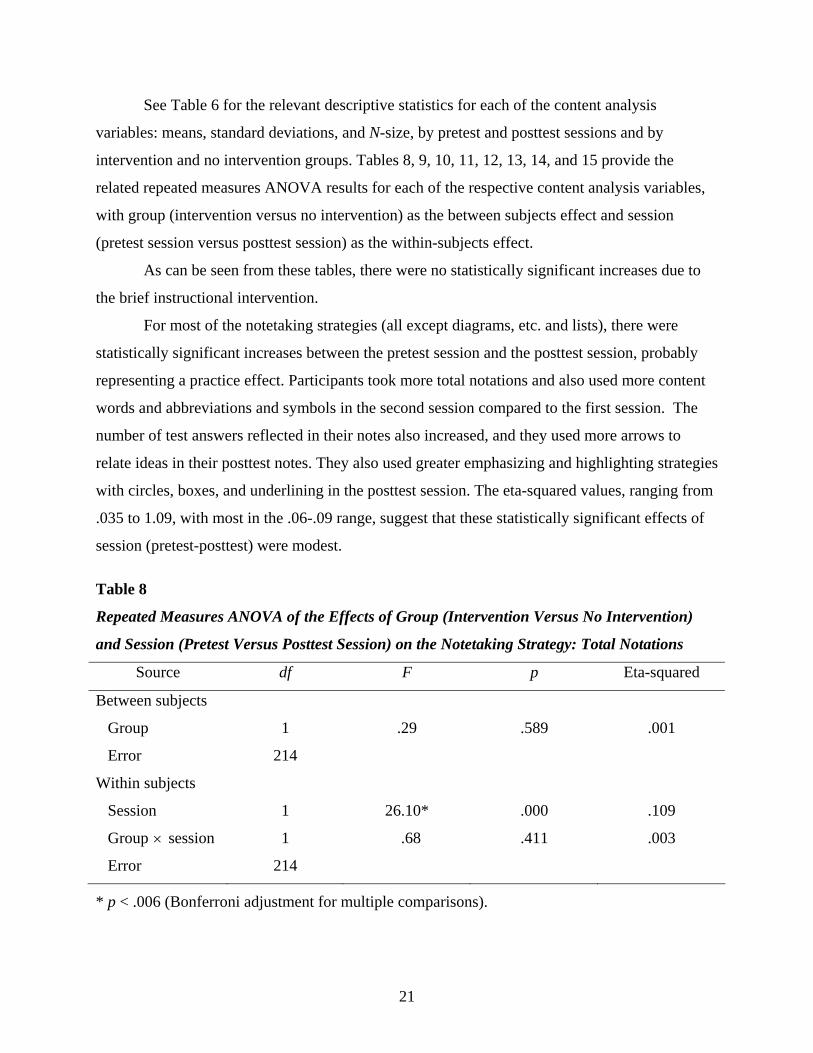
See Table 6 for the relevant descriptive statistics for each of the content analysis
variables: means, standard deviations, and N-size, by pretest and posttest sessions and by
intervention and no intervention groups. Tables 8, 9, 10, 11, 12, 13, 14, and 15 provide the
related repeated measures ANOVA results for each of the respective content analysis variables,
with group (intervention versus no intervention) as the between subjects effect and session
(pretest session versus posttest session) as the within-subjects effect.
As can be seen from these tables, there were no statistically significant increases due to
the brief instructional intervention.
For most of the notetaking strategies (all except diagrams, etc. and lists), there were
statistically significant increases between the pretest session and the posttest session, probably
representing a practice effect. Participants took more total notations and also used more content
words and abbreviations and symbols in the second session compared to the first session. The
number of test answers reflected in their notes also increased, and they used more arrows to
relate ideas in their posttest notes. They also used greater emphasizing and highlighting strategies
with circles, boxes, and underlining in the posttest session. The eta-squared values, ranging from
.035 to 1.09, with most in the .06-.09 range, suggest that these statistically significant effects of
session (pretest-posttest) were modest.
Table 8
Repeated Measures ANOVA of the Effects of Group (Intervention Versus No Intervention)
and Session (Pretest Versus Posttest Session) on the Notetaking Strategy: Total Notations
Source df F p Eta-squared
Between subjects
Group 1 .29 .589 .001
Error 214
Within subjects
Session 1 26.10* .000 .109
Group × session 1 .68 .411 .003
Error 214
* p < .006 (Bonferroni adjustment for multiple comparisons).
21

Table 9
Repeated Measures ANOVA of the Effects of Group (Intervention Versus No Intervention)
and Session (Pretest Versus Posttest Session) on the Notetaking Strategy: Content Words
Source df F p Eta-squared
Between subjects
Group 1 .27 .608 .001
Error 214
Within subjects
Session 1 21.16* .000 .090
Group × session 1 .03 .860 .000
Error 214
* p < .006 (Bonferroni adjustment for multiple comparisons).
Table 10
Repeated Measures ANOVA of the Effects of Group (Intervention Versus No Intervention)
and Session (Pretest Versus Posttest Session) on the Notetaking Strategy: Abbreviations
Source df F p Eta-squared
Between subjects
Group 1 2.04 .155 .009
Error 214
Within subjects
Session 1 20.81* .000 .089
Group × session 1 6.94 .009 .031
Error 214
* p < .006 (Bonferroni adjustment for multiple comparisons).
22
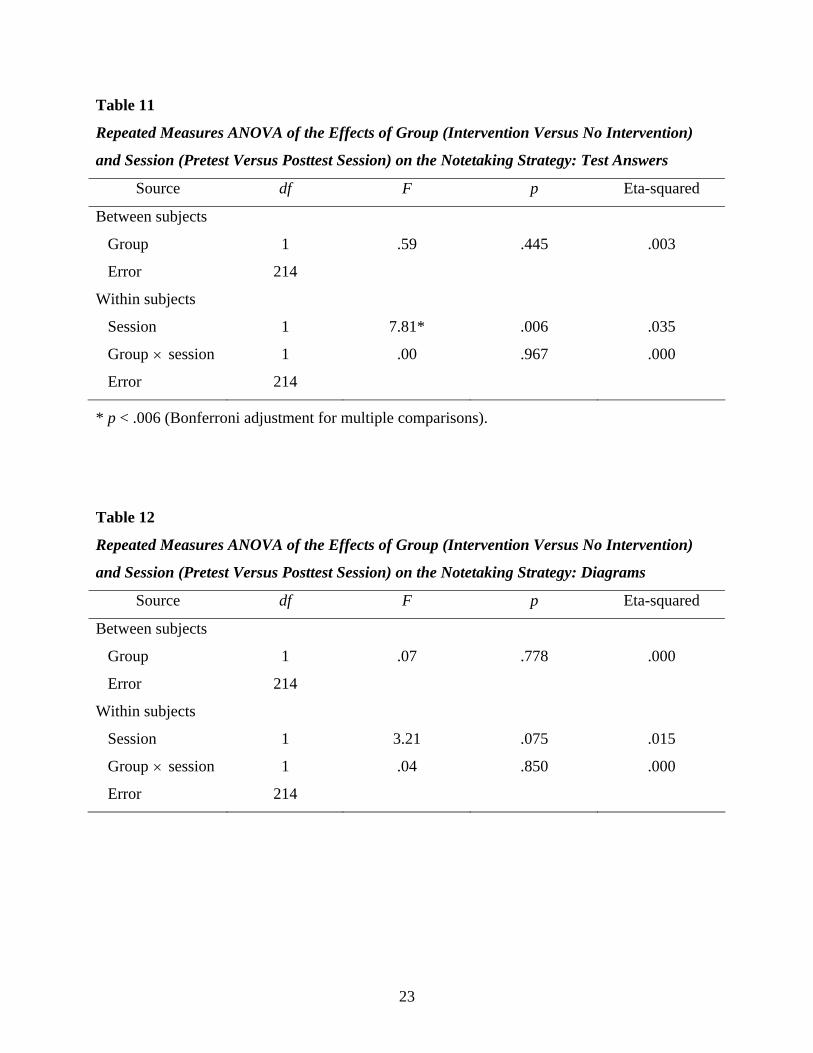
Table 11
Repeated Measures ANOVA of the Effects of Group (Intervention Versus No Intervention)
and Session (Pretest Versus Posttest Session) on the Notetaking Strategy: Test Answers
Source df F p Eta-squared
Between subjects
Group 1 .59 .445 .003
Error 214
Within subjects
Session 1 7.81* .006 .035
Group × session 1 .00 .967 .000
Error 214
* p < .006 (Bonferroni adjustment for multiple comparisons).
Table 12
Repeated Measures ANOVA of the Effects of Group (Intervention Versus No Intervention)
and Session (Pretest Versus Posttest Session) on the Notetaking Strategy: Diagrams
Source df F p Eta-squared
Between subjects
Group 1 .07 .778 .000
Error 214
Within subjects
Session 1 3.21 .075 .015
Group × session 1 .04 .850 .000
Error 214
23
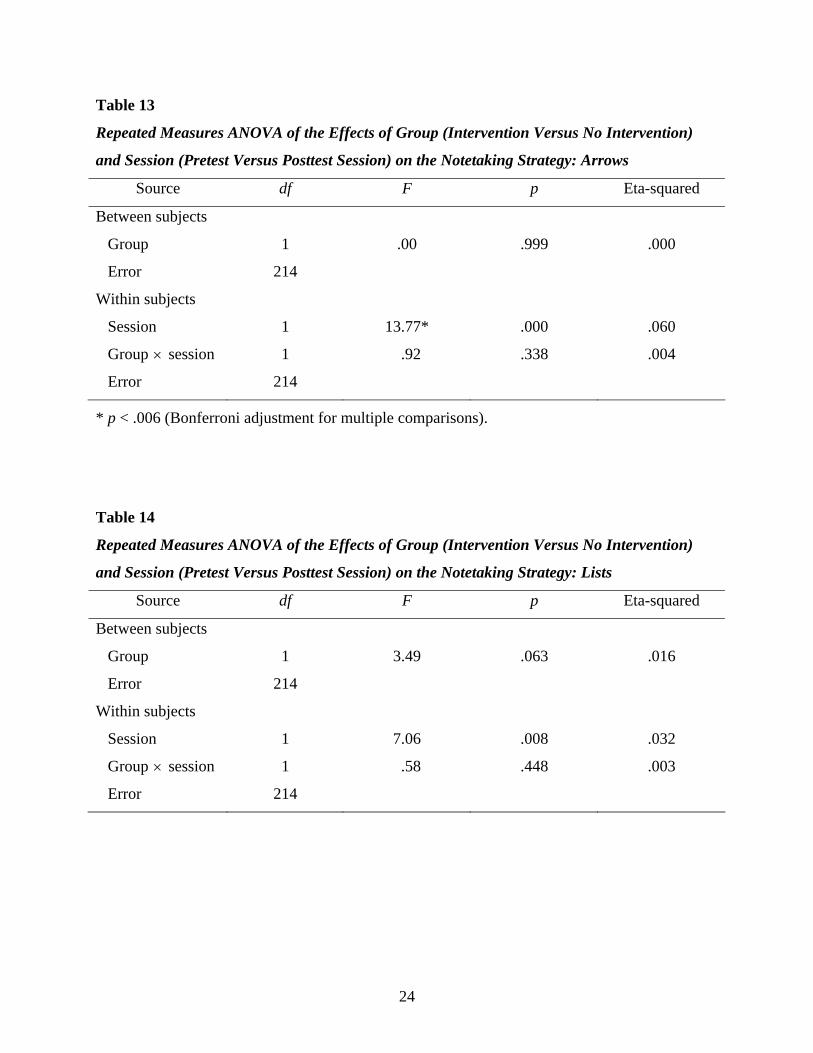
Table 13
Repeated Measures ANOVA of the Effects of Group (Intervention Versus No Intervention)
and Session (Pretest Versus Posttest Session) on the Notetaking Strategy: Arrows
Source df F p Eta-squared
Between subjects
Group 1 .00 .999 .000
Error 214
Within subjects
Session 1 13.77* .000 .060
Group × session 1 .92 .338 .004
Error 214
* p < .006 (Bonferroni adjustment for multiple comparisons).
Table 14
Repeated Measures ANOVA of the Effects of Group (Intervention Versus No Intervention)
and Session (Pretest Versus Posttest Session) on the Notetaking Strategy: Lists
Source df F p Eta-squared
Between subjects
Group 1 3.49 .063 .016
Error 214
Within subjects
Session 1 7.06 .008 .032
Group × session 1 .58 .448 .003
Error 214
24

Table 15
Repeated Measures ANOVA of the Effects of Group (Intervention Versus No Intervention)
and Session (Pretest Versus Posttest Session) on the Notetaking Strategy: Circles
Source df F p Eta-squared
Between subjects
Group 1 .30 .585 .001
Error 214
Within subjects
Session 1 15.48* .000 .067
Group × session 1 .03 .869 .000
Error 214
* p < .006 (Bonferroni adjustment for multiple comparisons).
Research Question 3a—Perceptions of Notetaking Strategies
Table 16 provides the descriptive statistics for the composite scores from the pre- and
posttest session questionnaires, by session and by group. Responses to the pretest session
questionnaire were utilized to address Research Question 3a.
As can be noted from the pretest session responses, participants reported that the
notetaking strategies that involved content (i.e., getting the main ideas and important facts, as
opposed to writing down irrelevant comments or trying to write down everything the lecturer
said) were the strategies they used most frequently and found to be most helpful. The next most
frequently utilized and helpful notetaking strategies were those involving efficiency (using
abbreviations, symbols, paraphrases, and omitting function words and using only content words)
and review of notes ( after the lecture to confirm comprehension and to answer test questions).
Notetaking strategies involving the organization of the notes (e.g., using diagrams, numbers,
lists, arrows, and highlighting) were reported as being used less frequently and as being less
helpful. General notetaking strategies such as using neat handwriting and writing down
unconnected words were reported as being used least frequently and as being least helpful.
25
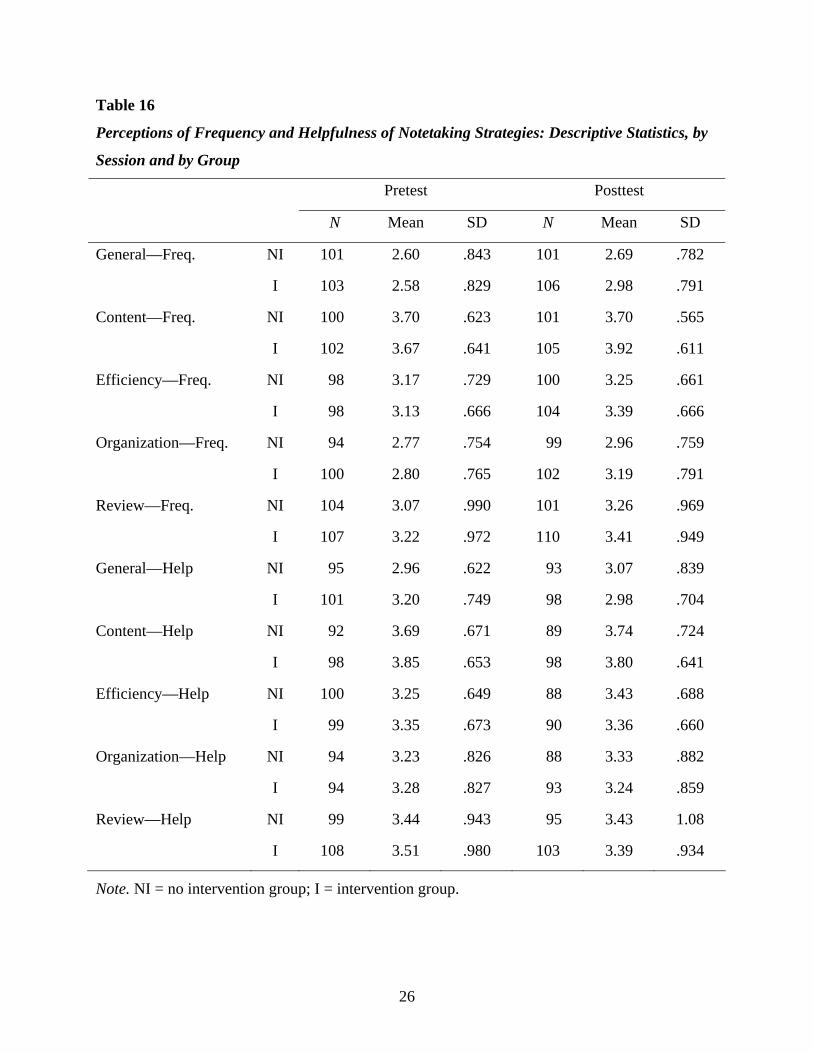
Table 16
Perceptions of Frequency and Helpfulness of Notetaking Strategies: Descriptive Statistics, by
Session and by Group
Pretest Posttest
N Mean SD N Mean SD
General—Freq. NI 101 2.60 .843 101 2.69 .782
I 103 2.58 .829 106 2.98 .791
Content—Freq. NI 100 3.70 .623 101 3.70 .565
I 102 3.67 .641 105 3.92 .611
Efficiency—Freq. NI 98 3.17 .729 100 3.25 .661
I 98 3.13 .666 104 3.39 .666
Organization—Freq. NI 94 2.77 .754 99 2.96 .759
I 100 2.80 .765 102 3.19 .791
Review—Freq. NI 104 3.07 .990 101 3.26 .969
I 107 3.22 .972 110 3.41 .949
General—Help NI 95 2.96 .622 93 3.07 .839
I 101 3.20 .749 98 2.98 .704
Content—Help NI 92 3.69 .671 89 3.74 .724
I 98 3.85 .653 98 3.80 .641
Efficiency—Help NI 100 3.25 .649 88 3.43 .688
I 99 3.35 .673 90 3.36 .660
Organization—Help NI 94 3.23 .826 88 3.33 .882
I 94 3.28 .827 93 3.24 .859
Review—Help NI 99 3.44 .943 95 3.43 1.08
I 108 3.51 .980 103 3.39 .934
Note. NI = no intervention group; I = intervention group.
26
Research Question 3b—Effects of the Intervention on Perceptions of Notetaking Strategies
The relationships among the questionnaire subscales for perception of the frequency and
helpfulness of the notetaking strategies are indicated by the intercorrelations reported in Table 17
(frequency subscales) and Table 18 (helpfulness subscales). Obviously there are some, but not
extensive, relationships among the subscales. The pretest-posttest correlations for the frequency
and helpfulness subscales for the no intervention group, reported along the diagonal at the top of
Tables 17 and 18, respectively, are measures of the test-retest reliability of the participants’
behavior vis-à-vis the questionnaire items (as distinct from the reliability of the ratings for these
measures). The frequency subscales show consistent correlations for both groups between pre-
and posttest session questionnaire responses; the helpfulness subscales show inconsistent
behavior of both groups of participants between pre- and posttest questionnaire responses.
The reliability of the questionnaires as measured by coefficient alpha is reported by group
and by session in Table 19. The reliability is low for some of the subscales, especially those with
a small number of items per subscale.
To address the effects of the intervention on participants’ perceptions of the frequency of
use of the notetaking strategies, a repeated-measures ANOVA was run for each frequency
subscale. These are reported in Tables 20, 21, 22, 23, and 24.
There were statistically significant increases due to session for all five of the subscales
related to participants’ perceptions of the frequency of their use of the notetaking strategies,
probably reflecting a practice effect. As students gained experience from taking notes for the test,
as well as from taking the test, they increased their perceptions of the frequency with which they
used various notetaking strategies. However, although the results are statistically significant, the
eta-squared results suggest that the effects were modest.
When the results were adjusted for multiple significance tests via the Bonferroni
procedure, there were no statistically significant differences in students’ perceptions of the
frequency of their use of any of the notetaking strategies due to the intervention, nor were there
any significant interactions between intervention and session.
27
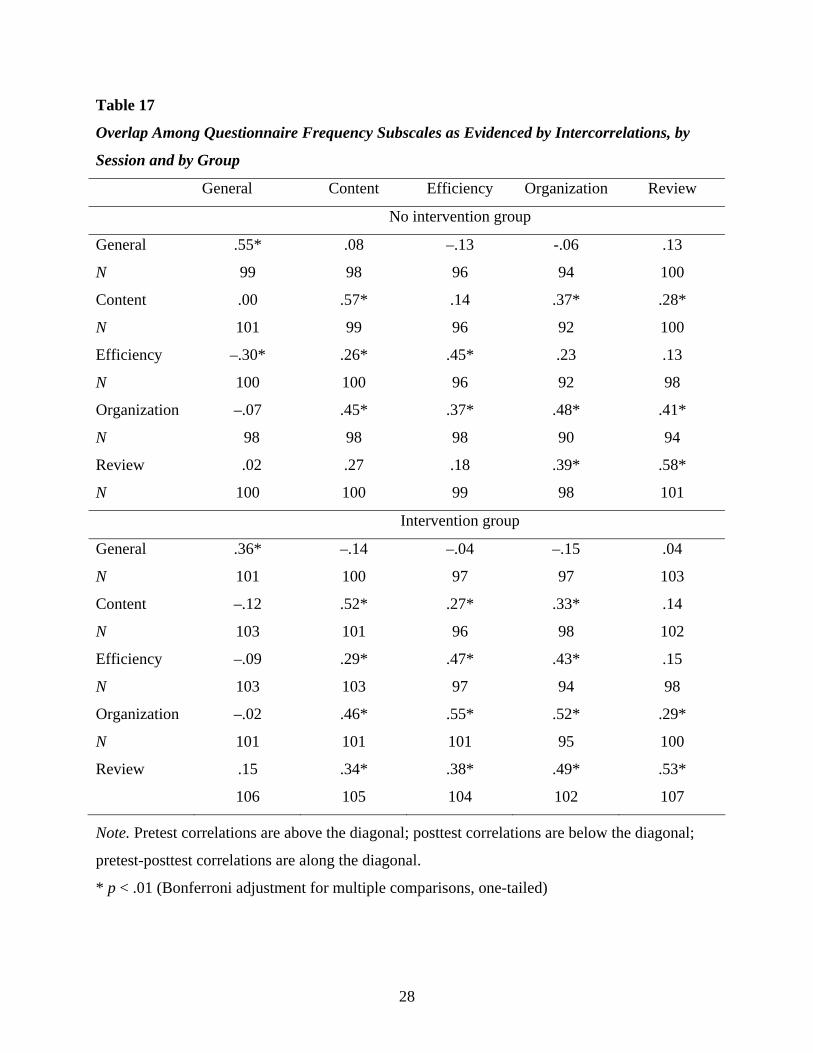
Table 17
Overlap Among Questionnaire Frequency Subscales as Evidenced by Intercorrelations, by
Session and by Group
General Content Efficiency Organization Review
No intervention group
General .55* .08 –.13 -.06 .13
N 99 98 96 94 100
Content .00 .57* .14 .37* .28*
N 101 99 96 92 100
Efficiency –.30* .26* .45* .23 .13
N 100 100 96 92 98
Organization –.07 .45* .37* .48* .41*
N 98 98 98 90 94
Review .02 .27 .18 .39* .58*
N 100 100 99 98 101
Intervention group
General .36* –.14 –.04 –.15 .04
N 101 100 97 97 103
Content –.12 .52* .27* .33* .14
N 103 101 96 98 102
Efficiency –.09 .29* .47* .43* .15
N 103 103 97 94 98
Organization –.02 .46* .55* .52* .29*
N 101 101 101 95 100
Review .15 .34* .38* .49* .53*
106 105 104 102 107
Note. Pretest correlations are above the diagonal; posttest correlations are below the diagonal;
pretest-posttest correlations are along the diagonal.
* p < .01 (Bonferroni adjustment for multiple comparisons, one-tailed)
28
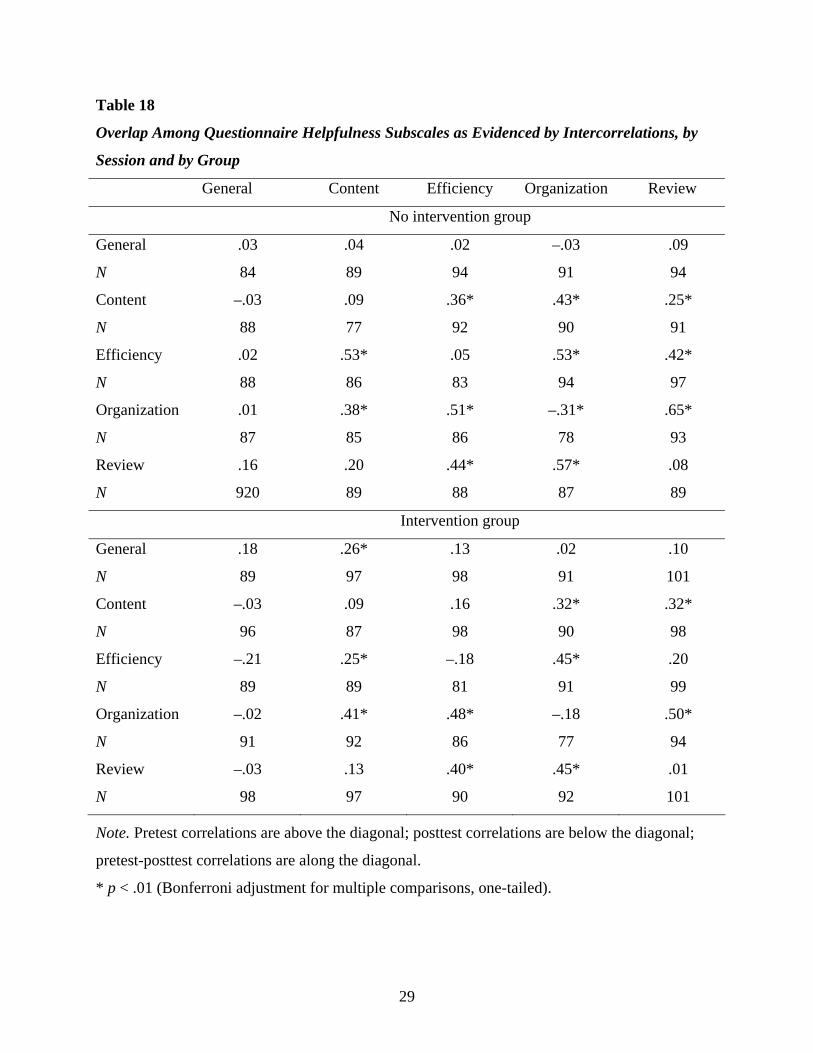
Table 18
Overlap Among Questionnaire Helpfulness Subscales as Evidenced by Intercorrelations, by
Session and by Group
General Content Efficiency Organization Review
No intervention group
General .03 .04 .02 –.03 .09
N 84 89 94 91 94
Content –.03 .09 .36* .43* .25*
N 88 77 92 90 91
Efficiency .02 .53* .05 .53* .42*
N 88 86 83 94 97
Organization .01 .38* .51* –.31* .65*
N 87 85 86 78 93
Review .16 .20 .44* .57* .08
N 920 89 88 87 89
Intervention group
General .18 .26* .13 .02 .10
N 89 97 98 91 101
Content –.03 .09 .16 .32* .32*
N 96 87 98 90 98
Efficiency –.21 .25* –.18 .45* .20
N 89 89 81 91 99
Organization –.02 .41* .48* –.18 .50*
N 91 92 86 77 94
Review –.03 .13 .40* .45* .01
N 98 97 90 92 101
Note. Pretest correlations are above the diagonal; posttest correlations are below the diagonal;
pretest-posttest correlations are along the diagonal.
* p < .01 (Bonferroni adjustment for multiple comparisons, one-tailed).
29

Table 19
Reliability of the Questionnaire Data as Measured by Coefficient Alpha, by Session and by
Group
Frequency Helpfulness Subscale
Pretest Posttest Pretest Posttest
General (2 items)
NI .08 –.36 .61 .30
Cases 101 101 95 93
I –.18 –.63 .42 .25
Cases 103 106 101 98
Content (5 items)
NI .43 .69 .48 .37
Cases 100 101 92 89
I .63 .59 .44 .50
Cases 102 105 98 98
Efficiency (5 items)
NI .56 .49 .75 .61
Cases 98 100 100 88
I .38 .46 .48 .58
Cases 98 104 99 90
Organization (8 items)
NI .76 .77 .83 .83
Cases 94 99 94 88
I .72 .79 .81 .83
Cases 100 102 94 93
Review (2 items)
NI .59 .49 .70 .52
Cases 104 101 99 95
I .44 .41 .62 .49
Cases 107 110 108 103
Note. NI = no intervention group; I = intervention group.
30
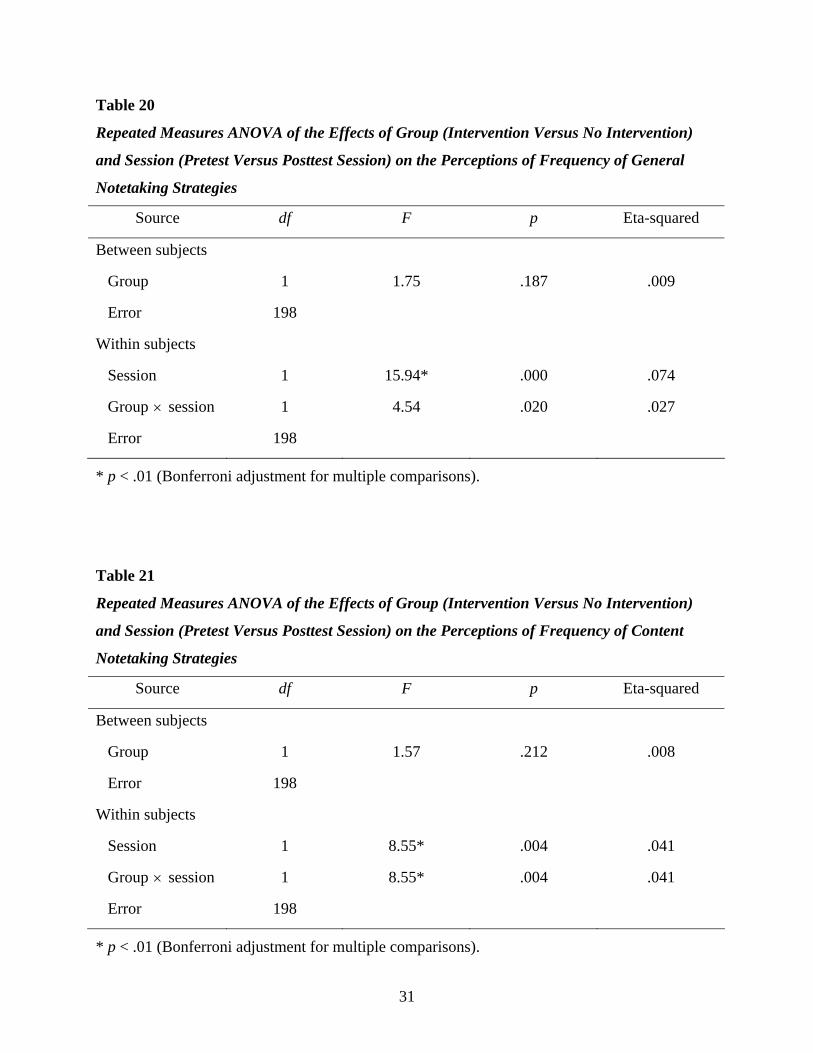
Table 20
Repeated Measures ANOVA of the Effects of Group (Intervention Versus No Intervention)
and Session (Pretest Versus Posttest Session) on the Perceptions of Frequency of General
Notetaking Strategies
Source df F p Eta-squared
Between subjects
Group 1 1.75 .187 .009
Error 198
Within subjects
Session 1 15.94* .000 .074
Group × session 1 4.54 .020 .027
Error 198
* p < .01 (Bonferroni adjustment for multiple comparisons).
Table 21
Repeated Measures ANOVA of the Effects of Group (Intervention Versus No Intervention)
and Session (Pretest Versus Posttest Session) on the Perceptions of Frequency of Content
Notetaking Strategies
Source df F p Eta-squared
Between subjects
Group 1 1.57 .212 .008
Error 198
Within subjects
Session 1 8.55* .004 .041
Group × session 1 8.55* .004 .041
Error 198
* p < .01 (Bonferroni adjustment for multiple comparisons).
31
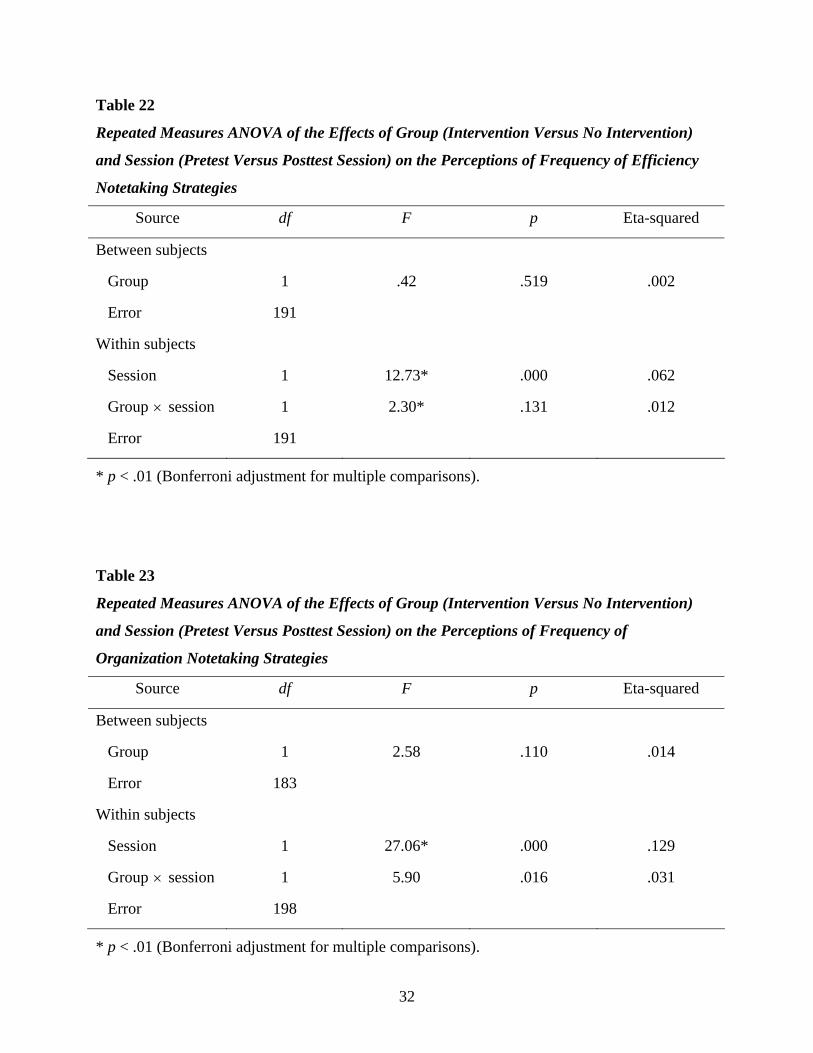
Table 22
Repeated Measures ANOVA of the Effects of Group (Intervention Versus No Intervention)
and Session (Pretest Versus Posttest Session) on the Perceptions of Frequency of Efficiency
Notetaking Strategies
Source df F p Eta-squared
Between subjects
Group 1 .42 .519 .002
Error 191
Within subjects
Session 1 12.73* .000 .062
Group × session 1 2.30* .131 .012
Error 191
* p < .01 (Bonferroni adjustment for multiple comparisons).
Table 23
Repeated Measures ANOVA of the Effects of Group (Intervention Versus No Intervention)
and Session (Pretest Versus Posttest Session) on the Perceptions of Frequency of
Organization Notetaking Strategies
Source df F p Eta-squared
Between subjects
Group 1 2.58 .110 .014
Error 183
Within subjects
Session 1 27.06* .000 .129
Group × session 1 5.90 .016 .031
Error 198
* p < .01 (Bonferroni adjustment for multiple comparisons).
32
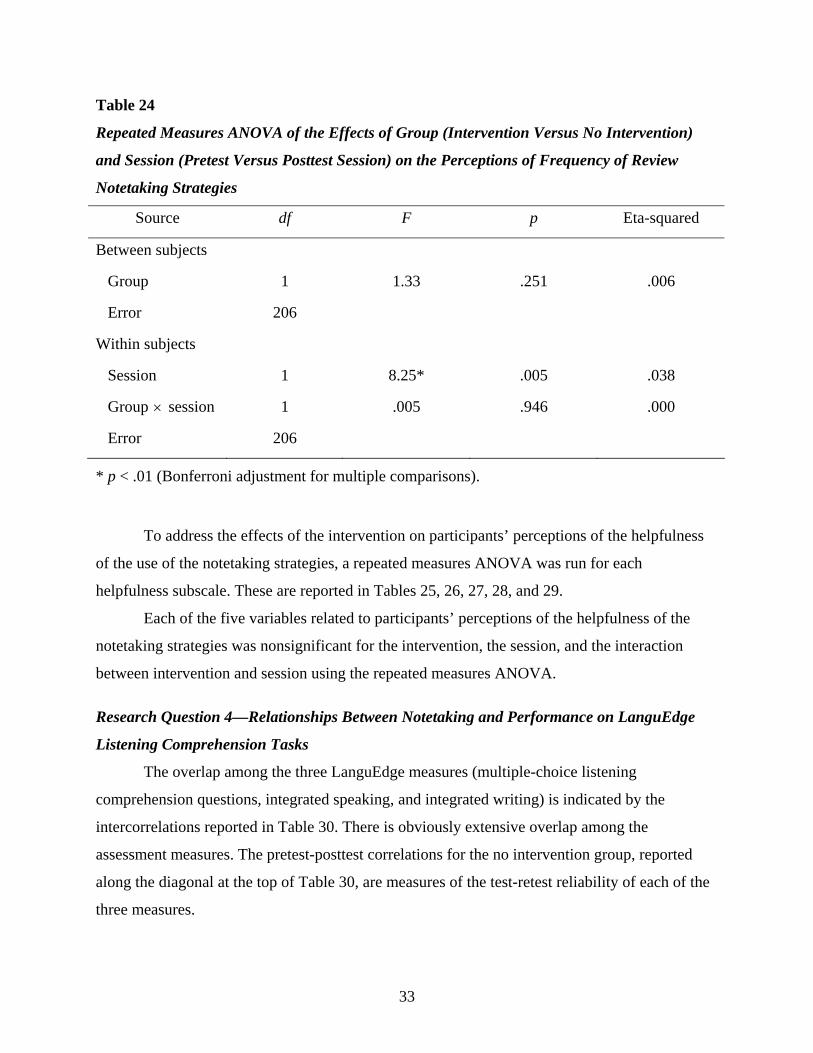
Table 24
Repeated Measures ANOVA of the Effects of Group (Intervention Versus No Intervention)
and Session (Pretest Versus Posttest Session) on the Perceptions of Frequency of Review
Notetaking Strategies
Source df F p Eta-squared
Between subjects
Group 1 1.33 .251 .006
Error 206
Within subjects
Session 1 8.25* .005 .038
Group × session 1 .005 .946 .000
Error 206
* p < .01 (Bonferroni adjustment for multiple comparisons).
To address the effects of the intervention on participants’ perceptions of the helpfulness
of the use of the notetaking strategies, a repeated measures ANOVA was run for each
helpfulness subscale. These are reported in Tables 25, 26, 27, 28, and 29.
Each of the five variables related to participants’ perceptions of the helpfulness of the
notetaking strategies was nonsignificant for the intervention, the session, and the interaction
between intervention and session using the repeated measures ANOVA.
Research Question 4—Relationships Between Notetaking and Performance on LanguEdge
Listening Comprehension Tasks
The overlap among the three LanguEdge measures (multiple-choice listening
comprehension questions, integrated speaking, and integrated writing) is indicated by the
intercorrelations reported in Table 30. There is obviously extensive overlap among the
assessment measures. The pretest-posttest correlations for the no intervention group, reported
along the diagonal at the top of Table 30, are measures of the test-retest reliability of each of the
three measures.
33

Table 25
Repeated Measures ANOVA of the Effects of Group (Intervention Versus No Intervention)
and Session (Pretest Versus Posttest Session) on the Perceptions of Helpfulness of General
Notetaking Strategies
Source df F p Eta-squared
Between subjects
Group 1 1.12 .291 .007
Error 171
Within subjects
Session 1 1.82 .179 .011
Group × session 1 4.60 .033 .026
Error 171
Table 26
Repeated Measures ANOVA of the Effects of Group (Intervention Versus No Intervention)
and Session (Pretest Versus Posttest Session) on the Perceptions of Helpfulness of Content
Notetaking Strategies
Source df F p Eta-squared
Between subjects
Group 1 3.06 .082 .019
Error 162
Within subjects
Session 1 .17 .684 .001
Group × session 1 .08 .782 .000
Error 162
34

Table 27
Repeated Measures ANOVA of the Effects of Group (Intervention Versus No Intervention)
and Session (Pretest Versus Posttest Session) on the Perceptions of Helpfulness of Efficiency
Notetaking Strategies
Source df F p Eta-squared
Between subjects
Group 1 .01 .916 .000
Error 162
Within subjects
Session 1 2.30 .132 .014
Group × session 1 .108 .300 .007
Error 162
Table 28
Repeated Measures ANOVA of the Effects of Group (Intervention Versus No Intervention)
and Session (Pretest versus Posttest Session) on the Perceptions of Helpfulness of
Organization Notetaking Strategies
Source df F p Eta-squared
Between subjects
Group 1 .002 .964 .000
Error 153
Within subjects
Session 1 1.03 .311 .007
Group × session 1 .31 .579 .002
Error 153
35
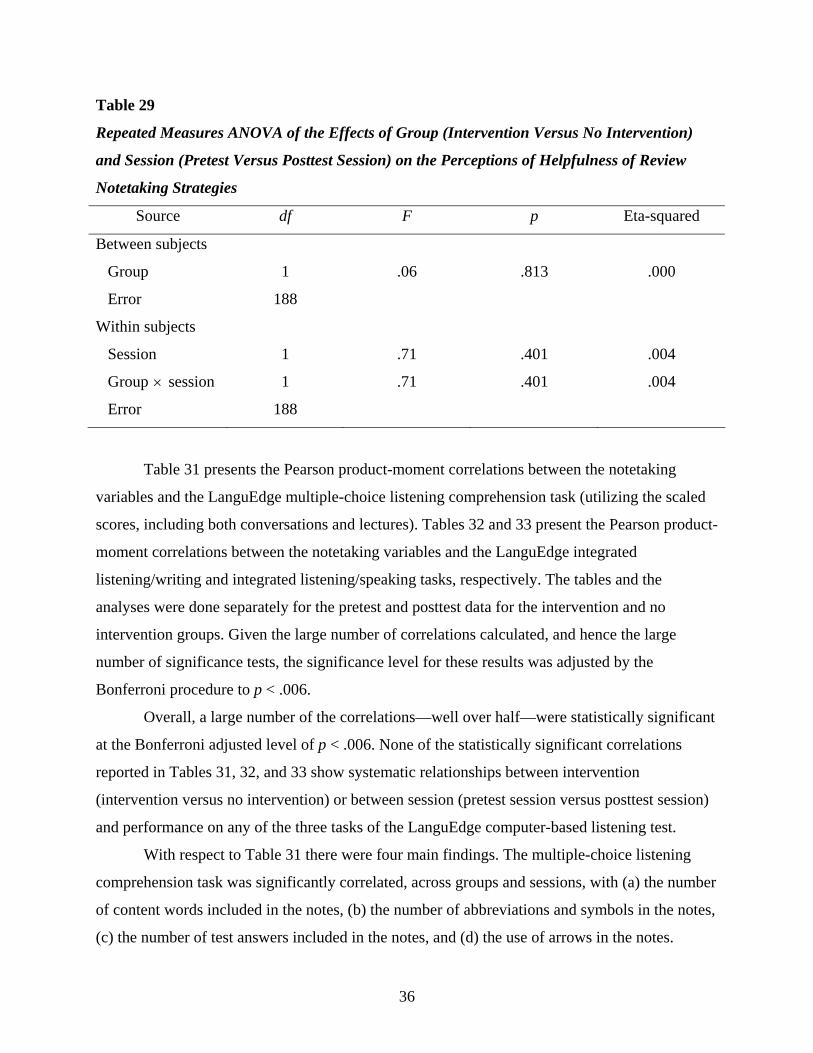
Table 29
Repeated Measures ANOVA of the Effects of Group (Intervention Versus No Intervention)
and Session (Pretest Versus Posttest Session) on the Perceptions of Helpfulness of Review
Notetaking Strategies
Source df F p Eta-squared
Between subjects
Group 1 .06 .813 .000
Error 188
Within subjects
Session 1 .71 .401 .004
Group × session 1 .71 .401 .004
Error 188
Table 31 presents the Pearson product-moment correlations between the notetaking
variables and the LanguEdge multiple-choice listening comprehension task (utilizing the scaled
scores, including both conversations and lectures). Tables 32 and 33 present the Pearson product-
moment correlations between the notetaking variables and the LanguEdge integrated
listening/writing and integrated listening/speaking tasks, respectively. The tables and the
analyses were done separately for the pretest and posttest data for the intervention and no
intervention groups. Given the large number of correlations calculated, and hence the large
number of significance tests, the significance level for these results was adjusted by the
Bonferroni procedure to p < .006.
Overall, a large number of the correlations—well over half—were statistically significant
at the Bonferroni adjusted level of p < .006. None of the statistically significant correlations
reported in Tables 31, 32, and 33 show systematic relationships between intervention
(intervention versus no intervention) or between session (pretest session versus posttest session)
and performance on any of the three tasks of the LanguEdge computer-based listening test.
With respect to Table 31 there were four main findings. The multiple-choice listening
comprehension task was significantly correlated, across groups and sessions, with (a) the number
of content words included in the notes, (b) the number of abbreviations and symbols in the notes,
(c) the number of test answers included in the notes, and (d) the use of arrows in the notes.
36

As Tables 32 and 33 show, the positive correlations for number of content words and
number of test answers with the multiple-choice task, irrespective of the intervention or the
session, were similarly found for the two integrated tasks: listening/writing and
listening/speaking, again consistently across groups and sessions.
Table 30
Overlap Among the LanguEdge Assessment Measures as Evidenced by Intercorrelations, by
Session and by Group
Multiple-
choice
Integrated writing Integrated speaking
No intervention
Multiple-choice .78* .71* .59*
N 106 106 104a
Integrated writing .69* .52* .58*
N 106 106 104a
Integrated speaking .59* .51* .63*
N 105a 105a 103a
Intervention
Multiple-choice .78* .64* .61*
N 110 110 110
Integrated writing .62* .50* .48*
N 110 110 110
Integrated speaking .67* .64* .65*
N 110 110 110
Note. Pretest correlations are above the diagonal; posttest correlations are below the diagonal;
pretest-posttest correlations are along the diagonal. a Two spoken responses on the pretest and one on the posttest were unintelligible due to static
and could not be scored; consequently, they were treated as missing data.
* p < .01 (Bonferroni adjustment for multiple comparisons, one-tailed).
37
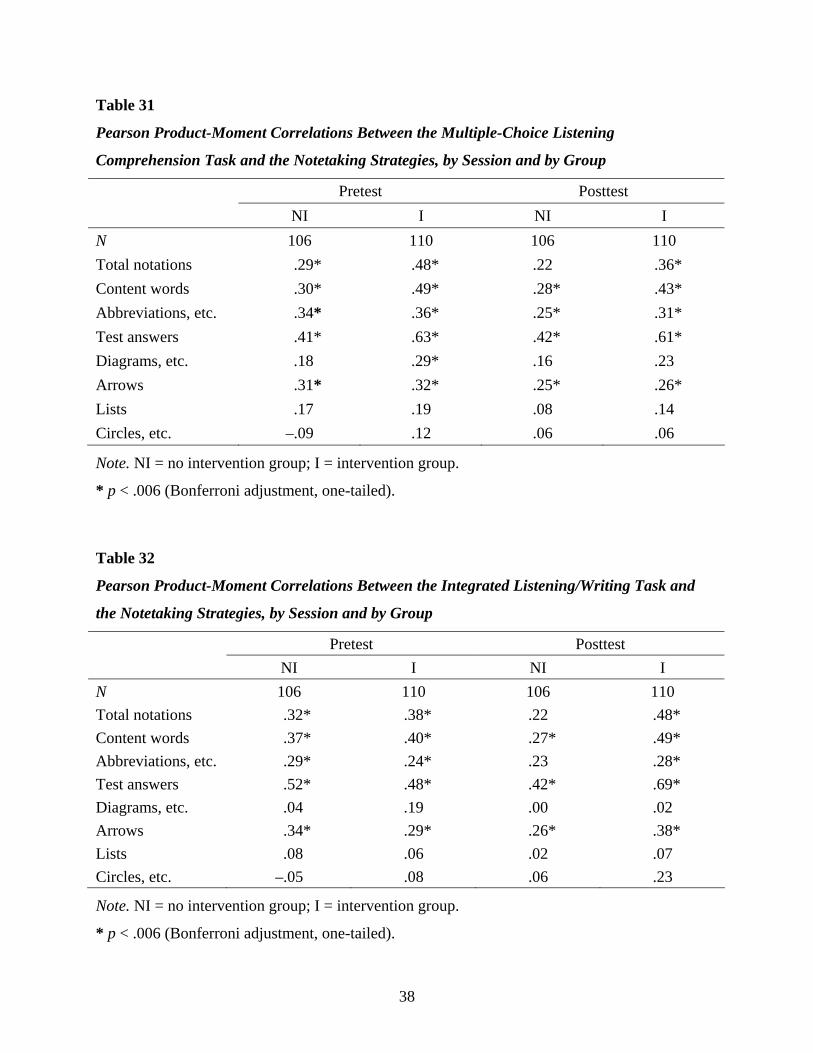
Table 31
Pearson Product-Moment Correlations Between the Multiple-Choice Listening
Comprehension Task and the Notetaking Strategies, by Session and by Group
Pretest Posttest NI I NI I
N 106 110 106 110 Total notations .29* .48* .22 .36* Content words .30* .49* .28* .43* Abbreviations, etc. .34* .36* .25* .31* Test answers .41* .63* .42* .61* Diagrams, etc. .18 .29* .16 .23 Arrows .31* .32* .25* .26* Lists .17 .19 .08 .14 Circles, etc. –.09 .12 .06 .06
Note. NI = no intervention group; I = intervention group.
* p < .006 (Bonferroni adjustment, one-tailed).
Table 32
Pearson Product-Moment Correlations Between the Integrated Listening/Writing Task and
the Notetaking Strategies, by Session and by Group
Pretest Posttest NI I NI I
N 106 110 106 110 Total notations .32* .38* .22 .48* Content words .37* .40* .27* .49* Abbreviations, etc. .29* .24* .23 .28* Test answers .52* .48* .42* .69* Diagrams, etc. .04 .19 .00 .02 Arrows .34* .29* .26* .38* Lists .08 .06 .02 .07 Circles, etc. –.05 .08 .06 .23
Note. NI = no intervention group; I = intervention group.
* p < .006 (Bonferroni adjustment, one-tailed).
38
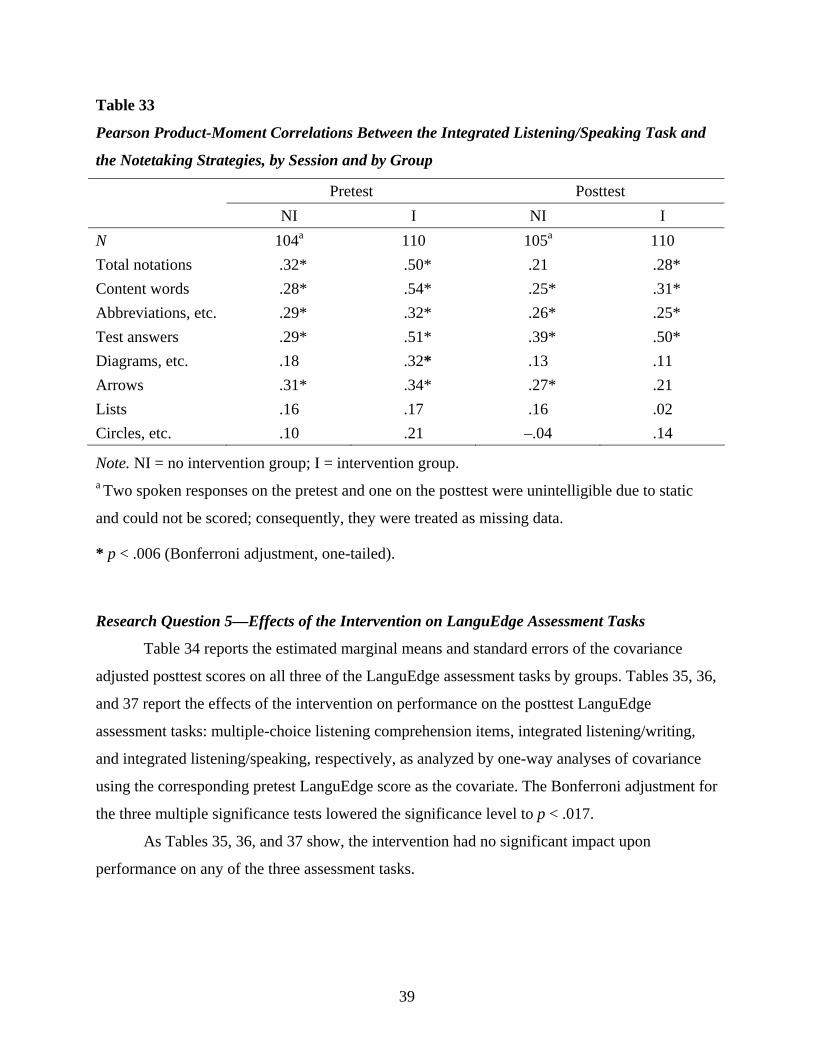
Table 33
Pearson Product-Moment Correlations Between the Integrated Listening/Speaking Task and
the Notetaking Strategies, by Session and by Group
Pretest Posttest NI I NI I
N 104a 110 105a 110 Total notations .32* .50* .21 .28* Content words .28* .54* .25* .31* Abbreviations, etc. .29* .32* .26* .25* Test answers .29* .51* .39* .50* Diagrams, etc. .18 .32* .13 .11 Arrows .31* .34* .27* .21 Lists .16 .17 .16 .02 Circles, etc. .10 .21 –.04 .14
Note. NI = no intervention group; I = intervention group. a Two spoken responses on the pretest and one on the posttest were unintelligible due to static
and could not be scored; consequently, they were treated as missing data.
* p < .006 (Bonferroni adjustment, one-tailed).
Research Question 5—Effects of the Intervention on LanguEdge Assessment Tasks
Table 34 reports the estimated marginal means and standard errors of the covariance
adjusted posttest scores on all three of the LanguEdge assessment tasks by groups. Tables 35, 36,
and 37 report the effects of the intervention on performance on the posttest LanguEdge
assessment tasks: multiple-choice listening comprehension items, integrated listening/writing,
and integrated listening/speaking, respectively, as analyzed by one-way analyses of covariance
using the corresponding pretest LanguEdge score as the covariate. The Bonferroni adjustment for
the three multiple significance tests lowered the significance level to p < .017.
As Tables 35, 36, and 37 show, the intervention had no significant impact upon
performance on any of the three assessment tasks.
39
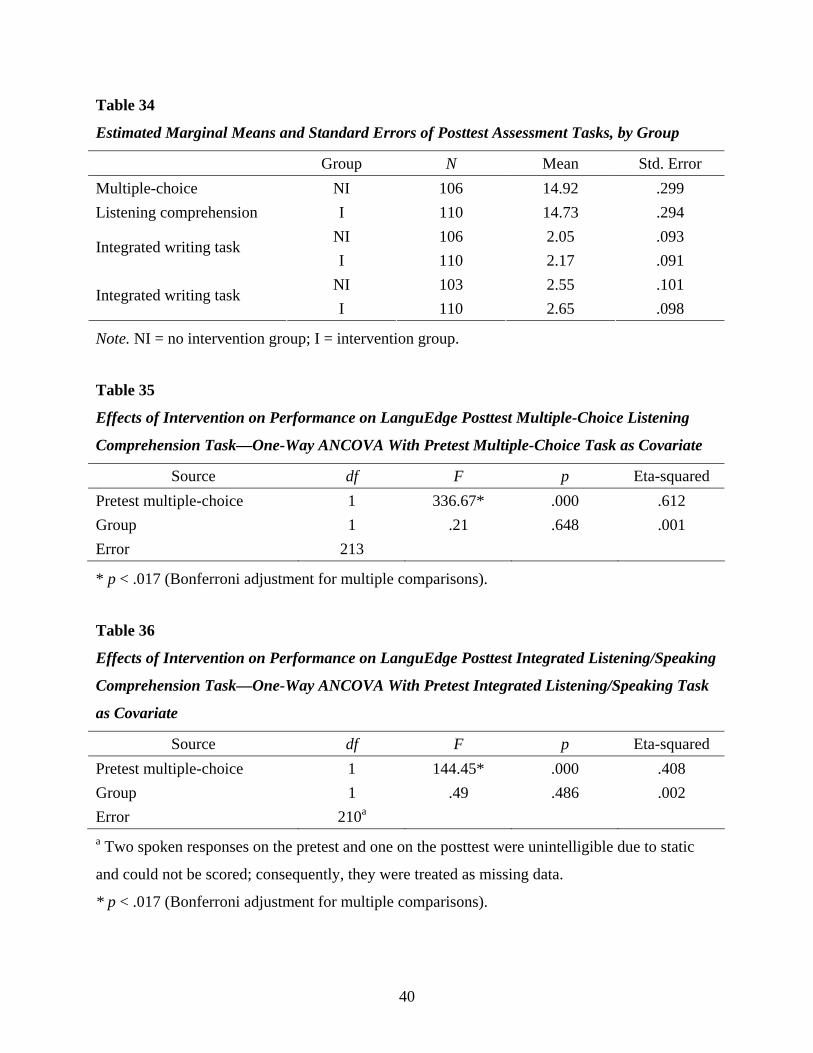
Table 34
Estimated Marginal Means and Standard Errors of Posttest Assessment Tasks, by Group
Group N Mean Std. Error Multiple-choice NI 106 14.92 .299 Listening comprehension I 110 14.73 .294
NI 106 2.05 .093 Integrated writing task
I 110 2.17 .091 NI 103 2.55 .101
Integrated writing task I 110 2.65 .098
Note. NI = no intervention group; I = intervention group.
Table 35
Effects of Intervention on Performance on LanguEdge Posttest Multiple-Choice Listening
Comprehension Task—One-Way ANCOVA With Pretest Multiple-Choice Task as Covariate
Source df F p Eta-squared Pretest multiple-choice 1 336.67* .000 .612 Group 1 .21 .648 .001 Error 213
* p < .017 (Bonferroni adjustment for multiple comparisons).
Table 36
Effects of Intervention on Performance on LanguEdge Posttest Integrated Listening/Speaking
Comprehension Task—One-Way ANCOVA With Pretest Integrated Listening/Speaking Task
as Covariate
Source df F p Eta-squared Pretest multiple-choice 1 144.45* .000 .408 Group 1 .49 .486 .002 Error 210a a Two spoken responses on the pretest and one on the posttest were unintelligible due to static
and could not be scored; consequently, they were treated as missing data.
* p < .017 (Bonferroni adjustment for multiple comparisons).
40
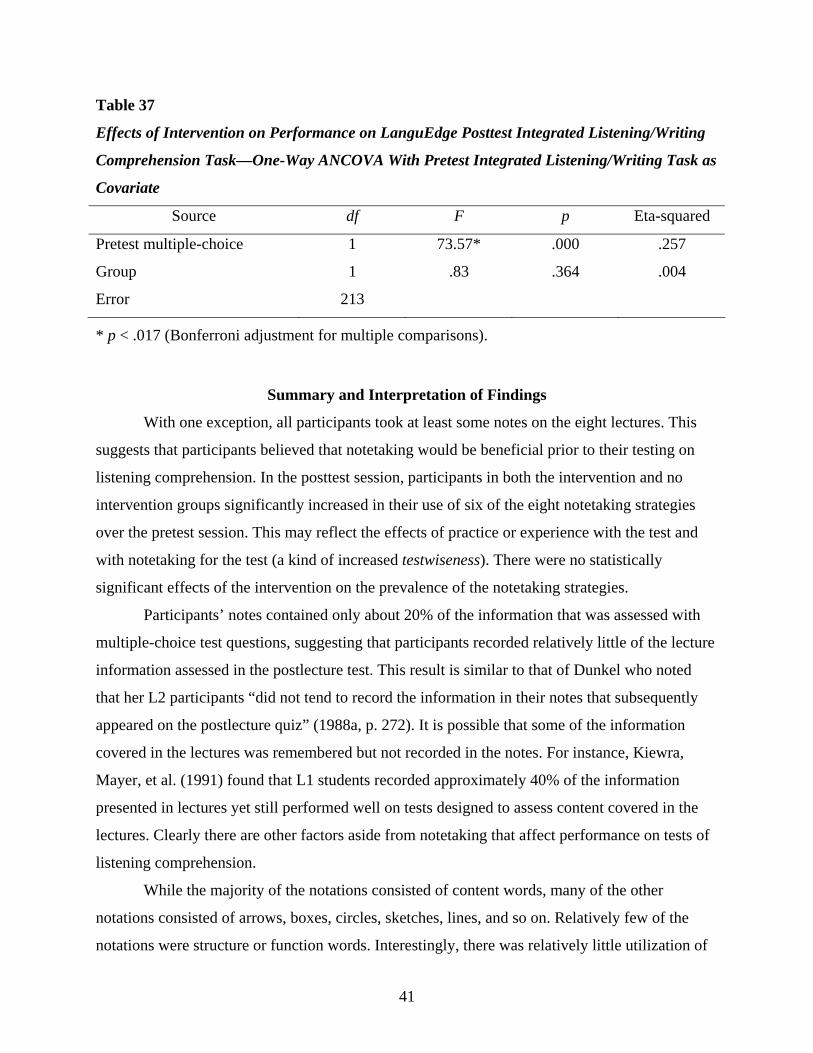
Table 37
Effects of Intervention on Performance on LanguEdge Posttest Integrated Listening/Writing
Comprehension Task—One-Way ANCOVA With Pretest Integrated Listening/Writing Task as
Covariate
Source df F p Eta-squared
Pretest multiple-choice 1 73.57* .000 .257
Group 1 .83 .364 .004
Error 213
* p < .017 (Bonferroni adjustment for multiple comparisons).
Summary and Interpretation of Findings
With one exception, all participants took at least some notes on the eight lectures. This
suggests that participants believed that notetaking would be beneficial prior to their testing on
listening comprehension. In the posttest session, participants in both the intervention and no
intervention groups significantly increased in their use of six of the eight notetaking strategies
over the pretest session. This may reflect the effects of practice or experience with the test and
with notetaking for the test (a kind of increased testwiseness). There were no statistically
significant effects of the intervention on the prevalence of the notetaking strategies.
Participants’ notes contained only about 20% of the information that was assessed with
multiple-choice test questions, suggesting that participants recorded relatively little of the lecture
information assessed in the postlecture test. This result is similar to that of Dunkel who noted
that her L2 participants “did not tend to record the information in their notes that subsequently
appeared on the postlecture quiz” (1988a, p. 272). It is possible that some of the information
covered in the lectures was remembered but not recorded in the notes. For instance, Kiewra,
Mayer, et al. (1991) found that L1 students recorded approximately 40% of the information
presented in lectures yet still performed well on tests designed to assess content covered in the
lectures. Clearly there are other factors aside from notetaking that affect performance on tests of
listening comprehension.
While the majority of the notations consisted of content words, many of the other
notations consisted of arrows, boxes, circles, sketches, lines, and so on. Relatively few of the
notations were structure or function words. Interestingly, there was relatively little utilization of
41

abbreviations or symbols and virtually no use of paraphrasing. Participants generally wrote
down, in full spelling, content words used by the lecturer. In that sense their notes reflected little
efficiency. Some of the notations were in the participants’ native or other language. One
participant’s notes used not only English, but also some Chinese and Spanish.
Most participants organized their notes using an unmarked strategy, simply following the
linear order of the lecture. Because of the overwhelming prevalence of this strategy and its
default nature, it was not included in the analysis. Of the marked organizational strategies
included in the analysis, participants organized their notes by linking information from the
lecture with arrows; infrequently they used other organizational devices such as diagrams,
indentations, outlining, or lists.
Participants emphasized particular information from the lecture with circles, boxes, and
underlining. However, this study did not investigate whether the use of these emphatic devices
correctly reflected recognition of the important or salient information from the lecture. That issue
warrants further research.
Students perceived that notetaking strategies related to the content of the notes were used
most frequently and were the most helpful to them. The next most frequently utilized and helpful
notetaking strategies were those related to the efficiency of notes and review of notes. Strategies
involving the organization of the notes were reported as least frequently used and least helpful.
This finding corroborates the unmarked organizational notetaking strategy used by most
participants.
In both the intervention and no intervention groups, participants’ perceptions of the
frequency of their use of notetaking strategies increased statistically significantly between
sessions. In both groups, participants’ perceptions of the helpfulness of the notetaking strategies
did not change significantly between sessions. The intervention had no effect on either
participants’ perceptions of frequency of use or their perception of the helpfulness of the
notetaking strategies. Interestingly, participants from both groups demonstrated greater use of
notetaking strategies from the pretest session to the posttest session, yet they did not report that
these strategies were helpful.
Relationships between notetaking strategies and performance on the three LanguEdge
assessment tasks are complex, depending upon the notetaking strategy and the task. Positive
correlations were found between the number of total notations and task performance, but not
42

consistently across groups and sessions. Liu (2001) included this measure [total notations] but
did not find significant results with it, whereas Dunkel (1988a) found total words (the sum of
words, symbols, abbreviations) to be inversely related to listening comprehension test
performance.
The positive correlation between the number of abbreviations and multiple-choice
listening comprehension replicates findings by Faraco et al. (2002) and Liu (2001;in the Liu
study, he called his measure words in full spelling, the opposite of abbreviation, which was
negatively related to test performance.)
The positive correlation between the number of test answers in the notes and multiple-
choice listening comprehension contrasts with results found by Dunkel (1988a) who obtained
insignificant correlations between test answerability and multiple-choice test performance on
either general or detail-specific questions. A possible explanation of this difference may be that
Dunkel’s study used only one lecture, which was considerably longer than each of the four
lectures in this study, and that Dunkel’s participants did not have access to their notes during
question-answering.
The significant correlation between the use of arrows and multiple-choice listening
comprehension appears to be unique to this study as previous research has not reported such a
relationship. The notetaking strategies that most consistently correlate with performance on all
three of the LanguEdge assessment tasks are number of content words and number of test
answers found in the notes. The brief, uninstructed intervention had no significant effect on
performance on any of the posttest LanguEdge tasks. More predictive of posttest performance
was pretest performance.
Discussion—Implications for the Field
The current study has contributed important information to our knowledge of notetaking
by second language learners during lecture-listening for the purposes of listening comprehension
testing and other communicative assessment tasks, such as writing and speaking in response to
listening. In addition to variables investigated in previous studies, new variables were included to
expand our understanding of the content and quality of second language listening comprehension
examinees’ notes.
Under test conditions where they will be tested immediately on the content, second
language listening notetakers tend to take down the content words used by the lecturer, doing
43
little abbreviating or symbolizing and virtually no paraphrasing. While they tend to use other
types of notations, including words in their native or another language, the good news is that they
tend not to write down English function or structure words, many of which are predictable from
context. If they attempt at all to organize their notes in a marked fashion, rather than use
diagrams or indentations or other visual indicators of organization, they tend to use arrows
linking ideas in the notes. They make little use of lists, but attempt to signal emphasized
information by underlining particular words or using circles or boxes around particular words. In
short, second language examinees’ notes reflect some, but not extensive, use of notetaking
strategies related to notetaking efficiency and organization.
The use of content words from the lecture, whether in full spelling or abbreviated or
symbolized, is a notetaking strategy significantly correlated with listening comprehension as
measured by multiple-choice measures, as well as with other communicative assessment tasks,
such as writing or speaking in response to listening. This is a strategy to be strongly encouraged
for notetaking during lecture-listening. Using abbreviations and symbols is an efficient
notetaking strategy. However, this efficiency strategy only works when the listener remembers
what the abbreviation or symbol stands for, or only when the listener correctly paraphrases the
information. This is an important corollary to always include with advice regarding the use of
such efficiency strategies.
This study included abbreviations, symbols, and paraphrases in the same category. As
was noted earlier, while participants made little use of abbreviations and symbols, they made
even less use of paraphrases. This may have been a wise decision on their part, given the results
of Faraco et al. (2002), who found that reformulations with words other than those produced by
the lecturer were negatively correlated with listening comprehension test performance. Second
language listening comprehension examinees may find attempting to paraphrase or reformulate
the lecturer’s words too cognitively demanding when taking notes under time constraints and for
immediate testing purposes. Thus, paraphrasing and reformulating, while representing a type of
notetaking efficiency, should not be strongly encouraged for second language examinees.
The significant relationship between number of test answers found in the notes and
performance on the various assessment tasks suggests that those who were able to write down
more information relevant to the tasks were also the ones who scored better on the tasks. Writing
down or not writing down the information is probably a matter of proficiency with both listening
44
and with notetaking. The most significant implication here is that teachers preparing students for
listening tests involving notetaking might do well to provide lots of practice so that students get
used to taking notes to increase their ability to write and listen at the same time.
At the same time, those who test L2 listening comprehension should be aware of the
additional cognitive load that notetaking during listening may place on second language
examinees. Even highly proficient L2 learners may find the simultaneous cognitive tasks of
comprehending the incoming lecture and producing effective, efficient, and well-organized notes
cognitively overloading. Even highly proficient L2 learners may not be able to process the L2
with the level of automaticity (e.g., in word recognition) as native speakers (Segalowitz &
Segalowitz, 1993). Therefore, much of their cognitive processing and working memory capacity
must be devoted to controlled, effortful comprehension processing. They may also be less able to
transfer their L1 notetaking skills, and they may be less well trained in applying notetaking skills
with efficiency in the second or foreign language. It may be unrealistic to expect any but the
most advanced L2 learners to produce quality notes in the face of the listening comprehension
processing they must undertake with limited controlled processing capacity.
A brief instructional overview, such as the one used in this study, provided to examinees
immediately prior to listening and testing, without the opportunity of discussion or practice,
appears to have little or no effect on either the notetaking strategies used by examinees or on
their test performance. For better or worse, in such testing situations, second language listening
examinees seem to have already formed their notetaking strategies and may be little affected by
information presented in a brief set of guidelines prior to testing. A brief intervention in
notetaking strategies immediately preceding testing might not be successful for L2 learners
because their problem in a listening-for-testing situation is with managing both the listening and
the writing at the same time, not simply accessing useful strategies.
Discussion—Implications for TOEFL
Specific implications for TOEFL, beyond those for the field in general, follow.
Given the results of Faraco et al. (2002) regarding reformulations, it is recommended that
future research consider paraphrase as a separate category from abbreviations and symbols. As
stated above, although it represents a kind of notetaking efficiency, paraphrasing may be a type
of reformulation that so significantly increases cognitive load that L2 listeners may be wise not
to attempt paraphrasing or reformulating when taking notes under time constraints and for
45
immediate TOEFL testing purposes. Thus, whatever guidelines that TOEFEL may provide for
examinees should take care not to overemphasize paraphrasing or reformulating the lecturer’s
words, but encourage the use of abbreviations and symbols (as long as the notetaker remembers
the original meaning).
TOEFL notetakers will have to cope with the dual cognitive tasks of taking notes while
listening for testing purposes, along with the fact of their less-than-native competence in English
as a foreign/second language. They may not be able to internalize and become adept at new
notetaking strategies presented to them in a brief guideline prior to their taking a test. Therefore,
it may also be wise for TOEFL notetaking guidelines to include statements encouraging
examinees to use whatever notetaking strategies have worked for them in the past. This would
include both the possibility of taking no notes, for those who need to concentrate on listening and
understanding the lecture or who feel that they can understand and remember the lecture well
without the aid of notetaking, as well as the possibility of taking notes, for those who find
notetaking a helpful aid in remembering the information in the lecture.
46
References
Armel, D., & Shrock, S. (1996). The effects of required and optional computer-based notetaking
on achievement and instructional completion time. Journal of Educational Computing
Research, 14, 329-344.
Barnett, J. E., DiVesta, F. J., & Rogozinski, J. (1981). What is learned in note taking? Journal of
Educational Psychology, 73, 181-192.
Benson, M. (1994). Lecture learning in an ethnographic perspective. In J. Flowerdew (Ed.),
Academic listening: Research perspectives (pp. 181-198). New York: Cambridge
University Press.
Bilbow, G. T. (1989). Towards an understanding of overseas students’ difficulties in lectures: A
phenomenographic approach. Journal of Further and Higher Education, 3, 85-99.
Carrell, P. L., Dunkel, P. A., & Mollaun, P. (2002). The effects of notetaking, lecture length and
topic on the listening component of the TOEFL 2000 (TOEFL Monograph Series No.
MS-23). Princeton, NJ: ETS.
Carrell, P. L., Dunkel, P. A., & Mollaun, P. (2004). The effects of notetaking, lecture length and
topic on a computer-based test of ESL listening comprehension. Applied Language
Learning, 14, 83-105.
Chaudron, C., Cook, J., & Loschky, L. (1988). Quality of lecture notes and second language
listening comprehension (Tech. Rep. No. 7). Honolulu: University of Hawaii at Manoa,
Center for Second Language Classroom Research.
Chaudron, C., Loschky, L., & Cook, J. (1994). Second language listening comprehension and
lecture notetaking. In J. Flowerdew (Ed.), Academic listening: Research perspectives (pp.
75-92). New York: Cambridge University Press.
Clerehan, R. (1995). Taking it down: Notetaking practices of L1 and L2 students. English for
Specific Purposes, 14, 137-155.
Cohen, J. (1960). Coefficient of agreement for nominal scales. Educational and Psychological
Measurement, 20, 37-46,
Cohen, J. (1968). Weighted kappa: Nominal scale agreement with provision for scaled
disagreement or partial credit. Psychological Bulletin, 70, 213-220.
Cohn, E., Cohn, S., & Bradley, J. (1995). Notetaking, working memory, and learning in
principles of economics. Research in Economic Education, 26, 291-307.
47
Cushing, S. T. (1991). A qualitative approach to the study of notetaking in UCLA's English as a
second language placement examination. Unpublished manuscript, University of
California, Los Angeles.
Cushing, S. T. (1993. April). L2 proficiency, academic status, and lecture note content. Paper
presented at TESOL, Atlanta, GA.
Dunkel, P. (1985). The immediate recall of English lecture information by native and non-native
speakers of English as a function of notetaking. Unpublished doctoral dissertation,
University of Arizona, Tucson.
Dunkel, P. (1988a). The content of L1 and L2 students’ lecture notes and its relation to test
performance. TESOL Quarterly, 22, 259-281.
Dunkel, P. (1988b). Academic listening and lecture notetaking for L1/L2 students: The need to
investigate the utility of the axioms of good notetaking. TESL Canada Journal/Revue
TESL du Canada, 6, 11-26.
Dunkel, P., & Davy, S. (1989). The heuristic of lecture notetaking: Perceptions of American and
international students regarding the value & practice of notetaking. English for Specific
Purposes, 8, 33-50.
ETS. (2002a). Teacher’s guide: LanguEdge courseware. Princeton, NJ: Author.
ETS. (2002b). Score interpretation guide: LanguEdge courseware. Princeton, NJ: Author.
ETS. (2002c). Handbook for scoring speaking and writing: LanguEdge courseware. Princeton,
NJ: Author.
Faraco, M., Barbier, M-L., & Piolat, A. (2002). A comparison between notetaking in L1 and L2
by undergraduate students. In S. Ransdell & M. Barbier (Eds.), Studies in writing,
Volume 11: New directions for research in L2 writing (pp. 145-167). The Netherlands:
Kluwer Academic Publishers.
Fisher, J. L., & Harris, M. B. (1973). Effect of note taking and review on recall. Journal of
Educational Psychology, 65, 321-325.
Fleiss, J. L. (1981). Statistical methods for rates and proportions. (2nd ed.). New York: John
Wiley & Sons, Inc.
Fleiss, J. L., Cohen, J., & Everitt, B. S. (1969). Large sample standard errors of kappa and
weighted kappa. Psychological Bulletin, 72, 323-327.
48

Fleiss, J. L., Levin, B., & Paik, M. C., (2003). Statistical methods for rates and proportions (3rd
ed.). Hoboken, NJ: Wiley-Interscience.
Flowerdew, J., & Miller, L. (1992). Student perceptions, problems and strategies in L2 lectures.
RELC Journal, 32, 60-80.
Flowerdew, J., & Miller, L. (1995). On the notion of culture in L2 lectures. TESOL Quarterly,
29, 345–373.
Frequently asked questions about the Internet-based test. (n.d.). Retrieved from the ETS Web
site July 26, 2006, at
http://www.ets.org/portal/site/ets/menuitem.1488512ecfd5b8849a77b13bc3921509/?vgne
xtoid=f969af5e44df4010VgnVCM10000022f95190RCRD&vgnextchannel=5296197a48
4f4010VgnVCM10000022f95190RCRD
Hale, G., & Courtney, R. (1994). The effect of notetaking on listening comprehension in the Test
of English as a Foreign Language. Language Testing, 11, 29-47.
Kiewra, K. A. (1983). The relationship between note-taking over an extended period and actual
course-related achievement. College Student Journal, 17, 381-385.
Kiewra, K. A. (1987). Notetaking and review: The research and its implications. Instructional
Science, 16, 233-249.
Kiewra, K. A. (1989). A review of note-taking: The encoding-storage paradigm and beyond.
Educational Psychology Review, 1, 147-172.
Kiewra, K. A., Benton, S. L., Kim, S-I., Risch, N., & Christensen, M. (1995). Effects of note-
taking format and study technique on recall and relational performance. Contemporary
Educational Psychology, 20, 172-187.
Kiewra, K. A., DuBois, N. F., Christensen, M., Kim, S.-I., & Lindberg, N. (1989). A more
equitable account of the note-taking function in learning from lectures and from text.
Instructional Science, 18, 217-232.
Kiewra, K. A., Mayer, R. E., Christensen, M., Kim, S.-I., & Risch, N. (1991). Effects of
repetition on recall and note-taking: Strategies for learning from lectures. Journal of
Educational Psychology, 83, 120-123.
Kirk, R. E. (1996). Practical significance: A concept whose time has come. Educational and
Psychological Measurement, 56, 746-759.
49

Landis, J. D., & Koch, G. G. (1977). The measurement of observer agreement for categorical
data. Biometrics, 33, 159-174.
Liu, Y. (2001). A cognitive study on the functions of note-taking and the content of notes taken in
a context of Chinese EFL learners. Unpublished master’s thesis, Guangdong University
of Foreign Studies, Guangdong, People’s Republic of China.
Segalowitz, N. S., & Segalowitz, S. J. (1993). Skilled performance, practice, and the
differentiation of speed-up from automatization effects: Evidence from second language
word recognition. Applied Psycholinguistics, 14, 369-85.
Wilkinson, L. (1999). Statistical methods in psychology journals: Guidelines and explanations.
American Psychologist, 54, 594-604.
50
Notes
1 At GSU, where another recently administered TOEFL study had paid participants $100 for 7–8
hours testing time, it was not possible to recruit participants for the original $25 gift
certificates. Therefore, all GSU participants were recruited on the basis of a $50 gift
certificate, with the understanding that they would perform their best on all segments of the
study. No bonus was given to GSU participants for posttest multiple-choice scores equaling or
exceeding the pretest multiple-choice scores, as was done at the other participating
institutions. There is no evidence that GSU’s participants behaved in any way dissimilar to
participants at the other institutions.
2 It should be noted that these categories ignore default types of organization (e.g., linear
ordering of notes reflecting the linear order of the information presented in the lecture or
spatially representing information). These were ignored because they were either reflected in
everyone’s notes (the former) or impossible to quantify (the latter).
3 The detailed guidelines used by the raters in performing the content analysis of the notes are
available from the researcher.
4 Ratings were pooled across lectures, groups, and sessions in the analyses of rater reliability;
hence an N-size of 1,728 notes/lectures (216 × 4 × 2).
51
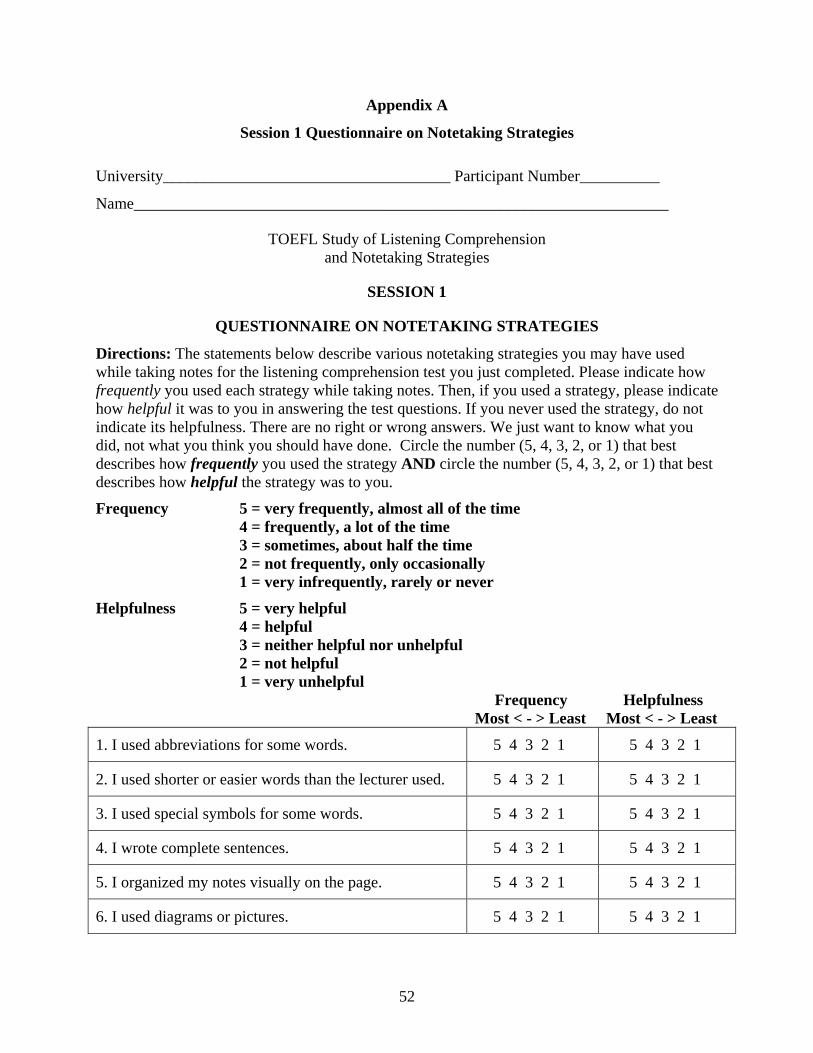
Appendix A
Session 1 Questionnaire on Notetaking Strategies
University____________________________________ Participant Number__________
Name___________________________________________________________________
TOEFL Study of Listening Comprehension and Notetaking Strategies
SESSION 1
QUESTIONNAIRE ON NOTETAKING STRATEGIES
Directions: The statements below describe various notetaking strategies you may have used while taking notes for the listening comprehension test you just completed. Please indicate how frequently you used each strategy while taking notes. Then, if you used a strategy, please indicate how helpful it was to you in answering the test questions. If you never used the strategy, do not indicate its helpfulness. There are no right or wrong answers. We just want to know what you did, not what you think you should have done. Circle the number (5, 4, 3, 2, or 1) that best describes how frequently you used the strategy AND circle the number (5, 4, 3, 2, or 1) that best describes how helpful the strategy was to you.
Frequency 5 = very frequently, almost all of the time 4 = frequently, a lot of the time 3 = sometimes, about half the time 2 = not frequently, only occasionally 1 = very infrequently, rarely or never
Helpfulness 5 = very helpful 4 = helpful 3 = neither helpful nor unhelpful 2 = not helpful 1 = very unhelpful Frequency Helpfulness Most < - > Least Most < - > Least
1. I used abbreviations for some words. 5 4 3 2 1 5 4 3 2 1
2. I used shorter or easier words than the lecturer used. 5 4 3 2 1 5 4 3 2 1
3. I used special symbols for some words. 5 4 3 2 1 5 4 3 2 1
4. I wrote complete sentences. 5 4 3 2 1 5 4 3 2 1
5. I organized my notes visually on the page. 5 4 3 2 1 5 4 3 2 1
6. I used diagrams or pictures. 5 4 3 2 1 5 4 3 2 1
52

Frequency Most < - > Least
Helpfulness Most < - > Least
7. I used outlining. 5 4 3 2 1 5 4 3 2 1
8. I used content words (nouns, verbs, adjectives, adverbs) and omitted function words (words like of, to, the).
5 4 3 2 1 5 4 3 2 1
9. I used numbering. 5 4 3 2 1 5 4 3 2 1
10. I used lists. 5 4 3 2 1 5 4 3 2 1
11. I used arrows. 5 4 3 2 1 5 4 3 2 1
12. I used ways to highlight particularly important information (e.g., circles, underlining).
5 4 3 2 1 5 4 3 2 1
13. I used neat handwriting. 5 4 3 2 1 5 4 3 2 1
14. I separated different ideas from each other. 5 4 3 2 1 5 4 3 2 1
15. I wrote down unconnected words. 5 4 3 2 1 5 4 3 2 1
16. I wrote down the lecturer’s main points. 5 4 3 2 1 5 4 3 2 1
17. I wrote down important details about each main point.
5 4 3 2 1 5 4 3 2 1
18. I wrote down important facts, numbers, and names that would be difficult to remember without my notes.
5 4 3 2 1 5 4 3 2 1
19. I wrote down the lecturer’s jokes and irrelevant comments.
5 4 3 2 1 5 4 3 2 1
20. I tried to write down everything the lecturer said.
5 4 3 2 1 5 4 3 2 1
21. I reviewed my notes after the lecture to be sure I understood the lecture.
5 4 3 2 1 5 4 3 2 1
22. I used my notes to answer test questions. 5 4 3 2 1 5 4 3 2 1
End of Questionnaire—READ IMPORTANT INFORMATION ON NEXT PAGE
53

PLEASE NOTE FOR THE NEXT TEST: IF YOUR PERFORMANCE ON THE NEXT TEST IS THE SAME OR BETTER THAN YOUR PERFORMANCE ON THE FIRST TEST, YOU WILL RECEIVE AN ADDITIONAL $25, OR A TOTAL OF $50. IF YOUR PERFORMANCE ON THE SECOND TEST IS NOT AS GOOD OR BETTER, YOU WILL RECEIVE ONLY THE BASIC $25.
54
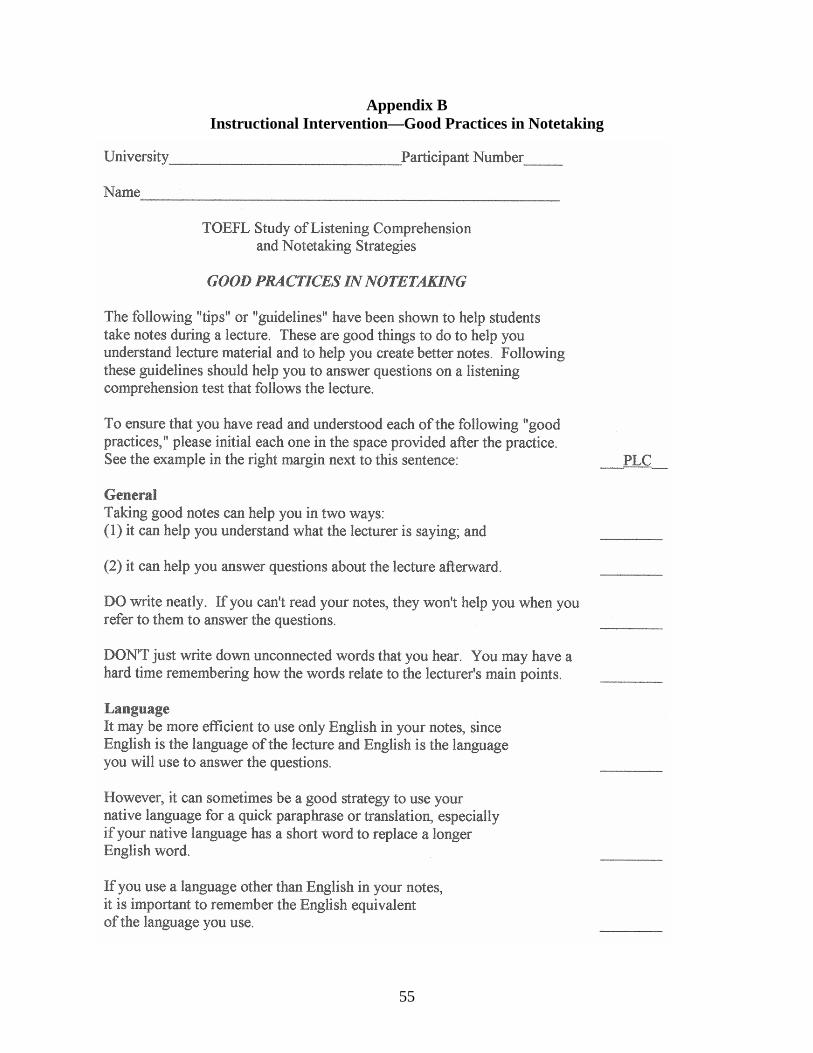
Appendix B Instructional Intervention—Good Practices in Notetaking
55
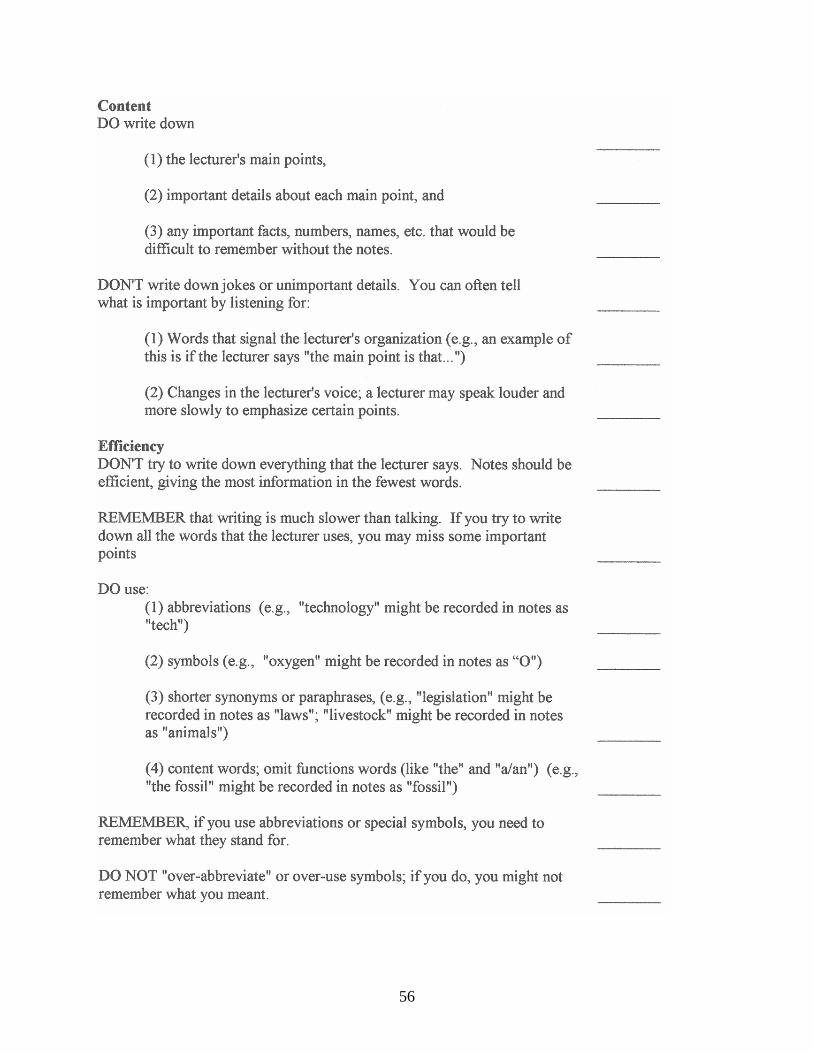
56

57
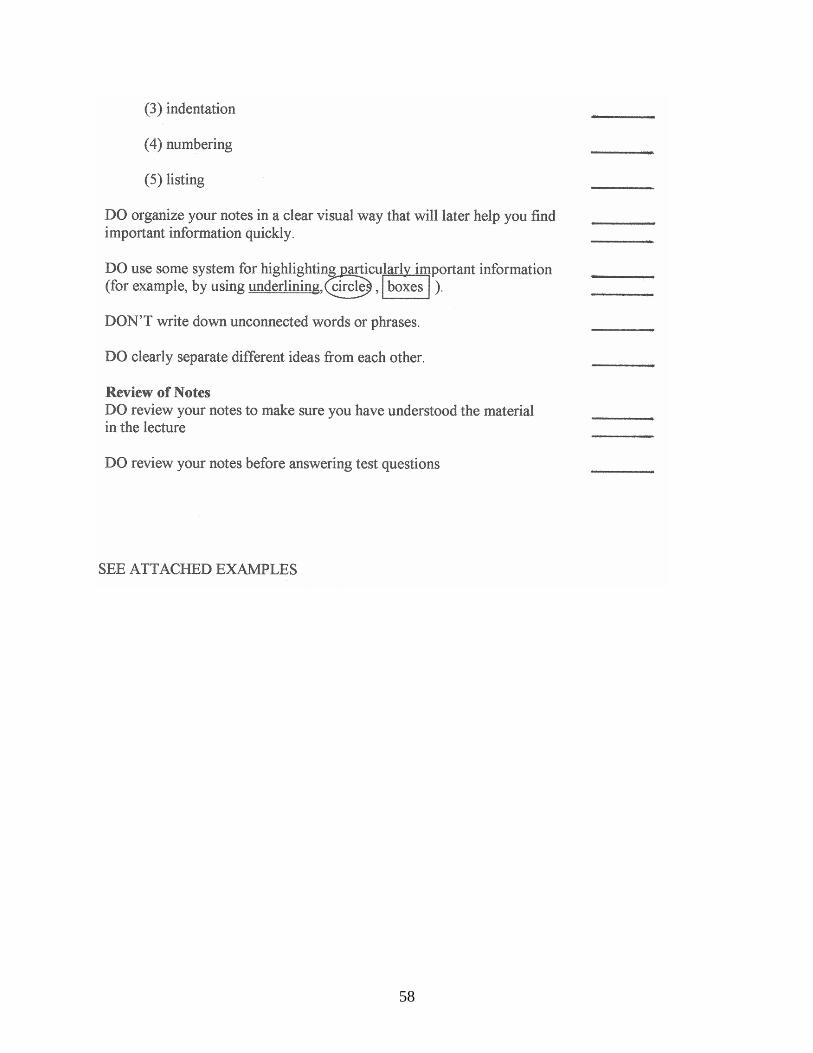
58
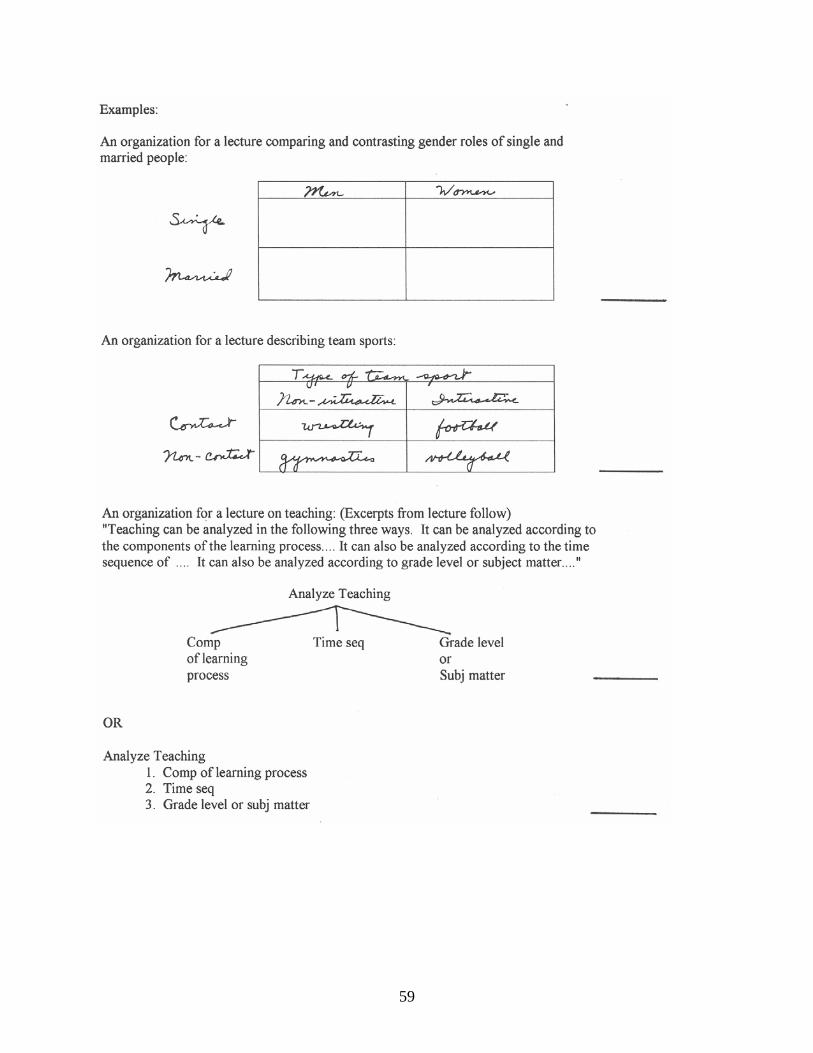
59
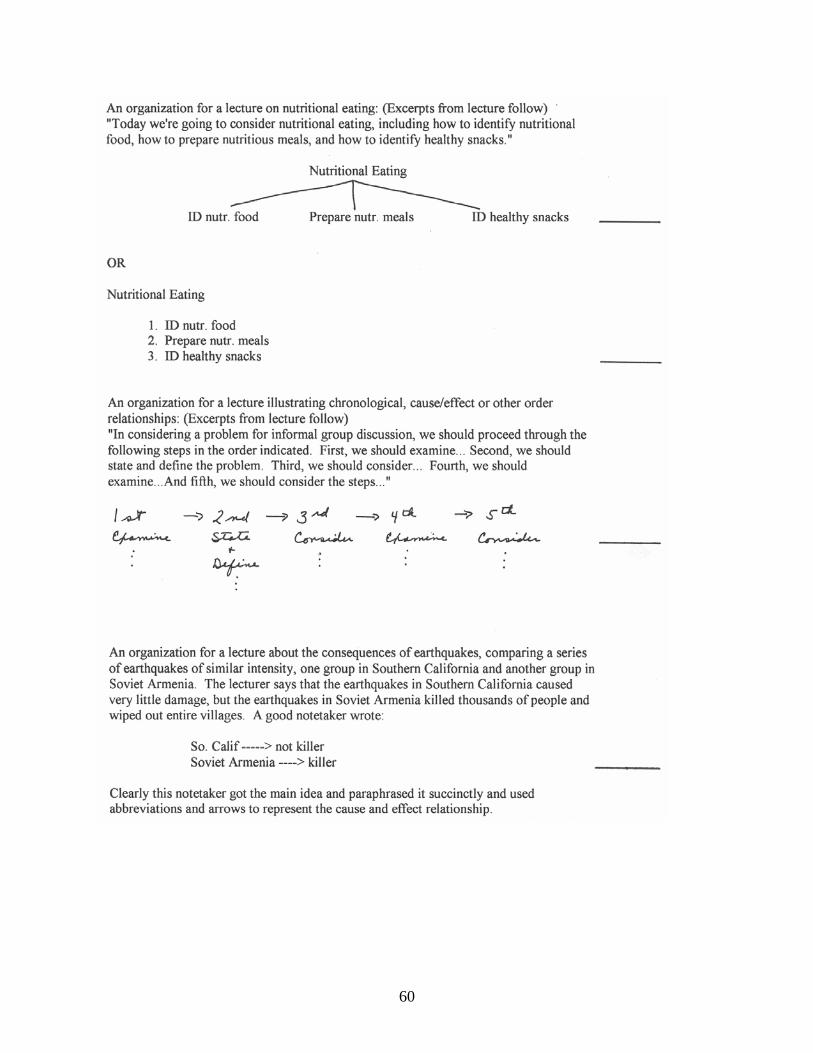
60
