notes to the consolidated financial statements - waha...
TRANSCRIPT
Notes to the Consolidated Financial Statements
1 Legal status and principal activities
Al Waha Capital PJSC (the “Company”) is a public joint stock company with limited liability, formed in the Emirate of Abu Dhabi, United Arab Emirates, by Emiri Decree No. 10 dated 20 May 1997 and incorporated on 12 July 1997.
These consolidated financial statements comprise the results and financial position of the Company and its subsidiaries (collectively referred to as the “Group”) and the Group’s interest in associates and jointly controlled entities (“equity accounted associates and joint ventures”).
The Group invests in a wide range of sectors, including aviation leasing, financial services, capital markets, maritime, industrial real estate, infrastructure, healthcare and oil and gas.
The Company has amended its Articles of Association and corporate governance procedures to ensure that it complies with the provisions of the UAE Federal Law No. 2 of 2015 (“Companies Law”), which came into force on 1 July 2015.
2 Basis of preparation
(a) Statement of complianceThe consolidated financial statements have been prepared in accordance with International Financial Reporting Standards (IFRS).
(b) Basis of measurementThe consolidated financial statements have been prepared on the historical cost basis except for investment property and certain financial instruments that are measured at fair value at the end of each reporting period, as explained in the accounting policies below.
Historical cost is generally based on the fair value of the consideration given in exchange for goods and services.
Fair value is the price that would be received to sell an asset or paid to transfer a liability in an orderly transaction between market participants at the measurement date, regardless of whether that price is directly observable or estimated using another valuation technique. In estimating the fair value of an asset or a liability, the Group takes into account the characteristics of the asset or liability if market participants would take those characteristics into account when pricing the asset or liability at the measurement date. Fair value for measurement and/or disclosure purposes in these consolidated financial statements is determined on such a basis, except for share-based payment transactions that are within the scope of IFRS 2, leasing transactions that are within the scope of IAS 17, and measurements that have some similarities to fair value but are not fair value, such as net realisable value in IAS 2 or value in use in IAS 36.
In addition, for financial reporting purposes, fair value measurements are categorised into Level 1, 2 or 3 based on the degree to which the inputs to the fair value measurements are observable and the significance of the inputs to the fair value measurement in its entirety, which are described as follows:
• Level 1 inputs are quoted prices (unadjusted) in active markets for identical assets or liabilities that the entity can access at the measurement date;
• Level 2 inputs are inputs, other than quoted prices included within Level 1, that are observable for the asset or liability, either directly or indirectly; and
• Level 3 inputs are unobservable inputs for the asset or liability.
(c) Functional currency and presentation currencyThe functional currency of the Company is the US Dollar (“US$”). The individual financial statements of each Group company are presented in the currency of the primary economic environment in which it operates (its functional currency). For the purpose of these consolidated financial statements, the results and financial position of the Group are presented in United Arab Emirates Dirhams (“AED”), which is the Group’s presentation currency. All financial information presented in AED has been rounded to the nearest thousand, unless otherwise stated.
(d) New and revised IFRS(i) New and revised IFRSs adopted with no material effect
on the consolidated financial statements:In the current year, the Group has applied a number of amendments to IFRSs issued by the International Accounting Standards Board (IASB) that are mandatorily effective for an accounting period that begins on or after 1 January 2016, as follows:
• IFRS 14 Regulatory Deferral Accounts
• Amendments to IAS 1 Presentation of Financial Statements relating to Disclosure initiative
• Amendments to IFRS 11 Joint arrangements relating to accounting for acquisitions of interests in joint operations
• Amendments to IAS 16 Property, Plant and Equipment and IAS 38 Intangible Assets relating to clarification of acceptable methods of depreciation and amortisation
• Amendments to IAS 16 Property, Plant and Equipment and IAS 41 Agriculture: Bearer Plants
• Amendments to IAS 27 Separate Financial Statements relating to accounting investments in subsidiaries, joint ventures and associates to be optionally accounted for using the equity method in separate financial statements
• Amendments to IFRS 10 Consolidated Financial Statements, IFRS 12 Disclosure of Interests in Other Entities and IAS 28 Investment in Associates and Joint Ventures relating to applying the consolidation exception for investment entities
• Annual Improvements to IFRSs 2012 – 2014 Cycle covering amendments to IFRS 5, IFRS 7, IAS 19 and IAS 34
• IFRS 7 Financial Instruments: Disclosures relating to the additional hedge accounting disclosures (and consequential amendments) resulting from the introduction of the hedge accounting chapter in IFRS 9
The application of these revised and new IFRSs has not had any material impact on the amounts reported for the current and prior years but may affect the accounting for future transactions or arrangements.
54 Waha Capital Annual Report 2016
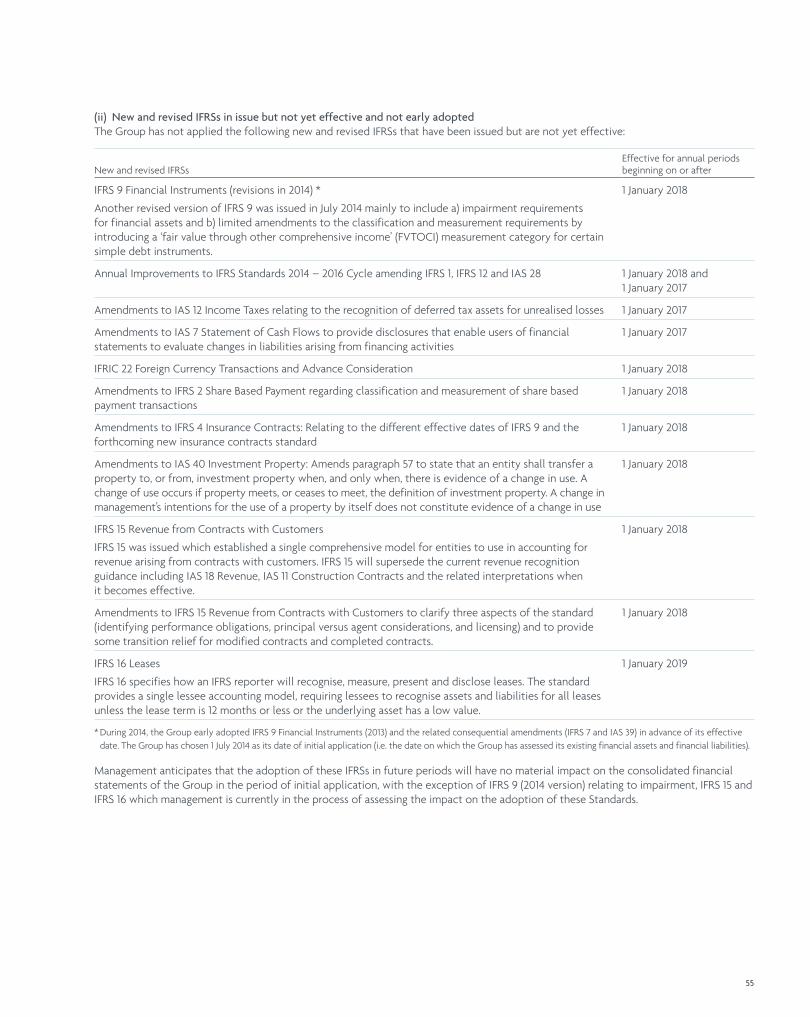
(ii) New and revised IFRSs in issue but not yet effective and not early adoptedThe Group has not applied the following new and revised IFRSs that have been issued but are not yet effective:
New and revised IFRSsEffective for annual periods beginning on or after
IFRS 9 Financial Instruments (revisions in 2014) *
Another revised version of IFRS 9 was issued in July 2014 mainly to include a) impairment requirements for financial assets and b) limited amendments to the classification and measurement requirements by introducing a ‘fair value through other comprehensive income’ (FVTOCI) measurement category for certain simple debt instruments.
1 January 2018
Annual Improvements to IFRS Standards 2014 – 2016 Cycle amending IFRS 1, IFRS 12 and IAS 28 1 January 2018 and 1 January 2017
Amendments to IAS 12 Income Taxes relating to the recognition of deferred tax assets for unrealised losses 1 January 2017
Amendments to IAS 7 Statement of Cash Flows to provide disclosures that enable users of financial statements to evaluate changes in liabilities arising from financing activities
1 January 2017
IFRIC 22 Foreign Currency Transactions and Advance Consideration 1 January 2018
Amendments to IFRS 2 Share Based Payment regarding classification and measurement of share based payment transactions
1 January 2018
Amendments to IFRS 4 Insurance Contracts: Relating to the different effective dates of IFRS 9 and the forthcoming new insurance contracts standard
1 January 2018
Amendments to IAS 40 Investment Property: Amends paragraph 57 to state that an entity shall transfer a property to, or from, investment property when, and only when, there is evidence of a change in use. A change of use occurs if property meets, or ceases to meet, the definition of investment property. A change in management’s intentions for the use of a property by itself does not constitute evidence of a change in use
1 January 2018
IFRS 15 Revenue from Contracts with Customers
IFRS 15 was issued which established a single comprehensive model for entities to use in accounting for revenue arising from contracts with customers. IFRS 15 will supersede the current revenue recognition guidance including IAS 18 Revenue, IAS 11 Construction Contracts and the related interpretations when it becomes effective.
1 January 2018
Amendments to IFRS 15 Revenue from Contracts with Customers to clarify three aspects of the standard (identifying performance obligations, principal versus agent considerations, and licensing) and to provide some transition relief for modified contracts and completed contracts.
1 January 2018
IFRS 16 Leases
IFRS 16 specifies how an IFRS reporter will recognise, measure, present and disclose leases. The standard provides a single lessee accounting model, requiring lessees to recognise assets and liabilities for all leases unless the lease term is 12 months or less or the underlying asset has a low value.
1 January 2019
* During 2014, the Group early adopted IFRS 9 Financial Instruments (2013) and the related consequential amendments (IFRS 7 and IAS 39) in advance of its effective date. The Group has chosen 1 July 2014 as its date of initial application (i.e. the date on which the Group has assessed its existing financial assets and financial liabilities).
Management anticipates that the adoption of these IFRSs in future periods will have no material impact on the consolidated financial statements of the Group in the period of initial application, with the exception of IFRS 9 (2014 version) relating to impairment, IFRS 15 and IFRS 16 which management is currently in the process of assessing the impact on the adoption of these Standards.
55
Notes to the Consolidated Financial Statements continued
3 Significant accounting policies
(a) Basis of consolidationThe consolidated financial statements incorporate the financial statements of the Company and entities (including structured entities) controlled by the Company and its subsidiaries.
(i) SubsidiariesConsolidation of a subsidiary is achieved when the Company obtains control over the investee and ceases when the Company loses control of the investee. Control is achieved when the Company:
• has power over the investee;
• is exposed, or has rights, to variable returns from its involvement with the investee; and
• has the ability to use its power to affect its returns.
The Company reassesses whether or not it controls an investee if facts and circumstances indicate that there are changes to one or more of the three elements of control listed above.
Specifically, income and expenses of a subsidiary acquired or disposed of during the year are included in the consolidated statement of profit or loss and other comprehensive income from the date the Company gains control until the date when the Company ceases to control the investee.
Profit or loss and each component of other comprehensive income are attributed to the Owners of the Company and to the non-controlling interests. Total comprehensive income of subsidiaries is attributed to the owners of the Company and to the non-controlling interests even if this results in the non-controlling interests having a deficit balance.
When necessary, adjustments are made to the financial statements of subsidiaries to bring their accounting policies into line with the Group’s accounting policies.
All intragroup balances, equity, income, expenses and cash flows resulting from intragroup transactions are eliminated in full on consolidation.
When the Company has less than a majority of the voting rights of an investee, it has power over the investee when the voting rights are sufficient to give it the practical ability to direct the relevant activities of the investee unilaterally. The Company considers all relevant facts and circumstances in assessing whether or not the Company’s voting rights in an investee are sufficient to give it power, including:
• the size of the Company’s holding of voting rights relative to the size and dispersion of holdings of the other vote holders;
• potential voting rights held by the Company, other vote holders or other parties;
• rights arising from other contractual arrangements; and
• any additional facts and circumstances that indicate that the Company has, or does not have, the current ability to direct the relevant activities at the time that decisions need to be made, including voting patterns at previous shareholders’ meetings.
Changes in the Group’s ownership interests in subsidiaries that do not result in the Group losing control over the subsidiaries are accounted for as equity transactions. The carrying amounts of the Group’s interest and the non-controlling interests are adjusted to reflect the changes in their relative interests in the subsidiaries/Any difference between the amount by which the non-controlling interests are adjusted and the fair value of the consideration paid or received is recognised directly in equity and attributed to Owners of the Company.
When the Group loses control of a subsidiary, a gain or loss is recognised in profit or loss and is calculated as the difference between (i) the aggregate of the fair value of the consideration received and the fair value of any retained interest and (ii) the previous carrying amount of the assets (including goodwill), and the liabilities of the subsidiary and any non-controlling interests. All amounts previously recognised in other comprehensive income in relation to that subsidiary are accounted for as if the Group had directly disposed of the related assets or liabilities of the subsidiary (i.e. reclassified to profit or loss or transferred to another category of equity as specified/permitted by applicable IFRSs). The fair value of any investment retained in the former subsidiary at the date when control is lost is regarded as the fair value on initial recognition for subsequent accounting under IAS 39, when applicable, the cost on initial recognition of an investments in an associate or a joint venture.
(ii) Business combinationsAcquisitions of businesses are accounted for using the acquisition method. The consideration transferred in a business combination is measured at fair value, which is calculated as the sum of the acquisition-date fair values of the assets transferred by the Group, liabilities incurred by the Group to the former owners of the acquiree and the equity interests issued by the Group in exchange for control of the acquiree. Acquisition-related costs are generally recognised in profit or loss as incurred.
At the acquisition date, the identifiable assets acquired and the liabilities assumed are recognised at their fair value.
Goodwill is measured as the excess of the sum of the consideration transferred, the amount of any non-controlling interests in the acquiree, and the fair value of the acquirer’s previously held equity interest in the acquiree (if any) over the net of the acquisition-date amounts of the identifiable assets acquired and the liabilities assumed. If, after reassessment, the net of the acquisition-date amounts of the identifiable assets acquired and liabilities assumed exceeds the sum of the consideration transferred, the amount of any non-controlling interests in the acquiree and the fair value of the acquirer’s previously held interest in the acquiree (if any), the excess is recognised immediately in profit or loss as a bargain purchase gain.
Non-controlling interests that are present ownership interests and entitle their holders to a proportionate share of the entity’s net assets in the event of liquidation may be initially measured either at fair value or at the non-controlling interests’ proportionate share of the recognised amounts of the acquiree’s identifiable net assets. The choice of measurement basis is made on a transaction-by-transaction basis. Other types of non-controlling interests are measured at fair value or, when applicable, on the basis specified in another IFRS.
56 Waha Capital Annual Report 2016

When the consideration transferred by the Group in a business combination includes assets or liabilities resulting from a contingent consideration arrangement, the contingent consideration is measured at its acquisition-date fair value and included as part of the consideration transferred in a business combination.
The subsequent accounting for changes in the fair value of the contingent consideration that do not qualify as measurement period adjustments depends on how the contingent consideration is classified. Contingent consideration that is classified as equity is not remeasured at subsequent reporting dates and its subsequent settlement is accounted for within equity. Contingent consideration that is classified as an asset or a liability is remeasured at subsequent reporting dates in accordance with IAS 39, or IAS 37 Provisions, Contingent Liabilities and Contingent Assets, as appropriate, with the corresponding gain or loss being recognised in profit or loss.
(iii) Investments in equity accounted associates and joint venturesAn associate is an entity over which the Group has significant influence, but not control or joint control, over the financial and operating policies. Significant influence is the power to participate in the financial and operating policy decisions of the investee but is not control or joint control over those policies.
A joint venture is a joint arrangement whereby the parties that have joint control of the arrangement have rights to the net assets of the joint arrangement. Joint control is the contractually agreed sharing of control of an arrangement, which exists only when decisions about the relevant activities require unanimous consent of the parties sharing control.
An investment in an associate or a joint venture is accounted for using the equity method from the date on which the investee becomes an associate or a joint venture. On acquisition of the investment in an associate or a joint venture, any excess of the cost of the investment over the Group’s share of the net fair value of the identifiable assets, liabilities and contingent liabilities of the investee is recognised as goodwill, which is included within the carrying amount of the investment. Any excess of the Group’s share of the net fair value of the identifiable assets and liabilities over the cost of the investment, after reassessment, is recognised immediately in profit or loss in the period in which the investment is acquired.
The results and assets and liabilities of associates or joint ventures are incorporated in these consolidated financial statements using the equity method of accounting, except when the investment, or a portion thereof, is classified as held for sale, in which case it is accounted for in accordance with IFRS 5. Under the equity method, an investment in an associate or a joint venture is initially recognised in the consolidated statement of financial position at cost, which includes transaction costs, and adjusted thereafter to recognise the Group’s share of the profit or loss and other comprehensive income of the associate or joint venture. When the Group’s share of losses of an associate or a joint venture exceeds its interest in that associate or joint venture (which includes any long-term interests that, in substance, form part of the Group’s net investment in the associate or joint venture), the Group discontinues recognising its share of further losses to the extent that the carrying amount of that interest (including any long term investment) is reduced to nil. Additional losses are recognised only to the extent that the Group has incurred legal or constructive obligations or made payments on behalf of the associate or joint venture.
The requirements of IAS 39 are applied to determine whether it is necessary to recognise any impairment loss with respect to the Group’s investment in an associate or a joint venture. When necessary, the entire carrying amount of the investment (including goodwill) is tested for impairment in accordance with IAS 36 Impairment of Assets as a single cash generating unit (“CGU”) by comparing its recoverable amount (higher of value in use and fair value less costs to sell) with its carrying amount, Any impairment loss recognised forms part of the carrying amount of the investment. Any reversal of that impairment loss is recognised in accordance with IAS 36 to the extent that the recoverable amount of the investment subsequently increases.
The Group discontinues the use of the equity method from the date when the investment ceases to be an associate or a joint venture, or when the investment is classified as held for sale. When the Group retains an interest in the former associate or joint venture and the retained interest is a financial asset, the Group measures the retained interest at fair value at that date and the fair value is regarded as its fair value on initial recognition in accordance with IAS 39. The difference between the carrying amount of the associate or joint venture at the date the equity method was discontinued, and the fair value of any retained interest and any proceeds from disposing of a part interest in the associate or joint venture is included in the determination of the gain or loss on disposal of the associate or joint venture. In addition, the Group accounts for all amounts previously recognised in other comprehensive income in relation to that associate or joint venture on the same basis as would be required if that associate or joint venture had directly disposed of the related assets or liabilities. Therefore, if a gain or loss previously recognised in other comprehensive income by that associate or joint venture would be reclassified to profit or loss on the disposal of the related assets or liabilities, the Group reclassifies the gain or loss from equity to profit or loss (as a reclassification adjustment) when the equity method is discontinued.
The Group continues to use the equity method when an investment in an associate becomes an investment in a joint venture or an investment in a joint venture becomes an investment in an associate. There is no remeasurement to fair value upon such changes in ownership interests.
When the Group reduces its ownership interest in an associate or a joint venture but the Group continues to use the equity method, the Group reclassifies to profit or loss the proportion of the gain or loss that had previously been recognised in other comprehensive income relating to that reduction in ownership interest if that gain or loss would be reclassified to profit or loss on the disposal of the related assets or liabilities.
When a group entity transacts with an associate or a joint venture of the Group, profits and losses resulting from the transactions with the associate or joint venture are recognised in the Group’s consolidated financial statements only to the extent of interests in the associate or joint venture that are not related to the Group.
57
Notes to the Consolidated Financial Statements continued
3 Significant accounting policies continued
(b) Non-current assets held for saleNon-current assets and disposal groups are classified as held for sale if their carrying amount will be recovered principally through a sale transaction rather than through continuing use. This condition is regarded as met only when the non-current asset (or disposal group) is available for immediate sale in its present condition subject only to terms that are usual and customary for sales of such asset (or disposal group) and its sale is highly probable. Management must be committed to the sale, which should be expected to qualify for recognition as a completed sale within one year from the date of classification.
When the Group is committed to a sale plan involving loss of control of a subsidiary, all of the assets and liabilities of that subsidiary are classified as held for sale when the criteria described above are met, regardless of whether the Group will retain a non-controlling interest in its former subsidiary after the sale.
When the Group is committed to a sale plan involving disposal of an investment, or a portion of an investment, in an associate or joint venture, the investment or the portion of the investment that will be disposed of is classified as held for sale when the criteria described above are met, and the Group discontinues the use of the equity method in relation to the portion that is classified a held for sale. Any retained portion of an investment in an associate or a joint venture that has not been classified as held for sale continues to be accounted for using the equity method. The Group discontinues the use of the equity method at the time of disposal when the disposal results in the Group losing significant influence over the associate or joint venture.
After the disposal takes place, the Group accounts for any retained interest in the associate or joint venture in accordance with IFRS 9 unless the retained interest continues to be an associate or a joint venture, in which case the Group uses the equity method (refer to note 3 (a)(iii)).
When an investment in an associate or a joint venture previously classified as held for sale no longer meets the criteria to be so classified, it shall be accounted for using the equity method retrospectively as from the date of its classification as held for sale.
Non-current assets (and disposal groups) classified as held for sale are measured at the lower of their previous carrying amount and fair value less costs to sell.
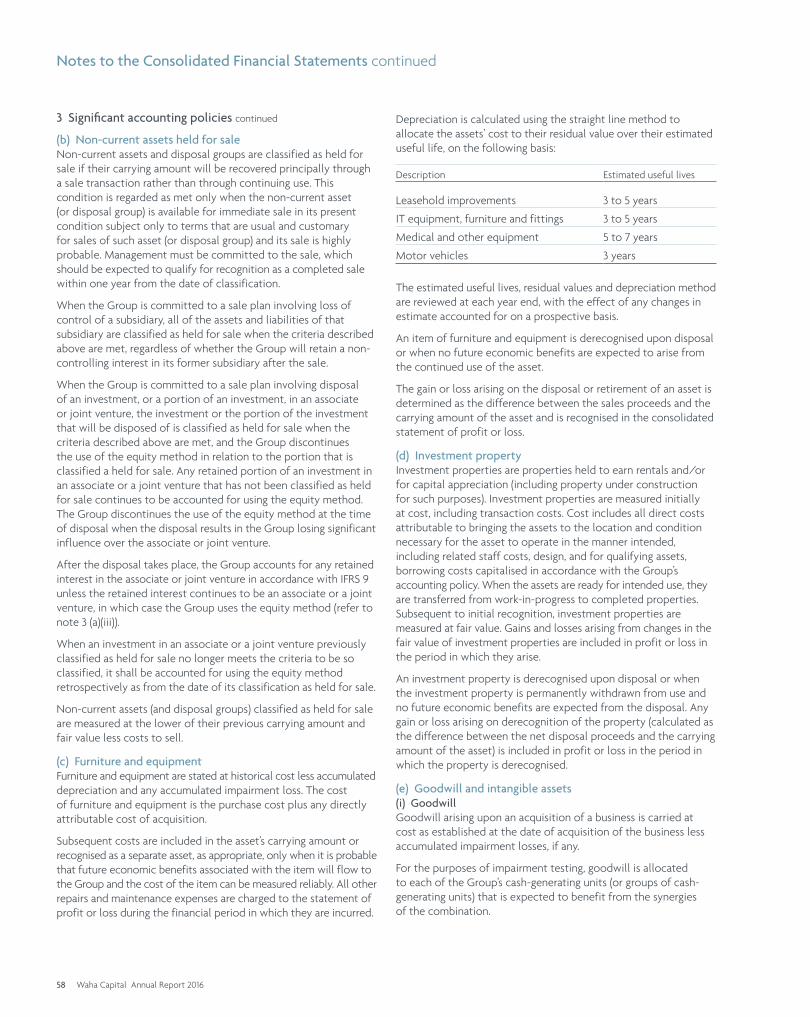
(c) Furniture and equipmentFurniture and equipment are stated at historical cost less accumulated depreciation and any accumulated impairment loss. The cost of furniture and equipment is the purchase cost plus any directly attributable cost of acquisition.
Subsequent costs are included in the asset’s carrying amount or recognised as a separate asset, as appropriate, only when it is probable that future economic benefits associated with the item will flow to the Group and the cost of the item can be measured reliably. All other repairs and maintenance expenses are charged to the statement of profit or loss during the financial period in which they are incurred.
Depreciation is calculated using the straight line method to allocate the assets’ cost to their residual value over their estimated useful life, on the following basis:
Description Estimated useful lives
Leasehold improvements 3 to 5 years
IT equipment, furniture and fittings 3 to 5 years
Medical and other equipment 5 to 7 years
Motor vehicles 3 years
The estimated useful lives, residual values and depreciation method are reviewed at each year end, with the effect of any changes in estimate accounted for on a prospective basis.
An item of furniture and equipment is derecognised upon disposal or when no future economic benefits are expected to arise from the continued use of the asset.
The gain or loss arising on the disposal or retirement of an asset is determined as the difference between the sales proceeds and the carrying amount of the asset and is recognised in the consolidated statement of profit or loss.
(d) Investment propertyInvestment properties are properties held to earn rentals and/or for capital appreciation (including property under construction for such purposes). Investment properties are measured initially at cost, including transaction costs. Cost includes all direct costs attributable to bringing the assets to the location and condition necessary for the asset to operate in the manner intended, including related staff costs, design, and for qualifying assets, borrowing costs capitalised in accordance with the Group’s accounting policy. When the assets are ready for intended use, they are transferred from work-in-progress to completed properties. Subsequent to initial recognition, investment properties are measured at fair value. Gains and losses arising from changes in the fair value of investment properties are included in profit or loss in the period in which they arise.
An investment property is derecognised upon disposal or when the investment property is permanently withdrawn from use and no future economic benefits are expected from the disposal. Any gain or loss arising on derecognition of the property (calculated as the difference between the net disposal proceeds and the carrying amount of the asset) is included in profit or loss in the period in which the property is derecognised.
(e) Goodwill and intangible assets(i) GoodwillGoodwill arising upon an acquisition of a business is carried at cost as established at the date of acquisition of the business less accumulated impairment losses, if any.
For the purposes of impairment testing, goodwill is allocated to each of the Group’s cash-generating units (or groups of cash-generating units) that is expected to benefit from the synergies of the combination.
58 Waha Capital Annual Report 2016
A cash-generating unit to which goodwill has been allocated is tested for impairment annually, or more frequently when there is an indication that the unit may be impaired. Recoverable amount is the higher of fair value less costs of disposal and value in use. If the recoverable amount of the cash-generating unit is less than its carrying amount, the impairment loss is allocated first to reduce the carrying amount of any goodwill allocated to the unit and then to the other assets of the unit pro rata based on the carrying amount of each asset in the unit. Any impairment loss for goodwill is recognised directly in profit or loss. An impairment loss recognised for goodwill is not reversed in subsequent periods.
On disposal of the relevant cash-generating unit, the attributable amount of goodwill is included in the determination of the profit or loss on disposal.
The Group’s policy for goodwill arising on the acquisition of an equity accounted investee is described at note 3 (a) (iii) above.
(ii) Other intangible assets acquired in a business combinationOther intangible assets acquired in a business combination and recognised separately from goodwill are initially recognised at their fair value at the acquisition date (which is regarded as their cost), and include trademarks, licenses contracts and software.
Subsequent to initial recognition, intangible assets acquired in a business combination are reported at cost less accumulated amortisation and accumulated impairment losses, on the same basis as intangible assets that are acquired separately. Amortisation is recognised on a straight-line basis over their estimated useful lives as disclosed in note 9. The estimated useful lives and amortisation method are reviewed at the end of each reporting period, with the effect of any changes in estimate being accounted for on a prospective basis.
(iii) De-recognition of intangible assetsAn intangible asset is derecognised on disposal, or when no future economic benefits are expected from use or disposal. Gains or losses arising from derecognition of an intangible asset, measured as the difference between the net disposal proceeds and the carrying amount of the asset, are recognised in profit or loss when the asset is derecognised.
(f) Impairment of tangible and intangible assets other than goodwill
At the end of each reporting period, the Group reviews the carrying amounts of its tangible and intangible assets to determine whether there is any indication that those assets have suffered an impairment loss. If any such indication exists, the recoverable amount of the asset is estimated in order to determine the extent of the impairment loss (if any). When it is not possible to estimate the recoverable amount of an individual asset, the Group estimates the recoverable amount of the cash-generating unit to which the asset belongs. When a reasonable and consistent basis of allocation can be identified, corporate assets are also allocated to individual cash-generating units, or otherwise they are allocated to the smallest group of cash-generating units for which a reasonable and consistent allocation basis can be identified.
Recoverable amount is the higher of fair value less costs to sell and value in use. In assessing value in use, the estimated future cash flows are discounted to their present value using a pre-tax discount rate that reflects current market assessments of the time value of money and the risks specific to the asset for which the estimates of future cash flows have not been adjusted.
If the recoverable amount of an asset (or cash-generating unit) is estimated to be less than its carrying amount, the carrying amount of the asset (or cash-generating unit) is reduced to its recoverable amount. An impairment loss is recognised immediately in profit or loss.
When an impairment loss subsequently reverses, the carrying amount of the asset (or a cash-generating unit) is increased to the revised estimate of its recoverable amount, but so that the increased carrying amount does not exceed the carrying amount that would have been determined had no impairment loss been recognised for the asset (or cash-generating unit) in prior years. A reversal of an impairment loss is recognised immediately in profit or loss.
(g) ProvisionsProvisions are recognised when the Group has a present obligation (legal or constructive) as a result of a past event, it is probable that the Group will be required to settle the obligation, and a reliable estimate can be made of the amount of the obligation.
The amount recognised as a provision is the best estimate of the consideration required to settle the present obligation at the end of the reporting period, taking into account the risks and uncertainties surrounding the obligation. When a provision is measured using the cash flows estimated to settle the present obligation, its carrying amount is the present value of those cash flows (when the effect of the time value of money is material).
When some or all of the economic benefits required to settle a provision are expected to be recovered from a third party, a receivable is recognised as an asset if it is virtually certain that reimbursement will be received and the amount of the receivable can be measured reliably.
(h) InventoriesInventories are measured at the lower of cost and net realisable value. Cost is determined using the weighted average method and includes expenditure incurred in acquiring the inventories and bringing them to their existing location and condition. Net realisable value represents the estimated selling price in the ordinary course of business, less estimated selling expenses. Allowance for obsolete and slow moving inventory is made to reduce the carrying amount of inventories to their net realisable value.
(i) Financial instrumentsInitial recognitionFinancial assets and financial liabilities are recognised when a group entity becomes a party to the contractual provisions of the instrument except for “regular way” purchases and sale of financial assets which are recognised on settlement date basis (other than derivative assets).
59
Notes to the Consolidated Financial Statements continued
3 Significant accounting policies continued
(i) Financial instruments continuedInitial recognition continued Financial assets and financial liabilities are initially measured at fair value. Transaction costs that are directly attributable to the acquisition or issue of financial assets and financial liabilities (other than financial assets and financial liabilities at fair value through profit or loss) are added to or deducted from the fair value of the financial assets or financial liabilities, as appropriate, on initial recognition.
Transaction costs directly attributable to the acquisition of financial assets or financial liabilities at fair value through profit or loss are recognised immediately in profit or loss.
Financial assetsAll regular way purchases or sales of financial assets are recognised and derecognised on a trade date basis. Regular way purchases or sales are purchases or sales of financial assets that require delivery of assets within the time frame established by regulation or convention in the marketplace.
Debt instrumentsDebt instruments are classified and subsequently measured at either amortised cost or fair value on the basis of the entity’s business model for managing the financial assets and the contractual cash flow characteristics of the financial assets.
Debt instruments are measured at amortised cost, net of any write down for impairment, only if (i) the asset is held within a business model whose objective is to hold assets in order to collect contractual cash flows and (ii) the contractual terms of the financial asset give rise on specified dates to cash flows that are solely payments of principal and interest on the principal amount outstanding.
Interest calculated using the effective interest method is recognised in profit or loss and is included in Finance cost, net. The effective interest rate is the rate that exactly discounts estimated future cash receipts (including all fees paid or received that form an integral part of the effective interest rate, transaction costs and other premiums or discounts) through the expected life of the debt instrument, or, where appropriate, a shorter period, to the net carrying amount on initial recognition.
The Group may choose at initial recognition to designate a debt instrument that otherwise qualifies to be measured at amortised cost or as at fair value through profit or loss (FVTPL) if doing so eliminates or significantly reduces an accounting mismatch. All other debt instruments must be measured as at FVTPL.
Debt instruments are reclassified from amortised cost to FVTPL when the business model is changed such that the amortised cost criteria are no longer met. Reclassification of debt instruments that are designated as at FVTPL on initial recognition is not allowed.
Other financial assets measured at amortised costTrade and other receivables and cash and cash equivalents are measured at amortised cost less any impairment. Interest income is recognised on an effective interest basis, except for short term receivables when the recognition of interest would be immaterial.
Cash and cash equivalents include cash on hand and deposits held with banks for working capital purposes (excluding deposits held under lien) and term deposits of original maturity less than 3 months.
Equity instrumentsA financial asset is held for trading if:
• it has been acquired principally for the purpose of selling it in the near term; or
• on initial recognition it is part of a portfolio of identified financial instruments that the Group manages together and has evidence of a recent actual pattern of short-term profit-taking; or
• it is a derivative that is not designated and effective as a hedging instrument or a financial guarantee.
Investments in equity instruments designated at FVTOCI are initially measured at fair value plus transaction costs. Subsequently, they are measured at fair value with gains and losses arising from changes in fair value recognised in other comprehensive income and accumulated in the investment revaluation reserve. The cumulative gain or loss will not be reclassified to profit or loss on disposal of the investments.
Dividends on these investments in equity instruments are recognised in profit or loss when the Group’s right to receive the dividends is established in accordance with IAS 18 Revenue, unless the dividends clearly represent a recovery of part of the cost of the investment. Dividends earned are recognised in profit or loss and are included in other (expense)/income (note 21).
Financial liabilities and equity instrumentsClassification as debt or equityDebt and equity instruments issued by the Group are classified as either financial liabilities or as equity in accordance with the substance of the contractual arrangements and the definitions of a financial liability and an equity instrument.
Equity instrumentsAn equity instrument is any contract that evidences a residual interest in the assets of an entity after deducting all of its liabilities. Equity instruments issued by the Group are recognised as the proceeds received, net of direct issue costs.
Repurchase of the Group’s own equity instruments is recognised and deducted directly in equity. No gain or loss is recognised in profit or loss on the purchase, sale, issue or cancellation of the Group’s own equity instruments.
Financial liabilitiesAll financial liabilities are subsequently measured at amortised cost using the effective interest method or at FVTPL.
However, financial liabilities that arise when a transfer of a financial asset does not qualify for derecognition or when the continuing involvement approach applies are measured in accordance with the specific accounting policies set out below.
60 Waha Capital Annual Report 2016
Financial liabilities at FVTPLFinancial liabilities are classified as at FVTPL when the financial liability is either held for trading or it is designated as at FVTPL.
A financial liability is classified as held for trading if:
• it has been incurred principally for the purpose of repurchasing it in the near term; or
• on initial recognition it is part of a portfolio of identified financial instruments that the Group manages together and has a recent actual pattern of short-term profit-taking; or
• it is a derivative that is not designated and effective as a hedging instrument.
A financial liability other than a financial liability held for trading may be designated as at FVTPL upon initial recognition if:
• such designation eliminates or significantly reduces a measurement or recognition inconsistency that would otherwise arise; or
• the financial liability forms part of a group of financial assets or financial liabilities or both, which is managed and its performance is evaluated on a fair value basis, in accordance with the Group’s documented risk management or investment strategy, and information about the grouping is provided internally on that basis; or
• it forms part of a contract containing one or more embedded derivatives, and the entire combined contract is designated as at FVTPL in accordance with IFRS 9.
Financial liabilities designated at FVTPL are stated at fair value. Any gains or losses arising on remeasurement of held for trading financial liabilities are recognised in profit or loss. Such gains or losses that are recognised in profit or loss incorporate any interest paid on the financial liabilities and are included in the ‘Income from financial investments’ line item in the consolidated statement of profit or loss.
However, for non-held for trading financial liabilities that are designated as at FVTPL, the amount of change in the fair value of the financial liability that is attributable to changes in the credit risk of that liability is recognised in other comprehensive income, unless the recognition of the effects of changes in the liability’s credit risk in other comprehensive income would create or enlarge an accounting mismatch in profit or loss. The remaining amount of change in the fair value of liability is recognised in profit or loss. Changes in fair value attributable to a financial liability’s credit risk that are recognised in other comprehensive income are not subsequently reclassified to profit or loss.
Gains or losses on financial guarantee contracts and loan commitments issued by the Group that are designated by the Group as at fair value through profit or loss are recognised in profit or loss.
Financial liabilities subsequently measured at amortised costFinancial liabilities that are not held for trading and are not designated as at FVTPL are measured at amortised cost at the end of subsequent accounting periods. The carrying amounts of financial liabilities that are subsequently measured at amortised cost are determined based on the effective interest method. Interest expense that is not capitalised as part of costs of an asset is included in the ‘Finance cost, net’ line item in the consolidated statement of profit or loss.
The effective interest method is a method of calculating the amortised cost of a financial liability and of allocating interest expense over the relevant period. The effective interest rate is the rate that exactly discounts estimated future cash payments (including all fees and points paid or received that form an integral part of the effective interest rate, transaction costs and other premiums or discounts) through the expected life of the financial liability, or (where appropriate) a shorter period, to the net carrying amount on initial recognition.
ReclassificationFor financial assets, reclassification is required between FVTPL, FVTOCI and amortised cost; if and only if the Group’s business model objective for its financial assets changes so its previous model assessment would no longer apply.
If reclassification is appropriate, it must be done prospectively from the reclassification date which is defined as the first day of the first reporting period following the change in business model. The Group does not restate any previously recognised gains, losses, or interest.
Reclassification is not allowed for:
• equity investments measured at FVTOCI, or
• where the fair value option has been exercised in any circumstance for a financial asset or financial liability.
DerecognitionThe Group derecognises a financial asset when the contractual rights to the cash flows from the financial asset expire, or when it transfers the financial asset in a transaction in which substantially all the risks and rewards of ownership of the financial asset are transferred or in which the Group neither transfers nor retains substantially all the risks and rewards of ownership and it does not retain control of the financial asset. On derecognition of a financial asset, the difference between the carrying amount of the asset and the consideration received is recognised in:
• Profit or loss, for securities measured at amortised cost or FVTPL, or
• Other comprehensive income, for investments at FVTOCI. At the time of derecognition of FVTOCI investment any revaluation reserve is transferred to retained earnings.
The Group derecognises financial liabilities when, and only when, the Group’s obligations are discharged, cancelled or they expire. The difference between the carrying amount of the financial liability derecognised and the consideration paid and payable, including any non-cash assets transferred or liabilities assumed, is recognised in profit or loss.
61
Notes to the Consolidated Financial Statements continued
3 Significant accounting policies continued
(i) Financial instruments continuedOffsettingFinancial assets and liabilities are offset and reported net in the consolidated statement of financial position only when there is a legally enforceable right to set off the recognised amounts and when the Group intends to settle either on a net basis, or to realise the asset and settle the liability simultaneously. Income and expenses are presented on a net basis only when permitted by the accounting standards, or for gains and losses arising from a group of similar transactions such as in the Group’s trading activity.
The Group is party to a number of arrangements, including master netting agreements that give it the right to offset financial assets and financial liabilities but, where it does not intend to settle the amounts net or simultaneously, the assets and liabilities concerned are presented on a gross basis.
Repurchase and reverse repurchase contractsSecurities sold subject to a commitment to repurchase them at a predetermined price at a specified future date (repos) continue to be recognised in the consolidated statement of financial position and a liability is recorded in respect of the consideration received under borrowings. Assets purchased with a corresponding commitment to resell at a specified future date (reverse repos) are not recognised in the consolidated statement of financial position. Amounts placed under these agreements are included in ‘Reverse-repo contracts’ within ‘Financial investments’.
Foreign exchange gains and lossesThe fair value of financial assets and liabilities denominated in a foreign currency is determined in that foreign currency and translated at the spot rate at the end of each reporting period. The foreign exchange component forms part of its fair value gain or loss. Therefore,
• for financial assets and liabilities that are classified as at FVTPL, the foreign exchange component is recognised in profit or loss; and
• for financial assets that are equity instruments and designated as at FVTOCI, any foreign exchange component is recognised in other comprehensive income.
For foreign currency denominated financial assets and liabilities measured at amortised cost at the end of each reporting period, the foreign exchange gains and losses are determined based on the amortised cost of the financial assets and are recognised in the ‘Income from financial investments’ line item in the consolidated statement of profit or loss.
Derivative financial instrumentsThe Group enters into a variety of derivative financial instruments, including equity price collars, foreign exchange forward contracts and interest rate swaps to manage its exposure to equity price, interest rate and foreign exchange rate risks. Further details of derivative financial instruments are disclosed in note 13.
Derivatives are initially recognised at fair value on the date the derivative contracts are entered into and are subsequently remeasured to their fair value at the end of each reporting period. The resulting gain or loss is recognised in profit or loss immediately unless the derivative is designated and effective as a hedging instrument, in which event the timing of the recognition in profit or loss depends on the nature of the hedge relationship.
Embedded derivativesDerivatives embedded in non-derivative host contracts that are not financial assets within the scope of IFRS 9 (e.g. financial liabilities) are treated as separate derivatives when their risks and characteristics are not closely related to those of the host contracts and the host contracts are not measured at FVTPL.
Hedge accountingThe Group has designated its equity price collars in respect of its equity price risk, as cash flow hedges.
At the inception of the hedge relationship, the Group documents the relationship between the hedging instrument and the hedged item, along with its risk management objectives and its strategy for undertaking various hedge transactions. Furthermore, at the inception of the hedge and on an ongoing basis, the Group documents whether the hedging instrument is highly effective in offsetting changes in fair values or cash flows of the hedged item attributable to the hedged risk.
Note 13 sets out details of the fair values of the derivative instruments used for hedging purposes.
Cash flow hedgesThe effective portion of changes in the fair value of derivatives that are designated and qualify as cash flow hedges is recognised in other comprehensive income and accumulated under the heading of revaluation reserve. The gain or loss relating to the ineffective portion is recognised immediately in profit or loss, and is included in other income/(expense).
Amounts previously recognised in other comprehensive income and accumulated in equity are reclassified to profit or loss in the periods when the hedged item is recognised in profit or loss, in the same line of the consolidated statement of profit or loss as the recognised hedged item. If a hedged forecast transaction subsequently results in the recognition of a non-financial item or becomes a firm commitment for which fair value hedge accounting is applied, the amount that has been accumulated in the revaluation reserve is removed and included directly in the initial cost or other carrying amount of the asset or the liability.
When the Group discontinues hedge accounting for a cash flow hedge, if the hedged future cash flows are still expected to occur, the amount that has been accumulated in the cash flow hedge reserve remains there until the future cash flows occur; if the hedged future cash flows are no longer expected to occur, that amount is immediately reclassified to profit or loss.
62 Waha Capital Annual Report 2016
When the Group separates the intrinsic value and time value of an option contract and designates as the hedging instrument only the change in intrinsic value of the option, it recognises some or all of the change in the time value in other comprehensive income which is later removed or reclassified from equity as a single amount or on an amortised basis (depending on the nature of the hedged item) and ultimately recognised in profit or loss.
If a hedging relationship ceases to meet the hedge effectiveness requirement relating to the hedge ratio but the risk management objective for that designated hedging relationship remains the same, the Group will adjust the hedge ratio of the hedging relationship (i.e. rebalances the hedge) so that it meets the qualifying criteria again.
ImpairmentFinancial assets that are measured at amortised cost are assessed for impairment at the end of each reporting period. Financial assets are considered to be impaired when there is objective evidence that, as a result of one or more events that occurred after the initial recognition of the financial assets, the estimated future cash flows of the asset have been affected.
Objective evidence of impairment could include:
• significant financial difficulty of the issuer or counterparty; or
• breach of contract, such as a default or delinquency in interest or principal payments; or
• it becoming probable that the borrower will enter bankruptcy or financial re-organisation; or
• the disappearance of an active market for that financial asset because of financial difficulties.
For certain categories of financial asset, such as trade receivables, assets that are assessed not to be impaired individually are, in addition, assessed for impairment on a collective basis. Objective evidence of impairment for a portfolio of receivables could include the Group’s past experience of collecting payments, an increase in the number of delayed payments in the portfolio past the average credit period of 60 days, as well as observable changes in national or local economic conditions that correlate with default on receivables.
The amount of the impairment loss recognised is the difference between the asset’s carrying amount and the present value of estimated future cash flows reflecting the amount of collateral and guarantee, discounted at the financial asset’s original effective interest rate.
The carrying amount of the financial asset is reduced by the impairment loss directly for all financial assets with the exception of trade receivables, where the carrying amount is reduced through the use of an allowance account. When a trade receivable is considered uncollectible, it is written off against the allowance account. Subsequent recoveries of amounts previously written off are credited against the allowance account. Changes in the carrying amount of the allowance account are recognised in profit or loss.
If, in a subsequent period, the amount of the impairment loss decreases and the decrease can be related objectively to an event occurring after the impairment was recognised, the previously recognised impairment loss is reversed through profit or loss to the extent that the carrying amount of the investment at the date the impairment is reversed does not exceed what the amortised cost would have been had the impairment not been recognised.
(j) Foreign currenciesIn preparing the financial statements of each individual group entity, transactions in currencies other than the entity’s functional currency (foreign currencies) are recognised at the rates of exchange prevailing at the dates of the transactions. At the end of each reporting period, monetary items denominated in foreign currencies are retranslated at the rates prevailing at that date. Non-monetary items carried at fair value that are denominated in foreign currencies are retranslated at the rates prevailing at the date when the fair value was determined. Non-monetary items that are measured in terms of historical cost in a foreign currency are not retranslated. Exchange differences on monetary items are recognised in profit or loss in the period in which they arise.
(k) Revenue recognitionRevenue is measured at the fair value of the consideration received or receivable. Revenue is reduced for estimated customer returns, rebates and other similar allowances.
(i) Sale of goods and servicesRevenue from the sale of goods is recognised when the goods are delivered and titles have passed, at which time all the following conditions are satisfied:
• the Group has transferred to the buyer the significant risks and rewards of ownership of the goods;
• the Group retains neither continuing managerial involvement to the degree usually associated with ownership nor effective control over the goods sold;
• the amount of revenue can be measured reliably;
• it is probable that the economic benefits associated with the transaction will flow to the Group; and
• the costs incurred or to be incurred in respect of the transaction can be measured reliably.
Revenue from services primarily represents the aggregate invoiced amount for medical services provided to patients (insured and non-insured) during the year and is stated net of any discounts allowed. Revenue is recognised in the accounting period in which services are provided.
(ii) Dividend and interest incomeDividend income from investments is recognised when the shareholder’s right to receive payment has been established (provided that it is probable that the economic benefits will flow to the Group and the amount of income can be measured reliably).
63
Notes to the Consolidated Financial Statements continued
3 Significant accounting policies continued
(k) Revenue recognition continued(ii) Dividend and interest income continuedInterest income from a financial asset is recognised when it is probable that the economic benefits will flow to the Group and the amount of income can be measured reliably. Interest income is accrued on a time basis, by reference to the principal outstanding and at the effective interest rate applicable, which is the rate that exactly discounts estimated future cash receipts through the expected life of the financial asset to that asset’s net carrying amount on initial recognition.
(iii) Rental incomeThe Group’s policy for recognition of revenue from operating leases is described in note (l) below.
(iv) Capital markets transactionsThe Group has arranged debt capital financing on behalf of its clients for the acquisition of high value items, such as vessels and aircraft. The Group earns income from arranging, advising on and administering such transactions. Given the nature of the services, which are predominately event-driven, the fees do not accrue on a time-proportionate basis but are recognised entirely as and when they become due to the Group once the likelihood of occurrence of trigger events has been ascertained.
(l) LeasingLeases are classified as finance leases whenever the terms of the lease transfer substantially all the risks and rewards of ownership to the lessee. All other leases are classified as operating leases.
(i) The Group as lessorAmounts due from lessees under finance leases are recognised as receivables at the amount of the Group’s net investment in the leases. Finance lease income is allocated to accounting periods so as to reflect a constant periodic rate of return on the Group’s net investment outstanding in respect of the leases.
Rental income from operating leases is recognised on a straight-line basis over the term of the relevant lease. Initial direct costs incurred in negotiating and arranging an operating lease are added to the carrying amount of the leased asset and recognised on a straight-line basis over the lease term.
(ii) The Group as lesseeAssets held under finance leases are initially recognised as assets of the Group at their fair value at the inception of the lease or, if lower, at the present value of the minimum lease payments. The corresponding liability to the lessor is included in the consolidated statement of financial position as a finance lease obligation.
Lease payments are apportioned between finance costs and reduction of the lease obligation so as to achieve a constant rate of interest on the remaining balance of the liability. Finance costs are recognised immediately in profit or loss, unless they are directly attributable to qualifying assets, in which case they are capitalised in accordance with the Group’s general policy on borrowing costs (see note 3(n) below). Contingent rentals are recognised as expenses in the periods in which they are incurred.
Operating lease payments are recognised as an expense on a straight-line basis over the lease term, except where another systematic basis is more representative of the time pattern in which economic benefits from the leased asset are consumed. Contingent rentals arising under operating leases are recognised as an expense in the period in which they are incurred.
(m) Employee benefitsThe provision for employees’ end of service benefit is calculated in accordance with the UAE Federal Labour Law and is recognised as an expense in the consolidated statement of profit and loss on an accrual basis.
Pension contribution for GCC nationals is recognised as an expense in the consolidated statement of profit and loss on an accrual basis.
Liabilities recognised in respect of other long-term employee benefits, included in trade and other liabilities, are measured at the present value of the estimated future cash outflows expected to be made by the Group in respect of services provided by employees up to the reporting date.
(n) Borrowing costsBorrowing costs directly attributable to the acquisition, construction or production of qualifying assets, which are assets that necessarily take a substantial period of time to get ready for their intended use or sale, are added to the cost of those assets, until such time as the assets are substantially ready for their intended use or sale.
All other borrowing costs are recognised in profit or loss in the period in which they are incurred.
(o) Government grantsThe Group believes that, in most cases, when land is initially received through government grants, the probability that future economic benefits will flow to the Group is uncertain, since, until the Group has established plans to utilise the land, it is possible that such land may revert back to the government. In addition, in the absence of identified use of the land, the amount of future economic benefits cannot be determined with reasonable certainty. Accordingly, land so received is not initially recognised in the consolidated financial statements until certain events occur, which enable management to conclude that it becomes probable that future economic benefits will flow to the Group from its ownership of such land.
Land received as government grants that do not meet the criteria that future economic benefits will flow to the Group, are not recognised, but their existence is disclosed in the consolidated financial statements.
64 Waha Capital Annual Report 2016
The determination of whether future economic benefits will flow to the Group is made by management using guidelines approved by the Board of Directors; each such determination is also approved by the Board of Directors. Once the determination is made, land is recognised in the financial statements at nominal value.
At the point of such initial recognition, and subsequently, at each reporting date, an assessment is made by the Group as to the ultimate use of the land, and based on such assessment, the land is transferred to the relevant asset category (such as investment property, property, plant and equipment or inventory) depending on its intended use, and is thereafter accounted for using the accounting policy in place for that relevant asset category.
(p) Statutory reserveIn accordance with the Companies Law and the Company’s Articles of Association, 10% of the profit after tax is transferred at the end of each financial year to a non-distributable statutory reserve. Such transfers are required to be made until the balance of the statutory reserve equals one half of the Company’s paid up share capital.
4 Critical accounting judgements and key sources of estimation uncertainty
The preparation of the consolidated financial statements in conformity with IFRS requires management to make judgements, estimates or assumptions that affect the application of accounting policies and the reported amounts of assets, liabilities, income and expenses. Actual results may differ from these estimates.
Estimates and underlying assumptions are reviewed on an ongoing basis and are based on historical experience and other factors, including expectations of future events that are believed to be reasonable under the circumstances. Revision to accounting estimates are recognised in the period in which the estimates are revised and in any future period affected.
(a) Key sources of estimation uncertainty(i) Investment property valuationThe key estimates used in the fair valuation of the Group’s investment properties are disclosed in note 8.
(ii) Impairment of equity-accounted associates and joint venturesThe investment in an equity accounted associate was tested for potential impairment by comparing its carrying amount and recoverable amount. The recoverable amount was determined using level 3 valuation techniques, including the forward industry standard multiples applied to the investees’ EBITDA and Enterprise Value. Based on estimates of recoverable amount developed in accordance with these assumptions, an impairment of AED 76,894 thousand was recognised (2015: AED 22,029 thousand).
(iii) Impairment of goodwillGoodwill arising from the acquisition of Anglo Arabian Healthcare and its subsidiaries was tested for impairment during the year. The recoverable amount was determined based on fair value calculation which uses cash flow projections based on a business plan covering a 5 year period, and a discount rate between 13%-16% per annum (2015: 13%-16% per annum).
The carrying amount of the Group’s interest in Anglo Arabian Healthcare group is AED 196.2 million (including goodwill) compared to a recoverable amount of AED 402.5 million. The senior management believe that any reasonably possible change in the key assumptions on which the recoverable amount was based would not cause the aggregate carrying amount to exceed the aggregate recoverable amount of the cash-generating unit.
(iv) Allowance for doubtful receivablesThe Group has estimated the recoverability of trade and other receivable, and loan investments and has considered the allowance required for doubtful receivables. The Group has provided for the allowance for doubtful receivables on the basis of prior experience and the current economic environment.
(v) Fair value of financial instrumentsThe Group has financial assets and liabilities that are measured at fair value for financial reporting purposes. In estimating the fair value of an asset or a liability, the Group uses market-observable data to the extent it is available. Information about the valuation techniques and inputs used in determining the fair value of various financial assets and liabilities are disclosed in note 27(a).
(b) Critical accounting judgements(i) Possibility of future economic benefits from land received
as government grantRefer to note 3(o) for a description of judgements used to ascertain the possibility of future economic benefits from land received as government grant.
(ii) Significant influence over Aercap Holdings NV (“Aercap”)The Group holds two seats on AerCap’s Board of Directors, as well as representation on the various Board sub-committees on which it currently serves in addition to its 15.23% equity ownership. Accordingly, the Group’s investment in Aercap is classified as an equity-accounted associate.
(iii) Classification of financial investmentsAs described in Note 3 (i), investments are classified as either financial investments at fair value through profit or loss or fair value through other comprehensive income. In judging whether investments are either financial investments at fair value through profit or loss or fair value through other comprehensive income, the Group has considered the detailed criteria for determination of such classification as set out in IFRS 9 Financial Instruments.
65
Notes to the Consolidated Financial Statements continued
5 Composition of the Group
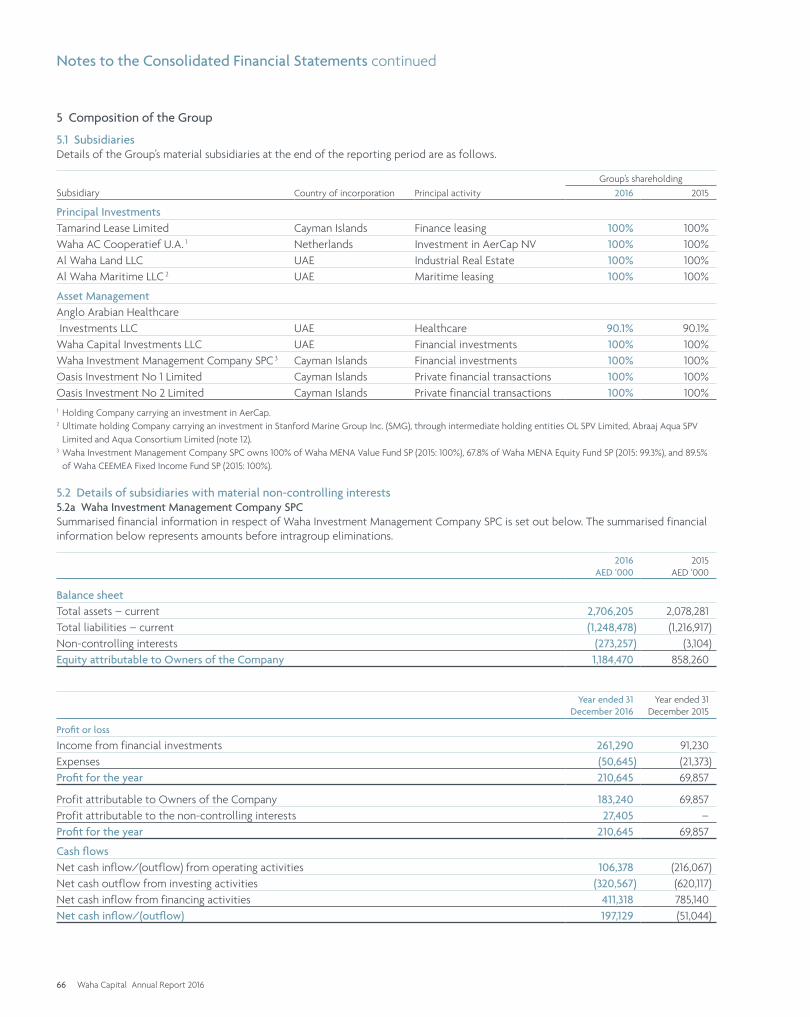
5.1 SubsidiariesDetails of the Group’s material subsidiaries at the end of the reporting period are as follows.
Subsidiary Country of incorporation Principal activity
Group’s shareholding
2016 2015
Principal InvestmentsTamarind Lease Limited Cayman Islands Finance leasing 100% 100%Waha AC Cooperatief U.A. 1 Netherlands Investment in AerCap NV 100% 100%Al Waha Land LLC UAE Industrial Real Estate 100% 100%Al Waha Maritime LLC 2 UAE Maritime leasing 100% 100%
Asset ManagementAnglo Arabian Healthcare Investments LLC UAE Healthcare 90.1% 90.1%Waha Capital Investments LLC UAE Financial investments 100% 100%Waha Investment Management Company SPC 3 Cayman Islands Financial investments 100% 100%Oasis Investment No 1 Limited Cayman Islands Private financial transactions 100% 100%Oasis Investment No 2 Limited Cayman Islands Private financial transactions 100% 100%1 Holding Company carrying an investment in AerCap.2 Ultimate holding Company carrying an investment in Stanford Marine Group Inc. (SMG), through intermediate holding entities OL SPV Limited, Abraaj Aqua SPV
Limited and Aqua Consortium Limited (note 12).3 Waha Investment Management Company SPC owns 100% of Waha MENA Value Fund SP (2015: 100%), 67.8% of Waha MENA Equity Fund SP (2015: 99.3%), and 89.5%
of Waha CEEMEA Fixed Income Fund SP (2015: 100%).
5.2 Details of subsidiaries with material non-controlling interests5.2a Waha Investment Management Company SPCSummarised financial information in respect of Waha Investment Management Company SPC is set out below. The summarised financial information below represents amounts before intragroup eliminations.
2016AED ‘000
2015AED ‘000
Balance sheetTotal assets – current 2,706,205 2,078,281Total liabilities – current (1,248,478) (1,216,917)Non-controlling interests (273,257) (3,104)Equity attributable to Owners of the Company 1,184,470 858,260
Year ended 31 December 2016
Year ended 31 December 2015
Profit or loss
Income from financial investments 261,290 91,230Expenses (50,645) (21,373)Profit for the year 210,645 69,857
Profit attributable to Owners of the Company 183,240 69,857Profit attributable to the non-controlling interests 27,405 –Profit for the year 210,645 69,857
Cash flowsNet cash inflow/(outflow) from operating activities 106,378 (216,067)Net cash outflow from investing activities (320,567) (620,117)Net cash inflow from financing activities 411,318 785,140Net cash inflow/(outflow) 197,129 (51,044)
66 Waha Capital Annual Report 2016

5.2b Anglo Arabian Healthcare Investments LLCAnglo Arabian Healthcare Investments LLC is a holding company for the Group’s 93% ownership interest in Proficiency Healthcare Diagnostics Laboratories LLC (2015: 93%), 70% in Sharjah Corniche Hospital LLC (“SCG”) and Health Bay Polyclinic (2015: 70%), 60% in Ibn Sina Medical Centre LLC and Oras Medical Center LLC (2015: 60%), and 100% in AAH Services FZ LLC (2015: 100%).
Summarised financial information in respect of Anglo Arabian Healthcare Investments LLC is set out below. The summarised financial information below represents amounts before intragroup eliminations.
2016AED ‘000
2015AED ‘000
Balance sheet
Non-current assets 222,375 205,693
Current assets 134,327 131,410
Current liabilities (138,528) (99,631)
Non-controlling interests (41,311) (53,616)
Equity attributable to Owners of the Company 176,863 183,856
Year ended 31 December 2016
Year ended 31 December 2015
Profit or loss
Revenue 295,115 247,974
Expenses (413,250) (277,543)
Loss for the year (118,135) (29,569)
Loss attributable to Owners of the Company (86,322) (20,106)
Loss attributable to the non-controlling interests (31,813) (9,463)
Loss for the year (118,135) (29,569)
Cash flows
Net cash outflow from operating activities (103,993) (52,343)
Net cash outflow from investing activities (16,681) (118,863)
Net cash inflow from financing activities 112,368 180,085
Net cash (outflow)/inflow (8,306) 8,879
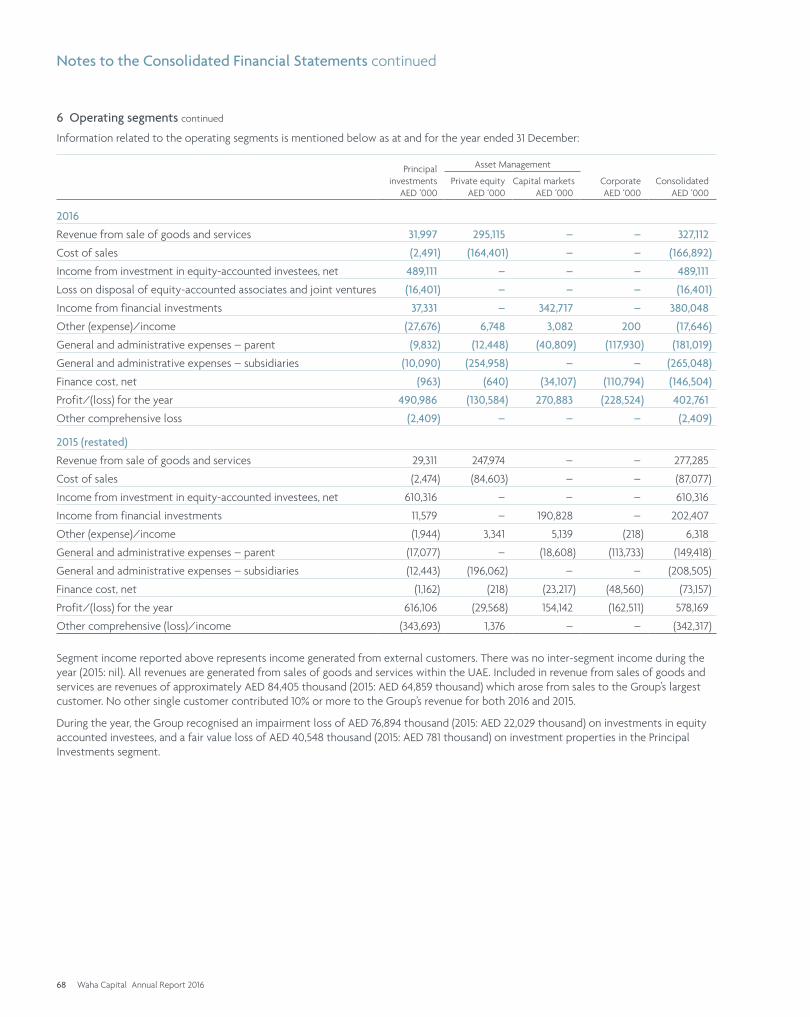
6 Operating segments
During the year, the Group realigned its operating segments following developments in key responsibilities of management and internal reporting. Following the realignment, the Principal Investments segment holds the Group’s industrial real estate division and NPS Holdings Limited in addition to the Group’s proprietary investments. The Asset Management – Private Equity segment holds the Group’s healthcare investment, Anglo Arabian Healthcare. Comparative periods were restated accordingly.
Based on the information reported to the Group’s Board of Directors for the allocation of resources, marketing strategies, management reporting lines and measurement of performance of business, the reportable segments under IFRS 8 were identified according to the structure of investment activities and services to customer groups.
Principal InvestmentsThe Principal Investments segment holds all of the Group’s proprietary investments in diversified industries including aviation leasing, maritime, financial services, infrastructure, oil and gas and industrial real estate.
Asset Management – Private EquityThe Private Equity segment represents a platform to provide investors access to attractive growth opportunities in the MENA region and currently holds investments in the healthcare industry.
Asset Management – Capital MarketsThe Capital Markets segment represents a platform to provide investors access to opportunities in equities and credit, and other asset management services.
67
Notes to the Consolidated Financial Statements continued
6 Operating segments continued
Information related to the operating segments is mentioned below as at and for the year ended 31 December:
Principal investments
AED ‘000
Asset Management
CorporateAED ‘000
ConsolidatedAED ‘000
Private equityAED ‘000
Capital marketsAED ‘000
2016
Revenue from sale of goods and services 31,997 295,115 – – 327,112
Cost of sales (2,491) (164,401) – – (166,892)
Income from investment in equity-accounted investees, net 489,111 – – – 489,111
Loss on disposal of equity-accounted associates and joint ventures (16,401) – – – (16,401)
Income from financial investments 37,331 – 342,717 – 380,048
Other (expense)/income (27,676) 6,748 3,082 200 (17,646)
General and administrative expenses – parent (9,832) (12,448) (40,809) (117,930) (181,019)
General and administrative expenses – subsidiaries (10,090) (254,958) – – (265,048)
Finance cost, net (963) (640) (34,107) (110,794) (146,504)
Profit/(loss) for the year 490,986 (130,584) 270,883 (228,524) 402,761
Other comprehensive loss (2,409) – – – (2,409)
2015 (restated)
Revenue from sale of goods and services 29,311 247,974 – – 277,285
Cost of sales (2,474) (84,603) – – (87,077)
Income from investment in equity-accounted investees, net 610,316 – – – 610,316
Income from financial investments 11,579 – 190,828 – 202,407
Other (expense)/income (1,944) 3,341 5,139 (218) 6,318
General and administrative expenses – parent (17,077) – (18,608) (113,733) (149,418)
General and administrative expenses – subsidiaries (12,443) (196,062) – – (208,505)
Finance cost, net (1,162) (218) (23,217) (48,560) (73,157)
Profit/(loss) for the year 616,106 (29,568) 154,142 (162,511) 578,169
Other comprehensive (loss)/income (343,693) 1,376 – – (342,317)
Segment income reported above represents income generated from external customers. There was no inter-segment income during the year (2015: nil). All revenues are generated from sales of goods and services within the UAE. Included in revenue from sales of goods and services are revenues of approximately AED 84,405 thousand (2015: AED 64,859 thousand) which arose from sales to the Group’s largest customer. No other single customer contributed 10% or more to the Group’s revenue for both 2016 and 2015.
During the year, the Group recognised an impairment loss of AED 76,894 thousand (2015: AED 22,029 thousand) on investments in equity accounted investees, and a fair value loss of AED 40,548 thousand (2015: AED 781 thousand) on investment properties in the Principal Investments segment.
68 Waha Capital Annual Report 2016
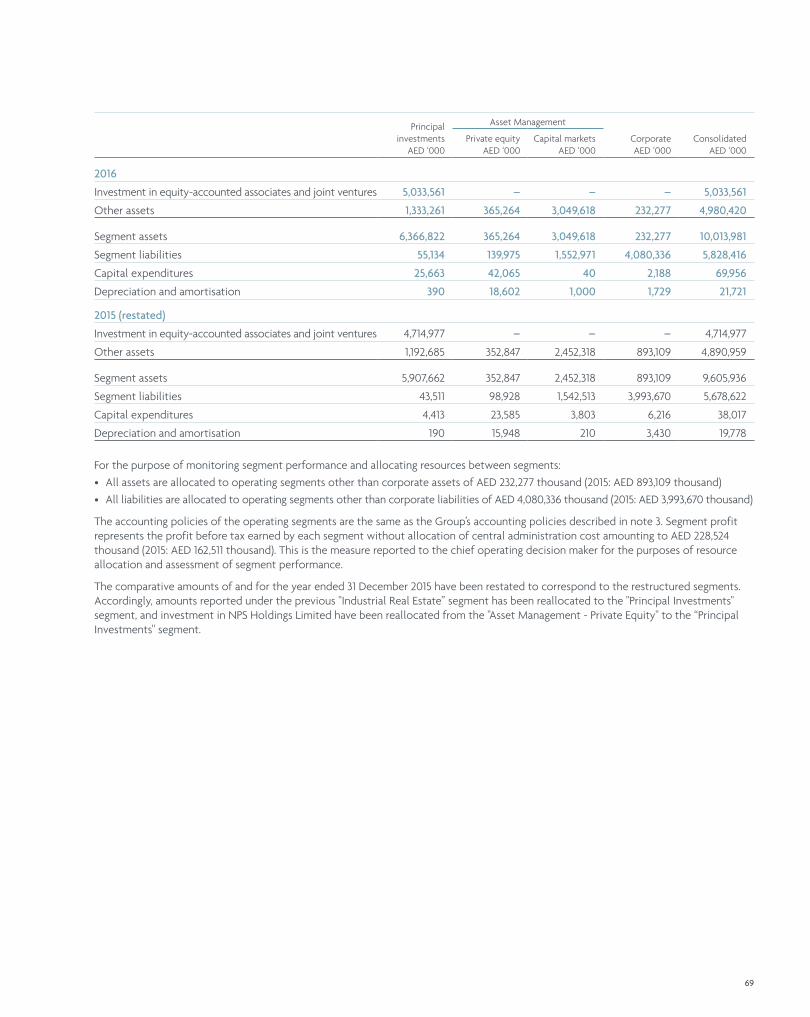
Principal investments
AED ‘000
Asset Management
CorporateAED ‘000
ConsolidatedAED ‘000
Private equityAED ‘000
Capital marketsAED ‘000
2016
Investment in equity-accounted associates and joint ventures 5,033,561 – – – 5,033,561
Other assets 1,333,261 365,264 3,049,618 232,277 4,980,420
Segment assets 6,366,822 365,264 3,049,618 232,277 10,013,981
Segment liabilities 55,134 139,975 1,552,971 4,080,336 5,828,416
Capital expenditures 25,663 42,065 40 2,188 69,956
Depreciation and amortisation 390 18,602 1,000 1,729 21,721
2015 (restated)
Investment in equity-accounted associates and joint ventures 4,714,977 – – – 4,714,977
Other assets 1,192,685 352,847 2,452,318 893,109 4,890,959
Segment assets 5,907,662 352,847 2,452,318 893,109 9,605,936
Segment liabilities 43,511 98,928 1,542,513 3,993,670 5,678,622
Capital expenditures 4,413 23,585 3,803 6,216 38,017
Depreciation and amortisation 190 15,948 210 3,430 19,778
For the purpose of monitoring segment performance and allocating resources between segments:
• All assets are allocated to operating segments other than corporate assets of AED 232,277 thousand (2015: AED 893,109 thousand)
• All liabilities are allocated to operating segments other than corporate liabilities of AED 4,080,336 thousand (2015: AED 3,993,670 thousand)
The accounting policies of the operating segments are the same as the Group’s accounting policies described in note 3. Segment profit represents the profit before tax earned by each segment without allocation of central administration cost amounting to AED 228,524 thousand (2015: AED 162,511 thousand). This is the measure reported to the chief operating decision maker for the purposes of resource allocation and assessment of segment performance.
The comparative amounts of and for the year ended 31 December 2015 have been restated to correspond to the restructured segments. Accordingly, amounts reported under the previous "Industrial Real Estate” segment has been reallocated to the "Principal Investments" segment, and investment in NPS Holdings Limited have been reallocated from the "Asset Management - Private Equity" to the “Principal Investments" segment.
69
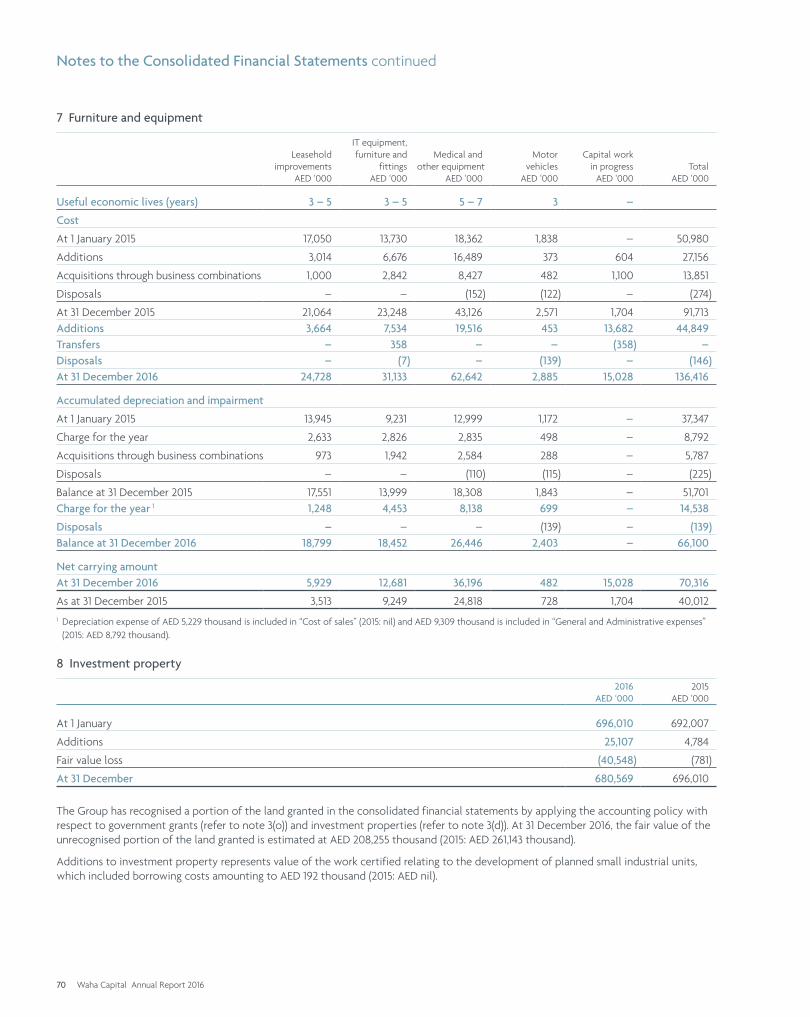
Notes to the Consolidated Financial Statements continued
7 Furniture and equipment
Leasehold improvements
AED ‘000
IT equipment, furniture and
fittingsAED ‘000
Medical and other equipment
AED ‘000
Motor vehicles
AED ‘000
Capital work in progress
AED ‘000Total
AED ‘000
Useful economic lives (years) 3 – 5 3 – 5 5 – 7 3 –
Cost
At 1 January 2015 17,050 13,730 18,362 1,838 – 50,980
Additions 3,014 6,676 16,489 373 604 27,156
Acquisitions through business combinations 1,000 2,842 8,427 482 1,100 13,851
Disposals – – (152) (122) – (274)
At 31 December 2015 21,064 23,248 43,126 2,571 1,704 91,713Additions 3,664 7,534 19,516 453 13,682 44,849Transfers – 358 – – (358) –Disposals – (7) – (139) – (146)At 31 December 2016 24,728 31,133 62,642 2,885 15,028 136,416
Accumulated depreciation and impairment
At 1 January 2015 13,945 9,231 12,999 1,172 – 37,347
Charge for the year 2,633 2,826 2,835 498 – 8,792
Acquisitions through business combinations 973 1,942 2,584 288 – 5,787
Disposals – – (110) (115) – (225)
Balance at 31 December 2015 17,551 13,999 18,308 1,843 – 51,701Charge for the year 1 1,248 4,453 8,138 699 – 14,538
Disposals – – – (139) – (139)Balance at 31 December 2016 18,799 18,452 26,446 2,403 – 66,100
Net carrying amountAt 31 December 2016 5,929 12,681 36,196 482 15,028 70,316
As at 31 December 2015 3,513 9,249 24,818 728 1,704 40,0121 Depreciation expense of AED 5,229 thousand is included in “Cost of sales” (2015: nil) and AED 9,309 thousand is included in “General and Administrative expenses”
(2015: AED 8,792 thousand).
8 Investment property
2016AED ‘000
2015AED ‘000
At 1 January 696,010 692,007
Additions 25,107 4,784
Fair value loss (40,548) (781)
At 31 December 680,569 696,010
The Group has recognised a portion of the land granted in the consolidated financial statements by applying the accounting policy with respect to government grants (refer to note 3(o)) and investment properties (refer to note 3(d)). At 31 December 2016, the fair value of the unrecognised portion of the land granted is estimated at AED 208,255 thousand (2015: AED 261,143 thousand).
Additions to investment property represents value of the work certified relating to the development of planned small industrial units, which included borrowing costs amounting to AED 192 thousand (2015: AED nil).
70 Waha Capital Annual Report 2016
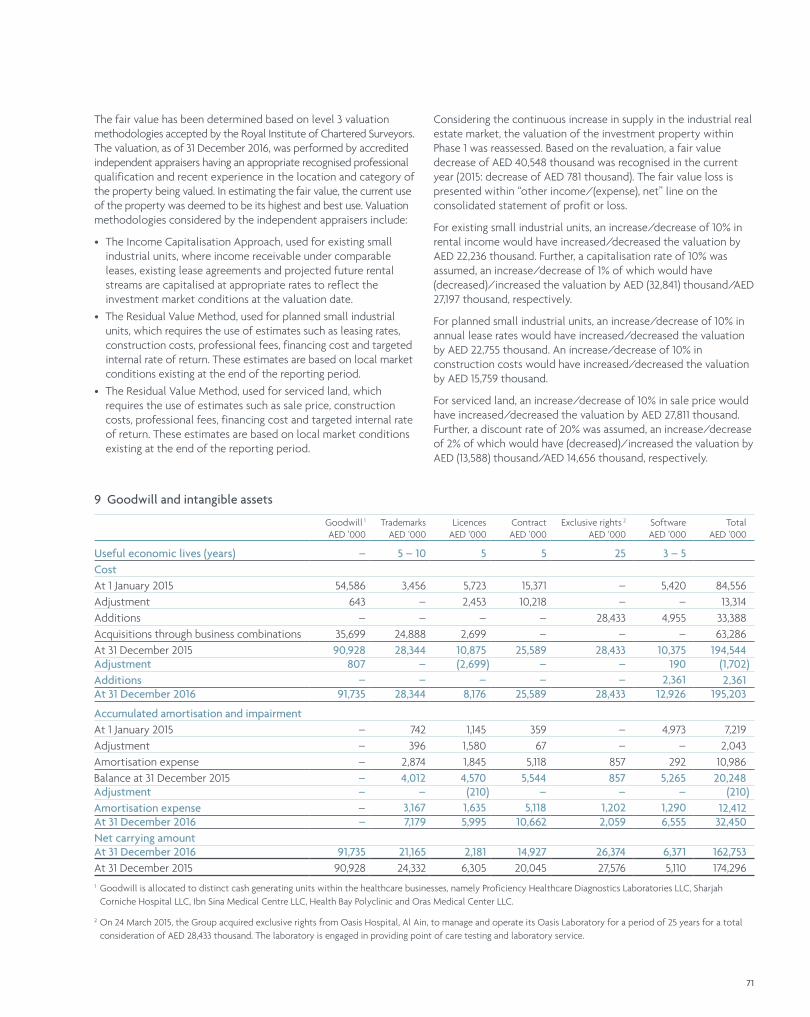
The fair value has been determined based on level 3 valuation methodologies accepted by the Royal Institute of Chartered Surveyors. The valuation, as of 31 December 2016, was performed by accredited independent appraisers having an appropriate recognised professional qualification and recent experience in the location and category of the property being valued. In estimating the fair value, the current use of the property was deemed to be its highest and best use. Valuation methodologies considered by the independent appraisers include:
• The Income Capitalisation Approach, used for existing small industrial units, where income receivable under comparable leases, existing lease agreements and projected future rental streams are capitalised at appropriate rates to reflect the investment market conditions at the valuation date.
• The Residual Value Method, used for planned small industrial units, which requires the use of estimates such as leasing rates, construction costs, professional fees, financing cost and targeted internal rate of return. These estimates are based on local market conditions existing at the end of the reporting period.
• The Residual Value Method, used for serviced land, which requires the use of estimates such as sale price, construction costs, professional fees, financing cost and targeted internal rate of return. These estimates are based on local market conditions existing at the end of the reporting period.
Considering the continuous increase in supply in the industrial real estate market, the valuation of the investment property within Phase 1 was reassessed. Based on the revaluation, a fair value decrease of AED 40,548 thousand was recognised in the current year (2015: decrease of AED 781 thousand). The fair value loss is presented within “other income/(expense), net” line on the consolidated statement of profit or loss.
For existing small industrial units, an increase/decrease of 10% in rental income would have increased/decreased the valuation by AED 22,236 thousand. Further, a capitalisation rate of 10% was assumed, an increase/decrease of 1% of which would have (decreased)/increased the valuation by AED (32,841) thousand/AED 27,197 thousand, respectively.
For planned small industrial units, an increase/decrease of 10% in annual lease rates would have increased/decreased the valuation by AED 22,755 thousand. An increase/decrease of 10% in construction costs would have increased/decreased the valuation by AED 15,759 thousand.
For serviced land, an increase/decrease of 10% in sale price would have increased/decreased the valuation by AED 27,811 thousand. Further, a discount rate of 20% was assumed, an increase/decrease of 2% of which would have (decreased)/increased the valuation by AED (13,588) thousand/AED 14,656 thousand, respectively.
9 Goodwill and intangible assets
Goodwill 1
AED ‘000Trademarks
AED ‘000Licences
AED ‘000ContractAED ‘000
Exclusive rights 2
AED ‘000SoftwareAED ‘000
TotalAED ‘000
Useful economic lives (years) – 5 – 10 5 5 25 3 – 5CostAt 1 January 2015 54,586 3,456 5,723 15,371 – 5,420 84,556Adjustment 643 – 2,453 10,218 – – 13,314Additions – – – – 28,433 4,955 33,388Acquisitions through business combinations 35,699 24,888 2,699 – – – 63,286At 31 December 2015 90,928 28,344 10,875 25,589 28,433 10,375 194,544Adjustment 807 – (2,699) – – 190 (1,702)Additions – – – – – 2,361 2,361At 31 December 2016 91,735 28,344 8,176 25,589 28,433 12,926 195,203
Accumulated amortisation and impairmentAt 1 January 2015 – 742 1,145 359 – 4,973 7,219Adjustment – 396 1,580 67 – – 2,043Amortisation expense – 2,874 1,845 5,118 857 292 10,986Balance at 31 December 2015 – 4,012 4,570 5,544 857 5,265 20,248Adjustment – – (210) – – – (210)Amortisation expense – 3,167 1,635 5,118 1,202 1,290 12,412At 31 December 2016 – 7,179 5,995 10,662 2,059 6,555 32,450Net carrying amountAt 31 December 2016 91,735 21,165 2,181 14,927 26,374 6,371 162,753At 31 December 2015 90,928 24,332 6,305 20,045 27,576 5,110 174,2961 Goodwill is allocated to distinct cash generating units within the healthcare businesses, namely Proficiency Healthcare Diagnostics Laboratories LLC, Sharjah
Corniche Hospital LLC, Ibn Sina Medical Centre LLC, Health Bay Polyclinic and Oras Medical Center LLC.
2 On 24 March 2015, the Group acquired exclusive rights from Oasis Hospital, Al Ain, to manage and operate its Oasis Laboratory for a period of 25 years for a total consideration of AED 28,433 thousand. The laboratory is engaged in providing point of care testing and laboratory service.
71
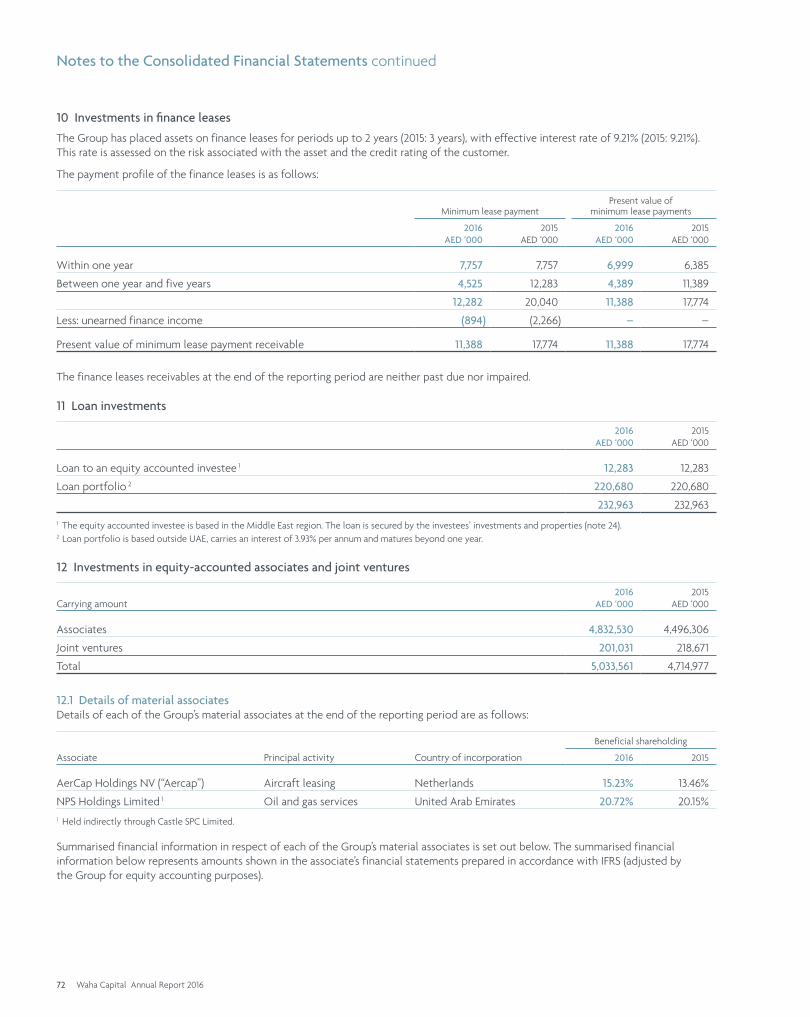
Notes to the Consolidated Financial Statements continued
10 Investments in finance leases
The Group has placed assets on finance leases for periods up to 2 years (2015: 3 years), with effective interest rate of 9.21% (2015: 9.21%). This rate is assessed on the risk associated with the asset and the credit rating of the customer.
The payment profile of the finance leases is as follows:
Minimum lease paymentPresent value of
minimum lease payments
2016AED ‘000
2015AED ‘000
2016AED ‘000
2015AED ‘000
Within one year 7,757 7,757 6,999 6,385
Between one year and five years 4,525 12,283 4,389 11,389
12,282 20,040 11,388 17,774
Less: unearned finance income (894) (2,266) – –
Present value of minimum lease payment receivable 11,388 17,774 11,388 17,774
The finance leases receivables at the end of the reporting period are neither past due nor impaired.
11 Loan investments
2016AED ‘000
2015AED ‘000
Loan to an equity accounted investee 1 12,283 12,283
Loan portfolio 2 220,680 220,680
232,963 232,9631 The equity accounted investee is based in the Middle East region. The loan is secured by the investees’ investments and properties (note 24).2 Loan portfolio is based outside UAE, carries an interest of 3.93% per annum and matures beyond one year.
12 Investments in equity-accounted associates and joint ventures
Carrying amount2016
AED ‘0002015
AED ‘000
Associates 4,832,530 4,496,306
Joint ventures 201,031 218,671
Total 5,033,561 4,714,977
12.1 Details of material associatesDetails of each of the Group’s material associates at the end of the reporting period are as follows:
Associate Principal activity Country of incorporation
Beneficial shareholding
2016 2015
AerCap Holdings NV (“Aercap”) Aircraft leasing Netherlands 15.23% 13.46%
NPS Holdings Limited 1 Oil and gas services United Arab Emirates 20.72% 20.15%1 Held indirectly through Castle SPC Limited.
Summarised financial information in respect of each of the Group’s material associates is set out below. The summarised financial information below represents amounts shown in the associate’s financial statements prepared in accordance with IFRS (adjusted by the Group for equity accounting purposes).
72 Waha Capital Annual Report 2016

AerCap NPS Holdings Limited
2016AED ‘000
2015AED ‘000
2016AED ‘000
2015AED ‘000
Statement of financial position
Current assets 29,223,946 31,468,747 578,020 573,341
Non-current assets 123,837,885 130,048,706 1,549,600 1,589,080
Current liabilities 19,553,142 20,897,760 245,981 201,113
Non-current liabilities 102,155,773 109,912,209 534,207 591,750
Statement of profit or loss
Revenue 18,949,538 19,447,627 824,295 749,264
Profit/(loss) for the year 3,849,505 4,335,369 (22,388) 13,307
Other comprehensive income for the year 16,691 2,163 – –
Total comprehensive income/(loss) for the year 3,866,196 4,337,532 (22,388) 13,307
Group’s share of contingencies 202,442 198,612 23,378 22,008
Group’s share of commitments 12,645,503 10,476,836 17,228 35,600
Reconciliation of the above summarised financial information to the carrying amount of the interest in the Group’s material associates recognised in the consolidated financial statements:
AerCap NPS Holdings Limited
2016AED ‘000
2015AED ‘000
2016AED ‘000
2015AED ‘000
Net assets of the associate 31,352,916 30,707,484 1,347,432 1,369,558
Proportion of the Group’s ownership interest 15.23% 13.46% 20.72% 20.15%
Group’s share of net assets of the associate 4,775,049 4,134,055 279,188 275,966
Goodwill – – – –
Other adjustments 1 (226,895) (60,375) (7,421) 4,199
Carrying amount of associate 4,548,154 4,073,680 271,767 280,1651 Includes fair value adjustments related to acquisitions.
During the year, the Group recognised net share of loss of AED 53,024 thousand from associates that are not individually material (2015: income of AED 551 thousand), the total carrying value of such investments amounting to AED 12,608 thousand (2015: AED 142,526 thousand).
During 2015, Aercap carried out a share buyback program, which the Group did not participate in. Consequently, the Group’s beneficial ownership increased from 12.64% to 13.46%.
During 2016, the Group concluded its open market program by acquiring an additional stake for an amount of AED 519,137 thousand. In addition, Aercap carried out a further share buyback program, which the Group did not participate in. Consequently, the Group’s beneficial ownership increased from 13.46% to 16.97%. Subsequently, the Group disposed of the additional stake bought during the year, for an amount of AED 643,797 thousand that resulted in a loss of AED 16,401 thousand, reducing the Group’s ownership from 16.97% to 15.23%.
During the year, the Group made an additional acquisition of NPS Holdings Limited shares for cash consideration of AED 7,141 thousand. This increased the Group’s beneficial ownership from 20.15% to 20.72%.
12.2 Details of material joint venturesDetails of each of the Group’s material joint ventures at the end of the reporting period are as follows.
Joint venture Principal activity Country of incorporation
Group’s shareholding
2016 2015
Dunia Finance 1 Banking UAE 25.00% 25.00%1 Dunia Finance includes Dunia Finance LLC and Dunia Services FZ-LLC
73
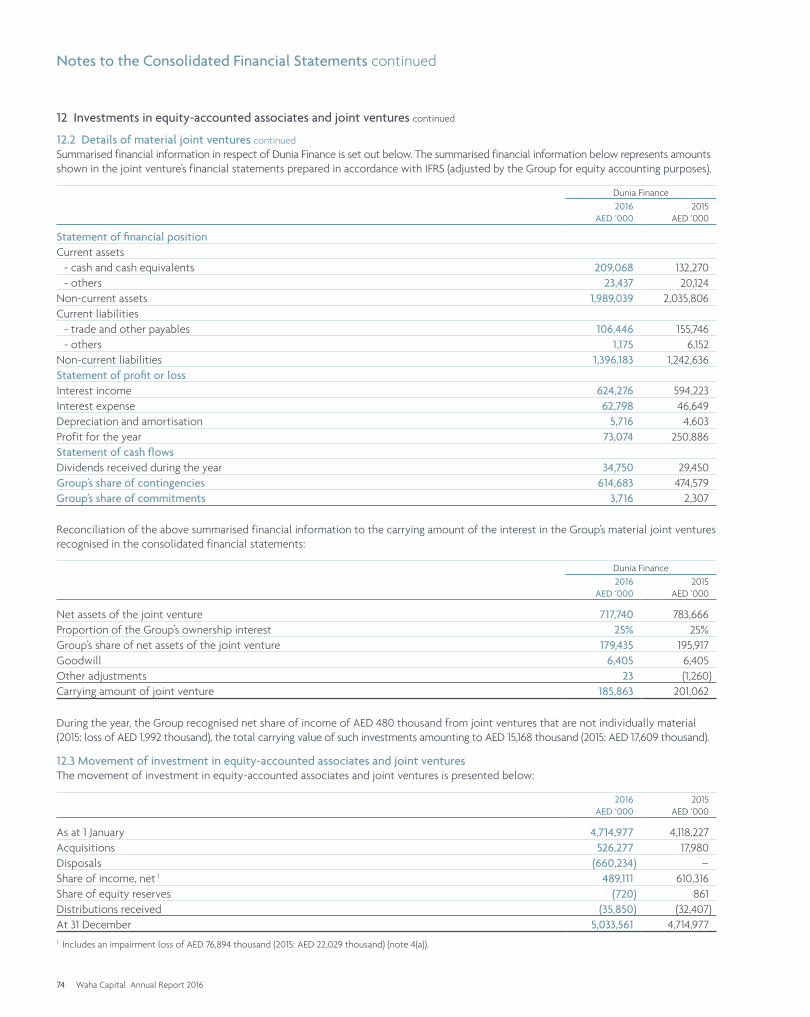
Notes to the Consolidated Financial Statements continued
12 Investments in equity-accounted associates and joint ventures continued
12.2 Details of material joint ventures continuedSummarised financial information in respect of Dunia Finance is set out below. The summarised financial information below represents amounts shown in the joint venture’s financial statements prepared in accordance with IFRS (adjusted by the Group for equity accounting purposes).
Dunia Finance2016
AED ‘0002015
AED ‘000
Statement of financial positionCurrent assets - cash and cash equivalents 209,068 132,270 - others 23,437 20,124Non-current assets 1,989,039 2,035,806Current liabilities - trade and other payables 106,446 155,746 - others 1,175 6,152Non-current liabilities 1,396,183 1,242,636Statement of profit or lossInterest income 624,276 594,223Interest expense 62,798 46,649Depreciation and amortisation 5,716 4,603Profit for the year 73,074 250,886Statement of cash flowsDividends received during the year 34,750 29,450Group’s share of contingencies 614,683 474,579Group’s share of commitments 3,716 2,307
Reconciliation of the above summarised financial information to the carrying amount of the interest in the Group’s material joint ventures recognised in the consolidated financial statements:
Dunia Finance2016
AED ‘0002015
AED ‘000
Net assets of the joint venture 717,740 783,666Proportion of the Group’s ownership interest 25% 25%Group’s share of net assets of the joint venture 179,435 195,917Goodwill 6,405 6,405Other adjustments 23 (1,260)Carrying amount of joint venture 185,863 201,062
During the year, the Group recognised net share of income of AED 480 thousand from joint ventures that are not individually material (2015: loss of AED 1,992 thousand), the total carrying value of such investments amounting to AED 15,168 thousand (2015: AED 17,609 thousand).
12.3 Movement of investment in equity-accounted associates and joint venturesThe movement of investment in equity-accounted associates and joint ventures is presented below:
2016AED ‘000
2015AED ‘000
As at 1 January 4,714,977 4,118,227Acquisitions 526,277 17,980Disposals (660,234) –Share of income, net 1 489,111 610,316Share of equity reserves (720) 861Distributions received (35,850) (32,407)At 31 December 5,033,561 4,714,9771 Includes an impairment loss of AED 76,894 thousand (2015: AED 22,029 thousand) (note 4(a)).
74 Waha Capital Annual Report 2016
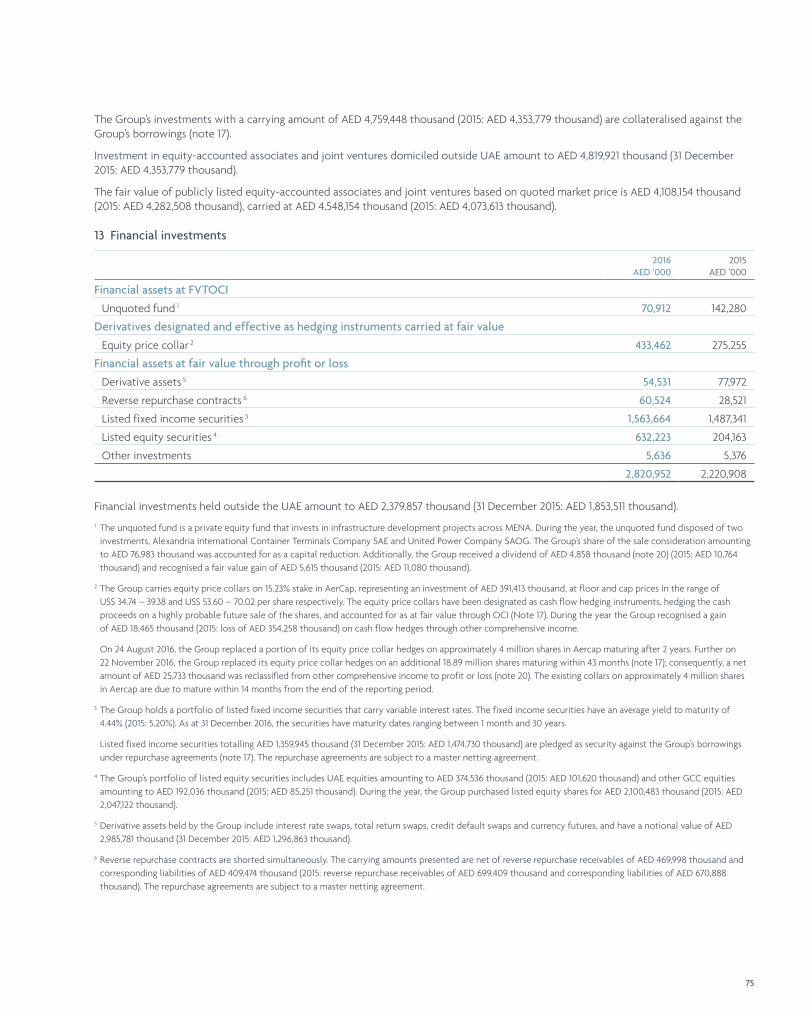
The Group’s investments with a carrying amount of AED 4,759,448 thousand (2015: AED 4,353,779 thousand) are collateralised against the Group’s borrowings (note 17).
Investment in equity-accounted associates and joint ventures domiciled outside UAE amount to AED 4,819,921 thousand (31 December 2015: AED 4,353,779 thousand).
The fair value of publicly listed equity-accounted associates and joint ventures based on quoted market price is AED 4,108,154 thousand (2015: AED 4,282,508 thousand), carried at AED 4,548,154 thousand (2015: AED 4,073,613 thousand).
13 Financial investments
2016AED ‘000
2015AED ‘000
Financial assets at FVTOCI Unquoted fund 1 70,912 142,280
Derivatives designated and effective as hedging instruments carried at fair value Equity price collar 2 433,462 275,255
Financial assets at fair value through profit or loss Derivative assets 5 54,531 77,972
Reverse repurchase contracts 6 60,524 28,521
Listed fixed income securities 3 1,563,664 1,487,341
Listed equity securities 4 632,223 204,163
Other investments 5,636 5,376
2,820,952 2,220,908
Financial investments held outside the UAE amount to AED 2,379,857 thousand (31 December 2015: AED 1,853,511 thousand).
1 The unquoted fund is a private equity fund that invests in infrastructure development projects across MENA. During the year, the unquoted fund disposed of two investments, Alexandria International Container Terminals Company SAE and United Power Company SAOG. The Group’s share of the sale consideration amounting to AED 76,983 thousand was accounted for as a capital reduction. Additionally, the Group received a dividend of AED 4,858 thousand (note 20) (2015: AED 10,764 thousand) and recognised a fair value gain of AED 5,615 thousand (2015: AED 11,080 thousand).
2 The Group carries equity price collars on 15.23% stake in AerCap, representing an investment of AED 391,413 thousand, at floor and cap prices in the range of US$ 34.74 – 39.38 and US$ 53.60 – 70.02 per share respectively. The equity price collars have been designated as cash flow hedging instruments, hedging the cash proceeds on a highly probable future sale of the shares, and accounted for as at fair value through OCI (Note 17). During the year the Group recognised a gain of AED 18,465 thousand (2015: loss of AED 354,258 thousand) on cash flow hedges through other comprehensive income.
On 24 August 2016, the Group replaced a portion of its equity price collar hedges on approximately 4 million shares in Aercap maturing after 2 years. Further on 22 November 2016, the Group replaced its equity price collar hedges on an additional 18.89 million shares maturing within 43 months (note 17); consequently, a net amount of AED 25,733 thousand was reclassified from other comprehensive income to profit or loss (note 20). The existing collars on approximately 4 million shares in Aercap are due to mature within 14 months from the end of the reporting period.
3 The Group holds a portfolio of listed fixed income securities that carry variable interest rates. The fixed income securities have an average yield to maturity of 4.44% (2015: 5.20%). As at 31 December 2016, the securities have maturity dates ranging between 1 month and 30 years.
Listed fixed income securities totalling AED 1,359,945 thousand (31 December 2015: AED 1,474,730 thousand) are pledged as security against the Group’s borrowings under repurchase agreements (note 17). The repurchase agreements are subject to a master netting agreement.
4 The Group’s portfolio of listed equity securities includes UAE equities amounting to AED 374,536 thousand (2015: AED 101,620 thousand) and other GCC equities amounting to AED 192,036 thousand (2015: AED 85,251 thousand). During the year, the Group purchased listed equity shares for AED 2,100,483 thousand (2015: AED 2,047,122 thousand).
5 Derivative assets held by the Group include interest rate swaps, total return swaps, credit default swaps and currency futures, and have a notional value of AED 2,985,781 thousand (31 December 2015: AED 1,296,863 thousand).
6 Reverse repurchase contracts are shorted simultaneously. The carrying amounts presented are net of reverse repurchase receivables of AED 469,998 thousand and corresponding liabilities of AED 409,474 thousand (2015: reverse repurchase receivables of AED 699,409 thousand and corresponding liabilities of AED 670,888 thousand). The repurchase agreements are subject to a master netting agreement.
75
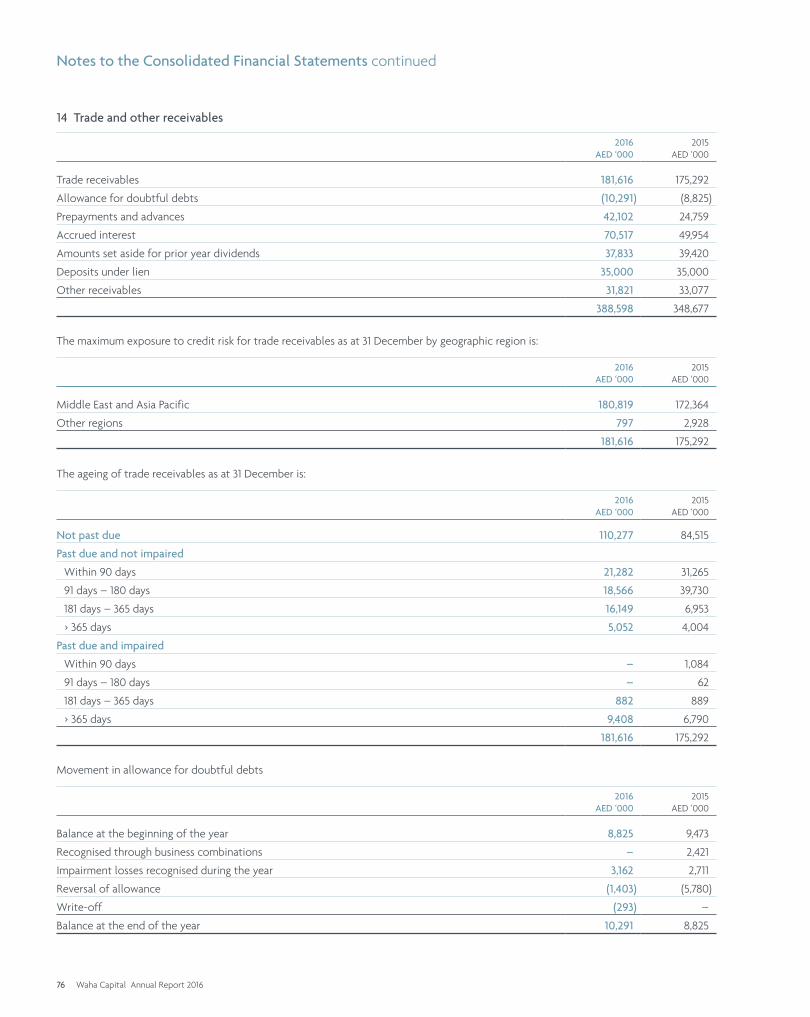
Notes to the Consolidated Financial Statements continued
14 Trade and other receivables
2016AED ‘000
2015AED ‘000
Trade receivables 181,616 175,292
Allowance for doubtful debts (10,291) (8,825)
Prepayments and advances 42,102 24,759
Accrued interest 70,517 49,954
Amounts set aside for prior year dividends 37,833 39,420
Deposits under lien 35,000 35,000
Other receivables 31,821 33,077
388,598 348,677
The maximum exposure to credit risk for trade receivables as at 31 December by geographic region is:
2016AED ‘000
2015AED ‘000
Middle East and Asia Pacific 180,819 172,364
Other regions 797 2,928
181,616 175,292
The ageing of trade receivables as at 31 December is:
2016AED ‘000
2015AED ‘000
Not past due 110,277 84,515
Past due and not impaired
Within 90 days 21,282 31,265
91 days – 180 days 18,566 39,730
181 days – 365 days 16,149 6,953
> 365 days 5,052 4,004
Past due and impaired
Within 90 days – 1,084
91 days – 180 days – 62
181 days – 365 days 882 889
> 365 days 9,408 6,790
181,616 175,292
Movement in allowance for doubtful debts
2016AED ‘000
2015AED ‘000
Balance at the beginning of the year 8,825 9,473
Recognised through business combinations – 2,421
Impairment losses recognised during the year 3,162 2,711
Reversal of allowance (1,403) (5,780)
Write-off (293) –
Balance at the end of the year 10,291 8,825
76 Waha Capital Annual Report 2016
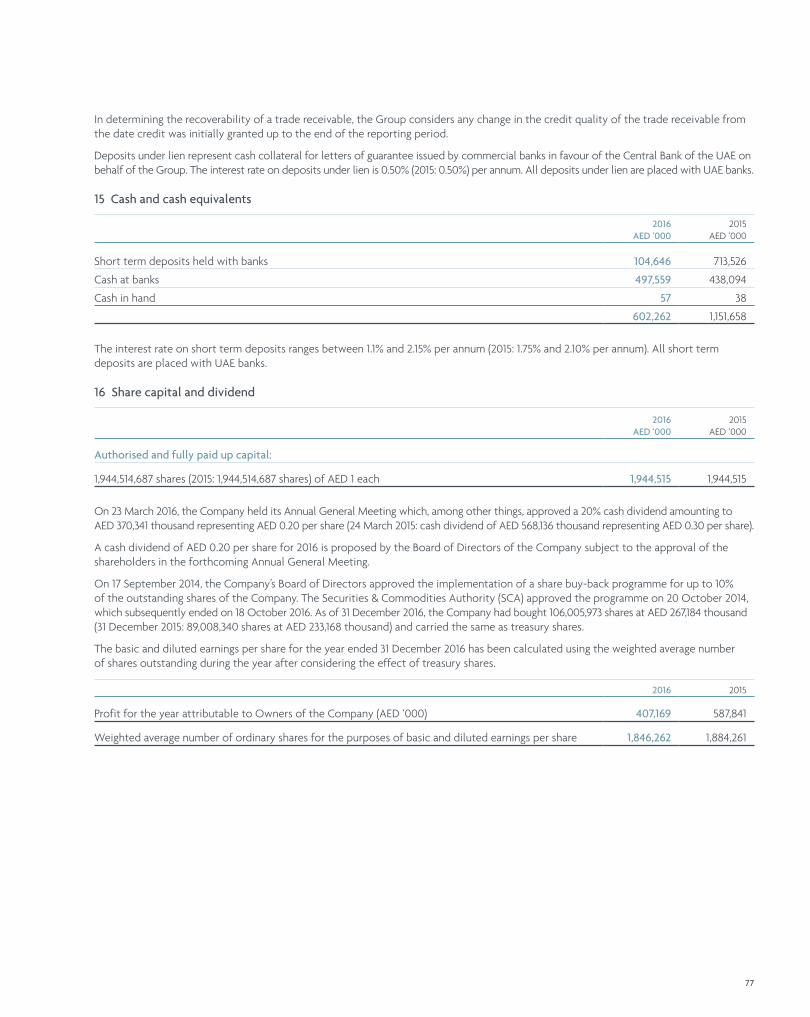
In determining the recoverability of a trade receivable, the Group considers any change in the credit quality of the trade receivable from the date credit was initially granted up to the end of the reporting period.
Deposits under lien represent cash collateral for letters of guarantee issued by commercial banks in favour of the Central Bank of the UAE on behalf of the Group. The interest rate on deposits under lien is 0.50% (2015: 0.50%) per annum. All deposits under lien are placed with UAE banks.
15 Cash and cash equivalents
2016AED ‘000
2015AED ‘000
Short term deposits held with banks 104,646 713,526
Cash at banks 497,559 438,094
Cash in hand 57 38
602,262 1,151,658
The interest rate on short term deposits ranges between 1.1% and 2.15% per annum (2015: 1.75% and 2.10% per annum). All short term deposits are placed with UAE banks.
16 Share capital and dividend
2016AED ‘000
2015AED ‘000
Authorised and fully paid up capital:
1,944,514,687 shares (2015: 1,944,514,687 shares) of AED 1 each 1,944,515 1,944,515
On 23 March 2016, the Company held its Annual General Meeting which, among other things, approved a 20% cash dividend amounting to AED 370,341 thousand representing AED 0.20 per share (24 March 2015: cash dividend of AED 568,136 thousand representing AED 0.30 per share).
A cash dividend of AED 0.20 per share for 2016 is proposed by the Board of Directors of the Company subject to the approval of the shareholders in the forthcoming Annual General Meeting.
On 17 September 2014, the Company’s Board of Directors approved the implementation of a share buy-back programme for up to 10% of the outstanding shares of the Company. The Securities & Commodities Authority (SCA) approved the programme on 20 October 2014, which subsequently ended on 18 October 2016. As of 31 December 2016, the Company had bought 106,005,973 shares at AED 267,184 thousand (31 December 2015: 89,008,340 shares at AED 233,168 thousand) and carried the same as treasury shares.
The basic and diluted earnings per share for the year ended 31 December 2016 has been calculated using the weighted average number of shares outstanding during the year after considering the effect of treasury shares.
2016 2015
Profit for the year attributable to Owners of the Company (AED ‘000) 407,169 587,841
Weighted average number of ordinary shares for the purposes of basic and diluted earnings per share 1,846,262 1,884,261
77
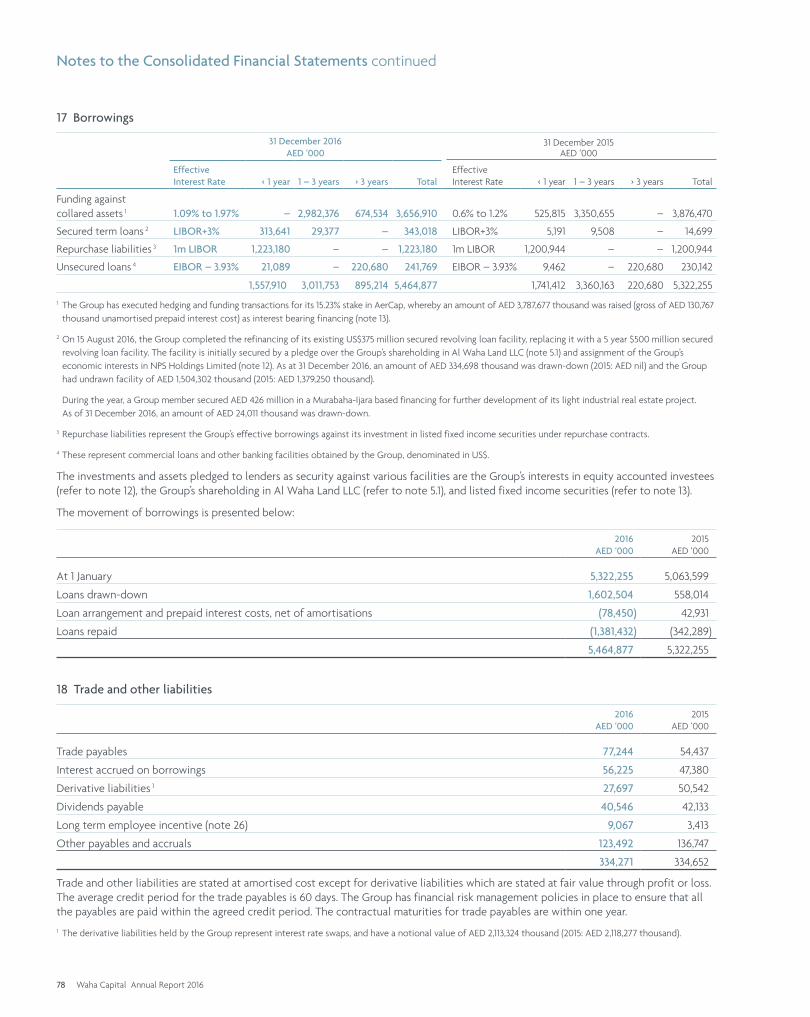
Notes to the Consolidated Financial Statements continued
17 Borrowings
31 December 2016 AED ‘000
31 December 2015 AED ‘000
Effective Interest Rate < 1 year 1 – 3 years > 3 years Total
Effective Interest Rate < 1 year 1 – 3 years > 3 years Total
Funding against collared assets 1 1.09% to 1.97% – 2,982,376 674,534 3,656,910 0.6% to 1.2% 525,815 3,350,655 – 3,876,470
Secured term loans 2 LIBOR+3% 313,641 29,377 – 343,018 LIBOR+3% 5,191 9,508 – 14,699
Repurchase liabilities 3 1m LIBOR 1,223,180 – – 1,223,180 1m LIBOR 1,200,944 – – 1,200,944
Unsecured loans 4 EIBOR – 3.93% 21,089 – 220,680 241,769 EIBOR – 3.93% 9,462 – 220,680 230,142
1,557,910 3,011,753 895,214 5,464,877 1,741,412 3,360,163 220,680 5,322,2551 The Group has executed hedging and funding transactions for its 15.23% stake in AerCap, whereby an amount of AED 3,787,677 thousand was raised (gross of AED 130,767
thousand unamortised prepaid interest cost) as interest bearing financing (note 13).
2 On 15 August 2016, the Group completed the refinancing of its existing US$375 million secured revolving loan facility, replacing it with a 5 year $500 million secured revolving loan facility. The facility is initially secured by a pledge over the Group’s shareholding in Al Waha Land LLC (note 5.1) and assignment of the Group’s economic interests in NPS Holdings Limited (note 12). As at 31 December 2016, an amount of AED 334,698 thousand was drawn-down (2015: AED nil) and the Group had undrawn facility of AED 1,504,302 thousand (2015: AED 1,379,250 thousand).
During the year, a Group member secured AED 426 million in a Murabaha-Ijara based financing for further development of its light industrial real estate project. As of 31 December 2016, an amount of AED 24,011 thousand was drawn-down.
3 Repurchase liabilities represent the Group’s effective borrowings against its investment in listed fixed income securities under repurchase contracts.
4 These represent commercial loans and other banking facilities obtained by the Group, denominated in US$.
The investments and assets pledged to lenders as security against various facilities are the Group’s interests in equity accounted investees (refer to note 12), the Group’s shareholding in Al Waha Land LLC (refer to note 5.1), and listed fixed income securities (refer to note 13).
The movement of borrowings is presented below:
2016AED ‘000
2015AED ‘000
At 1 January 5,322,255 5,063,599
Loans drawn-down 1,602,504 558,014
Loan arrangement and prepaid interest costs, net of amortisations (78,450) 42,931
Loans repaid (1,381,432) (342,289)
5,464,877 5,322,255
18 Trade and other liabilities
2016AED ‘000
2015AED ‘000
Trade payables 77,244 54,437
Interest accrued on borrowings 56,225 47,380
Derivative liabilities 1 27,697 50,542
Dividends payable 40,546 42,133
Long term employee incentive (note 26) 9,067 3,413
Other payables and accruals 123,492 136,747
334,271 334,652
Trade and other liabilities are stated at amortised cost except for derivative liabilities which are stated at fair value through profit or loss. The average credit period for the trade payables is 60 days. The Group has financial risk management policies in place to ensure that all the payables are paid within the agreed credit period. The contractual maturities for trade payables are within one year.
1 The derivative liabilities held by the Group represent interest rate swaps, and have a notional value of AED 2,113,324 thousand (2015: AED 2,118,277 thousand).
78 Waha Capital Annual Report 2016
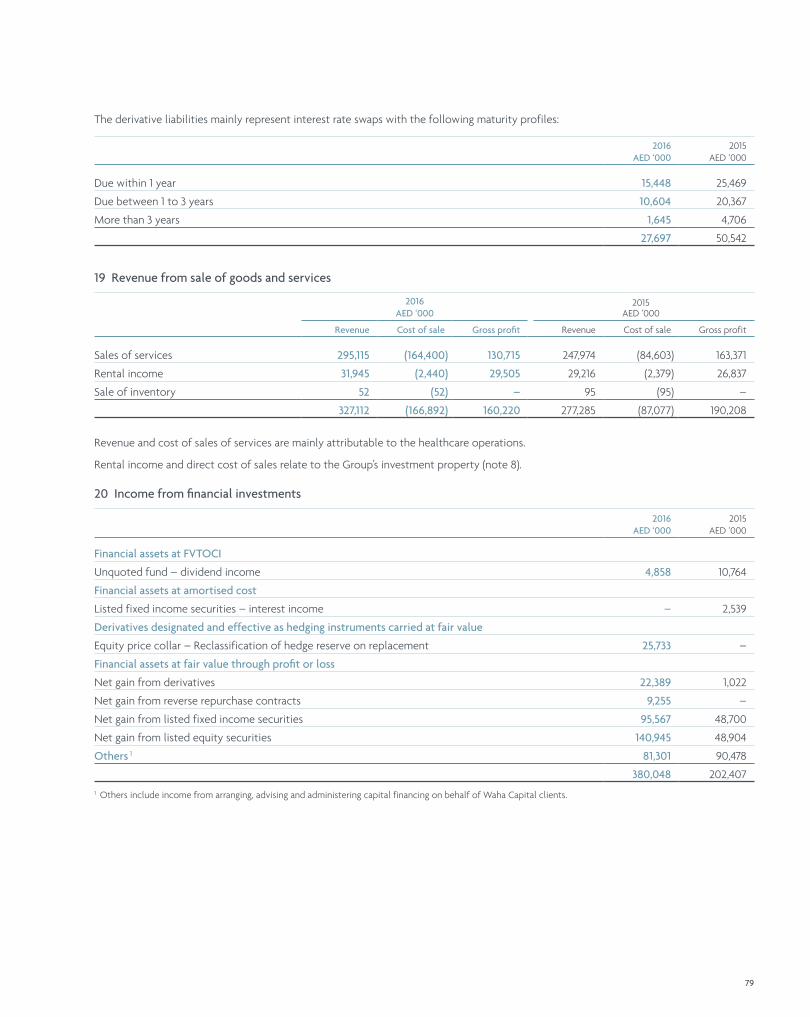
The derivative liabilities mainly represent interest rate swaps with the following maturity profiles:
2016AED ‘000
2015AED ‘000
Due within 1 year 15,448 25,469
Due between 1 to 3 years 10,604 20,367
More than 3 years 1,645 4,706
27,697 50,542
19 Revenue from sale of goods and services
2016 AED ‘000
2015 AED ‘000
Revenue Cost of sale Gross profit Revenue Cost of sale Gross profit
Sales of services 295,115 (164,400) 130,715 247,974 (84,603) 163,371
Rental income 31,945 (2,440) 29,505 29,216 (2,379) 26,837
Sale of inventory 52 (52) – 95 (95) –
327,112 (166,892) 160,220 277,285 (87,077) 190,208
Revenue and cost of sales of services are mainly attributable to the healthcare operations.
Rental income and direct cost of sales relate to the Group’s investment property (note 8).
20 Income from financial investments
2016AED ‘000
2015AED ‘000
Financial assets at FVTOCI
Unquoted fund – dividend income 4,858 10,764
Financial assets at amortised cost
Listed fixed income securities – interest income – 2,539
Derivatives designated and effective as hedging instruments carried at fair value
Equity price collar – Reclassification of hedge reserve on replacement 25,733 –
Financial assets at fair value through profit or loss
Net gain from derivatives 22,389 1,022
Net gain from reverse repurchase contracts 9,255 –
Net gain from listed fixed income securities 95,567 48,700
Net gain from listed equity securities 140,945 48,904
Others 1 81,301 90,478
380,048 202,4071 Others include income from arranging, advising and administering capital financing on behalf of Waha Capital clients.
79
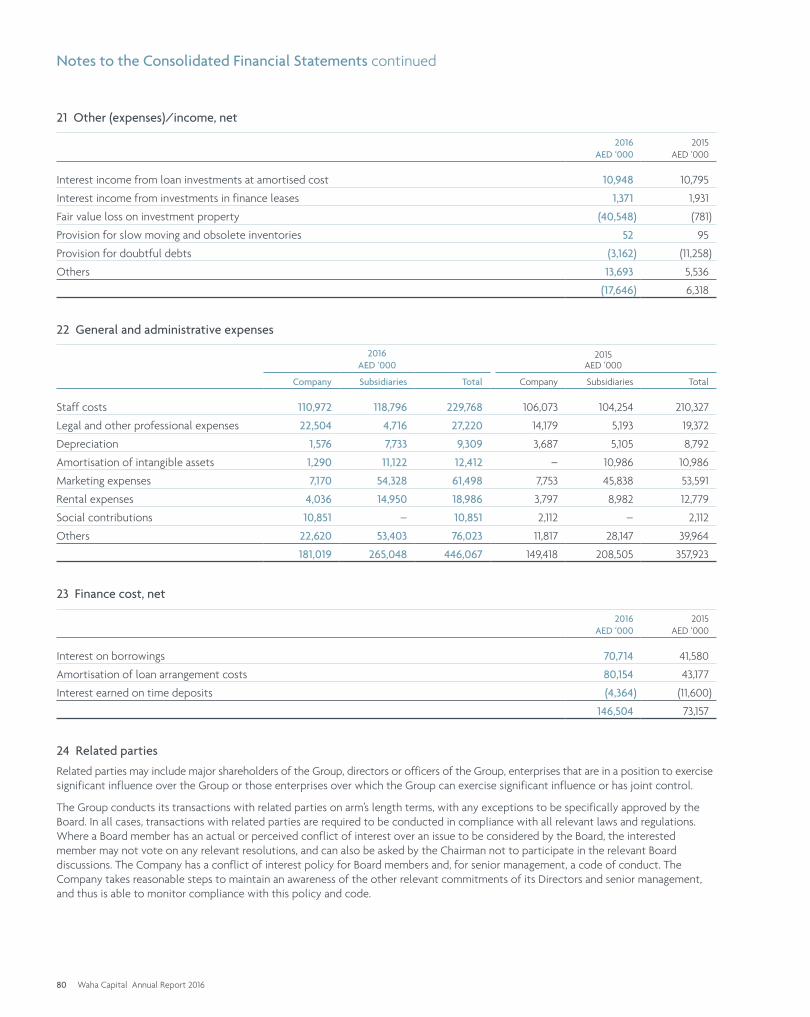
Notes to the Consolidated Financial Statements continued
21 Other (expenses)/income, net
2016AED ‘000
2015AED ‘000
Interest income from loan investments at amortised cost 10,948 10,795
Interest income from investments in finance leases 1,371 1,931
Fair value loss on investment property (40,548) (781)
Provision for slow moving and obsolete inventories 52 95
Provision for doubtful debts (3,162) (11,258)
Others 13,693 5,536
(17,646) 6,318
22 General and administrative expenses
2016 AED ‘000
2015 AED ‘000
Company Subsidiaries Total Company Subsidiaries Total
Staff costs 110,972 118,796 229,768 106,073 104,254 210,327
Legal and other professional expenses 22,504 4,716 27,220 14,179 5,193 19,372
Depreciation 1,576 7,733 9,309 3,687 5,105 8,792
Amortisation of intangible assets 1,290 11,122 12,412 – 10,986 10,986
Marketing expenses 7,170 54,328 61,498 7,753 45,838 53,591
Rental expenses 4,036 14,950 18,986 3,797 8,982 12,779
Social contributions 10,851 – 10,851 2,112 – 2,112
Others 22,620 53,403 76,023 11,817 28,147 39,964
181,019 265,048 446,067 149,418 208,505 357,923
23 Finance cost, net
2016AED ‘000
2015AED ‘000
Interest on borrowings 70,714 41,580
Amortisation of loan arrangement costs 80,154 43,177
Interest earned on time deposits (4,364) (11,600)
146,504 73,157
24 Related parties
Related parties may include major shareholders of the Group, directors or officers of the Group, enterprises that are in a position to exercise significant influence over the Group or those enterprises over which the Group can exercise significant influence or has joint control.
The Group conducts its transactions with related parties on arm’s length terms, with any exceptions to be specifically approved by the Board. In all cases, transactions with related parties are required to be conducted in compliance with all relevant laws and regulations. Where a Board member has an actual or perceived conflict of interest over an issue to be considered by the Board, the interested member may not vote on any relevant resolutions, and can also be asked by the Chairman not to participate in the relevant Board discussions. The Company has a conflict of interest policy for Board members and, for senior management, a code of conduct. The Company takes reasonable steps to maintain an awareness of the other relevant commitments of its Directors and senior management, and thus is able to monitor compliance with this policy and code.
80 Waha Capital Annual Report 2016
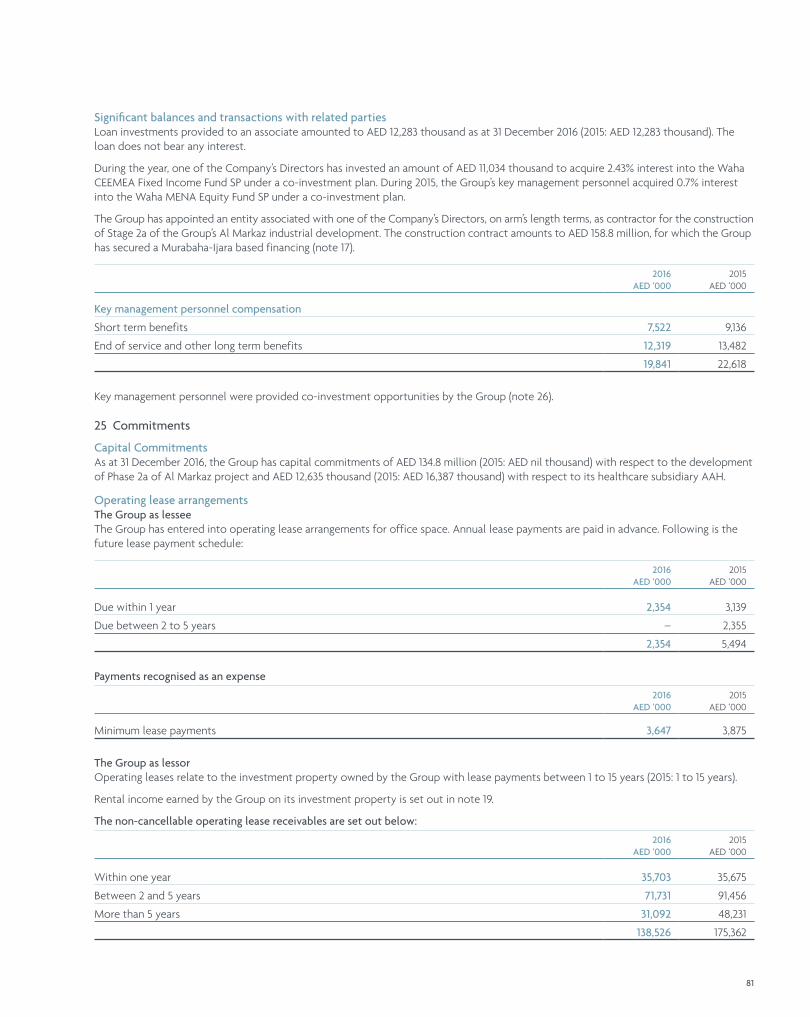
Significant balances and transactions with related partiesLoan investments provided to an associate amounted to AED 12,283 thousand as at 31 December 2016 (2015: AED 12,283 thousand). The loan does not bear any interest.
During the year, one of the Company’s Directors has invested an amount of AED 11,034 thousand to acquire 2.43% interest into the Waha CEEMEA Fixed Income Fund SP under a co-investment plan. During 2015, the Group’s key management personnel acquired 0.7% interest into the Waha MENA Equity Fund SP under a co-investment plan.
The Group has appointed an entity associated with one of the Company’s Directors, on arm’s length terms, as contractor for the construction of Stage 2a of the Group’s Al Markaz industrial development. The construction contract amounts to AED 158.8 million, for which the Group has secured a Murabaha-Ijara based financing (note 17).
2016AED ‘000
2015AED ‘000
Key management personnel compensation
Short term benefits 7,522 9,136
End of service and other long term benefits 12,319 13,482
19,841 22,618
Key management personnel were provided co-investment opportunities by the Group (note 26).
25 Commitments
Capital CommitmentsAs at 31 December 2016, the Group has capital commitments of AED 134.8 million (2015: AED nil thousand) with respect to the development of Phase 2a of Al Markaz project and AED 12,635 thousand (2015: AED 16,387 thousand) with respect to its healthcare subsidiary AAH.
Operating lease arrangementsThe Group as lesseeThe Group has entered into operating lease arrangements for office space. Annual lease payments are paid in advance. Following is the future lease payment schedule:
2016AED ‘000
2015AED ‘000
Due within 1 year 2,354 3,139
Due between 2 to 5 years – 2,355
2,354 5,494
Payments recognised as an expense
2016AED ‘000
2015AED ‘000
Minimum lease payments 3,647 3,875
The Group as lessorOperating leases relate to the investment property owned by the Group with lease payments between 1 to 15 years (2015: 1 to 15 years).
Rental income earned by the Group on its investment property is set out in note 19.
The non-cancellable operating lease receivables are set out below:
2016AED ‘000
2015AED ‘000
Within one year 35,703 35,675
Between 2 and 5 years 71,731 91,456
More than 5 years 31,092 48,231
138,526 175,362
81
Notes to the Consolidated Financial Statements continued
26 Employee compensation
In designing its employee compensation plans, the Group’s primary objective is to provide employees with a robust compensation platform upon which they are encouraged to pursue outstanding returns and to reward them based on their results in line with the interests of the Group. This is achieved through a combination of cash salaries, variable bonuses dependent upon Group and individual’s performance, and participation in various long term employee incentive and co-investment programs described below.
Investment profit participation plansDuring the current year, the Group’s Board of Directors has approved the following cash settled long term incentive plan for certain employees linked to investment profit participation:
• A short term trading plan, whereby the employees are granted points linked to the trading fund’s performance which vests progressively over three years from the effective grant date, subject to continued employment. A cash amount representing the value of vested points derived from the fund’s net asset value is paid after completing the service condition.
• A long term carried interest plan, whereby the employees are granted points linked to the realized Internal Rate of Return set for the specifically identified investments, which vest progressively, subject to continued employment and the investment exit. A cash amount representing the value of vested points is paid upon completion of the service condition and exit of the underlying investments, provided certain minimum pre-established return hurdles are satisfied.
In addition, Anglo Arabian Healthcare group (“AAH”) has approved a separate long term incentive plan for its management team. Under this plan, the employees shall receive a cash amount based on the exit value of AAH, subject to the Group achieving certain financial targets, and the employees meeting the relevant service conditions.
Share linked planDuring the current year, the Group’s Board of Directors has approved a cash settled share linked incentive plan for the management team, under which certain employees receive restricted stock units of Waha Capital PJSC, which vest progressively, over three years from the effective grant date, subject to continued employment. A cash amount representing the value of the vested shares, based on the latest share price, is paid upon the employee successfully completing the three year service condition.
For the current year, an amount of AED 26,530 thousand (2015: AED 35,000 thousand) was recognised as employee costs on account of variable performance based pay outs, which includes an amount of AED 5,654 thousand (2015: AED 3,413 thousand) accrued on account of vested long term incentive pay outs under different plans (note 18). As at 31 December 2016, the cumulated grants on account of long term incentive pay outs under different plans were AED 17,614 thousand (2015: AED 9,281 thousand), of which there were no amounts in either years that were expired or cancelled. The accrual was made using appropriate valuation techniques, considering the probability of relevant variable factors as outlined above and time value of money.
Programs for co-investmentInvestment professionals also participate in a co-investment program pursuant to which they acquire an interest in the Group's investments which they manage, at the Group's proportionate investment carrying value, thereby resulting in no gain or loss to the Group. In 2015, the Group has provided co-investment opportunities for 0.7% of Waha Investment Management Company SPC to its employees under co-investment programs (note 24).
27 Financial instruments
OverviewThe Group has exposure to the following risks from its use of financial instruments:
• credit risk
• liquidity risk
• market risk
• operational risk
This note presents information about the Group’s exposure to each of the above risks, the Group’s objectives, policies and processes for measuring and managing risk, and the Group’s management of capital. Further quantitative disclosures are included throughout these consolidated financial statements.
Risk management frameworkThe Board of Directors has overall responsibility for the establishment and oversight of the Group’s risk management framework. Management has established a committee comprising of senior management, which is responsible for developing and monitoring the Group’s risk management policies. The Group’s risk management policies are established to identify and analyse the risks faced by the Group, to set appropriate risk limits and controls, and to monitor risks and adherence to limits. Risk management policies and systems are reviewed regularly to reflect changes in market conditions and the Group’s activities. The Group, through its training and management standards and procedures, aims to develop a disciplined and constructive control environment in which all employees understand their roles and obligations.
The Group Audit Committee oversees how management monitors compliance with the Group’s risk management policies and procedures, and reviews the adequacy of the risk management framework in relation to the risks faced by the Group. The Group Audit Committee is assisted in its oversight role by an internal audit team. The Internal audit team undertakes regular reviews of risk management controls and procedures, the results of which are reported to the Audit Committee.
Credit riskCredit risk is the risk of financial loss to the Group if a customer or counterparty to a financial instrument fails to meet its contractual obligations, and arises principally from the Group’s receivables from customer, derivative assets, cash and cash equivalents, loan investments and finance leases.
82 Waha Capital Annual Report 2016
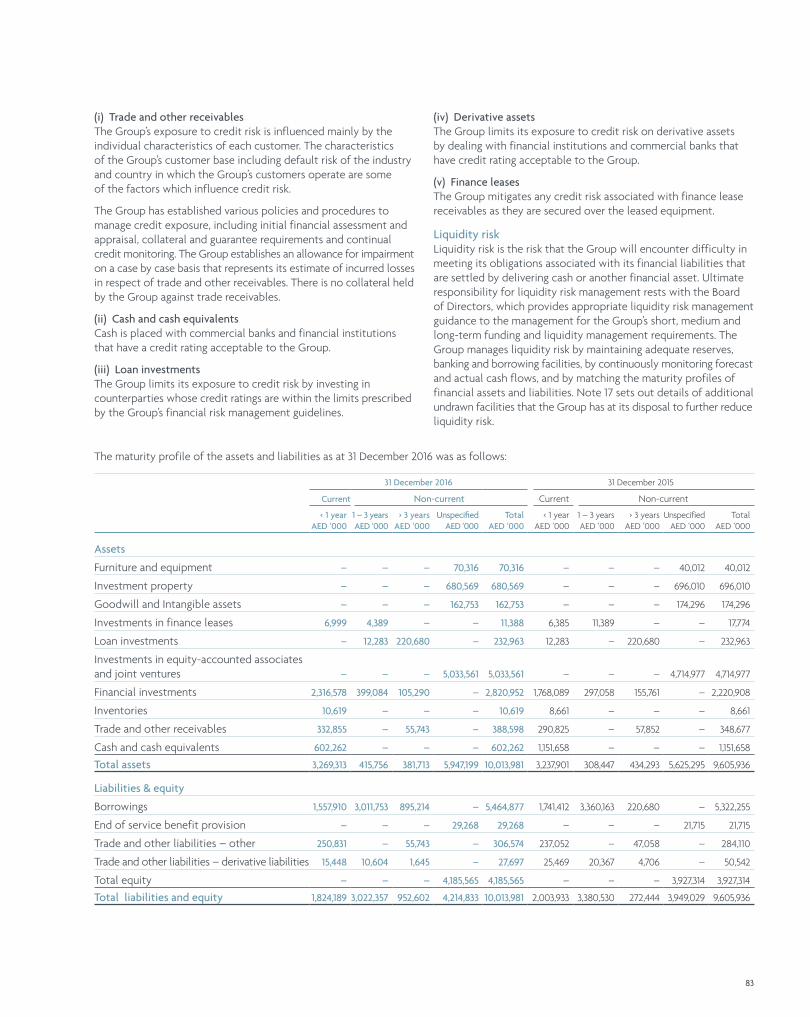
(i) Trade and other receivablesThe Group’s exposure to credit risk is influenced mainly by the individual characteristics of each customer. The characteristics of the Group’s customer base including default risk of the industry and country in which the Group’s customers operate are some of the factors which influence credit risk.
The Group has established various policies and procedures to manage credit exposure, including initial financial assessment and appraisal, collateral and guarantee requirements and continual credit monitoring. The Group establishes an allowance for impairment on a case by case basis that represents its estimate of incurred losses in respect of trade and other receivables. There is no collateral held by the Group against trade receivables.
(ii) Cash and cash equivalentsCash is placed with commercial banks and financial institutions that have a credit rating acceptable to the Group.
(iii) Loan investmentsThe Group limits its exposure to credit risk by investing in counterparties whose credit ratings are within the limits prescribed by the Group’s financial risk management guidelines.
(iv) Derivative assetsThe Group limits its exposure to credit risk on derivative assets by dealing with financial institutions and commercial banks that have credit rating acceptable to the Group.
(v) Finance leasesThe Group mitigates any credit risk associated with finance lease receivables as they are secured over the leased equipment.
Liquidity riskLiquidity risk is the risk that the Group will encounter difficulty in meeting its obligations associated with its financial liabilities that are settled by delivering cash or another financial asset. Ultimate responsibility for liquidity risk management rests with the Board of Directors, which provides appropriate liquidity risk management guidance to the management for the Group’s short, medium and long-term funding and liquidity management requirements. The Group manages liquidity risk by maintaining adequate reserves, banking and borrowing facilities, by continuously monitoring forecast and actual cash flows, and by matching the maturity profiles of financial assets and liabilities. Note 17 sets out details of additional undrawn facilities that the Group has at its disposal to further reduce liquidity risk.
The maturity profile of the assets and liabilities as at 31 December 2016 was as follows:
31 December 2016 31 December 2015
Current Non-current Current Non-current
< 1 yearAED ‘000
1 – 3 yearsAED ‘000
> 3 yearsAED ‘000
UnspecifiedAED ‘000
TotalAED ‘000
< 1 yearAED ‘000
1 – 3 yearsAED ‘000
> 3 yearsAED ‘000
UnspecifiedAED ‘000
TotalAED ‘000
Assets
Furniture and equipment – – – 70,316 70,316 – – – 40,012 40,012
Investment property – – – 680,569 680,569 – – – 696,010 696,010
Goodwill and Intangible assets – – – 162,753 162,753 – – – 174,296 174,296
Investments in finance leases 6,999 4,389 – – 11,388 6,385 11,389 – – 17,774
Loan investments – 12,283 220,680 – 232,963 12,283 – 220,680 – 232,963
Investments in equity-accounted associates and joint ventures – – – 5,033,561 5,033,561 – – – 4,714,977 4,714,977
Financial investments 2,316,578 399,084 105,290 – 2,820,952 1,768,089 297,058 155,761 – 2,220,908
Inventories 10,619 – – – 10,619 8,661 – – – 8,661
Trade and other receivables 332,855 – 55,743 – 388,598 290,825 – 57,852 – 348,677
Cash and cash equivalents 602,262 – – – 602,262 1,151,658 – – – 1,151,658
Total assets 3,269,313 415,756 381,713 5,947,199 10,013,981 3,237,901 308,447 434,293 5,625,295 9,605,936
Liabilities & equity
Borrowings 1,557,910 3,011,753 895,214 – 5,464,877 1,741,412 3,360,163 220,680 – 5,322,255
End of service benefit provision – – – 29,268 29,268 – – – 21,715 21,715
Trade and other liabilities – other 250,831 – 55,743 – 306,574 237,052 – 47,058 – 284,110
Trade and other liabilities – derivative liabilities 15,448 10,604 1,645 – 27,697 25,469 20,367 4,706 – 50,542
Total equity – – – 4,185,565 4,185,565 – – – 3,927,314 3,927,314
Total liabilities and equity 1,824,189 3,022,357 952,602 4,214,833 10,013,981 2,003,933 3,380,530 272,444 3,949,029 9,605,936
83
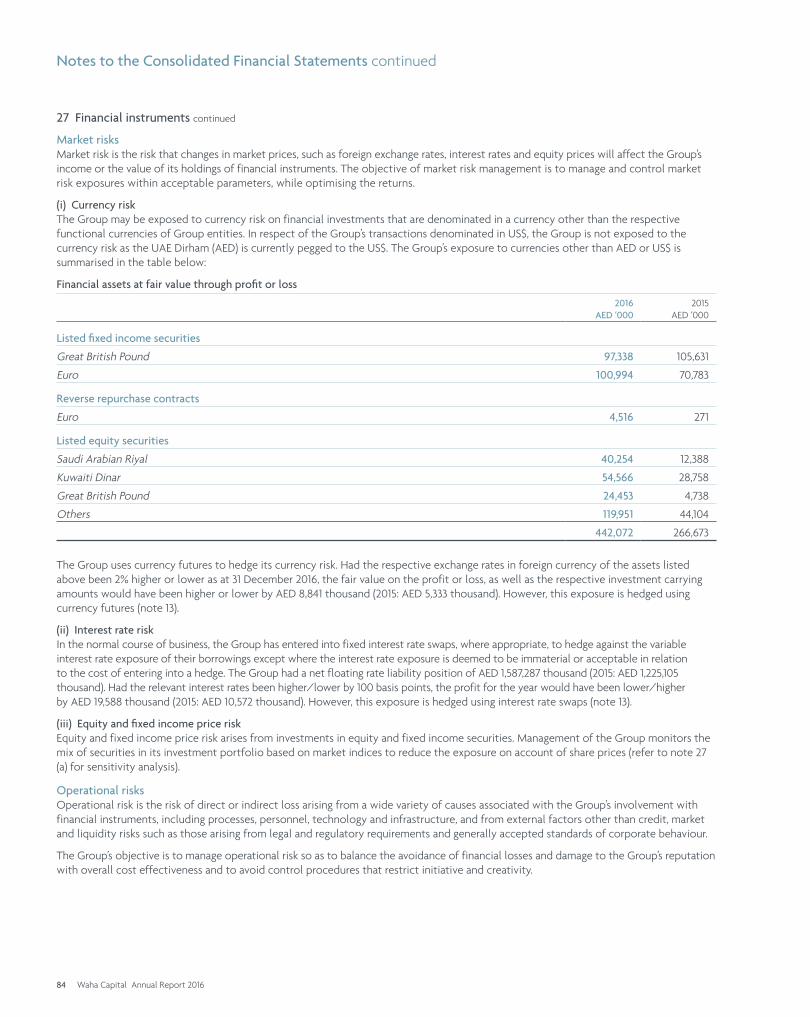
Notes to the Consolidated Financial Statements continued
27 Financial instruments continued
Market risksMarket risk is the risk that changes in market prices, such as foreign exchange rates, interest rates and equity prices will affect the Group’s income or the value of its holdings of financial instruments. The objective of market risk management is to manage and control market risk exposures within acceptable parameters, while optimising the returns.
(i) Currency riskThe Group may be exposed to currency risk on financial investments that are denominated in a currency other than the respective functional currencies of Group entities. In respect of the Group’s transactions denominated in US$, the Group is not exposed to the currency risk as the UAE Dirham (AED) is currently pegged to the US$. The Group’s exposure to currencies other than AED or US$ is summarised in the table below:
Financial assets at fair value through profit or loss
2016AED ‘000
2015AED ‘000
Listed fixed income securities
Great British Pound 97,338 105,631
Euro 100,994 70,783
Reverse repurchase contracts
Euro 4,516 271
Listed equity securities
Saudi Arabian Riyal 40,254 12,388
Kuwaiti Dinar 54,566 28,758
Great British Pound 24,453 4,738
Others 119,951 44,104
442,072 266,673
The Group uses currency futures to hedge its currency risk. Had the respective exchange rates in foreign currency of the assets listed above been 2% higher or lower as at 31 December 2016, the fair value on the profit or loss, as well as the respective investment carrying amounts would have been higher or lower by AED 8,841 thousand (2015: AED 5,333 thousand). However, this exposure is hedged using currency futures (note 13).
(ii) Interest rate riskIn the normal course of business, the Group has entered into fixed interest rate swaps, where appropriate, to hedge against the variable interest rate exposure of their borrowings except where the interest rate exposure is deemed to be immaterial or acceptable in relation to the cost of entering into a hedge. The Group had a net floating rate liability position of AED 1,587,287 thousand (2015: AED 1,225,105 thousand). Had the relevant interest rates been higher/lower by 100 basis points, the profit for the year would have been lower/higher by AED 19,588 thousand (2015: AED 10,572 thousand). However, this exposure is hedged using interest rate swaps (note 13).
(iii) Equity and fixed income price riskEquity and fixed income price risk arises from investments in equity and fixed income securities. Management of the Group monitors the mix of securities in its investment portfolio based on market indices to reduce the exposure on account of share prices (refer to note 27 (a) for sensitivity analysis).
Operational risksOperational risk is the risk of direct or indirect loss arising from a wide variety of causes associated with the Group’s involvement with financial instruments, including processes, personnel, technology and infrastructure, and from external factors other than credit, market and liquidity risks such as those arising from legal and regulatory requirements and generally accepted standards of corporate behaviour.
The Group’s objective is to manage operational risk so as to balance the avoidance of financial losses and damage to the Group’s reputation with overall cost effectiveness and to avoid control procedures that restrict initiative and creativity.
84 Waha Capital Annual Report 2016
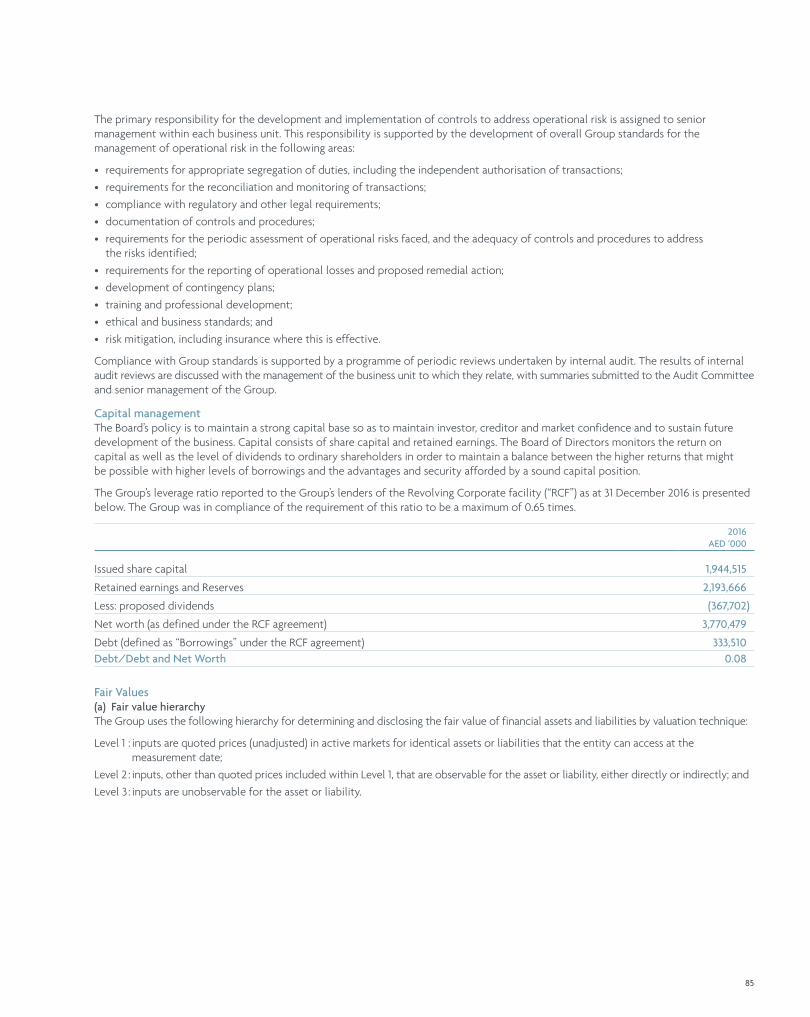
The primary responsibility for the development and implementation of controls to address operational risk is assigned to senior management within each business unit. This responsibility is supported by the development of overall Group standards for the management of operational risk in the following areas:
• requirements for appropriate segregation of duties, including the independent authorisation of transactions;
• requirements for the reconciliation and monitoring of transactions;
• compliance with regulatory and other legal requirements;
• documentation of controls and procedures;
• requirements for the periodic assessment of operational risks faced, and the adequacy of controls and procedures to address the risks identified;
• requirements for the reporting of operational losses and proposed remedial action;
• development of contingency plans;
• training and professional development;
• ethical and business standards; and
• risk mitigation, including insurance where this is effective.
Compliance with Group standards is supported by a programme of periodic reviews undertaken by internal audit. The results of internal audit reviews are discussed with the management of the business unit to which they relate, with summaries submitted to the Audit Committee and senior management of the Group.
Capital managementThe Board’s policy is to maintain a strong capital base so as to maintain investor, creditor and market confidence and to sustain future development of the business. Capital consists of share capital and retained earnings. The Board of Directors monitors the return on capital as well as the level of dividends to ordinary shareholders in order to maintain a balance between the higher returns that might be possible with higher levels of borrowings and the advantages and security afforded by a sound capital position.
The Group’s leverage ratio reported to the Group’s lenders of the Revolving Corporate facility (“RCF”) as at 31 December 2016 is presented below. The Group was in compliance of the requirement of this ratio to be a maximum of 0.65 times.
2016AED ‘000
Issued share capital 1,944,515
Retained earnings and Reserves 2,193,666
Less: proposed dividends (367,702)
Net worth (as defined under the RCF agreement) 3,770,479
Debt (defined as “Borrowings” under the RCF agreement) 333,510Debt/Debt and Net Worth 0.08
Fair Values(a) Fair value hierarchyThe Group uses the following hierarchy for determining and disclosing the fair value of financial assets and liabilities by valuation technique:
Level 1 : inputs are quoted prices (unadjusted) in active markets for identical assets or liabilities that the entity can access at the measurement date;
Level 2 : inputs, other than quoted prices included within Level 1, that are observable for the asset or liability, either directly or indirectly; and
Level 3 : inputs are unobservable for the asset or liability.
85
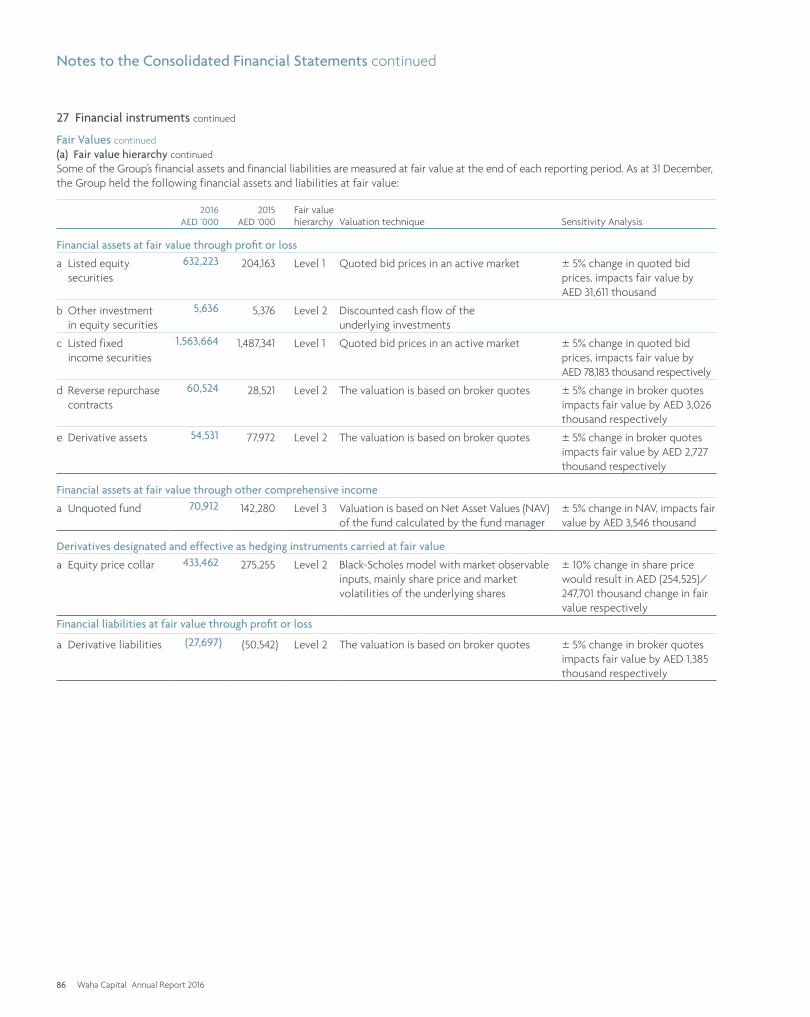
Notes to the Consolidated Financial Statements continued
27 Financial instruments continued
Fair Values continued(a) Fair value hierarchy continuedSome of the Group’s financial assets and financial liabilities are measured at fair value at the end of each reporting period. As at 31 December, the Group held the following financial assets and liabilities at fair value:
2016AED ‘000
2015AED ‘000
Fair value hierarchy Valuation technique Sensitivity Analysis
Financial assets at fair value through profit or loss
a Listed equity securities
632,223 204,163 Level 1 Quoted bid prices in an active market ± 5% change in quoted bid prices, impacts fair value by AED 31,611 thousand
b Other investment in equity securities
5,636 5,376 Level 2 Discounted cash flow of the underlying investments
c Listed fixed income securities
1,563,664 1,487,341 Level 1 Quoted bid prices in an active market ± 5% change in quoted bid prices, impacts fair value by AED 78,183 thousand respectively
d Reverse repurchase contracts
60,524 28,521 Level 2 The valuation is based on broker quotes ± 5% change in broker quotes impacts fair value by AED 3,026 thousand respectively
e Derivative assets 54,531 77,972 Level 2 The valuation is based on broker quotes ± 5% change in broker quotes impacts fair value by AED 2,727 thousand respectively
Financial assets at fair value through other comprehensive income
a Unquoted fund 70,912 142,280 Level 3 Valuation is based on Net Asset Values (NAV) of the fund calculated by the fund manager
± 5% change in NAV, impacts fair value by AED 3,546 thousand
Derivatives designated and effective as hedging instruments carried at fair value
a Equity price collar 433,462 275,255 Level 2 Black-Scholes model with market observable inputs, mainly share price and market volatilities of the underlying shares
± 10% change in share price would result in AED (254,525)/ 247,701 thousand change in fair value respectively
Financial liabilities at fair value through profit or loss
a Derivative liabilities (27,697) (50,542) Level 2 The valuation is based on broker quotes ± 5% change in broker quotes impacts fair value by AED 1,385 thousand respectively
86 Waha Capital Annual Report 2016
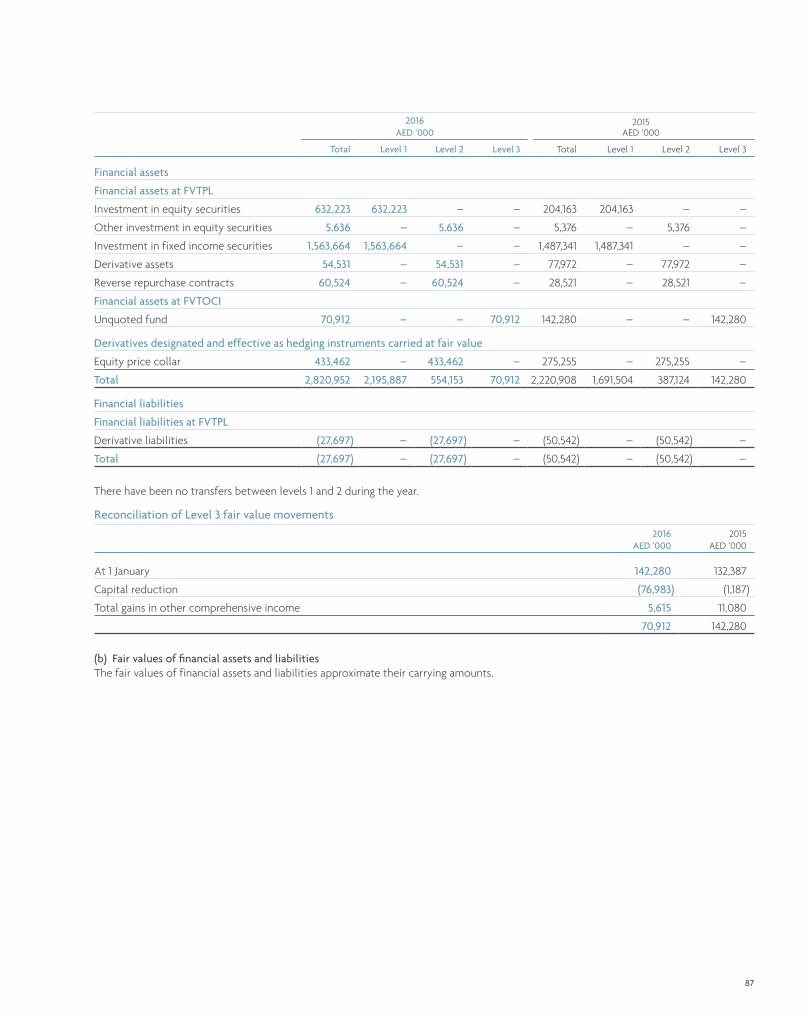
2016 AED ‘000
2015 AED ‘000
Total Level 1 Level 2 Level 3 Total Level 1 Level 2 Level 3
Financial assets
Financial assets at FVTPL
Investment in equity securities 632,223 632,223 – – 204,163 204,163 – –
Other investment in equity securities 5,636 – 5,636 – 5,376 – 5,376 –
Investment in fixed income securities 1,563,664 1,563,664 – – 1,487,341 1,487,341 – –
Derivative assets 54,531 – 54,531 – 77,972 – 77,972 –
Reverse repurchase contracts 60,524 – 60,524 – 28,521 – 28,521 –
Financial assets at FVTOCI
Unquoted fund 70,912 – – 70,912 142,280 – – 142,280
Derivatives designated and effective as hedging instruments carried at fair value
Equity price collar 433,462 – 433,462 – 275,255 – 275,255 –
Total 2,820,952 2,195,887 554,153 70,912 2,220,908 1,691,504 387,124 142,280
Financial liabilities
Financial liabilities at FVTPL
Derivative liabilities (27,697) – (27,697) – (50,542) – (50,542) –
Total (27,697) – (27,697) – (50,542) – (50,542) –
There have been no transfers between levels 1 and 2 during the year.
Reconciliation of Level 3 fair value movements2016
AED ‘0002015
AED ‘000
At 1 January 142,280 132,387
Capital reduction (76,983) (1,187)
Total gains in other comprehensive income 5,615 11,080
70,912 142,280
(b) Fair values of financial assets and liabilitiesThe fair values of financial assets and liabilities approximate their carrying amounts.
87