notes to the consolidated financial · pdf filethe group financial statements have been ......
TRANSCRIPT
70 / Aegis Group plc Annual Report and Accounts 2011
1. General information /Aegis Group plc is a company incorporated in the United Kingdom under the Companies Act 2006. The address of the registeredoffice is given on page 131. The nature of the Group’s operations and its principal activities are set out in note 4 and in the Directors’Report on pages 46 to 49.
These financial statements are presented in pounds sterling (GBP) because that is the currency of the primary economicenvironment in which the Group operates. Foreign operations are included in accordance with the policies set out in note 3.
2. Basis of preparation /The Group financial statements have been prepared in accordance with International Financial Reporting Standards (‘IFRSs’)adopted by the European Union and comply with Article 4 of the EU IAS Regulation. The financial statements have been preparedon the going concern basis of accounting for the reasons set out in the Directors’ report on page 49.
The financial statements have been prepared on the historical cost basis, except for the revaluation of certain financialinstruments. The principal accounting policies adopted are set out below in note 3.
At the date of authorisation of these financial statements, the following Standards and Interpretations which have not been appliedin these financial statements were in issue but not yet effective for the year:
IFRS 7 (amended) Disclosures – Transfers of Financial Assets
IFRS 7 Disclosures – Offsetting of Financial Assets and Liabilities
IFRS 9 Financial Instruments
IFRS 10 Consolidated Financial Statements
IFRS 11 Joint Arrangements
IFRS 12 Disclosure of Interests in Other Entities
IFRS 13 Fair Value Measurement
Amendments to IAS 1 (revised 2011)
Amendments to IAS 12 (revised 2010)
Amendments to IAS 19 (revised 2011)
IAS 27 Separate Financial Statements (reissued 2011)
IAS 28 Investments in Associates and Joint Ventures (reissued 2011)
IAS 32 Financial Instruments: Presentation – Offsetting of Financial Assets and Liabilities
The Directors anticipate that the adoption of these Standards and Interpretations in future periods will have no material impact onthe financial statements of the Group.
Adoption of standardsIn the current financial year, the Group has adopted the following standards and interpretations. These standards have no effect onthe financial statements of the Group.
Improvements to IFRSs (May 2010)
IAS 24 (revised 2009) Related Party Transactions
Amendments to IAS 32 (Oct 2009)
Amendments to IFRIC 14 (Nov 2009)
IFRIC 19 Extinguishing Financial Liabilities with Equity Instruments
Discontinued operationsThe Group completed the disposal of Synovate, its market research business, excluding Aztec, the scan data services business, toIpsos S.A. on 12 October 2011, following approval from the ordinary shareholders of Aegis Group plc on 16 August 2011, and receiptof mandatory anti-trust clearances. Therefore the results of Synovate (excluding Aztec) are shown as ‘discontinued operations’ inaccordance with IFRS 5 Non-current assets held for sale and discontinued operations.
Unless otherwise stated, income statement comparatives are restated on a continuing basis (the ‘Retained Group’) while balancesheet comparatives are not restated, as required by IFRS 5. Throughout these financial statements, “Synovate” is the disposedmarket research business and excludes Aztec.
Further information is given in note 10.
NOTES TO THE CONSOLIDATED FINANCIAL STATEMENTSFor the year ended 31 December 2011

71 / Aegis Group plc Annual Report and Accounts 2011
/FINANCIAL STATEM
ENTS
2. Basis of preparation / (continued)Underlying profitThe Group believes that underlying results (note 4) and underlying earnings per share (note 12) provide additional usefulinformation on underlying trends to shareholders. These measures are used for internal performance analysis and incentivecompensation arrangements for employees. The term underlying is not a defined term under IFRS and may not therefore becomparable with similarly titled profit measurements reported by other companies. It is not intended to be a substitute for, orsuperior to, IFRS measurements of profit. In the opinion of the Directors, such adjusting items are material by nature or amount,and may include impairment charges, profits and losses on disposals of investments, amortisation of purchased intangible assets(being amortisation charged on separately identifiable intangible assets in acquired businesses), acquisition costs in relation tobusiness combinations, fair value gains and losses on the revaluation of deferred consideration, revaluation of derivatives, fair valuegains and losses on liabilities in respect of put option agreements, and one-off items which are material by nature or amount in theopinion of the Directors, and any related tax thereon, as appropriate. Adjusting items may also include specific tax items such asdeferred tax liabilities for tax deductions taken in respect of goodwill, where a deferred tax liability is recognised even if such aliability would only unwind on the eventual sale or impairment of the business in question.
Adjusting items are classified as operating, non-operating and financing according to the nature of the underlying income or expense.
3. Accounting policies /Principal accounting policiesThe principal accounting policies set out below have been consistently applied to all the periods presented in this Annual Report.
Basis of consolidation(a) Subsidiaries
The consolidated financial statements incorporate the results, cash flows and net assets of Aegis Group plc and the entitiescontrolled by it (its subsidiaries) after eliminating internal transactions and recognising any non-controlling interests in thoseentities drawn up to 31 December each year. Control is achieved where the Group has the power to govern the financial andoperating policies of an investee entity so as to obtain economic benefits from its activities. Where subsidiaries are acquired or disposed of in the year, their results and cash flows are included from the effective date of acquisition or up to the effectivedisposal date.
Where a consolidated company is less than 100% owned by the Group, the non-controlling interest share of the results and netassets are recognised at each reporting date. The interests of non-controlling shareholders are ordinarily measured at the non-controlling interests’ proportionate share of the fair value of the acquiree’s identifiable net assets, but may alternatively be initially measured at fair value. The choice of measurement is made on an acquisition-by-acquisition basis. Subsequent toacquisition, the carrying amount of non-controlling interests is the amount of those interests at initial recognition plus the non-controlling interests’ share of subsequent changes in equity. Total comprehensive income is attributed to the non-controllinginterests even if this results in the non-controlling interests having a deficit balance.
Where a business combination is achieved in stages, on the date control is achieved the Group remeasures its previously held equity interest in the acquiree at its acquisition-date fair value, with any resulting gain or loss presented in profit or loss.Any amounts previously deferred in other comprehensive income are recognised on the same basis as if the Group had directlydisposed of the equity interest.
Changes in the Group’s interests in subsidiaries that do not result in a loss of control are accounted for as equity transactions.The carrying amount of the Group’s interests and the non-controlling interests are adjusted to reflect the changes in theirrelative interests in the subsidiaries. Any difference between the amount by which the non-controlling interests are adjusted andthe fair value of the consideration paid or received is recognised directly in equity and attributed to equity holders of the parent.
When the Group loses control of a subsidiary, the profit or loss on disposal is calculated as the difference between (i) theaggregate of the fair value of the consideration received and the fair value of any retained interest and (ii) the previous carryingamount of the assets (including goodwill), less liabilities of the subsidiary and any non-controlling interests. Amounts previouslyrecognised in other comprehensive income in relation to the subsidiary are reclassified to profit or loss or transferred directly toretained earnings as appropriate, in the same manner as would be required if the relevant assets or liabilities were disposed of.The fair value of any investment retained in the former subsidiary at the date when control is lost is regarded as the fair value oninitial recognition of the reclassified investment.
A list of the significant investments in subsidiaries, including the name, country of incorporation and proportion of ownershipinterest is given in the notes to the Company’s separate financial statements.
The company, Mediaagentur Dr. Pichutta GmbH & Co.KG, Wiesbaden, is included in the consolidated financial statements ofAegis Group plc; as such we apply S264b HGB of the German Commercial Code.

72 / Aegis Group plc Annual Report and Accounts 2011
3. Accounting policies / (continued)Basis of consolidation (continued)(b) Associates
Associates are entities in which the Group has a participating interest, over whose operating and financial policies it exercisessignificant influence and which are neither subsidiaries nor joint ventures. Significant influence is the power to participate inthe financial and operating policy decisions of the investee but is not control or joint control over these policies. The accountingpolicies used by the Group’s associates are the same as those used by the Group, as are the reporting dates in the majority ofcases. Where reporting dates for local accounts do not match the Group dates, the Group obtains additional reporting to ensurethe figures included in the consolidated accounts are current.
The Group’s associates are accounted for using the equity method of accounting. Any excess of the cost of acquisition over theGroup’s share of the fair values of the identifiable net assets of the associate at the date of acquisition is recognised as goodwillwithin the associate’s carrying amount and is assessed for impairment as part of that investment. The Group’s share of itsassociates’ post-acquisition profits or losses and any impairment of goodwill is recognised in the income statement and as a movement in the Group’s share of associates’ net assets in the balance sheet. Its share of any post-acquisition movements in reserves is recognised either directly in equity or in other comprehensive income as appropriate. Losses of the associates in excess of the Group’s interest in those associates are recognised only to the extent that the Group has incurred legal orconstructive obligations or made payments on behalf of the associate. Where a Group company transacts with an associate of the Group, profits and losses are eliminated to the extent of the Group’s interest in the relevant associate.
(c) Joint venturesJoint ventures are investments over which the Group exercises joint control with a third party. Such investments are equity-accounted, using the same method of equity accounting as described in associates above.
Business combinationsAcquisitions of subsidiaries and businesses are accounted for using the acquisition method. The consideration for eachacquisition is measured at the aggregate of the acquisition-date fair values of assets given, liabilities incurred or assumed, and equity instruments issued by the Group in exchange for control of the acquiree. Acquisition-related costs are recognised in profit or loss as incurred.
Where applicable, the consideration for the acquisition includes contingent consideration, measured at its acquisition-date fairvalue. Subsequent changes in the fair value of contingent consideration are adjusted against the cost of the acquisition whenthey qualify as measurement period adjustments (see below), or otherwise are accounted for as fair value changes in profit or loss.
The acquiree’s identifiable assets, liabilities and contingent liabilities that meet the conditions for recognition under IFRS 3 (2008)are recognised at their fair value at the acquisition date. If the initial accounting for a business combination is incomplete by theend of the reporting period in which the combination occurs, the Group reports provisional amounts. Provisional amounts areadjusted during the measurement period (see below), or additional assets or liabilities are recognised, to reflect new informationobtained about facts and circumstances that existed as of the acquisition date that, if known, would have affected the amountsrecognised at that date.
The measurement period is the period from the date of acquisition to the date the Group obtains complete information aboutfacts and circumstances that existed as of the acquisition date, and is subject to a maximum of one year.
For acquisitions completed prior to 1 January 2010, the revaluation of contingent consideration does not result in an entry toprofit or loss, but is adjusted against the carrying amount of associated goodwill. Such contingent consideration liabilities arediscounted and an imputed interest charge is recognised in profit or loss.
Income statement movements in relation to changes to the fair value of contingent consideration are not considered to be partof the Group’s underlying profit. Therefore, following the adoption of IFRS 3 (2008), fair value gains or losses on the revaluationof deferred consideration, including any imputed interest, are excluded from underlying profit, as explained in the ‘Underlyingprofit’ section in note 2.
NOTES TO THE CONSOLIDATED FINANCIAL STATEMENTSFor the year ended 31 December 2011
(continued)
73 / Aegis Group plc Annual Report and Accounts 2011
/FINANCIAL STATEM
ENTS
3. Accounting policies / (continued)GoodwillGoodwill arising in a business combination is recognised as an asset at the date that control is achieved (the acquisition date).Goodwill is measured as the excess of the sum of the consideration transferred, the amount of any non-controlling interest in theacquiree and the fair value of the Group’s previously held equity interest in the acquiree (if any) over the net of the acquisition-dateamounts of the identifiable assets acquired and the liabilities assumed.
If, after reassessment, the net of the acquisition-date amounts of the identifiable assets acquired and the liabilities assumedexceeds the sum of the consideration transferred, the amount of any non-controlling interest in the acquiree and the fair value ofthe Group’s previously held equity interest in the acquiree (if any), the excess is recognised immediately in profit or loss as abargain purchase.
Following initial recognition, goodwill is not amortised but is carried at cost less any accumulated impairment losses. Goodwillrecognised under UK GAAP prior to the date of transition to IFRS is stated at net book value as at that date less any subsequentaccumulated impairment losses.
Goodwill is allocated to disposals on a CGU basis where entire CGU’s are disposed, or otherwise on a relative value basis.
Goodwill written off to reserves under UK GAAP prior to 1998 has not been reinstated and is not included in determining anysubsequent profit or loss on disposal.
Goodwill impairmentGoodwill is reviewed for impairment annually or more frequently if events or changes in circumstances indicate that the carryingamount may be impaired. Any impairment is recognised immediately in the income statement and is not subsequently reversed.
For the purpose of impairment testing, goodwill is allocated to each of the Group’s cash generating units (“CGUs”) expected tobenefit from the synergies of the combination. CGUs to which goodwill has been allocated are tested for impairment annually, ormore frequently when there is an indication that the unit may be impaired. If the recoverable amount of the CGU is less than thecarrying amount of the unit, the impairment loss is allocated first to reduce the carrying amount of any goodwill allocated to theunit and then to the other assets of the unit pro rata on the basis of the carrying amount of each asset in the unit. The Group’sCGUs are given in note 13.
Intangible assetsSeparately acquired intangible assets are capitalised at cost. Intangible assets acquired as part of a business combination arecapitalised at fair value at the date of acquisition. Fair value is calculated based on the Group’s valuation methodology, usingdiscounted cash flows, charges avoided or replacement costs as appropriate.
An internally-generated intangible asset arising from the Group’s development activities is recognised only if all of the followingconditions are met:
– an asset is created that can be identified (such as software and new processes)
– it is probable that the asset created will generate future economic benefits
– the development cost of the asset can be measured reliably.
Where these criteria are met, the development expenditure is capitalised at cost. Where they are not met, development expenditureis recognised as an expense in the period in which it is incurred. Expenditure on research activities is recognised as an expense inthe period in which it is incurred.
Intangible assets (both internally generated and separately acquired) are amortised to residual values on a straight-line basis overthe useful economic life of the asset as follows:
Software 20% to 50% per annum
Customer relationships 20% per annum
Panel costs 33% per annum
Patents and trademarks Nil to 20% per annum
Non compete agreements 14% to 50% per annum
Intellectual property 33% per annum
Other 10% to 50% per annum
Where an asset’s useful life is considered indefinite, an annual impairment test is performed (see below).

74 / Aegis Group plc Annual Report and Accounts 2011
3. Accounting policies / (continued)Property, plant and equipmentProperty, plant and equipment are stated at historical cost less accumulated depreciation and any recognised impairment losses.Depreciation is charged to write off the cost of these assets to their residual value over their expected useful lives, using thestraight-line method, on the following basis:
Freehold buildings 1% to 5% per annum
Leasehold buildings Over the period of the lease
Leasehold improvements 10% to 20% per annum or over the period of the lease, if shorter
Office furniture, fixtures, equipment and vehicles 10% to 50% per annum
The gain or loss arising on the disposal or retirement of an asset is determined as the difference between the sales proceeds andthe carrying amount of the asset and is recognised in the income statement.
Impairment of tangible and intangible assets excluding goodwillAt each balance sheet date, the Group reviews the carrying amounts of its tangible and intangible assets (both internally generatedand separately acquired) to determine whether there is any indication that those assets have suffered an impairment loss. If anysuch indication exists, the recoverable amount of the asset is estimated in order to determine the extent of the impairment loss, ifany. The recoverable amount is the higher of fair value less costs to sell and value in use. In assessing value in use, the estimatedfuture cash flows are discounted to their present value using a pre-tax discount rate that reflects current market assessments ofthe time value of money and the risks specific to the asset for which the estimates of future cash flows have not been adjusted.Where the asset does not generate cash flows that are independent from other assets, the Group estimates the recoverableamount of the CGU to which the asset belongs.
If the recoverable amount of an asset (or CGU) is estimated to be less than its carrying amount, the carrying amount of the asset(or CGU) is reduced to its recoverable amount.
Work in progressWork in progress comprises directly attributable costs deferred to align with the timing of revenue recognition. Work in progress isheld in the balance sheet at the lower of cost and net realisable value.
Provisions Provisions are recognised when the Group has a present obligation (legal or constructive) as a result of a past event, it is probablethat an outflow of resources will be required to settle the obligation and a reliable estimate can be made of the amount of theobligation. The amount recognised as a provision is the best estimate of the consideration required to settle the present obligationat the balance sheet date, taking into account the risks and uncertainties surrounding the obligation.
Where leasehold properties remain unutilised by the Group or where the Group is demonstrably committed to a period of non-utilisation, and such properties have not been sublet, provision is made in full for the outstanding rental payments together withother outgoings for the remaining period of the lease. This provision takes into account any future sublet income reasonablyexpected to be obtained. Future rental payments are charged against this provision in the period in which they are made.
From time to time the Group is exposed to claims which the Group vigorously defends. Provision for costs is made when thelikelihood of a case proceeding is adjudged as probable. Disclosure is made of potentially material matters where, on the basis of legal advice, an adverse outcome cannot currently be judged as remote.
Turnover and revenueTurnover represents amounts billable for media handled by the Group on behalf of clients, together with fees earned for media and research services provided, net of discounts, VAT and other sales-related taxes.
Revenue is the value of media and research fees and commission earned by the Group.
Media revenue arises in the form of fees and commissions for media services and performance related incentives. Fee andcommission revenue is recognised when earned, principally when advertisements appear in the media over the period of therelevant assignments or agreements. Performance related income is recognised when it can be reliably estimated whether, andthe extent to which, the performance criteria have been met.
For market research and media project businesses, revenue is recognised based on the stage of completion of each project, whichis indicated by the satisfactory completion of a specific phase of a project. Provision is made for losses on a project as soon as itbecomes clear that a loss will arise. Invoices raised during the course of a project are booked as deferred income on the balancesheet until such a time as the related revenue is recognised in the income statement.
NOTES TO THE CONSOLIDATED FINANCIAL STATEMENTSFor the year ended 31 December 2011
(continued)

75 / Aegis Group plc Annual Report and Accounts 2011
/FINANCIAL STATEM
ENTS
3. Accounting policies / (continued)Investment incomeInterest income is accrued on a time basis, by reference to the principal outstanding and at the effective interest rate applicable,which is the rate that exactly discounts estimated future cash receipts through the expected life of the financial asset to that asset’snet carrying amount.
Dividend income from investments is recognised when the shareholders’ rights to receive payment have been established.
Share-based payment transactionsThe Group applies the requirements of IFRS 2 Share-based payment. In accordance with the transitional provisions, IFRS 2 hasbeen applied to all grants of equity instruments after 7 November 2002 that remained unvested as of 1 January 2005.
Certain employees receive remuneration in the form of share-based payments, including shares or rights over shares. The cost ofequity-settled transactions with employees is measured by reference to the fair value of the instruments concerned at the date atwhich they are granted. The fair value is determined by an external valuer using a stochastic model. The fair value determined atthe grant date of the equity-settled share-based payments is expensed on a straight line basis over the vesting period, based on theGroup’s estimate of equity instruments that will eventually vest. At each balance sheet date, the Group revises its estimate of thenumber of equity instruments expected to vest as a result of the effect of non-market-based vesting conditions. The impact of therevision of the original estimates, if any, is recognised in profit and loss such that the cumulative expense reflects the revisedestimate, with a corresponding adjustment to equity.
The dilutive effect of outstanding options is reflected as additional share dilution in the computation of diluted earnings per share.
Retirement benefitsRetirement benefits for employees are principally provided by defined contribution schemes which are funded by contributions fromGroup companies and employees. The amount charged to the income statement is the contribution payable in the year by Groupcompanies.
In addition, the Group has a small number of other retirement benefit schemes, principally where required by statute in certainjurisdictions. These schemes are not considered by management to represent standard defined contribution schemes and do notvary significantly in terms of the Group’s liability. However, IAS 19 requires that these schemes be disclosed as defined benefitschemes.
The liability recognised in the balance sheet in respect of defined benefit obligations is the present value of the defined benefitobligation at the balance sheet date as adjusted for unrecognised past service cost less the fair value of the plan assets. Any assetresulting from this calculation is limited to unrecognised past service cost, plus the present value of available refunds andreductions in future contributions to the scheme. The defined benefit obligation is calculated using the project unit credit methodwith actuarial valuations being carried out at each balance sheet date. The present value of the defined benefit obligation isdetermined by discounting the estimated future cash outflows using interest rates of high-quality corporate bonds approximating tothe terms of the related liability.
Actuarial gains and losses are recognised immediately outside the income statement and are presented in the consolidatedstatement of comprehensive income. Past service cost is recognised immediately to the extent that the benefits are already vestedand otherwise is amortised on a straight-line basis over the average period until the benefits become vested.
Foreign currenciesThe individual financial statements of each group company are presented in the currency of the primary economic environment inwhich it operates (its functional currency). The consolidated financial statements are reported in Sterling, which is the functionalcurrency of Aegis Group plc and the presentational currency for the Group’s consolidated financial statements.
In group companies, the term ‘foreign currencies’ refers to currencies other than the entity’s functional currency. Transactions inforeign currencies are recorded at the exchange rate ruling at the date of the transaction. Upon settlement, monetary assets andliabilities denominated in foreign currencies are re-translated at the rate ruling on the settlement date. Monetary assets andliabilities denominated in foreign currencies at the year end are re-translated at the exchange rate ruling at the balance sheet date.Exchange differences arising upon re-translation at the settlement date or balance sheet date are taken to the income statement.
Non-monetary items that are measured in terms of historical cost in a foreign currency are not retranslated.
Exchange differences arising on the re-translation of foreign currency borrowings used to provide a hedge against foreign currencyinvestments, including goodwill, are recognised in other comprehensive income as long as the hedge remains effective.
For consolidation purposes, the trading results and cash flows arising in operations with non-Sterling functional currencies aretranslated into Sterling at average exchange rates for the period. Assets and liabilities denominated in foreign currencies aretranslated using the rate of exchange ruling at the balance sheet date. Exchange differences arising upon consolidation arerecognised in other comprehensive income. In the event of the disposal of an operation the cumulative effect of such translation is reclassified to the income statement.
76 / Aegis Group plc Annual Report and Accounts 2011
3. Accounting policies / (continued)Leased assetsLeases where the lessor retains substantially all the risks and benefits of ownership of the asset are classified as operating leases.Operating lease rentals are charged to the income statement over the lease term on a straight-line basis. In the event that leaseincentives are received to enter into operating leases, such incentives are recognised as a liability and recognised as a reduction ofrental expense on a straight-line basis.
TaxationThe tax expense represents the sum of current tax and deferred tax.
Current tax is based on taxable profit for the year. Taxable profit differs from net profit as reported in the Consolidated IncomeStatement because it excludes items of income or expense that are taxable or deductible in other years and it further excludesitems that are never taxable or deductible. The Group’s liability for current tax is calculated using tax rates that have been enactedor substantively enacted by the balance sheet date.
Deferred tax is the tax expected to be payable or recoverable on differences between the carrying amounts of assets and liabilitiesin the financial statements and the corresponding tax bases used in the computation of taxable profit, and is accounted for usingthe balance sheet liability method. Deferred tax liabilities are generally recognised for all taxable temporary differences anddeferred tax assets are recognised to the extent that it is probable that taxable profits will be available against which deductibletemporary differences can be utilised. Such assets and liabilities are not recognised if the temporary difference arises from theinitial recognition of goodwill or from the initial recognition (other than in a business combination) of other assets and liabilities ina transaction that affects neither the tax nor accounting profit.
Deferred tax is calculated for all business combinations in respect of intangible assets and properties. A deferred tax liability isrecognised to the extent that the fair value of the assets for accounting purposes exceeds the value of those assets for tax purposesand will form part of the associated goodwill on acquisition.
Deferred tax liabilities are recognised for taxable temporary differences arising on investments in subsidiaries and associates,including interests in joint ventures, except where the Group is able to control the reversal of the temporary difference and it isprobable that the temporary difference will not reverse in the foreseeable future.
The carrying amount of deferred tax assets is reviewed at each balance sheet date and reduced to the extent that it is no longerprobable that sufficient taxable profits will be available to allow all or part of the asset to be recovered.
Deferred tax is calculated at the tax rates that are expected to apply in the period when the liability is settled or the asset isrealised. Deferred tax is charged or credited in the income statement, except when it relates to items charged or credited to othercomprehensive income or directly to equity, in which case the deferred tax is also dealt with in other comprehensive income orequity respectively.
Deferred tax assets and liabilities are offset when there is a legally enforceable right to set off tax assets against tax liabilitiesunder current legislation and when they relate to income taxes levied by the same taxation authority and the Group intends to settle its current tax assets and liabilities on a net basis.
Financial instrumentsFinancial assetsThe Group’s financial assets principally include the following:
Cash and short-term depositsCash and short-term deposits include cash at bank and in hand and highly liquid deposits with an original maturity of three monthsor less which are subject to an insignificant risk of changes in value. In the Consolidated Cash Flow Statement, bank overdrafts arededucted from cash and short-term deposits to give cash and cash equivalents.
Trade receivablesTrade receivables are initially recorded at the invoiced value and subsequently reduced by appropriate allowances for estimatedirrecoverable amounts. Current trade receivables do not carry any interest charge. Interest may be charged on overdue balances.
Available-for-sale financial assetsAvailable-for-sale financial assets are initially measured at cost, including transaction costs, and at subsequent reporting dates at fair value. Gains and losses arising from changes in fair value are recognised directly in other comprehensive income, until thesecurity is disposed of or is determined to be impaired, at which time the cumulative gain or loss previously reported in equity isincluded in the net profit or loss for the period. Impairment losses recognised in the income statement for equity instrumentsclassified as available-for-sale are not subsequently reversed through profit or loss.
NOTES TO THE CONSOLIDATED FINANCIAL STATEMENTSFor the year ended 31 December 2011
(continued)
77 / Aegis Group plc Annual Report and Accounts 2011
/FINANCIAL STATEM
ENTS
3. Accounting policies / (continued)Financial instruments (continued)Financial assets (continued)
Impairment of financial assetsFinancial assets, other than those at FVTPL ‘Fair Value Through Profit and Loss’, are assessed for indicators of impairment at eachbalance sheet date. Financial assets are impaired where there is objective evidence that, as a result of one or more events thatoccurred after the initial recognition of the financial asset, the estimated future cash flows of the investment have been impacted.
Financial liabilities and equityFinancial liabilities and equity instruments are classified according to the substance of the contractual arrangements entered into.
Bank borrowingsInterest-bearing bank loans and overdrafts are recorded at the value of proceeds received, net of direct issue costs. Direct issuecosts are amortised over the period of the loans and overdrafts to which they relate. Finance charges, including premiums payableon settlement or redemption are charged to the income statement as incurred using the effective interest method and are added tothe carrying value of the instrument to the extent that they are not settled in the period in which they arise.
Trade PayablesTrade payables are initially stated at fair value and subsequently at amortised cost.
Equity instrumentsAn equity instrument is any contract that evidences a residual interest in the assets of an entity after deducting all of its liabilities.Ordinary shares are classified as equity instruments. Equity instruments issued by the Company are recorded at the value ofproceeds received, net of direct issue costs.
Investments in own shares, held through the Aegis Group Employee Share Trust, are shown as a deduction from shareholders’equity at cost. The costs of administration of the Trust are included in the income statement as they accrue.
Compound instrumentsThe Group issued £190.6m convertible bonds in April 2010. The convertible bonds are regarded as compound financial instruments.The component parts of compound instruments issued by the Group are classified separately as financial liabilities and equity inaccordance with the substance of the contractual arrangement. At the date of issue, in the case of a convertible bond denominatedin the functional currency of the issuer that may be converted into a fixed number of equity shares, the fair value of the liabilitycomponent is estimated using the prevailing market interest rate that the Group could achieve for a similar non-convertibleinstrument. This amount is recorded as a liability on an amortised cost basis using the effective interest method until extinguishedupon conversion or at the instrument’s maturity date. The equity component is determined by deducting the amount of the liabilitycomponent from the fair value of the compound instrument as a whole. This is recognised and included within equity in the OtherEquity Reserves and is not subsequently remeasured.
Issue costs are apportioned between the liability and equity components of the convertible bonds based on their relative carryingamounts at the date of issue. The portion relating to the equity component is charged directly against equity. The non-cash elementof the interest charge is reclassified within equity at each period end to exclude the impact of the accounting charge from RetainedEarnings. This element of the charge is recognised within the Other Equity Reserves.
Derivative financial instrumentsThe Group’s activities expose it to certain financial risks including changes in foreign currency exchange rates and interest rates.The Group uses foreign exchange forward contracts and interest rate swap contracts to hedge these exposures where they areconsidered to be significant. The Group does not use derivative financial instruments for speculative purposes.
Derivative financial instruments are held at fair value at the balance sheet date. A derivative with a positive fair value is recognisedas a financial asset whereas a derivative with a negative fair value is recognised as a financial liability. A derivative is presented as a non-current asset or a non-current liability if the remaining maturity of the instrument is more than 12 months and it is notexpected to be realised or settled within 12 months. Other derivatives are presented as current assets or current liabilities.
Changes in the fair value of derivative financial instruments that are designated and effective as cash flow hedges of future cashflows are recognised directly in other comprehensive income and the ineffective portion is recognised immediately in the incomestatement. Amounts deferred in this way are recognised in the income statement in the same period in which the hedged firmcommitments or forecast transactions are recognised in the income statement. Changes in the fair value of derivative financialinstruments that do not qualify for hedge accounting are recognised in the income statement as they arise. Where such changesare intended to provide a natural hedge of a particular risk, the income statement classification reflects this.
78 / Aegis Group plc Annual Report and Accounts 2011
3. Accounting policies / (continued)Financial instruments (continued)Derivative financial instruments (continued)Hedge accounting is discontinued when the hedging instrument expires or is sold, terminated or exercised, or no longer qualifiesfor hedge accounting. At that point in time, any cumulative gains or losses on the hedging instrument recognised in othercomprehensive income are retained until the forecast transaction occurs. If a hedged transaction is no longer expected to occur,the net cumulative gain or loss recognised in other comprehensive income is transferred to the income statement for the period.Note 20 includes further information on hedge accounting as applied by the Group.
Liabilities in respect of option agreements with non-controlling shareholdersThe Group is party to a number of put and call options over the remaining non-controlling stakes in its subsidiaries. In accordancewith IAS 39, put options are treated as derivatives over equity instruments and the amounts that are potentially to be paid for thestakes are recorded as financial liabilities at fair value on initial recognition, with a corresponding decrease in reserves. Fair valueis calculated based on the discounted value of expected future payments.
Subsequent changes in the fair value of the liability are recognised as movements in the income statement. On exercise andsettlement of a put option liability the cumulative amounts are removed from reserves, along with the derecognition of non-controlling interests.
Accounting estimates and uncertaintiesThe Group makes estimates and judgements concerning the future and the resulting estimates may, by definition, vary from therelated actual results. The Directors consider the critical accounting estimates and judgements to be:
– Revenue recognitionJudgement is required in selecting the appropriate timing and amount of revenue recognised, particularly where the Grouprecognises performance related income. Revenue is only recognised when it can be reliably estimated using customer specificinformation and, where there is a performance related element, to the extent to which the performance criteria have been met
The likelihood of collection of trade receivables also requires judgement to be applied. The Group monitors the levels ofprovisioning required based on historical trends and by detailed review of individually significant balances
– Contingent deferred consideration and put option payments in respect of acquisitionsThe Group determines the amount of deferred consideration to be recognised according to the formulae agreed at time ofacquisition, normally related to the future earnings of the acquired entity. Estimates of the expected future earnings of theacquired entity therefore affect the valuation of deferred consideration. The liability for deferred consideration is reviewed ateach balance sheet date and revaluation entries are applied, if required, to deferred consideration and either goodwill or profitor loss in accordance with the Group’s accounting policy for business combinations, discussed above
Deferred consideration liabilities are discounted to their fair value in accordance with IFRS 3 and IAS 37. The differencebetween the fair value of these liabilities and the actual amounts payable is charged to the income statement as a notionalfinance cost
Key areas of judgement in calculating the fair value of the put option liabilities are the expected future cash flows and earningsof the acquired entity and the discount rate
– Recognition of share-based paymentsThe Group makes share-based payments to certain employees. These payments are measured at their estimated fair value atthe date of grant. The fair value is determined by an external valuer using a stochastic model
The fair value is expensed on a straight-line basis over the vesting period of the grant. The vesting period charge is calculatedwith reference to the estimated number of awards that are expected to vest, as determined by the anticipated number ofleavers during the vesting period and based on an annual assessment of non-market performance conditions attached tocertain awards. See note 31 for further details
– Valuation of intangible assetsThe Group exercises judgement in determining the fair value of identifiable assets, liabilities and contingent liabilities assumedin business combinations. In calculating the fair values of intangibles the Group makes assumptions on the timing and amountof future cash flows generated by the assets it has acquired, the appropriate discount rates and the useful economic lives of theassets purchased
– ImpairmentIn determining whether an impairment loss has arisen on goodwill or intangible assets the Group makes judgements over thevalue in use of its CGUs. In calculating the value in use of a CGU the Group makes estimates of future forecast cash flows anddiscount rates to derive a net present value of these cash flows and determine if an impairment has occurred. Key areas ofjudgement include the determination of the long term growth rate applicable to each CGU and the determination of the CGUsthemselves. See note 13 for further details
NOTES TO THE CONSOLIDATED FINANCIAL STATEMENTSFor the year ended 31 December 2011
(continued)
79 / Aegis Group plc Annual Report and Accounts 2011
/FINANCIAL STATEM
ENTS
3. Accounting policies / (continued)Accounting estimates and uncertainties (continued)– Taxation
Tax laws that apply to the Group’s businesses may be amended by the relevant authorities, for example as a result of changesin fiscal circumstances or priorities. Such potential amendments and their application to the Group are regularly monitored andthe requirement for recognition of any liabilities assessed where necessary
Being a multinational Group with tax affairs in many geographic locations inherently leads to a highly complex tax structurewhich makes the degree of estimation and judgement more challenging. The resolution of issues is not always within thecontrol of the Group and is often dependent on the efficiency of legal processes. Such issues can take several years to resolve.The Group takes a conservative view of unresolved issues, however the inherent uncertainty regarding these items means thatthe eventual resolution could differ significantly from the accounting estimates and therefore may impact the Group’s resultsand future cash flows
– Deferred taxThe key area of judgement in respect of deferred tax accounting is the assessment of the expected timing and manner ofrealisation or settlement of the carrying amounts of assets and liabilities held at the balance sheet date. In particular,assessment is required of whether it is probable that there will be suitable future taxable profits against which any deferred tax assets can be utilised.
4. Segment reporting /Business segmentsThe segmentation of the Group’s results is driven by information provided to the Group’s chief operating decision-maker, the Boardof Directors. Up to the disposal of Synovate, information reported to the Board of Directors for the purposes of resource allocationand assessment of segment performance focused on the two business divisions of Aegis Media and Synovate, which incorporatedthe global Aztec business, reflecting the management structure of the Group historically and for the majority of 2011. Thesedivisions, which operate in the media and market research sectors respectively are therefore the Group’s reportable segmentsunder IFRS 8. Intersegment trading is not significant to the operating segments and no intersegment trading information isincluded in reports to the Board of Directors. Therefore all information reported below relates to external trades.
The accounting policies of the reportable segments are the same as the Group’s accounting policies, which are described in note 3.Segment result represents segment underlying operating profit, which is the measure reported to the Board of Directors for thepurposes of resource allocation and assessment of segment performance. The Board of Directors also monitors the tangible,intangible and financial assets attributable to each segment. All assets and liabilities are allocated to reportable segments with the exception of centrally-managed financial instruments, tax and other centrally-managed balances. Goodwill is allocated to thesegments as described in note 13.
The discontinued operations of Synovate are separately disclosed in the tables below. The Group’s operating segments as shown are based on the two-divisional management structure of the Group prior to the disposal of Synovate, which was the managementstructure in place for the majority of 2011. Subsequent to the disposal, the Board of Directors is considering a possible change to thesegmental disclosure for external reporting purposes, with any such change expected to be included in external reporting for 2012.
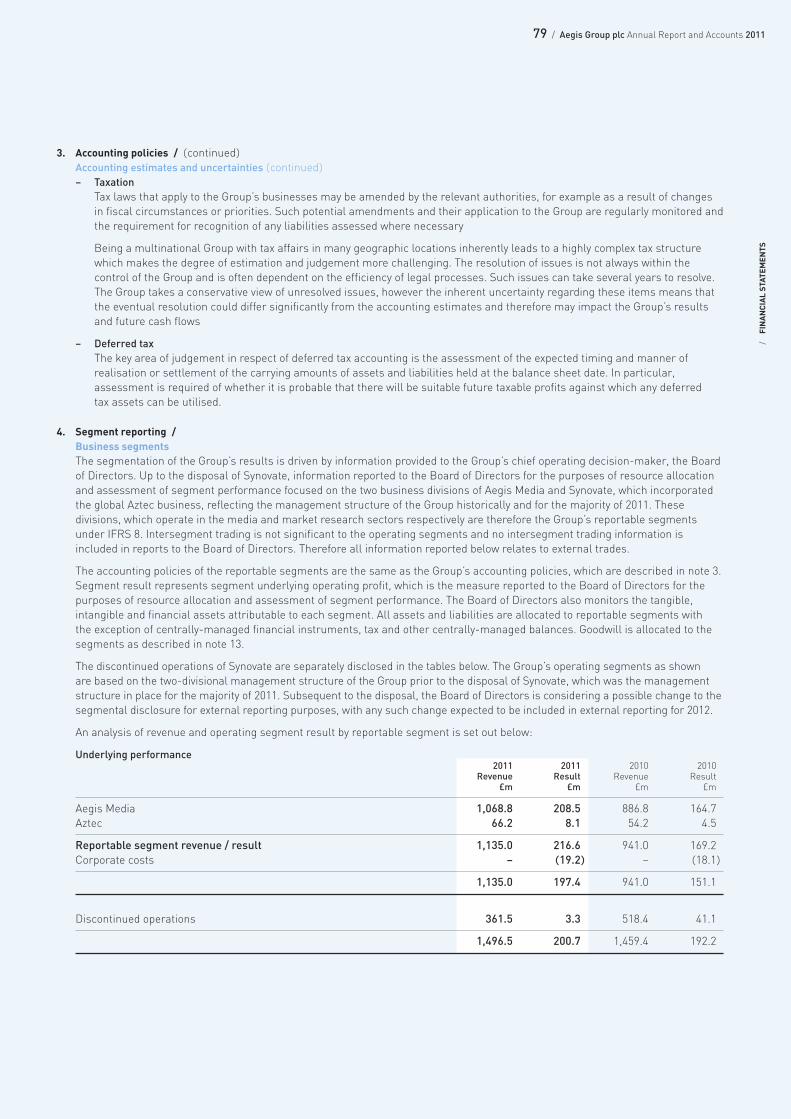
An analysis of revenue and operating segment result by reportable segment is set out below:
Underlying performance2011 2011 2010 2010
Revenue Result Revenue Result£m £m £m £m
Aegis Media 1,068.8 208.5 886.8 164.7 Aztec 66.2 8.1 54.2 4.5
Reportable segment revenue / result 1,135.0 216.6 941.0 169.2 Corporate costs – (19.2) – (18.1)
1,135.0 197.4 941.0 151.1
Discontinued operations 361.5 3.3 518.4 41.1
1,496.5 200.7 1,459.4 192.2
80 / Aegis Group plc Annual Report and Accounts 2011
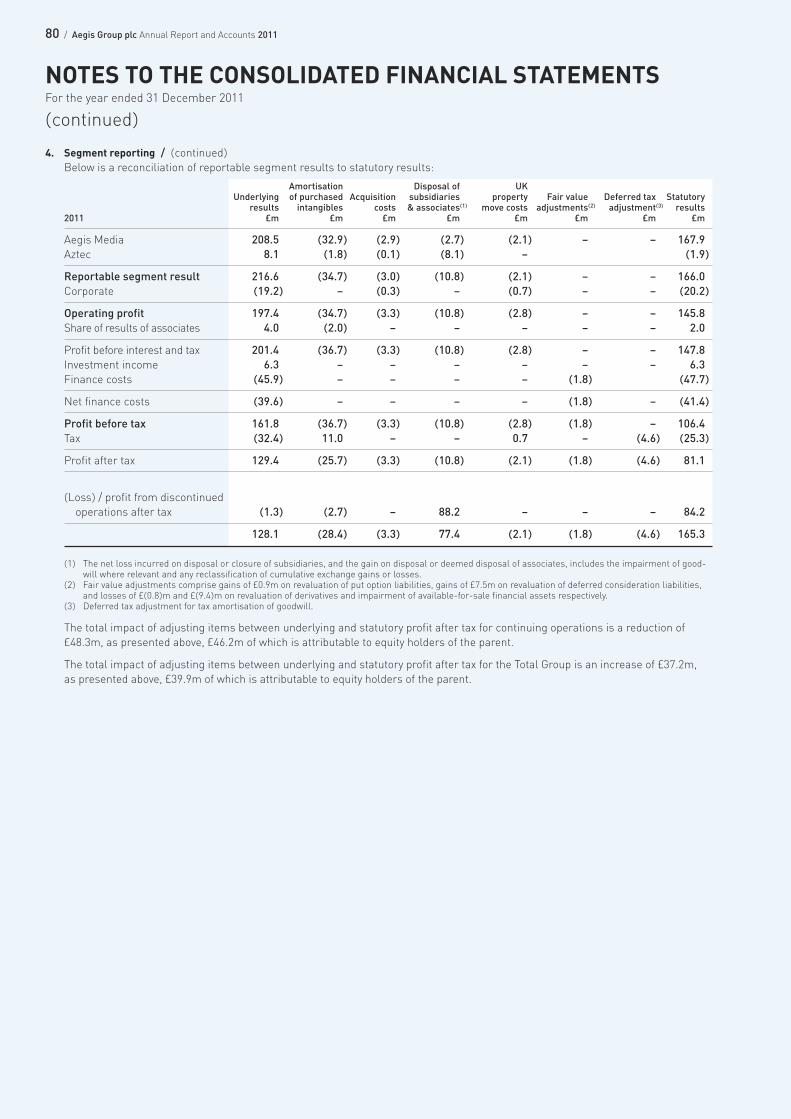
4. Segment reporting / (continued)Below is a reconciliation of reportable segment results to statutory results:
Amortisation Disposal of UKUnderlying of purchased Acquisition subsidiaries property Fair value Deferred tax Statutory
results intangibles costs & associates(1) move costs adjustments(2) adjustment(3) results2011 £m £m £m £m £m £m £m £m
Aegis Media 208.5 (32.9) (2.9) (2.7) (2.1) – – 167.9 Aztec 8.1 (1.8) (0.1) (8.1) – (1.9)
Reportable segment result 216.6 (34.7) (3.0) (10.8) (2.1) – – 166.0Corporate (19.2) – (0.3) – (0.7) – – (20.2)
Operating profit 197.4 (34.7) (3.3) (10.8) (2.8) – – 145.8Share of results of associates 4.0 (2.0) – – – – – 2.0
Profit before interest and tax 201.4 (36.7) (3.3) (10.8) (2.8) – – 147.8 Investment income 6.3 – – – – – – 6.3 Finance costs (45.9) – – – – (1.8) (47.7)
Net finance costs (39.6) – – – – (1.8) – (41.4)
Profit before tax 161.8 (36.7) (3.3) (10.8) (2.8) (1.8) – 106.4Tax (32.4) 11.0 – – 0.7 – (4.6) (25.3)
Profit after tax 129.4 (25.7) (3.3) (10.8) (2.1) (1.8) (4.6) 81.1
(Loss) / profit from discontinued operations after tax (1.3) (2.7) – 88.2 – – – 84.2
128.1 (28.4) (3.3) 77.4 (2.1) (1.8) (4.6) 165.3
(1) The net loss incurred on disposal or closure of subsidiaries, and the gain on disposal or deemed disposal of associates, includes the impairment of good-will where relevant and any reclassification of cumulative exchange gains or losses.
(2) Fair value adjustments comprise gains of £0.9m on revaluation of put option liabilities, gains of £7.5m on revaluation of deferred consideration liabilities,and losses of £(0.8)m and £(9.4)m on revaluation of derivatives and impairment of available-for-sale financial assets respectively.
(3) Deferred tax adjustment for tax amortisation of goodwill.
The total impact of adjusting items between underlying and statutory profit after tax for continuing operations is a reduction of£48.3m, as presented above, £46.2m of which is attributable to equity holders of the parent.
The total impact of adjusting items between underlying and statutory profit after tax for the Total Group is an increase of £37.2m, as presented above, £39.9m of which is attributable to equity holders of the parent.
NOTES TO THE CONSOLIDATED FINANCIAL STATEMENTSFor the year ended 31 December 2011
(continued)
81 / Aegis Group plc Annual Report and Accounts 2011
/FINANCIAL STATEM
ENTS
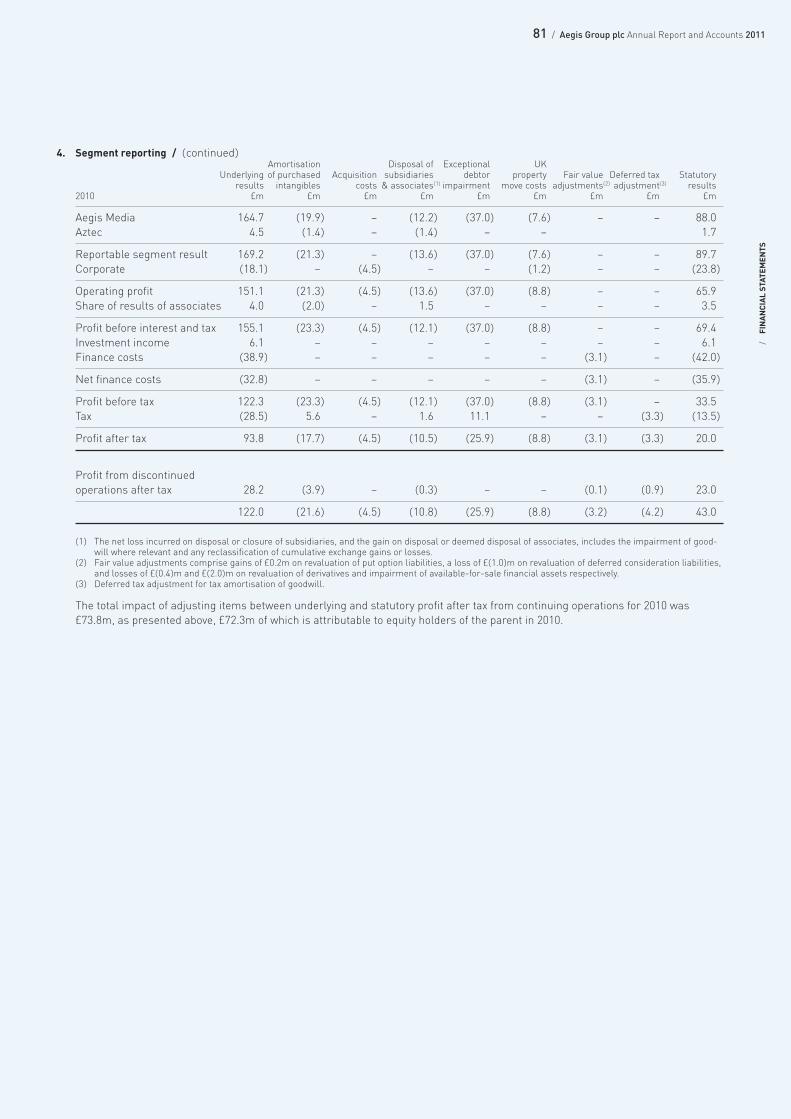
4. Segment reporting / (continued)Amortisation Disposal of Exceptional UK
Underlying of purchased Acquisition subsidiaries debtor property Fair value Deferred tax Statutoryresults intangibles costs & associates(1) impairment move costs adjustments(2) adjustment(3) results
2010 £m £m £m £m £m £m £m £m £m
Aegis Media 164.7 (19.9) – (12.2) (37.0) (7.6) – – 88.0 Aztec 4.5 (1.4) – (1.4) – – 1.7
Reportable segment result 169.2 (21.3) – (13.6) (37.0) (7.6) – – 89.7 Corporate (18.1) – (4.5) – – (1.2) – – (23.8)
Operating profit 151.1 (21.3) (4.5) (13.6) (37.0) (8.8) – – 65.9 Share of results of associates 4.0 (2.0) – 1.5 – – – – 3.5
Profit before interest and tax 155.1 (23.3) (4.5) (12.1) (37.0) (8.8) – – 69.4 Investment income 6.1 – – – – – – – 6.1 Finance costs (38.9) – – – – – (3.1) – (42.0)
Net finance costs (32.8) – – – – – (3.1) – (35.9)
Profit before tax 122.3 (23.3) (4.5) (12.1) (37.0) (8.8) (3.1) – 33.5 Tax (28.5) 5.6 – 1.6 11.1 – – (3.3) (13.5)
Profit after tax 93.8 (17.7) (4.5) (10.5) (25.9) (8.8) (3.1) (3.3) 20.0
Profit from discontinued operations after tax 28.2 (3.9) – (0.3) – – (0.1) (0.9) 23.0
122.0 (21.6) (4.5) (10.8) (25.9) (8.8) (3.2) (4.2) 43.0
(1) The net loss incurred on disposal or closure of subsidiaries, and the gain on disposal or deemed disposal of associates, includes the impairment of good-will where relevant and any reclassification of cumulative exchange gains or losses.
(2) Fair value adjustments comprise gains of £0.2m on revaluation of put option liabilities, a loss of £(1.0)m on revaluation of deferred consideration liabilities,and losses of £(0.4)m and £(2.0)m on revaluation of derivatives and impairment of available-for-sale financial assets respectively.
(3) Deferred tax adjustment for tax amortisation of goodwill.
The total impact of adjusting items between underlying and statutory profit after tax from continuing operations for 2010 was£73.8m, as presented above, £72.3m of which is attributable to equity holders of the parent in 2010.
82 / Aegis Group plc Annual Report and Accounts 2011
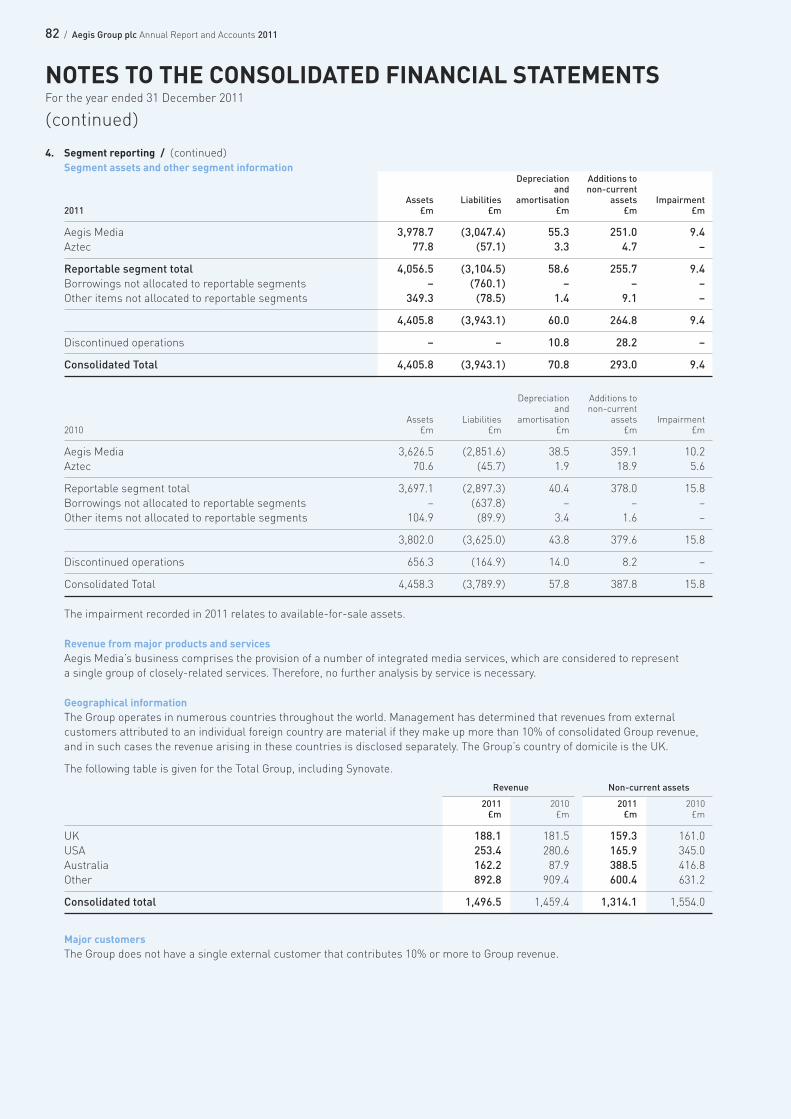
4. Segment reporting / (continued)Segment assets and other segment information
Depreciation Additions toand non-current
Assets Liabilities amortisation assets Impairment2011 £m £m £m £m £m
Aegis Media 3,978.7 (3,047.4) 55.3 251.0 9.4Aztec 77.8 (57.1) 3.3 4.7 –
Reportable segment total 4,056.5 (3,104.5) 58.6 255.7 9.4 Borrowings not allocated to reportable segments – (760.1) – – –Other items not allocated to reportable segments 349.3 (78.5) 1.4 9.1 –
4,405.8 (3,943.1) 60.0 264.8 9.4
Discontinued operations – – 10.8 28.2 –
Consolidated Total 4,405.8 (3,943.1) 70.8 293.0 9.4
Depreciation Additions toand non-current
Assets Liabilities amortisation assets Impairment2010 £m £m £m £m £m
Aegis Media 3,626.5 (2,851.6) 38.5 359.1 10.2 Aztec 70.6 (45.7) 1.9 18.9 5.6
Reportable segment total 3,697.1 (2,897.3) 40.4 378.0 15.8 Borrowings not allocated to reportable segments – (637.8) – – –Other items not allocated to reportable segments 104.9 (89.9) 3.4 1.6 –
3,802.0 (3,625.0) 43.8 379.6 15.8
Discontinued operations 656.3 (164.9) 14.0 8.2 –
Consolidated Total 4,458.3 (3,789.9) 57.8 387.8 15.8
The impairment recorded in 2011 relates to available-for-sale assets.
Revenue from major products and servicesAegis Media’s business comprises the provision of a number of integrated media services, which are considered to represent a single group of closely-related services. Therefore, no further analysis by service is necessary.
Geographical informationThe Group operates in numerous countries throughout the world. Management has determined that revenues from externalcustomers attributed to an individual foreign country are material if they make up more than 10% of consolidated Group revenue,and in such cases the revenue arising in these countries is disclosed separately. The Group’s country of domicile is the UK.
The following table is given for the Total Group, including Synovate.
Revenue Non-current assets
2011 2010 2011 2010£m £m £m £m
UK 188.1 181.5 159.3 161.0 USA 253.4 280.6 165.9 345.0 Australia 162.2 87.9 388.5 416.8 Other 892.8 909.4 600.4 631.2
Consolidated total 1,496.5 1,459.4 1,314.1 1,554.0
Major customersThe Group does not have a single external customer that contributes 10% or more to Group revenue.
NOTES TO THE CONSOLIDATED FINANCIAL STATEMENTSFor the year ended 31 December 2011
(continued)
83 / Aegis Group plc Annual Report and Accounts 2011
/FINANCIAL STATEM
ENTS
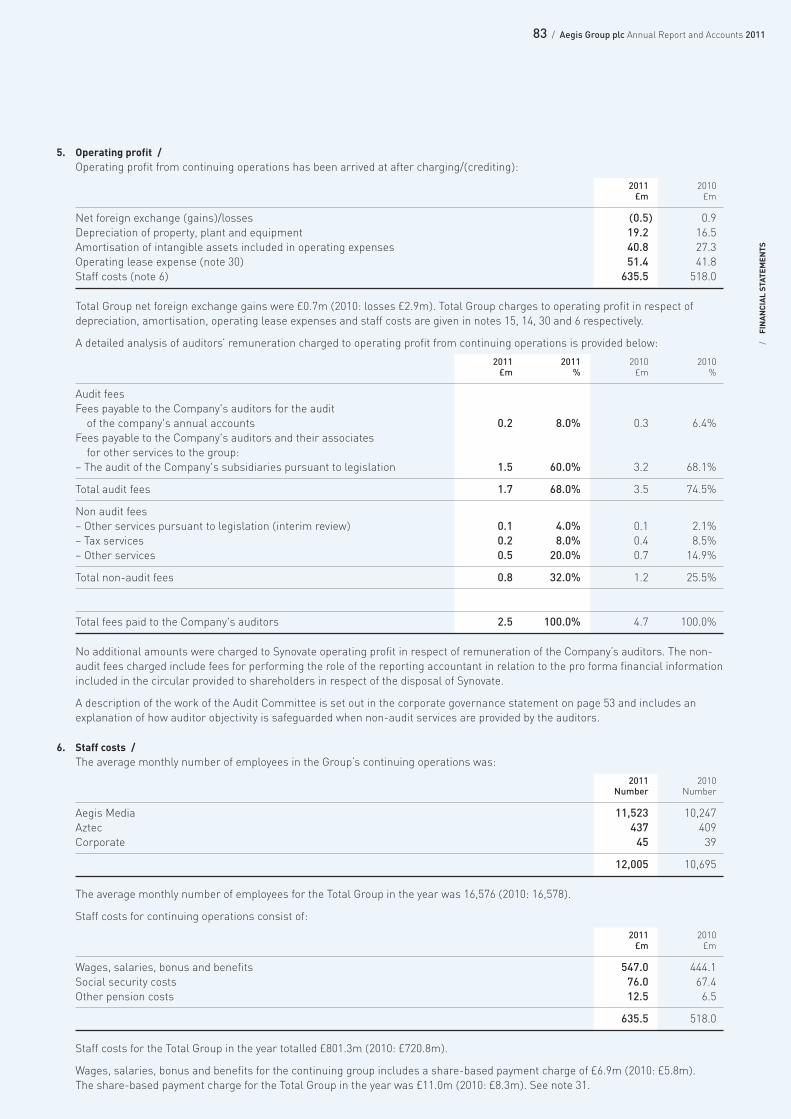
5. Operating profit /Operating profit from continuing operations has been arrived at after charging/(crediting):
2011 2010£m £m
Net foreign exchange (gains)/losses (0.5) 0.9 Depreciation of property, plant and equipment 19.2 16.5 Amortisation of intangible assets included in operating expenses 40.8 27.3 Operating lease expense (note 30) 51.4 41.8 Staff costs (note 6) 635.5 518.0
Total Group net foreign exchange gains were £0.7m (2010: losses £2.9m). Total Group charges to operating profit in respect ofdepreciation, amortisation, operating lease expenses and staff costs are given in notes 15, 14, 30 and 6 respectively.
A detailed analysis of auditors’ remuneration charged to operating profit from continuing operations is provided below:
2011 2011 2010 2010£m % £m %
Audit feesFees payable to the Company's auditors for the audit of the company's annual accounts 0.2 8.0% 0.3 6.4%
Fees payable to the Company's auditors and their associates for other services to the group:
– The audit of the Company's subsidiaries pursuant to legislation 1.5 60.0% 3.2 68.1%
Total audit fees 1.7 68.0% 3.5 74.5%
Non audit fees– Other services pursuant to legislation (interim review) 0.1 4.0% 0.1 2.1%– Tax services 0.2 8.0% 0.4 8.5%– Other services 0.5 20.0% 0.7 14.9%
Total non-audit fees 0.8 32.0% 1.2 25.5%
Total fees paid to the Company's auditors 2.5 100.0% 4.7 100.0%
No additional amounts were charged to Synovate operating profit in respect of remuneration of the Company’s auditors. The non-audit fees charged include fees for performing the role of the reporting accountant in relation to the pro forma financial informationincluded in the circular provided to shareholders in respect of the disposal of Synovate.
A description of the work of the Audit Committee is set out in the corporate governance statement on page 53 and includes anexplanation of how auditor objectivity is safeguarded when non-audit services are provided by the auditors.
6. Staff costs /The average monthly number of employees in the Group’s continuing operations was:
2011 2010Number Number
Aegis Media 11,523 10,247 Aztec 437 409 Corporate 45 39
12,005 10,695
The average monthly number of employees for the Total Group in the year was 16,576 (2010: 16,578).
Staff costs for continuing operations consist of:
2011 2010£m £m
Wages, salaries, bonus and benefits 547.0 444.1 Social security costs 76.0 67.4 Other pension costs 12.5 6.5
635.5 518.0
Staff costs for the Total Group in the year totalled £801.3m (2010: £720.8m).
Wages, salaries, bonus and benefits for the continuing group includes a share-based payment charge of £6.9m (2010: £5.8m). The share-based payment charge for the Total Group in the year was £11.0m (2010: £8.3m). See note 31.
84 / Aegis Group plc Annual Report and Accounts 2011
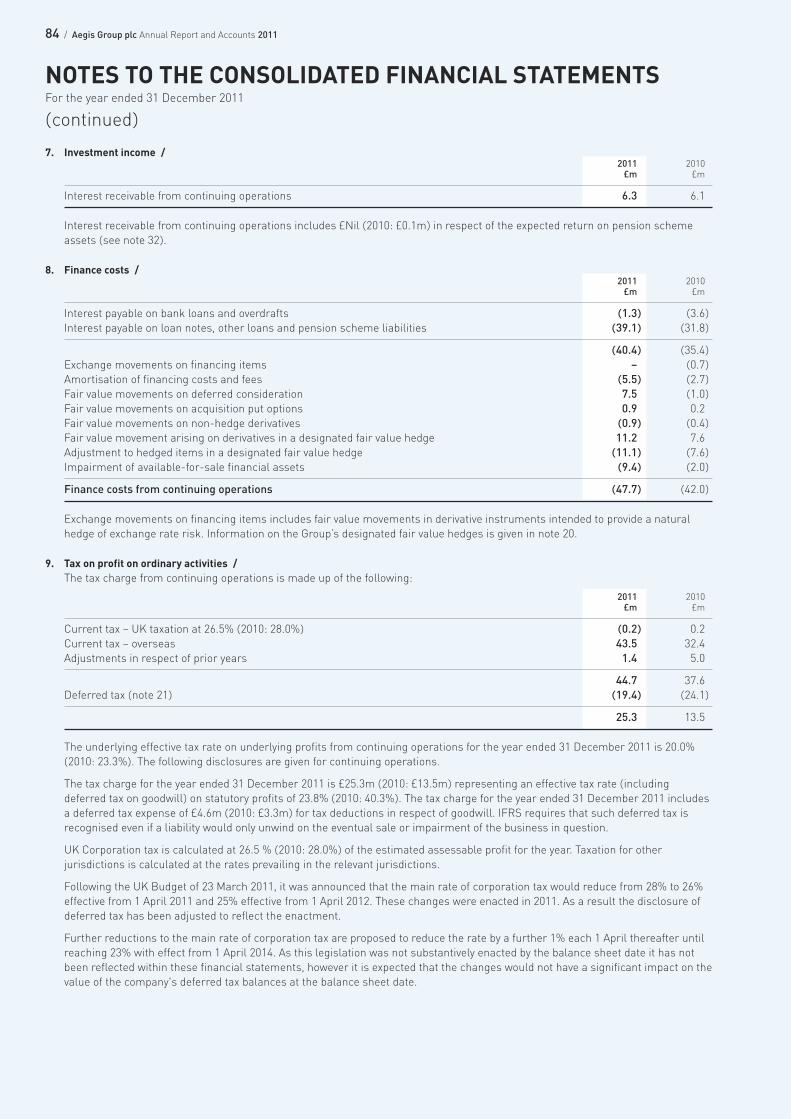
7. Investment income /2011 2010£m £m
Interest receivable from continuing operations 6.3 6.1
Interest receivable from continuing operations includes £Nil (2010: £0.1m) in respect of the expected return on pension schemeassets (see note 32).
8. Finance costs /2011 2010£m £m
Interest payable on bank loans and overdrafts (1.3) (3.6)Interest payable on loan notes, other loans and pension scheme liabilities (39.1) (31.8)
(40.4) (35.4)Exchange movements on financing items – (0.7)Amortisation of financing costs and fees (5.5) (2.7)Fair value movements on deferred consideration 7.5 (1.0)Fair value movements on acquisition put options 0.9 0.2 Fair value movements on non-hedge derivatives (0.9) (0.4)Fair value movement arising on derivatives in a designated fair value hedge 11.2 7.6 Adjustment to hedged items in a designated fair value hedge (11.1) (7.6)Impairment of available-for-sale financial assets (9.4) (2.0)
Finance costs from continuing operations (47.7) (42.0)
Exchange movements on financing items includes fair value movements in derivative instruments intended to provide a naturalhedge of exchange rate risk. Information on the Group’s designated fair value hedges is given in note 20.
9. Tax on profit on ordinary activities /The tax charge from continuing operations is made up of the following:
2011 2010£m £m
Current tax – UK taxation at 26.5% (2010: 28.0%) (0.2) 0.2 Current tax – overseas 43.5 32.4 Adjustments in respect of prior years 1.4 5.0
44.7 37.6 Deferred tax (note 21) (19.4) (24.1)
25.3 13.5
The underlying effective tax rate on underlying profits from continuing operations for the year ended 31 December 2011 is 20.0%(2010: 23.3%). The following disclosures are given for continuing operations.
The tax charge for the year ended 31 December 2011 is £25.3m (2010: £13.5m) representing an effective tax rate (includingdeferred tax on goodwill) on statutory profits of 23.8% (2010: 40.3%). The tax charge for the year ended 31 December 2011 includesa deferred tax expense of £4.6m (2010: £3.3m) for tax deductions in respect of goodwill. IFRS requires that such deferred tax isrecognised even if a liability would only unwind on the eventual sale or impairment of the business in question.
UK Corporation tax is calculated at 26.5 % (2010: 28.0%) of the estimated assessable profit for the year. Taxation for otherjurisdictions is calculated at the rates prevailing in the relevant jurisdictions.
Following the UK Budget of 23 March 2011, it was announced that the main rate of corporation tax would reduce from 28% to 26%effective from 1 April 2011 and 25% effective from 1 April 2012. These changes were enacted in 2011. As a result the disclosure ofdeferred tax has been adjusted to reflect the enactment.
Further reductions to the main rate of corporation tax are proposed to reduce the rate by a further 1% each 1 April thereafter untilreaching 23% with effect from 1 April 2014. As this legislation was not substantively enacted by the balance sheet date it has notbeen reflected within these financial statements, however it is expected that the changes would not have a significant impact on thevalue of the company's deferred tax balances at the balance sheet date.
NOTES TO THE CONSOLIDATED FINANCIAL STATEMENTSFor the year ended 31 December 2011
(continued)
85 / Aegis Group plc Annual Report and Accounts 2011
/FINANCIAL STATEM
ENTS
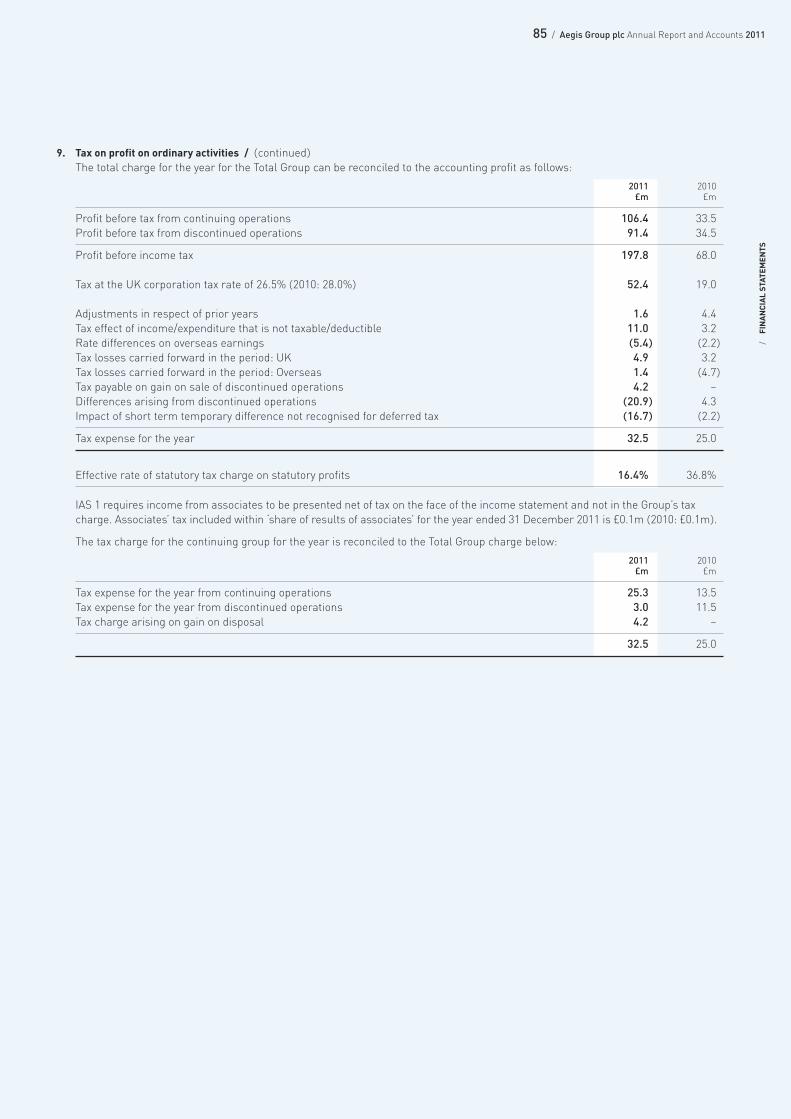
9. Tax on profit on ordinary activities / (continued)The total charge for the year for the Total Group can be reconciled to the accounting profit as follows:
2011 2010£m £m
Profit before tax from continuing operations 106.4 33.5 Profit before tax from discontinued operations 91.4 34.5
Profit before income tax 197.8 68.0
Tax at the UK corporation tax rate of 26.5% (2010: 28.0%) 52.4 19.0
Adjustments in respect of prior years 1.6 4.4 Tax effect of income/expenditure that is not taxable/deductible 11.0 3.2 Rate differences on overseas earnings (5.4) (2.2)Tax losses carried forward in the period: UK 4.9 3.2 Tax losses carried forward in the period: Overseas 1.4 (4.7)Tax payable on gain on sale of discontinued operations 4.2 –Differences arising from discontinued operations (20.9) 4.3 Impact of short term temporary difference not recognised for deferred tax (16.7) (2.2)
Tax expense for the year 32.5 25.0
Effective rate of statutory tax charge on statutory profits 16.4% 36.8%
IAS 1 requires income from associates to be presented net of tax on the face of the income statement and not in the Group’s taxcharge. Associates’ tax included within ‘share of results of associates’ for the year ended 31 December 2011 is £0.1m (2010: £0.1m).
The tax charge for the continuing group for the year is reconciled to the Total Group charge below:
2011 2010£m £m
Tax expense for the year from continuing operations 25.3 13.5 Tax expense for the year from discontinued operations 3.0 11.5 Tax charge arising on gain on disposal 4.2 –
32.5 25.0
86 / Aegis Group plc Annual Report and Accounts 2011
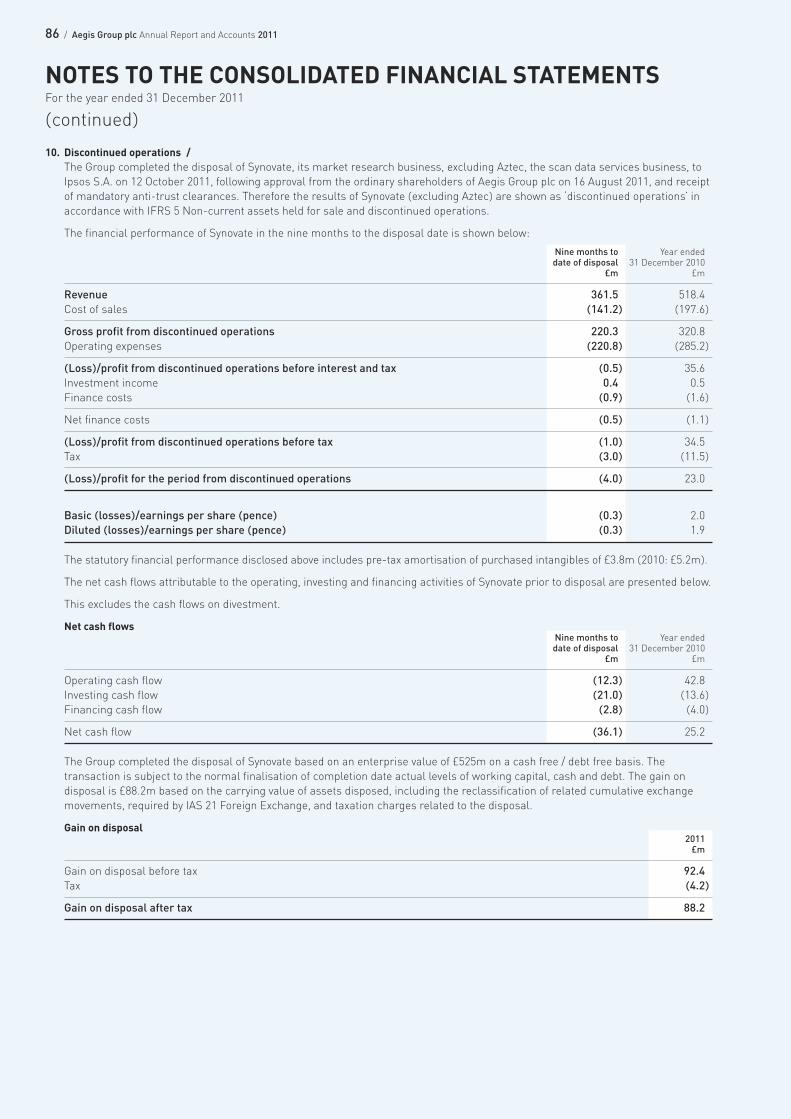
10. Discontinued operations /The Group completed the disposal of Synovate, its market research business, excluding Aztec, the scan data services business, toIpsos S.A. on 12 October 2011, following approval from the ordinary shareholders of Aegis Group plc on 16 August 2011, and receiptof mandatory anti-trust clearances. Therefore the results of Synovate (excluding Aztec) are shown as ‘discontinued operations’ inaccordance with IFRS 5 Non-current assets held for sale and discontinued operations.
The financial performance of Synovate in the nine months to the disposal date is shown below:
Nine months to Year endeddate of disposal 31 December 2010
£m £m
Revenue 361.5 518.4 Cost of sales (141.2) (197.6)
Gross profit from discontinued operations 220.3 320.8 Operating expenses (220.8) (285.2)
(Loss)/profit from discontinued operations before interest and tax (0.5) 35.6 Investment income 0.4 0.5 Finance costs (0.9) (1.6)
Net finance costs (0.5) (1.1)
(Loss)/profit from discontinued operations before tax (1.0) 34.5 Tax (3.0) (11.5)
(Loss)/profit for the period from discontinued operations (4.0) 23.0
Basic (losses)/earnings per share (pence) (0.3) 2.0 Diluted (losses)/earnings per share (pence) (0.3) 1.9
The statutory financial performance disclosed above includes pre-tax amortisation of purchased intangibles of £3.8m (2010: £5.2m).
The net cash flows attributable to the operating, investing and financing activities of Synovate prior to disposal are presented below.
This excludes the cash flows on divestment.
Net cash flowsNine months to Year endeddate of disposal 31 December 2010
£m £m
Operating cash flow (12.3) 42.8 Investing cash flow (21.0) (13.6)Financing cash flow (2.8) (4.0)
Net cash flow (36.1) 25.2
The Group completed the disposal of Synovate based on an enterprise value of £525m on a cash free / debt free basis. Thetransaction is subject to the normal finalisation of completion date actual levels of working capital, cash and debt. The gain ondisposal is £88.2m based on the carrying value of assets disposed, including the reclassification of related cumulative exchangemovements, required by IAS 21 Foreign Exchange, and taxation charges related to the disposal.
Gain on disposal2011£m
Gain on disposal before tax 92.4Tax (4.2)
Gain on disposal after tax 88.2
NOTES TO THE CONSOLIDATED FINANCIAL STATEMENTSFor the year ended 31 December 2011
(continued)
87 / Aegis Group plc Annual Report and Accounts 2011
/FINANCIAL STATEM
ENTS
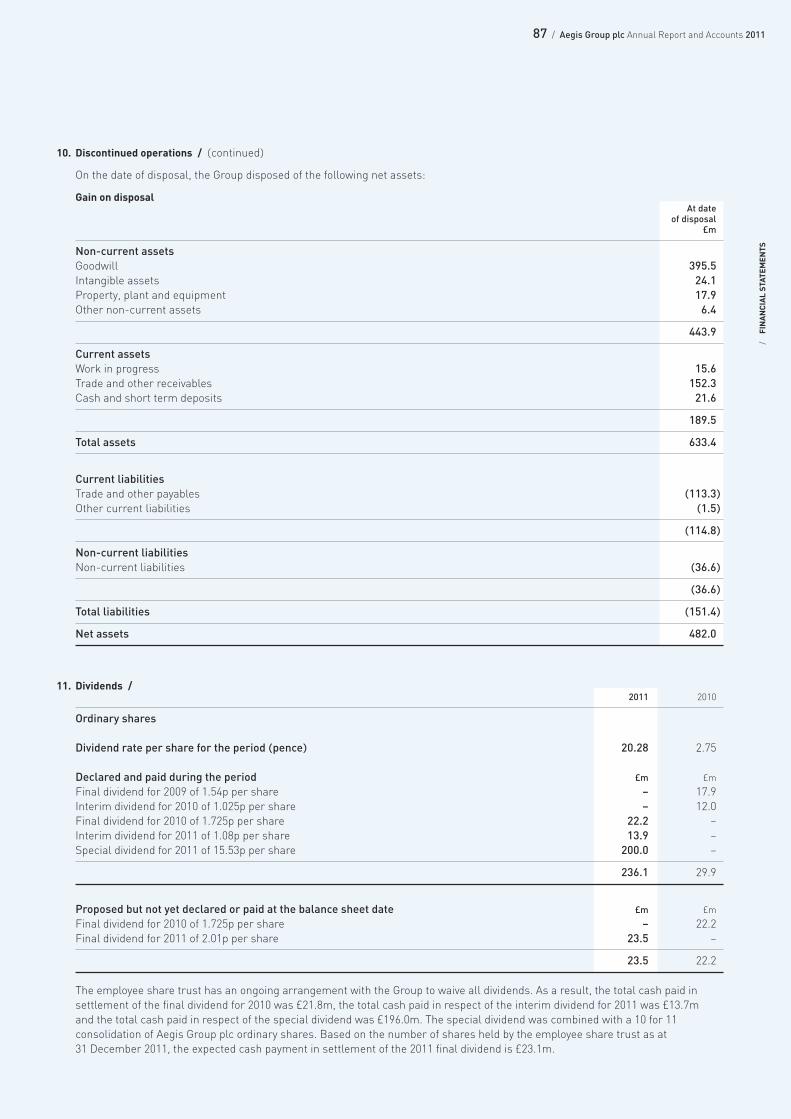
10. Discontinued operations / (continued)
On the date of disposal, the Group disposed of the following net assets:
Gain on disposalAt date
of disposal£m
Non-current assetsGoodwill 395.5Intangible assets 24.1Property, plant and equipment 17.9 Other non-current assets 6.4
443.9
Current assetsWork in progress 15.6Trade and other receivables 152.3 Cash and short term deposits 21.6
189.5
Total assets 633.4
Current liabilitiesTrade and other payables (113.3)Other current liabilities (1.5)
(114.8)
Non-current liabilitiesNon-current liabilities (36.6)
(36.6)
Total liabilities (151.4)
Net assets 482.0
11. Dividends /2011 2010
Ordinary shares
Dividend rate per share for the period (pence) 20.28 2.75
Declared and paid during the period £m £m
Final dividend for 2009 of 1.54p per share – 17.9 Interim dividend for 2010 of 1.025p per share – 12.0 Final dividend for 2010 of 1.725p per share 22.2 –Interim dividend for 2011 of 1.08p per share 13.9 –Special dividend for 2011 of 15.53p per share 200.0 –
236.1 29.9
Proposed but not yet declared or paid at the balance sheet date £m £m
Final dividend for 2010 of 1.725p per share – 22.2 Final dividend for 2011 of 2.01p per share 23.5 –
23.5 22.2
The employee share trust has an ongoing arrangement with the Group to waive all dividends. As a result, the total cash paid insettlement of the final dividend for 2010 was £21.8m, the total cash paid in respect of the interim dividend for 2011 was £13.7m and the total cash paid in respect of the special dividend was £196.0m. The special dividend was combined with a 10 for 11consolidation of Aegis Group plc ordinary shares. Based on the number of shares held by the employee share trust as at 31 December 2011, the expected cash payment in settlement of the 2011 final dividend is £23.1m.
88 / Aegis Group plc Annual Report and Accounts 2011
11. Dividends / (continued)
An interim dividend of 1.08p per share was paid on 23 September 2011, shortly before the 10 for 11 share consolidation undertakenon 24 October 2011. This is equivalent to 1.19p per share on a post-consolidation basis. The final dividend proposed for the year is 2.01p per share, making a total dividend for the year of 3.20p per share on a post-consolidation basis, excluding the specialdividend announced on 14 October 2011. The special dividend of 15.53p per share (equivalent to 17.08p per share on a post-consolidation basis) increases the total dividend for the year to 20.28p per share on a post-consolidation basis.
The final dividend for 2011, if approved, will be paid on 4 July 2012 to all ordinary shareholders on the register at 15 June 2012.
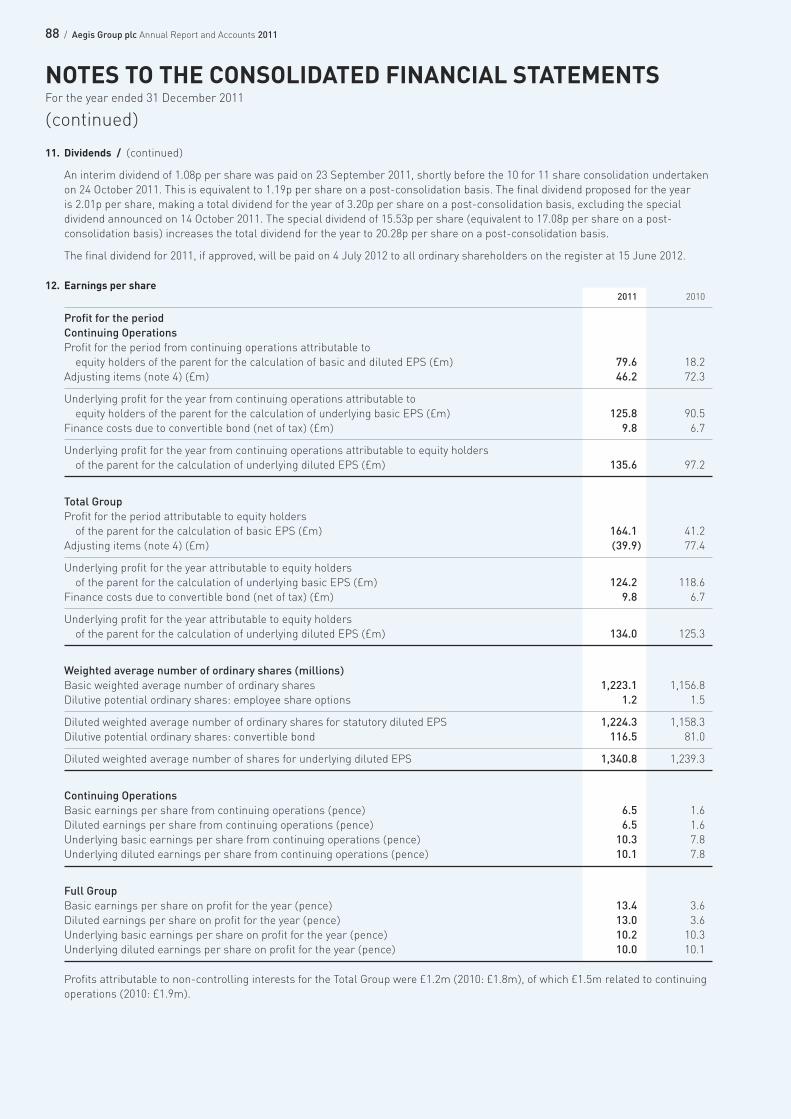
12. Earnings per share2011 2010
Profit for the periodContinuing OperationsProfit for the period from continuing operations attributable to equity holders of the parent for the calculation of basic and diluted EPS (£m) 79.6 18.2
Adjusting items (note 4) (£m) 46.2 72.3
Underlying profit for the year from continuing operations attributable to equity holders of the parent for the calculation of underlying basic EPS (£m) 125.8 90.5
Finance costs due to convertible bond (net of tax) (£m) 9.8 6.7
Underlying profit for the year from continuing operations attributable to equity holdersof the parent for the calculation of underlying diluted EPS (£m) 135.6 97.2
Total GroupProfit for the period attributable to equity holders of the parent for the calculation of basic EPS (£m) 164.1 41.2
Adjusting items (note 4) (£m) (39.9) 77.4
Underlying profit for the year attributable to equity holdersof the parent for the calculation of underlying basic EPS (£m) 124.2 118.6
Finance costs due to convertible bond (net of tax) (£m) 9.8 6.7
Underlying profit for the year attributable to equity holdersof the parent for the calculation of underlying diluted EPS (£m) 134.0 125.3
Weighted average number of ordinary shares (millions)Basic weighted average number of ordinary shares 1,223.1 1,156.8 Dilutive potential ordinary shares: employee share options 1.2 1.5
Diluted weighted average number of ordinary shares for statutory diluted EPS 1,224.3 1,158.3 Dilutive potential ordinary shares: convertible bond 116.5 81.0
Diluted weighted average number of shares for underlying diluted EPS 1,340.8 1,239.3
Continuing OperationsBasic earnings per share from continuing operations (pence) 6.5 1.6 Diluted earnings per share from continuing operations (pence) 6.5 1.6 Underlying basic earnings per share from continuing operations (pence) 10.3 7.8 Underlying diluted earnings per share from continuing operations (pence) 10.1 7.8
Full GroupBasic earnings per share on profit for the year (pence) 13.4 3.6 Diluted earnings per share on profit for the year (pence) 13.0 3.6 Underlying basic earnings per share on profit for the year (pence) 10.2 10.3 Underlying diluted earnings per share on profit for the year (pence) 10.0 10.1
Profits attributable to non-controlling interests for the Total Group were £1.2m (2010: £1.8m), of which £1.5m related to continuingoperations (2010: £1.9m).
NOTES TO THE CONSOLIDATED FINANCIAL STATEMENTSFor the year ended 31 December 2011
(continued)
89 / Aegis Group plc Annual Report and Accounts 2011
/FINANCIAL STATEM
ENTS
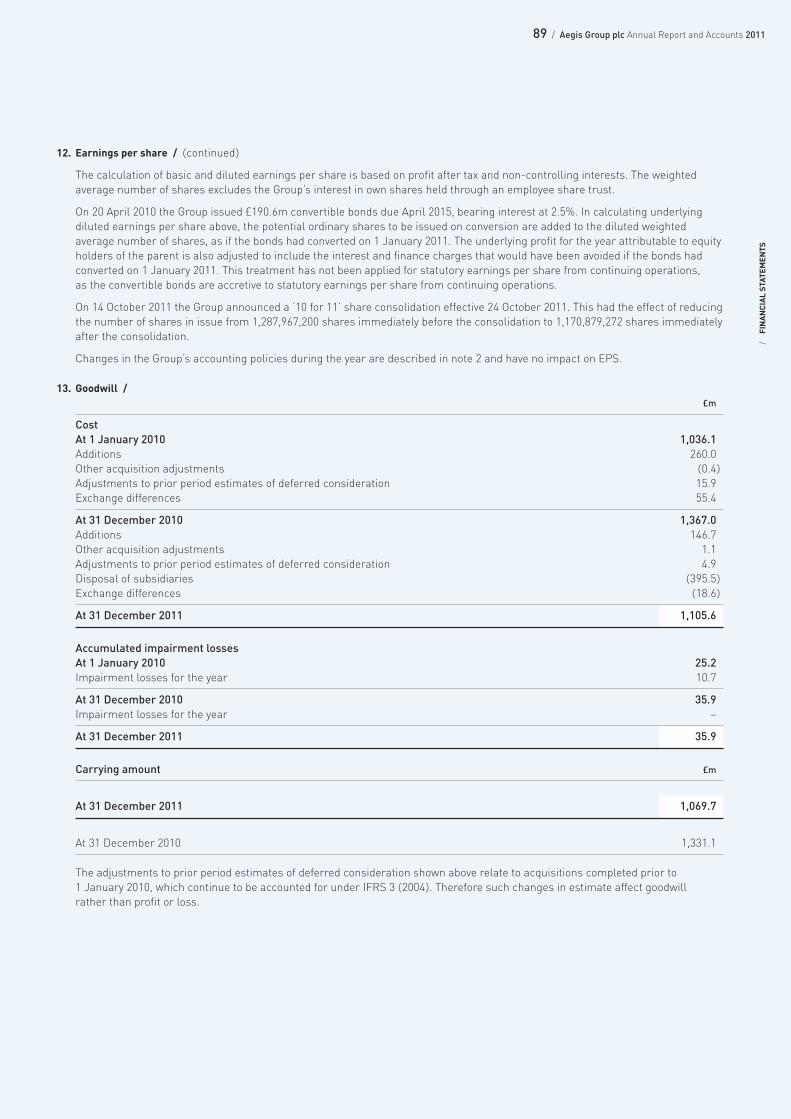
12. Earnings per share / (continued)
The calculation of basic and diluted earnings per share is based on profit after tax and non-controlling interests. The weightedaverage number of shares excludes the Group’s interest in own shares held through an employee share trust.
On 20 April 2010 the Group issued £190.6m convertible bonds due April 2015, bearing interest at 2.5%. In calculating underlyingdiluted earnings per share above, the potential ordinary shares to be issued on conversion are added to the diluted weightedaverage number of shares, as if the bonds had converted on 1 January 2011. The underlying profit for the year attributable to equityholders of the parent is also adjusted to include the interest and finance charges that would have been avoided if the bonds hadconverted on 1 January 2011. This treatment has not been applied for statutory earnings per share from continuing operations, as the convertible bonds are accretive to statutory earnings per share from continuing operations.
On 14 October 2011 the Group announced a ‘10 for 11’ share consolidation effective 24 October 2011. This had the effect of reducingthe number of shares in issue from 1,287,967,200 shares immediately before the consolidation to 1,170,879,272 shares immediatelyafter the consolidation.
Changes in the Group’s accounting policies during the year are described in note 2 and have no impact on EPS.
13. Goodwill / £m
CostAt 1 January 2010 1,036.1Additions 260.0 Other acquisition adjustments (0.4)Adjustments to prior period estimates of deferred consideration 15.9 Exchange differences 55.4
At 31 December 2010 1,367.0 Additions 146.7 Other acquisition adjustments 1.1 Adjustments to prior period estimates of deferred consideration 4.9 Disposal of subsidiaries (395.5)Exchange differences (18.6)
At 31 December 2011 1,105.6
Accumulated impairment lossesAt 1 January 2010 25.2Impairment losses for the year 10.7
At 31 December 2010 35.9Impairment losses for the year –
At 31 December 2011 35.9
Carrying amount £m
At 31 December 2011 1,069.7
At 31 December 2010 1,331.1
The adjustments to prior period estimates of deferred consideration shown above relate to acquisitions completed prior to 1 January 2010, which continue to be accounted for under IFRS 3 (2004). Therefore such changes in estimate affect goodwill rather than profit or loss.
90 / Aegis Group plc Annual Report and Accounts 2011
13. Goodwill / (continued)
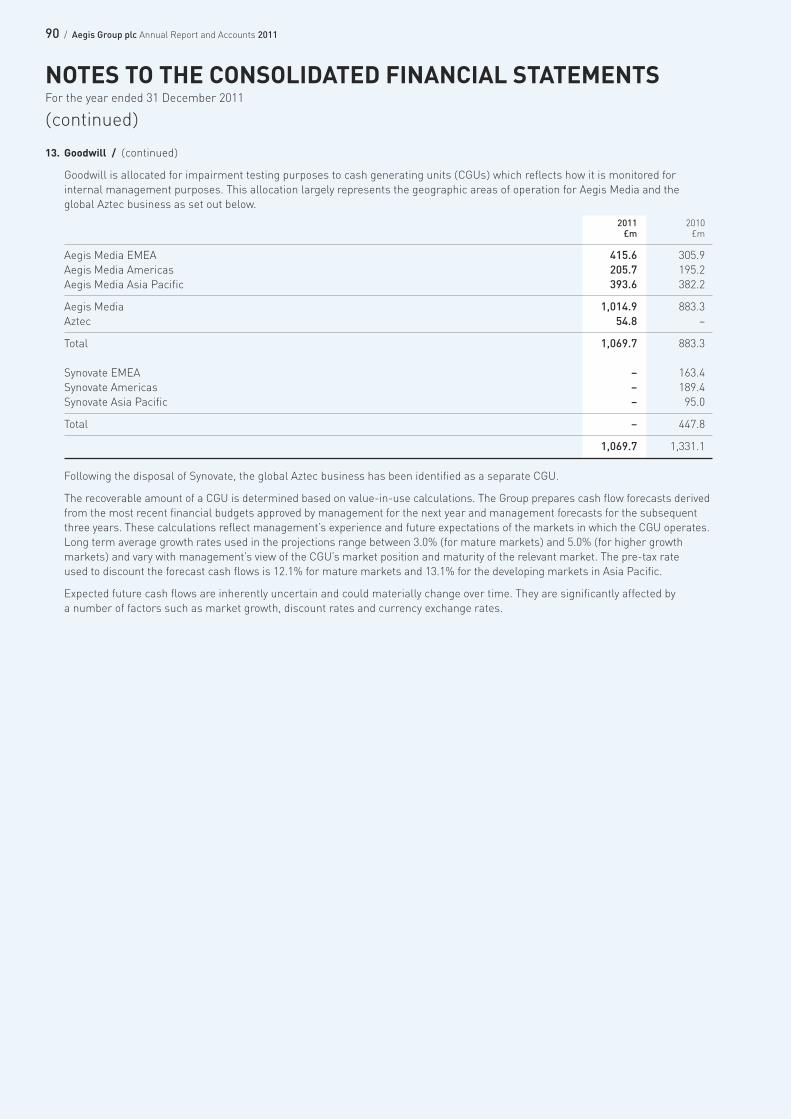
Goodwill is allocated for impairment testing purposes to cash generating units (CGUs) which reflects how it is monitored forinternal management purposes. This allocation largely represents the geographic areas of operation for Aegis Media and theglobal Aztec business as set out below.
2011 2010£m £m
Aegis Media EMEA 415.6 305.9 Aegis Media Americas 205.7 195.2 Aegis Media Asia Pacific 393.6 382.2
Aegis Media 1,014.9 883.3 Aztec 54.8 –
Total 1,069.7 883.3
Synovate EMEA – 163.4 Synovate Americas – 189.4 Synovate Asia Pacific – 95.0
Total – 447.8
1,069.7 1,331.1
Following the disposal of Synovate, the global Aztec business has been identified as a separate CGU.
The recoverable amount of a CGU is determined based on value-in-use calculations. The Group prepares cash flow forecasts derivedfrom the most recent financial budgets approved by management for the next year and management forecasts for the subsequentthree years. These calculations reflect management’s experience and future expectations of the markets in which the CGU operates.Long term average growth rates used in the projections range between 3.0% (for mature markets) and 5.0% (for higher growthmarkets) and vary with management’s view of the CGU’s market position and maturity of the relevant market. The pre-tax rate used to discount the forecast cash flows is 12.1% for mature markets and 13.1% for the developing markets in Asia Pacific.
Expected future cash flows are inherently uncertain and could materially change over time. They are significantly affected by a number of factors such as market growth, discount rates and currency exchange rates.
NOTES TO THE CONSOLIDATED FINANCIAL STATEMENTSFor the year ended 31 December 2011
(continued)
91 / Aegis Group plc Annual Report and Accounts 2011
/FINANCIAL STATEM
ENTS
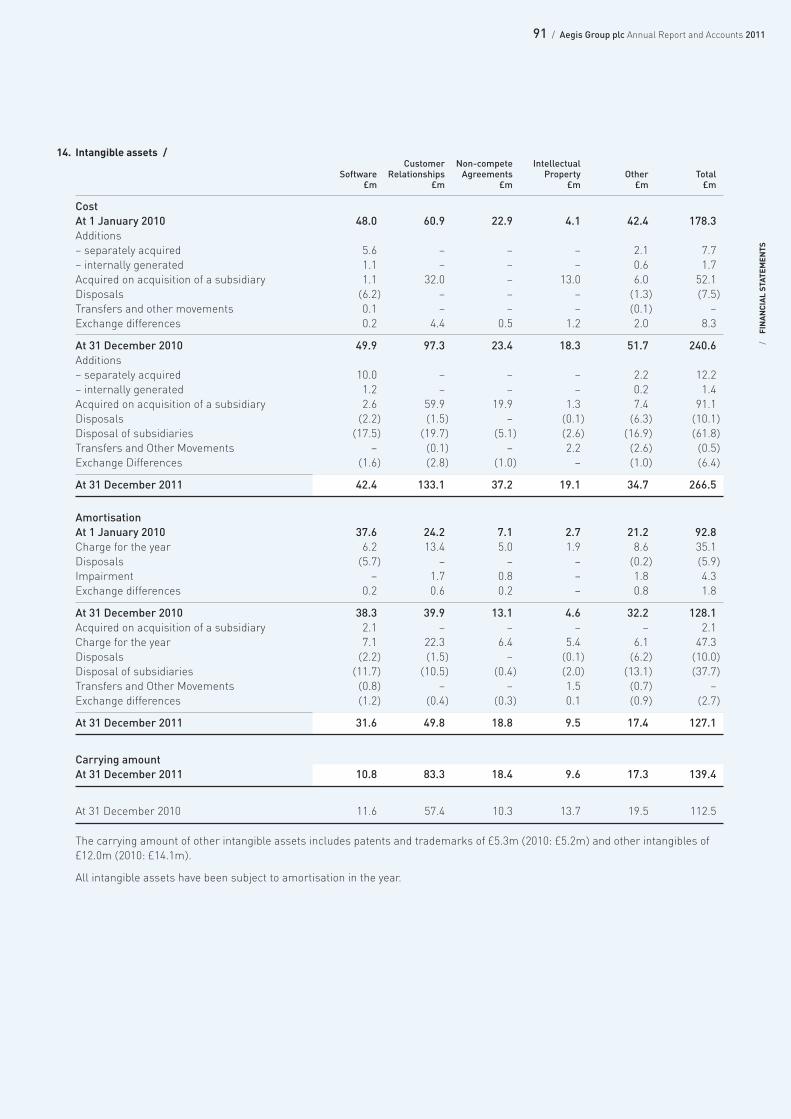
14. Intangible assets /Customer Non-compete Intellectual
Software Relationships Agreements Property Other Total£m £m £m £m £m £m
CostAt 1 January 2010 48.0 60.9 22.9 4.1 42.4 178.3 Additions– separately acquired 5.6 – – – 2.1 7.7 – internally generated 1.1 – – – 0.6 1.7 Acquired on acquisition of a subsidiary 1.1 32.0 – 13.0 6.0 52.1 Disposals (6.2) – – – (1.3) (7.5)Transfers and other movements 0.1 – – – (0.1) –Exchange differences 0.2 4.4 0.5 1.2 2.0 8.3
At 31 December 2010 49.9 97.3 23.4 18.3 51.7 240.6 Additions– separately acquired 10.0 – – – 2.2 12.2 – internally generated 1.2 – – – 0.2 1.4 Acquired on acquisition of a subsidiary 2.6 59.9 19.9 1.3 7.4 91.1 Disposals (2.2) (1.5) – (0.1) (6.3) (10.1)Disposal of subsidiaries (17.5) (19.7) (5.1) (2.6) (16.9) (61.8)Transfers and Other Movements – (0.1) – 2.2 (2.6) (0.5)Exchange Differences (1.6) (2.8) (1.0) – (1.0) (6.4)
At 31 December 2011 42.4 133.1 37.2 19.1 34.7 266.5
AmortisationAt 1 January 2010 37.6 24.2 7.1 2.7 21.2 92.8 Charge for the year 6.2 13.4 5.0 1.9 8.6 35.1 Disposals (5.7) – – – (0.2) (5.9)Impairment – 1.7 0.8 – 1.8 4.3 Exchange differences 0.2 0.6 0.2 – 0.8 1.8
At 31 December 2010 38.3 39.9 13.1 4.6 32.2 128.1 Acquired on acquisition of a subsidiary 2.1 – – – – 2.1 Charge for the year 7.1 22.3 6.4 5.4 6.1 47.3 Disposals (2.2) (1.5) – (0.1) (6.2) (10.0)Disposal of subsidiaries (11.7) (10.5) (0.4) (2.0) (13.1) (37.7)Transfers and Other Movements (0.8) – – 1.5 (0.7) –Exchange differences (1.2) (0.4) (0.3) 0.1 (0.9) (2.7)
At 31 December 2011 31.6 49.8 18.8 9.5 17.4 127.1
Carrying amountAt 31 December 2011 10.8 83.3 18.4 9.6 17.3 139.4
At 31 December 2010 11.6 57.4 10.3 13.7 19.5 112.5
The carrying amount of other intangible assets includes patents and trademarks of £5.3m (2010: £5.2m) and other intangibles of£12.0m (2010: £14.1m).
All intangible assets have been subject to amortisation in the year.
92 / Aegis Group plc Annual Report and Accounts 2011
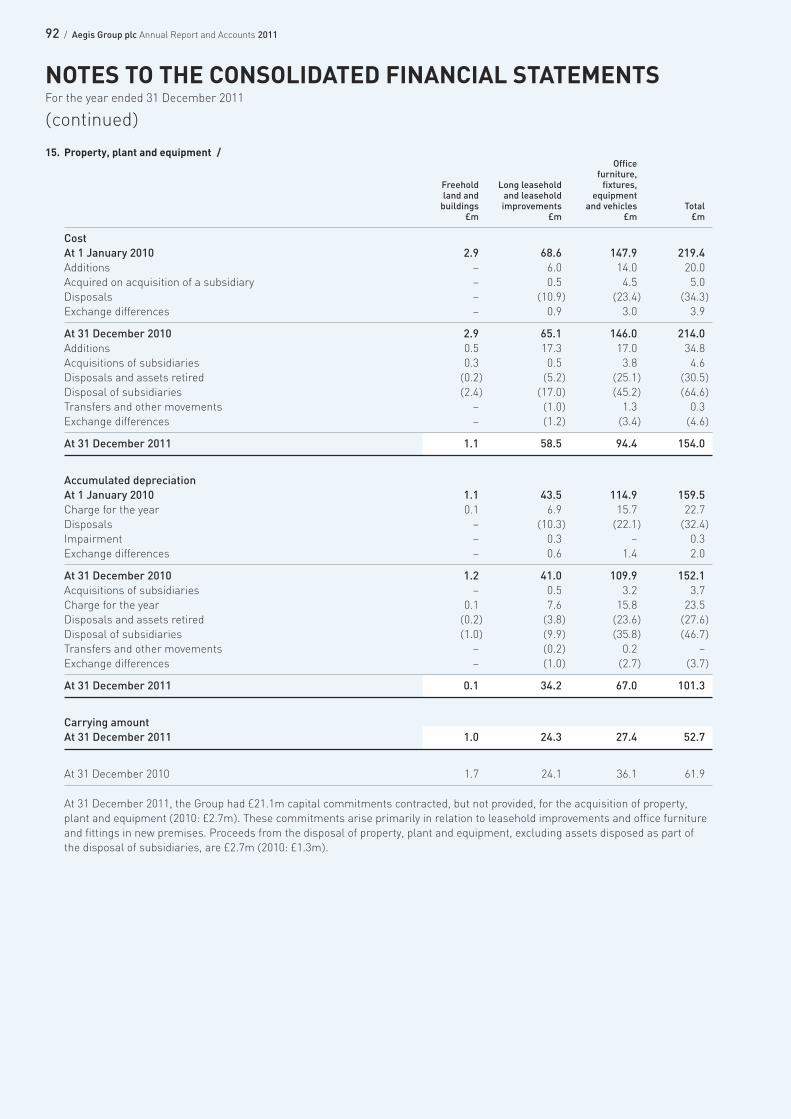
15. Property, plant and equipment /Office
furniture,Freehold Long leasehold fixtures,land and and leasehold equipment buildings improvements and vehicles Total
£m £m £m £m
CostAt 1 January 2010 2.9 68.6 147.9 219.4 Additions – 6.0 14.0 20.0 Acquired on acquisition of a subsidiary – 0.5 4.5 5.0 Disposals – (10.9) (23.4) (34.3)Exchange differences – 0.9 3.0 3.9
At 31 December 2010 2.9 65.1 146.0 214.0 Additions 0.5 17.3 17.0 34.8 Acquisitions of subsidiaries 0.3 0.5 3.8 4.6 Disposals and assets retired (0.2) (5.2) (25.1) (30.5)Disposal of subsidiaries (2.4) (17.0) (45.2) (64.6)Transfers and other movements – (1.0) 1.3 0.3 Exchange differences – (1.2) (3.4) (4.6)
At 31 December 2011 1.1 58.5 94.4 154.0
Accumulated depreciationAt 1 January 2010 1.1 43.5 114.9 159.5 Charge for the year 0.1 6.9 15.7 22.7 Disposals – (10.3) (22.1) (32.4)Impairment – 0.3 – 0.3 Exchange differences – 0.6 1.4 2.0
At 31 December 2010 1.2 41.0 109.9 152.1 Acquisitions of subsidiaries – 0.5 3.2 3.7 Charge for the year 0.1 7.6 15.8 23.5 Disposals and assets retired (0.2) (3.8) (23.6) (27.6)Disposal of subsidiaries (1.0) (9.9) (35.8) (46.7)Transfers and other movements – (0.2) 0.2 –Exchange differences – (1.0) (2.7) (3.7)
At 31 December 2011 0.1 34.2 67.0 101.3
Carrying amountAt 31 December 2011 1.0 24.3 27.4 52.7
At 31 December 2010 1.7 24.1 36.1 61.9
At 31 December 2011, the Group had £21.1m capital commitments contracted, but not provided, for the acquisition of property,plant and equipment (2010: £2.7m). These commitments arise primarily in relation to leasehold improvements and office furnitureand fittings in new premises. Proceeds from the disposal of property, plant and equipment, excluding assets disposed as part ofthe disposal of subsidiaries, are £2.7m (2010: £1.3m).
NOTES TO THE CONSOLIDATED FINANCIAL STATEMENTSFor the year ended 31 December 2011
(continued)
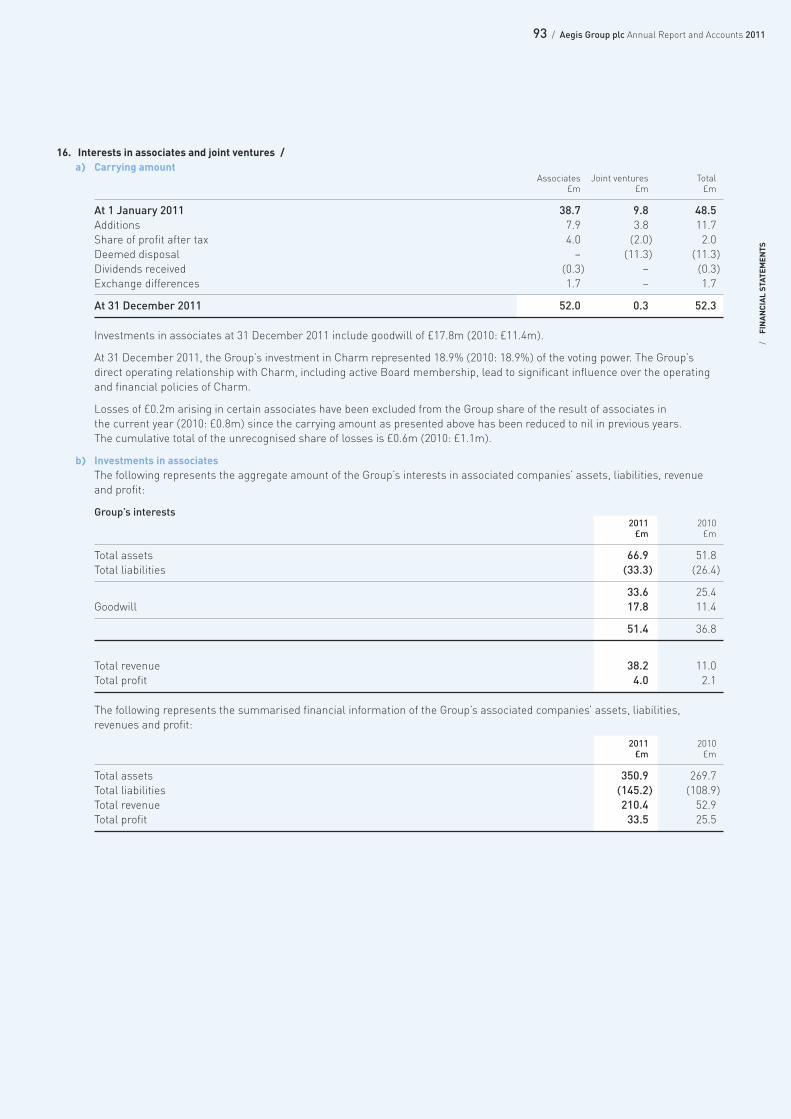
93 / Aegis Group plc Annual Report and Accounts 2011
/FINANCIAL STATEM
ENTS
16. Interests in associates and joint ventures /a) Carrying amount
Associates Joint ventures Total£m £m £m
At 1 January 2011 38.7 9.8 48.5 Additions 7.9 3.8 11.7 Share of profit after tax 4.0 (2.0) 2.0 Deemed disposal – (11.3) (11.3)Dividends received (0.3) – (0.3)Exchange differences 1.7 – 1.7
At 31 December 2011 52.0 0.3 52.3
Investments in associates at 31 December 2011 include goodwill of £17.8m (2010: £11.4m).
At 31 December 2011, the Group’s investment in Charm represented 18.9% (2010: 18.9%) of the voting power. The Group’sdirect operating relationship with Charm, including active Board membership, lead to significant influence over the operatingand financial policies of Charm.
Losses of £0.2m arising in certain associates have been excluded from the Group share of the result of associates in the current year (2010: £0.8m) since the carrying amount as presented above has been reduced to nil in previous years. The cumulative total of the unrecognised share of losses is £0.6m (2010: £1.1m).
b) Investments in associatesThe following represents the aggregate amount of the Group’s interests in associated companies’ assets, liabilities, revenueand profit:
Group’s interests2011 2010£m £m
Total assets 66.9 51.8 Total liabilities (33.3) (26.4)
33.6 25.4 Goodwill 17.8 11.4
51.4 36.8
Total revenue 38.2 11.0 Total profit 4.0 2.1
The following represents the summarised financial information of the Group’s associated companies’ assets, liabilities,revenues and profit:
2011 2010£m £m
Total assets 350.9 269.7 Total liabilities (145.2) (108.9)Total revenue 210.4 52.9 Total profit 33.5 25.5
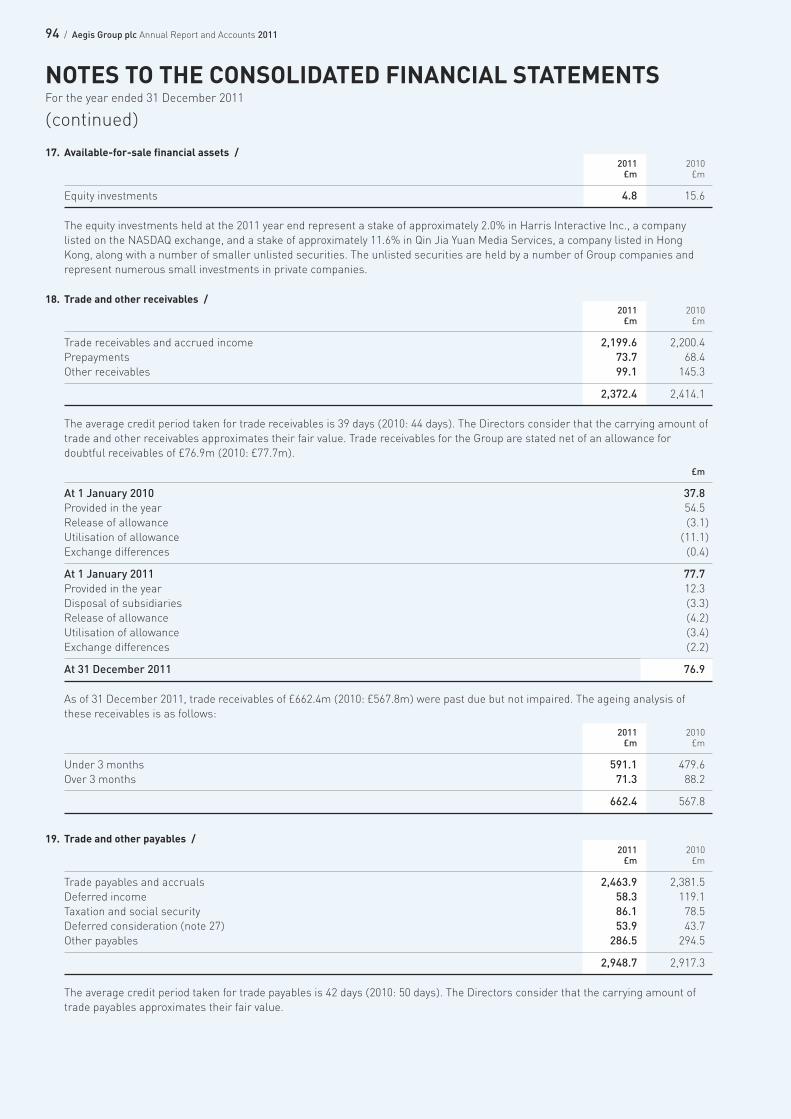
94 / Aegis Group plc Annual Report and Accounts 2011
17. Available-for-sale financial assets /2011 2010£m £m
Equity investments 4.8 15.6
The equity investments held at the 2011 year end represent a stake of approximately 2.0% in Harris Interactive Inc., a companylisted on the NASDAQ exchange, and a stake of approximately 11.6% in Qin Jia Yuan Media Services, a company listed in HongKong, along with a number of smaller unlisted securities. The unlisted securities are held by a number of Group companies andrepresent numerous small investments in private companies.
18. Trade and other receivables /2011 2010£m £m
Trade receivables and accrued income 2,199.6 2,200.4 Prepayments 73.7 68.4 Other receivables 99.1 145.3
2,372.4 2,414.1
The average credit period taken for trade receivables is 39 days (2010: 44 days). The Directors consider that the carrying amount oftrade and other receivables approximates their fair value. Trade receivables for the Group are stated net of an allowance fordoubtful receivables of £76.9m (2010: £77.7m).
£m
At 1 January 2010 37.8 Provided in the year 54.5 Release of allowance (3.1)Utilisation of allowance (11.1)Exchange differences (0.4)
At 1 January 2011 77.7 Provided in the year 12.3 Disposal of subsidiaries (3.3)Release of allowance (4.2)Utilisation of allowance (3.4)Exchange differences (2.2)
At 31 December 2011 76.9
As of 31 December 2011, trade receivables of £662.4m (2010: £567.8m) were past due but not impaired. The ageing analysis ofthese receivables is as follows:
2011 2010£m £m
Under 3 months 591.1 479.6 Over 3 months 71.3 88.2
662.4 567.8
19. Trade and other payables /2011 2010£m £m
Trade payables and accruals 2,463.9 2,381.5Deferred income 58.3 119.1Taxation and social security 86.1 78.5Deferred consideration (note 27) 53.9 43.7Other payables 286.5 294.5
2,948.7 2,917.3
The average credit period taken for trade payables is 42 days (2010: 50 days). The Directors consider that the carrying amount oftrade payables approximates their fair value.
NOTES TO THE CONSOLIDATED FINANCIAL STATEMENTSFor the year ended 31 December 2011
(continued)
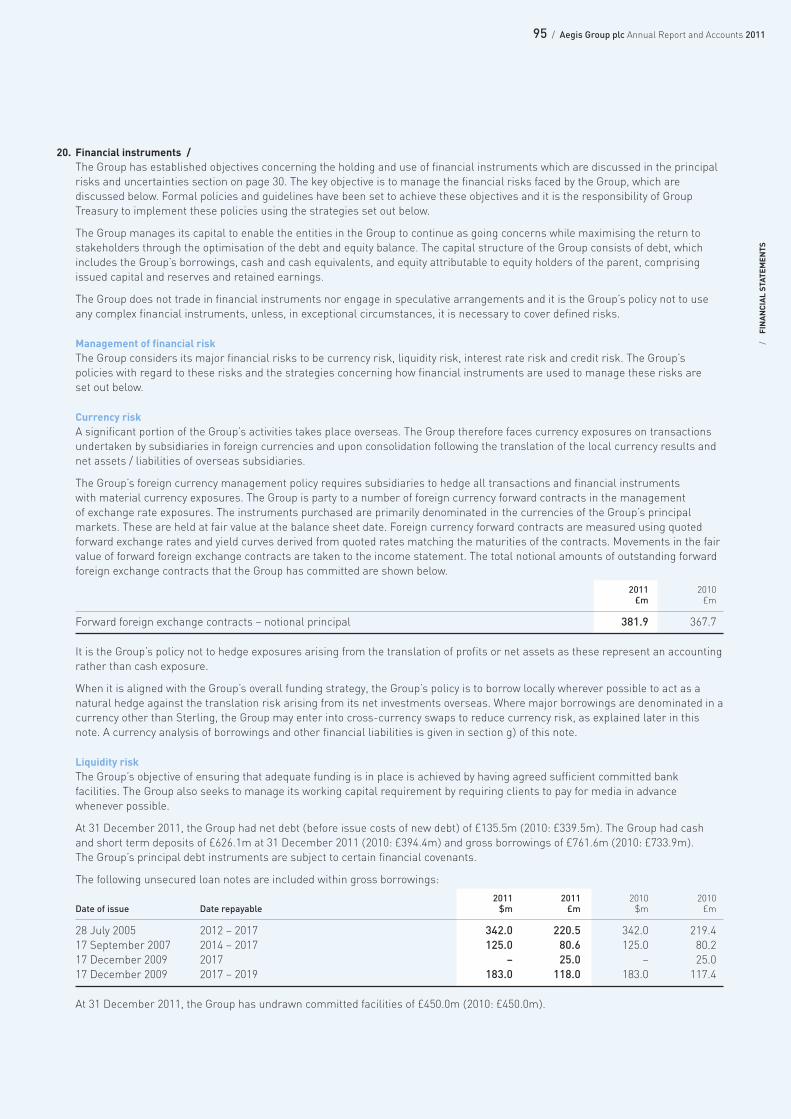
95 / Aegis Group plc Annual Report and Accounts 2011
/FINANCIAL STATEM
ENTS
20. Financial instruments /The Group has established objectives concerning the holding and use of financial instruments which are discussed in the principalrisks and uncertainties section on page 30. The key objective is to manage the financial risks faced by the Group, which arediscussed below. Formal policies and guidelines have been set to achieve these objectives and it is the responsibility of GroupTreasury to implement these policies using the strategies set out below.
The Group manages its capital to enable the entities in the Group to continue as going concerns while maximising the return tostakeholders through the optimisation of the debt and equity balance. The capital structure of the Group consists of debt, whichincludes the Group’s borrowings, cash and cash equivalents, and equity attributable to equity holders of the parent, comprisingissued capital and reserves and retained earnings.
The Group does not trade in financial instruments nor engage in speculative arrangements and it is the Group’s policy not to useany complex financial instruments, unless, in exceptional circumstances, it is necessary to cover defined risks.
Management of financial riskThe Group considers its major financial risks to be currency risk, liquidity risk, interest rate risk and credit risk. The Group’spolicies with regard to these risks and the strategies concerning how financial instruments are used to manage these risks are set out below.
Currency riskA significant portion of the Group’s activities takes place overseas. The Group therefore faces currency exposures on transactionsundertaken by subsidiaries in foreign currencies and upon consolidation following the translation of the local currency results andnet assets / liabilities of overseas subsidiaries.
The Group’s foreign currency management policy requires subsidiaries to hedge all transactions and financial instruments with material currency exposures. The Group is party to a number of foreign currency forward contracts in the management of exchange rate exposures. The instruments purchased are primarily denominated in the currencies of the Group’s principalmarkets. These are held at fair value at the balance sheet date. Foreign currency forward contracts are measured using quotedforward exchange rates and yield curves derived from quoted rates matching the maturities of the contracts. Movements in the fairvalue of forward foreign exchange contracts are taken to the income statement. The total notional amounts of outstanding forwardforeign exchange contracts that the Group has committed are shown below.
2011 2010£m £m
Forward foreign exchange contracts – notional principal 381.9 367.7
It is the Group’s policy not to hedge exposures arising from the translation of profits or net assets as these represent an accountingrather than cash exposure.
When it is aligned with the Group’s overall funding strategy, the Group’s policy is to borrow locally wherever possible to act as anatural hedge against the translation risk arising from its net investments overseas. Where major borrowings are denominated in acurrency other than Sterling, the Group may enter into cross-currency swaps to reduce currency risk, as explained later in thisnote. A currency analysis of borrowings and other financial liabilities is given in section g) of this note.
Liquidity riskThe Group’s objective of ensuring that adequate funding is in place is achieved by having agreed sufficient committed bankfacilities. The Group also seeks to manage its working capital requirement by requiring clients to pay for media in advancewhenever possible.
At 31 December 2011, the Group had net debt (before issue costs of new debt) of £135.5m (2010: £339.5m). The Group had cashand short term deposits of £626.1m at 31 December 2011 (2010: £394.4m) and gross borrowings of £761.6m (2010: £733.9m). The Group’s principal debt instruments are subject to certain financial covenants.
The following unsecured loan notes are included within gross borrowings:
2011 2011 2010 2010Date of issue Date repayable $m £m $m £m
28 July 2005 2012 – 2017 342.0 220.5 342.0 219.417 September 2007 2014 – 2017 125.0 80.6 125.0 80.217 December 2009 2017 – 25.0 – 25.017 December 2009 2017 – 2019 183.0 118.0 183.0 117.4
At 31 December 2011, the Group has undrawn committed facilities of £450.0m (2010: £450.0m).
96 / Aegis Group plc Annual Report and Accounts 2011
NOTES TO THE CONSOLIDATED FINANCIAL STATEMENTSFor the year ended 31 December 2011
(continued)
20. Financial instruments / (continued)Interest rate riskThe Group’s unsecured loan notes, referred to above, are at fixed rates. All other borrowings are at floating rates. Certain portionsof the Group’s unsecured loan notes are subject to interest rate swaps, as explained later in this note.
The Group has in place cash pooling arrangements in a number of territories. These enable the Group to minimise the interest paidon short-term borrowings and overdrafts, whilst allowing net surplus funds to be invested in interest bearing accounts.
Credit RiskThe Group’s credit risk is primarily attributable to its trade receivables and cash balances. The amounts presented in the balancesheet in respect of trade receivables are net of allowances for doubtful receivables, estimated by the Group’s management basedon prior experience and their assessment of the current economic environment. Trade credit risk is managed in each territorythrough the use of credit checks on new clients and individual credit limits, where considered necessary. In some instances clientsare required to pay for media in advance.
The credit risk on liquid funds and derivative financial instruments is limited because the counterparties are banks with highcredit-ratings assigned by international credit-rating agencies. The Group has no significant concentration of credit risk, withexposure spread over a large number of counterparties and customers. The maximum exposure to credit risk is represented by the carrying amount of each financial asset in the balance sheet.
Current receivables and payables and currency disclosuresDue to the nature of the operations of the business, Group companies are able to match current receivables and payables incurrencies other than their functional currency and therefore do not have material, unhedged monetary assets and liabilities.Current receivables and payables are therefore excluded from currency analyses provided in this note.
Private Placement Debt – July 2005On 28 July 2005, the Group issued US$342m of unsecured loan notes, repayable between 2012 and 2017. The interest ratesapplicable on these loan notes range from 5.25% to 5.65%. These loan notes are guaranteed by the Company and certain of itssubsidiaries. On 9 November 2005 cross currency swaps were entered into for US$142m of the loan notes due in 2012 and US$50mof the loan notes due in 2015 to convert this US$ fixed rate borrowing into Euro fixed rate borrowing. The remaining US$150m ofloan notes were used to provide a natural hedge against US dollar-denominated assets.
Private Placement Debt – September 2007On 17 September 2007, the Group issued US$125m of unsecured loan notes repayable between 2014 and 2017. The interest rates applicable on these loan notes range from 6.06% to 6.29%. These loan notes are guaranteed by the Company and certain of its subsidiaries.
Term loan – July 2009In July 2009 the Group secured a loan of £45m available until July 2011 at a variable interest rate. In July 2011, the facility wasincreased to £60m with a fixed interest rate. The loan is repayable in 2014.
Private Placement Debt – December 2009On 17 December 2009, the Group issued US$183m and £25m of unsecured loan notes repayable between 2017 and 2019. Theinterest rates applicable on these loan notes range from 6.07% to 6.50%. These loan notes are guaranteed by the Company andcertain of its subsidiaries. On 17 November 2009, an interest rate swap was entered into for US$50m of the loan notes due in 2019to convert the US$ fixed rate debt to US$ floating rate debt. On 17 November 2009, cross currency interest rate swaps were enteredinto for US$18m of the loan notes due in 2017 and US$115m of the loan notes due in 2019 to convert the US$ fixed rate borrowingto GBP floating rate borrowing. From 19 January 2010, US$50m of the loan note was designated as a net investment hedge againstUS dollar-denominated investments. To the extent that this hedging relationship was effective, exchange differences arising on there-translation of the US$50m of debt was taken to reserves.
Multi-currency credit facility – July 2010In July 2010, the Group re-financed the five year £450m multi-currency credit facility with a group of international banks, which was originally entered into in June 2006. The facility is committed and revolving and allows drawings under a variety of currencies.Pricing is based on the inter-bank rate of the relevant currency for the corresponding period of the drawing with the interestmargin determined by reference to a grid based on the consolidated net borrowings to consolidated net EBITDA ratio. The facility is unsecured but guaranteed by the Company and certain of its subsidiaries until July 2015.
97 / Aegis Group plc Annual Report and Accounts 2011
/FINANCIAL STATEM
ENTS
20. Financial instruments / (continued)Convertible bondThe Group issued £190.6m convertible bonds in April 2010, due for repayment in April 2015. The convertible bonds bear interest at2.5% per annum and are convertible at the option of the holder into Aegis ordinary shares at an exchange price of £1.6129, adjustedfrom the original exchange price of £1.6444 following the special dividend and assigned share consolidation in the year (see note 11and 23). The total number of ordinary shares that would be issued if all bonds converted would be 118.2 million (adjusted from115.9 million as above).
As a compound financial instrument, the net proceeds of the bond were split into a liability component and an equity component onthe issue date, and at 31 December 2011 the carrying value of the liability, net of deferred issue costs, is £172.5m.
Cross currency swapsThe fair value of the cross currency swaps at 31 December 2011 is £(11.4)m (2010: £(13.4)m). The fair value is based on adiscounted cash flow model and market interest yield curves applicable and represents movements in the Euro/US$ foreignexchange spot rate and in Euro and US$ interest rate yields. The cross currency swaps are synthetically split, for accountingpurposes, to reflect the Group’s presentational currency of Sterling. The US$/Sterling legs of the swaps are designated andeffective as cash flow hedges against the Group’s US$ loan notes. Movements in the fair value of the US$/Sterling legs of theswaps are taken to reserves and released to the income statement when the underlying portion of US$ loan notes interest isrecognised in the income statement every six months. The Euro/Sterling legs of the swaps are designated as net investmenthedges in respect of certain of the Group’s Euro-denominated investments. To the extent that this hedging relationship is effective,exchange differences arising on the re-translation of the swapped Euro debt are taken to reserves.
Interest rate swapsThe fair value of the interest rate swaps at 31 December 2011 is £3.9m (2010: £0.5m). The fair value is based on a discounted cash flow model and market interest yield curves applicable and represents unrecognised gains which the Group expects to realiseas a result of lower or higher variable interest payments under the swap compared with the fixed interest rate applicable on theunderlying loan notes. The interest rate swaps are designated and effective as fair value hedges against changes in the fair value of the debt caused by changes in interest risk. Movements in the fair value of the interest rate swaps are taken to the incomestatement where they offset against very similar but opposite movements in the fair value of the debt caused by movements ininterest rates.
Cross currency interest rate swapsThe fair value of the cross currency interest rate swaps at 31 December 2011 is £16.2m (2010: £8.0m). The fair value is based on adiscounted cash flow model and market yield curves applicable and represents movements in the Sterling/US$ foreign exchangespot rate and in Sterling and US$ interest rate yields. Movements in the fair value of the cross currency interest rate swapsexcluding the credit spread are taken to the income statement where they offset against opposite movements in the fair value of theUS$ loan notes caused by changes in interest rates and foreign exchange spot rates. Movements in the fair value of the crosscurrency interest rate swaps relating to the credit spread are taken to reserves and released to the income statement when theunderlying portion of US$ loan notes interest is recognised in the income statement.
CovenantsCovenant requirements under the current Group financing arrangements and the performance against these requirements for thecurrent year are given in the Financial Review on page 29.
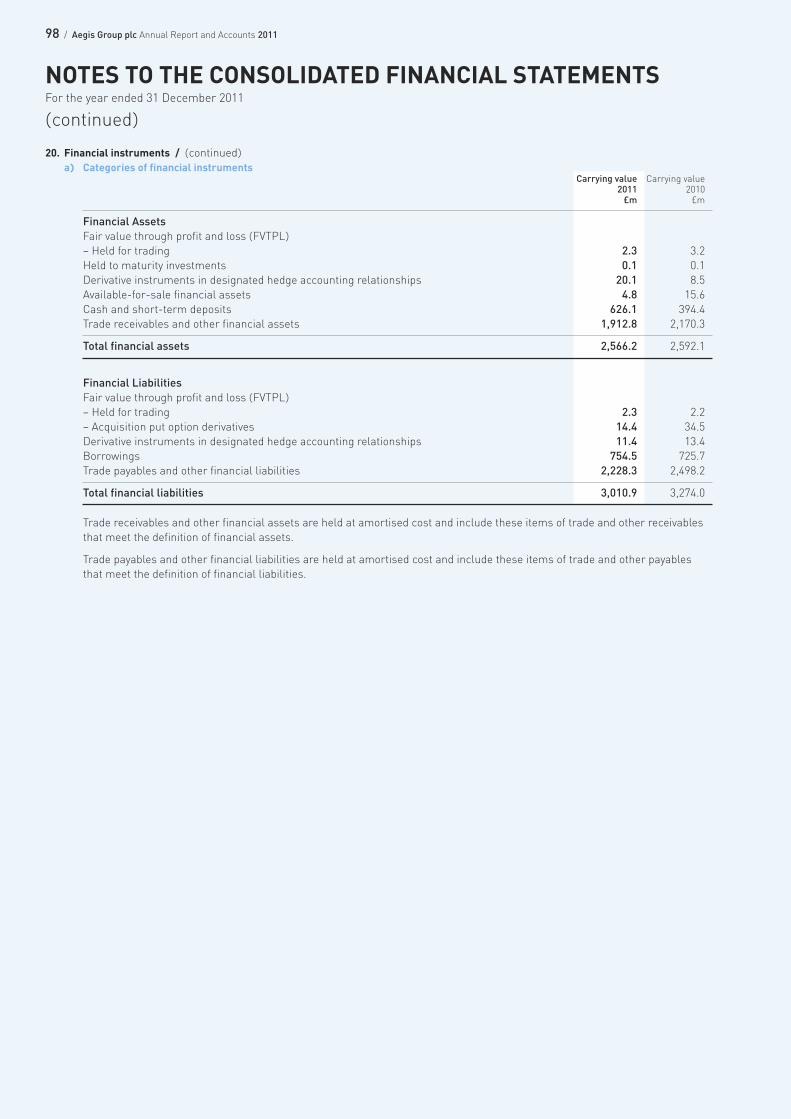
98 / Aegis Group plc Annual Report and Accounts 2011
20. Financial instruments / (continued)a) Categories of financial instruments
Carrying value Carrying value2011 2010£m £m
Financial AssetsFair value through profit and loss (FVTPL)– Held for trading 2.3 3.2 Held to maturity investments 0.1 0.1 Derivative instruments in designated hedge accounting relationships 20.1 8.5 Available-for-sale financial assets 4.8 15.6 Cash and short-term deposits 626.1 394.4 Trade receivables and other financial assets 1,912.8 2,170.3
Total financial assets 2,566.2 2,592.1
Financial LiabilitiesFair value through profit and loss (FVTPL)– Held for trading 2.3 2.2 – Acquisition put option derivatives 14.4 34.5 Derivative instruments in designated hedge accounting relationships 11.4 13.4 Borrowings 754.5 725.7 Trade payables and other financial liabilities 2,228.3 2,498.2
Total financial liabilities 3,010.9 3,274.0
Trade receivables and other financial assets are held at amortised cost and include these items of trade and other receivablesthat meet the definition of financial assets.
Trade payables and other financial liabilities are held at amortised cost and include these items of trade and other payablesthat meet the definition of financial liabilities.
NOTES TO THE CONSOLIDATED FINANCIAL STATEMENTSFor the year ended 31 December 2011
(continued)
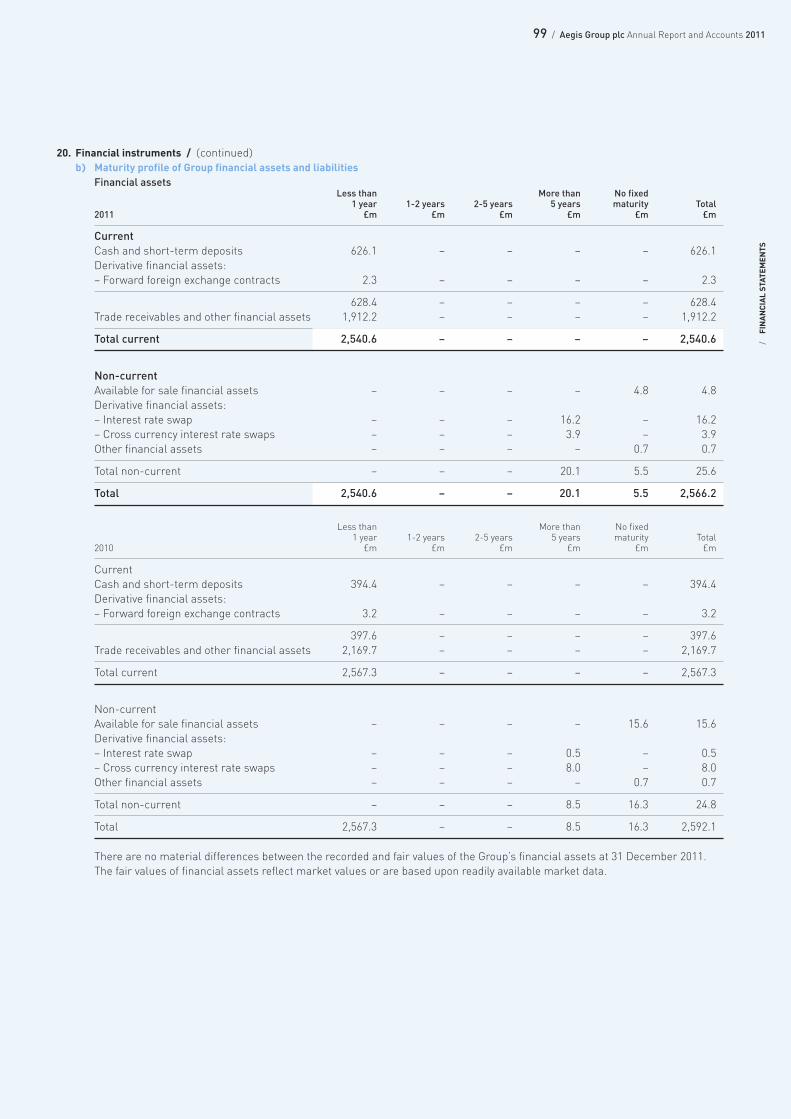
99 / Aegis Group plc Annual Report and Accounts 2011
/FINANCIAL STATEM
ENTS
20. Financial instruments / (continued)b) Maturity profile of Group financial assets and liabilities
Financial assetsLess than More than No fixed
1 year 1-2 years 2-5 years 5 years maturity Total2011 £m £m £m £m £m £m
CurrentCash and short-term deposits 626.1 – – – – 626.1Derivative financial assets:– Forward foreign exchange contracts 2.3 – – – – 2.3
628.4 – – – – 628.4Trade receivables and other financial assets 1,912.2 – – – – 1,912.2
Total current 2,540.6 – – – – 2,540.6
Non-currentAvailable for sale financial assets – – – – 4.8 4.8Derivative financial assets:– Interest rate swap – – – 16.2 – 16.2– Cross currency interest rate swaps – – – 3.9 – 3.9Other financial assets – – – – 0.7 0.7
Total non-current – – – 20.1 5.5 25.6
Total 2,540.6 – – 20.1 5.5 2,566.2
Less than More than No fixed 1 year 1-2 years 2-5 years 5 years maturity Total
2010 £m £m £m £m £m £m
CurrentCash and short-term deposits 394.4 – – – – 394.4Derivative financial assets:– Forward foreign exchange contracts 3.2 – – – – 3.2
397.6 – – – – 397.6Trade receivables and other financial assets 2,169.7 – – – – 2,169.7
Total current 2,567.3 – – – – 2,567.3
Non-currentAvailable for sale financial assets – – – – 15.6 15.6Derivative financial assets:– Interest rate swap – – – 0.5 – 0.5– Cross currency interest rate swaps – – – 8.0 – 8.0Other financial assets – – – – 0.7 0.7
Total non-current – – – 8.5 16.3 24.8
Total 2,567.3 – – 8.5 16.3 2,592.1
There are no material differences between the recorded and fair values of the Group’s financial assets at 31 December 2011. The fair values of financial assets reflect market values or are based upon readily available market data.
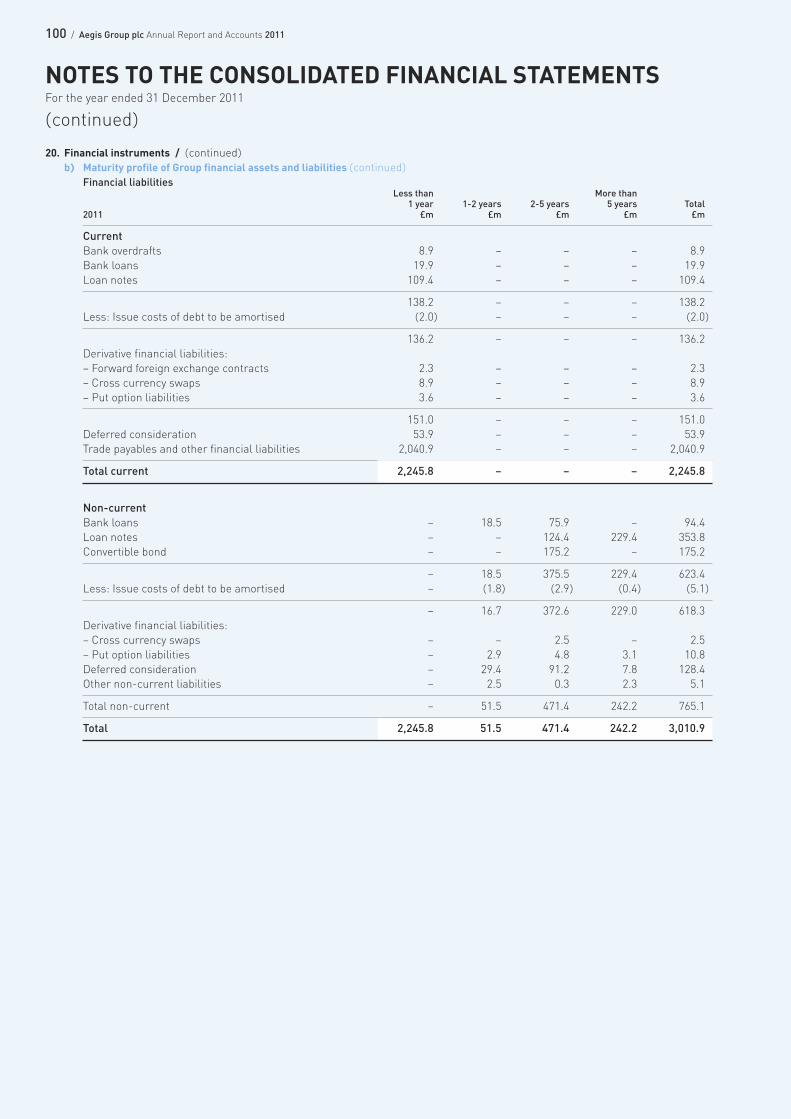
100 / Aegis Group plc Annual Report and Accounts 2011
20. Financial instruments / (continued)b) Maturity profile of Group financial assets and liabilities (continued)
Financial liabilitiesLess than More than
1 year 1-2 years 2-5 years 5 years Total2011 £m £m £m £m £m
CurrentBank overdrafts 8.9 – – – 8.9Bank loans 19.9 – – – 19.9Loan notes 109.4 – – – 109.4
138.2 – – – 138.2Less: Issue costs of debt to be amortised (2.0) – – – (2.0)
136.2 – – – 136.2Derivative financial liabilities:– Forward foreign exchange contracts 2.3 – – – 2.3– Cross currency swaps 8.9 – – – 8.9– Put option liabilities 3.6 – – – 3.6
151.0 – – – 151.0Deferred consideration 53.9 – – – 53.9Trade payables and other financial liabilities 2,040.9 – – – 2,040.9
Total current 2,245.8 – – – 2,245.8
Non-currentBank loans – 18.5 75.9 – 94.4Loan notes – – 124.4 229.4 353.8Convertible bond – – 175.2 – 175.2
– 18.5 375.5 229.4 623.4Less: Issue costs of debt to be amortised – (1.8) (2.9) (0.4) (5.1)
– 16.7 372.6 229.0 618.3Derivative financial liabilities:– Cross currency swaps – – 2.5 – 2.5– Put option liabilities – 2.9 4.8 3.1 10.8Deferred consideration – 29.4 91.2 7.8 128.4Other non-current liabilities – 2.5 0.3 2.3 5.1
Total non-current – 51.5 471.4 242.2 765.1
Total 2,245.8 51.5 471.4 242.2 3,010.9
NOTES TO THE CONSOLIDATED FINANCIAL STATEMENTSFor the year ended 31 December 2011
(continued)
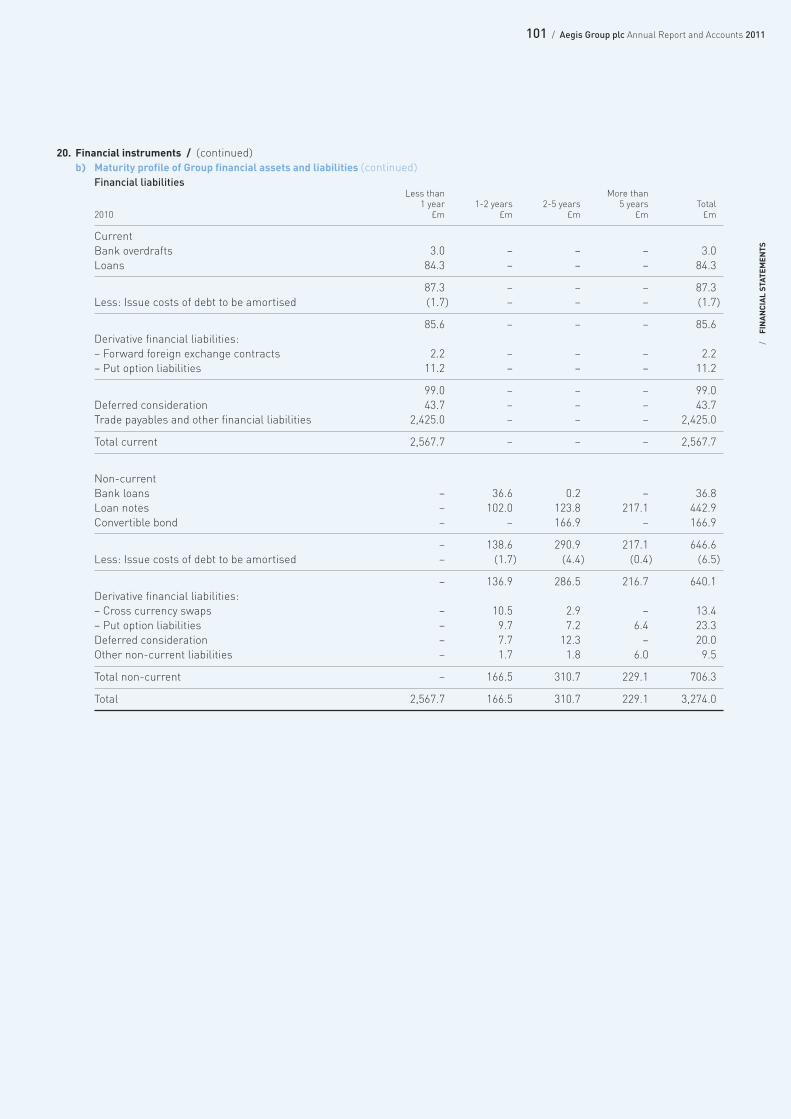
101 / Aegis Group plc Annual Report and Accounts 2011
/FINANCIAL STATEM
ENTS
20. Financial instruments / (continued)b) Maturity profile of Group financial assets and liabilities (continued)
Financial liabilitiesLess than More than
1 year 1-2 years 2-5 years 5 years Total2010 £m £m £m £m £m
CurrentBank overdrafts 3.0 – – – 3.0Loans 84.3 – – – 84.3
87.3 – – – 87.3Less: Issue costs of debt to be amortised (1.7) – – – (1.7)
85.6 – – – 85.6Derivative financial liabilities:– Forward foreign exchange contracts 2.2 – – – 2.2– Put option liabilities 11.2 – – – 11.2
99.0 – – – 99.0Deferred consideration 43.7 – – – 43.7Trade payables and other financial liabilities 2,425.0 – – – 2,425.0
Total current 2,567.7 – – – 2,567.7
Non-currentBank loans – 36.6 0.2 – 36.8Loan notes – 102.0 123.8 217.1 442.9Convertible bond – – 166.9 – 166.9
– 138.6 290.9 217.1 646.6Less: Issue costs of debt to be amortised – (1.7) (4.4) (0.4) (6.5)
– 136.9 286.5 216.7 640.1Derivative financial liabilities:– Cross currency swaps – 10.5 2.9 – 13.4– Put option liabilities – 9.7 7.2 6.4 23.3Deferred consideration – 7.7 12.3 – 20.0Other non-current liabilities – 1.7 1.8 6.0 9.5
Total non-current – 166.5 310.7 229.1 706.3
Total 2,567.7 166.5 310.7 229.1 3,274.0

102 / Aegis Group plc Annual Report and Accounts 2011
20. Financial instruments / (continued)c) Valuation of financial assets and liabilities
Except as detailed in the following table, the carrying amounts of financial assets and financial liabilities recorded at amortisedcost in the financial statements are approximately equal to their fair values:
2011 2011 2010 2010Fair value Carrying value Fair value Carrying value
£m £m £m £m
2005 loan notes 220.6 225.6 230.2 224.4 2007 loan notes 80.6 82.0 87.2 81.6 2009 loan notes 143.0 143.4 155.7 142.8
Total 444.2 451.0 473.1 448.8
Valuation techniques and assumptions applied for the purposes of measuring fair valueThe fair values of financial assets and financial liabilities are determined as follows:
– The fair values of financial assets and financial liabilities with standard terms and conditions and traded on active liquidmarkets are determined with reference to quoted market prices (includes held-to-maturity investments and quotedavailable-for-sale investments)
– The fair values of derivative instruments, other than put options over acquisition of minorities, are calculated using quotedprices and yield curves derived from these quoted prices
– The fair values of put option liabilities are calculated as the best estimate of the gross cash expected to be paid discountedto present value.
The following table provides an analysis of financial instruments that are measured subsequent to initial recognition at fairvalue, grouped into levels 1 to 3 based on the degree to which the fair value is observable:
– Level 1 fair value measurements are those derived from quoted prices (unadjusted) in active markets for identical assets or liabilities
– Level 2 fair value measurements are those derived from inputs other than quoted prices included within level 1 that areobservable for the asset or liability either directly (i.e. as prices) or indirectly (i.e. derived from prices)
– Level 3 fair value measurements are those derived from valuation techniques that include inputs for the asset or liabilitythat are not based on observable market data (unobservable inputs).
NOTES TO THE CONSOLIDATED FINANCIAL STATEMENTSFor the year ended 31 December 2011
(continued)
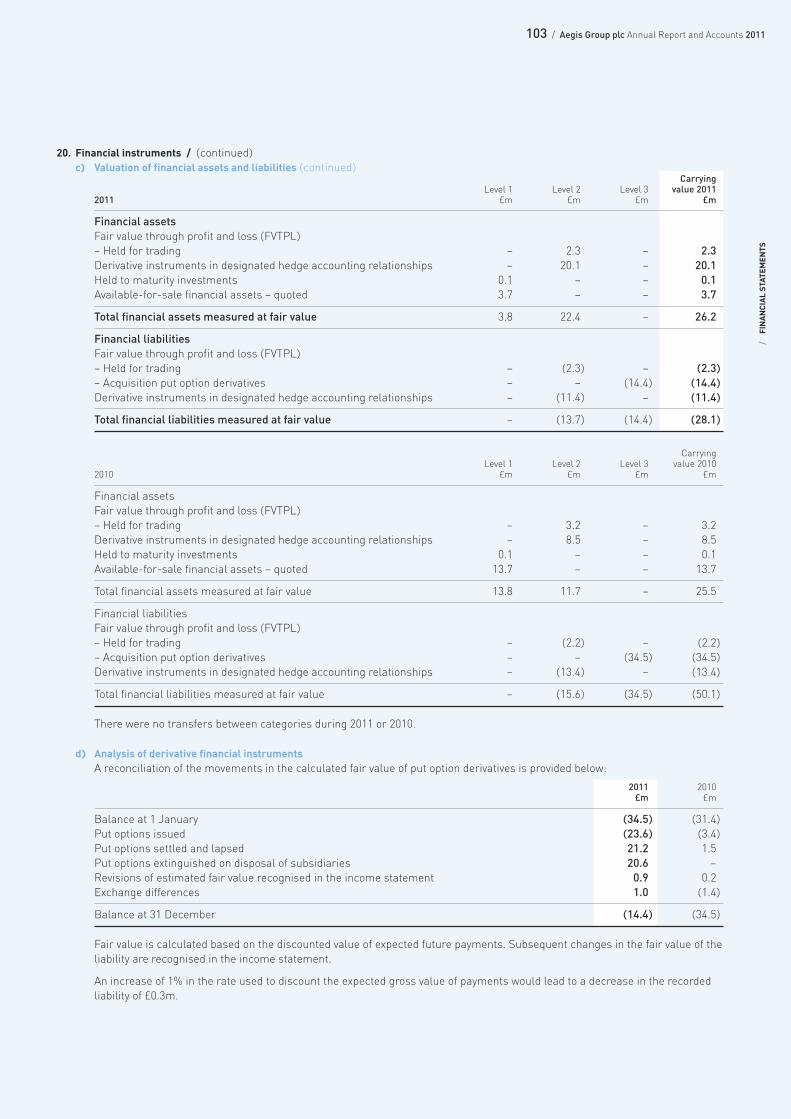
103 / Aegis Group plc Annual Report and Accounts 2011
/FINANCIAL STATEM
ENTS
20. Financial instruments / (continued)c) Valuation of financial assets and liabilities (continued)
CarryingLevel 1 Level 2 Level 3 value 2011
2011 £m £m £m £m
Financial assetsFair value through profit and loss (FVTPL)– Held for trading – 2.3 – 2.3Derivative instruments in designated hedge accounting relationships – 20.1 – 20.1 Held to maturity investments 0.1 – – 0.1 Available-for-sale financial assets – quoted 3.7 – – 3.7
Total financial assets measured at fair value 3.8 22.4 – 26.2
Financial liabilitiesFair value through profit and loss (FVTPL)– Held for trading – (2.3) – (2.3)– Acquisition put option derivatives – – (14.4) (14.4)Derivative instruments in designated hedge accounting relationships – (11.4) – (11.4)
Total financial liabilities measured at fair value – (13.7) (14.4) (28.1)
Carrying Level 1 Level 2 Level 3 value 2010
2010 £m £m £m £m
Financial assetsFair value through profit and loss (FVTPL)– Held for trading – 3.2 – 3.2 Derivative instruments in designated hedge accounting relationships – 8.5 – 8.5 Held to maturity investments 0.1 – – 0.1 Available-for-sale financial assets – quoted 13.7 – – 13.7
Total financial assets measured at fair value 13.8 11.7 – 25.5
Financial liabilitiesFair value through profit and loss (FVTPL)– Held for trading – (2.2) – (2.2)– Acquisition put option derivatives – – (34.5) (34.5)Derivative instruments in designated hedge accounting relationships – (13.4) – (13.4)
Total financial liabilities measured at fair value – (15.6) (34.5) (50.1)
There were no transfers between categories during 2011 or 2010.
d) Analysis of derivative financial instrumentsA reconciliation of the movements in the calculated fair value of put option derivatives is provided below:
2011 2010£m £m
Balance at 1 January (34.5) (31.4)Put options issued (23.6) (3.4)Put options settled and lapsed 21.2 1.5 Put options extinguished on disposal of subsidiaries 20.6 –Revisions of estimated fair value recognised in the income statement 0.9 0.2 Exchange differences 1.0 (1.4)
Balance at 31 December (14.4) (34.5)
Fair value is calculated based on the discounted value of expected future payments. Subsequent changes in the fair value of theliability are recognised in the income statement.
An increase of 1% in the rate used to discount the expected gross value of payments would lead to a decrease in the recordedliability of £0.3m.
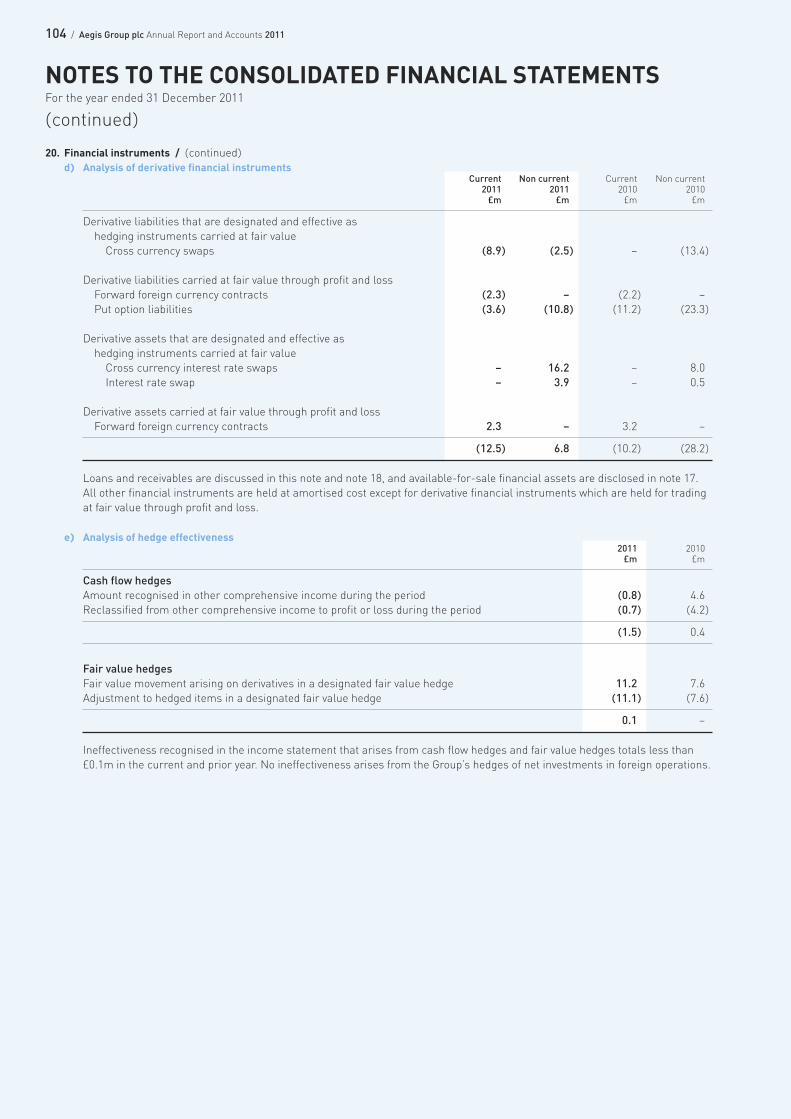
104 / Aegis Group plc Annual Report and Accounts 2011
20. Financial instruments / (continued)d) Analysis of derivative financial instruments
Current Non current Current Non current2011 2011 2010 2010£m £m £m £m
Derivative liabilities that are designated and effective as hedging instruments carried at fair valueCross currency swaps (8.9) (2.5) – (13.4)
Derivative liabilities carried at fair value through profit and lossForward foreign currency contracts (2.3) – (2.2) –Put option liabilities (3.6) (10.8) (11.2) (23.3)
Derivative assets that are designated and effective as hedging instruments carried at fair valueCross currency interest rate swaps – 16.2 – 8.0 Interest rate swap – 3.9 – 0.5
Derivative assets carried at fair value through profit and lossForward foreign currency contracts 2.3 – 3.2 –
(12.5) 6.8 (10.2) (28.2)
Loans and receivables are discussed in this note and note 18, and available-for-sale financial assets are disclosed in note 17.All other financial instruments are held at amortised cost except for derivative financial instruments which are held for tradingat fair value through profit and loss.
e) Analysis of hedge effectiveness2011 2010£m £m
Cash flow hedgesAmount recognised in other comprehensive income during the period (0.8) 4.6 Reclassified from other comprehensive income to profit or loss during the period (0.7) (4.2)
(1.5) 0.4
Fair value hedgesFair value movement arising on derivatives in a designated fair value hedge 11.2 7.6 Adjustment to hedged items in a designated fair value hedge (11.1) (7.6)
0.1 –
Ineffectiveness recognised in the income statement that arises from cash flow hedges and fair value hedges totals less than£0.1m in the current and prior year. No ineffectiveness arises from the Group’s hedges of net investments in foreign operations.
NOTES TO THE CONSOLIDATED FINANCIAL STATEMENTSFor the year ended 31 December 2011
(continued)
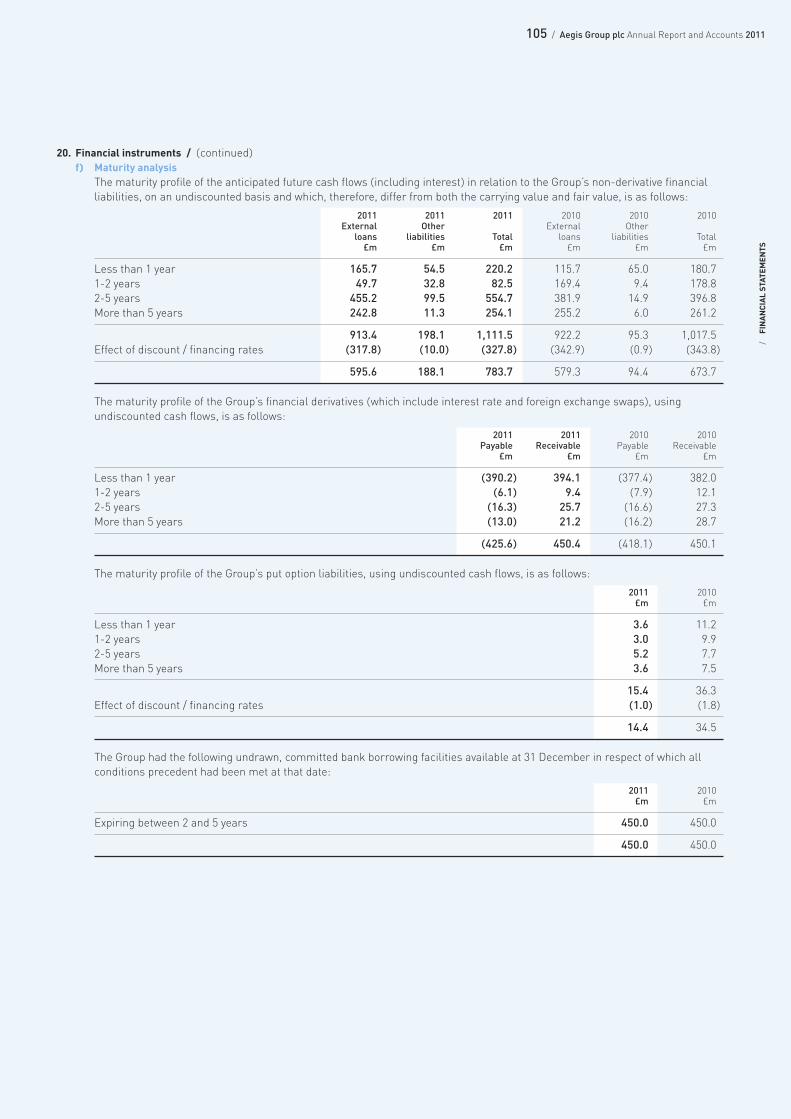
105 / Aegis Group plc Annual Report and Accounts 2011
/FINANCIAL STATEM
ENTS
20. Financial instruments / (continued)f) Maturity analysis
The maturity profile of the anticipated future cash flows (including interest) in relation to the Group’s non-derivative financialliabilities, on an undiscounted basis and which, therefore, differ from both the carrying value and fair value, is as follows:
2011 2011 2011 2010 2010 2010External Other External Other
loans liabilities Total loans liabilities Total£m £m £m £m £m £m
Less than 1 year 165.7 54.5 220.2 115.7 65.0 180.7 1-2 years 49.7 32.8 82.5 169.4 9.4 178.8 2-5 years 455.2 99.5 554.7 381.9 14.9 396.8 More than 5 years 242.8 11.3 254.1 255.2 6.0 261.2
913.4 198.1 1,111.5 922.2 95.3 1,017.5 Effect of discount / financing rates (317.8) (10.0) (327.8) (342.9) (0.9) (343.8)
595.6 188.1 783.7 579.3 94.4 673.7
The maturity profile of the Group’s financial derivatives (which include interest rate and foreign exchange swaps), usingundiscounted cash flows, is as follows:
2011 2011 2010 2010Payable Receivable Payable Receivable
£m £m £m £m
Less than 1 year (390.2) 394.1 (377.4) 382.0 1-2 years (6.1) 9.4 (7.9) 12.1 2-5 years (16.3) 25.7 (16.6) 27.3 More than 5 years (13.0) 21.2 (16.2) 28.7
(425.6) 450.4 (418.1) 450.1
The maturity profile of the Group’s put option liabilities, using undiscounted cash flows, is as follows:
2011 2010£m £m
Less than 1 year 3.6 11.2 1-2 years 3.0 9.9 2-5 years 5.2 7.7 More than 5 years 3.6 7.5
15.4 36.3 Effect of discount / financing rates (1.0) (1.8)
14.4 34.5
The Group had the following undrawn, committed bank borrowing facilities available at 31 December in respect of which allconditions precedent had been met at that date:
2011 2010£m £m
Expiring between 2 and 5 years 450.0 450.0
450.0 450.0
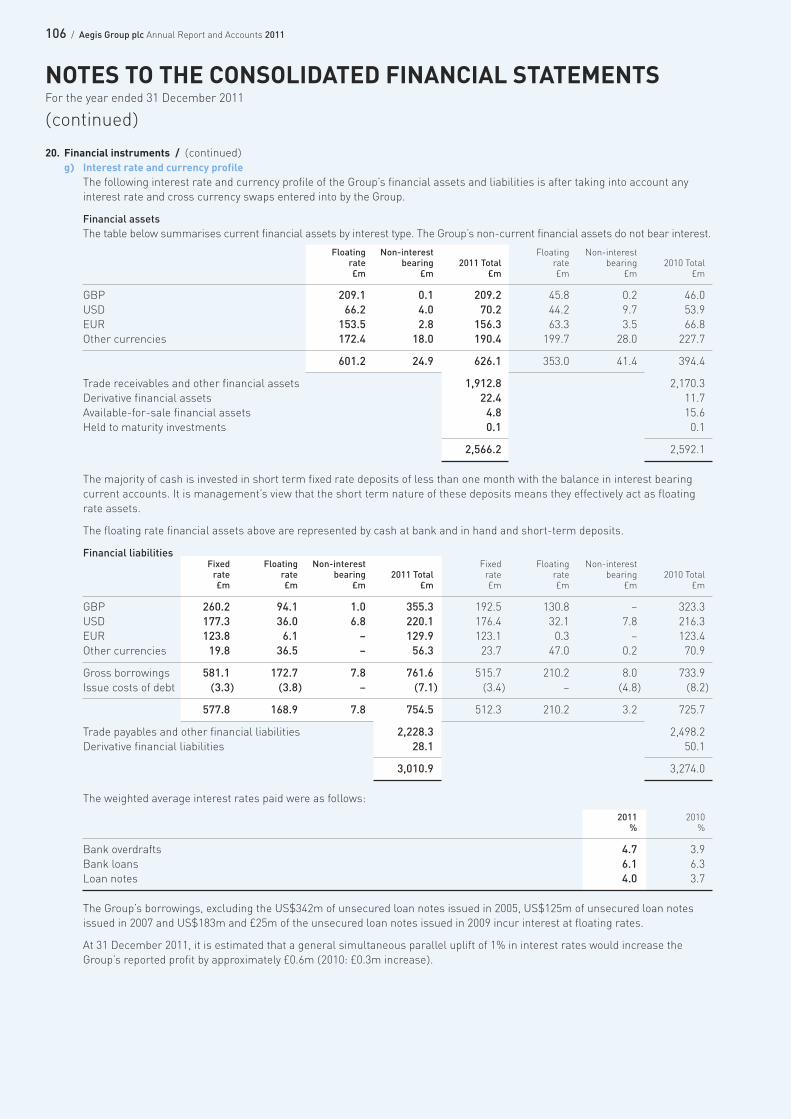
106 / Aegis Group plc Annual Report and Accounts 2011
20. Financial instruments / (continued)g) Interest rate and currency profile
The following interest rate and currency profile of the Group’s financial assets and liabilities is after taking into account anyinterest rate and cross currency swaps entered into by the Group.
Financial assetsThe table below summarises current financial assets by interest type. The Group’s non-current financial assets do not bear interest.
Floating Non-interest Floating Non-interest rate bearing 2011 Total rate bearing 2010 Total£m £m £m £m £m £m
GBP 209.1 0.1 209.2 45.8 0.2 46.0 USD 66.2 4.0 70.2 44.2 9.7 53.9 EUR 153.5 2.8 156.3 63.3 3.5 66.8 Other currencies 172.4 18.0 190.4 199.7 28.0 227.7
601.2 24.9 626.1 353.0 41.4 394.4
Trade receivables and other financial assets 1,912.8 2,170.3 Derivative financial assets 22.4 11.7 Available-for-sale financial assets 4.8 15.6 Held to maturity investments 0.1 0.1
2,566.2 2,592.1
The majority of cash is invested in short term fixed rate deposits of less than one month with the balance in interest bearingcurrent accounts. It is management’s view that the short term nature of these deposits means they effectively act as floatingrate assets.
The floating rate financial assets above are represented by cash at bank and in hand and short-term deposits.
Financial liabilitiesFixed Floating Non-interest Fixed Floating Non-interest rate rate bearing 2011 Total rate rate bearing 2010 Total£m £m £m £m £m £m £m £m
GBP 260.2 94.1 1.0 355.3 192.5 130.8 – 323.3 USD 177.3 36.0 6.8 220.1 176.4 32.1 7.8 216.3 EUR 123.8 6.1 – 129.9 123.1 0.3 – 123.4 Other currencies 19.8 36.5 – 56.3 23.7 47.0 0.2 70.9
Gross borrowings 581.1 172.7 7.8 761.6 515.7 210.2 8.0 733.9 Issue costs of debt (3.3) (3.8) – (7.1) (3.4) – (4.8) (8.2)
577.8 168.9 7.8 754.5 512.3 210.2 3.2 725.7
Trade payables and other financial liabilities 2,228.3 2,498.2 Derivative financial liabilities 28.1 50.1
3,010.9 3,274.0
The weighted average interest rates paid were as follows:
2011 2010% %
Bank overdrafts 4.7 3.9Bank loans 6.1 6.3Loan notes 4.0 3.7
The Group’s borrowings, excluding the US$342m of unsecured loan notes issued in 2005, US$125m of unsecured loan notesissued in 2007 and US$183m and £25m of the unsecured loan notes issued in 2009 incur interest at floating rates.
At 31 December 2011, it is estimated that a general simultaneous parallel uplift of 1% in interest rates would increase theGroup’s reported profit by approximately £0.6m (2010: £0.3m increase).
NOTES TO THE CONSOLIDATED FINANCIAL STATEMENTSFor the year ended 31 December 2011
(continued)
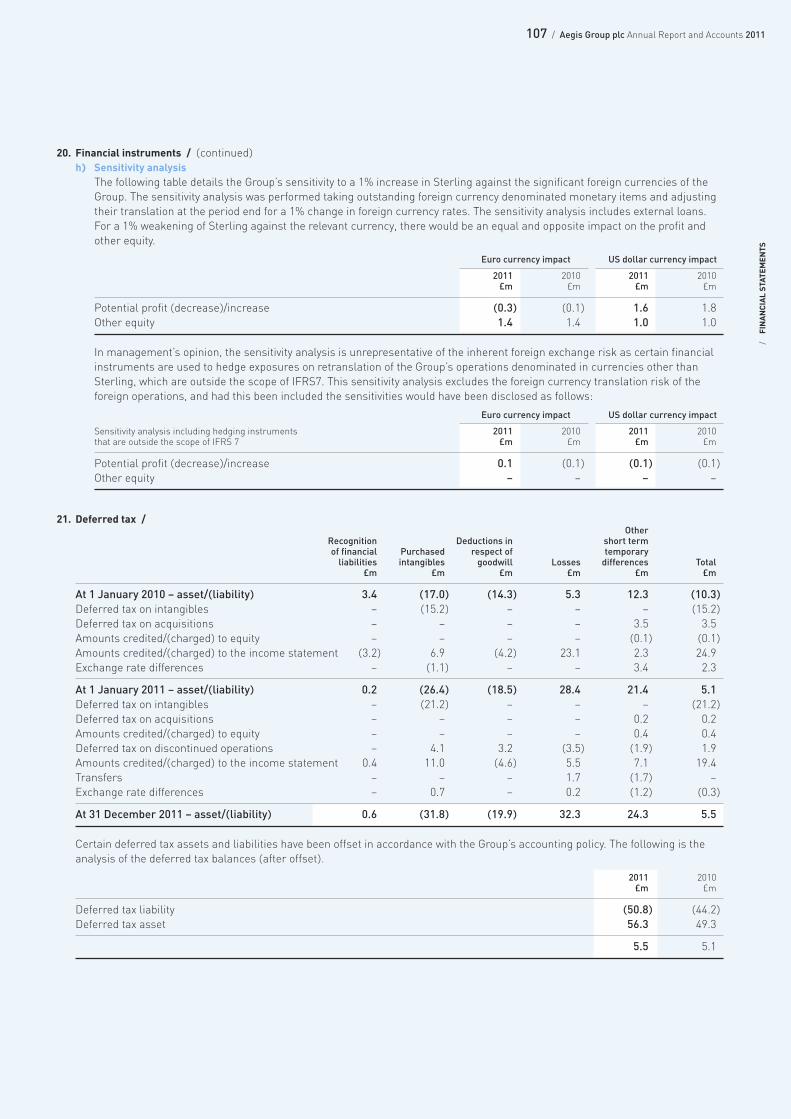
107 / Aegis Group plc Annual Report and Accounts 2011
/FINANCIAL STATEM
ENTS
20. Financial instruments / (continued)h) Sensitivity analysis
The following table details the Group’s sensitivity to a 1% increase in Sterling against the significant foreign currencies of theGroup. The sensitivity analysis was performed taking outstanding foreign currency denominated monetary items and adjustingtheir translation at the period end for a 1% change in foreign currency rates. The sensitivity analysis includes external loans.For a 1% weakening of Sterling against the relevant currency, there would be an equal and opposite impact on the profit andother equity.
Euro currency impact US dollar currency impact
2011 2010 2011 2010£m £m £m £m
Potential profit (decrease)/increase (0.3) (0.1) 1.6 1.8 Other equity 1.4 1.4 1.0 1.0
In management’s opinion, the sensitivity analysis is unrepresentative of the inherent foreign exchange risk as certain financialinstruments are used to hedge exposures on retranslation of the Group’s operations denominated in currencies other thanSterling, which are outside the scope of IFRS7. This sensitivity analysis excludes the foreign currency translation risk of theforeign operations, and had this been included the sensitivities would have been disclosed as follows:
Euro currency impact US dollar currency impact
Sensitivity analysis including hedging instruments 2011 2010 2011 2010that are outside the scope of IFRS 7 £m £m £m £m
Potential profit (decrease)/increase 0.1 (0.1) (0.1) (0.1)Other equity – – – –
21. Deferred tax /Other
Recognition Deductions in short term of financial Purchased respect of temporary liabilities intangibles goodwill Losses differences Total
£m £m £m £m £m £m
At 1 January 2010 – asset/(liability) 3.4 (17.0) (14.3) 5.3 12.3 (10.3)Deferred tax on intangibles – (15.2) – – – (15.2)Deferred tax on acquisitions – – – – 3.5 3.5 Amounts credited/(charged) to equity – – – – (0.1) (0.1)Amounts credited/(charged) to the income statement (3.2) 6.9 (4.2) 23.1 2.3 24.9 Exchange rate differences – (1.1) – – 3.4 2.3
At 1 January 2011 – asset/(liability) 0.2 (26.4) (18.5) 28.4 21.4 5.1 Deferred tax on intangibles – (21.2) – – – (21.2)Deferred tax on acquisitions – – – – 0.2 0.2 Amounts credited/(charged) to equity – – – – 0.4 0.4 Deferred tax on discontinued operations – 4.1 3.2 (3.5) (1.9) 1.9 Amounts credited/(charged) to the income statement 0.4 11.0 (4.6) 5.5 7.1 19.4 Transfers – – – 1.7 (1.7) –Exchange rate differences – 0.7 – 0.2 (1.2) (0.3)
At 31 December 2011 – asset/(liability) 0.6 (31.8) (19.9) 32.3 24.3 5.5
Certain deferred tax assets and liabilities have been offset in accordance with the Group’s accounting policy. The following is theanalysis of the deferred tax balances (after offset).
2011 2010£m £m
Deferred tax liability (50.8) (44.2)Deferred tax asset 56.3 49.3
5.5 5.1

108 / Aegis Group plc Annual Report and Accounts 2011
21. Deferred tax / (continued)The Group has the following temporary differences in respect of which no deferred tax asset has been recognised.
2011 2010£m £m
Losses – revenue 83.6 67.5 Losses – capital 185.5 100.2 Other temporary differences 35.0 6.5
304.1 174.2
The tax losses and other temporary differences have no expiry date, except for capital losses of £90.6m which have a tax expiry date of 5 years. The total amount of tax losses and other temporary differences for which no deferred tax was recognised at 31 December 2010 was £174.2m.
Balances in the subsidiary entities are shown on a 100% basis, regardless of ownership percentage. Balances in associates andjoint ventures are not included.
No deferred tax liability is recognised on temporary differences of £120.2m (2010: £161.5m) relating to the unremitted earnings ofoverseas subsidiaries as the Group is able to control the timing of the reversal of these temporary differences and it is probablethat they will not reverse in the foreseeable future. The temporary differences at 31 December 2011 represent only the unremittedearnings of those overseas subsidiaries where remittance to the UK of those earnings may still result in a tax liability, principally asa result of dividend withholding taxes levied by the overseas tax jurisdictions in which these subsidiaries operate.
Temporary differences arising in connection with interests in associates and joint ventures are insignificant.
22. Provisions /2011£m
At 1 January 2011 8.0 Additional provision in the year 2.0 Utilisation (4.8)Disposal of subsidiaries (0.2)Released (0.4)
At 31 December 2011 4.6
The Group’s vacant leasehold properties are principally located in the UK. Provision has been made for the residual leasecommitments for the remaining period of the leases, which at 31 December 2011 is approximately 1.0 year (2010: 1.6 years).
Contingent liabilitiesThe Group and its subsidiaries are subject to legal challenges and claims from time to time, and such claims are vigorouslydefended. The Directors do not anticipate that the outcome of pending legal proceedings, either individually or in aggregate, will have a material adverse effect on the consolidated accounts or on the operations of the Group.
NOTES TO THE CONSOLIDATED FINANCIAL STATEMENTSFor the year ended 31 December 2011
(continued)
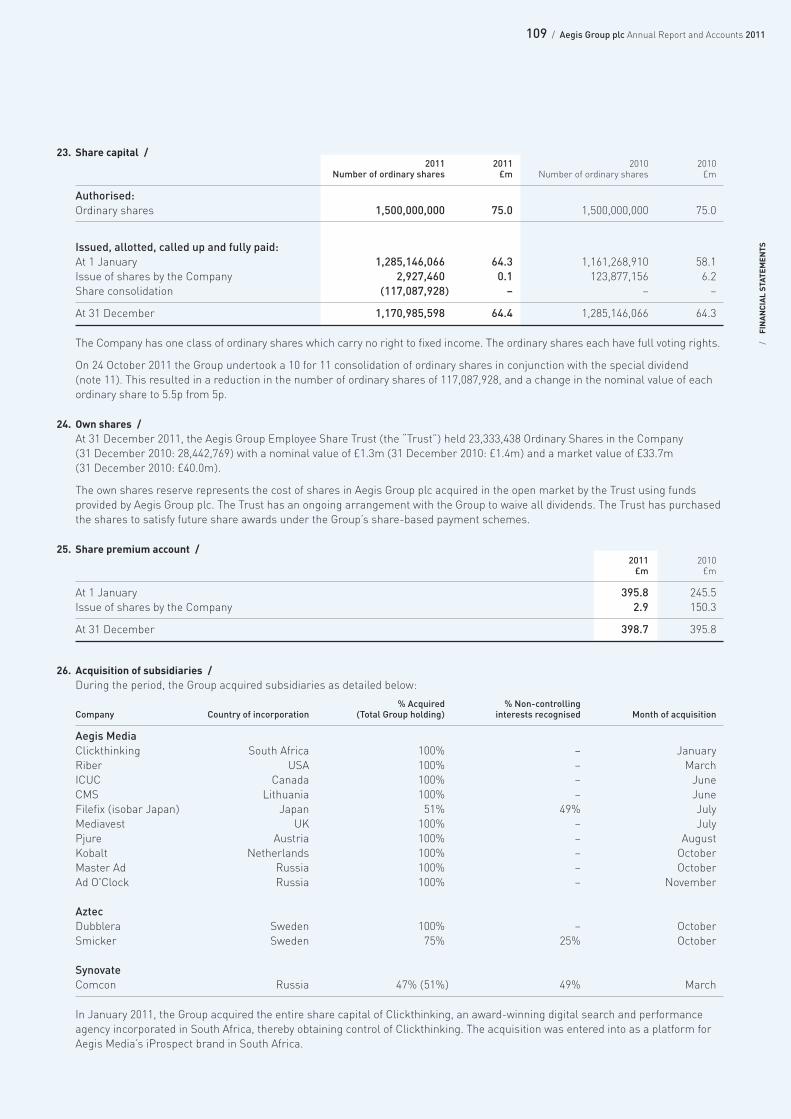
109 / Aegis Group plc Annual Report and Accounts 2011
/FINANCIAL STATEM
ENTS
23. Share capital /2011 2011 2010 2010
Number of ordinary shares £m Number of ordinary shares £m
Authorised:Ordinary shares 1,500,000,000 75.0 1,500,000,000 75.0
Issued, allotted, called up and fully paid:At 1 January 1,285,146,066 64.3 1,161,268,910 58.1 Issue of shares by the Company 2,927,460 0.1 123,877,156 6.2 Share consolidation (117,087,928) – – –
At 31 December 1,170,985,598 64.4 1,285,146,066 64.3
The Company has one class of ordinary shares which carry no right to fixed income. The ordinary shares each have full voting rights.
On 24 October 2011 the Group undertook a 10 for 11 consolidation of ordinary shares in conjunction with the special dividend (note 11). This resulted in a reduction in the number of ordinary shares of 117,087,928, and a change in the nominal value of eachordinary share to 5.5p from 5p.
24. Own shares /At 31 December 2011, the Aegis Group Employee Share Trust (the “Trust”) held 23,333,438 Ordinary Shares in the Company (31 December 2010: 28,442,769) with a nominal value of £1.3m (31 December 2010: £1.4m) and a market value of £33.7m (31 December 2010: £40.0m).
The own shares reserve represents the cost of shares in Aegis Group plc acquired in the open market by the Trust using fundsprovided by Aegis Group plc. The Trust has an ongoing arrangement with the Group to waive all dividends. The Trust has purchasedthe shares to satisfy future share awards under the Group’s share-based payment schemes.
25. Share premium account /2011 2010£m £m
At 1 January 395.8 245.5 Issue of shares by the Company 2.9 150.3
At 31 December 398.7 395.8
26. Acquisition of subsidiaries /During the period, the Group acquired subsidiaries as detailed below:
% Acquired % Non-controlling Company Country of incorporation (Total Group holding) interests recognised Month of acquisition
Aegis MediaClickthinking South Africa 100% – JanuaryRiber USA 100% – MarchICUC Canada 100% – JuneCMS Lithuania 100% – JuneFilefix (isobar Japan) Japan 51% 49% JulyMediavest UK 100% – JulyPjure Austria 100% – AugustKobalt Netherlands 100% – OctoberMaster Ad Russia 100% – OctoberAd O'Clock Russia 100% – November
AztecDubblera Sweden 100% – OctoberSmicker Sweden 75% 25% October
SynovateComcon Russia 47% (51%) 49% March
In January 2011, the Group acquired the entire share capital of Clickthinking, an award-winning digital search and performanceagency incorporated in South Africa, thereby obtaining control of Clickthinking. The acquisition was entered into as a platform forAegis Media’s iProspect brand in South Africa.
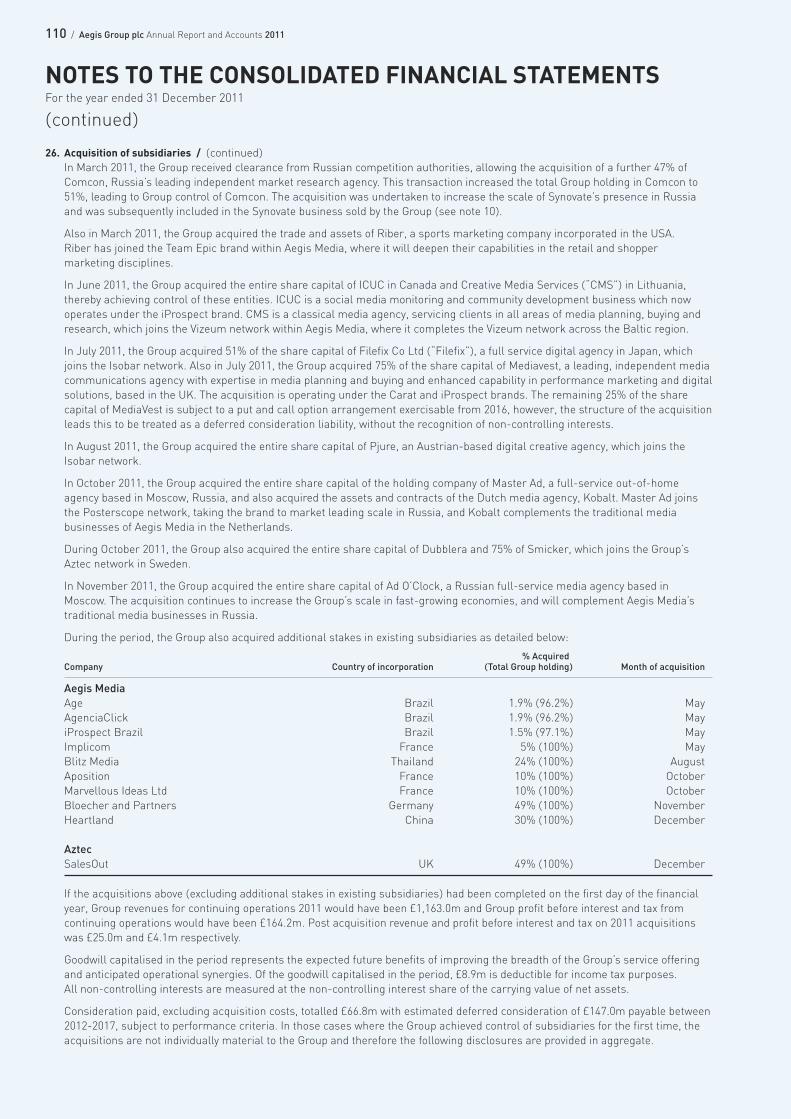
110 / Aegis Group plc Annual Report and Accounts 2011
26. Acquisition of subsidiaries / (continued)In March 2011, the Group received clearance from Russian competition authorities, allowing the acquisition of a further 47% ofComcon, Russia’s leading independent market research agency. This transaction increased the total Group holding in Comcon to51%, leading to Group control of Comcon. The acquisition was undertaken to increase the scale of Synovate’s presence in Russiaand was subsequently included in the Synovate business sold by the Group (see note 10).
Also in March 2011, the Group acquired the trade and assets of Riber, a sports marketing company incorporated in the USA. Riber has joined the Team Epic brand within Aegis Media, where it will deepen their capabilities in the retail and shopper marketing disciplines.
In June 2011, the Group acquired the entire share capital of ICUC in Canada and Creative Media Services (“CMS”) in Lithuania,thereby achieving control of these entities. ICUC is a social media monitoring and community development business which nowoperates under the iProspect brand. CMS is a classical media agency, servicing clients in all areas of media planning, buying andresearch, which joins the Vizeum network within Aegis Media, where it completes the Vizeum network across the Baltic region.
In July 2011, the Group acquired 51% of the share capital of Filefix Co Ltd (“Filefix”), a full service digital agency in Japan, whichjoins the Isobar network. Also in July 2011, the Group acquired 75% of the share capital of Mediavest, a leading, independent mediacommunications agency with expertise in media planning and buying and enhanced capability in performance marketing and digitalsolutions, based in the UK. The acquisition is operating under the Carat and iProspect brands. The remaining 25% of the sharecapital of MediaVest is subject to a put and call option arrangement exercisable from 2016, however, the structure of the acquisitionleads this to be treated as a deferred consideration liability, without the recognition of non-controlling interests.
In August 2011, the Group acquired the entire share capital of Pjure, an Austrian-based digital creative agency, which joins theIsobar network.
In October 2011, the Group acquired the entire share capital of the holding company of Master Ad, a full-service out-of-homeagency based in Moscow, Russia, and also acquired the assets and contracts of the Dutch media agency, Kobalt. Master Ad joinsthe Posterscope network, taking the brand to market leading scale in Russia, and Kobalt complements the traditional mediabusinesses of Aegis Media in the Netherlands.
During October 2011, the Group also acquired the entire share capital of Dubblera and 75% of Smicker, which joins the Group’sAztec network in Sweden.
In November 2011, the Group acquired the entire share capital of Ad O’Clock, a Russian full-service media agency based inMoscow. The acquisition continues to increase the Group’s scale in fast-growing economies, and will complement Aegis Media’straditional media businesses in Russia.
During the period, the Group also acquired additional stakes in existing subsidiaries as detailed below:
% AcquiredCompany Country of incorporation (Total Group holding) Month of acquisition
Aegis MediaAge Brazil 1.9% (96.2%) MayAgenciaClick Brazil 1.9% (96.2%) MayiProspect Brazil Brazil 1.5% (97.1%) MayImplicom France 5% (100%) MayBlitz Media Thailand 24% (100%) AugustAposition France 10% (100%) OctoberMarvellous Ideas Ltd France 10% (100%) OctoberBloecher and Partners Germany 49% (100%) NovemberHeartland China 30% (100%) December
AztecSalesOut UK 49% (100%) December
If the acquisitions above (excluding additional stakes in existing subsidiaries) had been completed on the first day of the financialyear, Group revenues for continuing operations 2011 would have been £1,163.0m and Group profit before interest and tax fromcontinuing operations would have been £164.2m. Post acquisition revenue and profit before interest and tax on 2011 acquisitionswas £25.0m and £4.1m respectively.
Goodwill capitalised in the period represents the expected future benefits of improving the breadth of the Group’s service offeringand anticipated operational synergies. Of the goodwill capitalised in the period, £8.9m is deductible for income tax purposes. All non-controlling interests are measured at the non-controlling interest share of the carrying value of net assets.
Consideration paid, excluding acquisition costs, totalled £66.8m with estimated deferred consideration of £147.0m payable between2012-2017, subject to performance criteria. In those cases where the Group achieved control of subsidiaries for the first time, theacquisitions are not individually material to the Group and therefore the following disclosures are provided in aggregate.
NOTES TO THE CONSOLIDATED FINANCIAL STATEMENTSFor the year ended 31 December 2011
(continued)
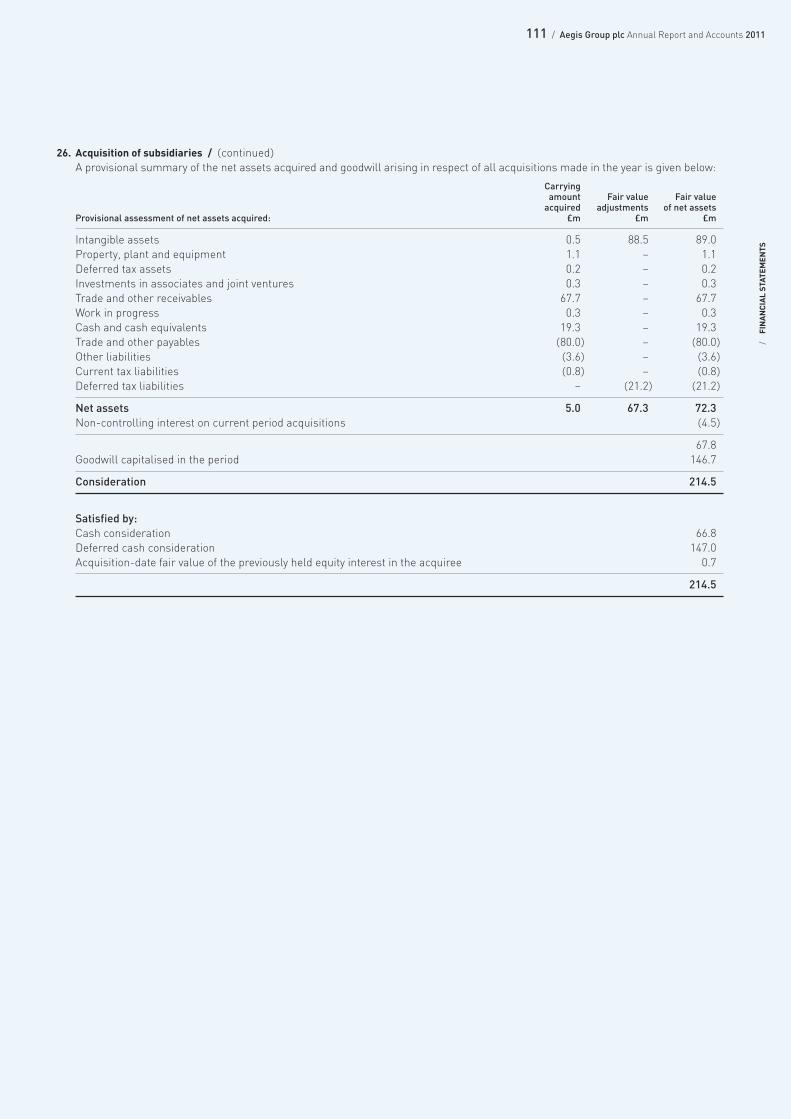
111 / Aegis Group plc Annual Report and Accounts 2011
/FINANCIAL STATEM
ENTS
26. Acquisition of subsidiaries / (continued)A provisional summary of the net assets acquired and goodwill arising in respect of all acquisitions made in the year is given below:
Carrying amount Fair value Fair valueacquired adjustments of net assets
Provisional assessment of net assets acquired: £m £m £m
Intangible assets 0.5 88.5 89.0 Property, plant and equipment 1.1 – 1.1 Deferred tax assets 0.2 – 0.2 Investments in associates and joint ventures 0.3 – 0.3 Trade and other receivables 67.7 – 67.7 Work in progress 0.3 – 0.3 Cash and cash equivalents 19.3 – 19.3 Trade and other payables (80.0) – (80.0)Other liabilities (3.6) – (3.6)Current tax liabilities (0.8) – (0.8)Deferred tax liabilities – (21.2) (21.2)
Net assets 5.0 67.3 72.3 Non-controlling interest on current period acquisitions (4.5)
67.8 Goodwill capitalised in the period 146.7
Consideration 214.5
Satisfied by:Cash consideration 66.8 Deferred cash consideration 147.0 Acquisition-date fair value of the previously held equity interest in the acquiree 0.7
214.5
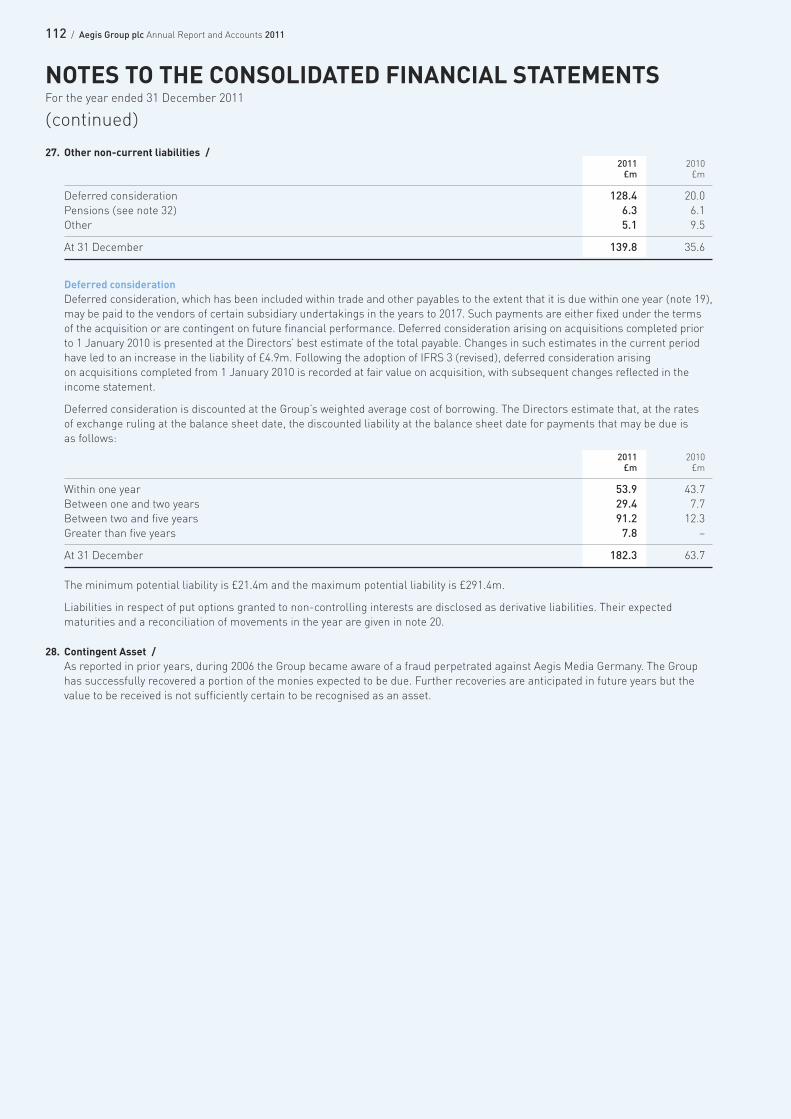
112 / Aegis Group plc Annual Report and Accounts 2011
27. Other non-current liabilities /2011 2010£m £m
Deferred consideration 128.4 20.0 Pensions (see note 32) 6.3 6.1 Other 5.1 9.5
At 31 December 139.8 35.6
Deferred considerationDeferred consideration, which has been included within trade and other payables to the extent that it is due within one year (note 19),may be paid to the vendors of certain subsidiary undertakings in the years to 2017. Such payments are either fixed under the termsof the acquisition or are contingent on future financial performance. Deferred consideration arising on acquisitions completed priorto 1 January 2010 is presented at the Directors’ best estimate of the total payable. Changes in such estimates in the current periodhave led to an increase in the liability of £4.9m. Following the adoption of IFRS 3 (revised), deferred consideration arising on acquisitions completed from 1 January 2010 is recorded at fair value on acquisition, with subsequent changes reflected in theincome statement.
Deferred consideration is discounted at the Group’s weighted average cost of borrowing. The Directors estimate that, at the rates of exchange ruling at the balance sheet date, the discounted liability at the balance sheet date for payments that may be due is as follows:
2011 2010£m £m
Within one year 53.9 43.7 Between one and two years 29.4 7.7 Between two and five years 91.2 12.3 Greater than five years 7.8 –
At 31 December 182.3 63.7
The minimum potential liability is £21.4m and the maximum potential liability is £291.4m.
Liabilities in respect of put options granted to non-controlling interests are disclosed as derivative liabilities. Their expectedmaturities and a reconciliation of movements in the year are given in note 20.
28. Contingent Asset /As reported in prior years, during 2006 the Group became aware of a fraud perpetrated against Aegis Media Germany. The Grouphas successfully recovered a portion of the monies expected to be due. Further recoveries are anticipated in future years but thevalue to be received is not sufficiently certain to be recognised as an asset.
NOTES TO THE CONSOLIDATED FINANCIAL STATEMENTSFor the year ended 31 December 2011
(continued)
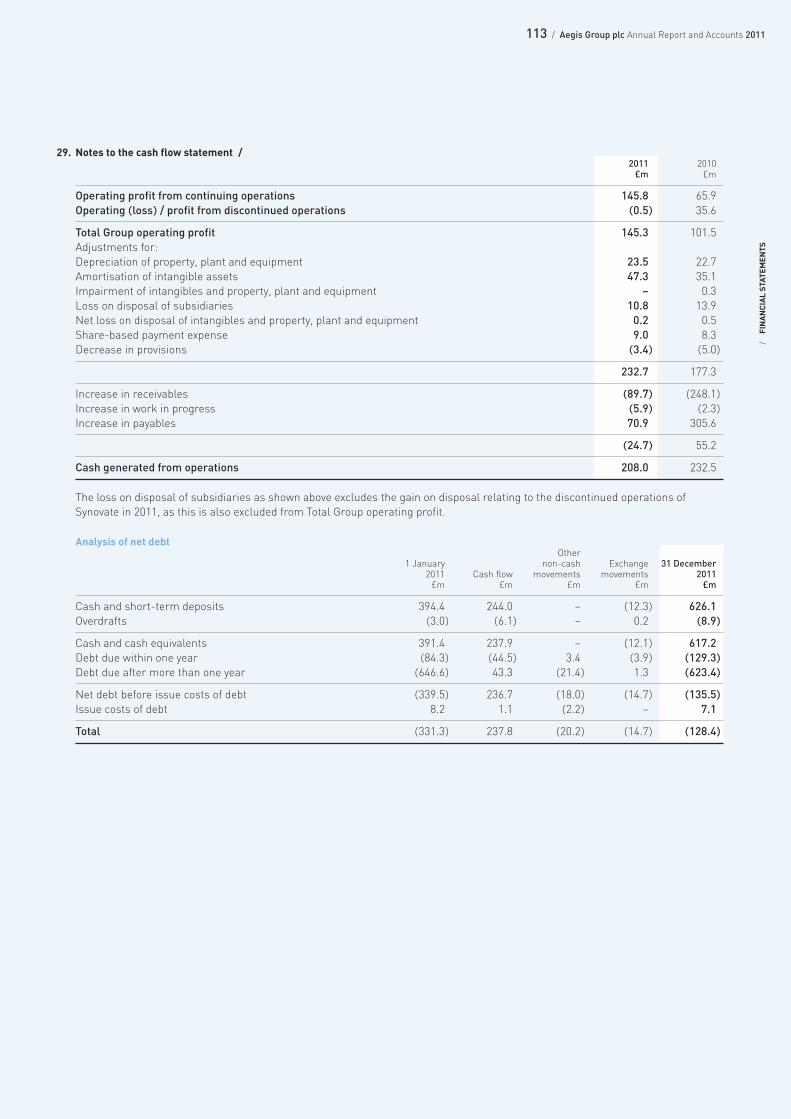
113 / Aegis Group plc Annual Report and Accounts 2011
/FINANCIAL STATEM
ENTS
29. Notes to the cash flow statement /2011 2010£m £m
Operating profit from continuing operations 145.8 65.9 Operating (loss) / profit from discontinued operations (0.5) 35.6
Total Group operating profit 145.3 101.5 Adjustments for:Depreciation of property, plant and equipment 23.5 22.7 Amortisation of intangible assets 47.3 35.1 Impairment of intangibles and property, plant and equipment – 0.3 Loss on disposal of subsidiaries 10.8 13.9 Net loss on disposal of intangibles and property, plant and equipment 0.2 0.5 Share-based payment expense 9.0 8.3 Decrease in provisions (3.4) (5.0)
232.7 177.3
Increase in receivables (89.7) (248.1)Increase in work in progress (5.9) (2.3)Increase in payables 70.9 305.6
(24.7) 55.2
Cash generated from operations 208.0 232.5
The loss on disposal of subsidiaries as shown above excludes the gain on disposal relating to the discontinued operations ofSynovate in 2011, as this is also excluded from Total Group operating profit.
Analysis of net debtOther
1 January non-cash Exchange 31 December 2011 Cash flow movements movements 2011£m £m £m £m £m
Cash and short-term deposits 394.4 244.0 – (12.3) 626.1Overdrafts (3.0) (6.1) – 0.2 (8.9)
Cash and cash equivalents 391.4 237.9 – (12.1) 617.2 Debt due within one year (84.3) (44.5) 3.4 (3.9) (129.3)Debt due after more than one year (646.6) 43.3 (21.4) 1.3 (623.4)
Net debt before issue costs of debt (339.5) 236.7 (18.0) (14.7) (135.5)Issue costs of debt 8.2 1.1 (2.2) – 7.1
Total (331.3) 237.8 (20.2) (14.7) (128.4)

114 / Aegis Group plc Annual Report and Accounts 2011
30. Operating lease arrangements /2011 2011 2011 2010 2010 2010£m £m £m £m £m £m
Land and Land and buildings Other Total buildings Other Total
Lease payments under operating leases recognised in operating expenses from continuing operations 49.3 2.1 51.4 38.8 3.0 41.8
At the balance sheet date, the Group had outstanding commitments for future minimum lease payments under non-cancellableoperating leases, which fall due as follows:
2011 2011 2011 2010 2010 2010£m £m £m £m £m £m
Land and Land and Gross lease commitments payable buildings Other Total buildings Other Total
Within one year 48.1 4.0 52.1 46.6 2.9 49.5 In the second to fifth years inclusive 122.3 3.0 125.3 111.8 4.4 116.2 After five years 93.9 – 93.9 58.4 – 58.4
264.3 7.0 271.3 216.8 7.3 224.1
2011 2011 2011 2010 2010 2010£m £m £m £m £m £m
Land and Land and Committed sublease income buildings Other Total buildings Other Total
Within one year (0.1) – (0.1) (0.5) – (0.5)In the second to fifth years inclusive (0.2) – (0.2) (1.1) – (1.1)
(0.3) – (0.3) (1.6) – (1.6)
2011 2011 2011 2010 2010 2010£m £m £m £m £m £m
Land and Land and Net minimum lease commitments buildings Other Total buildings Other Total
Within one year 48.0 4.0 52.0 46.1 2.9 49.0 In the second to fifth years inclusive 122.1 3.0 125.1 110.7 4.4 115.1 After five years 93.9 – 93.9 58.4 – 58.4
264.0 7.0 271.0 215.2 7.3 222.5
Operating lease payments principally represent rentals payable by the Group for certain of its office properties. Leases arenegotiated for an average term of 3.8 years and rentals are fixed for an average of 3 years.
NOTES TO THE CONSOLIDATED FINANCIAL STATEMENTSFor the year ended 31 December 2011
(continued)
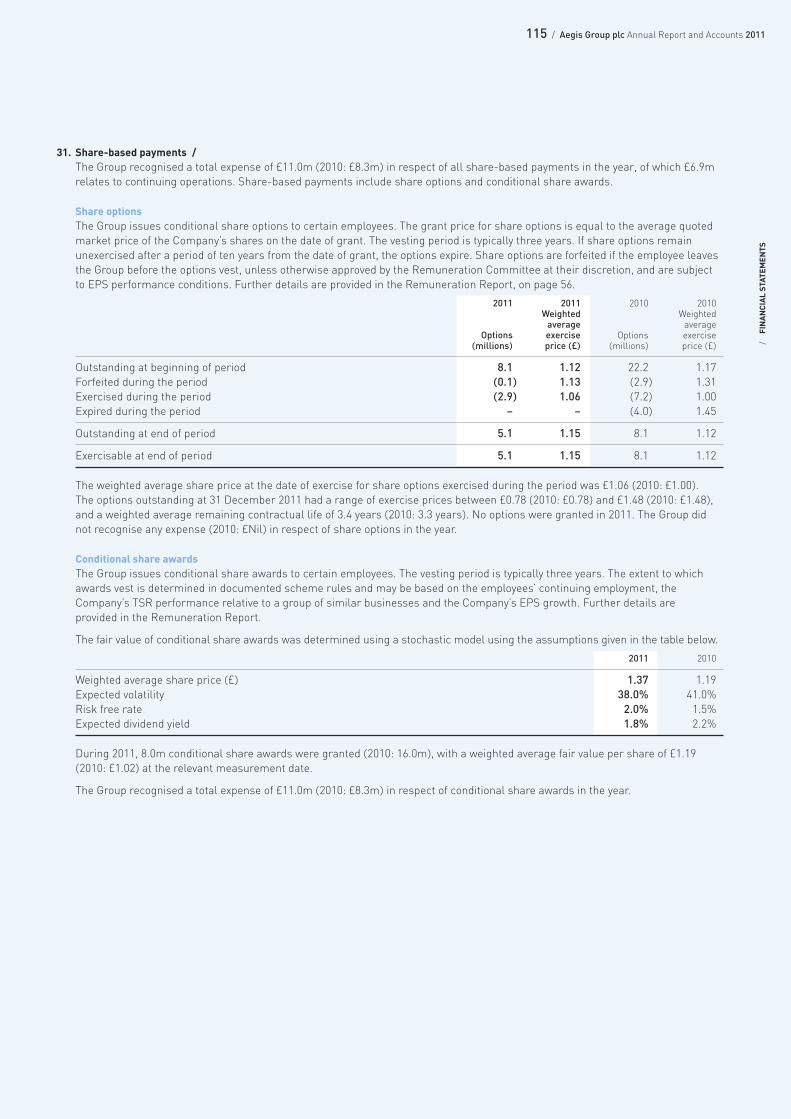
115 / Aegis Group plc Annual Report and Accounts 2011
/FINANCIAL STATEM
ENTS
31. Share-based payments /The Group recognised a total expense of £11.0m (2010: £8.3m) in respect of all share-based payments in the year, of which £6.9mrelates to continuing operations. Share-based payments include share options and conditional share awards.
Share optionsThe Group issues conditional share options to certain employees. The grant price for share options is equal to the average quotedmarket price of the Company’s shares on the date of grant. The vesting period is typically three years. If share options remainunexercised after a period of ten years from the date of grant, the options expire. Share options are forfeited if the employee leavesthe Group before the options vest, unless otherwise approved by the Remuneration Committee at their discretion, and are subjectto EPS performance conditions. Further details are provided in the Remuneration Report, on page 56.
2011 2011 2010 2010Weighted Weightedaverage average
Options exercise Options exercise(millions) price (£) (millions) price (£)
Outstanding at beginning of period 8.1 1.12 22.2 1.17Forfeited during the period (0.1) 1.13 (2.9) 1.31Exercised during the period (2.9) 1.06 (7.2) 1.00Expired during the period – – (4.0) 1.45
Outstanding at end of period 5.1 1.15 8.1 1.12
Exercisable at end of period 5.1 1.15 8.1 1.12
The weighted average share price at the date of exercise for share options exercised during the period was £1.06 (2010: £1.00). The options outstanding at 31 December 2011 had a range of exercise prices between £0.78 (2010: £0.78) and £1.48 (2010: £1.48),and a weighted average remaining contractual life of 3.4 years (2010: 3.3 years). No options were granted in 2011. The Group didnot recognise any expense (2010: £Nil) in respect of share options in the year.
Conditional share awardsThe Group issues conditional share awards to certain employees. The vesting period is typically three years. The extent to whichawards vest is determined in documented scheme rules and may be based on the employees’ continuing employment, theCompany’s TSR performance relative to a group of similar businesses and the Company’s EPS growth. Further details are provided in the Remuneration Report.
The fair value of conditional share awards was determined using a stochastic model using the assumptions given in the table below.
2011 2010
Weighted average share price (£) 1.37 1.19Expected volatility 38.0% 41.0%Risk free rate 2.0% 1.5%Expected dividend yield 1.8% 2.2%
During 2011, 8.0m conditional share awards were granted (2010: 16.0m), with a weighted average fair value per share of £1.19(2010: £1.02) at the relevant measurement date.
The Group recognised a total expense of £11.0m (2010: £8.3m) in respect of conditional share awards in the year.
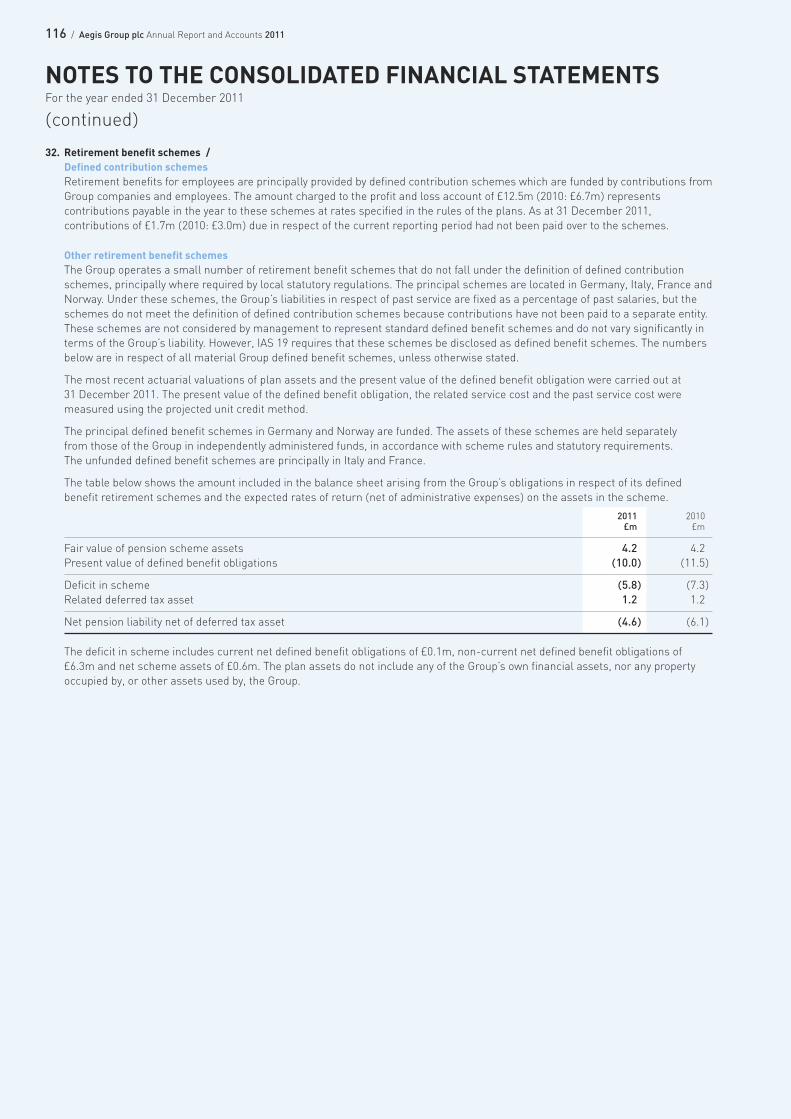
116 / Aegis Group plc Annual Report and Accounts 2011
32. Retirement benefit schemes /Defined contribution schemesRetirement benefits for employees are principally provided by defined contribution schemes which are funded by contributions fromGroup companies and employees. The amount charged to the profit and loss account of £12.5m (2010: £6.7m) representscontributions payable in the year to these schemes at rates specified in the rules of the plans. As at 31 December 2011,contributions of £1.7m (2010: £3.0m) due in respect of the current reporting period had not been paid over to the schemes.
Other retirement benefit schemesThe Group operates a small number of retirement benefit schemes that do not fall under the definition of defined contributionschemes, principally where required by local statutory regulations. The principal schemes are located in Germany, Italy, France andNorway. Under these schemes, the Group’s liabilities in respect of past service are fixed as a percentage of past salaries, but theschemes do not meet the definition of defined contribution schemes because contributions have not been paid to a separate entity.These schemes are not considered by management to represent standard defined benefit schemes and do not vary significantly interms of the Group’s liability. However, IAS 19 requires that these schemes be disclosed as defined benefit schemes. The numbersbelow are in respect of all material Group defined benefit schemes, unless otherwise stated.
The most recent actuarial valuations of plan assets and the present value of the defined benefit obligation were carried out at 31 December 2011. The present value of the defined benefit obligation, the related service cost and the past service cost weremeasured using the projected unit credit method.
The principal defined benefit schemes in Germany and Norway are funded. The assets of these schemes are held separately from those of the Group in independently administered funds, in accordance with scheme rules and statutory requirements. The unfunded defined benefit schemes are principally in Italy and France.
The table below shows the amount included in the balance sheet arising from the Group’s obligations in respect of its definedbenefit retirement schemes and the expected rates of return (net of administrative expenses) on the assets in the scheme.
2011 2010£m £m
Fair value of pension scheme assets 4.2 4.2 Present value of defined benefit obligations (10.0) (11.5)
Deficit in scheme (5.8) (7.3)Related deferred tax asset 1.2 1.2
Net pension liability net of deferred tax asset (4.6) (6.1)
The deficit in scheme includes current net defined benefit obligations of £0.1m, non-current net defined benefit obligations of£6.3m and net scheme assets of £0.6m. The plan assets do not include any of the Group’s own financial assets, nor any propertyoccupied by, or other assets used by, the Group.
NOTES TO THE CONSOLIDATED FINANCIAL STATEMENTSFor the year ended 31 December 2011
(continued)
117 / Aegis Group plc Annual Report and Accounts 2011
/FINANCIAL STATEM
ENTS
33. Related party transactions /Remuneration of key management personnelThe following is the compensation of Directors and key management. Further information about the remuneration of individualDirectors is provided in the audited part of the Directors’ Remuneration Report on pages 56 to 63.
2011 2010£m £m
Short-term employee benefits 3.4 2.9 Post-employment benefits 0.4 0.4 Termination benefits 1.2 –Share-based payment 2.2 0.7
7.2 4.0
Transactions with associated undertakingsIn 2011, Group subsidiary companies purchased media space from associated undertakings totalling £22.6m (2010: £29.7m). The balance due from Group companies to associated undertakings at the end of 2011 was £7.0m (2010: £13.4m). The balance due from associated undertakings to Group companies at the end of 2011 was £1.1m (2010: £6.8m).
Other related party disclosuresHarold Mitchell, a director of the Company, holds 42,412,152 Aegis Group plc shares and unless otherwise agreed with theCompany will retain at least 85% of those shares for 2 years from 17 November 2010. His son, Stuart Mitchell, is a director andemployee of Aegis Media Pacific, part of the Mitchell Communication Group, which was acquired by Aegis Group plc in 2010. AegisMedia Pacific Management Services Pty Limited leases premises from Mitchell Land Pty Ltd, of which Harold Mitchell is a director,under a 10-year lease expiring in 2020 and from a company controlled by another member of his family under a monthly tenancy,for a combined annual rental charge of £1.4m.
Harold is a director of Mitchell Air Pty Ltd, which owns a jet aircraft and on-charges Aegis Media Australia at arm’s length rates the cost of travel by employees using the jet for business purposes. Mitchell Air Pty Ltd is the trustee of the Mitchell Air Trust, to whom Harold Mitchell is a nominated beneficiary.
34. Subsequent events /Acquisitions completed after the balance sheet dateIn January 2012, the Group acquired a minority share in The Upper Storey Pte Ltd (“TUS”), an award-winning digital creative agencybased in Singapore. TUS will become part of Isobar in Asia Pacific and will be rebranded as TUS Isobar.
In February 2012, the Group announced an agreement to acquire the holding company of Roundarch Inc. (“Roundarch”), the USdigital agency, for an initial consideration of US$125 million. Roundarch is a leading digital agency which specialises in designingand building enterprise-class digital solutions for clients. The acquisition of Roundarch is in line with Aegis Group’s strategy totarget acquisitions with a specific focus on digital businesses, North America and faster-growing regions. With offices in Chicago,Denver, Boston and New York, Roundarch employs 250 staff and its service offerings include strategy, design, development andoutsourcing across all digital channels, including web, mobile and social media.
Following the acquisition, Roundarch will be combined with Isobar, Aegis Media’s existing digital creative network in the US, toform RoundarchIsobar. RoundarchIsobar will be a top tier digital agency with the depth and resources to consolidate Aegis’scompetitive position in the US.
In March 2012, the Group entered into an agreement to acquire Beijing eLink Advertising Co., Ltd (“eLink”), a digital agency inChina. The transaction is subject to regulatory procedures and customary closing conditions and is expected to close in the secondquarter of 2012. eLink will become part of the Isobar network in China, strengthening Isobar in Beijing and ensuring a leadingposition in China.
In March 2012, the Group acquired the Hungarian Out-of-Home agency PPI Central Europe Ltd (“PPI”). PPI will be rebranded tobecome part of the Posterscope EMEA division of Posterscope Worldwide.
The additional IFRS3 (2008) disclosures are not given because the initial accounting for the business combination is incomplete atthe time the financial statements are authorised for issue.
118 / Aegis Group plc Annual Report and Accounts 2011
2011 2010 2009 2008 2007£m £m £m £m £m
Income statementRevenue 1,135.0 941.0 873.0 856.4 697.7 Underlying profit before interest and tax 201.4 155.1 136.2 142.1 119.1 Underlying profit before tax 161.8 122.3 116.9 131.1 110.5 Profit before tax 106.4 33.5 82.3 94.5 110.0 Profit attributable to equity holders of the parent 79.6 18.2 56.4 61.3 73.3
Balance sheet Non-current assets 1,396.0 1,628.1 1,200.7 1,345.7 938.7 Net current (liabilities)/assets (111.0) (198.4) (6.5) (5.4) 35.6 Non-current liabilities (822.3) (761.3) (749.7) (880.5) (668.0)
Net assets 462.7 668.4 444.5 459.8 306.3
Financed by:Equity 457.1 654.9 431.9 442.5 299.8 Non-controlling interests 5.6 13.5 12.6 17.3 6.5
462.7 668.4 444.5 459.8 306.3
Pence Pence Pence Pence Pence
Earnings per share– Basic 6.5 1.6 5.0 5.4 6.6 – Diluted 6.5 1.6 5.0 5.4 6.5 Underlying earnings per share– Basic 10.3 7.8 7.4 8.0 6.8 – Diluted 10.1 7.8 7.4 8.0 6.7
Dividend rate per share 20.28 2.75 2.50 2.50 2.30
The amounts disclosed for all years have been prepared under IFRS.
Underlying profit before tax and earnings per share are restated on a continuing group basis for prior years as discussed in note 2.
FIVE-YEAR SUMMARY

119 / Aegis Group plc Annual Report and Accounts 2011
/FINANCIAL STATEM
ENTS
We have audited the financial statements of Aegis Group plc for the year ended 31 December 2011 which comprise the ParentCompany Balance Sheet and the related notes 1 to 16. The financial reporting framework that has been applied in their preparation is applicable law and United Kingdom Accounting Standards (United Kingdom Generally Accepted Accounting Practice).
This report is made solely to the company’s members, as a body, in accordance with Chapter 3 of Part 16 of the Companies Act 2006. Our audit work has been undertaken so that we might state to the company’s members those matters we are required to state to them in an auditor’s report and for no other purpose. To the fullest extent permitted by law, we do not accept or assume responsibility toanyone other than the company and the company’s members as a body, for our audit work, for this report, or for the opinions we have formed.
The maintenance and integrity of the Aegis Group plc web site is the responsibility of the directors; the work carried out by the auditorsdoes not involve consideration of these matters and, accordingly, the auditors accept no responsibility for any changes that may haveoccurred to the financial statements since they were initially presented on the web site.
Legislation in the United Kingdom governing the preparation and dissemination of financial statements may differ from legislation inother jurisdictions.
Respective responsibilities of directors and auditor /As explained more fully in the Directors’ Responsibilities Statement set out on page 50, the directors are responsible for thepreparation of the financial statements and for being satisfied that they give a true and fair view. Our responsibility is to audit andexpress an opinion on the financial statements in accordance with applicable law and International Standards on Auditing (UK andIreland). Those standards require us to comply with the Auditing Practices Board’s Ethical Standards for Auditors.
Scope of the audit of the financial statements /An audit involves obtaining evidence about the amounts and disclosures in the financial statements sufficient to give reasonableassurance that the financial statements are free from material misstatement, whether caused by fraud or error. This includes anassessment of: whether the accounting policies are appropriate to the parent company’s circumstances and have been consistentlyapplied and adequately disclosed; the reasonableness of significant accounting estimates made by the directors; and the overallpresentation of the financial statements. In addition, we read all the financial and non-financial information in the Annual Report and Accounts to identify material inconsistencies with the audited financial statements. If we become aware of any apparent materialmisstatements or inconsistencies we consider the implications for our report.
Opinion on financial statements /In our opinion the parent company financial statements:
– give a true and fair view of the state of the company’s affairs as at 31 December 2011;
– have been properly prepared in accordance with United Kingdom Generally Accepted Accounting Practice; and
– have been prepared in accordance with the requirements of the Companies Act 2006.
Opinion on other matters prescribed by the Companies Act 2006 /In our opinion:
– the part of the Directors’ Remuneration Report to be audited has been properly prepared in accordance with the Companies Act2006; and
– the information given in the Directors’ Report for the financial year for which the financial statements are prepared is consistentwith the parent company financial statements.
Matters on which we are required to report by exception /We have nothing to report in respect of the following matters where the Companies Act 2006 requires us to report to you if, in our opinion:
– adequate accounting records have not been kept by the parent company, or returns adequate for our audit have not been receivedfrom branches not visited by us; or
– the parent company financial statements and the part of the Directors’ Remuneration Report to be audited are not in agreementwith the accounting records and returns; or
– certain disclosures of directors’ remuneration specified by law are not made; or
– we have not received all the information and explanations we require for our audit.
Other matter /We have reported separately on the group financial statements of Aegis Group plc for the year ended 31 December 2011.
Richard Addison (Senior statutory auditor)for and on behalf of Ernst & Young LLP, Statutory Auditor London
14 March 2012
INDEPENDENT AUDITOR’S REPORTTo the members of Aegis Group plc
120 / Aegis Group plc Annual Report and Accounts 2011
2011 2010Notes £m £m
Fixed assetsTangible assets 4 10.6 2.9 Investments 5 1,714.1 1,518.6 Derivative financial assets 10 20.1 8.5
1,744.8 1,530.0
Current assets Debtors– due within one year 6 235.8 219.2 – due after more than one year 7 3.5 225.5 Derivative financial assets 10 0.5 –Cash at bank and in hand 128.1 6.2
367.9 450.9 Creditors: Amounts falling due within one year 8 (853.8) (715.5)Derivative financial liabilities 10 (8.9) (2.1)
Net current liabilities (494.8) (266.7)
Total assets less current liabilities 1,250.0 1,263.3 Creditors: Amounts falling due after more than one year 9 (351.4) (440.2)Derivative financial liabilities 10 (2.5) (13.4)
Net assets 896.1 809.7
Called up share capital 11 64.4 64.3 Share premium account 12 398.7 395.8 Capital redemption reserve 12 0.2 0.2 Other reserve 12 19.2 19.2Merger reserve 12 13.0 13.0 ESOP reserve 12 (31.2) (33.7)Capital reserve 12 301.4 301.4 Profit and loss account 13 130.4 49.5
Equity shareholders' funds 896.1 809.7
Company number 1403668 England and Wales
These financial statements were approved by the Board of Directors on 14 March 2012 and were signed on its behalf by:
Jerry Buhlmann (Chief Executive Officer) Nick Priday (Chief Financial Officer)
COMPANY BALANCE SHEETAt 31 December 2011
121 / Aegis Group plc Annual Report and Accounts 2011
/FINANCIAL STATEM
ENTS
1. Basis of preparation and accounting policies /Basis of preparation The separate financial statements of the Company are presented as required by the Companies Act 2006. They have been preparedunder the historical cost convention and in accordance with applicable United Kingdom Accounting Standards and law.
The Directors’ Report, Corporate Governance and Directors’ Remuneration Report disclosures have been made in the Groupsection of this annual report, refer to pages 46 to 63.
The Company has utilised the exemptions provided under FRS 1 (Revised) and has not presented a cash flow statement. TheGroup’s cash flow statement has been presented in the Group financial statements.
In accordance with FRS 8 Related Party Disclosures, the Company has taken advantage of the exemption from disclosingtransactions with other wholly owned Group Companies and where the Group accounts contain these disclosures.
As the parent company of a group drawing up consolidated financial statements that meet the requirements of IFRS 7, it is exemptfrom disclosures that comply with its UK GAAP equivalent, FRS 29 Financial Instruments Disclosures.
Accounting policiesThe principal accounting policies are summarised below. They have all been applied consistently throughout the year and thepreceding year.
Employee benefitsThe retirement benefits for employees are provided by defined contribution schemes which are funded by contributions from theCompany and employees. The amount charged to profit and loss is the contribution payable in the year.
Share-based paymentsThe Company applies the requirements of FRS 20 Share-based payment. In accordance with the transitional provisions, FRS 20 hasbeen applied to all grants of equity instruments after 7 November 2002 that were unvested at 1 January 2005.
Certain employees receive remuneration in the form of share-based payments, including shares or rights over shares. The cost ofequity-settled transactions with employees is measured by reference to the fair value of the instruments concerned at the date at whichthey are granted. The fair value is determined by an external valuer using a stochastic model. The fair value determined at the grantdate of the equity-settled share-based payments is expensed on a straight-line basis over the vesting period, based on the Company’sestimate of equity instruments that will eventually vest. At each balance sheet date, the Company revises its estimate of the number ofequity instruments expected to vest as a result of the effect of non market-based vesting conditions. The impact of the revision of theoriginal estimates, if any, is recognised in profit and loss such that the cumulative expense reflects the revised estimate, with acorresponding adjustment to equity.
Where a parent entity grants rights to its equity instruments to employees of a subsidiary, and such share-based compensation isaccounted for as equity-settled in the consolidated financial statements of the parent, UITF 44 requires the subsidiary to record anexpense for such compensation in accordance with FRS 20 Share-based payment, with a corresponding increase recognised inequity as a contribution from the parent.
Interest incomeInterest income is accrued on a time basis, by reference to the principal outstanding and at the effective interest rate applicable,which is the rate that exactly discounts estimated future cash receipts through the expected life of the financial asset to that asset’snet carrying amount.
Foreign exchangeTransactions in foreign currencies are recorded at the exchange rate ruling at the date of the transaction. Upon settlement,monetary assets and liabilities are re-translated at the rate ruling on the settlement date. Monetary assets and liabilities at theyear end are re-translated at the exchange rate ruling at the balance sheet date.
Deferred taxationDeferred taxation is provided in full on timing differences that result in an obligation at the balance sheet date to pay more tax, or a right to pay less tax, at a future date, at rates expected to apply when they crystallise based on current tax rates and law. Timingdifferences arise from the inclusion of items of income and expenditure in taxation computations in periods different from those inwhich they are included in financial statements.
Deferred tax assets are recognised to the extent that it is regarded as more likely than not that they will be recovered. Deferred taxassets and liabilities are not discounted.
NOTES TO THE COMPANY’S FINANCIAL STATEMENTSFor the year ended 31 December 2011
122 / Aegis Group plc Annual Report and Accounts 2011
1. Basis of preparation and accounting policies / (continued)Leased assetsLeases where the lessor retains substantially all the risks and benefits of ownership of the asset are classified as operating leases.Operating lease rentals are charged to income statement over the lease term on a straight-line basis. In the event that leaseincentives are received to enter into operating leases, such incentives are recognised as a liability and recognised as a reduction of rental expense on a straight-line basis.
Tangible assetsTangible fixed assets are stated at historical cost less accumulated depreciation.
Depreciation is provided to write off the cost of all fixed assets to their residual value over their expected useful lives using thestraight-line method. It is calculated on the historic cost of the assets at the following rates:
Leasehold buildings Over the period of the lease
Leasehold improvements 10% to 20% per annum or over the period of the lease, if shorter
Office furniture, fixtures, equipment and vehicles 10% to 50% per annum
Software 20% to 50% per annum
Other 10% to 50% per annum
The carrying value of tangible fixed assets are reviewed for impairment when events or changes in circumstances indicate thecarrying value may not be recoverable.
InvestmentsInvestments in subsidiaries, associates and joint ventures, are held in the Company balance sheet at cost less any provisions forimpairment.
Equity instrumentsEquity instruments issued by the Company are recorded at the proceeds received, net of direct issue costs.
LoansInterest-bearing bank loans and overdrafts are recorded at the proceeds received, net of direct issue costs. Direct issue costs are amortised over the period of the loans and overdrafts to which they relate. Finance charges, including premiums payable onsettlement or redemption are charged to profit and loss as incurred using the effective interest method and are added to thecarrying value of the instrument to the extent that they are not settled in the period in which they arise.
Derivative financial instrumentsThe Company uses derivative financial instruments to reduce exposure to foreign exchange risk and interest rate movements. The Company does not hold or issue derivative financial instruments for speculative purposes.
For a forward foreign exchange contract to be treated as a hedge the instrument must be related to actual foreign currency assetsor liabilities or to a probable commitment. It must involve the same currency or similar currencies as the hedged item and mustalso reduce the risk of foreign currency exchange movements on the Company’s operations. Gains and losses arising on thesecontracts are deferred and recognised in the profit and loss account, or as adjustments to the carrying amount of fixed assets, only when the hedged transaction has itself been reflected in the Company’s financial statements.
Changes in the fair value of the derivative financial instruments that do not qualify for hedge accounting are recognised in the profitand loss account as they arise.
NOTES TO THE COMPANY’S FINANCIAL STATEMENTSFor the year ended 31 December 2011
(continued)
123 / Aegis Group plc Annual Report and Accounts 2011
/FINANCIAL STATEM
ENTS
2. Profit for the year /As permitted by Section 408 of the Companies Act 2006, no separate profit and loss account is presented in respect of the parent Company.
Aegis Group plc reported a profit, before the payment of dividends, for the financial year ended 31 December 2011 of £312.9m(2010: £24.0 m).
The profit for the year of £312.9m includes dividends received of £258.9m (2010: £77.6m) from group companies.
The auditor’s remuneration for audit services to the Company amounted to £0.2m (2010: £0.3m) and for non-audit servicesamounted to £0.5m (2010: £0.6m).
Details of executive and non-executive directors’ emoluments and their interest in shares and options of the Company are shownwithin the Remuneration Report on pages 56 to 63.
3. Staff costs /The monthly average number of persons employed by the Company (excluding directors) during the year was 45 (2010: 38).
Their aggregate remuneration comprised:
2011 2010£m £m
Wages, salaries, bonus and benefits 5.0 4.6 Social security costs 0.5 0.4 Pension costs 0.4 0.3
Staff Costs 5.9 5.3
Staff costs include a share-based payment expense of £1.3m (2010: £1.0m).
Directors’ remuneration is disclosed in the front section of this report, refer to Remuneration Report on pages 56 to 63.
4. Tangible assets /Long leasehold Equipment,and leasehold fixtures Computer improvements and fittings software Other Total
£m £m £m £m £m
CostAt 1 January 1.6 2.3 0.8 1.6 6.3 Additions 8.7 – 0.2 0.2 9.1
At 31 December 10.3 2.3 1.0 1.8 15.4
Accumulated depreciationAt 1 January 0.6 2.1 – 0.7 3.4 Charge for the year 0.8 0.2 0.2 0.2 1.4
At 31 December 1.4 2.3 0.2 0.9 4.8
Carrying amountAt 31 December 2011 8.9 – 0.8 0.9 10.6
At 31 December 2010 1.0 0.2 0.8 0.9 2.9
Additions to leasehold improvements relate primarily to the UK office re-location.
The net book value of other tangible assets includes trademarks of £1.0m (2010: £0.9m).
124 / Aegis Group plc Annual Report and Accounts 2011
5. Investments /Shares in
Interests in subsidiary associates undertakings Total
£m £m £m
CostAt 1 January 0.2 1,708.5 1,708.7 Additions – 220.9 220.9 Disposals – (43.1) (43.1)
At 31 December 0.2 1,886.3 1,886.5
Accumulated impairment lossesAt 1 January – 190.1 190.1Disposals – (17.7) (17.7)
At 31 December – 172.4 172.4
Carrying amountAt 31 December 2011 0.2 1,713.9 1,714.1
At 31 December 2010 0.2 1,518.4 1,518.6
A listing of principal subsidiary and associated undertakings is included in note 16.
Additions to investments principally relate to the recapitalisation of Aegis Finance (Guernsey) Ltd, a direct subsidiary of the Company.
On 12 October 2011, the Group completed its disposal of the Synovate division to Ipsos S.A. As part of this transaction, Aegis Groupplc (Company) disposed of two subsidiaries: Synovate (Holdings) Ltd and Synovate Healthcare Ltd, for consideration of £127.5m,realising a gain on disposal of £102.5m (excluding transaction costs).
The Company’s associated undertaking is:
Effective interest in Nature of Operation Country of Incorporation ordinary share capital
Carat Philippines Inc Media Communications Philippines 30%
6. Debtors due within one year /2011 2010£m £m
Amounts owed by subsidiary undertakings 233.4 217.3 Other debtors 0.9 0.9 Prepayments and accrued income 1.5 1.0
235.8 219.2
Amounts owed by subsidiary undertakings are on-demand and interest-bearing.
7. Debtors due after more than one year /2011 2010£m £m
Amounts owed by subsidiary undertakings – 222.0 Deferred tax asset 3.5 3.5
3.5 225.5
Amounts owed by subsidiary undertakings are interest-bearing.
NOTES TO THE COMPANY’S FINANCIAL STATEMENTSFor the year ended 31 December 2011
(continued)

125 / Aegis Group plc Annual Report and Accounts 2011
/FINANCIAL STATEM
ENTS
8. Creditors: amounts falling due within one year /2011 2010£m £m
Loans 109.4 6.8 Less issue costs of debt to be amortised (1.2) (1.0)
108.2 5.8 Trade creditors 1.6 2.2 Amounts owed to subsidiary undertakings 726.3 698.3 Other creditors – 1.1Provision for liabilities 0.3 0.5 Accruals and deferred income 17.4 7.6
853.8 715.5
Amounts owed to subsidiary undertakings are on-demand and interest-bearing.
The provision for liabilities is the Company’s vacant leasehold properties which are located in the UK. Provision has been made for the residual lease commitments for the remaining period of the leases split as current £0.3 m (2010: £0.5m) and non-current£0.8m (2010: £1.0m).
9. Creditors: amounts falling due after more than one year /2011 2010£m £m
Borrowings 353.7 442.9 Less issue costs of debt to be amortised (3.1) (3.7)
350.6 439.2 Provision for liabilities 0.8 1.0
351.4 440.2
Private Placement Debt – July 2005On 28 July 2005, the Company issued US$342m of unsecured loan notes, repayable between 2012 and 2017. On 9 November 2005cross currency swaps were entered into for US$142m of the loan notes due in 2012 and US$50m of the loan notes due in 2015 toconvert this US$ fixed rate borrowing into EUR fixed rate borrowing. These loan notes are guaranteed by the Company and certainof its subsidiaries.
Private Placement Debt – September 2007On 17 September 2007, the Company issued US$125m of unsecured loan notes, repayable between 2014 and 2017. These loannotes are guaranteed by the Company and certain of its subsidiaries.
Private Placement Debt – December 2009On 17 December 2009, the Company issued US$183m and £25m of unsecured loan notes repayable between 2017 and 2019. Theseloans are guaranteed by the Company and certain of its subsidiaries. On 17 November 2009, an interest rate swap was entered intofor US$50m of the loan notes due 2019 to convert the US$ fixed rate debt to US$ floating rate debt. On 17 November 2009, crosscurrency interest rate swaps were entered into for US$18m of the loan notes due 2017 and US$115m of the loan notes due 2019 toconvert the US$ fixed rate borrowing to GBP floating rate borrowing.
Multi-currency credit facility – July 2010In July 2010, the Company re-financed the five year £450m multi-currency credit facility with a group of international financialbanks, which was originally entered into in June 2006. The facility is of a committed revolving nature with drawings allowable under a variety of currencies. The facility is guaranteed by the Company and certain of its subsidiaries.
126 / Aegis Group plc Annual Report and Accounts 2011
9. Creditors: amounts falling due after more than one year / (continued)Loans repayable, included within creditors, are analysed as follows:
2011 2010£m £m
Repayable within one year 109.4 6.8 Repayable between one and two years – 102.0 Repayable between two and five years 124.4 123.8 Repayable after more than five years 229.3 217.1 Issue cost of debt (4.3) (4.7)
458.8 445.0
Details of gross borrowings not wholly repayable within five years as follows:5.65% fixed rate 2005 $65m private placement debt repayable 28 July 2017 41.9 41.76.29% fixed rate 2007 $50m private placement debt repayable 17 September 2017 32.2 32.1 6.39% fixed rate 2009 £25m private placement debt repayable 17 December 2017 25.0 25.0 6.07% fixed rate 2009 $18m private placement debt repayable 17 December 2017 11.6 11.5 6.50% fixed rate 2009 $165m private placement debt repayable 17 December 2019 106.4 105.8
217.1 216.1
10. Derivative financial instruments /2011 2010£m £m
CurrentDerivative financial assets 0.5 –
Derivative financial liabilities (8.9) (2.1)
Non-currentDerivative financial assets 20.1 8.5
Derivative financial liabilities (2.5) (13.4)
The derivative financial assets and liabilities represent the fair value of the external and intra-group foreign exchange contracts,cross currency swaps, interest rate swap and cross currency interest rate swaps which are accounted for as fair value throughprofit and loss.
Cross currency swapsThe fair value is based on a discounted cash flow model and market interest yield curves applicable and represents movements inthe Euro/US$ foreign exchange spot rate and in Euro and US$ interest rate yields. The cross currency swaps are synthetically splitto reflect the Company’s functional currency of Sterling. The US$/Sterling legs of the swaps are designated and effective as cashflow hedges against the Company’s US$ loan notes. The Euro/Sterling legs of the swaps have been designated as fair valuethrough profit and loss.
Interest rate swapThe fair value is based on a discounted cash flow model and market interest yield curves applicable and represents unrecognisedmovements which the Company expects to realise as a result of lower or higher variable interest payments under the swapcompared with the fixed interest rate applicable on the underlying loan note. The interest rate swap is designated and effective asfair value hedge against changes in the fair value of the debt caused by changes in interest rates/risk. Movement in the fair value ofthe interest rate swap is taken to profit and loss where it offsets against similar but opposite movement in the fair value of the debtcaused by movement in interest rates.
Cross currency interest rate swapsThe fair value is based on a discounted cash flow model and market yield curves applicable and represents movements in theGBP/US$ foreign exchange spot rate and in GBP and US$ interest rate yields. Movements in the fair value of the cross currencyinterest rate swaps excluding the credit spread are taken to profit and loss where they offset against opposite movements in the fairvalue of the US$ loan notes caused by changes in interest rates and foreign exchange spot rates. Movements in the fair value of thecross currency interest rate swaps relating to the credit spread are taken to reserves and released to the profit and loss when theunderlying portion of US loan notes interest is recognised in profit and loss.
Details of the fair value of the Company’s derivative financial instruments are set out in note 20 of the Group’s financial statements.
NOTES TO THE COMPANY’S FINANCIAL STATEMENTSFor the year ended 31 December 2011
(continued)
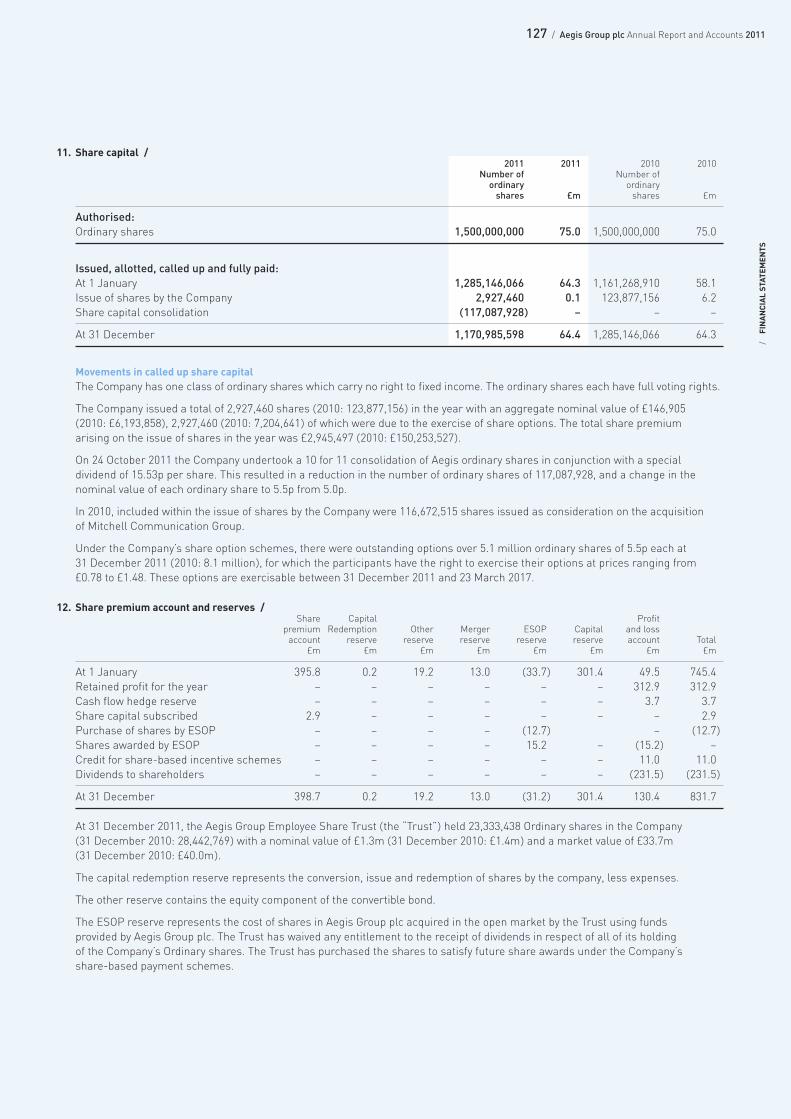
127 / Aegis Group plc Annual Report and Accounts 2011
/FINANCIAL STATEM
ENTS
11. Share capital / 2011 2011 2010 2010
Number of Number of ordinary ordinaryshares £m shares £m
Authorised:Ordinary shares 1,500,000,000 75.0 1,500,000,000 75.0
Issued, allotted, called up and fully paid:At 1 January 1,285,146,066 64.3 1,161,268,910 58.1Issue of shares by the Company 2,927,460 0.1 123,877,156 6.2 Share capital consolidation (117,087,928) – – –
At 31 December 1,170,985,598 64.4 1,285,146,066 64.3
Movements in called up share capitalThe Company has one class of ordinary shares which carry no right to fixed income. The ordinary shares each have full voting rights.
The Company issued a total of 2,927,460 shares (2010: 123,877,156) in the year with an aggregate nominal value of £146,905 (2010: £6,193,858), 2,927,460 (2010: 7,204,641) of which were due to the exercise of share options. The total share premium arising on the issue of shares in the year was £2,945,497 (2010: £150,253,527).
On 24 October 2011 the Company undertook a 10 for 11 consolidation of Aegis ordinary shares in conjunction with a specialdividend of 15.53p per share. This resulted in a reduction in the number of ordinary shares of 117,087,928, and a change in thenominal value of each ordinary share to 5.5p from 5.0p.
In 2010, included within the issue of shares by the Company were 116,672,515 shares issued as consideration on the acquisition of Mitchell Communication Group.
Under the Company’s share option schemes, there were outstanding options over 5.1 million ordinary shares of 5.5p each at 31 December 2011 (2010: 8.1 million), for which the participants have the right to exercise their options at prices ranging from£0.78 to £1.48. These options are exercisable between 31 December 2011 and 23 March 2017.
12. Share premium account and reserves /Share Capital Profit
premium Redemption Other Merger ESOP Capital and lossaccount reserve reserve reserve reserve reserve account Total
£m £m £m £m £m £m £m £m
At 1 January 395.8 0.2 19.2 13.0 (33.7) 301.4 49.5 745.4 Retained profit for the year – – – – – – 312.9 312.9 Cash flow hedge reserve – – – – – – 3.7 3.7Share capital subscribed 2.9 – – – – – – 2.9 Purchase of shares by ESOP – – – – (12.7) – (12.7)Shares awarded by ESOP – – – – 15.2 – (15.2) –Credit for share-based incentive schemes – – – – – – 11.0 11.0 Dividends to shareholders – – – – – – (231.5) (231.5)
At 31 December 398.7 0.2 19.2 13.0 (31.2) 301.4 130.4 831.7
At 31 December 2011, the Aegis Group Employee Share Trust (the “Trust”) held 23,333,438 Ordinary shares in the Company(31 December 2010: 28,442,769) with a nominal value of £1.3m (31 December 2010: £1.4m) and a market value of £33.7m (31 December 2010: £40.0m).
The capital redemption reserve represents the conversion, issue and redemption of shares by the company, less expenses.
The other reserve contains the equity component of the convertible bond.
The ESOP reserve represents the cost of shares in Aegis Group plc acquired in the open market by the Trust using funds provided by Aegis Group plc. The Trust has waived any entitlement to the receipt of dividends in respect of all of its holding of the Company’s Ordinary shares. The Trust has purchased the shares to satisfy future share awards under the Company’s share-based payment schemes.
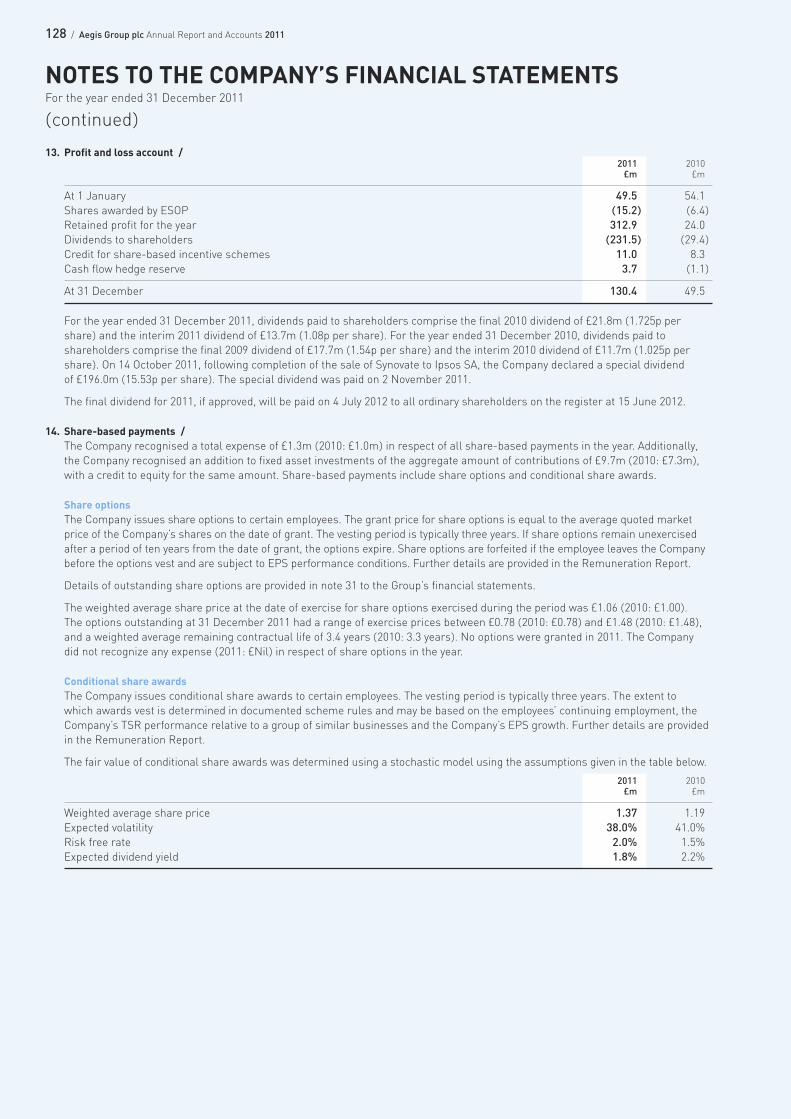
128 / Aegis Group plc Annual Report and Accounts 2011
13. Profit and loss account /2011 2010£m £m
At 1 January 49.5 54.1 Shares awarded by ESOP (15.2) (6.4)Retained profit for the year 312.9 24.0 Dividends to shareholders (231.5) (29.4)Credit for share-based incentive schemes 11.0 8.3 Cash flow hedge reserve 3.7 (1.1)
At 31 December 130.4 49.5
For the year ended 31 December 2011, dividends paid to shareholders comprise the final 2010 dividend of £21.8m (1.725p pershare) and the interim 2011 dividend of £13.7m (1.08p per share). For the year ended 31 December 2010, dividends paid toshareholders comprise the final 2009 dividend of £17.7m (1.54p per share) and the interim 2010 dividend of £11.7m (1.025p pershare). On 14 October 2011, following completion of the sale of Synovate to Ipsos SA, the Company declared a special dividend of £196.0m (15.53p per share). The special dividend was paid on 2 November 2011.
The final dividend for 2011, if approved, will be paid on 4 July 2012 to all ordinary shareholders on the register at 15 June 2012.
14. Share-based payments /The Company recognised a total expense of £1.3m (2010: £1.0m) in respect of all share-based payments in the year. Additionally,the Company recognised an addition to fixed asset investments of the aggregate amount of contributions of £9.7m (2010: £7.3m),with a credit to equity for the same amount. Share-based payments include share options and conditional share awards.
Share optionsThe Company issues share options to certain employees. The grant price for share options is equal to the average quoted marketprice of the Company’s shares on the date of grant. The vesting period is typically three years. If share options remain unexercisedafter a period of ten years from the date of grant, the options expire. Share options are forfeited if the employee leaves the Companybefore the options vest and are subject to EPS performance conditions. Further details are provided in the Remuneration Report.
Details of outstanding share options are provided in note 31 to the Group’s financial statements.
The weighted average share price at the date of exercise for share options exercised during the period was £1.06 (2010: £1.00). The options outstanding at 31 December 2011 had a range of exercise prices between £0.78 (2010: £0.78) and £1.48 (2010: £1.48),and a weighted average remaining contractual life of 3.4 years (2010: 3.3 years). No options were granted in 2011. The Company did not recognize any expense (2011: £Nil) in respect of share options in the year.
Conditional share awardsThe Company issues conditional share awards to certain employees. The vesting period is typically three years. The extent to which awards vest is determined in documented scheme rules and may be based on the employees’ continuing employment, theCompany’s TSR performance relative to a group of similar businesses and the Company’s EPS growth. Further details are providedin the Remuneration Report.
The fair value of conditional share awards was determined using a stochastic model using the assumptions given in the table below.
2011 2010£m £m
Weighted average share price 1.37 1.19Expected volatility 38.0% 41.0%Risk free rate 2.0% 1.5%Expected dividend yield 1.8% 2.2%
NOTES TO THE COMPANY’S FINANCIAL STATEMENTSFor the year ended 31 December 2011
(continued)

129 / Aegis Group plc Annual Report and Accounts 2011
/FINANCIAL STATEM
ENTS
15. Operating lease arrangements /At 31 December 2011, there were the following annual commitments in respect of non-cancellable operating leases:
2011 2010£m £m
Operating lease payments recognised in expense for the year 2.2 0.6
Operating leases that expireBetween two and five years 0.5 0.2After five years 1.8 0.3
2.3 0.5
16. Principal subsidiary and associated undertakings /All shareholdings are of ordinary shares.
All of the principal subsidiary and associated undertakings are disclosed below. To avoid a statement of excessive length, details ofinvestments which are not significant have been omitted.
Country of incorporation Effective interest in issuedand operation share capital at 31 Dec 2011
Principal subsidiary undertakingsAegis Media France S.A.S France 100%Aegis Media Iberia S.L. Spain 100%Aegis Media (Central Europe & Africa) GmbH Germany 100%Carat Nordic AB Sweden 100%Aegis Media Italia Srl Italy 100%Aegis Media Ltd England and Wales 100%Eaton Gate Inc US 100%Aegis Media Pacific Limited England and Wales 100%Aegis Australia Holdings Pty Ltd Australia 100%Aegis Finance (Guernsey) Limited Guernsey 100%
Principal associated undertakings
Charm Communications Inc China 15.8%
On 12 October 2011, the Group completed its disposal of the Synovate division to Ipsos S.A. As part of this transaction, Aegis Groupplc (Company) disposed of two subsidiaries: Synovate (Holdings) Ltd and Synovate Healthcare Ltd, for consideration of £127.5m,realising a gain on disposal of £102.5m (excluding transaction costs).