northwestern university feinberg school of medicine northwestern memorial hospital
TRANSCRIPT

Northwestern UniversityFeinberg School of Medicine
Northwestern Memorial Hospital
Eat Well, Live Well, Let’s Move!Eat Well, Live Well, Let’s Move!
Clyde W. Yancy, MD, MSc, FACC, FAHA, MACPMagerstadt Professor of Medicine
Chief of CardiologyNorthwestern University, Feinberg School of Medicine
&Associate Medical Director
Bluhm Cardiovascular InstituteChicago, IL
Quiz! How heart healthy are you?Quiz! How heart healthy are you?• Do you smoke?
• Is your weight over 200 lb or waist measurement > 34 inches (women) or 40 inches (men)?
• Do you consider shopping or watching football exercise?
• Do you believe chocolate or beer is a food group?
• A normal blood pressure is 145/95
• Your blood sugar should be ~ 150
• Your blood cholesterol level should be 50
TODAY’S MESSAGE:
PREVENTING HEART DISEASE?
IS IT POSSIBLE?• THE DISEASE
• Where we are
• Where we need to be
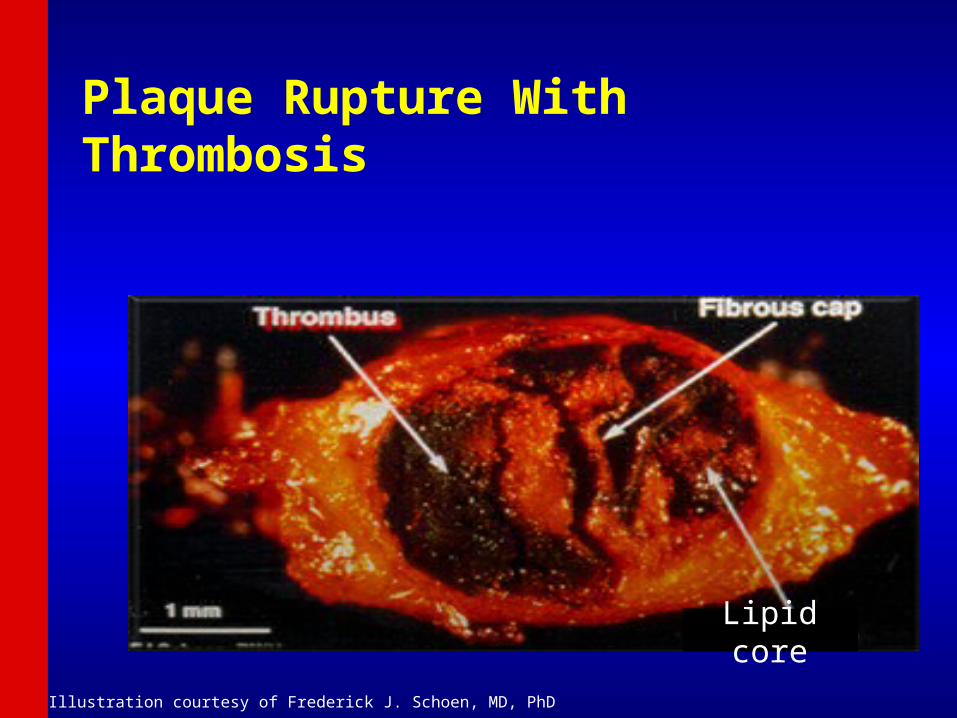
Plaque Rupture With Thrombosis
Lipid core
Illustration courtesy of Frederick J. Schoen, MD, PhD
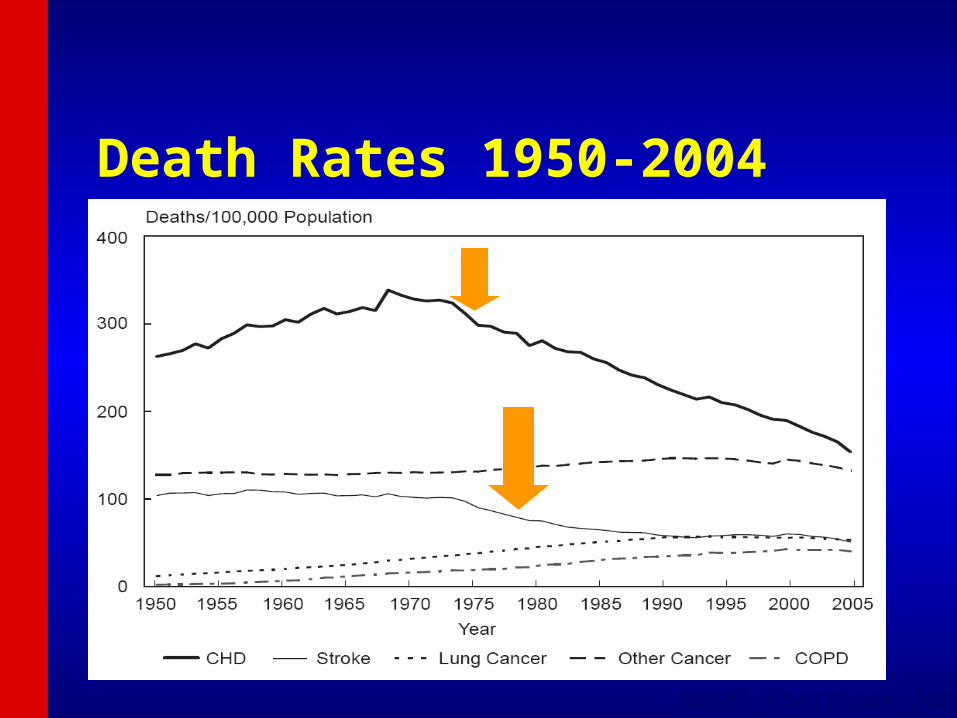
Death Rates 1950-2004
NHLBI Chartbook 2007
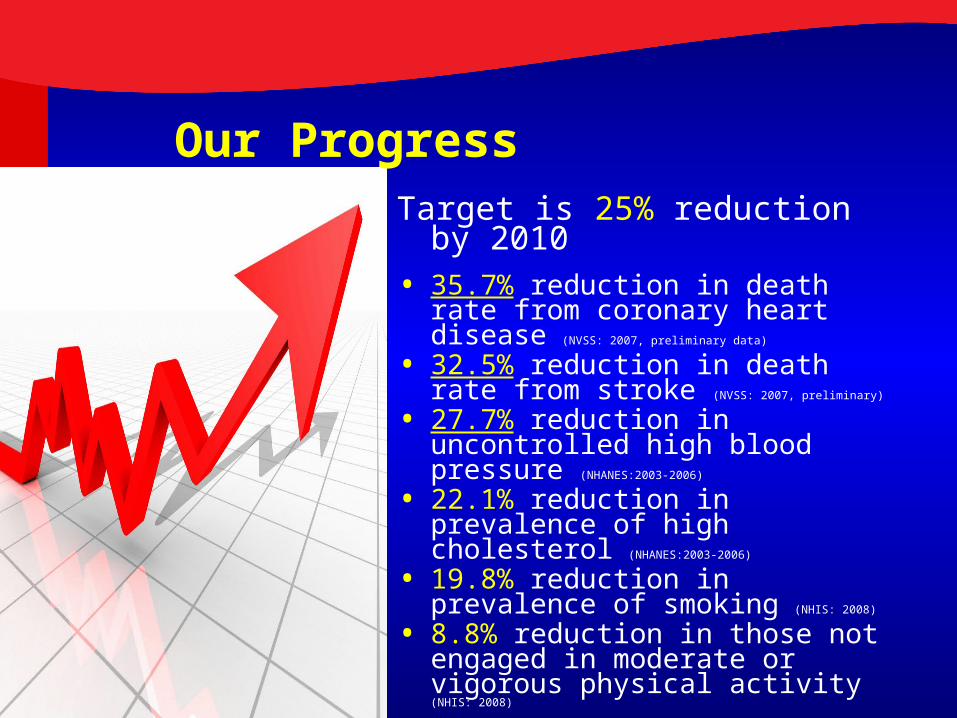
Our ProgressTarget is 25% reduction by 2010
• 35.7% reduction in death rate from coronary heart disease (NVSS: 2007, preliminary data)
• 32.5% reduction in death rate from stroke (NVSS: 2007, preliminary)
• 27.7% reduction in uncontrolled high blood pressure (NHANES:2003-2006)
• 22.1% reduction in prevalence of high cholesterol (NHANES:2003-2006)
• 19.8% reduction in prevalence of smoking (NHIS: 2008)
• 8.8% reduction in those not engaged in moderate or vigorous physical activity (NHIS: 2008)
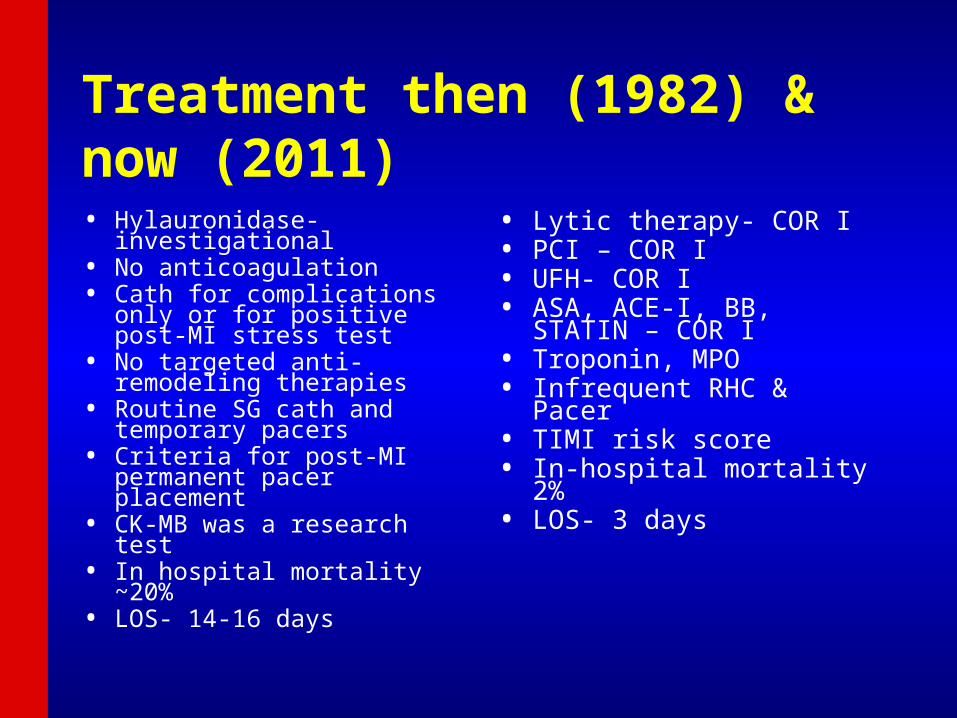
Treatment then (1982) & now (2011)• Hylauronidase-
investigational• No anticoagulation• Cath for complications only
or for positive post-MI stress test
• No targeted anti-remodeling therapies
• Routine SG cath and temporary pacers
• Criteria for post-MI permanent pacer placement
• CK-MB was a research test• In hospital mortality ~20%• LOS- 14-16 days
• Lytic therapy- COR I• PCI – COR I• UFH- COR I• ASA, ACE-I, BB, STATIN –
COR I• Troponin, MPO• Infrequent RHC & Pacer• TIMI risk score• In-hospital mortality 2%• LOS- 3 days

WHAT DOES THIS ALL COST?????
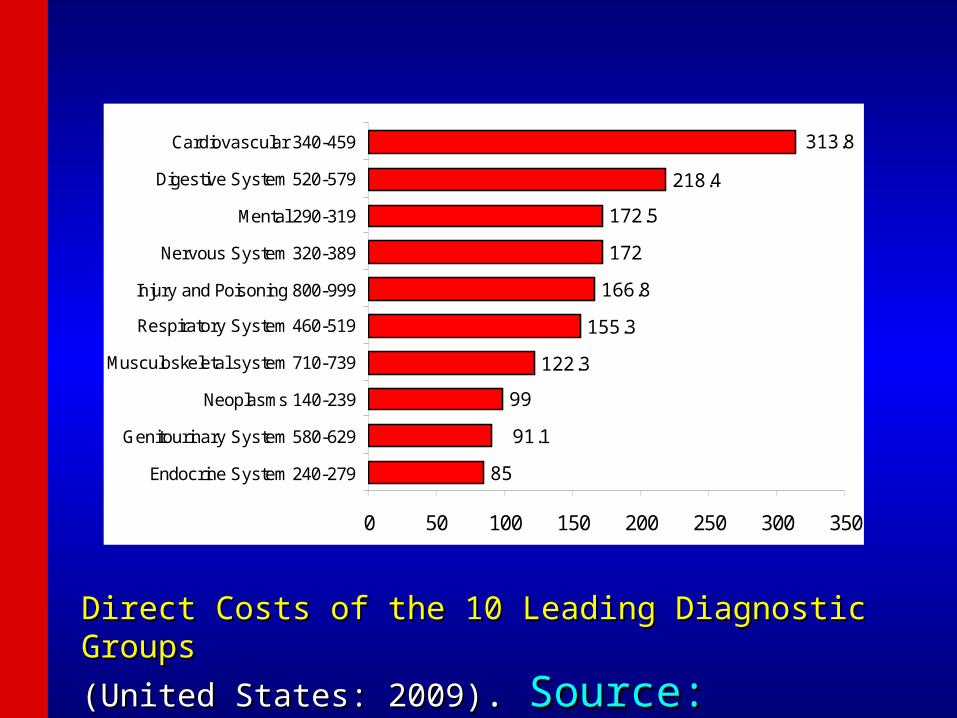
Direct Costs of the 10 Leading Diagnostic Groups Direct Costs of the 10 Leading Diagnostic Groups
(United States: 2009)(United States: 2009). . Source: NHLBI. Source: NHLBI.
85
99
122.3
155.3
166.8
172
172.5
218.4
91.1
313.8
0 50 100 150 200 250 300 350
Endocrine System 240-279
Genitourinary System 580-629
Neoplasms 140-239
Musculoskeletal system 710-739
Respiratory System 460-519
Injury and Poisoning 800-999
Nervous System 320-389
Mental 290-319
Digestive System 520-579
Cardiovascular 340-459
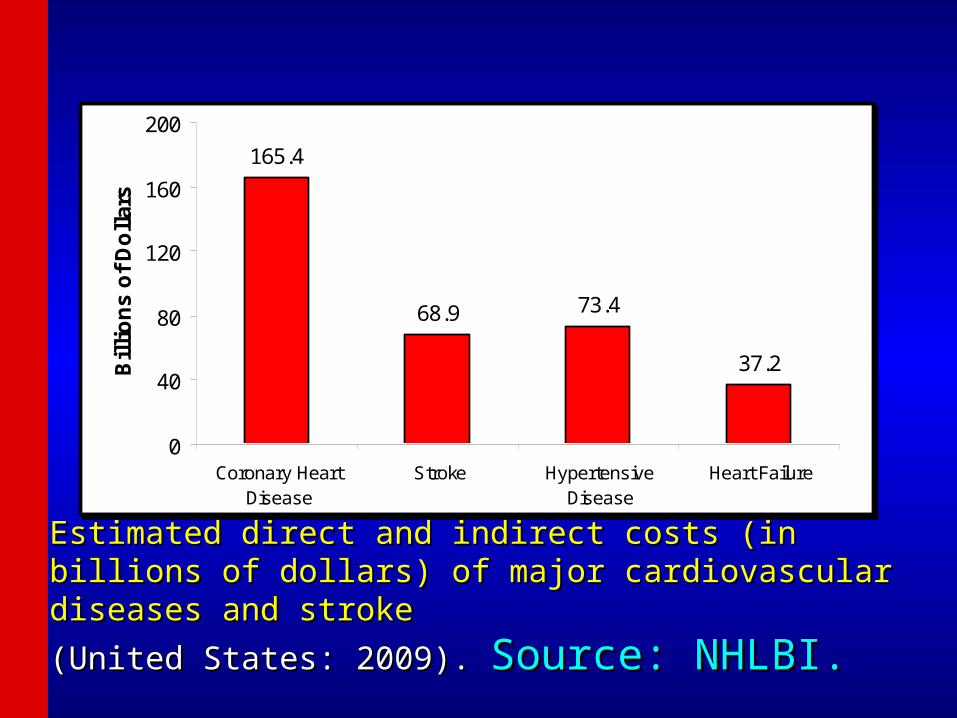
Estimated direct and indirect costs (in billions of dollars) of major Estimated direct and indirect costs (in billions of dollars) of major cardiovascular diseases and stroke cardiovascular diseases and stroke
(United States: 2009). (United States: 2009). Source: NHLBI.Source: NHLBI.
165.4
68.9 73.4
37.2
0
40
80
120
160
200
Coronary HeartDisease
Stroke HypertensiveDisease
Heart Failure
Bil
lio
ns
of
Do
llar
s
Instead of health care reform, what about “health reform”?
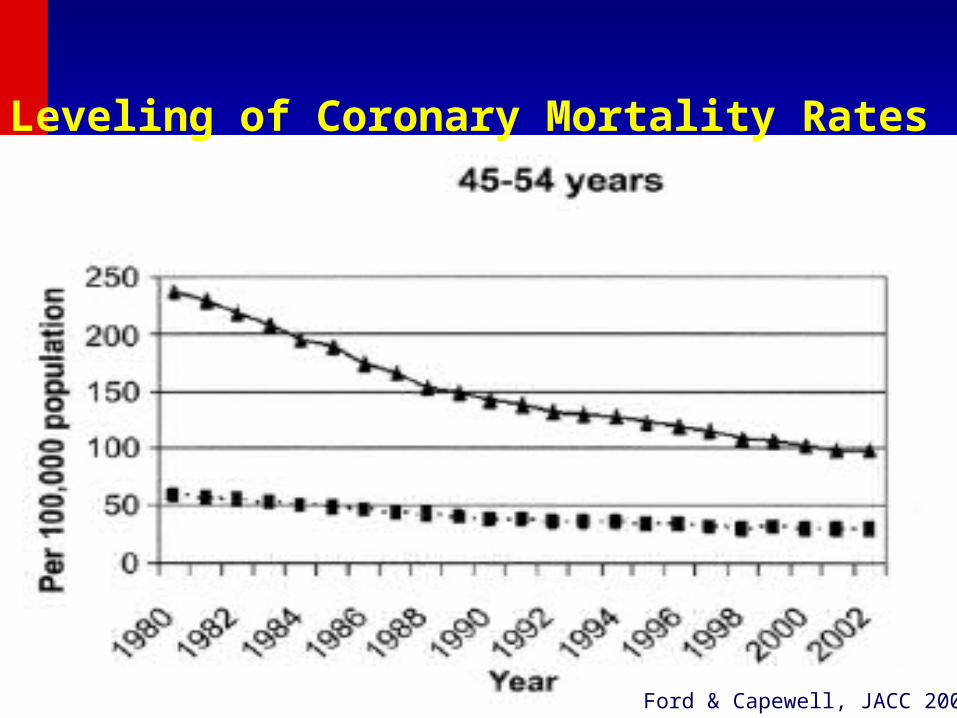
Leveling of Coronary Mortality Rates
Ford & Capewell, JACC 2007

We risk a generation of children who
may not outlive their parents…

Diet
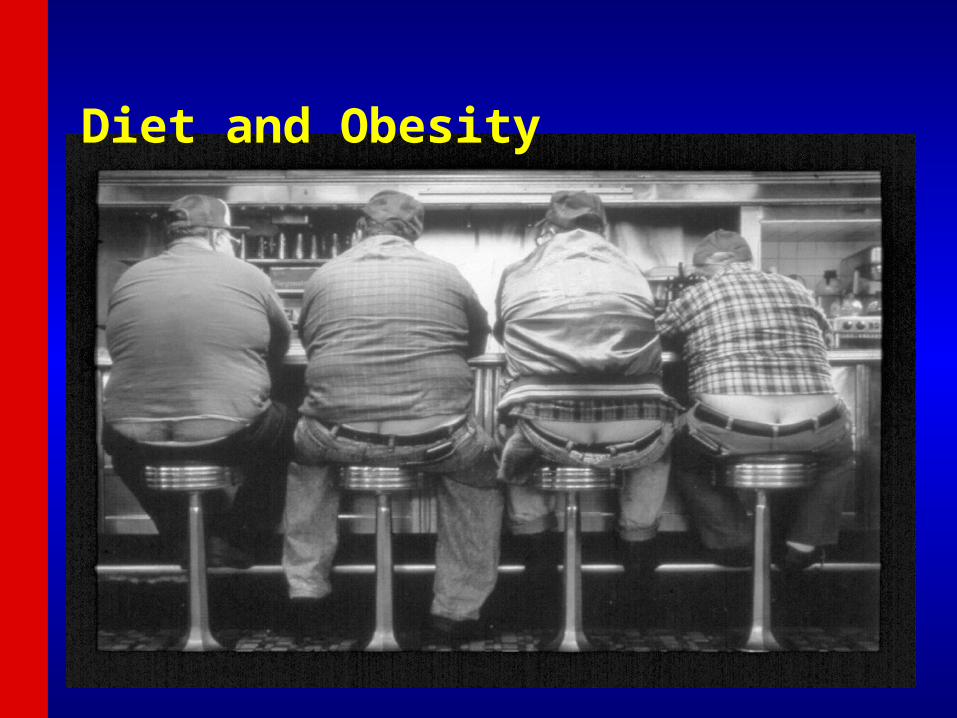
Diet and Obesity
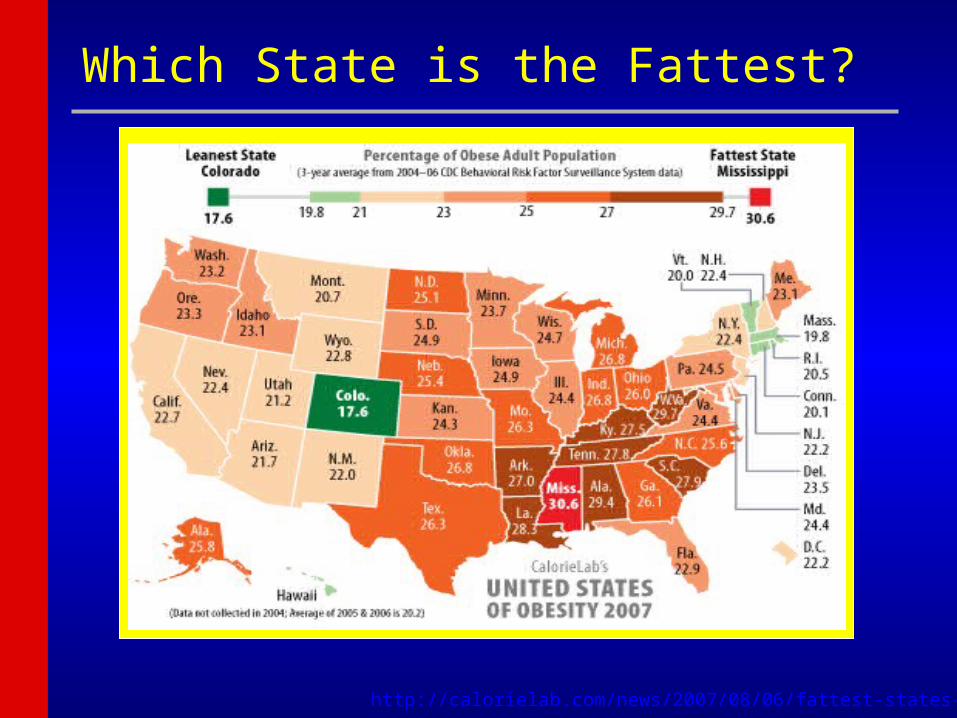
http://calorielab.com/news/2007/08/06/fattest-states-2007.
Which State is the Fattest?
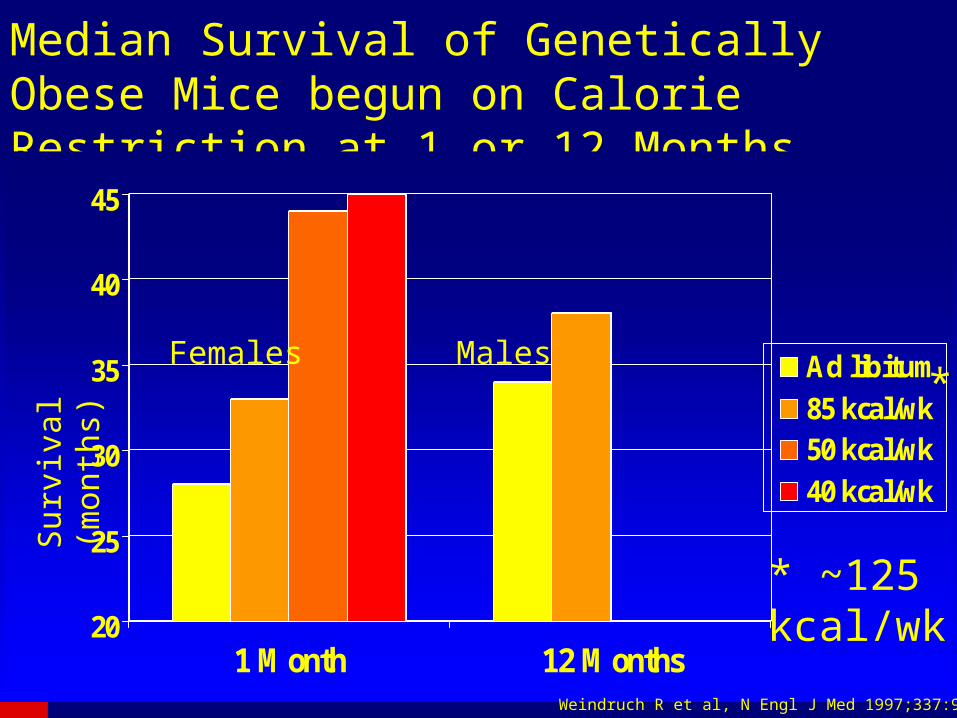
Median Survival of Genetically Obese Mice begun on Calorie Restriction at 1 or 12 Months
20
25
30
35
40
45
1 Month 12 Months
Ad libitum
85 kcal/wk50 kcal/wk
40 kcal/wk
*
* ~125 kcal/wk
Sur
viva
l (m
onth
s)
Females Males
Weindruch R et al, N Engl J Med 1997;337:986
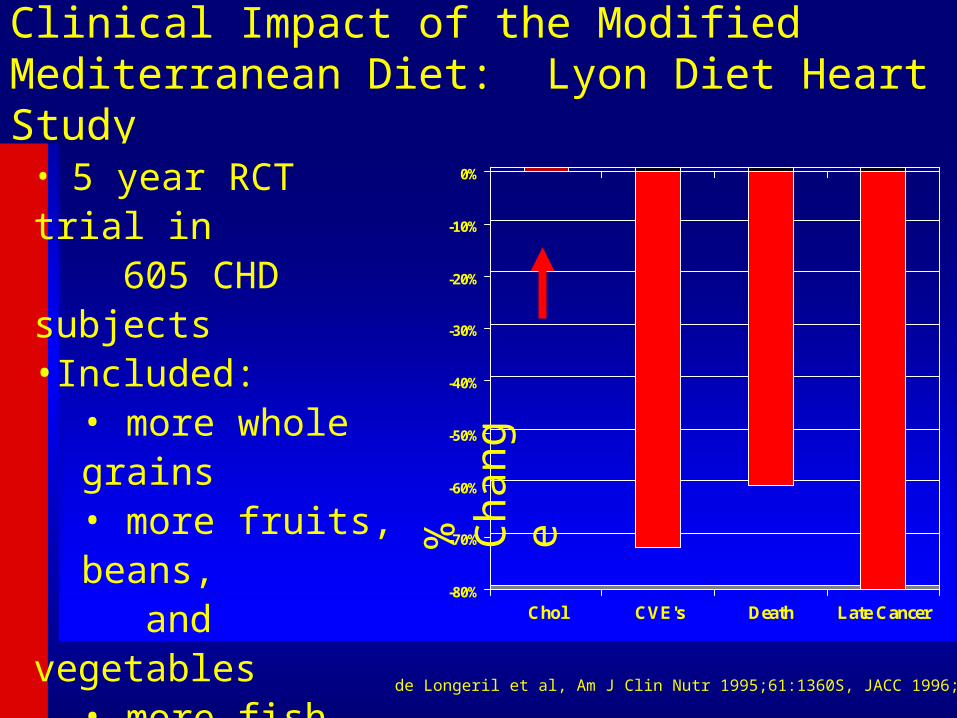
Clinical Impact of the Modified Mediterranean Diet: Lyon Diet Heart Study
-80%
-70%
-60%
-50%
-40%
-30%
-20%
-10%
0%
Chol CVE's Death Late Cancer
%
Cha
nge
• 5 year RCT trial in 605 CHD subjects•Included:
• more whole grains• more fruits, beans,
and vegetables• more fish • less meat• skim milk products• canola oil
de Longeril et al, Am J Clin Nutr 1995;61:1360S, JACC 1996;28:1103
Trans Fats
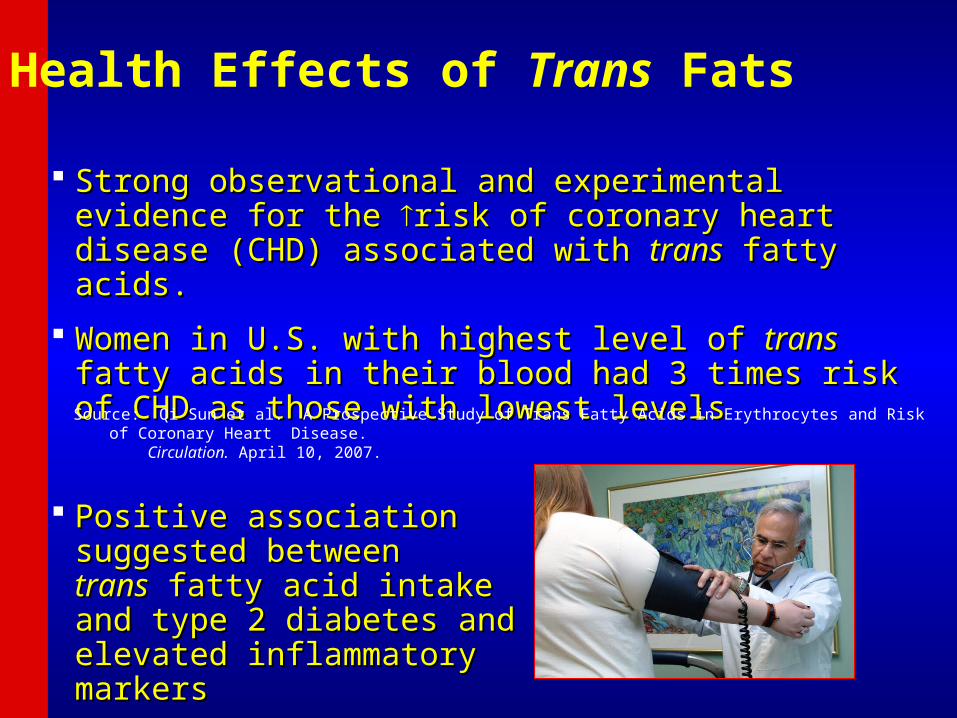
Health Effects of Trans Fats
Strong observational and experimental evidence for the Strong observational and experimental evidence for the risk of coronary heart disease (CHD) associated with risk of coronary heart disease (CHD) associated with transtrans fatty acids. fatty acids.
Women in U.S. with highest level of Women in U.S. with highest level of transtrans fatty acids in their fatty acids in their blood had 3 times risk of CHD as those with lowest levelsblood had 3 times risk of CHD as those with lowest levels
Positive association Positive association suggested between suggested between transtrans fatty acid intake fatty acid intake and type 2 diabetes and and type 2 diabetes and elevated inflammatory elevated inflammatory markers markers
Source: Qi Sun et al. A Prospective Study of Trans Fatty Acids in Erythrocytes and Risk of Coronary Heart Disease. Circulation. April 10, 2007.
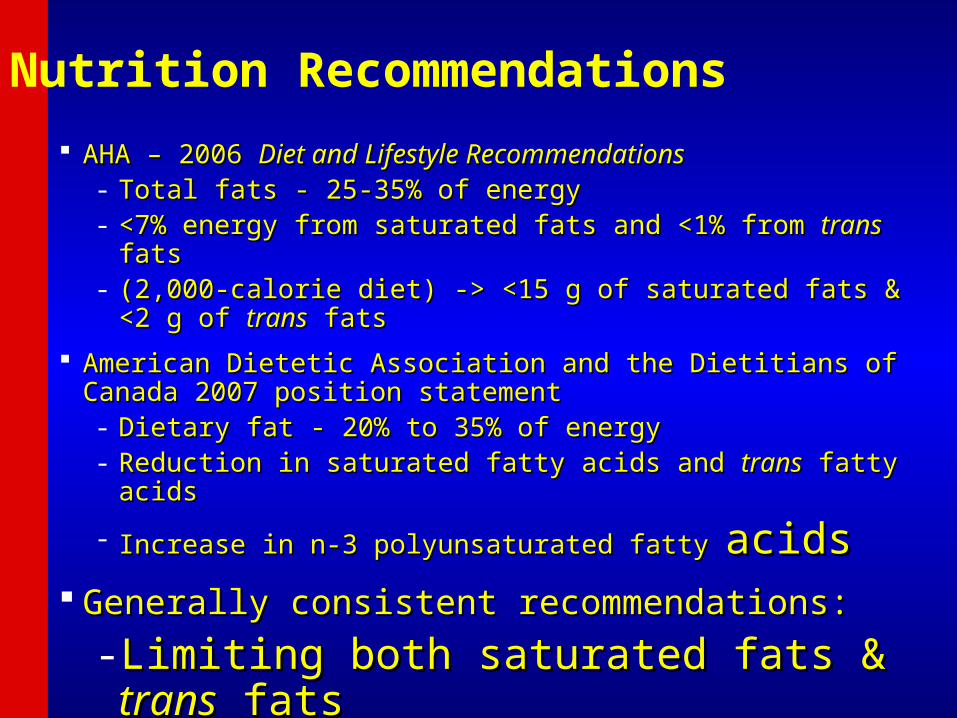
Nutrition Recommendations
AHA – 2006 AHA – 2006 Diet and Lifestyle RecommendationsDiet and Lifestyle Recommendations- Total fats - 25-35% of energyTotal fats - 25-35% of energy- <7% energy from saturated fats and <1% from <7% energy from saturated fats and <1% from transtrans fats fats- (2,000-calorie diet) -> <15 g of saturated fats & <2 g of (2,000-calorie diet) -> <15 g of saturated fats & <2 g of transtrans fats fats
American Dietetic Association and the Dietitians of Canada 2007 American Dietetic Association and the Dietitians of Canada 2007 position statementposition statement- Dietary fat - 20% to 35% of energyDietary fat - 20% to 35% of energy- Reduction in saturated fatty acids and Reduction in saturated fatty acids and transtrans fatty acids fatty acids
- Increase in n-3 polyunsaturated fatty Increase in n-3 polyunsaturated fatty acidsacids Generally consistent recommendations:Generally consistent recommendations:
- Limiting both saturated fats & Limiting both saturated fats & transtrans fats fats- Replacing them with monounsaturated Replacing them with monounsaturated
and/or polyunsaturated fatsand/or polyunsaturated fats

SodiumSodium
Copyright © 2010 Massachusetts Medical Society. All rights reserved. Published by Massachusetts Medical Society. 2
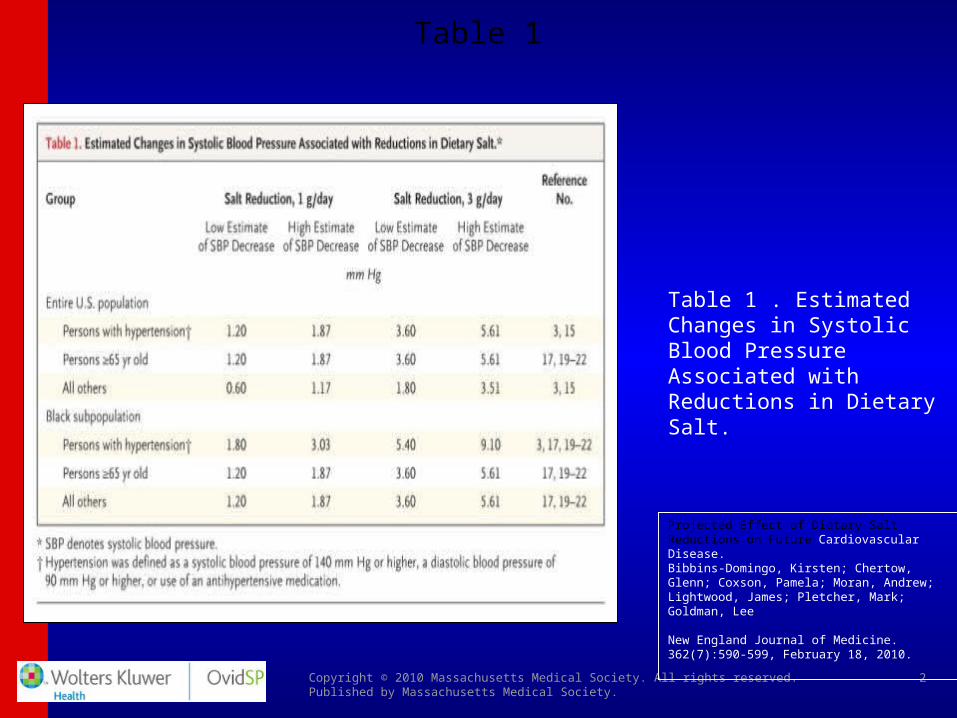
Table 1
Projected Effect of Dietary Salt Reductions on Future Cardiovascular Disease.Bibbins-Domingo, Kirsten; Chertow, Glenn; Coxson, Pamela; Moran, Andrew; Lightwood, James; Pletcher, Mark; Goldman, Lee
New England Journal of Medicine. 362(7):590-599, February 18, 2010.
Table 1 . Estimated Changes in Systolic Blood Pressure Associated with Reductions in Dietary Salt.
Copyright © 2010 Massachusetts Medical Society. All rights reserved. Published by Massachusetts Medical Society. 2
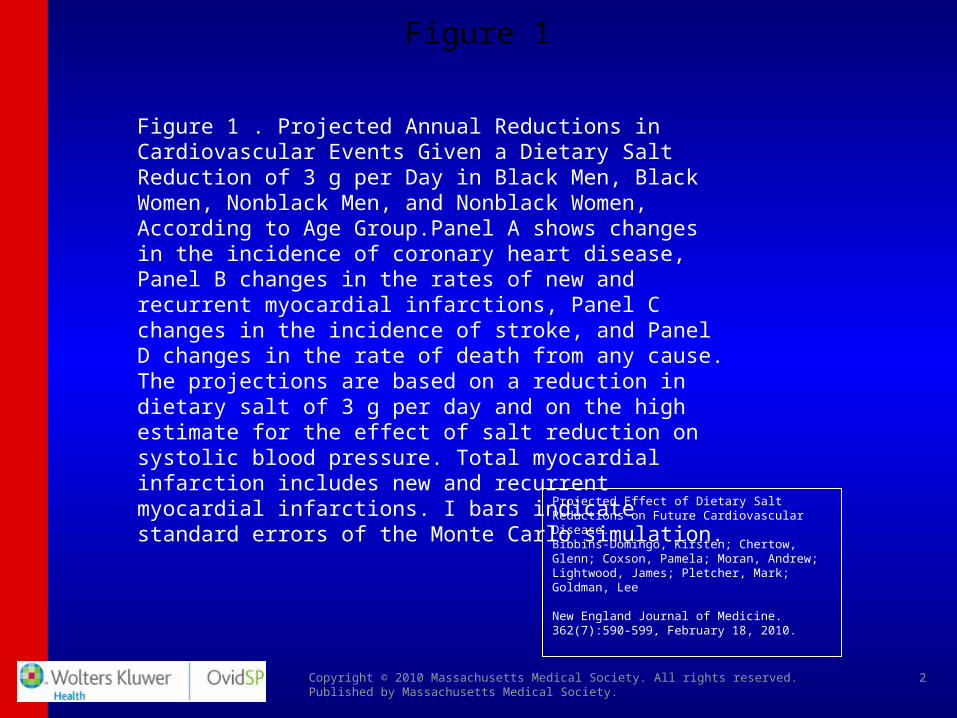
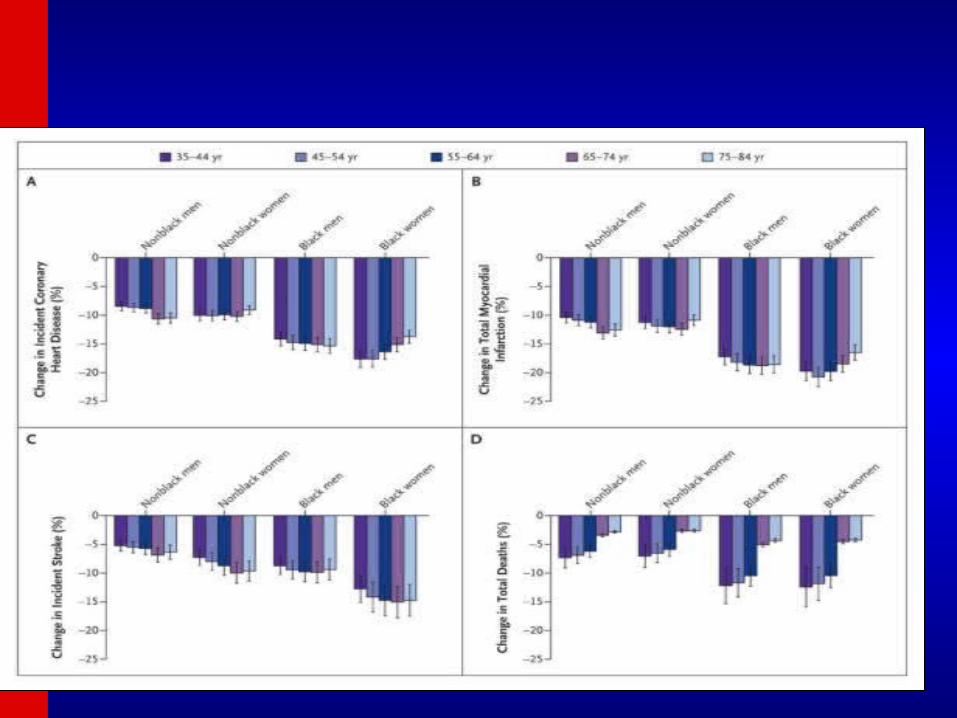
Figure 1
Projected Effect of Dietary Salt Reductions on Future Cardiovascular Disease.Bibbins-Domingo, Kirsten; Chertow, Glenn; Coxson, Pamela; Moran, Andrew; Lightwood, James; Pletcher, Mark; Goldman, Lee
New England Journal of Medicine. 362(7):590-599, February 18, 2010.
Figure 1 . Projected Annual Reductions in Cardiovascular Events Given a Dietary Salt Reduction of 3 g per Day in Black Men, Black Women, Nonblack Men, and Nonblack Women, According to Age Group.Panel A shows changes in the incidence of coronary heart disease, Panel B changes in the rates of new and recurrent myocardial infarctions, Panel C changes in the incidence of stroke, and Panel D changes in the rate of death from any cause. The projections are based on a reduction in dietary salt of 3 g per day and on the high estimate for the effect of salt reduction on systolic blood pressure. Total myocardial infarction includes new and recurrent myocardial infarctions. I bars indicate standard errors of the Monte Carlo simulation.

Exercise
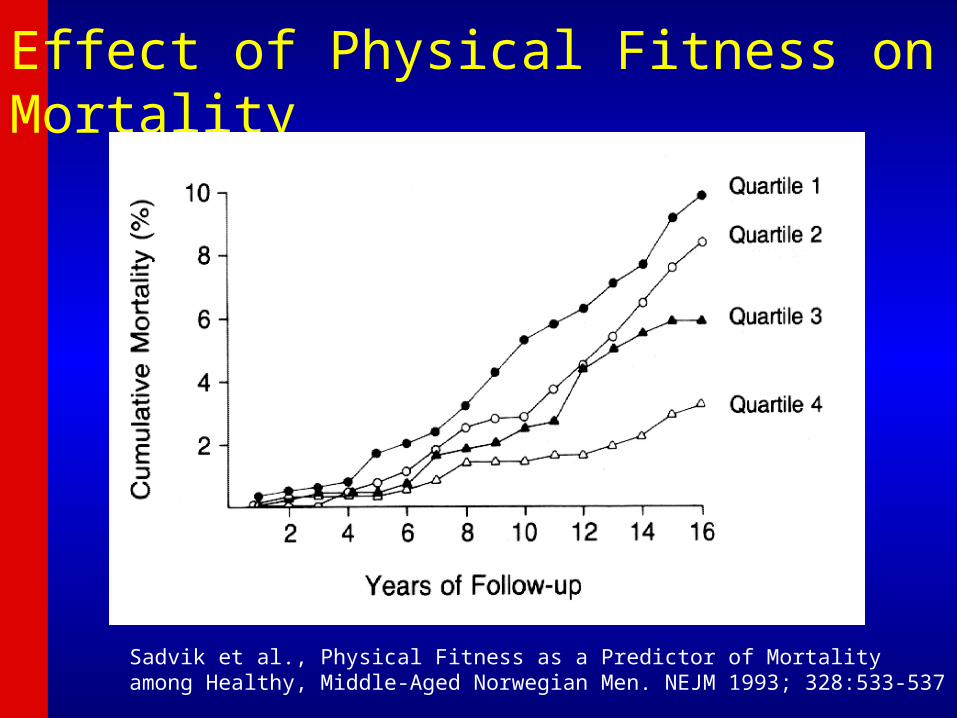
Effect of Physical Fitness on Mortality
Sadvik et al., Physical Fitness as a Predictor of Mortality among Healthy, Middle-Aged Norwegian Men. NEJM 1993; 328:533-537
Most fit
Least fit
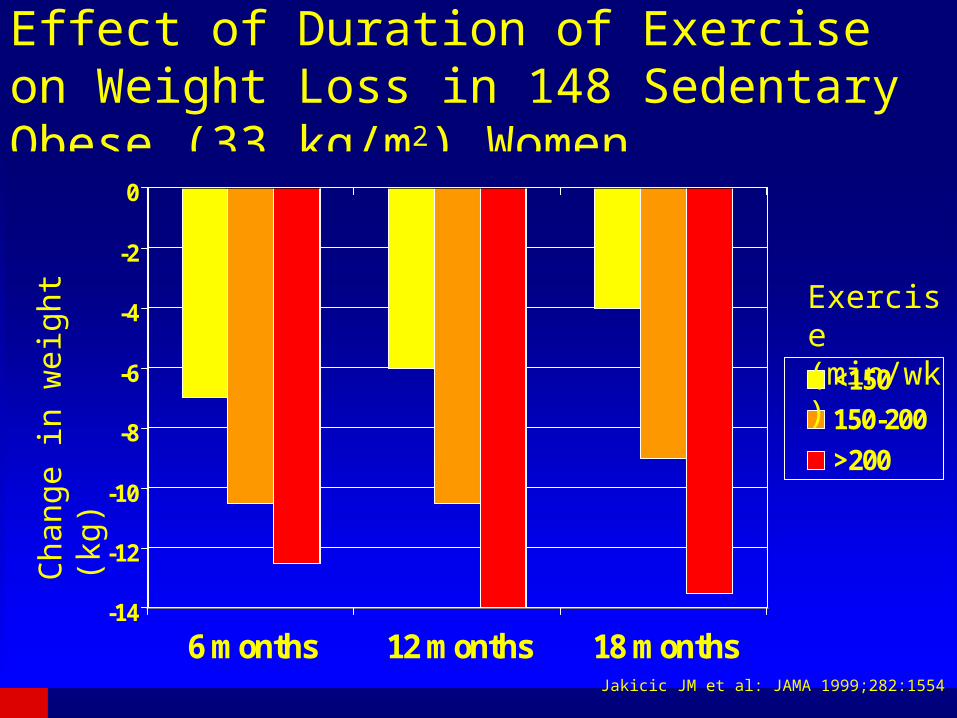
Effect of Duration of Exercise on Weight Loss in 148 Sedentary Obese (33 kg/m2) Women
-14
-12
-10
-8
-6
-4
-2
0
6 months 12 months 18 months
<150
150-200
>200
Exercise (min/wk)
Cha
nge
in w
eigh
t (kg
)
Jakicic JM et al: JAMA 1999;282:1554
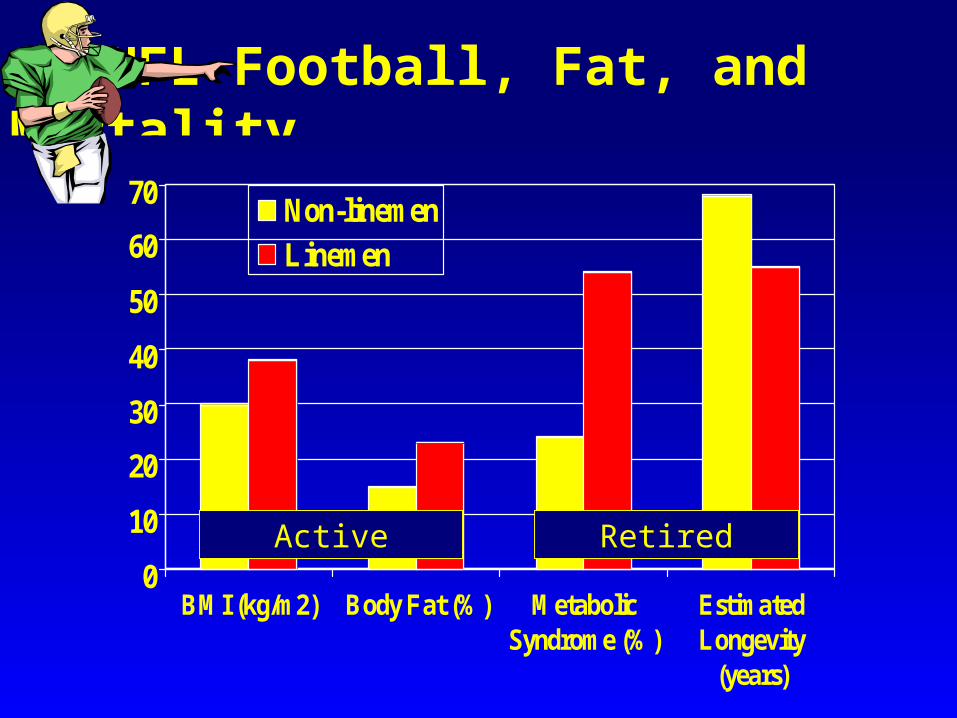
NFL Football, Fat, and Mortality
0
10
20
30
40
50
60
70
BMI (kg/m2) Body Fat (%) MetabolicSyndrome (%)
EstimatedLongevity
(years)
Non-linemenLinemen
Active Retired

Smoking Cessation
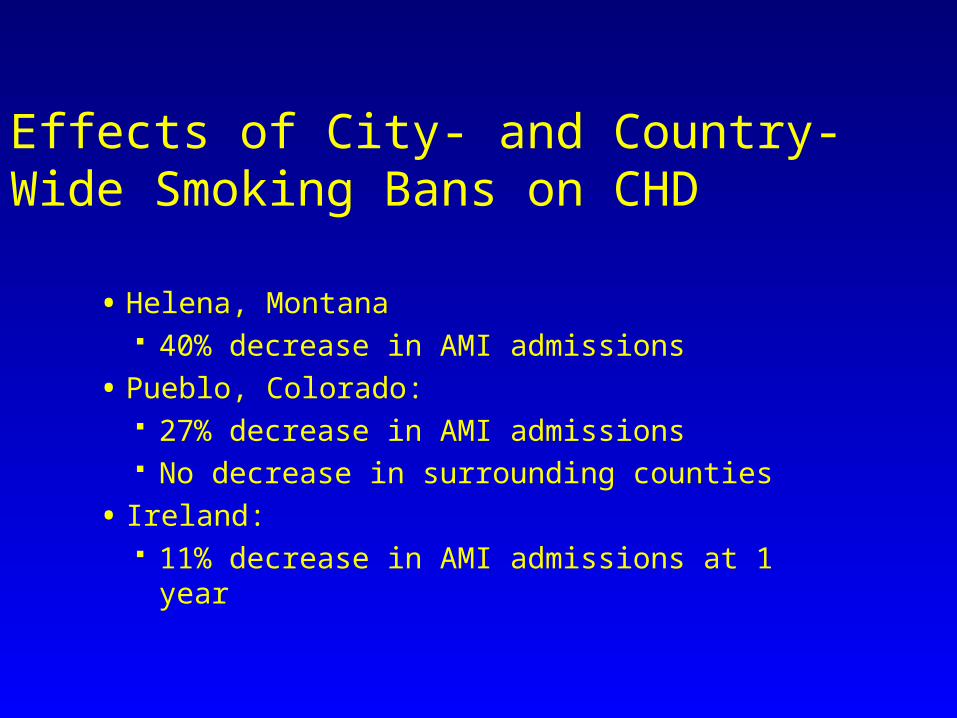
Effects of City- and Country-Wide Smoking Bans on CHD
• Helena, Montana 40% decrease in AMI admissions
• Pueblo, Colorado: 27% decrease in AMI admissions No decrease in surrounding counties
• Ireland: 11% decrease in AMI admissions at 1 year

THE FOUNTAIN OF YOUTHTHE FOUNTAIN OF YOUTH
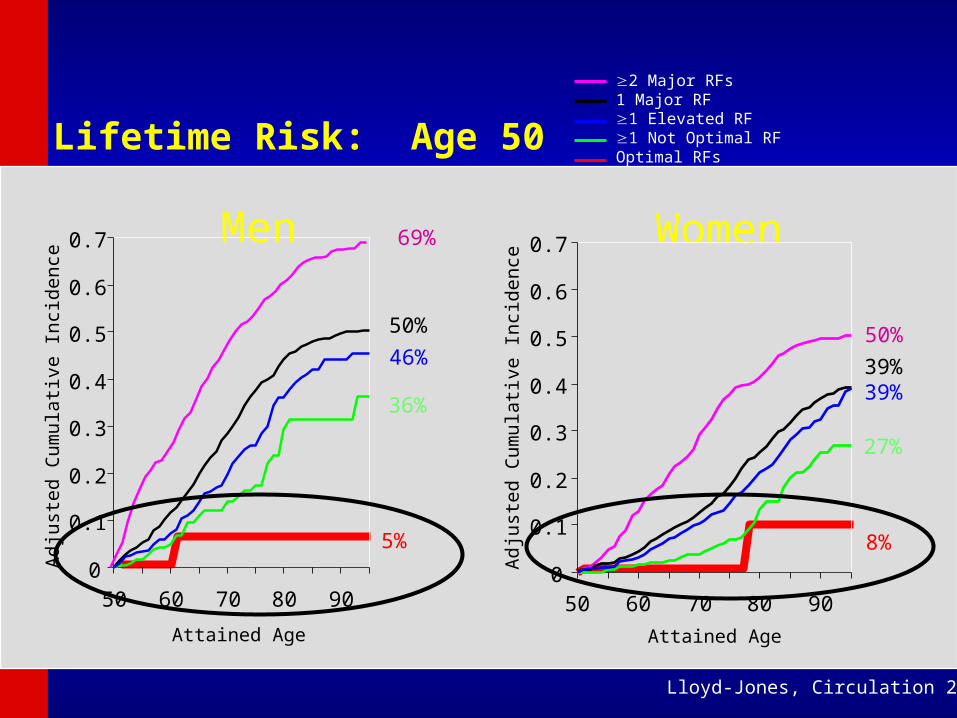
Lifetime Risk: Age 50
Lloyd-Jones, Circulation 2006
2 Major RFs1 Major RF1 Elevated RF1 Not Optimal RFOptimal RFs
Men
Attained Age
Ad
just
ed
Cu
mu
lati
ve I
nci
den
ce
5%
36%
50%
69%
46%
0
0.1
0.2
0.3
0.4
0.5
0.6
0.7
50 60 70 80 90
Attained Age
Women
8%
27%
50%
39%39%
Ad
just
ed
Cu
mu
lati
ve I
nci
den
ce
0
0.1
0.2
0.3
0.4
0.5
0.6
0.7
50 60 70 80 90
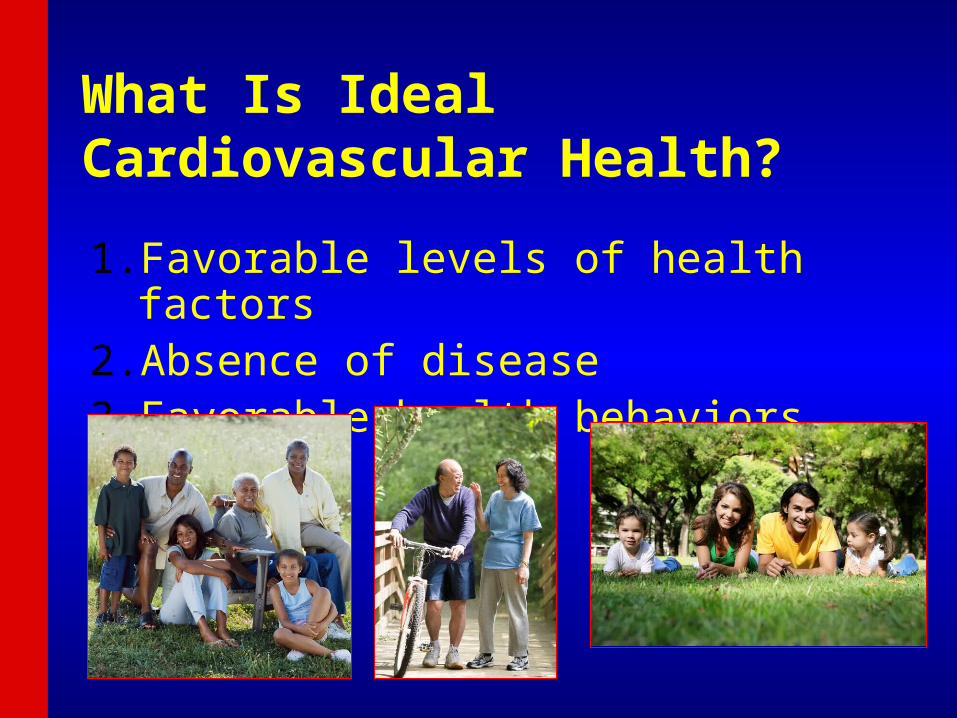
What Is Ideal Cardiovascular Health?
1. Favorable levels of health factors2. Absence of disease3. Favorable health behaviors
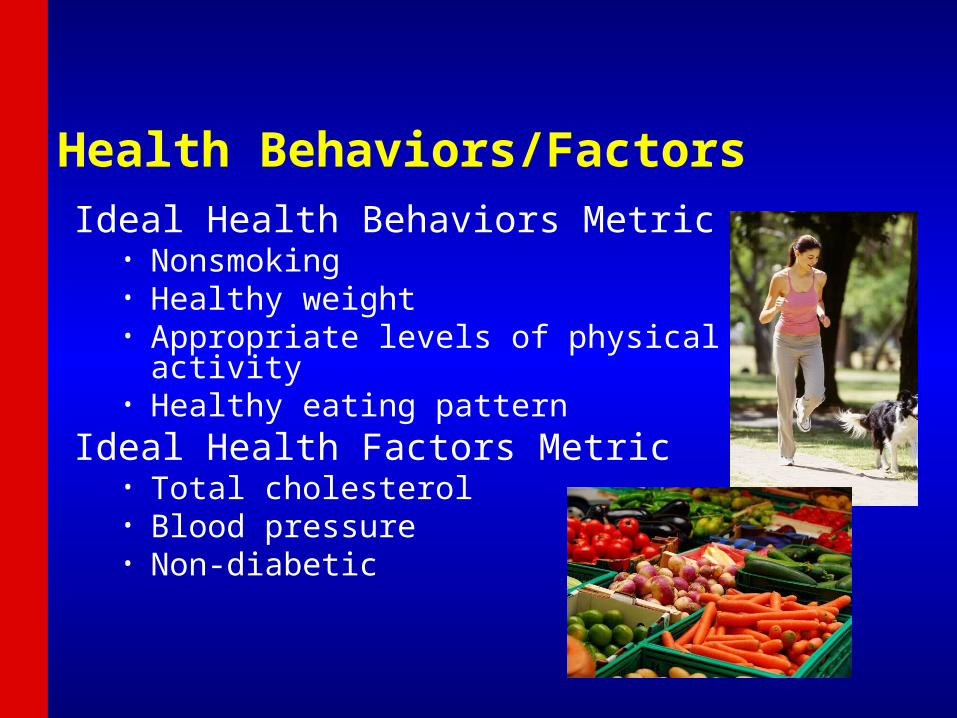
Health Behaviors/FactorsIdeal Health Behaviors Metric
• Nonsmoking• Healthy weight • Appropriate levels of physical activity • Healthy eating pattern
Ideal Health Factors Metric• Total cholesterol • Blood pressure• Non-diabetic
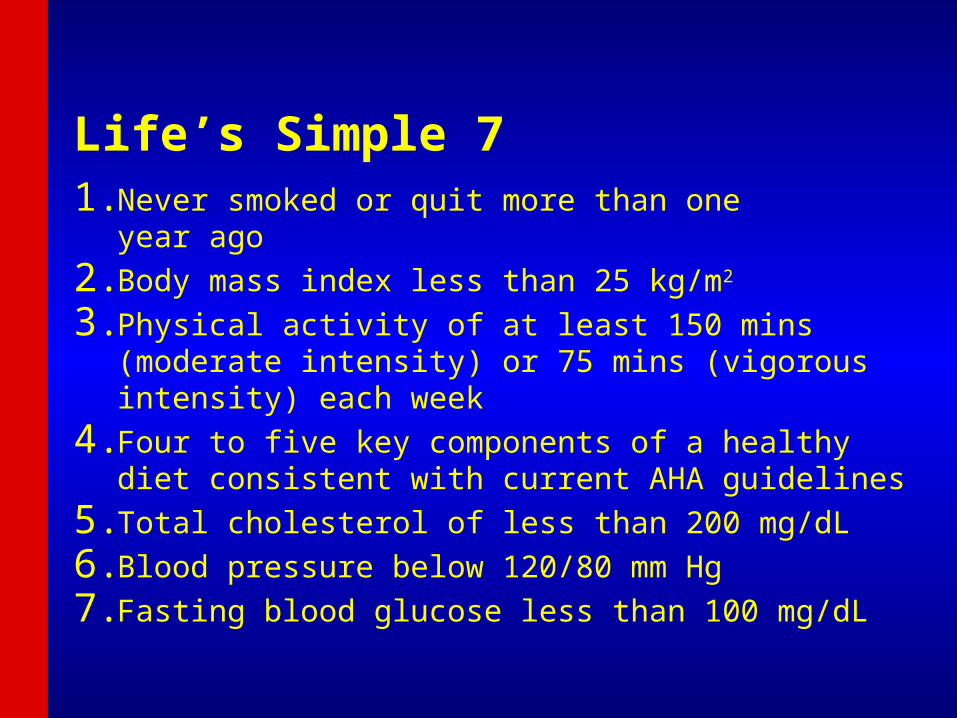
Life’s Simple 71. Never smoked or quit more than one
year ago
2. Body mass index less than 25 kg/m2
3. Physical activity of at least 150 mins (moderate intensity) or 75 mins (vigorous intensity) each week
4. Four to five key components of a healthy diet consistent with current AHA guidelines
5. Total cholesterol of less than 200 mg/dL
6. Blood pressure below 120/80 mm Hg
7. Fasting blood glucose less than 100 mg/dL
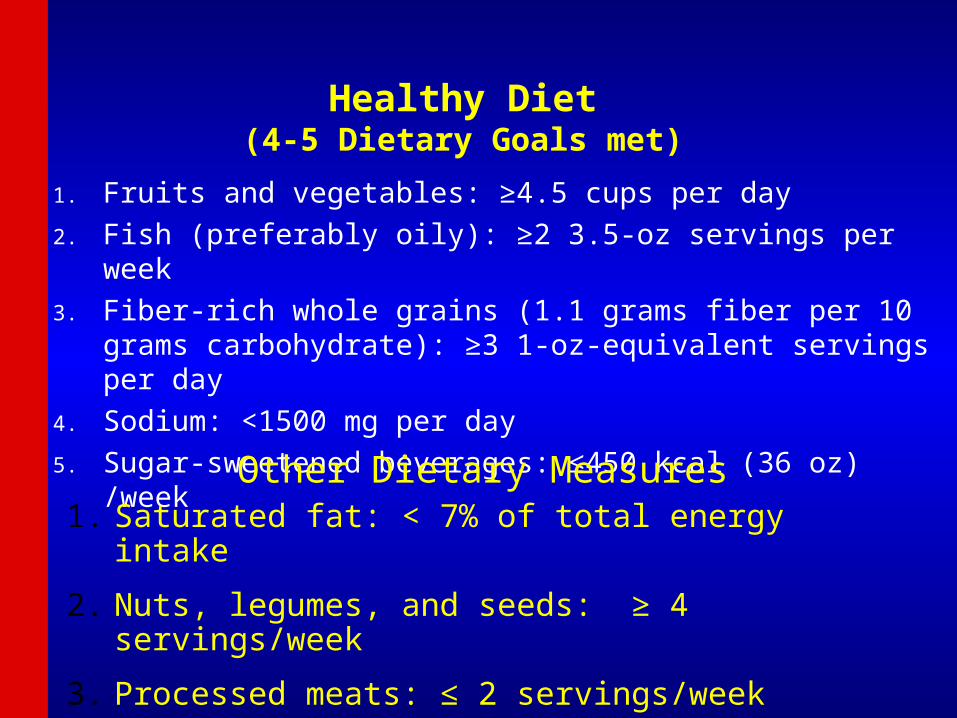
Healthy Diet(4-5 Dietary Goals met)
1. Fruits and vegetables: ≥4.5 cups per day
2. Fish (preferably oily): ≥2 3.5-oz servings per week
3. Fiber-rich whole grains (1.1 grams fiber per 10 grams carbohydrate): ≥3 1-oz-equivalent servings per day
4. Sodium: <1500 mg per day
5. Sugar-sweetened beverages: ≤450 kcal (36 oz) /week
Other Dietary Measures1. Saturated fat: < 7% of total energy intake
2. Nuts, legumes, and seeds: ≥ 4 servings/week
3. Processed meats: ≤ 2 servings/week
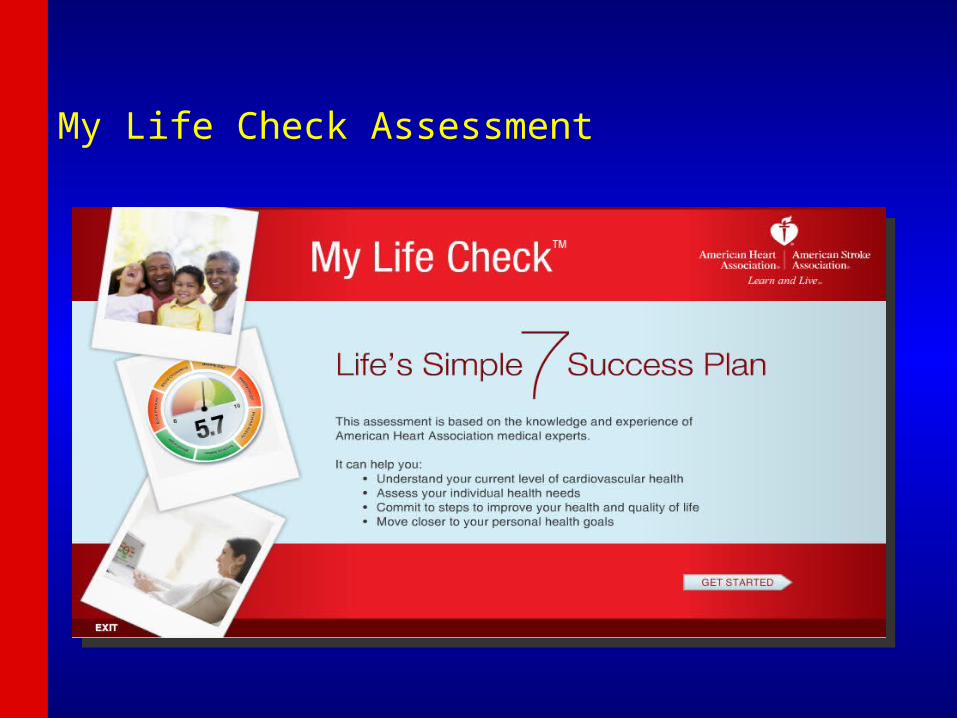
My Life Check Assessment
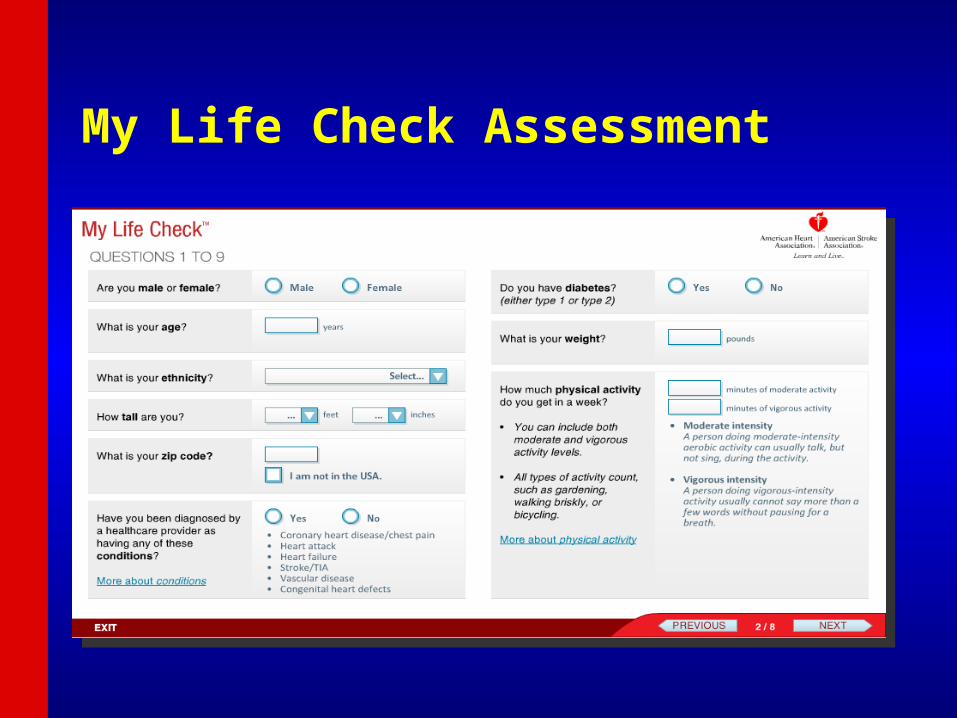
My Life Check Assessment
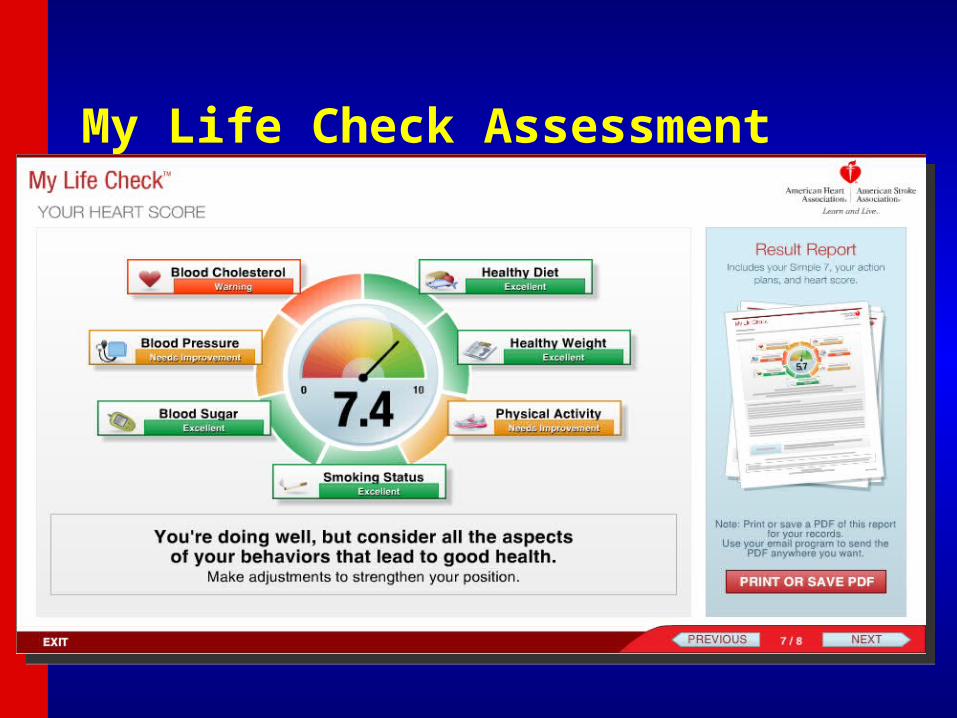
My Life Check Assessment
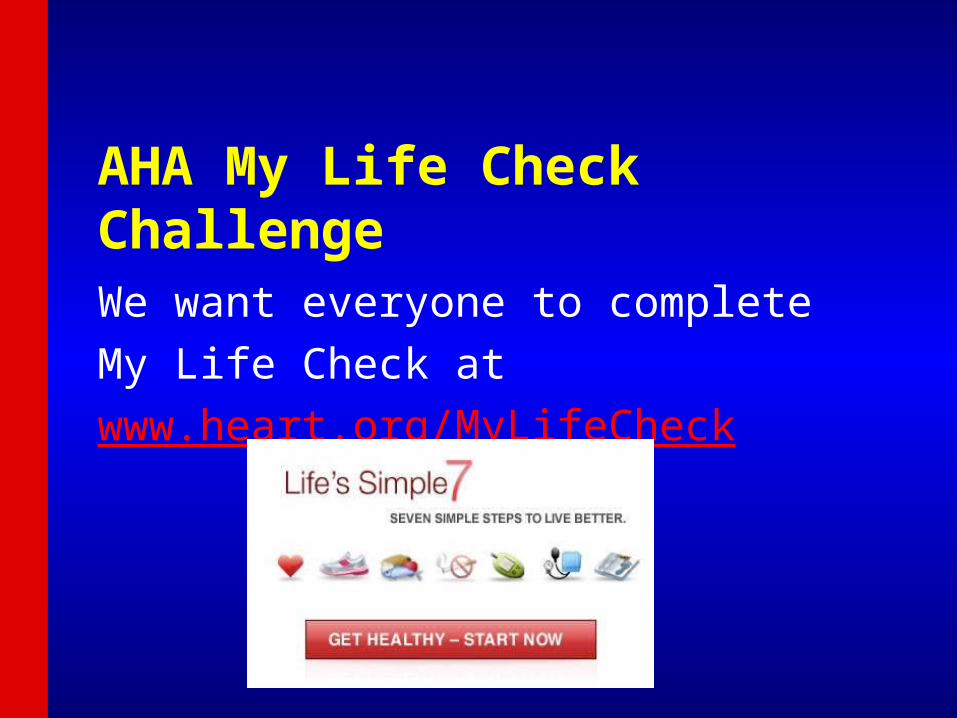
AHA My Life Check Challenge
We want everyone to complete
My Life Check at
www.heart.org/MyLifeCheck

“Be the change you wish to see in the world.”
M. Gandhi