northwestern medical center fiscal year...
TRANSCRIPT

1
NORTHWESTERN MEDICAL CENTER
FISCAL YEAR 2017 BUDGET
OVERVIEW As we continue to move closer to an alternative payment model environment in the State of Vermont, it is a challenge to balance the need for cost reduction with the need to invest in the infrastructure and resources to be successful in a fixed payment world which requires a focus on population health. While we continue on a day to day basis to identify and implement opportunities to reduce costs and find ways to do things more efficiently, these opportunities are becoming more challenging to find as we have already identified and implemented a number of improvements during recent years. Rating agencies for the health care industry also recognize that a lot of the low hanging fruit for cost reductions have already been harvested, and coupled with the reimbursement pressures hospitals face, the agencies continue to give hospitals a negative outlook. On a positive note, we have achieved some successes, which have resulted in cost reduction and service improvement initiatives list as follows:
• Renegotiated orthopedic implant contracts resulting in annualized savings of $340,000. • Re-Bid and finalized a new security services contract, resulting in improved overall
service provided by the outsourced company. Although this was not a cost savings initiative it greatly improved safety and security throughout the organization.
• Currently conducting LEAN exercises to identify and implement savings associated with standardizing care processes while reducing overall cost per case. The initial focus of these efforts will focus on Pulmonary Edema, COPD, Pneumonia and Septicemia.
• Achieved further reductions in avoidable visits in the Emergency Department exceeding goals for 2015 and YTD 2016. More information on the details of this initiative are later in this document.
• Addition of Tomosynthesis Unit in our Diagnostic Imaging department to provide best practice breast imaging technology. This has allowed us to diagnose cancers in earlier stages and initiate treatment plans sooner thereby supporting improved quality outcomes.
• The return of a Dermatology Practice to our community has been instrumental in alleviating significant access challenges for patients in our service area. There is already evidence of capturing early versus later stage melanomas.
• Implemented new low dose CT Scan protocols which will capture lung cancer cases earlier and reduce cost and improve outcomes
• Developed Transitions of Care Teams to improve timeliness of discharges, reduce length of stay and reduce readmission rates.
• Transitioned certain higher cost lab tests that were once performed offsite to our hospital lab, thereby reducing costs.
• Acquired Mousetrap Pediatrics and transitioned to Northwestern Pediatrics to stabilize access to essential primary pediatric services for our service area.

2
While we continue to work on cost reduction initiatives, we are also making investments in infrastructure and resources to position our organization to successfully operate in a global budget, value based environment. Examples of some of the investments we have either made over the past few years or plan to make in 2016 include:
• Adding a case manager to the ED and to two primary care offices to further decrease avoidable high utilizer ED visits. In 2015, we reduced ED avoidable visits by 7% against a target of 5%. As of May 2016, we are exceeding current targets by 18%.
• Expanding access to addiction medicine services by increasing the size and scope of our Northwestern Comprehensive Pain practice in response to demand and our most recent Community Needs Assessment. In addition we are working collaboratively with the Howard Center on a joint application to develop and implement a HUB.
• Started Urine Toxicology program to support our growing pain and addiction medicine services. This service substantially improves access and efficiency of services provided to patients.
• In August of 2016 Dr. Simon Shapiro will join the organization as an interventional pain specialist within our orthopedic practice. This is not a new service but replacing another physician who left the area.
• Expressed interest to participate in a risk based payment model with the newly forming Vermont Care Organization.
• Continuing to lead the regional clinical performance council to enhance local coordination of care and to create and implement standardized best clinical practice. This has evolved to the development of a Unified Community Collaborative (UCC) including the completion of a group charter, membership, governance structure and bylaws to set priorities and be prepared for alternative payments for population health.
• Continuing to implement software to provide clinical data analytics capabilities. This is being driven by the increased focus on data and outcomes as we move toward an all payor model for payment. A decision support team is now in place to lead this process.
• Increased evening hours in our primary care practices to support the needs of our patients after hours.
• Continue to meet on a regular basis with UVM Medical Center, and our local community partners to explore opportunities to integrate our work, reduce costs, increase quality, and ultimately improve the patient experience.
• Completed a new three year Community Needs Assessment and have integrated those priorities into our planning.
• Completed a strategic positioning process with the Board of Directors, Administrative Leadership, and Medical Leadership based on predictive analytics, internal and external interviews and national trends.
• Currently recruiting physicians in many clinical disciplines including, Primary Care, Pediatrics, ENT, Addiction Medicine and Radiology.
• To enhance NMC’s mission of providing exceptional care to our community, through our Five Star Caring…Always model we continue to advance the work we have done with the Studer Group. This has included the implementation of our advanced patient communications, interactions and customer service programs as well as our newly created Service Excellence Standards, which are driving improvement with our HCAHPS scores.

3
• Piloting a “Surgi Center Approach” at NMC which will convert a portion of our surgical suite into an ambulatory surgery center that will provide the same cost effective and time sensitive services that could be provided in a standalone center. This service will take advantage of existing capacity within our current facilities and leverage physician leadership to maximize efficiencies and clinical quality outcomes.
• Advanced RiseVT, the community collaborative focused on embracing healthy lifestyles,
improving quality of life, and long-term, reducing health care costs through primary
prevention. As of the program’s first anniversary on June 1, RiseVT had engaged over
12,000 individuals, 44 businesses, 15 schools, and 9 municipalities.
• Engaged EPODE, an international organization with proven expertise in reducing
childhood obesity, to do a comprehensive review of the RiseVT initiative. Our efforts, as
the EPODE visitors presented to the Green Mountain Care Board, scored very highly
compared to other programs worldwide. We continue to work with EPODE to align with
their methodology to help ensure best-practice and pursue sustainability and scalability
relating to RiseVT. The work is both at a local and state level to integrate primary
prevention as a key strategy to long term goals to bend the cost curve.
• Incorporated the proven Complete Health Improvement Program (CHIP) curriculum into
our Lifestyle Medicine Clinic (an intensive therapeutic lifestyle change program). We
have piloted this clinic with a group of NMC employees and are currently working
through four additional pilots – two focused on entry level workers at local employers
(including Vermont Precision Tools and Mylan) and two focused on individuals with
Medicaid from our Primary Care practices key to the budget reconsideration by the
GMCB.
• Engaged WellCoaches in an evidence based program to come to Vermont and train a
group of NMC staff members and community health and fitness professionals to be
certified health coaches. We are now engaging these coaches in supporting the
‘graduates’ of our CHIP clinic to help them sustain their gains and one is active within
RiseVT to enhance the services available to their participants. They also represent a new
resource for general use in our community with a shared knowledge base, language, and
approach spread across organizations and settings. This is the evolution of coaching a
village.
• Continued investment in tobacco prevention. We are particularly proud of the work done
by school children in Enosburg who successfully advocated for changes in how Vermont
regulates e-Cigarettes. Adult smoking rates continue to decline in our service area and
are now below the State average.
• Within the Healthy Roots program, created a gleaning initiative with farmers’ markets
that prevents foods from going to waste and gets them to charitable food sites for
consumption by our most vulnerable populations. We have engaged 5 additional schools
in ‘farm to school’ efforts.
• Embedded Mental Health Counselors in our Emergency Department in partnership with Northwest Counseling and Support Services (NCSS).
4
• Awarded a $400k grant to implement SBIRT (Screening, Brief Intervention and Referral to Treatment) processes in our Emergency Department to support mental health and substance abuse care.
• Embedded two new RN Care Managers in our Primary Care offices (Northwest Primary Care and Georgia Health Care) to support population health initiatives and transitions of care.
• Recently received the national designation of being a “Baby Friendly” organization. We are only the second hospital in the state of Vermont to receive this designation.
We are also working to enhance the patient experience at NMC. Despite earning several awards from Avatar over the last few years, including Best Overall Performer, we are not resting on our laurels, and have made a commitment to invest in, learn and implement a Studer culture of excellence. This work will continue into 2017 and beyond as this is a multi-year journey to fully integrate the Studer concepts into our culture. Our targeted measure results are improving as we hardwire this philosophy. Our focus on the areas described above is complicated by a challenging 2017 budget year that continues to focus on capping net patient revenue growth. In the 2016 budget process, we proposed and implemented an 8.0% reduction in rates in order to address the excess in net patient revenue over the cap in 2014 and 2015. Although we continue to exceed the cap in 2016 much of that excess is being driven by our focus on providing access to quality physician specialties locally. Much of the focus of our budget and our strategic positioning is based on the importance of access to care which was evident in our community needs assessment. This document discusses the specifics of exactly where we stand with respect to the net revenue cap, how it impacts our 2017 budget, and in particular how improving access to quality physicians and services has impacted our net patient revenue growth.
THE 3% NET REVENUE CAP In 2013, as a means of controlling health care expenditures, the GMCB established a 3% limit on the increase in budgeted net patient revenue from year to year for Vermont hospitals for fiscal years 2014 through 2016. They have extended that same guidance to the 2017 budget process as well. There are small exceptions allowed for demonstrated investments in health care reform if approved by the GMCB. In addition, exceptions may be granted for net revenue associated with employing physicians that were true net adds to the organization (not just backfill of vacant existing positions). In our 2016 budget presentation process with the GMCB we proposed and were approved for a 10% reduction in our rates to address net patient revenue growth overages from the approved budget for both fiscal year 2014 and 2015. Based upon an innovative approach to population health we were grateful that the GMCB supported our request to retain 2.0% of those proposed cuts to continue to invest in population health and healthier community initiatives. This request was supported by outcome measures.

5
The GMCB has continued to have ongoing meetings over 2016 to review and focus on the handful of hospitals (including NMC) that exceeded their net revenue budget in 2014 and 2015 by more than the .5% threshold of variance that they have established. Many of these hospitals continue to experience overages in their 2016 YTD net patient revenue as well. A small group of hospitals, including NMC, have been working closely with staff members of the GMCB in evaluating a broader set of parameters that may be used, in addition to net patient revenue growth, to help the GMCB in their management of hospital growth. An important element of our net patient revenue growth over the last several years has been our continued emphasis on the importance of access to quality care locally. In 2012 we had five employed outpatient practices within NMC including; Orthopedics, Obstetrics and Gynecology, Primary Care, General Surgery and Ophthalmology. In 2012 those 5 services totaled net patient revenue of $7.2 Million. Over the next five years those disciplines were joined by six additional practices that are either provided by employed physicians or contracted physicians with part time hours. Those services include: Urology, Cardiology, Pulmonology, Comprehensive Pain, Dermatology and most recently Pediatrics. In 2017 these six service disciplines will generate $7.1 Million in net patient revenue. One of the most critical aspects of healthcare across the country is the importance of access to quality physicians and advanced practice providers in order to provide care, both primary preventative and specialty. Over the last five years we have invested a significant amount of time and energy to ensure appropriate recruitment and retention of our providers, so that the residents of Franklin and Grand Isle counties have access to quality physicians in as many disciplines as possible that are reasonable for a community hospital to provide. Our focus is wellness and prevention. This has been guided by our Community Needs Assessment and our Strategic Operating Plan. As a result of some progress in this area, “access to care and physicians” has actually improved within our Community Needs Assessment and is now a “priority” rather than a “top priority”. This is exactly the type of improvement one would hope to see within Vermont’s communities. At the same time the hospital has continued to grow but in aggregate well below the targeted 3% growth that has been established by the GMCB. The average net patient revenue growth in hospital services for the last 5 years has been 0.99%. The focus of the net patient revenue enforcement to date has not separated out the impact of access to primary and specialty physicians from hospital based services. The chart below much more clearly shows the impact of these services versus the growth in hospital revenue.

6
Net patient revenue is a complex item to budget. As a result, having our actual revenues not exceed budget by more than the GMCB limit of .5% is extremely difficult. For instance, our 2016 net patient revenue budget was approximately $96 million. Based on the State’s guidelines, we could only exceed this amount by $480,000 before we were deemed to be out of compliance. The various factors that can impact net patient revenues are: • Patient volumes • Payor mix • Reimbursement levels from Medicare, Medicaid, and insurance companies • Bad debt and charity write-offs Due to the number of factors that can impact net patient revenues, from a prudent business perspective, we budget net patient revenues with a level of conservatism to reduce the likelihood that we materially come in under our net revenue target. In addition to the growth in physician based services described above, there has been a significant change in an important part of our revenue cycle. As you all know, hospitals and in particular NMC, provide a significant amount of free care to its community. Much of this is done intentionally through policies designed to assist those who are unable to afford care.
FY2012 FY2013 FY2014 FY2015 FY2016 FY2017
Northwestern Orthopedics 3,323 4,049 4,036 4,421 5,020 5,007
Northwestern OB/GYN 1,367 1,946 2,287 2,403 2,520 2,438
Northwestern Georgia Health Center 990 1,165 1,314 1,527 1,656 1,481
Northwestern Primary Care 793 831 1,839 1,915 1,948 1,784
Northwestern Associates in Surgery 593 622 472 623 592 551
Northwestern Ophthalmology 150 621 805 1,021 1,038 1,094
Northwestern Urology - - 22 690 694 682
Northwestern Cardiology Services - - 373 498 584 645
Northwestern Pulmonology Services - - 132 207 186 192
Northwestern Comprehensive Pain - - 1,097 1,335 1,118 1,326
Northwestern Dermatology - - - - 798 1,207
Northwestern Pediatrics - - - - 1,704 3,080
Physician Practice Net Patient Revenue 7,216 9,234 12,377 14,640 17,858 19,487
28.0% 34.0% 18.3% 22.0% 9.1%
22.28%
Hospital Net Patient Revenue 77,740 78,040 78,921 81,949 80,704 81,586
0.4% 1.1% 3.8% -1.5% 1.1%
0.99%
Total Net Patient Revenue 84,956 87,274 91,298 96,589 98,562 101,073
Net Patient Revenue Growth 2.73% 4.61% 5.80% 2.04% 2.55%
Average Net Patient Revenue Growth 3.54%
7
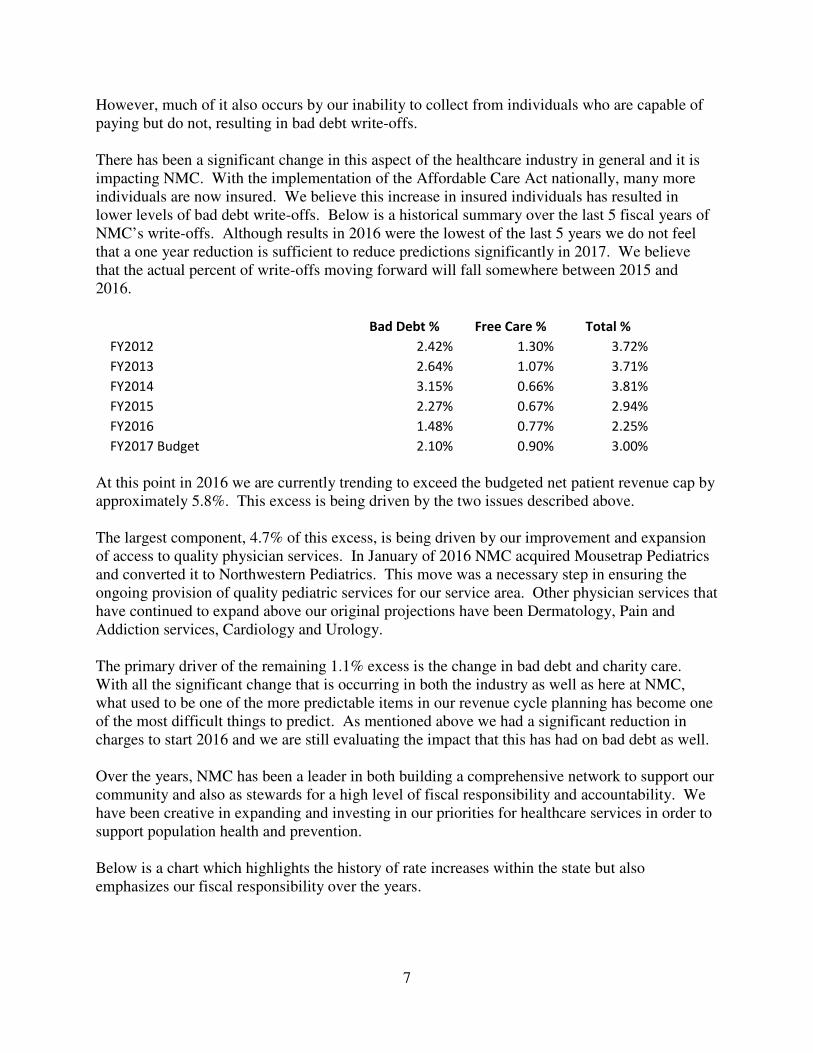
However, much of it also occurs by our inability to collect from individuals who are capable of paying but do not, resulting in bad debt write-offs. There has been a significant change in this aspect of the healthcare industry in general and it is impacting NMC. With the implementation of the Affordable Care Act nationally, many more individuals are now insured. We believe this increase in insured individuals has resulted in lower levels of bad debt write-offs. Below is a historical summary over the last 5 fiscal years of NMC’s write-offs. Although results in 2016 were the lowest of the last 5 years we do not feel that a one year reduction is sufficient to reduce predictions significantly in 2017. We believe that the actual percent of write-offs moving forward will fall somewhere between 2015 and 2016.
Bad Debt % Free Care % Total %
FY2012 2.42% 1.30% 3.72%
FY2013 2.64% 1.07% 3.71%
FY2014 3.15% 0.66% 3.81%
FY2015 2.27% 0.67% 2.94%
FY2016 1.48% 0.77% 2.25%
FY2017 Budget 2.10% 0.90% 3.00%
At this point in 2016 we are currently trending to exceed the budgeted net patient revenue cap by approximately 5.8%. This excess is being driven by the two issues described above. The largest component, 4.7% of this excess, is being driven by our improvement and expansion of access to quality physician services. In January of 2016 NMC acquired Mousetrap Pediatrics and converted it to Northwestern Pediatrics. This move was a necessary step in ensuring the ongoing provision of quality pediatric services for our service area. Other physician services that have continued to expand above our original projections have been Dermatology, Pain and Addiction services, Cardiology and Urology. The primary driver of the remaining 1.1% excess is the change in bad debt and charity care. With all the significant change that is occurring in both the industry as well as here at NMC, what used to be one of the more predictable items in our revenue cycle planning has become one of the most difficult things to predict. As mentioned above we had a significant reduction in charges to start 2016 and we are still evaluating the impact that this has had on bad debt as well. Over the years, NMC has been a leader in both building a comprehensive network to support our community and also as stewards for a high level of fiscal responsibility and accountability. We have been creative in expanding and investing in our priorities for healthcare services in order to support population health and prevention. Below is a chart which highlights the history of rate increases within the state but also emphasizes our fiscal responsibility over the years.

8
Total
Hospital Rate Increases 2011 2012 2013 2014 2015 2016 Since 2011
Rutland Regional Medical Center 5.5% 9.8% 10.3% 4.8% 8.40% 3.70% 42.50%
UVM Medical Center 5.7% 5.9% 9.4% 4.4% 7.80% 6.00% 39.20%
Grace Cottage Hospital 5.5% 10.6% 6.5% 6.0% 5.00% 5.00% 38.60%
Porter Medical Center 6.5% 10.3% 5.0% 6.0% 5.00% 5.30% 38.10%
Gifford Medical Center 5.8% 7.0% 6.1% 7.6% 5.60% 5.80% 37.90%
North Country Hospital 4.4% 5.1% 4.6% 8.0% 8.30% 4.80% 35.20%
Southwestern VT Medical Center 6.0% 5.5% 6.8% 7.2% 4.50% 3.80% 33.80%
Central Vermont Medical Center 5.2% 6.0% 5.0% 6.9% 5.90% 4.70% 33.70%
Northeastern VT Regional 4.8% 7.5% 6.5% 5.6% 5.00% 3.20% 32.60%
Mount Ascutney Hospital 6.5% 3.5% 7.0% 5.0% 3.22% 5.70% 30.92%
Springfield Hospital 3.8% 5.8% 6.0% 4.6% 5.45% 2.80% 28.45%
Brattleboro Memorial Hospital 6.0% 7.4% 5.2% 5.8% 2.70% -1.40% 25.70%
Copley Hospital 5.5% 6.0% 3.0% 6.0% 0.00% -4.00% 16.50%
Northwestern Medical Center 1.8% 6.3% 2.9% 3.9% 6.40% -10.00% 11.30%
Based on these factors we believe the rate decreases that we implemented during the 2016 budget process were sufficient to right-size the organization for the future. We ask that the GMCB recognize that the investments that we have made over the last 5 years in physician services were not only necessary to respond to our community needs assessments but also to set the stage for providing quality cost effective care for the residents of Franklin and Grand Isle counties now and in the future. Based on all of these factors our 2017 revenue budget assumes a 2.9% aggregate increase in rates in order to generate sufficient revenue to support our plan. Based on the history outlined above we believe this rate increase is reasonable based on its impact on the residents of Vermont but also sufficient to support our efforts in providing exceptional care to our community.
VOLUMES AND REVENUE Admissions
Based on national trends, over the last two years, we have projected our admissions to decrease slightly each year. However, each year we have seen an increase over the prior year, 3.3% from 2014 to 2015 and in 2016 year-to-date through April, our admissions are 9.2% higher than the same time last year. We attribute much of this increase to the continued aging of what is already deemed a significantly aged population. After the experience of the last two years, we will be taking a more conservative approach in 2017 and are projecting that our Med-Surg/ICU admissions will remain flat from 2016 to 2017. In our Family Birthing Center (FBC) we have

9
seen reductions over the last couple years. Our births went down by (6.6%) from 2014 to 2015 and in 2016 year-to-date through April they our down an additional (6.8%) from the same time last year. As a result, we have budgeted a decrease in births from budget 2016 to budget 2017 of (2.4%). Acute average length of stay is 2.97 year-to-date through April 2016. This compares to actual average length of stay for all of 2015 at 3.11, 3.32 for 2014. Much of these reductions have been driven by our efforts to reduce length of stay wherever possible and reduce readmission rates which often end up being longer length of stay cases. As we know, this past winter was very mild and we saw fewer flu cases than we have historically. Based on projecting a normal flu season and due to a continued increase in the aging population, we do believe that we will likely see a slight increase in the length of stay and have budgeted 3.1 days for 2017. Surgeries
In 2016 our surgeries are running over budget year to date through the end of April by 4.9%. The 2016 budget had anticipated a growth rate of 1%. We do anticipate that the growth that we have experienced over the first seven months will slow as we move into the summer months. For 2017 we are projecting a decrease of (1.4%) based on our actual run rate for 2016. We are also working to advance a Surgi-Center approach within the outpatient department of our surgical suite in order to provide lower cost surgical procedures using the capacity that currently exists within our hospital. Our strategic positioning process suggests a joint venture with our surgeons. We will evaluate that opportunity throughout 2017 to improve work and patient flow, increase efficiencies and quality outcomes, while reducing costs and therefore charges. ED
Over the last several years NMC has made a concerted effort to reduce ED visits and in particular avoidable visits. We continue to be successful in eliminating ‘high utilizer’ avoidable ED visits but have seen a rise in the unavoidable more acute visits. In 2016 we set a target to eliminate 1,888 visits that are deemed avoidable (e.g. low acuity patients with greater than 1 ED visit/ month X 3 months). YTD we have reduced 929 visits and we project that we will finish the year with a reduction of 2,230 visits which substantially exceeds our target. From 2012 through the end of 2015 total ED visits went down by (7.3%) a reduction of over (2,000) visits. Much of this reduction was the result of continued care management efforts and the opening of two urgent care locations in St. Albans. In 2016 we anticipated that this decrease would continue and projected a (5.7%) reduction in appropriate ED visits (higher acuity levels) from where we projected 2015 visits to finish. At this point in time not only have we not seen the anticipated reduction in ED avoidable visits but we have seen a significant increase; 7.8% above the same timeframe last year in acute ED visits. Although we continue to see significant growth in our Urgent Care business, the ED continues to be very busy. In planning for 2017 we believe that we will continue to see increases in the more acute patients in the ED. Our 2017 projections call for a 2.8% increase in ED visits from the current projected 2016 visits. New Providers

10
Our budget includes the following assumptions for physician positions that we have been recruiting for: • Full year of employment for Dr. Shapiro an Interventional Pain specialist replacing Dr.
Roberts. • Northwestern Pediatrics started in January 2016 which we have included for a full year in
the 2017 budget. This practice currently includes 5 Pediatricians with one more starting in November of 2016. We continue to recruit for additional Pediatricians.
• Our Comprehensive Pain and Addiction Clinic will continue to grow as we benefit from a full year of Dr. Herrington and Dr. White. We continue to recruit for additional providers to support the growing volumes of patients and unmet need in this area.
• Beginning December 2015, we employed Dr. Kabeli as a part time pulmonologist to replace Dr. Gorman, for two days a week. Before that time, a locum has been budgeted.
• Full year of employment for Dr. Neider, our new dermatologist, at three days per week. • We continue to recruit for a fulltime replacement ENT physician. • We have two Primary Care physicians who will be leaving NMC in July 2016. We are
actively recruiting for replacements and have included locum coverage in the budget to cover their anticipated vacancies.
We have built in ramp up time for all of our new providers noted above, which results in a less favorable financial performance for them compared to when they have fully developed practices. As we have mentioned in the narrative above we have had significant change in physician based services over the last several years. GMCB guidelines require us to identify our Pediatrics practice as a “physician transfer” in our budget submission and we will be required to request approval from the GMCB to have revenues associated with this practice be exempted from the 3% net patient revenue cap. In addition to our Pediatric practice transfer we are also asking for additional exceptions for the full year impact of Dermatology, Comprehensive Pain Clinic, Urology and Cardiology, programs already approved by the GMCB. Outpatient Lab and Diagnostic Imaging
In 2016 we projected that the diagnostic imaging modalities would remain flat while the lab budgeted to increase by 2.8% resulting from the addition of the Urine Toxicology program, offset slightly by a small temporary decrease in the referrals coming from NOTCH (local FQHC) as they transition to a new Electronic Medical Record (EMR). Over the first seven months of 2017 DI procedures are running (8.1%) below budget. In projecting 2017 we do believe some of this volume will come back and have projected an increase of 1.6% from current levels. Some of this increase will be driven by our focus on breast care services. Through the first seven month of 2016 Lab tests are right at budget. In the 2016 budget we had also included a new urine toxicology program. This program is just getting ready to start and is not currently included in our actual volumes. Based on the addition of these services in 2017 we anticipate an increase in Lab tests by 9.9%. Payor Mix Based on Gross Revenues
11
Our 2017 budgeted payor mix was set to our actual payor mix for the past 12 months, which we do not anticipate any significant changes to. This does reflect a slight increase in Medicaid mix as a result of Medicaid expansion, as well as an increase in Blue Cross as they become more dominant in the state. Net Patient Care Revenue
Medicare Inpatient Based on the proposed Medicare inpatient rules recently issued, we are budgeting for a 2.15% increase in Medicare inpatient reimbursement effective October 1st. This includes approximately $875,000 in low volume payments which CMS extended through October 31, 2017. Medicare Outpatient Based on information that is available to date we are budgeting for an increase in reimbursement of 1.2% effective January 1, 2017. Medicaid Inpatient and Outpatient We have included in the budget for 2017 the impact of the reduction in OPPS based on the elimination of Provider Based Billing for physician practices. The estimated impact for NMC for this change along with the corresponding change in OPPS rates resulted in a reduction of revenue of ($845,000). Physician Practices We have made no additional reductions in physician based rates other than the impact mentioned above for provider based billing changes. All Other Payors Substantially all other payors reimburse NMC hospital services on a percentage of charge basis, so as we increase or decrease our rates, reimbursement from these payors also increases or decreases. Based on the anticipated changes that will occur to Medicare and Medicaid and the increase in utilization that we have projected we will be instituting a 2.9% aggregate rate increase for 2017. Bad Debts and Charity Care Bad debt and charity care are generally measured in the industry as a percentage of gross revenues. As mentioned earlier in this narrative there has been change in this area of the

12
organization over the last several years. In 2017 we will be budgeting 2.1% in Bad Debt and .90% in Charity Care.
Other Revenue
Other revenue includes various revenues, the most significant of which are cafeteria sales, rebates we receive under our HPG (group purchasing organization) contract, and grant revenues. In 2017, based on a recommendation from our independent auditing firm we are reclassifying revenue associated with reference lab testing for other organizations to other operating revenue. In 2017 the amount being reclassified is estimated to be $1,450,000. We believe this reclassification will make NMC consistent with other healthcare organizations in Vermont. The 2017 budget includes $409,000 of revenue related to the 340b pharmaceutical program which is a decrease compared to budget 2016. As we have reported in previous years a significant part of the other operating revenue has been meaningful use funds provided by CMS. Over the last several years these funds have been slowly phased out. In 2017 we are not anticipating any meaningful use funds.
OPERATING EXPENSES Salaries and Wages
Salary costs are budgeted to increase by $5.9 million, or 13.4% from the 2016 budgeted amount. This increase is due to the following: • Increases in compensation to employees, including the following:
o An overall 3.0% increase for staff effective January 2016. This increase will be applied under our merit based system, so some employees will receive more than 3.0% and some less.
o An additional 0.6% increase for the following:
o Market adjustments and other salary increases that are deemed appropriate for certain positions throughout the year. These increases will be based on annual compensation surveys and market equity.
• FTEs increased (net) by 60.5 or 10.5% over the budgeted FTEs last year. The most
significant changes that make up the net increase can be broken down as follows: o Approximately 32 FTEs are being added for the addition of Pediatrics services which
occurred in January of 2016.
13
o Approximately 12.2 FTE’s related to our continued investment in health promotion and other grant related initiatives most specifically the grant funded Community Health Team.
o Approximately 3 FTE’s to support the continued expansion of our comprehensive pain management program to address the shortage of services available in our region.
o Approximately 4 FTE’s to support the improvement of our Primary Care service line. o The remaining 9.5 FTE’s are additions to support the continued growth of other practices
within the organization. Including urine toxicology, Dermatology and Orthopedics. Employee Benefits
Employee benefits include several expenses of which the most significant are FICA tax, employee health, dental, and vision costs, stop-loss insurance coverage on health claims, contributions to retirement plans, workers’ compensation costs, Healthy Ü program (employee wellness program) costs, and the cost of various activities for employees throughout the year. The 2017 budget reflects an employee benefit cost that is 23.3% of the budgeted salary cost. This is down from 24.7% which we are running on YTD basis for the first seven months of fiscal year 2016. Much of this decrease is being driven by the addition of the higher compensation levels for the physicians that are being added who as a percent of salaries have a lower benefit percentage. Our health plan will continue to place accountability on employees and their spouses for preventive health. If identified required preventive health is not obtained by an employee, they will pay a higher health plan premium than an employee that completes their required preventive health. The budget also includes operating a wellness clinic open to high risk employees and their spouses, where they will take part in a series of coaching and educational sessions. Dr. Fontaine, our Lifestyle Medicine Medical Director, will be providing the physician support for the clinic. Supplies
Due to significant efforts to control supply expenses we are budgeting supply costs to be flat from the 2016 budgeted amount. As mentioned earlier we have several initiatives underway to help reduce supply expenses. One major initiative that was completed in 2016 was the signing of new agreements for orthopedic joints which resulted in annualized savings of approximately $340,000. Were it not for this savings alone we would have anticipated supply expenses to increase by 2.8%. Contracted Services
Contracted services includes contract purchases, maintenance agreement costs, legal fees, equipment rentals, and audit fees. The contract services budgeted for 2017 is an increase of $187,000 or 1.3% over the 2016 budgeted amount. This increase is driven by a couple of positive changes and a couple of additions. The following are the significant changes:
14
• With the departure of two key primary care providers scheduled for July we have included
in the 2017 budget a provision for Locum providers to fill any necessary gaps to ensure services are available to patients. The impact in this budget is $350,000.
• In 2015 our compliment of Pathologists was cut in half by the departure of our Medical Director of Lab/Pathology. Over the course of 2016 we operated with one Pathologist which was extremely difficult. Instead of hiring a new Pathologist we have decided to collaborate with UVM for them to provide a part time Pathologist to support our program. The cost in 2017 will be approximately $270,000.
• With the addition of the new pediatrics practice there are various contracted services that
are associated with that practice totaling $204,000. Some examples are IT services, cleaning, maintenance, snowplowing and lawn care
• IT software maintenance and support costs are budgeted to increase by $187,000 as a result
of increased use of technology in our business.
• We are projecting for some interim Locum services to be needed in our comprehensive pain clinic while recruitment continues. The 2017 budgeted amount is $145,000.
• In 2016 we had budgeted for additional Locum support for our Anesthesia service. At this
time our compliment of anesthesia providers is stable which allows us to reduce our budget by ($337,000).
• We have transitioned the CFO position from a contracted service to an employed position.
The associated reduction in the QHR contract equates to approximately ($232,000).
• We had budgeted for a Locum provider in Pulmonology but at this point have an employed physician. The budget impact is a reduction of ($182,000).
Travelers
Although NMC has not had a significant dependency on traveling nurses in the past we have embarked upon an initiative to substantially reduce our dependence on traveler nurses. Based on this plan we have reduced our budget for travelers down to $122,000 for 2017. Interest and Amortization
This expense category includes interest cost on our debt and amortization of bond issuance costs. As of June 1, 2016 we have refinanced our previous bond debt and issued additional bonds to help in the funding of our master facility plan. Although our debt ended up doubling with the new debt much of the interest on the new debt will be capitalized as part of the construction project in 2017. Therefore we are budgeting for this expense category to decrease by approximately ($30,000).

15
Medicaid Provider Tax
The Medicaid provider tax is calculated based on 6% of projected 2016 net patient revenues, adjusted to actual after our 2016 books are closed. Included on the Medicaid Provider Tax expense line is also the DSH funding we receive from the State. For the 2017 budget we have received a 29% increase in DSH funding increasing from $1.4 Million to $1.8 Million. The net impact of these two changes has resulted in an overall reduction in the Medicaid Provider Tax expense line of ($462,000). Depreciation Expense
As we continue to make significant investment in not only our buildings and equipment but also in information systems this category of expense will increase significantly over the next several years. Depreciation expense is budgeted to increase by $714,000 from the 2016 budget. We estimate depreciation expense based on the recommended capital budget and schedule of existing assets.
NONOPERATING GAINS AND LOSSES Interest and Dividends
Interest and dividends are earned on operating cash, working capital investments, and certain investments managed by Bernstein. Based on our analysis of historical interest and dividends, expected interest rates, and consultation with Bernstein, we have budgeted interest and dividends in the amount of $1,031,000 for 2017. This is lower than what we expect to achieve in 2016 as we use cash resources to advance our master facility plan project. General Donations
General donations have been nominal and therefore we are only budgeting $3,000. At this point almost all donations that we receive unless specifically designated for other purposes are going toward our capital campaign for the master facility plan. Based on GMCB budgeting guidelines, we cannot, and have not, included any revenues related to these fundraising efforts into our budget. Realized Gains on Investments
Realized gains on investments depend on stock market conditions and decisions by our investment manager on the timing of stock sales. They also include the net income or loss from NOH, which over the last several years has generated a loss from operations. The history of realized gains/ (losses) over the past five years is as follows: 2012 - $1,099,204 2013 - $725,263 2014 - $1,439,318
16
2015 - $676,000 2016 - $200,526* *(YTD through April) Based on the relative uncertainty and unpredictability of investment returns, we have not included anything in the budget for these amounts. However, the budget does include an expected loss of $1,077,000 from NOH. As this service continues to grow we continue to look for opportunities to drive efficiency and potentially partner with other local providers.
Investment Property Income
This line represents the rental income we receive for the properties we rent to others, offset by the cost we incur to maintain and repair those properties. The largest rents we receive include rentals related to space in Cobblestone, the land lease for the Doctors Office Commons, and space in the Georgia medical building (subleased).
Other
Other non-operating expenses represent banking and investment fees related to our managed investment accounts, and changes in the market value of our bond swaps. As the market value of our swaps cannot be predicted, we do not budget for this. Fees related to our operating checking accounts, which are nominal, are included in other operating expenses.
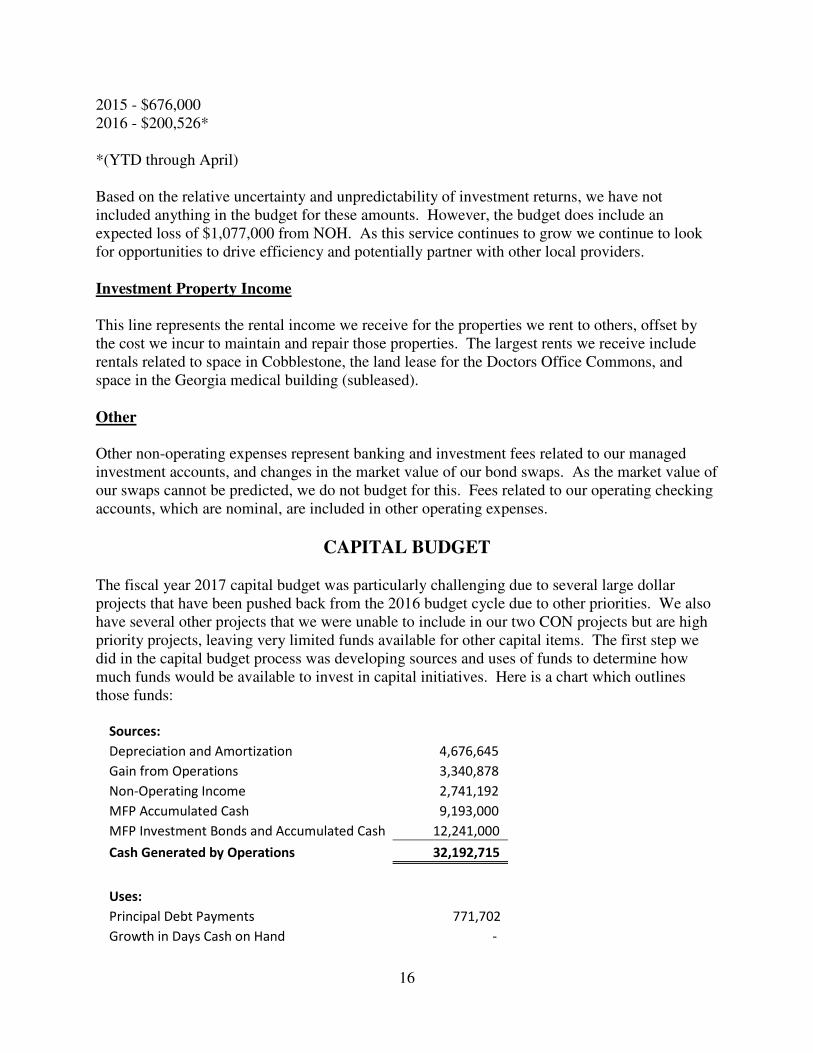
CAPITAL BUDGET The fiscal year 2017 capital budget was particularly challenging due to several large dollar projects that have been pushed back from the 2016 budget cycle due to other priorities. We also have several other projects that we were unable to include in our two CON projects but are high priority projects, leaving very limited funds available for other capital items. The first step we did in the capital budget process was developing sources and uses of funds to determine how much funds would be available to invest in capital initiatives. Here is a chart which outlines those funds:
Sources:
Depreciation and Amortization 4,676,645
Gain from Operations 3,340,878
Non-Operating Income 2,741,192
MFP Accumulated Cash 9,193,000
MFP Investment Bonds and Accumulated Cash 12,241,000
Cash Generated by Operations 32,192,715
Uses:
Principal Debt Payments 771,702
Growth in Days Cash on Hand -

17
Strategic Investment Pool 500,000
Divisional Capital Pools 1,057,568
Contingency 250,000
Committee Allocation 4,844,445
Emergency Department 340,000
Georgia Health Center 2,995,000
MFP 21,434,000
Cash Used for Capital and Principal 32,192,715
As we embarked on this year’s capital budgeting process we looked to separate the responsibilities for working through the budget into a pooling of funds concept. Historically a capital budget committee would review every capital related request regardless of dollar value or need. This year we decided to move forward with a pool based approach. In the uses section above you will see the four primary areas of the pool distribution are; divisional capital pools, committee allocation pool, strategic investment pool and contingency pool. Three other projects (ED, Georgia Health Center and MFP) were large enough that we pulled them out of the pool based process. Here is a brief explanation of the pools purpose:
• Strategic Pool – This pool is intended to provide resources over the course of 2017 to invest in strategic initiatives that may come up after the budget process has been finalized. These initiatives would be reviewed and vetted by the senior leadership team and ultimately come to the board for approval.
• Divisional Capital Pools – This is the newest concept within the budget process. These items are items that have a cost of less than $50,000. Each division within the organization, i.e. clinical, facilities, physician services, information technology, were given a pool of funds based on historical purchases that could be used to prioritize and vet each item requested that costs less than $50,000. The decision to move forward with each item would be the divisional senior leader and it would be reviewed prior to purchase by the senior leadership team. This saved the capital committee and department managers a significant amount of time in the process.
• Contingency Pool – This pool is exactly as the name suggests. It is a pool of approved capital funds that can be used over the course of 2017 as emergent situations arise. Many capital items will be delayed due to lack of funds, some of them may fail prior to the next capital cycle. This pool of funds allows flexibility to deal with emergent situations. Items that come forward requesting the use of these funds will also be reviewed and approved by the sr. leadership team.
• Committee Allocation Pool – this is the final pool but also the largest pool. This pool was made available to the capital planning committee. They were charged with reviewing all requests that were over $50,000. The total of these requests started at over $10 Million. Many were modified to either spread them over multiple years or reduce their scope. The committee’s role was to meet with every stakeholder and prioritize the requests against one another to determine those that could be funded within this pool and those that would have to wait another year. This process is very detailed and a consistent scoring process is used for each request to score the value and

18
need of each item. Here is a brief description of the items that we are recommending to move forward with:
Meditech Hardware Replacement and Meditech Clinical System Upgrade to 6.1 - $583,000 This is the second part of a request that was approved last year and it was agreed to spread over a couple fiscal years. The Meditech system (hardware and software) was implemented in October 2010. Meditech is implementing a major software upgrade which we have already presented to the Board in 2015 for approval of the initial payment. The additional payments due in 2016 for this upgrade totaled $293,714. The software upgrade costs represent implementation hours incurred by Meditech, with the implementation scheduled for completion in 2017. There are no additional software licensing charges as our contract with Meditech provides us with a perpetual license. Over the course of the two years an additional cost of just over $575,000 represents capitalized NMC staff time to work on the implementation, as well as a project consultant. This component completes this project which is scheduled to go live in April of 2017. OR Chiller Replacement - $942,845 This project ended up being deferred from 2016 and moved into 2017. This project includes the replacement and upgrade of the chiller that provides cooling to the Operating Rooms and Surgical Services. This project is designed to address ongoing issues (equipment failure, noise, temperature and humidity control) from a failing unit which was not able to be fully restored through the last couple of year’s repairs. The upgrades included in this project will position us for better redundancy that we need but have not previously had. There will also be energy efficiency benefits of this project. Surgical Instrument Upgrade - $625,863 A critical part of a state of the art surgical suite is its scopes and cameras. At this point in time many of our scopes and cameras have reached the end of useful life and need replacement. We discussed the possibility of staging this replacement in order to spread it out over several years. That strategy is very difficult because the technology cannot run on new and old platforms together, therefore we must purchase new equipment all at once. The request is to purchase new surgical scopes to support patient care and select equipment that will tie into our newly integrated operating rooms. Last year, we upgraded our OR rooms with lights, booms and computer systems. This request is for the purchase of new scopes that will tie into this upgrade and offer better visualization of the surgical field for our surgeons. Using minimally invasive surgical techniques require the use of a scope, a light source, a camera, and a visual display, which makes up the entire platform. The upgraded scopes will provide NMC with state of the art technology for performing arthroscopy, hysteroscopy, cystoscopy and laparoscopic procedures which supports our Orthopedic, OB/GYN, Urology and General surgeons on a daily basis. The normal life expectancy for surgical scopes is 3-5 years, due to daily use and subsequent wear and

19
tear. The current age of NMCs equipment ranges from 5-8 years and because of the frequent use, repairs are increasing and costly. HVAC HeatEx Unit Replacement (Lab) - $250,000 This project is one component of a general AHU replacement project to update an end of life HVAC unit serving our Lab, Administration, Support Services, and Cafeteria/Courtyard Cafe areas. This project will also correct code deficiencies and arrangement of areas served to reduce overall energy consumption. This is a portion of a project that was deferred from 2016 due to other priorities. Fit Up for new Ophthalmology Space - $530,000 In 2015 we entered into a lease with the St. Maries to lease space for our new dermatology practice and to relocate our ophthalmology practice. The fit-up work for these practices was phased in with dermatology practice space completed in 2016. The second phase of the project is to renovate the ophthalmology space and includes additional equipment, the total project cost is estimated at a cost of $530,000. The current ophthalmology space lease expires January 1, 2017. Renovation of Enosburg Pediatric Suite - $300,000 This is a request to renovate the current pediatric space in Enosburg Falls. After acquisition of the practice in January of 2016 we determined that the space they occupied had significant shortfalls. It was very inefficient and also was not up to the standards established for NMC. This construction budget is for interior renovation consisting of new flooring, ceilings, lighting, doors, patching and painting through-out, new reception desk, new millwork in all patient rooms, and minor reconfiguration of suite. Mind Ray Telemetry System - $200,000 This request is to expand and replace our current Mindray Cardiac monitoring and telemetry system for the new Medical Surgical/ICU addition. The existing Mindray cardiac monitoring equipment (bedside monitors) are at end of life and cannot be moved to the newly renovated area. This quote utilizes existing telemetry monitoring (equipment), wiring for new addition, mobile bedside monitors for 6 cardiac monitors and central display stations for the new nurses stations. We will be using all current slave monitors and adding additional monitors for complete visibility in the new addition. Renovation Pain Clinic Offices - $189,000 Based on our community needs assessment one of the areas of focus and growth for NMC is pain and addiction services. We have proceeded with renting additional space on Catherine St. adjacent to our existing clinic. This space will be used to expand our clinic in the current location. The cost is associated with renovation and fit up to prepare the new space for occupancy and to tie into the existing space.

20
Renovation of Laboratory Space - $141,500 For the last several years there has been ongoing discussion regarding the need to renovate our existing lab. This is a designated place holder to do the planning and design phases of what a renovated lab would look like. Wireless Infrastructure Refresh - $125,000
NMC's staff, patients and visitors must have a reliable and high performance wireless network for business and personal device communication. In coming years, our Medent and Meditech electronic medical records will be releasing browser and app enabled products that allow providers to roam room to room with portable devices. Our current NMC wireless network was installed in 2006 and is over 10 years old. Due to its age, this network is becoming unstable and unreliable and we have experienced increasingly frequent hardware failures. Additionally, since 2006 wireless technology has evolved to improve performance, security, and reliability. Wireless network speeds at NMC are currently limited to a max of 54Mbps, as compared to new standards that support theoretical speeds of up to 867 Mbps. This project was delayed from the 2016 capital plan. Computer Device Refresh - $130,000 Throughout the last several years, NMC has seen a shift toward more mobile and portable computing devices. These devices are approximately 40% more expensive than the typical desktop computer; however, they result in a more productive and efficient workforce. This capital will fund the increasing requests for lightweight, mobile devices for new hires, and replacement of the oldest laptop devices currently under management. Meditech Critical Care Module - $118,370 This software will allow for the ability to view and document patient data in one electronic tool. It will allow direct access to the critical care flowsheet via a desktop and provide standard dictionary content geared towards critical care workflow. It will allow for the ability to add/ customize assessment content and documentation efficiently as well as integrate with the medication administration record to streamline intravenous and titration documentation. Additional Ultrasound Unit in DI - $81,732 Due to a continuous increase in U/S volumes since October 2012, sustained revenues above budget and continued scheduling constraints (booking 2 weeks or more out), and an increase in U/S breast exams and biopsies, this is a proposal to purchase an additional U/S unit and staff it to handle this volume. This request has been debated over the course of 2016 and will be an important addition as we expand our breast care services. Donor Stewardship Recognition - $75,000
21
Through our capital campaign it is important to recognize those individuals that have made significant contributions to our Master Facility Plan. These funds were removed from the project costs as we went through the CON approval process. This request will allow for proper recognition to support our capital campaign. e-Signature Software - $73,000 e-Signature will eliminate the current cycle of print, sign, and scan that is used for consents, and registration documentation. This will greatly improve the patient experience, streamline admissions and discharges and dramatically improve the efficiency and accuracy of registration by ensuing proper document signatures are captured and directly saved into the record. This will mitigate the current issue of lost documentation due to delays in scanning, or scanning into the wrong visit or patient record. Nurse Communication Devices - $62,000 These devices will significantly improve nurse communications among each other, with providers and with their assigned patients. Devices will enable nurses to view telemetry waveforms remotely, receive, triage and respond to nurse call request while on the floor and away from nurse hubs, receive real-time vital signs and lab results. Use of portable communications by nursing staff should positively contribute to improved patient satisfaction scores. Nurse response time, and ability to communicate with and meet patient expectations should improve through integration of vital, telemetry, and nurse call systems along with portable phones and secure texting capabilities nurses will be able to better communicate with each other and with providers. This should improve discharge processes, as well as patient flow for admissions. Jackson Table Fracture Kit - $57,135 This is a fracture kit or accessory that attaches to our current operating room table. It will replace the current outdated and problematic unit. This along with the new Hana table will allow two cases of the same type to be performed or overlap in two different rooms, accommodating our growing orthopedic practice. Digital X-Ray Room - $360,000 Current X-Ray operations can be hampered due to the restrictions of Computed Radiography (CR); having to use, expose and process physical cassettes when performing Radiographic images. Typically, the processing of these cassettes can take up to 1 ½ minutes per cassette. Transitioning to the use of Digital Radiography (DR) eliminates the need to use and process multiple cassettes and helps improve workflow with near instantaneous image acquisition and display. In addition to these concerns Medicare has passed legislation that will reduce payments

22
for organizations that continue to use CR technology past January 1, 2018. The impact to NMC if we still had CR technology would be approximately $195,000.