northern territory government · northern territory government, ... jackfruit and others. ... the...
TRANSCRIPT

NORTHERN TERRITORY GOVERNMENT
DEPARTMENT OF REGIONAL DEVELOPMENT, PRIMARY INDUSTRY, FISHERIES AND RESOURCES
PRIMARY INDUSTRIES ANNUAL RESEARCH REPORT 2008-09

Copyright ©:
Northern Territory Government, 2009
This work is copyright. Except as permitted under the Copyright Act 1968 (Commonwealth), no part of this publication may be reproduced by any process, electronic or otherwise, without the specific written permission of the copyright owners. Neither may information be stored electronically in any form whatsoever without such permission.
Disclaimer:
While all care has been taken to ensure that information contained in this Technical Bulletin is true and correct at the time of publication, changes in circumstances after the time of publication may impact on the accuracy of its information.
The Northern Territory of Australia gives no warranty or assurance, and makes no representation as to the accuracy of any information or advice contained in this Technical Bulletin, or that it is suitable for your intended use.
You should not rely upon information in this publication for the purpose of making any serious, business or investment decisions without obtaining independent and/or professional advice in relation to your particular situation.
The Northern Territory of Australia disclaims any liability or responsibility or duty of care towards any person for loss or damage caused by any use of or reliance on the information contained in this publication.
October 2009
Bibliography:
Northern Territory Government (2009). Primary Industries Annual Research Report 2008-09. Northern Territory Department of Regional Development, Primary Industry, Fisheries and Resources. Technical Bulletin No. 331.
Contact:
Northern Territory Government Department of Regional Development, Primary Industry, Fisheries and Resources GPO Box 3000 Darwin NT 0801
http://www.nt.gov.au/d
Technical Bulletin No. 331 ISSN: 1837-4654

CONTENTS
INTRODUCTION .................................................................................................................................................5
PLANT INDUSTRIES..........................................................................................................................................7
ANIMAL INDUSTRIES......................................................................................................................................32
PUBLICATIONS, CONFERENCE PAPERS AND PRESENTATIONS............................................................115
INDEXES ........................................................................................................................................................121


ANNUAL RESEARCH REPORT 2008-09
INTRODUCTION
Since 1987, the Primary Industries Group in the Department of Regional Development, Primary Industry, Fisheries and Resources (DRDPIFR) (and its predecessors) has annually reported in its Technical Annual Report (TAR) on research, development and extension projects conducted in the Northern Territory (NT) of Australia. This year, a change has been introduced to separate research activities from those related to extension. Thus this report, which deals entirely with research work, is named the Annual Research Report (ARR). The first Annual Extension Report will be produced in March, 2010.
Research work reported in this ARR covers two major areas: Plant Industries - crop, forestry and horticulture production, entomology and plant pathology; and Animal Industries – cattle, pasture and buffalo production. Much of this work is conducted in Darwin, Alice Springs, Katherine and Tennant Creek. Research is also conducted at the Department’s research farms and on private properties in collaboration with owners. These projects are conducted in response to the needs of industry. This ARR provides a summary of new and continuing research work conducted during the 2008-09 financial year, together with results, where available, and general recommendations.
The estimated gross value of plant industries in 2008-09 was expected to be $262m. This represents a 126% increase in the value of horticulture production and a 153% increase in field crop production over the last five years. Mangoes, melons, citrus and vegetables are the main products of the horticultural industry in the Darwin and Katherine regions. Other smaller volume crops include bananas, rambutan, dragon fruit, jackfruit and others. There is also a significant nursery and cut-flower industry. Turf production is increasing with the rapid expansion in residential areas in the Darwin region.
The broad-acre agricultural sector is based largely on pasture seed, hay for fodder, peanuts and maize production. The main production area for this industry is in the Katherine region, although some lucerne is produced in Central Australia. There has been a rapid increase in peanut and maize production in the Katherine region based on irrigation. Traditional temperate cereals, such as wheat and oats, have been trialled under irrigation during the dry season.
Table grapes have been the predominant horticultural crop in Central Australia for 20 years. Although market pressure has affected this industry in recent times, production is continuing to grow. Growers are also testing the feasibility of growing other fruit and vegetable crops in the region, particularly watermelons, pomegranates and pumpkins.
Forestry covers 30 000 hectares of Acacia mangium trees on Melville Island destined for the paper pulp industry and 6000 hectares of African mahogany (Khaya senegalensis) in the Daly region for hardwood timber production. Although there have been some problems in financing these operations, production is expanding. DRDPIFR is supporting the industry through research on the genetic improvement of African mahogany and the management of termites in Acacia mangium.
The ornamental industry supplies local, domestic and export markets. Tropical cut-flowers are supplied locally and interstate
The Pastoral Division supports the sustainable development of the NT pastoral industry. In 2008, the industry turned off more than 500 000 cattle. This included 359 307 which were sent to the live export market from the port of Darwin and the rest were sent interstate to feedlots or for slaughter. Good rain was received through most of the NT in late 2008. In the Barkly region, the change went from one of the driest years on

2008-09
record to one of the wettest and several stations were affected by floods. The Barkly Highway was cut-off for some weeks. However, very little follow up rain was received in some regions, especially Central Australia.
The pastoral industry is addressing issues related to profitability, production cost reductions, increasing public accountability on the use of natural resources, animal welfare practices and the uncertainty surrounding climate change.
DRDPIFR is assisting producers to address these issues by conducting focused research to improve the efficiency of sustainable production on pastoral properties. This ARR includes summaries of current research projects that are addressing these issues, including improving breeding herd efficiency, grazing management and increasing carrying capacity through infrastructure development and assisting indigenous land owners to increase pastoral production on their land. A number of specific large research projects are being conducted on commercial properties on, for example, heifers, the cash-cow concept, live-weight gain and carrying capacity.
The Biosecurity and Product Integrity Division manages risks posed by animal and plant pests, diseases and chemical residues to the economy, the environment and to human health. It is responsible for preventing the establishment of exotic pests and diseases in the NT through early detection and eradication, or containment, to prevent further spread. The Division also ensures continued access for NT produce to domestic and international markets by providing certification or accreditation and by conducting surveillance to substantiate area freedom from disease. This work is assisted by a quality-assured veterinary laboratory service that is recognised nationally and internationally.
This ARR is divided into two parts: ‘Plant Industries’ and ‘Animal Industries’. Projects related to plant industries are listed under ‘Plant Industries’, irrespective of which departmental Division they come under. Similarly, projects related to animal industries are listed under ‘Animal Industries’, irrespective of which departmental Division they come under. To assist readers to find projects of interest quickly in this ARR, two indexes are included at the end.

ANNUAL RESEARCH REPORT 2008-09
PLANT INDUSTRIES
Plant industries projects conduct applied research in controlled trials to discover solutions to problems that affect productivity and profitability of the industry and, where possible, to protect the environment and human health.
PROJECT: Potential Perennial Bio-fuel Crops for the NT
Project Officers: M. Bennett, M. Kahl and M. MacRae
Location: Katherine
Keyword(s): bio-fuel, pongamia, cassava, sunflower, safflower, Katherine Research Station
Objective:
To investigate potentially suitable perennial crops for bio-fuel production in the NT.
Background:
Bio-fuel research to investigate potentially suitable crops commenced in May 2006 at the Katherine Research Station (KRS). Potential stock feed crops that are suitable for bio-fuel production include both irrigated and rain-fed annuals and perennials.
Annuals for ethanol production include maize, sorghum and cassava and, for biodiesel production, oil seed crops, such as soybeans, sunflower and safflower.
Perennials for ethanol production include cassava and, for biodiesel production, pongamia, moringa, African oil palm and coconut.
In 2007, it was decided not to continue research on any crop:
• that requires intensive management, irrigation and high amounts of fertiliser; • whose grain is principally used as stockfeed or for human consumption, • that competes for prime agricultural land; and • that has weed-like characteristics.
The short list for further investigation includes perennial tree crops and cassava.
Tree crops include pongamia, moringa and African oil palm. There was particular interest in pongamia, which is a legume, which can produce its own nitrogen. It is adaptable to local conditions, including low soil fertility and is not potentially a noxious weed.
A new site was established at Coastal Plains Research Station (CPRS) in 2007 to compare crop production in a tropical environment (1400 mm rainfall vs. 980 mm at KRS).

2008-09 PLANT INDUSTRIES
Method:
Multiple research sites are maintained at KRS and CPRS. Establishment, phenology, growth and yield are measured. Additional seed will be sourced from native pongamia stands to test for oil quality.
The trials will continue for another five years.
Observations:
Hand-harvested yields of irrigated cassava were more than 50 t/ha fresh tuber weight at 12 months and more than 90t/ha fresh tuber weight at 18 months. Tubers were set horizontally (shallow) below the soil surface to allow for mechanical harvesting and minimal damage.
Cassava could be grown without irrigation if it is sown at the beginning of the wet season and harvested at the end of the following wet season.
Moringa is extremely drought resistant. In one trial, pongamia seedlings could not survive the 2008 dry season, but 90% of moringa seedlings did. However, in another trial, where moringa seedlings were irrigated and fertilised, 95% of them died.
Three moringa pods (drum sticks) were harvested at nine months of age. The last surviving moringa tree is currently flowering. The need to hand-harvest pods would make moringa a relatively expensive plant for bio-fuel production.
Coconut plants are growing rapidly but so far no coconuts have been produced. Results from trials in north Queensland indicate that production is directly related to the cultivar. If coconuts are to be seriously considered for bio-fuel production in the NT, a cultivar assessment would be required.
Two different lines of African oil palm were established in 2007. The first reproductive structures were recorded for the second line in December 2008. Two palm trees appear to be dioecious (males and females on different plants) and four to be monoecious. The fate of the rest is not yet known. The flowers on one female palm tree appear to have been wind-pollinated, as reddish berries are forming. It is thought that Australia does not have the vectors necessary for insect pollination.
Queensland is thought to have some of the highest yielding indigenous pongamia specimens in Australia. In trials in the NT, seed and seedlings from 10 superior Queensland lines and 10 NT lines were used. NT lines come from Darwin, Batchelor, Pine Creek, Douglas Daly, Katherine and possibly Mataranka. The trials are investigating establishment techniques (seed vs. seedling vs. cutting), planting density, and monitoring phenology and yield production.
In December 2008, 25% of trees produced ‘light’ flowering. However, none were able to set pods. Poor pod- setting is of a major concern in the NT, as many local specimens produce large numbers of flowers but few pods.

ANNUAL RESEARCH REPORT 2008-09
PROJECT: Evaluation of Maize Cultivars in the 2008 Dry Season
Project Officers: M. Bennett, D. Renfree and D. Hussie
Location: Katherine
Keyword(s): maize, Katherine, Blain soils
Objective:
To evaluate irrigated maize cultivars on Blain soils at Taylor’s Park.
Background:
The Peanut Company of Australia is increasing peanut production in the Katherine region. A major problem with growing peanuts continuously is a rise in diseases, legume weeds and insect pests.
The best way to overcome this problem is through crop rotation. Maize grows well in rotation with peanuts, especially under irrigation during the dry season.
An extensive range of maize cultivars is available for evaluation, including normal temperate feed and grit lines through to tropical x temperate hybrids, as well as waxy and high amylose lines.
This trial is evaluating potential maize cultivars suitable for dry season production in Katherine.
Method:
Twenty-eight maize cultivars from QDPI&F, Pacific Seeds, Pioneer Hi-Bred Australia and HSR Seeds were sown on 22 April 2008 at Pivot 12, Taylor’s Park. Plots consisted of four rows, 10 m long with 90 cm between rows. The soil is a Blain sandy loam. The research site was managed using local commercial maize production practices.
The trial was a randomised complete block with three replicates. Sowing was at the rate of seven seeds/m. “Doubles” were thinned at 14 days after sowing. Ten plants from the inside rows of each cultivar were identified for measurement.
Various plant characteristics were measured during the trial. Four of these characteristics are listed in Table 1.

2008-09 PLANT INDUSTRIES
Results:
Table 1. Ten highest yielding maize cultivars evaluated at Taylor’s Park in the 2008 dry season
Cultivar Population - mean plant
number (1000/ha)
Yield - mean (kg/ha) 12%
moisture
Kernels per cob - mean (%)
Anthesis – silking interval
(days) PAC 74077 HY 675.IT PAC 54102 PAC M727 Pioneer 3153 HSR 5114 HSR 51037 Pioneer 32P55 HY 424 Pioneer 31G66
74.2 71.4 74.2 76.9 65.0 71.4 76.9 76.9 72.8 74.2
11424 10783 10773 10415 10348 10265 9561 9125 9066 9030
86.2 86.5 85.6 83.9 84.6 87.1 85.4 83.2 85.2 87.1
4.9 1.5 2.4 1.9 2.5 -1.0 2.7 3.2 4.6 2.2
mean of 28 cultivars 70.1 8641 83.8 3.1
Commercial standards, Pioneer 3153 and Pacific Seeds HY 675.IT are still in the top ten yielding cultivars suitable for winter grain production in the NT.
The more tropically-adapted hybrids generally produced lower amounts of grain than the temperate hybrids. Dry-season grain yields need to be more than 10t/ha to be profitable.
Pioneer 31G66 and HSR 5114 recorded 87.1% kernels. More than 85% kernels are considered necessary in high yielding crops.
Extensive symptoms of Physoderma brown spot were recorded in six of the 28 cultivars evaluated in the trial.
Silk-balling was observed in some cultivars, possibly a hybrid characteristic (tight husks surrounding the cob) coinciding with a cold snap (minimums less than 8 ºC) before silking.

ANNUAL RESEARCH REPORT 2008-09
PROJECT: Demonstrate and Evaluate Mulch Management Techniques in a Legume–Cereal(s) Rotation
Project Officers: M. Bennett, D. Renfree and D. Hussie
Location: Katherine
Keyword(s): mulch management, millet, crop rotation, Katherine
Objective:
To demonstrate the effect of millet mulch management techniques on maize production in a legume–cereal rotation.
Background:
The Peanut Company of Australia is increasing peanut production in the Katherine region. A major problem of growing peanuts continuously is the rise in diseases, legume weeds and insect pests.
The best solution to this problem is crop rotation. Maize, which is a cereal, grows well in rotation with peanuts, especially as an irrigated dry-season crop.
Maize is normally harvested in the third or fourth week of September, while peanuts are sown in the first week of December. During this intervening period the soil is exposed to wind erosion and the occasional intense storm, which causes severe water erosion. To minimise erosion and to assist in reducing weeds and diseases, an irrigated millet cover crop can be grown. Prior to sowing the next crop, the millet is sprayed with a herbicide to terminate its growth and then is either incorporated into the soil, slashed or left standing.
This trial is evaluating the effect of three millet mulch management techniques on growth and yield of dry season maize.
Method:
Ingrid pearl millet was sown into three legume stubbles on 9 April 2009 in Putland Paddock (lateral move irrigator) at Katherine Research Station. The stubbles were of lab-lab (3.3 ha) at the northern end of the paddock, lucerne (6.6 ha) in the central area and Cavalcade (3.1 ha) at the southern end of the paddock.
The millet grew for 29 days before it was sprayed with Round-up CT (2 L/ha). About one third of the area was then cultivated, one third was slashed and one third was left as standing mulch. One week later, maize cultivar 31G66 was sown at 72 000 seeds/ha.
Data collection areas were identified within the mulch management treatments x original legume stubble. Crop emergence, establishment, and biomass at 84 days after sowing and grain yield will be measured. Soil moisture monitors were buried 30, 60, 90 and 120 cm below the surface.

2008-09 PLANT INDUSTRIES
Results:
The crop was to be harvested in October 2009. Tentative results indicate that mulch management did not affect emergence or establishment of maize. The soil moisture extraction profiles below the different mulch treatments were different but maize biomass at 84 days after sowing was not.
PROJECT: A Preliminary Investigation into Commercial-scale Production of Solanum centrale (Bush Tomatoes) - the Role of Irrigation and Weed Competition on Yield
Project Officer: G. Ellis
Location: Alice Springs
Keyword(s): bush tomatoes, Solanum centrale, irrigation, weed competition, Arid Zone Research Institute
Objectives:
To investigate the response of different varieties of S. centrale (bush tomatoes) to different irrigation rates and the effect of weeds on yield.
To identify high-yielding plants, potential pests, the feasibility of mechanical harvesting, post-harvest handling and suitable storage conditions.
Background:
The increasing use of bush tomatoes in food manufacturing has led to an increase in demand (Salvin et al. 2004). Current demand for bush tomatoes is largely met by small groups and individuals who gather the produce in desert regions of Australia as it becomes available. Harvests from the wild can be unreliable as the crop is seasonal and subject to considerable variation in yield (Cleary et al. 2008; Miers 2004; Morse 2005). Horticultural production of bush tomatoes is seen as a secure and reliable way to meet increasing demand.
Method:
Trial site
The trial site is at AZRI (23º46’07”S 133º53’21”E) consisting of two plots: A1 (50 m x 70 m) and A2 (50 m x 40 m). The two plots were separated by a permanent bed of asparagus.
Soil
Two soil samples were collected in January 2007 from A1 and A2 and sent for testing for total exchange capacity, organic matter, anions, cations and base elements. Both A1 and A2 soils were found to have excessive levels of potassium (K) (1516 and 1763 kg/ha, respectively). Phosphorous (P) levels were also found to be excessive. A1 had 366 kg/ha and A2 had 563 kg/ha. Nitrogen levels were very low in both A1 and A2 soils (44 and 48 kg/ha, respectively). Colloidal organic matter was also very low in both A1 and A2

ANNUAL RESEARCH REPORT 2008-09
soils (1.20% and 1.40%, respectively). Given the high level of both K and P salts, the effect of fertiliser was not included in this study.
Plant material
Three local nurseries (Desert Park, Geoff Miers Garden Solutions and Tangentyere) were commissioned by the Desert Knowledge CRC to propagate seedlings for the trial. Approximately 11 000 seedlings were germinated from seed sourced from three separate geographical locations: Napperby, Amberlindum and Utopia. The plants exhibited variation in morphology both within and between geographical sources.
Irrigation
Non-pressure-compensated 17-mm inline sub-surface drip irrigation lines were installed in rows 1.5 m apart. To examine the effect of different irrigation rates, three lines were used to deliver water at different rates (1, 2 and 3 L/hour). The plants were watered weekly for two hours at a time during April-May and August-September, and twice weekly for two hours at a time during October-March. The plants were not irrigated during the cooler parts of the year (June-July).
Planting
Seedlings were planted manually in March 2007 above each sub-surface irrigation line at 300-mm intervals in a zigzag pattern on either side of the buried drip line.
Experimental design and data collection
As outlined in Table 1, trial 1 investigated the effect of three levels of irrigation on the Napperby variety, while trial 2 investigated the effect of the same three levels of irrigation on the three varieties of bush tomatoes. Trial 3 investigated the performance of two varieties of bush tomatoes in the presence/absence of weeds and varying irrigation rates.

2008-09 PLANT INDUSTRIES
Table 1. Bush tomato trials at AZRI
Trial [plot (rows)]
Factors/treatment (levels)
Replication Response variables
1 [A1 (2-46)] Irrigation (3) 1 L/h 2 L/h 3 L/h Block (5)
Three rows (115-155 plants) of “Napperby” per irrigation type within each block
Dry weight of berries per row.
2 [A2.1 (48-56)]
Variety (3) Napperby Amberlindum Utopia Irrigation (3) 1L/h 2L/h 3L/h
Nine replicate plots (40 plants each)
Dry weight of harvested berries per replicate within varieties.
3 [A2.2 (59-70)]
Variety (2) Napperby Amberlindum Irrigation (3) 1L/h 2L/h 3L/h Weed competition (2) Present (“weedy”) Absent (“weed-free”)
Two replicate rows at the level of the interaction term
Dry weight of berries for both Napperby and Amberlindum in the weedy and weed-free areas.
Buffer rows planted with 1 (Napperby); 47 (Napperby); 57-58 (Napperby); 71 (Amberlindum); 72 (Napperby)
Results:
Yield in the three varieties (Amberlindum, Napperby and Utopia) did not differ significantly from each other under any of the irrigation rates. The presence of weeds significantly affected the yield across all irrigation rates. The yield in weedy areas was less than a fifth of that in the weed-free area.
This project was funded by the Desert Knowledge CRC.
References:
Cleary, J., McGregor, M., Bryceson, K. and James, C. (2008). ‘Development of a value-driven bush foods industry chain that rewards Aboriginal people’, Desert Knowledge Cooperative Research Centre, Alice Springs.
Miers, G. (2004). Cultivation and sustainable wild harvest of bush foods by Aboriginal communities in Central Australia. RIRDC Research Report No. W03/124, Canberra.
Morse, J. (2005). Bush resources: Opportunities for Aboriginal enterprise in Central Australia. Desert Knowledge CRC Report No. 2/2005. Alice Springs.
Salvin, S., Bourke, M. and Byrne, T. (2004). ‘Native Foods’, the New Industries Crop Handbook, RIRDC, Canberra.

ANNUAL RESEARCH REPORT 2008-09
PROJECT: Delivering Mango Technology – Two Research Trials in Darwin
Project Officers: D. Hamilton, N. Hartley and T. Williams
Location: Darwin
Keyword(s): mango, nutrition, nitrogen
Objectives:
To assess the effect of timing of soil-applied nitrogen (N) on the partitioning of N in plant parts, growth response and N recovery in Kensington Pride (KP) mangoes with either low or higher leaf N levels (trial 1).
To compare the uptake of foliar applications of urea and potassium nitrate by KP mangoes (trial 2).
Background:
Given the importance of N fertiliser in mango yield and quality, growers are keen to understand how this nutrient can be managed better. A major concern is that the continual use of N to achieve high yields can result in over-vigorous trees and green-skinned fruit that do not ripen normally. Looming issues include the rising cost of fertiliser and the possible environmental impact of over-fertilising. Information on a reliable relationship between the timing of soil-applied N and subsequent productivity is limited. Moreover, given that leaf samples are taken at set times for N analysis to predict productivity, the question arises as to whether the levels of N reflect those applied this year, last year, or both.
Some growers rely on foliar N sprays to enhance budburst at flowering and/or supplement N levels throughout the season. The effectiveness of these strategies has not been investigated. It is not clear how the effectiveness and efficiency of foliar application compares with soil application. An understanding of N uptake from foliar applications may offer benefits for growers to rapidly boost N levels in leaves when crop requirements are high.
Method:
Trial 1
In 2008 a section of 12-year-old uniform mature KP trees spaced at 7 x 12 m were selected at a Fly Creek orchard that had a history of low N fertiliser input but reasonable production. Before the trial commenced, half of the trees had received urea N fertiliser to boost leaf N levels and create a high N status compared with the already low leaf N level trees. Thus the trial consisted of trees with a high N status that had received 200 g N as enriched urea 15 N (2.10 atom % excess) at either post-harvest (December 2008), or pre-flowering (April 2009), and those that did not receive N at all (control). N was applied as a solution to an approximate distance of 60 cm radius of the trunk and then immediately watered in. Each treatment had six single tree plot replicates in a randomised complete block design. Guard trees were used within the rows between treated trees.
The measurements included temperature, relative humidity and rainfall, tree size, % total N, and 15 N leaf and plant levels, vegetative and flowering growth, fruit numbers and weights, and fruit quality.

2008-09 PLANT INDUSTRIES
Trial 2
The selected site details are similar to those of trial 1, but the trees in this trial were not treated with soil- applied fertiliser N. In May 2009, one to two weeks before flower initiation, urea and potassium nitrate solutions (2% concentrated, 10% 15 N enriched) were applied to the leaves to determine the uptake of N. A single application of both N formulations was compared with two single applications of both formulations, applied 24 hours apart. A control treatment of distilled water was also used to compare uptake at both application times. Each treatment had six single tree replicates arranged in a Latin square design. Separate branches on each tree were used. Single leaves were treated on each branch and were sampled before and after, to provide uptake efficiency measurements. Additional untreated leaves were also sampled to provide any indication of the movement of N from treated leaves.
Estimates of total leaf biomass were made to determine N uptake per tree.
Results:
The analysis of results for trials 1 and 2 has not been completed yet.
PROJECT: Quality Management to Enhance Effective Supply Chains for Mangoes and Rambutan in Nusa Tenggara Barat, Indonesia and Australia
Project Officers: B. Thistleton, J. Liberato, D. Chin, S. Qureshi and A. Daly
Location: NT
Keyword(s): mango, rambutan, fruit quality, insects, diseases, socio-economic analysis, supply chain analysis, Darwin, Katherine, Indonesia
Objective:
To address common key issues that influence the development of mango and rambutan supply chains in both Nusa Tenggara Barat (NTB), Indonesia and Australia.
Background:
The project started in 2008 in Australia and in Indonesia. Departmental scientists conduct assessments and trials on the factors that affect the quality of mango fruit, particularly damage caused by insects and by pre and post-harvest diseases in Australia. Scientists from three institutions (the Assessment Institute for Agriculture Technology, Dinas Pertanian and the University of Mataram) in NTB are carrying out similar research with periodic visits by the Australian team.
Method:
In Australia, the project has finalised work on mango flower insects, started trial work on management interventions to control insect pests in mangoes and has assessed alternative post-harvest fungicides. Two insect trials this season involved the use of systemic soil-applied insecticides to control leaf hoppers. Further work is planned for this season on mango quality to accurately assess defect levels at different times in the

ANNUAL RESEARCH REPORT 2008-09
season and at different locations. It is also intended to study the effect of different harvesting techniques on mango quality and on pre and post-harvest fungicides.
In Indonesia, samples were taken to identify major quality constraints in both crops. A range of appropriate management interventions were identified to deal with observed quality constraints in both crops. Trials commenced on post-harvest fungicides and a survey was conducted of mango growers in Lombok for a range of socio-economic factors. An economic analysis of Lombok supply chains for mangoes and rambutan has been completed. Trials are also under way on the control of leaf hoppers with soil-applied systemic insecticides to complement the trials carried out in Australia. A crop loss assessment trial is also progressing to quantify the effects on quality and yield of leaf hoppers, red-banded mango caterpillars and anthracnose.
Results:
The work on “Mango flower insects and their effect on fruit quality” has been reported separately in this publication. The systemic insecticides appear to give good control, but results will be reported in detail next year.
Post-harvest diseases were assessed and the effectiveness of a number of post-harvest chemicals was tested in Australia and Indonesia. In Indonesia, varieties Harumanis and Gedong gincu showed relatively low levels of post-harvest diseases, despite poor storage conditions. The fungicide dip fludioxonil was the best treatment, reducing the incidence of anthracnose to below 5% after nine days of storage compared with 50% in untreated controls. In Indonesian varieties, it may be possible to rely on post-harvest treatments to control post-harvest rots.
In Australia, post-harvest fungicides failed to give adequate protection from disease in KP in two separate trials (see separate report in this publication). The disease pressure on the fruit prior to harvest was so great that the post-harvest treatments were ineffective. This trial emphasised the importance of pre-harvest treatments to control post-harvest diseases in KP in Australia.
A socio-economic analysis of mango growers in Lombok was conducted using 100 growers at three sites: North, East and South Lombok (in the areas of Bayan, Pringabaya and Sekotong, respectively). The main parameters measured were land area, mango tree numbers, income from mangoes, other farm income and total income. Most farms were very small with less than 100 mango trees. Farms in Bayan were larger with more farmers with more than 100 trees, whereas in south and east Lombok no farmers had more than 100 trees. Mangoes contributed 12% to 30% to total family income in an area where family incomes per year averaged from Rp10 million to less than Rp 1 million. Income per tree was low, from an average of only 3000 Rp/tree to 30 000 Rp/tree.
The results indicate that income from mangoes in Lombok should be far more than at present. Most farmers were receiving 500 to 1000 Rp/kg but reported yields were very low, at less than 10 kg/tree. Low yields may be due to insect attack at flowering (plant/leaf hoppers), early fruit drop caused by red-banded mango caterpillars, fruit flies and red-banded caterpillars at harvest. Reported yields are lower than from trees harvested as part of quality sampling where the average yield was around 80 to 120 kg. Low yields may also reflect the fact that many mangoes are not picked because of low prices and an oversupplied market.
The findings of the supply chain analysis and the farmer socio-economic survey support the original hypothesis of this project that farmer incomes from mangoes were low due to low local market prices, not because of unreasonable mark ups in the supply chain. It supports the conclusion that attempting to grow mangoes for export may be financially and technically possible in an attempt to lift the income of farmers, especially for those in the drier areas of north Lombok. However, the finding that fruit of the Gedong gincu

2008-09 PLANT INDUSTRIES
variety are too small for export is a significant risk to the future of the project. Attempts are being made to increase fruit size with better management and to assess export market implications.
Rambutan quality in Lombok was good with 30 to 40% of fruit meeting export grades. Fruit size was an issue, particularly later in the season. Early in the season (November), suspected powdery mildew was very common (49% of fruit affected) but there was none late in the season (February). Later in the season, white scale (28-42%) and mealy bug (6-20%) defects were more common as were black rots (19-34%).
PROJECT: Mango Flower Insects and their Effect on Fruit Quality
Project Officers: D. Chin, H. Brown, M. Neal and B. M. Thistleton
Location: NT
Keyword(s): thrips, dimpling bugs, plant hoppers, caterpillars, fruit spotting bugs, fruit flies, green tree ants, insects, mango, flower panicle, fruit quality, Darwin, Katherine
Objective:
To develop a species list of invertebrates found in mango flower panicles and on developing fruit, and to determine their effect on fruit quality.
Background:
Mangoes are the most important horticultural crop in terms of value and production in the NT. The main production areas are in the Darwin and in Katherine regions. Mangoes are a dry-season crop, flowering from May onwards and fruit is harvested between October and December.
The project conducts research on insects that affect fruit quality and is a part of the ACIAR Mango Quality Project. Results of the trials are provided to growers through ‘Delivering Mango Technology’ workshops.
Initially, the project was funded by DRDPIFR to assist growers in monitoring their orchards and to provide advice on integrated pest management during 2004 and 2005. The project focused on determining the effect of flower pests on fruit quality as well as observing the diversity of pollinators and natural enemies of the pests that visit or occupy flower panicles.
During the 2007 season, trials were carried out in Katherine to examine the diversity of invertebrates in flower panicles as well as to assess the species range of thrips on small developing fruit-lets. In 2008, the trials concentrated on examining small developing fruit to determine if there was an association between fruit abortion and insect damage as well as to inspect mature fruit prior to harvest in both the Darwin and Katherine regions.
Method:
During 2008, four orchards were sampled in Darwin and three in Katherine. There were two sampling periods, one during early fruit development when the fruits were 2 to 45 mm (August for Katherine and September for Darwin) and a sampling period when the fruits were mature, just prior to harvest (October for Katherine and November for Darwin). During the first sampling period, 60 fruit-lets were harvested and

ANNUAL RESEARCH REPORT 2008-09
inspected at each orchard for damage and all insects on the fruit were recorded. In the final sampling period, mature fruits were inspected for insect damage and the proportion of the fruit surface area that was affected by insects was recorded.
Results:
Dimpling bug (Campyloma austrina Malipatil (Hemiptera: Miridae) and flower thrips (Thysanoptera) were shown to be associated with minor blemishes on the fruit surface; however, the fruit usually grows out of the damage and any marks on the fruit surface caused by insects were only minor when observed just prior to harvest. The species of thrips that causes damage to developing fruit was not confirmed. During the 2008 trials Thrips imaginis Bagnall (Thysanoptera: Thripidae), Thrips hawaiiensis (Morgan) (Thysanoptera: Thripidae) and Phlaeothridae (Thysanoptera) were occasionally collected from small developing fruit-lets, although it is unlikely that these species were feeding on the fruit. It was determined that other insects, such as the mango plant hopper, (Colgaroides acuminata (Walker) (Hemiptera: Flatidae) the fruit-spotting bug (Amblypelta lutescens lutescens) (Distant), mango scales, (Pseudaulacaspis cockerelli) (Cooley) (Hemiptera: Diaspidae) and Aulacaspis tubercularis Newstaed (Hemiptera: Diaspidae), caterpillars (various species in the families Pyralidae and Noctuidae), fruit flies (Bactrocera jarvisi) (Tryon) and (Bactrocera tryoni) (Froggatt) and green tree ants (Oecophylla smaragdina) (Fabricius) (Hymenoptera: Formicidae) were occasionally noted to cause blemishes or damage to the fruit (Table 1.). Pests that affect the yield, such as flower caterpillars (Lepidoptera, various families) and mango leafhoppers (Idioscopus nitidulus) (Walker) (Hemiptera: Cicadellidae), were well managed at the orchards and they were rarely observed during the sampling periods.
During the first sampling period of the immature fruit (fruit-lets 2 to 45 mm), each fruit-let was noted if it had been aborted and whether the abortion was associated with insect damage. The rate of abortion was recorded as a percentage of the fruit affected in 60 fruit-lets sampled per orchard (Table 1).

2008-09 PLANT INDUSTRIES
Table 1. Insects recorded on immature and mature mangoes associated with fruit quality and the effect on fruit abortion (of immature fruit)
Immature fruit (2-45 mm)
Mature fruit (pre-harvest)
Abortion due to insects (immature fruit 2 to 45 mm) (%)
Abortion not due to insects (immature fruit 2 to 45 mm) (%)
Thrips and dimpling bug damage – more obvious
Thrips and dimpling bug damage – slight
Darwin 1.67 Darwin 20.85
Plant hoppers - occasional
Plant hoppers – occasional to common, may cause sap-burn from feeding at stem end
Katherine 2.49 Katherine 16.10
Mango scale – occasional and minor
Green tree ants - occasional
Green tree ants – occasional, formic acid spray causes black spots on fruit
Caterpillar damage – occasional and minor
Caterpillar damage – occasional and minor
Other: bird damage, cleavage scar, prominent lenticel, sap-burn, splitting
Acknowledgements:
We would like to thank the following growers who kindly provided their orchards for monitoring: K&M Mangoes, Jabiru Tropical Orchards, Ballongilly, Manbulloo, Oolloo, Tukanup, Colton Park Trading Pty Ltd, Wayne Saunders and WE Pack.

ANNUAL RESEARCH REPORT 2008-09
PROJECT: The Northern Territory Economic Insect Reference Collection and the Australian Plant Pest Database
Project Officers: B. Thistleton, H. Brown, L. Zhang, D. Chin, M. Neal and A. McLennan
Location: NT
Keyword(s): insects, collection, Australian plant pest database
Objective:
To develop, curate and maintain a reference collection and associated database of economically important arthropods relevant to various NT agricultural and horticultural industries and to allow access to those records to approved users at other institutions through the Australian Plant Pest Database (APPD).
Background:
The NT Economic Insect Reference Collection (NTEIRC) was initiated in 1970 and has become the main insect reference collection in the NT. During the past 25 years, the objectives of the collection have changed from general entomology to economic entomology. The NT Museum is now responsible for general collections and most of the non-economic specimens were donated to it in 1992. NTEIRC now contains mainly economically important arthropods from agricultural, horticultural, quarantine and domestic sources, as well as a small number from general collection.
APPD is a national web-based virtual database, consisting of 15 databases resulting from a major collaboration between the industry, State and Commonwealth Governments, research organisations and universities. APPD is supported and managed by Plant Health Australia and the Commonwealth Department of Agriculture, Fisheries and Forestry.
Method:
Specimens are collected during the course of entomology extension and research work or brought in by clients for identification. They are then preserved, numbered and recorded in a relational Microsoft Access database and the NTEIRC database, which is one of the components of APPD.
Initially, project funds were used to record data on APPD. Currently, the funds are used for the verification of records, which includes checking the accuracy of the data in each field and, where necessary, verification of the identification. This is achieved by submitting specimens to taxonomists or by arranging for taxonomists to work at the collection site. Cate Lemann and Tom Weir from the Australian National Insect Collection at CSIRO in Canberra spent several days in 2008 verifying specimens in the collection, particularly Coleoptera and Hemiptera.
Results:
The collection currently has 42 312 specimens. Data related to the specimens is recorded on the NTEIRC database. Three quarters of the records have been verified for accuracy. Currently, NTEIRC data is

2008-09 PLANT INDUSTRIES
accessed from a copy sent on compact disk to CSIRO in Canberra. The APPD software is being put on a new server at the Victorian Partnership for Advanced Computing. Once this has been done, it will be possible to access NTEIRC on-line.
During 2008-09 the Section forwarded 107 specimens to specialist taxonomists for species identification or confirmation. Most specimens were of economic significance.
The following were newly recorded during 2007-09. They are recorded by locality as ‘new NT, new Australia, or new host (NT).
Acarina
Amerosiidae • Amerosius sp.
- Ex. hay shed (new NT) Eriophyidae
• Brevipalpus californicus (Banks) - Ex. leaves of Lycopersicon esculentum (new host)
• Calomerus novahebridensis Keifer - Under calyx of Cocos nucifera (new Australia)
Tetranychidae • Tetranychus gloveri Banks (new Australia)
- Ex. leaves of Hymenocallis speciosa (new Australia)
• Tetranychus neocaledonicus (Andre) - Ex. leaves of Codiaeum variegatum (new host) - Ex. leaves of Hibiscus (new host) - Ex. leaves of Canna lily (new host) - Ex. leaves of Acalypha wilkesiana var. moorei (new host)
Tenuipalpidae
• Brevipalpus ?lewisi McGregor - Ex. leaf buds of Vitis vinifera (new host)
Coleoptera
Cerambycidae • Stromatium longicorne Newman
- Ex. wood in house (new Australia) Scarabaeidae
• Protaetia fusca Herbst - Ex. Albizzia lebbeck (new host)
Diptera
Tephritidae • Bactrocera aquilonis Tryon
- reared from larva in fruit of Citrus glauca (desert lime) (new host) - Reared from larva in Dendrobium sp. (New host)

ANNUAL RESEARCH REPORT 2008-09
Hemiptera
Conchaspididae • Conchaspis angraeci Cockerell
- Ex. stems of Carphalea kirondon (new host) Diaspididae
• Aonidiella orientalis(Newstead) - Ex. leaves of Cycas angulata (new host)
• Lepidosaphes tappleyi Williams - Ex. leaves of Rhizophora stylosa (NAQS specimen) (new NT)
• Lindingaspis rossi Maskell - Ex. leaves of Ficus sp. (new host)
Lepidoptera
Noctuidae • Achaea janata Linnaeus
- Ex. leaves of Acacia mangium (new host) • Raparna lugubris Turner
- Reared from larva feeding on Pterocarpus indicus (new NT) Pyralidae
• Tirathaba rufivena Walker - reared from larva in fruit seed of Bismarkia palm (new host)
Orthoptera
Acrididae • Austracris guttulosa Walker
- feeding on leaves of Zea mays (new host)
Thysanoptera
Thripidae • Copidothrips ortarticulatus Schmutz
- Damaging leaves of Spathoglottis plicata (new host) • Frankliniella schultzei Trybom
- Ex. leaves of Capsicum frutescens (new host) - Ex. flowers of Anacardium occidentale (new host)
• Pezothrips kellyanus Bagnall - Ex. flower panicle of Mangifera indica (new NT)
• Scirtothrips dobroskyi Moulton - Damaging leaves of Spathoglottis plicata (new host)
• Scirtothrips dorsalis Hood - Ex. leaves of Capsicum frutescens (New host)
• Thrips coloratus Schmutz - Ex. flowers of Anacardium occidentalis (new host)
Phlaeothripidae • Nesothrips latriventris Karny
- Ex. growing tips of Khaya senegalensis (new NT)

2008-09 PLANT INDUSTRIES
PROJECT: Best Practice IPM Strategies for the Control of Major Soil-borne Diseases of Vegetable Crops in Australia –Fusarium Wilt in Snake Beans in the NT
Project Officers: B. Condé, M. Traynor, D. Cumberland, M. Hearnden and L. Ulyatt
Location: Darwin
Keyword(s): diseases, snake beans, Vigna unguiculata sesquipedalis, Fusarium wilt, Fusarium oxysporum f.sp. tracheiphilum, disease management, grafting
Objectives:
To develop IPM controls for soil-borne diseases, specifically Fusarium wilt in snake beans in the NT.
To promote appropriate IPM controls for soil-borne diseases, specifically Fusarium wilt in snake beans in the NT.
To characterise further the strains of snake bean Fusarium wilt by collecting isolates from the field, storing them and subjecting them to race differential infection analysis, VCG and molecular analysis.
Background:
Fusarium wilt caused by Fusarium oxysporum f.sp. tracheiphilum (Fot) was first detected in snake beans (Vigna unguiculata s.sp. sesquipedalis) in the NT in mid-1999. By 2002, 75% of farms growing snake beans were infected, causing a decline in production by 50% (from 483 to 253 tonnes). After slumping for several years due to the effects of the Fusarium disease, production soared again in 2005 with a record production of 690 tonnes worth $3.105 million due mainly to farmers moving to new uninfected land because of the incentive of very high market prices (Greg Owens, pers. com). These new areas of land became infected with Fot due to contamination by vehicles, farm implements, farm produce, or due to the use of seed contaminated with Fot. This was evidenced by the 2006 production of 300 tonnes valued at $1.4million. Research from late 1999 to 2005, which was funded by the NT Government, showed that there were at least three strains differentiated on culture characteristics, particularly colour, designated as plum, white and pink. Seventy-four snake bean lines and eight lines of cowpeas were screened for resistance to the three strains of snake bean Fusarium wilt. The snake beans demonstrated varying degrees of resistance to the Fusarium wilt. Four cowpea types were found to be resistant to all three strains of Fot. The cowpea variety, (Iron) was chosen as a rootstock for grafting snake beans because of its excellent resistance, its strong root system and because it also possessed resistance to root knot nematode caused by Meloidogyne incognita and M. javanica. This grafting technique was publicised in Agnote I61: Grafting Snake Beans to Control Fusarium Wilt, which was published in 2002. HAL grant VC01725 on the national “Best Practice IPM Strategies for the Control of Major Soil-borne Diseases of Vegetable Crops throughout Australia. (Vegetable pathology subprogram 2.2)” allowed experimental work on the snake bean Fusarium problem to re-commence in February 2009.
Method:
A national road show workshop was planned for Darwin to present and demonstrate IPM techniques for reducing the impact of soil-borne diseases. This was to include the locally important snake bean Fusarium

ANNUAL RESEARCH REPORT 2008-09
wilt disease and the technology of controlling it by grafting onto resistant rootstock. The effectiveness of grafting snake beans as a method of controlling Fusarium wilt disease was demonstrated by on-farm field trials comparing rows of grafted plants with rows of seedling plants, set up in consultation with the biometrician. Snake bean farms with a history of Fusarium wilt were considered as potential trial sites. Individual seedling and grafted plants were numbered and labelled with pot labels. Plants were assessed weekly for external and internal symptoms. Samples were collected to confirm Fusarium wilt, to indicate the strains of Fot at the trial sites and for later characterisation of the strains. It is intended to arrange field days for farmers to demonstrate the effectiveness of grafting as a technique for controlling snake bean Fusarium wilt.
Results:
The Darwin national road show workshop was held on 24 September 2008, attracting seven local farmers. The local segment of this workshop consisted of a demonstration of the Fusarium wilt disease and the grafting technique utilising the Iron cowpea rootstock to combat the disease. Field trials of grafted vs. non-grafted plants were established in 2009 on four farms: Acacia Hills, Berry Springs, Buckley Road and Lambells Lagoon. The Berry Springs site was known to have an extremely high level of Fusarium wilt. Seedling snake bean crops could not be grown successfully at the Acacia Hills site, so the level of Fusarium wilt was gauged as moderately high. A small number of test snake bean plants grown at the Buckley Road site to assess the level of Fusarium infection in 2008 prior to the 2009 field trials, did not succumb to wilt, suggesting that the level at that site was low. Each trial plant at each site was tagged on pot labels with its seedling or grafted plant number. Plants were assessed weekly for wilt symptoms, internal vascular browning and subsequent death, from 10 June. Samples were collected to confirm the presence of disease and to process isolates of Fot for later characterisation. By 24 June, there were 35/84 (41.7%) infected seedling plants and 3/84 (3.6%) dead seedling plants at the Berry Springs site. Infection levels at the Acacia hills site were more moderate with 6/120 (5%) infected and 2/120 (1.7%) dead by 24 June. There were no infected or dead plants at the Buckley trial site during the weekly assessment on 24 June. However, several snake bean plants outside the trial site were either affected with wilt or were dead. There were no Fusarium wilt infections at the Lambells Lagoon site by 24 June. None of the grafted plants developed wilt. Samples of wilted plants were collected from the trial sites and also from another farm in the vicinity of the Acacia Hills trial site to confirm the presence of Fot and for characterisation of the strains. That farm had about 10% infection and expressed an interest in grafting snake beans on to cowpea to control the Fusarium wilt.

2008-09 PLANT INDUSTRIES
Figure 1. Mark Traynor (DRDPIFR) demonstrating grafting procedures to Vietnamese growers (photo courtesy of Caroline Donald)
Figure 2. The grafted snake bean (left) and the non-grafted snake bean (right) infected with Fusarium oxysporum f. sp. tracheiphilum

ANNUAL RESEARCH REPORT 2008-09
PROJECT: Strategy and Progress of a Tree Improvement Program for African Mahogany (Khaya senegalensis) in the Northern Territory
Project Officers: D. Reilly, D. Marcsik, P. Bergin with Dr G. Nikles and G. Dickinson of the Queensland Forestry Research Institute
Location: NT
Keyword(s): forestry, mahogany, genetic selection, clone, Darwin, Katherine
Objectives:
To facilitate the deployment of genetically superior clonal material for commercial adoption.
To estimate the genotype x environment interaction at the clone level across many sites.
To check that rooted cuttings are not inferior (root development) to seedlings after 10 years.
To investigate provenance and other genetic variation, including genetic parameters.
To establish a clone test of five replications on the optimal ‘red’ soil and another clone test of three replications, (being a sub-set of the larger trial) on the ‘grey’ podzolic soil, regarded as sub-optimal for growing trees.
Background:
Research on dry zone mahogany (Khaya senegalensis (Ks) began in Darwin in 1959. This early work was conducted by the Forest Research Institute, later to be known as CSIRO. Some of the early plantings still exist; some are over 1 m in diameter.
The good early growth and survival of the plantings showed that this species had potential in the Top End. In the 1970-71 wet season, CSIRO established the first provenance trials at Gunn Point, just north of Darwin and on Melville Island. Trials were established over three consecutive years with 20 different provenances represented within the trials. The provenance trials are probably one of the broadest extant collections of the species – certainly in Australia.
The broad genetic base (see below) of K. senegalensis in the NT mainly comprises stands planted in the early 1970s. Primary breeding needs are to rapidly improve stem straightness and to reduce the occurrence of large branching while maintaining the high quality timber characteristics reported in a joint study in Queensland (AFFS-FR/NT DBIRD/RIRDC) to evaluate the timber characteristics and drying requirements of this species.
Method:
Superior trees were selected in 2000. They were grafted and then planted in December 2001 in a clonal seed orchard and a gene re-combination orchard, at Howard Springs and Berrimah Farm, respectively.

2008-09 PLANT INDUSTRIES
In October of 2003, 38 mature-age trees were selected and harvested for a timber evaluation study of the species. Most of these trees were taken from Gunn Point and were among the original 96 selects that were grafted and planted in the seed orchards. The remaining trees were selected from known provenances of the same age planted at Howard Springs.
Of the harvested trees at Gunn Point, 11 had mature seed pods, which were collected, grown and planted out at Berrimah Farm in family rows. With the addition of seedling material from Weipa in north Queensland and vegetatively-produced cuttings from selected areas at Howard Springs, the first Hedge Garden (HG) was established in March of 2004.
Further additions have been made with coppice (stump re-growth) from some of the harvested trees at both harvest sites. Within HG, more than 560 individual plants have potential to yield cuttings that can be propagated and deployed as rooted cuttings in clone tests at a number of sites. There are now 10 clone tests established at Coastal Plains, DDRF, and Katherine and on commercial properties from Melville Island in the north to the Douglas Daly region and Katherine in the south. The composition of the recently established clone tests is outlined in Table 1.
Results:
Testing of clonal material of Khaya senegalensis is continuing across a number of sites and locations. The vegetatively-propagated rooted cuttings are evaluated against each other and compared with the seedling controls.
Table 1. List of rooted cuttings from the Berrimah HG and some background information on timber yield and green off-saw (GOS).recovery
Ks plus tree no. prov.
Number of seedlings in HG of each family
Phenotypic status GOS recovery (%)
3 33 A 46.6 10 16 Not in top 38 12 33 A 33.0 18 17 41.0 19 30 A 45.4 70 32 39.2 122 67 A 50.6 151 32 36.3 158 32 31.7 166 32 31.1 169 20 A 35.2 Weipa 114

ANNUAL RESEARCH REPORT 2008-09
Table 2. Composition of Ks clone test (rooted cuttings) for the ‘5 replicate’ trial established at the AMA property (Douglas Daly) planted 17-18/12/08
HG number Family ID No. planted Mean height (mm) June ‘09 1-33 3 20 23.03 34-49 10 7 31.4 50-66 18 9 30.6 67-99 12 11 30.4 100-132 19 21 23.5 133-165 70 24 28.07 166-231 122 35 27.02 232-264 151 17 32.02 265-297 158 10 34.05 298-330 166 25 32.92 331-350 169 11 32.67 351-363 Weipa 10 30.44 430-528 Weipa 57 37.01 364-429 H. Springs wildling 47 32.34 529-557 Stump coppice/ RC 13 31.12 DST 149 31.16 Mali seedlings 249 47.9 Fills (Mali seedlings) 144 46.18
This trial of rooted cuttings consists of 47 with three ramets, 51 with four ramets and 222 with five ramets.
Table 3. Composition of Ks clone test (rooted cuttings) for the ‘three replicate’ trial established at the AMA property (Douglas Daly) planted 17-18/12/08
HG number Family ID No. planted Mean height (mm) June ‘09 1-33 3 2 28.33 34-49 10 0 * 50-66 18 0 * 67-99 12 0 * 100-132 19 2 39.58 133-165 70 2 31.66 166-231 122 1 33.33 232-264 151 2 48.75 265-297 158 0 * 298-330 166 7 34.64 331-350 169 3 27.77 351-363 Weipa 0 * 430-528 Weipa 17 37.34 364-429 H. Springs wildling 12 34.72 529-557 Stump coppice/ RC 6 38.33 DST 29 40.86 Mali seedlings 51 46.66
There are 54 HG numbers with three ramets. * Indicates no clones planted.

2008-09 PLANT INDUSTRIES
The tables indicate that rooted cuttings from all families in HG are represented in this clone test in addition to seedlings as controls from Darwin streets, entry 580 and a seed collected from Mali, entry 585 (‘fills’ in the last two replicates). In replicates 4 and 5, clone numbers with insufficient ramets are replaced with ‘fills’ (Mali seedlings).
This is the first clone test evaluation established on land owned by African Mahogany Australia in the Stray Creek region of the Douglas Daly basin. It also illustrates the collaboration and cooperation between commercial plantation enterprises and NT/Queensland Governments.
Acknowledgements:
Thanks to Gordon Coward and Andrew McKenzie for their remarkable assistance and cooperation during a difficult period. Thanks also to Doris Marcsik, Peter Bergin, Nick Hartley, Libby Doney and Graham Schultz for establishing, fertilising and measuring activities.
PROJECT: Environmental Impacts of Agriculture – a Literature Review
Project Officer: S. Smith
Location: Darwin
Keyword(s): environment, water, soil, agriculture
Objective:
To review published literature on the impact of plant industry practices on the environment, particularly, water and soil.
Background:
Gaining a clear understanding of the environmental impacts of agriculture (including cropping, forestry and horticulture) at the paddock level has been identified as a goal of the Plant Industries Division of DRDPIFR. Before resources are committed to achieve this goal, there is a need to review what has already been investigated in the NT and to identify knowledge gaps where further work is needed.
Conducting this review will benefit the department and/or stakeholders by:
• Clearly showing what has already been achieved so that duplication of effort is avoided. • Identifying the issues that are of concern and priority to the government/community so as to align
future effort to them. • Developing new projects that align with priority issues so that internal and external funding can be
obtained. • Gathering information and reviewing it so it can be used for policy development.

ANNUAL RESEARCH REPORT 2008-09
Method:
Online databases of relevant reference material were searched using the resources of the Primary Industry Library at Berrimah Farm. The catalogues of both the Primary Industry and NRETAS libraries were also searched. Staff from the Plant Industries Division submitted printed material in their possession.
References were catalogued in an on-line reference system (Refworks). This system was also used to manage citations and references in the text.
Results:
Written material on the impact of plant industry activities on water and soil in the NT was gathered, referenced and then stored on Refworks. Reference material included information from the 1940s up to the present. Technical Bulletin 330, titled The Environmental Impact of Plant Industries on Inland Water in the Northern Territory was published in January 2009. It summarised the literature up to then. The information was also presented in a ‘Knowledge seminar’ at Berrimah Farm in September 2008. A similar report on the environmental impact of plant industries on soil is planned to be published in 2009-10 from reviewed material.

2008-09 ANIMAL INDUSTRIES
ANIMAL INDUSTRIES
Animal industries projects conduct applied research in controlled trials to discover solutions to problems that affect productivity and profitability of the industry and, where possible, to protect the environment and human health.
PROJECT: 21st Century Pastoralism
Project Officer: A. Bubb
Location: Alice Springs
Keyword(s): Aboriginal, indigenous, desert pastoral
Objectives:
To provide research, development and extension services to commercial pastoral producers in the Alice Springs region and the broader desert regions of Australia as a component of the Desert Knowledge Cooperative Research Centre.
To increase the economic and livelihood opportunities associated with desert pastoralism by developing unique enterprise models, economic development systems and pastoral management systems that provide tangible benefits to producers.
Background:
The 21st Century Pastoralism project aims to increase the economic viability of desert pastoral enterprises. The project has analysed the cost/benefit of labour saving devices, including telemetry systems. The project has also created a remote livestock management system: ‘WaterSmart’, which evaluates commercially available products for delivering and monitoring stock water.
The Cattle and Country project completed evaluations of the Kimberly Indigenous Management Support Service (KIMSS) and the Indigenous Pastoral Program (IPP) and also reviewed indigenous participation in the northern beef industry for Meat and Livestock Australia (MLA) and the Indigenous Land Corporation (ILC).
Method:
The cost of bore runs at three stations was determined in the Utilising Technology project and telemetry systems were installed on all of them.
The development of a remote livestock management system (incorporating “walk-over weighing” and “auto drafting”) has continued to an advanced commercialisation phase. Two units were purchased by DRDPIFR for research purposes.
The Cattle and Country project completed evaluations of KIMSS and IPP and also reviewed indigenous participation in the northern beef industry for MLA and ILC. The evaluations and review were based on extensive stakeholder interviews and visits.

ANNUAL RESEARCH REPORT 2008-09
Results:
The telemetry systems in the Utilising Technology and WaterSmart projects generated significant savings for the properties involved, reducing the cost of monitoring and maintaining stock water by 30-50%. The investments in the new technologies ranged between $30 000 and $70 000 and had a cost recovery period of six to 24 months.
The remote livestock management system was used in commercial operations at Napperby Station for data collection and mustering purposes. Drafting accuracy has been increased to 96% and walk-over weighing accuracy has also significantly improved.
The findings of the evaluation of KIMSS and IPP were presented to ILC in two individual reports. The Indigenous Pastoral Employment Review identified the lack of a clearly defined career pathway as the greatest impediment to long term Aboriginal employment in the pastoral industry. An economic analysis of Aboriginal- focused training programs to increase participation in the pastoral industry has shown high returns to the NT.
PROJECT: Rangeland Grazing Strategies for Improved Economic and Resource Sustainability
Project Officer: C. Materne
Location: Alice Springs
Keyword(s): grazing strategies, rotation grazing, spelling
Objective:
To develop industry-acknowledged best practice guidelines for two grazing strategies in Central Australia that incorporate spelling and that contribute to improved economic viability and resource sustainability.
Background:
Best practice guidelines for Central Australian spell grazing strategies
Over the past decade, the ongoing cost-price squeeze has forced pastoralists to look at using their land more efficiently. There has been widespread interest by the industry in spelling practices, which hold the potential for increased or sustained production without damage to natural resources. However, such a potential has been little documented, particularly at a practical whole-of-property/business level. Heytesbury Beef established a major commercial trial of intensified land use in the tropical savannah region of the VRD at Pigeon Hole Station. A similar project by pastoralists is underway in the southwest rangelands of Western Australia to monitor the effects of various practices at a property level. A Meat and Livestock Australia project in Queensland is exploring the environmental and economic benefits, and cost of, different grazing systems, particularly cell grazing. Current trials cover summer and winter-dominant rainfall regions of the rangelands but leave out the seasonal and more variable sector of the rangelands from western NSW and south western Queensland through Central Australia to the Murchison in WA.

2008-09 ANIMAL INDUSTRIES
The major benefits of spell-grazing practices are likely to be:
1. Opportunities to spell country at critical times for pasture regeneration.
2. Closer observation of the condition of the country for the benefit of both quality stock production for market and resource sustainability.
3. Consequent better drought preparedness.
4. Potential for carbon sequestration and production of offsets for trading.
Potential risks of spell-grazing include:
1. Capital costs for setting up a more intensively-fenced and watered system.
2. Errors of judgment in leaving stock on country for too long (though offset by damaging less area in one go), probably made riskier in regions with a more variable climate or fragile soils.
3. Lack of access to markets at critical times.
Method:
Two grazing trials are being conducted in Central Australia, one on a pastoral property (Mt Riddock) and one at Old Man Plains Research Station.
At Mt Riddock, steers are grazed through an eight-paddock rotation. Pastures are monitored pre- and post-grazing. Cattle are weighed at the beginning and end of their time in the rotation and are also weighed periodically throughout the rotation. Animal grazing and behaviour are recorded using a defoliation index and a cattle activity index. The defoliation index is a qualitative measurement of yield that has been removed. Cattle activity is a qualitative assessment of activity within a quadrat.
The Old Man Plains Research Station trial consists of a four-paddock rotation that allows for annual summer spelling of the calcareous grasslands and biannual summer spelling of the more resilient mulga country. Pastures are monitored pre- and post-grazing.
Results:
A final report was submitted for the 2008 trial period of this project, which was funded by the Natural Heritage Trust’s RIS program. The Caring for our Country program funded the final phase of the project until the end of 2009. By then, guidelines for the two grazing strategies will be developed.

ANNUAL RESEARCH REPORT 2008-09
PROJECT: Seasonal Burning of Mitchell Grassland on the Barkly Tableland
Project Officer: C. Materne
Location: Barkly
Keyword(s): Mitchell grassland, seasonal burning, rangeland management
Objectives:
To measure the impact of low intensity, early dry-season fires and high intensity, late dry-season fires on Mitchell grasslands and woody plant species in Buchanan paddock on Alexandria station.
To demonstrate the application of prescribed burning in the extensively-grazed Mitchell grasslands of Buchanan paddock.
Background:
Understanding the relationship between fire and Mitchell grasslands has been overlooked in the past due to a view that “Mitchell grasslands are too valuable as a pasture to be burnt” (Thackway et al. 2007). However, more recently, observations by station managers and naturalists of Mitchell grassland recovery after wildfires have stimulated curiosity as to whether seasonal fire is needed to maintain Mitchell grasslands of the Barkly Tableland in good condition. Scanlan (1980) found that burning under low soil moisture conditions followed by low rainfall was detrimental to pasture condition of Mitchell grasslands. Phelps and Bates (1996) demonstrated the use of spring fire as a tool for managing the undesirable Aristida latifolia (Feathertop wiregrass) in Mitchell grasslands of the intensively sheep-grazed areas of Queensland. The aim of this trial was to better understand the importance of seasonal prescribed burning as a management tool for Mitchell grasslands under continuous grazing and its effect on cattle production on the Barkly Tableland.
Method:
This trial consists of two parts:
1. An intensively sampled plot trial to identify the response of Mitchell grasslands to burning at two different times of the calendar year.
2. A broader paddock-scale trial to demonstrate the use of fire as a pasture management tool and its effect on the encroaching woody vegetation.
The trial was conducted at Alexandria Downs station between 2001 and 2004. The trial site (dominated by Astrebla pectinata - barley Mitchell grass and A. elymoides - weeping Mitchell grass) is in the sub-tropical (distinctively dry winter) grassland climate zone and has a median annual rainfall of 350 mm. The effects of early and late-dry-season burning on native trees and shrubs, pasture dynamics, cattle diet quality and grazing characteristics were investigated using a randomised three plot (25 ha each) block design with four replications in a paddock under conservative continuous grazing. Tree and shrub data was collected from individuals selected prior to treatment. Pasture yield, species composition and cover were collected from 50x1 m2 quadrats on four parallel transects, each 400 m long. Pasture quality data was collected using the ‘grab sampling’ technique (Ash and McIvor 1995) and analysed using wet chemistry methods. Cattle diet

2008-09 ANIMAL INDUSTRIES
was analysed using NIRS on a paddock scale, replicated twice. Repeated measures ANOVA was used to test the interaction effect of treatment and time. Post priori comparisons were used to test for differences between treatments within different time periods.
Results:
The financial year (July to June) rainfall totals were close to the median of 350 mm, although it became increasingly drier as the trial progressed. This followed consecutive above-average seasons (top decile) in 1999-2000 and 2000-01.
For all treatments, cover and yield (Figures 1 and 2) progressively declined over the trial period due to the decreasing seasonal rainfall (F2, 40=206, P<0.001, and F2, 40=316, P<0.001, respectively). Although no significant difference in cover (F1, 20=0.35; P=0.55) or yield (F1, 20=0.0; P=0.99) was recorded between the two seasonal burning treatments, burning itself significantly reduced both cover (F1, 20= 78.3; P<0.0001) and yield (F1, 20=35.9; P<0.0001) following the first growing season. Yield recovered but cover was still lower in burned plots after the second growing season (F1, 20=0.13; P=0.72, F1, 20=11.1, P<0.01, respectively).
Flora species richness was largely influenced by seasonal response (F2, 40=171.6; P<0.001). However, fire significantly increased species richness following the first growing season (F1, 20=7.8; P=0.01) (Figure 3). There was no significant difference between the two seasonal burning treatments after one year (F1, 20=0.4; P=0.05). The effect of fire on flora richness disappeared after two growing seasons.
Woody plant death rates increased following the burning treatments and were greatest under the late-dry-season burns (Figure 4). Considerable re-sprouting did occur following burning, but consecutive drier than average years resulted in further deaths following the second year. The height of surviving woody vegetation was reduced on average by approximately 40% regardless of burning season (Figure 5).

ANNUAL RESEARCH REPORT 2008-09
0102030405060708090
100C
over
(%)
Early Dry Burning Late Dry Burning Control (No Burning)
Pre Treatment 1 year Post Treatment 2 years Post Treatment500
1000
1500
2000
2500
3000
3500
4000
Yie
ld (k
g/H
a)
Figures 1 and 2. Seasonal burning effect on ground cover and pasture yield under grazing, with 95% confidence limits (measured in April)
Pre Treatment 1 year Post Treatment 2 years Post Treatment4
6
8
10
12
Spec
ies
Ric
hnes
s(s
pp. p
er m
2 )
Early Dry Season Burning Late Dry Season Burning Control (No Burning)
Figure 3. The effect of seasonal burning on species richness within a 1 m area over time with 95% confidence intervals (measured in April)

2008-09 ANIMAL INDUSTRIES
0
5
10
15
20
0 1 2Years Since Treatment
Dea
th R
ate
per P
lot (
%) Control
Early DryLate Dry
0
20
40
60
80
100
120
0 1 2Years Since Treatment
Hei
ght I
ndex
(%)
Figures 4 and 5. Woody vegetation death rate and height under different seasonal burning regimes
In all treatments cattle activity increased over the trial period (Figure 6) due to the decreasing seasonal rainfall (F2, 40=124.9, P<0.001). Burning further significantly increased cattle activity (F1, 20=6.7; P=0.01) over at least two dry-seasons. Short-term improvements in Mitchell grass feed quality over the first growing season were found following fire (Figures 7, 10 and 11). However, NIRS sampling (Figure 8) indicated that the effect on diet was relatively small and only at the beginning of the growing season before the annual grasses and forbs germinated.
Pre Treatment (Apr)Pre Treatment (Oct)
1 year Post Treatment (Oct)2 year Post Treatment (Oct)
0
1
2
3
4
5
Gra
zing
Inde
x (0
to 5
)
Early Dry Season Burning Late Dry Season Burning Control (No Burning)
Figure 6. The effect of seasonal burning on cattle grazing activity, with 95% confidence limits
Burning

ANNUAL RESEARCH REPORT 2008-09
0
5
10
15
20
25M
itche
ll G
rass
Cru
de P
rote
in (%
)Burnt (Buchanan & Heidi's Pdks) Unburnt (Buchanan, Playford & Bull Pdks)
0
2
4
6
8
10
12
14
01-O
ct-0
1
01-N
ov-0
1
01-D
ec-0
1
01-J
an-0
2
01-F
eb-0
2
01-M
ar-0
2
01-A
pr-0
2
01-M
ay-0
2
01-J
un-0
2
01-J
ul-0
2
01-A
ug-0
2
01-S
ep-0
2
01-O
ct-0
2
01-N
ov-0
2
01-D
ec-0
2
01-J
an-0
3
01-F
eb-0
3
01-M
ar-0
3
01-A
pr-0
3
01-M
ay-0
3
01-J
un-0
3
Pred
icte
d D
ieta
ry C
rude
Pro
tein
(%) Burnt (Buchanan & Heidi's Pdks) Unburnt (Playford & Bull Pdks)
Figures 7 and 8. Crude protein content of late-dry-season burnt and unburnt Mitchell grass (Astrebla pectinata and A. elymoides) from grab sampling (analysis using dry chemical methodology); and the predicted cattle diet quality from dung samples (NIRS analysis), with 95% confidence limits
Figures 9 and 10. Rank pasture pre burning in December and again in late January after burning and rain
Discussion:
The greatest pasture management risk with prescribed burning in Mitchell grasslands in more arid areas is a lack of follow-up rain, and the resulting short-term feed loss and production (Daubenmire 1968; Scanlan 1980). However, dry matter differences between the burnt and unburnt plots under drier seasons appear to be due to carry over feed in the unburnt plots, rather than a lack of seasonal growth from the burnt plots. Following the second consecutive below average growing season, no difference was identified in the

2008-09 ANIMAL INDUSTRIES
available feed between the burnt and unburnt sites, similar to Scanlan’s (1983) findings even though the burnt areas remained axillary tiller-free. With adequate rainfall Scanlan (1980) found these grasslands can recover rapidly within one growing season supporting the observations found in this study.
Following fire, Mitchell grassland cover appears to require three growing seasons to recover, a finding similar to Dyer et al. (2003) in the higher rainfall Victoria River District of the NT. Cover is considered an important land condition indicator (Materne 2005 and Chilcott et al. 2007). However, personal observations, supported by Scanlan (1983), suggest the cover change was dominated by the litter component and not the more stable Mitchell grass basal area, and hence is not considered an indicator of declining land condition. This reduced litter cover is likely to have contributed to increased species richness by removing its suppressive tendencies.
Even though many woody species within the trial area are considered to be relatively fire-tolerant re-sprouters, fire still had a significant effect on survival and height.
Although short-term negative impacts were recorded following fire in the Mitchell grassland on the Barkly Tableland, the results of this trial indicate that these grasslands are resilient to fire and conservative stocking, even under less than favourable growing conditions. Late-dry-season burning has the potential to provide production benefits and can be a useful cost-effective management tool for the removal of rank pasture, reducing tree and shrub cover, and influencing cattle movements and short-term diet quality.
References
Ash, J. and McIvor, J. G. (1995). Land condition in the tropical tall grass pastures lands. 2. Effects on herbage quality and nutrient uptake. Australian Rangeland Journal. 17 (1): 86-98.
Dyer, R., Café, L., Cobiac, M. and Cowley R. (2003). Developing sustainable grazing management systems for the semi-arid tropics of the Northern Territory. MLA, Sydney, Australia.
Daubenmire, R. (1968). Ecology of fire in grasslands. Advanced Ecological Research 5: 209-66.
Chilcott, C. R., Rodney, J. P., Kennedy, A. J. and Bastin, G. N. (2005). Grazing land management – Central Australia version: workshop notes. MLA, Sydney, Australia.
Materne, C. (2005). Mitchell grasslands quality and quantity guide. BL & CA, Tennant Creek.
Phelps, D. G. and Bates, K. N. (1996). Burning can reduce feathertop (Aristida latifolia) invasion in the Mitchell grasslands. Proceedings 9th Australian Rangelands Conference. Port Augusta, Australia.
Scanlan, J. C. (1980). Effects of spring wildfires on Astrebla (Mitchell grass) grasslands in north-west Queensland under varying levels of growing season rainfall. Australian Rangelands Journal 2: 162-8.
Scanlan, J. C. (1983). Changes in tiller and tussock characteristics of Astrebla lappacea (curly Mitchell grass) after burning. Australian Rangelands Journal 5: 13-9.
Thackway, R., Eddington, M., Walcott, J., Burton, K., Frakes, I. and Randall, L. (2007). Vegetation management – Towards sustainability for vegetation management – Mitchell grasslands. BRS, Canberra, Australia.

ANNUAL RESEARCH REPORT 2008-09
Publications
A paper and a poster were presented at the 2008 Australian Rangeland Conference titled: Late dry-season burning: A Mitchell grassland management tool for cattle production.
PROJECT: Developing Sustainable Carrying Capacities in the NT
Project Officers: C. Pettit and R. Cowley (Sturt Plateau), K. Scott (Barkly) and C. Materne (Alice Springs)
Location: NT
Keyword(s): carrying capacity, Sturt Plateau, Barkly, Alice Springs
Objectives:
To develop methodologies for the objective assessment of carrying capacity, including calibration of pasture growth models, for the Sturt Plateau, the Barkly region and the Alice Springs region.
To develop methodologies to evaluate carrying capacity and enable pastoralists to make decisions on seasonal and long-term stocking strategies.
Background:
There is potential in the NT cattle industry to increase production through subdivision and intensification of land use. However, land intensification in other states has sometimes led to unviable small blocks and extensive land degradation, due to an over-optimistic assessment of land capability. To facilitate sustainable development of the NT cattle industry, it is imperative to have an objective and transparent method for estimating carrying capacity, particularly where properties are being subdivided.
This project aims to calibrate the GRASP model to facilitate estimation of sustainable carrying capacities in important grazing pasture types of the NT in the Barkly, Sturt Plateau and Alice Springs regions. The GRASP model is calibrated through the collection of pasture, soil and meteorological data from small exclosures called SWIFTSYND sites. These exclosures have been set up on areas that represent different land systems and vegetation types in order to obtain a broad viewpoint across the region.
Method:
Monitoring events (harvests) are conducted at SWIFTSYND sites four times throughout the year except for the Alice Springs region where harvests are conducted two-monthly. The timing of harvests is dependent on seasonal conditions. At each harvest, pasture, soil and rainfall data is collected from the sites.
Alice Springs
Six sites were constructed on four stations and the Old Man Plains Research Station during 2004-05. They represented the following land systems: Alcoota (Alcoota Station), Ebenezer (Mt Ebenezer Station), Muller (Old Man Plains Research Station), Outounya (Umbeara Station), Renners (Deep Well Station) and

2008-09 ANIMAL INDUSTRIES
Sandover (Alcoota Station). Harvests are undertaken when the predominant annual grasses have begun seeding (approximately 10-14 days after rain).
Good rain over November-December 2008 enabled all six sites to be sampled following a significant growth event for the first time. As a result, two sites have enough data to calibrate GRASP and will only be sampled again following an exceptionally good growth event. The remaining sites will remain operational to obtain additional data. Six new sites will be constructed during 2009-10.
Barkly
Twelve monitoring sites were constructed in the Barkly region. These sites are located at Alexandria, Beetaloo, Benmara, Brunette Downs, Helen Springs, Newcastle Waters, Rockhampton Downs and Walhallow stations. The land systems represented include: Barkly, Creswell, Pollyarra, Pollyarra/Creswell and Wonorah/Barkly1.
Harvest of the remaining four sites was due to finish in October 2009.
Sturt Plateau
There are currently ten SWIFTSYND sites located around the Sturt Plateau on five different land systems. The selected land systems are Banjo, Larrimah, Sturt, Bulwaddy and Elsey. Together, these land systems represent 71% of the total Sturt Plateau region.
All sites have been completed.
Results:
Staff from Katherine and Alice Springs attended a two-week workshop in Brisbane in August 2008 for GRASP calibration training and to assist in the documentation of the GRASP calibration process.
Alice Springs
Two sites had eight harvests and preliminary calibration of sites was completed but will be revised following the collection of additional data. Preliminary site calibration will begin on the remaining four sites.
Barkly
Data collection was completed and is in the process of being analysed.
Sturt Plateau
Two sites have been calibrated. The remaining sites are due to be completed by February 2010 in time for a Sturt Plateau GLM workshop.

ANNUAL RESEARCH REPORT 2008-09
PROJECT: Enhancing the Adoption of Improved Grazing and Fire Management Practices in Northern Australia: Synthesis of Research and Identification of Best Bet Management Guidelines (also known as the Northern Grazing Systems Project)
Project Officers: D. Walsh and K. Scott
Location: NT
Keyword(s): sustainable pastoral management, pasture spelling, prescribed fire, infrastructure development, stocking rates, Katherine, Barkly
Objectives:
To improve our understanding of interactions and trade-offs, and identify cost-effective grazing land management strategies for improving animal production and economic performance, improving and maintaining land condition (vegetation, soil health and water quality) and improving risk management in relation to climate variability.
To integrate, enhance and extend key findings and knowledge generated by completed grazing and fire research across northern Australia.
Background:
This project is the NT component of a larger northern grazing systems (NGS) project which aims to increase the adoption of innovative best-practice grazing management by beef producers throughout Queensland, the NT and the Kimberley and Pilbara regions of WA. NGS is primarily funded by Meat & Livestock Australia (MLA), with additional support from State, NT and Commonwealth Governments. The Queensland Department of Employment, Economic Development and Innovation (which incorporates Primary Industries) is the overall project manager.
The importance of infrastructure development (fencing, watering), stocking rate management, pasture spelling and prescribed burning have been demonstrated at various field study sites. However, we are unable to predict how variations and combinations of these practices will affect the productive capacity and resource condition of grazing land in particular situations. In addition, the economic and practical implications of implementing these strategies at an enterprise level are often unclear. This is limiting the rate of adoption of practices to improve grazing and fire management across northern Australia.
NGS projects will thus integrate, enhance and extend key findings and knowledge generated from completed grazing and fire research funded by MLA and other research organisations across northern Australia.

2008-09 ANIMAL INDUSTRIES
Method:
The NGS project will be conducted in two phases. Phase 1, to be completed by July 2010, will consist of three activities:
1. Regional assessment: Source, collate and report region-specific research data and herd and pasture management practices, and facilitate the input of producers and other regional specialists in identifying and assessing best bet management guidelines.
2. Synthesis: Review, analyse and synthesise data and outputs from completed field research studies across northern Australia to develop additional insights, produce relationships that assist extrapolation to a range of environments and starting conditions, and to generate a suite of best bet management guidelines and strategies for different environments and scales of operation.
3. Bio-economic modelling: Modify, link and apply existing simulation models to evaluate best bet guidelines and strategies in terms of their impacts on the productive capacity of grazing land, water quality, soil health, risk profile and economic performance.
Phase 2, to commence in approximately 12-15 months, will implement, test and increase adoption of these practices through on-property demonstration sites, field days, forums, training workshops and MLA/agency publications. It will also roll out the bio-economic modelling framework for evaluating best-practice management strategies across other regions of northern Australia and will address key research gaps identified during the project.
Results:
Workshops were held in Katherine and Tennant Creek in April 2009. Attendees included pastoralists, agricultural advisers and agency technical staff. The workshops documented current and best management practices related to infrastructure development, stocking rate management, pasture spelling and the use of prescribed fire for each region. Two “representative” properties for each region were described by participants for use in bio-economic modelling. Information was also collated on region-specific research trials for use by the synthesis team. Since those workshops, a draft set of grazing management guidelines (based on the literature and workshop input) was produced by the synthesis team and continues to be refined. The bio-economic modelling of different management practices is now underway and will be completed for some regions by the end of 2009. Once the modelling has been completed, the results will be presented at regional workshops to seek input from the industry.
This project will also produce two additional outputs that will be implemented in subsequent northern grazing systems projects. They are:
• a sub-set of the best-bet guidelines that will be extended via regional producer demonstration sites in each of the target regions; and
• priority grazing land management research questions and their justification for each target region.

ANNUAL RESEARCH REPORT 2008-09
PROJECT: Safe Utilisation Rates for NT Land Types
Project Officer: D. Walsh
Location: NT
Keyword(s): carrying capacity, pasture utilisation, sustainable pastoralism, Katherine, Barkly, Alice Springs
Objective:
To determine safe pasture utilisation rates for different pastoral land types across the NT.
Background:
The pastoral industry in the central and northern parts of the NT is currently undergoing rapid expansion and development with a focus on intensification. Dyer et al. (2001) predicted that intensification and development would continue in the northern beef industry due to the need to reduce the cost of production, increase the efficiency of production and maximise returns. This suggests that pasture utilisation will increase in the northern and central parts of the NT, but we need to do more work to determine the utilisation rates that achieve positive production outcomes without degrading the pasture resource (Dyer et al. 2001).
In the southern parts of the NT, where full development is closer to completion, there is an apparent disparity at the property level between what is considered an economically viable herd size and recommendations about safe carrying capacities (Phil Holmes, pers. comm.). This has recently been borne out during grazing trials conducted in the Alice Springs region, where large differences between scientifically-derived carrying capacities and actual stocking rates were documented (Kain 2008). Kain concluded there was an urgent need to work with industry to document current utilisation rates, investigate the rates of utilisation in areas that have good land condition and determine sustainable carrying capacities for different land types. She also recommended that more work be done to determine whether there are factors influencing carrying capacity that are not currently being taken into account in the methodology used to calculate it.
Most properties and paddocks have areas that are over-utilised or under-utilised as a result of preferential grazing behaviour, infrastructure placement and distance from water. This patchiness in utilisation directly affects the amount of animal production achieved, as well as the long-term condition of pastures. Under-utilised pasture represents beef production the industry is missing out on. Conversely, productivity and land condition suffers where pasture resources are over-utilised. The trick is finding the cross-over point that achieves economically viable animal production and maintains good pasture condition in the long-term.
Currently, the only objective NT-tested knowledge we have on utilisation rates is derived from grazing trials on black soil in the VRD and a small number of case studies on a few land types in the VRD. For black soil pastures in good condition, utilisation rates of 20 to 25% have been found to be sustainable. However, our current recommendations of 15% for pastures on productive red soils, 10% for pastures on less productive red soils and 5% for spinifex pastures remain untested. Hence, there is an urgent need to objectively assess utilisation levels of important pasture communities throughout the NT to guide sustainable development and management of the pastoral resource.

2008-09 ANIMAL INDUSTRIES
Method:
The utilisation rate is defined as the proportion of a year’s pasture growth that is consumed by cattle. This project is using methods similar to those described by Johnston et al. (1996). These methods involve calculating utilisation rates from “benchmark” grazing properties and local grazing trials and comparing them with consensus figures determined by people with long-term experience in the regions concerned. The use of benchmark grazing properties is based on the assumption that paddocks in good land condition that have a long history of grazing must have been managed using safe utilisation rates (Johnston et al. 1996). By “looking back in time” and calculating what these utilisation rates have been, we can improve our recommendations on long-term sustainable utilisation rates for different land types.
We are thus working with producers who have paddocks with pastures in good condition and several years of accurate paddock stock records. We then calculate annual utilisation rates using:
Annual pasture growth – based on pasture type and watered area (growth is estimated by pasture modelling such as GRASP or AussieGRASS).
Estimated consumption by cattle – based on the numbers, classes and approximate age/weights of cattle in the paddock (data provided by producers).
Our goal is to make recommendations based on what is considered a safe utilisation rate in the context of annual pasture growth risk. In the northern NT, an appropriate safe utilisation rate might be based on the annual growth that would be expected in an “average’ year. If, however, we based stocking rates in the southern NT on the growth expected in 50% of years, this would lead to overgrazing in five out of every 10 years and a high probability that pastures would not recover before the next dry period (Partridge, 1999). Thus, in the southern NT, where the climate (and thus forage availability) is highly variable and the risk of poor forage growth is higher, we intend to make recommendations on a more risk averse basis (e.g. manage for utilisation rates that are safe in 70% of years, as per Scanlan et al. 1994).
Results:
By February 2010, the project will produce:
• Data on intake, pasture growth and utilisation rates for at least six paddocks in the Katherine region, four in the Alice Springs region and four in the Barkly region.
• A summary of utilisation data from past grazing trials from the different regions. • Safe utilisation rates and carrying capacity guidelines for incorporation into the calculators used in
the NT grazing land management packages. • Safe utilisation rate fact sheets, which will be accessible through the Tropical Savannas CRC, North
Australia Land Manager InfoNet website and DRDPIFR.
This project is supported by external funding from the Caring for Our Country initiative of the Commonwealth Government and is due for completion in February 2010.

ANNUAL RESEARCH REPORT 2008-09
References:
Dyer, R., Cafe, L., Cobiac, M. Cowley, R. and Bryce, D. (2001). Developing sustainable grazing management systems for the semi-arid tropics in the Northern Territory. pp. 3-10 In: ‘Proceedings of the Northern Australian Beef Industry Conference’, Kununurra, WA. 8-9 November 2001. Department of Agriculture, Western Australia.
Johnston, P. W., McKeon, G. M. and Day, K. A. (1996). Objective ‘safe’ grazing capacities for south-west Queensland Australia: development of a model for individual properties. Rangelands Journal 18(2): 244-258.
Kain, A. J. (2008). Comparison of rotational grazing and continuous grazing on native pastures using a moving water point: preliminary results from Idracowra Station. Department of Primary Industry, Fisheries and Mines, Alice Springs. 12pp.
Partridge, I. (1999). Managing grazing in northern Australia – a grazier’s guide. QDPI&F, Brisbane. 54pp.
Scanlan, J. C., McKeon, G. M., Day, K. A., Mott, J. J. and Hinton, A. W. (1994). Estimating safe carrying capacities of extensive cattle-grazing properties within tropical, semi-arid woodlands of north-eastern Australia. Rangelands Journal 16 (1): 64-76.
PROJECT: Developing Sustainable Carrying Capacities in the NT – Tennant Creek
Project Officer: K. Scott
Location: Barkly
Keyword(s): carrying capacity, GRASP, SWIFTSYND, pasture growth model
Objective:
To determine the long-term safe carrying capacity of various land types in the Barkly region by measuring variables required for the pasture growth model GRASP.
Background:
Sustainable grazing of rangelands is primarily dependent on the management of pasture utilisation, especially in relation to the level of utilisation and its timing. The implementation of this principle in practice is greatly assisted by tools that can help assess two key issues:
• Long-term carrying capacity - the number of animals that a particular paddock or property can be expected to sustainably carry on average, given the climate, land type, land condition, infrastructure and management system.
• Short-term carrying capacity - the number of animals that can be sustainably carried at a specific time and for a specified period, given the current pasture standing crop and the likelihood of additional pasture growth.

2008-09 ANIMAL INDUSTRIES
Long-term carrying capacity procedures have been recently developed and tested for several regions within the ‘dry’ tropical savannas (VRD, Mitchell grasslands of Queensland, and Upper Burdekin) based on the use of the GRASP pasture growth model. To fully realise the value of this tool, there is an urgent need to:
• Develop a quick but effective procedure for customising the procedure to other regions. • Test the reliability of the procedure in ‘wetter’ regions, where other factors apart from the pasture’s
tolerance to utilisation (e.g. nutritional factors) may constrain carrying capacity. • Demonstrate the role of long-term carrying capacity as a tool for both on-property decision-making
and regional administration. • Integrate grazing tools with the wider issues of savannah health.
Method:
Data is collected in the field to calibrate the pasture growth model GRASP. On four occasions throughout the year, seven sites across the Barkly are used to collect this data. Visual estimates are taken of the amount of ground covered by grass, rocks and leaf litter, how much of the pasture is green, and grass height. Pasture samples are then cut and weighed to determine the yield (e.g. kg/ha) and percent contribution of dominant grasses, sub-dominant grasses, forbs and all other pasture species. Soil cores are dug with a hand auger, samples are collected every 10 cm to a depth of 1 m. These soil samples are analysed in the laboratory for moisture content, N content and the stem/leaf fraction.
Results:
Sampling in February 2009 revealed pasture yields of between 666 and 2089 kg/ha in the red soil country and between 2263 and 2501 kg/ha in the black soil country (Table 1). This range in yield between soil types may be a result of differences in competition with trees and soil fertility, but also simply the bulk of grass species that occupy the different habitats. For example, compare a spindly northern kerosene grass (Aristida hygrometrica) tussock on red soil and a bulky Mitchell grass (Astrebla spp.) tussock on black soil.
Table 1. Yield estimates of pasture samples in February 2009 from four common land systems of the Barkly Region, and their corresponding carrying capacity (CC) estimate for the coming year
Land system Date sampled Yield (kg/ha) CC estimate (AE/km2) Prentice (red soil) 6/02/2009 2089 2.9 Pollyarra (red soil) 24/02/2009 666 0.5 Barkly (black soil) 19/02/2009 2501 11.0 Austral (black soil) 25/02/2009 2263 9.9
Based on these yields, carrying capacity estimates for the coming year were between 0.5 and 2.9 AE/km2 for red soil, and between 9.9 and 11.0 AE/km2 for black soil (Table 1). Carrying capacity is determined by knowing (1) the amount of feed in a paddock and (2) how much feed an AE consumes in a year. But, not all of the pasture can/should be eaten. In large paddocks, cattle do not tend to utilise pastures more than 3 km from water. Also, not all of the available pasture should be consumed, in order to prevent degradation (current recommendations are 5-10% on red soil and 20% on black soil). These factors reduce the amount of available feed in the forage budget/carrying capacity calculation.
Carrying capacity estimates will vary according to land type, land condition (previous management practices), watered area (assumed to be 50% of red soil country and 80% of black soil country in these calculations) and regional rainfall patterns, so the above estimates should be treated as a guide only.

ANNUAL RESEARCH REPORT 2008-09
Indeed, more conservative stocking rates will assist in the recovery of degraded country (such as paddocks heavily stocked during the last drought).
In the red soil country (Prentice land system), the dominant (kerosene grass (Aristida hygrometrica) and sub-dominant (golden beard (Chrysopogon fallax) grasses made up about two-thirds of the pasture. Forbs and other grasses made up the remaining third of the total yield in that land system.
In the black soil country, by contrast, the dominant (barley Mitchell grass (Astrebla pectinata) and subdominant (feathertop (Aristida latifolia) grasses comprised less than a quarter of the pasture yield, and forbs made up a much larger proportion of the pasture. This seems to be a response to the good rainfall in January and was typical of the black soil sites on the Barkly this year. Subsequent sampling revealed that most of these forbs started to dry off and die by late March.
Soil moisture in February was still relatively high following good rainfall in the previous month. In the Pollyarra land system (red soil), soil moisture gradually increased down the soil profile, to be highest at 90-100 cm. Indeed, some of the samples near the bottom of the hole were dripping with water! In the Barkly land system (black soil), soil moisture was generally more uniform down the soil profile, although dry near the surface (like red soils) and peaking at 30-40 cm. In general, black soils were wetter than red soils in the upper layers (0-70 cm) and red soils were wetter than black soils in the lower layers (70-100 cm).
PROJECT: Newcastle Waters Cell Grazing Trial
Project Officer: K. Scott
Location: Barkly
Keyword(s): cell grazing, Newcastle Waters, rotational grazing, pasture utilisation, stocking rates
Objective:
To compare cell and continuous grazing through an assessment of pasture composition and animal production, and technical limitations.
Background:
Newcastle Waters station established a cell grazing trial in 2002. DRDPIFR conducted assessments of pasture composition and animal production to determine whether such a strategy had an advantage over continuous stocking in the extensive beef cattle properties of northern Australia.
Method:
Cell grazing was employed in two paddocks (Brownies and Langlands), whilst continuous stocking was employed in one paddock (Runaway). Brownies comprised four cells and Langlands comprised 10 cells. Cattle were rotated within the two cell grazing paddocks on a regular basis, though without firm ‘rules’ as to the direction of rotation or period of grazing. Assessments of pasture composition were conducted in early May and late October (dry season) during 2002-05. The paddocks were stocked with breeders and the

2008-09 ANIMAL INDUSTRIES
weight gain of their weaners was assessed. Weaners were weighed at the first and second round musters and live-weight gain was calculated.
Results:
A detailed report on this project is in the process of being produced. A brief summary of some of the finds are:
• Stocking rates and utilisation rates were comparable with those suggested for the region • Season and inter-annual variability (and fire in the last year of the trial) had a very strong effect on
grazing score (i.e. grazing activity), cover and yield. • There was no significant effect of treatment (cell grazing vs. continuous stocking) on grazing score,
cover or yield. • Live-weight gain was lower in cattle in cell grazing paddocks than in the continuous grazing paddock
in both years (significantly so for the 2004-2005 season). • Overall, the study suggested cell grazing is a viable grazing strategy in these rangelands. However,
whether it is more profitable or improves land condition, compared with continuous grazing, is questionable.
PROJECT: Using Alternate Water Points as a Means of Increasing Pasture Utilisation
Project Officer: K. Scott
Location: Barkly
Keyword(s): rotational grazing, water points, evenness, spelling, Rockhampton Downs
Objective:
To determine the feasibility of a rotational grazing system facilitated by water availability in a commercial environment, by considering pasture composition and yield, animal production, animal behaviour, labour requirement and the general practicality of implementing such a system.
Background:
As an alternative to traditional continuous stocking systems, other grazing systems, such as rotational grazing, may provide an opportunity to increase production whilst also maintaining (or improving) rangeland condition. This study reports on a three-year, innovative rotational grazing trial conducted at Rockhampton Downs station on the Barkly Tableland. Rather than installing new fences to create multiple paddocks, cattle were rotated around a paddock by controlling the availability of water at each of several new and existing water points. The central concept of the strategy was having only one water point operational at any given time.
Method:
An existing paddock was subdivided to create a control Paddock No. 8 (278 km2) and a treatment Paddock No.12 (253 km2). A continuous grazing system (previously used at the site) was used on the control paddock

ANNUAL RESEARCH REPORT 2008-09
while an alternate watering rotational grazing system was used on the treatment paddock. Three existing water points were located inside the control paddock, whereas the treatment paddock utilised a network of five water points including new 30 000-gallon (113 600 L) tanks with water troughs to which water was directed.
In May 2004, 811 pregnancy-tested-in-calf (PTIC) Santa Gertrudis heifers (mean weight 374.88 kg, age approximately 2.5 years) were placed in the control paddock, and 832 PTIC heifers were placed in the treatment paddock (mean weight 375.31 kg). One hundred heifers in each paddock were individually identified with ear tags and the performance of the tagged heifers was recorded throughout the trial. Mating was continuous and calves were weaned at muster in May and September. In May each year the weight, pregnancy status and lactation status of the tagged animals was recorded. Cattle were moved by staff to new water points every six weeks (approximately), generally in an anticlockwise direction. Intensive supervision was required to achieve the desired rotational policy. In the wet season, however, cattle were permitted to graze freely until surface water became unavailable (all water points were operational).
The species composition of pasture at the site was recorded in the early (April-May) and late (October) dry season throughout the trial (2004-06 inclusive; except the late dry season in 2005) using the BOTANAL technique (Tothill et al. 1992), to quantify changes in pasture composition and condition. Animal production parameters were quantified annually between 2004 and 2006 (inclusive) at the first round muster in May. Collected data included breeder weight, weaning weight, pregnancy status and foetal age, and lactation status (determined visually, by several operators, with breeders not ‘hand stripped’ for confirmation).
Results:
The trial was completed successfully and thus demonstrates that such a rotational grazing system can indeed be implemented on commercial beef cattle properties. This represents a substantial mind-shift away from a continuous set stocked regime traditionally employed throughout northern Australia. A detailed report on the project has been submitted to MLA and a summary of the principal findings of the study are presented below.
Infrastructure development, labour costs and management of cattle present challenges to such a strategy initially. Cattle behaviour was difficult to manage, particularly in the first two years. Cattle would often congregate at dry water points. As a result, frequent observation and interference were required, making the trial very labour-intensive. Over time though, managers devised a procedure whereby the next water point was turned on and the current water point was turned off on the day prior to moving the cattle. This significantly reduced the labour required to implement the system. Managers used the rotational grazing system to have cattle closer to the yards at mustering times, thereby saving a significant amount of time and money. These cost savings through more efficient management will help to offset the initial capital investment.
Infrastructure development (installation of new water points) increased carrying capacity by increasing the watered area of the paddock. Higher stocking rates could be achieved in areas traditionally un-grazed (by virtue of their higher yield), but this bonus will be reduced over time if not managed in a sustainable manner. Land condition (measured by species composition, yield and cover) associated with new water points in the rotational grazing paddock appeared to follow a trajectory of degradation towards that shown around old water points with a long history of continuous stocking.
Despite signs of degradation, the previously un-grazed pasture showed some initial resistance to grazing effects following the introduction of rotational grazing. For example, there was no sizeable decrease in the

2008-09 ANIMAL INDUSTRIES
abundance of the dominant perennial grass Astrebla pectinata close to new water points and no significant reduction in total species richness during the three year trial.
The rotational grazing system did not improve the existing land condition of old water points (at least for the specific regime followed in the trial and period of observation), contrary to the popular belief of rotational grazing proponents.
The design of the trial (and problems with data quality) was unable to determine whether an alternate water rotational grazing strategy resulted in differences in animal production (individual liveweight gain and breeder performance) compared with continuous grazing.
At its completion, the trial gave station managers a better understanding of the possibilities of manipulating pasture utilisation and they expressed interest in applying that knowledge to future grazing management strategies.
PROJECT: Northern Australian Beef Fertility Project – Cash Cow
Project Officer: K. McCosker
Location: NT
Keyword(s): breeder herd performance, reproduction, calf mortality, Darwin, Katherine, Barkly
Objective:
To estimate reproductive performance in cattle on commercial properties in northern Australia. Other subsidiary objectives were defined in the 2008-09 TAR.
Background:
There are many causes of sub-optimal reproductive performance in beef cattle in northern Australia. Although much improvement has been achieved in nutrition and management, there is a shortage of detailed information on the causes of mortality between confirmed pregnancy and weaning. Even where such information is available, the relative contribution of each cause of mortality is not known. This project attempts to explore some of the causes of low productivity.
Method:
Estimating mustering efficiency
Pregnancy test data was collected from four pilot property mobs prior to commencement of joining in 2007. By comparing the numbers of females mustered prior to joining with the numbers mustered in 2008 for pregnancy diagnosis, the efficiency of mustering or recapture rate could be calculated for these mobs. Across the four properties the recapture rate was 86%. Mob recapture rates ranged from 79% to 100%.

ANNUAL RESEARCH REPORT 2008-09
Mating management
All pilot heifer mobs were control-mated for periods ranging from two to six months. The average bull ratio was 3.2 % (range 2 % to 5 %). Bull breeding soundness data was available for six mobs. Most of the bulls mated to these mobs were physically sound. However, there was considerable variation in the proportion of bulls with ≥ 70% normal sperm (range 30% to 100%). The bulls were vaccinated against vibriosis in 91% of the pilot heifer mobs.
Results:
Overall pregnancy rates and measures of the efficiency of conception during the mating period
The data is summarised by broad region in Table 1. The Tropic of Capricorn was used to divide Queensland into northern and southern regions. The Australian cattle veterinarian definition of fertility was used to establish a benchmark of at least 90% pregnant within two months of commencement of mating. There were similar wide ranges in overall pregnancy rate and percentage of heifers pregnant within two months of commencement of mating in each region. Two out of the 19 mobs monitored achieved this level of reproductive performance – one mob was from the NT and one from southern Queensland (Table 2).
Table 1. Pregnancy rates of the Cash Cow pilot study mobs by region
Overall pregnant after joining (%)
Heifers pregnant within two months of start of joining
(%)
Region Average duration of joining (months)
Average Min Max Average Min Max
Southern Qld (n=12)¹
3 (2-4)²
81.9 62.0 100 74 50 97
Northern Qld (n=3)
4.3 (4-5)
78.7 65.4 96.3 71 55 87
NT (n=4)
5 (4-6)
75.9 63.3 96.9 62 42 92
Overall 3.7 (2-6)
77.7 62.0 100 72 42 97
¹ - number of mobs ² - range in duration of joining
Table 2. Benchmarking how efficiently the pilot study mobs became pregnant – percent pregnant within two months of commencement of mating
Pregnant within two months (%)
Number of mobs in each conception efficiency
benchmark
Ratio of mobs in each conception efficiency benchmark (%)
< 50 1 5 50 to 60 3 16 61 to 70 5 26 71 to 80 4 21 81 to 90 4 21
> 90 2 11

2008-09 ANIMAL INDUSTRIES
Measures of the quality of nutrition during the mating period
Again there were similar wide ranges in the body weight, body condition score and hip-height of heifers at the time of pregnancy testing in each region (Table 3). We are currently developing a method of adjusting these measures to account for the effects of stage of pregnancy and interval between start of mating to enable more accurate comparisons to be made between mobs. NIRS samples were collected from 92% of pilot properties with 72% of requested samples being collected for the pilot study. However, only 62% of pilot properties had sufficient NIRS and wet chemistry data to define wet season pasture quality. The relationships between the proportion of heifers pregnant within two months of start of joining and percent pasture digestibility and crude protein are presented in Figures 1 and 2.
Table 3. Average body condition, body weight and hip height of the pilot study heifers at the time of pregnancy testing
Body condition score (1 to 5)
Body weight (kg) Hip height (cm) Region
Average Min Max Average Min Max Average Min Max Southern Qld 3.8 2.5 5.0 443 260 618 136 115 155 Northern Qld 3.9 2.0 5.0 423 253 606 135 109 154 NT 3.3 2.0 5.0 401 200 700 136 115 187 Overall 3.5 2.0 5.0 418 200 700 136 109 187
2 m
onth
s of
the
com
men
cem
ent o
f joi
ning
joining determined by faecal NIRS analysis
010
2030
4050
6070
8090
100
Per
cent
age
of n
ot p
regn
ant f
emal
es, p
regn
ant w
ithin
45 50 55 60Mean Dry Matter Digestibility (%) of pasture consumed by mobs across 07/08
Figure 1. The relationship between mean (average) percent dry matter digestibility of pasture during the joining period and the percent in calf within two months of the start of joining for individual pilot study heifer mobs

ANNUAL RESEARCH REPORT 2008-09
with
in 2
mon
ths
of th
e co
mm
ence
men
t of j
oini
ng
across 07/08 joining, determined by faecal NIRS analysis
010
2030
4050
6070
8090
100
Perc
enta
ge o
f not
pre
gnan
t fem
ales
, pre
gnan
t with
in
5 6 7 8 9Mean Crude Protein Content (%) of pasture consumed by mobs
Figure 2. The relationship between mean (average) percent crude protein content of pasture during the joining period and the percent in calf within two months of the start of joining for individual pilot study heifer mobs
Figure 3. Location of the properties enrolled in the Cash Cow three-year study of factors affecting the reproductive performance of beef herds in northern Australia

2008-09 ANIMAL INDUSTRIES
Acknowledgement:
Project team: M. McGowan1, S. Jephcott2, J. Morton1, N. Perkins3, G. Fordyce4, B. Burns4, D. Smith4 and B. Hill4
¹The University of Queensland, School of Veterinary Science; ²Chinchilla Veterinary Services; ³Ausvet, Toowoomba; 4Queenland Department Primary Industries and Fisheries
PROJECT: Industry Initiatives to Improve Heifer Performance in the NT
Project Officer: T. Schatz
Location: NT
Keyword(s): cattle, heifer fertility, commercial properties
Objectives:
To establish current levels of fertility of heifers on commercial properties throughout the NT.
To investigate current heifer management practices and why some are not widely adopted.
To demonstrate best practice heifer management in each region and record the production that can be achieved under those systems.
To prepare a best practice manual for heifer management.
Background:
The research work in this project occurs entirely on commercial properties and decisions about what is studied are made by producers through the producer groups (Katherine Pastoral Industry Advisory Committee, Barkly Region Advisory Committee, and Alice Springs Pastoral Industry Advisory Committee) and the managers of the properties where the research work occurs.
Part of the project is to establish what the current levels of fertility are in each region and how heifers are commonly managed. This was done through a survey, the results of which have been published in the Pastoral Industry Survey NT. Copies are available from DRDPIFR Publications. The actual performance of heifers was also recorded on 14 commercial NT cattle properties.
The main body of research work is being done at demonstration sites on commercial properties in the VRD (Newry) and Alice Springs (Tieyon) regions. The data collection at these demonstration sites was completed in mid 2009. However, there is a possibility that at the Alice Springs site data collection will continue.

ANNUAL RESEARCH REPORT 2008-09
Results:
The findings from the performance recording work were summarised in the 2008 TAR and were also published in the Australian Journal of Experimental Agriculture 48: 940-944. (Schatz, T. and Hearnden, M.): Heifer fertility on commercial cattle properties in the NT.
The findings from the demonstration sites have been presented at field days. Copies of reports from the field days are available from Tim Schatz ([email protected] or 89992332).
A final report for this project will be submitted to MLA at the end of 2009 and will be available on their website and from Tim Schatz. The report is about 100 pages long and cannot be presented in this document.
A best practice manual on heifer management will be produced at the end of the project in 2009 and published in 2010.
A follow up survey was done in mid 2009 to determine how this project has impacted the NT beef industry. In the 2004 NT Pastoral Industry Survey the average of all the estimates of first-calf heifer re-conception rates by 170 managers of NT cattle stations was 63%. However, the performance recording done on commercial properties during the course of this project has shown that the figure is actually likely to be much lower. In fact, re-conception rates were found to be less than 10% on more than a third of the properties that participated and were less than 25% on eight of the 11 properties. Re-conception rates were only found to be greater than 50% on two of the 11 properties.
The performance recording has highlighted the fact that the problem of low first-calf heifer fertility is much bigger than many people realised. The follow up survey in 2009 found that the average estimate by managers of first-calf heifer re-conception rates had dropped to 42%. This shows that there is an increasing awareness of the problems with first-calf heifer fertility.

2008-09 ANIMAL INDUSTRIES
PROJECT: Understanding and Improving Heifer Fertility in the NT
Project Officer: T. Schatz
Location: Katherine
Keyword(s): cattle, heifer, fertility, Douglas Daly Research Farm, Victoria River Research Station
Objectives:
To establish a relationship between body weight/condition and conception rates for the first two joinings of Brahman heifers (joined first as yearlings and as two year-olds) in northern Australia.
To produce simple charts showing the conception rates that can be expected from mating heifers at different weights/conditions at their first two joinings.
To demonstrate and document the target weights and subsequent fertility that can be achieved under high and low input management systems in different pastoral zones of the NT and to determine the costs.
Background:
The low re-mating conception rates in lactating first-calf heifers has long been recognised as the biggest area of inefficiency in northern Australian breeding herds. The main reason is that the condition of first-calf heifers often slips while they are lactating (and growing at the same time). As a result, they do not resume cycling soon after calving.
This project aims to establish the exact relationship between body weight (and/or condition) and re-mating conception rates for Brahman heifers at their first two joinings in northern Australia. From this it will be possible to produce a simple chart showing the conception rates that would be expected from mating first-calf heifers at different weights. This would allow producers to determine the most cost-effective way to manage replacement breeders.
Data collection was completed in mid 2009. A comprehensive report will be submitted to MLA at the end of 2009 and will be available from their website in 2010 (copies will also be available from Tim Schatz ([email protected] or 89992332).
Method:
The methodology of this project has been described in more detail in previous TARs. A brief summary is provided below.
Each year at least 100 maiden Brahman heifers will be joined at VRRS (joined first at 2 years-old) and DDRF (joined first as yearlings). At both sites, pregnant heifers with their first calf will be split into two treatment groups. One group, (control) will graze pasture as normal in the pre-calving dry season, while the other, the high nutrition group (HN), will be managed to gain an extra 50 kg before calving. This will give heifers with a range of weights/body conditions at their second joining. The data from this joining (over several years) will allow the generation of a model that predicts the pregnancy rates likely from mating lactating first-calf heifers

ANNUAL RESEARCH REPORT 2008-09
at a range of pre-calving weights, P8 fat depths and condition scores. From the model, a simple chart will be produced showing the conception rates that would be expected from mating first-calf heifers at different weights. Data collected through the project will also help to produce similar charts for maiden heifers (mated first as yearlings and as two-year-olds).
Results:
Preliminary results have been presented in previous TARs and a final report is being written. It will be much too large to present here but will be available from the MLA website in 2010 and from Tim Schatz. Highlights of the report will be presented in next years ARR.
One aspect of the work that can be reported briefly here is the effect on re-conception rates of feeding a protein supplement to heifers in the dry season prior to their first calving. This was part of the research at VRRS, where maiden heifers are joined for the first time at two years of age.
Since weight/body condition has such a large effect on heifer fertility, supplementary feeding can be used to increase pregnancy rates. However, the profitability of supplementary feeding strategies needs to be assessed carefully in each situation as sometimes the costs can outweigh the benefits, especially when freight costs are high.
At VRRS heifers that were pregnant with their first calf were divided into two groups. One group was given a protein supplement for several months prior to calving.
In the first year, the HN group was fed live export pellets (28% crude protein) at a rate of 2.3 kg/animal/day for 154 days leading up to calving, while the control group received no protein supplement. Subsequently re-conception rates were 43% higher in the HN group (82% vs. 39%).
In the second year the HN group was fed copra meal (22% crude protein) at a rate of 1.6 kg/animal/day for 109 days. Subsequently, re-conception rates were 54% higher in the HN group (63% vs. 9%).
82%
63%
39%
9%
0%
20%
40%
60%
80%
100%
No. 4 No. 5
HNControl
Figure 1. The effect of protein supplementation prior to calving on re-conception rates in first calf heifers
While supplementation greatly increased re-conception rates in both years, the feeding strategy ran at a small loss (-$7.90 per heifer) in the first year (as there was a late start to the wet season and feeding had to continue longer than intended), but made a profit in the second year (+$63.27 per heifer)*. This highlights the importance of focusing on the profitability of a feeding strategy and not just the improved performance. Cost of supplement, freight and length of feeding have large effects on the profitability of feeding strategies. *Note – labour costs were excluded from this evaluation.

2008-09 ANIMAL INDUSTRIES
PROJECT: Senepol Crossbreeding Project
Project Officers: T. Schatz and T. Cowley
Location: Katherine
Keyword(s): cattle, Senepol, crossbreeding, Brahman, meat quality, Victoria River Research Station, Douglas Daly Research Farm
Objectives:
To determine if crossbreeding with Senepol bulls is a viable strategy for producers with Bos indicus herds in the NT to produce animals with increased marketing options.
To compare the growth and meat quality of F1 Brahman x Senepol steers with pure Brahman steers.
To compare the performance of F1 Brahman x Senepol heifers with pure Brahman heifers over the replacement heifer phase (from weaning until the first calf has been weaned).
To compare the performance of F1 Brahman x Senepol breeders with pure Brahman breeders.
Background:
Currently the destination for almost all cattle turned-off from properties in the northern parts of the NT is the live export market in South-East Asia. There would be large ramifications for these properties should the live export market ever collapse. If this were to happen, many thousands of the high grade Brahman cattle normally sent to the live export from NT properties each year would have to be sent to markets in southern Australia. It is probable that this would result in lower returns for NT cattle producers as animals with high Brahman content usually fetch lower prices in southern markets as they are perceived to have lower meat quality than Bos taurus animals. The aim of this study is to determine the costs and benefits of a likely response to this scenario in which adapted Bos taurus bulls are mated to existing Brahman breeder herds to produce offspring that would be more desirable in southern markets.
Also there is increasing acceptance of tropically-adapted crossbred and composite cattle in live export markets and in some cases, they are even preferred (where their improved carcase traits and feedlot performance have been noted). If NT cattle stations are able to produce animals that are desirable in both South-East Asian and southern Australian markets, it gives them more flexibility to target whichever market is more profitable at the time. Even if live export continues to be the main market, it is likely that Bos indicus x adapted Bos taurus animals will be a better product for the live export market than pure Bos indicus animals. This project aims to determine whether properties in northern parts of the NT can successfully produce such animals and the effects of such a crossbreeding program on animal production and property profitability.
It would be beneficial for cattle producers in the northern NT to have local research done to determine whether the benefits of a crossbreeding program aimed at producing animals with better meat quality outweigh the costs before they embark on such a program themselves.
There is considerable scientific research showing that meat from Bos taurus cattle is more tender than meat from Bos indicus cattle. In fact, some studies have shown that there is an almost linear reduction in

ANNUAL RESEARCH REPORT 2008-09
tenderness as the proportion of Bos indicus genes increases (Crouse et al. 1995, Johnson et al. 1990 and Sherbeck et al. 1995). Therefore, an obvious solution for Bos indicus herds where meat tenderness is perceived to be a problem is to incorporate Bos taurus genes. However, this is not a simple process in tropical areas of the NT, where pure British breed (Bos taurus) bulls often struggle just to survive in the harsh environment and their introduction in the past has largely been unsuccessful. To overcome these difficulties, it has been suggested to use a tropically-adapted Bos taurus breed, such as Senepol as an effective strategy to reduce tenderness problems in cattle in tropical areas (O’Connor et al. 1997).
The introduction of Bos taurus genes into Brahman herds in northern Australia has several potential advantages such as hybrid vigour, potential for higher growth, fertility and better meat quality and disadvantages such as less resistance to pests and environmental stresses, resulting in possible lower growth and fertility, and higher mortality rates. The success of a crossbreeding program in northern Australia largely depends on getting the right mix of adaptive (Bos indicus) and productive (Bos taurus) genes. In parts of the NT where there are ticks, high temperatures and humidity, a high proportion of Bos indicus genes are required in crossbred animals to thrive. However, there are several tropically-adapted Bos taurus breeds, such as Senepol, Belmont Red and Tuli, which allow higher proportions of Bos taurus genes to be used in a crossbreeding program than would be the case if a normal Bos taurus breed was used. Having higher Bos taurus content increases the chances of having improved meat quality and the ability to use purebred Bos taurus bulls simplifies the crossbreeding program and reduces the time taken to produce offspring with 50% Bos taurus genes.
As a result, this project will investigate the crossing of purebred adapted Bos taurus bulls with Brahman cows in the Katherine/VRD districts. Any tropically-adapted Bos taurus breed, such as Tuli, Belmont Red and Senepol could be used in this work. However, Senepol has been chosen as it seems to be the breed currently of most interest to industry and also because it fits in best with the DRDPIFR’s current activities (we already have 12 Senepol bulls). The other benefit of using Senepols is that all of the F1 offspring are polled or scurred, which is likely to become more desirable as animal welfare concerns increase.
The Brahman x Senepol offspring will be compared with high grade Brahman cattle of the same age in the following traits:
• Growth rate of steers over the post-weaning year on improved pasture in the Douglas Daly district. • Performance of steers in a feedlot at KRS, Queensland and possibly in Indonesia. • Meat quality and carcase measurements from steers sent to an Australian abattoir and meat science
laboratory. • Growth rate of replacement heifers to two years of age on native pasture in the VRD. • Conception rates in maiden heifers. • Re-conception rates in first-calf heifers. • Breeder herd efficiency and other measures of performance of mature cows. • Mortality rates.
Method:
The research will comprise two phases. In the first phase, the young F1 Senopol x Brahman animals will be bred and aspects of their performance up to the age of three years will be studied. In the second phase, the performance of F1 Senopol x Brahman and high grade Brahman cows will be compared when they are run together in the same paddocks and mated to Brahman bulls.

2008-09 ANIMAL INDUSTRIES
First phase (2009–2015): • Building up female numbers for later breeder studies. • Growth and meat quality studies on male progeny (DDRF and feedlot). • Replacement heifer phase – compare Brahman with F1 Senopol x Brahman (VRRS).
Second phase (2015–2018) • Performance of F1 Senopol x Brahman and Brahman breeders compared. • Both genotypes of cows will be run together in breeder paddocks. • The same breed of bull (Brahman) will be used in all paddocks. • Breeder performance may be studied concurrently with supplementation research.
Methodology of different aspects of the research
During the trial, all cattle will be mustered at least twice a year when weight, fatness, height, lactation and pregnancy status (if applicable) will be recorded according to normal protocols. Horn status and coat colour of the F1 offspring will also be recorded.
Studies on male progeny (Brahman vs. F1 Senopol x Brahman)
After weaning, all male progeny will be transported to DDRF where they will be processed (castration, dehorning etc.) and post-weaning studies of growth on improved pasture will be conducted. Some steers will be selected for feedlot studies in Katherine where their growth rates and maturity type will be assessed. Some steers will be transported to a feedlot in Queensland where their growth will be studied and then detailed meat quality studies will be conducted after slaughter by the University of New England’s (UNE) Meat Science Laboratory.
Parameters to be assessed will include:
• Growth rate on improved pasture over the year post-weaning. • Fatness measured by ultrasound at the end of the post-weaning year. • Feedlot growth rate. • Maturity type (fatness at known age and weight). • Carcase and meat quality assessments, such as shear force.
There is also the possibility of comparing the two genotypes of steers right through the live export process and their performance in an Indonesian feedlot.
Methodology of meat quality studies
After grazing improved pasture at DDRF for about one year post-weaning, 50 Brahman and 50 F1 Senopol x Brahman steers selected to represent a range of sires, will be transported to a feedlot near an abattoir in Queensland where they will be fed for approximately 60 days. They will then be sent to a Muslim-accredited abattoir where they will be slaughtered and carcase measurements will be recorded. After aging for seven days, a strip-loin from each carcase will be removed and sent to the meat testing laboratory at the UNE for tenderness studies costing about $50 to $70 per test. The Meat Science Department at UNE has indicated a willingness to collaborate in this aspect of the work although they are unlikely to be able to provide any funding. Someone from DRDPIFR and/or UNE would be present at slaughtering to ensure that identification of carcases is done correctly.

ANNUAL RESEARCH REPORT 2008-09
This methodology will be used in animals from the first year group of weaners initially and then repeated with the second year group if funds are available and the study indicates that it is necessary.
Studies on female progeny (Brahman vs. F1 Senopol x Brahman) – the replacement heifer phase
After weaning, heifers of both genotypes will be placed in paddocks at VRRS with equal numbers of each genotype in each paddock. The heifers will be mated for the first time at two years of age (with a limited joining period of 3.5 months from late December to the end of March) and their growth until this time will be compared as well as the conception rates from their maiden joining. Brahman bulls will be used over both genotypes of heifers, which will be running together mixed equally in paddocks stocked at the same utilisation rate (AE/km2). All heifers will be vaccinated against botulism and will receive a 7-in-1 vaccination at weaning and at the second round muster after weaning, and a Vibrovax vaccination at the second round muster prior to joining.
The performance of first calf heifers will be studied (re-conception rate and calf loss) and again both genotypes will be mixed together in paddocks. Brahman bulls will be re-introduced in late December and removed at the first round weaning muster.
Parameters to be assessed include:
• Growth rate on native pasture over the post weaning year. • Weight gain to maiden joining and fatness at this time. • Conception rate (within weight ranges) from maiden joining. • Calf loss and mortality in first calf heifers. • Re-conception rate in first calf heifers. • Weight and fatness at the time when the first calf is weaned.
Studies on breeders (Brahman vs. F1 Senopol x Brahman)
Heifers will be moved to breeder paddocks once they have had their first calf. Again each paddock will have an equal mix of cows of both genotypes. Mating will be for a limited period from late December to the first round muster with Brahman bulls.
Parameters to be assessed include:
• Breeder herd efficiency (kg of calf weaned per 100 kg cow mated). • Weaning rate. • Wet cow re-conception rate. • Mature size (weight corrected for stage of pregnancy at same age, fatness and lactation status). • Calf loss and mortality. • Pest resistance. • Ability to maintain body condition (fatness) under VRD conditions.
A decision on whether to perform studies on the progeny of the F1 breeders will be made in consultation with KPIAC when the time comes.
Results:
This project started recently and no results are available at this stage. The first crossbred calves will be weaned in mid 2010.

2008-09 ANIMAL INDUSTRIES
PROJECT: Shruburn – Rangeland Burning Trial
Project Officer: T. Cowley
Location: Katherine
Keyword(s): fire, rangelands, woody thickening, pasture, Victoria River Research Station
Objectives:
To investigate the efficacy of using fire to control woody thickening on pastoral land.
To identify effective fire frequencies and intensities that alter or maintain woody vegetation structure.
Background:
Fires are an important component of grazing systems. Fire frequency has a strong influence on land condition and native woody plant cover and density, which in turn influences carrying capacity. Long-term impacts of regular fire frequency on land condition and woody cover are unknown. This project provides important understanding of how fires can be used to manage woody cover and maintain carrying capacity. This is particularly relevant given the increasing rainfall over the last 20 years, which has been linked to increasing native woody cover in the region. Fire is the only practical tool to manage woody cover.
Climate change models predict that woody cover will increase under higher carbon dioxide levels. As rainfall-driven woody cover increases as a result of climate change, fire is the only tool that can practically manage it.
This is one of a few long-term fire trials internationally and may provide information for global climate change modelling. For this reason it has been identified as having a high priority to continue its work in the future.
Method:
The study site is VRRS in the central VRD. It is composed of two trial sites on different soil-pasture communities within separate grazed paddocks. One site is a ribbon-blue grass pasture on grey cracking clays dominated by rosewood (Terminalia volucris) and bauhinia (Lysipyllum cunninghamii). The other is an arid short grass pasture community on red soil which is dominated by inland bloodwood (Eucalyptus terminalis), silver leaf box (Eucalyptus pruinosa), conkerberry bush (Carissa lanceolata) and Hakea aborescens.
Each trial site is composed of 16 plots (100 m x 100 m) in a 4 x 4 design. Season of burn (early dry season – June vs. late dry season – October) and frequency of burning (never, every two years, every four years, or every six years) are the treatment variables. Each site has two plots of each treatment (see the plot map in Appendix 1).
Every two years, pasture sampling is carried out to determine the impact of the different fire regimes on pasture vigour and composition. Woody vegetation assessments (specifically tree basal area and canopy cover) were carried out in 2009 but had not been measured since 1999.

ANNUAL RESEARCH REPORT 2008-09
Results:
Analysis is expected to be complete by January 2010.
Appendix 1: Shruburn trial layout – treatment allocations
Rosewood paddock
1 2 3 4 L6 E4 E4 E6 N 5 6 7 8 E6 L4 L4 0 9 10 11 12 0 L2 L6 E2 13 14 15 16 0 E2 L2 0 Conkerberry Paddock
17 18 19 20 L6 0 E6 L4 N 21 22 23 24 0 E4 E2 L2 25 26 27 28 E6 0 E4 E2 29 30 31 32 0 L4 L2 L6
NB: E = early burn, L = late burn, the numbers indicate the frequency of burning.

2008-09 ANIMAL INDUSTRIES
PROJECT: Breeding to Suit Future Market Opportunities: Tuli X Brahman, F1 Belmont Red X Brahman and Brahman Cattle
Project Officers: R. Golding and A. Cooper
Location: Katherine
Keyword(s): feedlot, Brahman, Belmont Red, Tuli, crossbreed, live-weight, feed conversion, mature size, P8 fat, Katherine Research Station
Objective:
To measure and report on the relative mature size of young Tuli x Brahman, F1 Belmont Red x Brahman and Brahman cattle, by June 2009.
Background:
In cattle, mature size affects the amount of fat that they have at different weights. Larger mature size animals have less fat at the same weight as smaller mature size animals. The South-East Asian beef market prefers lean meat as excess fat on animals is trimmed off at slaughter. Therefore, animals which are leaner at the end of the feedlot process in South-East Asia are more efficient and profitable for traders. This project aims to generate information that can be useful to consolidate the NT’s position as a major supplier to the South-East Asian beef market. The project may also provide alternative options to NT beef cattle producers by increasing market flexibility and possibly reducing reliance on the live export trade.
The findings from this research are expected to enable DRDPIFR to further promote NT beef products. The results will help to provide better advice to beef cattle producers on possible future strategies on how to target different markets and achieve market flexibility.
Method:
Two cohorts (year groups) of 10 steers of each genotype were selected and put in a feedlot. All animals receive the same ration. Animal weight, hip height and P8 fat depth will be measured at monthly intervals until the pen averages 10 mm of fat depth at the P8 site. The amount of feed consumed is measured so that feed conversion efficiency could be calculated.
Steers entered the Katherine Research Station feedlot in October 2008 and the last group left the feedlot in mid June 2009. The two cohorts of each genotype were animals that had been weaned in either 2007 or 2008.
Results:
An initial analysis of data was completed in February 2009, a summary of which is presented here. A complete analysis and report on the final project will be completed later this year.
Over the course of the trial, all breeds recorded live-weight gains (LWG) of approximately 1 kg/day (Figure 1). There was no significant difference between breed (P=0.337) or age (P=0.797).

ANNUAL RESEARCH REPORT 2008-09
Feed conversion efficiency (FCE) was significantly different between cohort (P<0.01). The mean FCE for the 2007 cohort was 73 g LWG/kg feed provided as opposed to 47 g LWG/kg feed provided for the 2008 cohort.
FCE was influenced by breed (P=0.03). The F1 Belmont Red x Brahman cattle displayed greater feed conversion efficiency than the F1 Tuli x Brahman cattle (P<0.05). However, both F1 Tuli x Brahman and F1 Belmont Red x Brahman were not found to be significantly different to Brahman (P<0.05) (Figure 2).
The study showed that there was a significant difference between age (P<0.01) and breed (P<0.01) in hip height. As expected, the younger animals recorded shorter hip heights than the older animals. The F1 Tuli x Brahman cattle were shorter than the F1 Belmont x Brahman and the Brahman cattle (Figure 3).
This could be explained by the early maturity type of the Tuli breed and suggests that the F1 Tuli x Brahman composites mature earlier than the F1 Belmont x Brahman and the Brahman cattle. This could present the problem of cattle of this genotype being over-fat at slaughter in South-East Asian feedlots. Hence, the F1 Tuli x Brahman composite may not be a solution to improve export specifications in this market.
As expected, the average fatness at the P8 site was influenced by age (P<0.001). However, average fat at the P8 site was not found to be significantly different between breeds following the feeding phase (P=0.42) (Figure 4).
Figure 1. Average live-weight gain of breeds in each year group
Figure 2. Feed conversion efficiency of breeds in each year group

2008-09 ANIMAL INDUSTRIES
Figure 3. Hip height of breeds in each year group Figure 4. P8 Fat depth of breeds in each year group
Key:

ANNUAL RESEARCH REPORT 2008-09
PROJECT: Productivity Consequences of Incorporating Tropically-adapted Bos Taurus Breeds into a Breeding Herd in the Victoria River District
Project Officer: R. Golding
Location: Katherine
Keyword(s): Brahman, Belmont Red, Tuli, crossbreed, breeding herd efficiency, Victoria River Research Station
Objectives:
To measure and report on the relative breeding herd efficiency (kg calf weaned per 100 kg of cow mated and AE) of adult F1 Belmont Red x Brahman and F1 Tuli x Brahman breeders, relative to purebred Brahman by 2011.
To determine the mature size of F1 Belmont Red x Brahman and F1 Tuli x Brahman.
Background:
Feedback from South-East Asian feedlots in the early 1990s indicated that there was an increasing problem with over-fattening at the completion of the feeding phase in young Brahman cattle sourced from northern Australia. South-East Asian feedlots usually supply beef to local ‘wet’ markets, which have a low value for fat and consider it a less-desirable component of the carcase.
A way to combat this problem of over-fattening is to include later-maturing genes. However, history has shown that animals containing a high proportion of later-maturing genes (European breeds) were not productive in northern Australia. Belmont Red and Tuli cattle were identified as having some desirable carcase traits and as having the potential to provide production benefits through crossbreeding with Brahmans. Therefore, a study was conducted at VRRS to investigate the productivity of breeders produced from crossing Brahman with the Belmont Red and Tuli breeds.
Method:
Location
The breeder herds were kept in ‘Boab’, ‘Coolibah’, ‘Nutwood’ and ‘Supplejack’ paddocks on VRRS.
Table 1. Paddock allocation
Paddock AEs Breeders Bulls Boab 55 40 Bra 2 Bra Coolibah 120 43 F1 BRd x Bra
43 Tul x Bra 4 Bra
Nutwood 64 46 Bra 2 Bra Supplejack 118 43 F1 BRd x Bra
43 Tul x Bra 4 Bra

2008-09 ANIMAL INDUSTRIES
Animals
The breeding herds were managed under a modified Best Bet Management System using a stocking rate that was calculated from the long-term median pasture growth and estimated safe utilisation rates.
The breeding herds were mustered twice a year, usually in May and October, and data was collected for pregnancy, lactation status and empty live-weight. The condition of the animal was visually assessed at processing and assigned a score against a nine point system. Breeders were culled if they were not pregnant and not lactating. Other criteria for culling included temperament, injury and age (over 10 years). The breeders were continuously mated at 4% to fertility-tested bulls. Bulls were culled for sub-fertility based on the BBSE score, injury and temperament, or after being with the herd for two years. A two-year maximum joining ensures a breed effect rather than a bull effect. All animals were vaccinated against C and D botulism strains during May and a booster vibriosis vaccination was given to the bulls in October.
At processing, the progeny were mothered-up to determine parentage and bulls were identified using DNA sampling, tagged and weighed. A minimum weaning weight of 100 kg was used at both weaning rounds across all years. Progeny were branded but not dehorned or castrated until after weaning when they were transported to Douglas Daly Research Farm.
Heifers were selected at two years of age based on temperament, live-weight of 280 kg or over and general appearance. Heifers were mated in January each year and were run separately until they weaned their first calf.
Supplementation
All animals were supplemented all year round. During the dry season, a loose supplement consisting of 20−30% urea, 20% kynophos, 10% sulphate of ammonia and 40−50% salt was used. A loose wet season mix consisting of 35% kynophos, 10% sulphate of ammonia and 55% salt was used across the wet season. These mixes were distributed weekly at approximately 100 g of supplement per animal per day.
Paddock differences
In order to highlight any differences between paddocks, indicator steers are included with each breeder herd and monthly faecal samples are collected for each paddock for NIRS analysis.
Indicator steers: Ten steers of similar genotype, age and weight were included in each paddock annually in May and were replaced in May the following year. The inter-paddock difference in average live-weight gain was used as an indicator of paddock quality.
Faecal samples: Stool samples were collected from various locations within each paddock monthly. A bulked sample representing each paddock was then analysed using NIRS technology for faecal nitrogen, dietary crude protein and dry matter digestibility.
Results:
This project was terminated early because the paddocks were required for more urgent research at VRRS.
Data was collected for the second round in 2008 and the first round in 2009. A final report on this project will be presented in next year’s ARR.

ANNUAL RESEARCH REPORT 2008-09
A number of the Belmont and Tuli breeders are retained at Old Man Plains Research Farm in Alice Springs for future use.
PROJECT: Selected Brahmans - Improvement of the Fertility of the Brahman through the Use of BREEDPLAN EBVs and Selection
Project Officer: R. Golding
Location: Katherine
Keyword(s): Brahman, BREEDPLAN, EBVs fertility, estimated breeding values, scrotal circumference, days to calving, Douglas Daly Research Farm, Katherine Research Station, Victoria River Research Station
Objectives:
To continue improving the performance of the herd through selection and culling, introduce superior genes through AI and continue herd recording for BREEDPLAN.
To provide extension activities to raise awareness of the use of selection and EBVs.
To continue sire sales and develop semen sales.
To compare herd performance with industry herds (this needs increasing the herd size for proper statistical comparison).
Background:
The growth and development of the Australian Brahman herd has been described as the greatest livestock revolution in history. The use of Brahman genetics has transformed northern Australian beef properties from near bankruptcy to efficient and profitable enterprises, contributing billions of dollars to domestic and export income (Croaker 2002). Using technologies such as artificial insemination, embryo transfer and BREEDPLAN, the rate of genetic gain has increased the impact of Brahman genetics from being a crossbreeding option to the largest pure breed in Australia (Croaker 2002).
While the Brahman has produced remarkable productivity gains in northern Australia through its adaptation to tropical environments, it is recognised as having lower fertility than Bos taurus breeds. While some of this can be attributed to environmental stressors, which are present in the north, herd reproductive performance ultimately determines the enterprise profitability and, with cost of production increasing, it is imperative that herds maximise outputs through higher weaning rates.
Over the past 23 years the NT Government has carried out research on improving the fertility of the Brahman breed. In 1994, a herd was formed using females from the research stations and bulls from the local area using a high selection pressure. This involved mating heifers as yearlings, a strict culling of females over two years of age which fail to become pregnant and selecting bulls on testicle size. The research also utilised AI to introduce high quality genetics based on estimated breeding values (EBVs) into the herd. The herd joined

2008-09 ANIMAL INDUSTRIES
the Australian Brahman Breeders Association and became a member of BREEDPLAN in 1996. Herd data from as early as 1986 was recorded in BREEDPLAN. From 2005 all male calves were kept entire and bulls to be used for breeding were selected as yearlings. As a result, all females are now mated to either bulls bred from within the herd or through AI (about 10%).
The success of this program is reflected by the fact that the research herd (No. 4299) is the best of all the herds on the Brahman group BREEDPLAN for reproductive traits, including average days to calving, scrotal circumference and EBVs (Figures 1 and 2).
The success of this program in a small herd over a 14 year period shows that very rapid improvements in fertility are possible in large NT herds if these selection methods are followed. The current project is a continuation of the previous work, which was completed with selection based on EBVs and herd performance, with the additional aim to increase herd size while maintaining strict selection, extend the knowledge of selection practices used and share the gene pool through bull and semen sales. It is necessary to build up the herd size to allow for a proper statistical comparison with industry Brahman herds. This project will also provide examples for, and work closely with, the Northern Selection Index project to be completed in 2009.
Figure 1. Days to calving EBV Figure 2. Scrotal size EBV
Method:
Figure 3 illustrates the movement of cattle (females pink, males blue) in this trial and the data which is submitted to BREEDPLAN for the national herd recording.

ANNUAL RESEARCH REPORT 2008-09
Figure 3. Selected Brahman herd management plan

2008-09 ANIMAL INDUSTRIES
Results:
Activities in this project only began this year and as such, there is little to report on at this point.
However; related directly to the outputs of this project, some milestones have been achieved:
BREEDPLAN herd performance results were received after submission of the 2008-09 data. They are presented below. Figures 4 and 5 show that for the EBV traits related to herd fertility, the project herd is well above breed average. This is achieved through selection pressure for fertility.
A small amount of extension work has been done, such as interviews regarding the project on the NT Country Hour. Collation and analysis of previous data for this trial is continuing and some research papers and industry information will be prepared.
Surplus sires will again be offered for tender in October, allowing industry to have access to the genes of this herd.
Another 30 breeders were moved to KRS in an effort to build the size of the herd while maintaining strict selection. This is part of the proposed plan stated in the project management plan and will continue for several years.
Figure 4. Days to calving EBV Figure 5. Scrotal size EBV

ANNUAL RESEARCH REPORT 2008-09
PROJECT: Improving Herd Profitability
Project Officer: R. Golding
Location: Katherine
Keyword(s): breeder herd productivity, management, bull ratio, strategic supplement
Objectives:
To measure and report on the costs and returns of each management package in terms of gross margin per AE after interest.
To measure the production differences between each management package in terms of kg of calf weaned per 100 kg of cow mated.
To measure the differences in labour requirements between the management packages in terms of full time equivalents.
To achieve the stated objectives and report on them by December 2008.
Background:
In 1990 the Best Bet management package was formulated for Kidman Springs, Victoria River Research Station (VRRS), which has been described in previous TARs.
As a result, the performance of the herd at Kidman Springs greatly improved. Mortality rates declined from 12% to less than 2% and weaning rates increased from 50% to over 80%. With the ever-increasing cost squeeze, pastoralists requested research to be conducted on how to improve or maintain performance with reduced inputs.
The improved profit package made changes to five of the Best Bet management practices: modifying stocking rates, reducing bull percentages and supplementation costs, varying minimum weaning weight and keeping aged cows longer.
Method:
The research is conducted on several paddocks at VRRS and neighbouring Victoria River Downs (VRD) station. One paddock at Kidman Springs (VRRS) is based on the Improved Profit package. Two control paddocks at Kidman Springs are based on the Best Bet Management System (BBMS) package, one with higher and one with lower nutrition. A commercial paddock ‘Rifts Yard’ on VRD is based on the Improved Profit package.
The Improved Profit project commenced in May 2003. Data collection was scheduled for completion by October 2007. Data collection from the commercial scale paddock was completed at second round 2006.
Results:
A draft final report and a summary paper for this trial have been completed. They are in the process of review for publication. A brief summary is provided below.

2008-09 ANIMAL INDUSTRIES
The results in Table 1 show that the Kidman herds performed similarly for most herd production traits, with no significant differences between treatments for these parameters. However, when these values were used in the herd model Breedcow, the herd managed under the Improved Herd Profitability (IHP) package had a 12% higher gross margin than the BBMS herd. The VRD herd managed under the IHP package had a gross margin 9% lower than the BBMS herd. However, this was directly related to the lower weaning percentages, which were thought to be the result of the very high pasture utilisation rates (refer Figure 2). This showed that profit can be increased using this modified management system without significantly compromising herd performance, at least in the short term. Over a longer time frame and in harder seasons (not experienced during this trial) the performance of herds under the modified system may be challenged and will need to be managed appropriately.
Table 1. Mean herd productivity over the trial
Treatment herds Control herd VRRS VRD
Weaning rate (%) 74 70 55 Breeder live-weight (kg) 444 445 423 Weaner live-weight (kg) 183 186 178 Breeder mortality (%) 2 2 2 Gross margin/AE ($) 164 183 143
0102030405060708090
100
Control Trt VRRS Trt VRD
Wea
ning
%
0102030405060708090
Past
ure
utili
satio
n %
2005 Weaning % 2006 Weaning %2005 Utilisation % 2006 Utilisation %
Figure 1. Pasture utilisation and weaning percentages for each treatment in 2005 and 2006
Pasture sampling, NIRS data and indicator steer growth showed minimal paddock differences between the VRRS paddocks. Insufficient indicator steer or NIRS data was collected to compare the VRD paddock. Annual rainfall over the trial was above average for all years at both trial locations (BOM 2009). Pasture sampling showed that the VRD paddock was over-utilised (due to extra animals entering the paddock), and this could have had an impact on animal performance, especially towards the later part of the trial.

ANNUAL RESEARCH REPORT 2008-09
This can be seen in Figure 1, where the VRD weaning percentage was similar to VRRS herds for 2005, but diminished in 2006 as the paddock continued to be over-utilised and the effects of the previous year’s utilisation impacted on weaning percentages. Optimal safe utilisation rates (where pasture utilisation refers to the percentage of the paddocks annual pasture growth that is consumed by cattle) for the VRD is now generally considered as 20% (Cowley 2009) with adequate infrastructure and good management.
It was initially thought that the Improved Profitability system may ‘mine’ breeder condition (reduce it over time). Assessment of breeder body condition and live-weight over the trial is shown in Figure 2. These results show no trend of this occurring, with breeders either maintaining or gaining condition/weight at the conclusion of the trial. A trend did occur in 2006 where both treatment herds had lower condition and weights than the control herd. However, it is difficult to tell if this trend would have continued, as in 2007 there was minimal difference between the herds. It was noted that above average rainfall was experienced over the trial and weaning percentages did decline for the VRD treatment herd, although this could also be attributed to the higher pasture utilisation experienced in this paddock.
360
380
400
420
440
460
480
500
2004 2005 2006 2007
Live
wei
ght (
kg)
0
1
2
3
4
5
6
7
BCS
(1-9
)
Control Lwt Trt VRRS Lwt Trt VRD LwtControl BCS Trt VRRS BCS Trt VRD BCS
Figure 2. Breeder live-weight and BCS throughout the trial
Recommendations
The following recommendations are made:
• Paddocks should now be stocked according to the carrying capacities of the individual land units within the paddocks, not at the nominal set stocking rate of seven breeders/km².
• Bull percentages can be safety reduced from 5% to 3%, with the option of 2%; however, annual bull fertility assessment is recommended.
• Faecal NIRS technology has become a lot more reliable and is a valuable way of determining animal diet quality at various times of the year. This technology is being used much more widely since this project began and could be used to accurately determine key times where supplement is most required and effective. Pastoral Production is currently collating NIRS data for specific land types and regions and hopes to produce a guide, which will aid in the development of strategic supplementation programs using this objective information.

2008-09 ANIMAL INDUSTRIES
• Changes to the minimum weaning weight and age of culling of cows made little difference to the results observed in this trial; however, these two strategies could have an impact over a longer period or in a run of poor seasons.
As costs increase and cattle values fluctuate, management must adapt to optimise productivity and hence profitability. On-going research is continually producing options which enable this to be achieved whilst also caring for land condition.
For producers currently managing herds under the Best Bet system, these findings can be directly implemented. For producers who have not been managing under the Best Bet system due to the cost of implementation, these findings may make implementing the revised IHP package a more attractive option.
While this trial has found that the revised system can maintain productivity levels similar to the Best Bet system and improve economic efficiency, producers are encouraged to treat each herd and paddock individually when making management decisions and monitor their enterprise closely.
PROJECT: Live-weight Gain in Cattle in the NT
Project Officer: S. Streeter
Location: NT
Keyword(s): beef cattle, live-weight gain, Katherine, Barkly
Objectives:
To analyse data from Beef CRC herds and stud herds from two major pastoral companies in northern Australia and determine the amount of live-weight gain (LWG) variation in growing animals that can be attributed to genetic and environmental influences.
To identify and quantify the drivers of LWG variation within and between ten study mobs in the NT.
To identify the influence of other difficult-to-measure causal factors, such as foraging behaviour, parasites and some disease factors from a series of smaller-scale nested experiments.
To report the potential differences in feed efficiency factors between high and low growth animals identified in Objective 2 in pen studies at the Katherine Research Station.
To develop a practical analytical toolkit and determine data requirements for investigating and identifying the drivers of LWG performance in individual herds.
To develop strategies that can be identified using an analytical toolkit to reduce the number of poor performing animals and increase average herd performance.
Background:
It is proposed that for the NT and for many other extensive areas of northern Australia, the most cost-effective strategy for improving LWG would be to address the large variation in performance within the herd and focus on lifting production in the poorly performing proportion of the herd. Measurements within

ANNUAL RESEARCH REPORT 2008-09
extensively managed herds in the NT show extremely wide variation in rates of LWG even within herds managed under the same conditions and having animals with no obvious breed differences. This variation represents an opportunity for significant improvement.
Method:
The project consists of three experimental phases.
1. Desktop study – analysis of Beef CRC and NT industry stud data (completed May 2008).
2. Field study – investigation of causal factors affecting live-weight gain in ten commercial NT herds (Barkly and Katherine regions) - current.
3. Nested studies – research station pen trials investigating feed efficiency and other difficult-to-measure factors that contribute to LWG variation in the extensive environment in phase 2 (2009-10).
Field study
Data is collected from a single mob of 250 steers on each participating property, from weaning to approximately 12 months post-weaning. Four observation events occur over this period: 1. Weaning/processing; 2. Two to three weeks post-weaning; 3. Pre-wet season; 4. Post-wet season. Table 1 lists the project variables to be measured at the animal-level, mob-level and property-level.

2008-09 ANIMAL INDUSTRIES
Table 1. Project variables described at the animal-level, mob-level and property-level
Variable category
Attribute Variable Units Recording frequency
Animal-level FID 3 digit number Identification EID 15 digit number
One-off
Sex Sex Single code digit One-off Branding year Year brand 4 digit year
number One-off
Breed Breed content 4 digit text One-off Observation date Date date 4 obs*
Weight kg 4 obs* Weight ADG kg/day 3 gain periods
Condition Condition score 1 to 9 4 obs* Hip height cm 4 obs* Maturity type Fat depth mm post-wet season Sire ID 6 digit number One-off Genetics Sire breed 4 digit text One-off
Temperament Flight speed metres/second 4 obs* Tick Tick score 1 to 5 4 obs* Fly Buffalo fly count count 4 obs* Lesion Buffalo fly lesion score 1.1-2.5 4 obs*
Faecal nitrogen % Forage digestibility % ME intake (MJ/100kgLW)
Diet selection (FNIRS)
Dietary non-grass %
3 obs
Wound size (cm2) Frontal sinus exposed y/n Bleeding rate score 0-3 Dressing applied y/n Tool S,C,K,P
Dehorn severity
Hygiene score 0-3
Weaning
Method (cut low, cut high) L,H Castration severity Bleeding rate score 0-3
Weaning
Dehorn infection Healing score 0-5 2 wks post-weaning
Castration infection Healing score 0-5 2 wks post-weaning
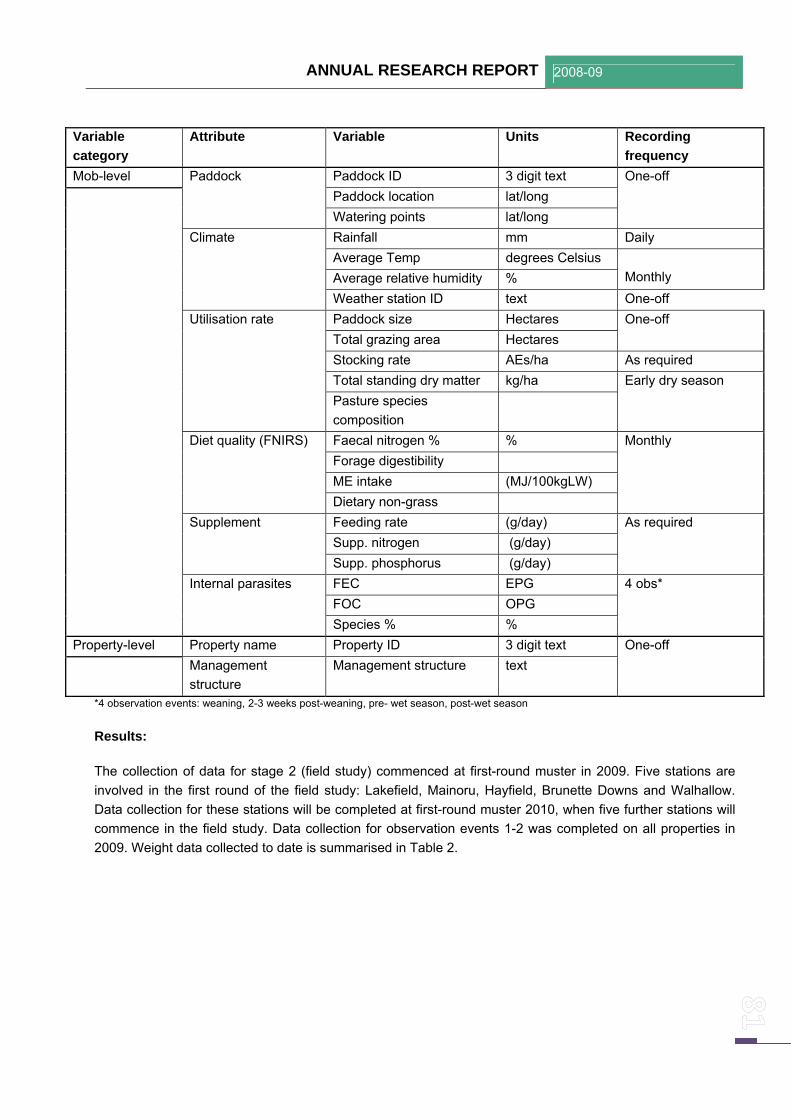
ANNUAL RESEARCH REPORT 2008-09
Variable category
Attribute Variable Units Recording frequency
Mob-level Paddock ID 3 digit text Paddock location lat/long
Paddock
Watering points lat/long
One-off
Rainfall mm Daily Average Temp degrees Celsius Average relative humidity % Monthly
Climate
Weather station ID text One-off Paddock size Hectares Total grazing area Hectares
One-off
Stocking rate AEs/ha As required Total standing dry matter kg/ha
Utilisation rate
Pasture species composition
Early dry season
Faecal nitrogen % % Forage digestibility ME intake (MJ/100kgLW)
Diet quality (FNIRS)
Dietary non-grass
Monthly
Feeding rate (g/day) Supp. nitrogen (g/day)
Supplement
Supp. phosphorus (g/day)
As required
FEC EPG FOC OPG
Internal parasites
Species % %
4 obs*
Property-level Property name Property ID 3 digit text
Management structure
Management structure text One-off
*4 observation events: weaning, 2-3 weeks post-weaning, pre- wet season, post-wet season
Results:
The collection of data for stage 2 (field study) commenced at first-round muster in 2009. Five stations are involved in the first round of the field study: Lakefield, Mainoru, Hayfield, Brunette Downs and Walhallow. Data collection for these stations will be completed at first-round muster 2010, when five further stations will commence in the field study. Data collection for observation events 1-2 was completed on all properties in 2009. Weight data collected to date is summarised in Table 2.

2008-09 ANIMAL INDUSTRIES
Table 2. Summary of mean weaning weight, post-weaning weight and average daily gain (ADG) for five commercial properties
Property (Region)
Mean wean weight (kg) + s. d. (n)
Mean post-wean weight (kg)
+ s. d. (n)
Days mean ADG (kg/day)
+ s. d. (n) Lakefield (Katherine)
133 +20 (213)
141 +26 (208)
22 0.42 +0.52 (208)
Mainoru (Katherine)
160 +30 (286)
164.5 + 30 (229)
16 0.06 +0.29 (227)
Hayfield (North Barkly)
211 +43 (251)
213 +49 (247)
22 0.12 +0.41 (241)
Brunette Downs (Barkly)
213 +52 (228)
208 +53 (222)
19 -0.14 +0.40 (213)
Walhallow (Barkly)
213 +36 (250)
200 +34 (229)
23 -0.56 +0.43 (228)
s. d. = standard deviation, n = sample size
The project passed a review by MLA in December 2008, which was conducted by Dr Kishore Prayaga (CSIRO) and Dr John Morton (University of Queensland). A variation agreement has been signed with MLA to include an extension of the project for one year, with a revised completion date of March 2012.
PROJECT: Pasture Species Evaluation under Grazing at DDRF
Project Officers: B. Lemcke, P. Shotton and DDRF Staff
Location: Darwin
Keyword(s): improved pastures, pasture grasses, pasture legumes, cattle grazing, leucaena
Objectives:
To evaluate improved pasture species and mixtures under a continuous grazing regime on Blain soil at Douglas Daly Research Farm (DDRF).
To determine their persistence, productivity and contribution to the weight gain performance of cattle.
To make pasture management recommendations for Top End livestock producers
Background:
Promising pasture species and mixtures are evaluated under grazing by cattle at DDRF to determine their long-term potential in the Douglas Daly and wider Top End regions.

ANNUAL RESEARCH REPORT 2008-09
Method:
Pastures are grazed in 4-ha paddocks by six Brahman weaner steers per paddock (1.5 animals/ha). However, to monitor the long-term effects of heavy stocking rates on these productive leucaena/buffel and buffel pastures, Paddocks 39 and 49 had four extra animals, which increased the stocking rate to 2.5 animals/ha. Steers are allotted to paddocks in June/July (post-weaning) and remain in the grazing trial until the following June (almost 12 months).
Paddocks are top-dressed annually with a phosphorus-based fertiliser. This year Pasture Generator® (NPKS 0:16:0:20) was ground-spread on the paddocks at 50 kg/ha. During the wet season, various weed control measures were conducted where required, usually spot-spraying for broadleaf weed control. Some grass-only paddocks are boom-sprayed with Starane®/2, 4-D or 2, 4-D/Brush Off ® mixtures if broadleaf weeds become prominent. An application of 2 x 50 kg split applications of urea was made to Paddock 532.
The animals were supplemented ad-lib with Uramol® blocks during the dry season and Phosrite® blocks during the wet season. Intake was recorded monthly. Paddock 532 animals received no wet season block supplement; because it had an application of urea.
The cattle were weighed monthly, given a condition score and their P8 (rump) fat was measured from January onwards and continued until the end of the grazing season in July 2009.
Pasture composition and yield were assessed twice during the year, first in the early wet season in December 2008 and post-wet season, in May 2009.
Paddock 39 has been divided into two and grazing is rotated monthly to allow leucaena to recover leaf on a regular basis.
As an extension to a 12-month evaluation trial in 2006 titled”To monitor the consumption of companion pasture legumes with improved grass species using near infrared reflectance spectroscopy”, a collaborative project between QDPI&F and DRDPIFR commenced in August 2007 and continued this year to further investigate the consumption of pasture legumes, dietary crude protein, digestibility and faecal N concentration of each group of animals sampled.

2008-09 ANIMAL INDUSTRIES
Results:
Table 1. Mean cattle live-weight gains for each paddock (kg/animal)
Paddock No.
Pasture type July 08- Nov 08
(mid-late dry)
Nov 08 – April 09
(wet season)
April 09- Jun 09
(early dry)
Total July 08-Jun 09
39 Buffel/leucaena (split paddock-heavier stocking)
23.2 127.2 22.2 172.6
40 Nunbank buffel 1.7 100.5 14.2 116.3 41 Tully (B. humidicola) 6.0 101.7 13.8 121.5 42 Wynn cassia/Jarra 14.0 135.0 16.8 165.8 43 Signal*Grass –planted Dec 2007 28.7 159.7 4.8 164.5 44 Pangola 15.5 128.3 10.7 154.5 45 Pangola/leucaena 25.2 149.7 28.5 203.3 46 Sabi 10.6 ** ** ** 47 Jarra 8.2 123.6 12.8 144.6 48 Sabi/leucaena 14.1 132.2 23.6 169.9 49 Buffel/tall variety (heavier stocking) 3.0 *** *** *** 50 Buffel/legumes 25.8 129.8 17.5 173.2 51 Strickland/Wynn 17.7 133.8 21.2 172.7 52 Arnhem/Oolloo 4.2 117.9 8.8 130.9 531 Buffel/sabi/ WS blocks 7.3 135.3 11.7 155.3 532 Buffel/sabi (100 kg urea) 11.7 120.0 8.3 140.0 533 Buffel/sabi/Wynn -5.2 128.4 22.2 145.4 534 Leucaena/buffel/sabi 22.5 143.9 21.0 187.4 535 Buffel / Oolloo 18.7 126.4 14.3 159.5 All paddocks
Mean live-weight change 13.3 128.1 16.0 157.4
*Signal paddock was stocked for a full year **Destocked for planting with leucaena *** Destocked for replanting with Milgara blue pea
Table 2. Mean cattle live-weight gains (kg) for the previous ten years (all paddocks)
Year 1999-00 2000-01 2001-02 2002-03 2003-04 2004-05 2005-06 2006-07 2007-08 2008-09 LWG/ animal
187.7 176.1 173.0 173.1 176.5 168.0 205.9 137.6 157.7 157.4
Animals/4ha
4 4 5 5 5 5 5 6 6 6
There was a slight decrease in average live-weight gain (LWG) per animal this year compared with the previous year, but it was only the second lowest result in the last 10 years. This year the stocking rate was the same as during the last two years. However, during the last three years it was 20% higher than in previous years, except for Paddock 49, which had 2.5 animals/ha and was replanted this year. This was the second year with 2.5 animals/ha in Paddock 39, which has a leucaena/buffel mix. Productivity was 431.5 kg/ha compared with 437.3 kg/ha last year. This is commensurate with the average of all paddocks and was

ANNUAL RESEARCH REPORT 2008-09
most likely due to the shorter, lighter wet season. There is a need to watch the trends over years to ensure that the stocking rate remains conservative and paddock productivity is not declining over time. Per animal rates of LWG appear to have dropped by raising the stocking rate to six animals/ha but the LWG/ha has increased only marginally from 216 to 226 kg/ha from the extra animal per paddock. This would appear to indicate that stocking capacity is close to the limit.
The seasonal rainfall for each year was markedly different with 1846 mm (119 rain days) in 2005-06, 1127 mm (76 rain days) in 2006-07, 1984.8 mm (96 rain days) in 2007-08 and 1201 mm (81days) in 2008-09). Despite the 40% lower rainfall this year and fewer rain days, paddock productivity was still maintained. A late start and an early end to the wet season were the main characteristics of the 2008-09 period, which was an average year for rainfall.
The LWG patterns of previous years were again apparent this year. Animals in grass/leucaena paddocks performed best; those in grasses/legumes paddocks performed less well; those in grasses only paddocks were the poorest performers. This year thee levels were virtually the same as last year (Table 3.)
Table 3. Cattle LWG performance on different pasture groups
Year Mean LWG all leucaena / grass paddocks
Mean LWG all legume / grass paddocks
(excluding leucaena)
Mean LWG all grass-only paddocks
2005-06 235.0 kg/head 204.8 kg/head 193.8 kg/head 2006-07 158.3 kg/head 150.5 kg/head 119.8 kg/head 2007-08 185.0 kg/head 171.8 kg/head 137.9 kg/head 2008-09 183.3 kg/head 163.5 kg/head 137.5 kg/head
There were some poor leucaena rows in some paddocks that did not exhibit normal animal growth patterns. It would appear that a rest period, preferably during the wet, is needed to allow leucaena to rejuvenate properly. Constant stocking appears not to be the best management in the long term. Where the rows were slashed in Paddock 48 several years ago, there has been very poor regrowth since. Some tree-pruning was carried out with a large mechanical (commercial mango) pruner at two different heights to compare outcomes. The management of leucaena needs further investigation for best production.
Results of the NIRS sampling
Pasture composition and total yield were assessed in December 2008 and May 2009 using Botanal®.
Table 4 shows the total average biomass yield of each paddock and the proportion of the main grass species, all other grass species, all legumes and all broad leaf weeds.

2008-09 ANIMAL INDUSTRIES
Table 4. Plant groups in each paddock
Pasture mix Paddock Main grasses (%)
Other grasses (%)
Legumes (%)
B/L weeds (%)
Total biomass
Buffel and Wynn 39 80 0.7 3 16.3 5850 Nunbank buffel 40 71.2 15.9 9.9 3.1 6234 Tully 41 82.3 1.6 15.4 0.7 6263 Jarra / Wynn 42 76.6 3.5 19.7 0 6996 Signal grass 43 94.9 4.9 0 0.1 8564 Pangola 44 97.9 0.8 1.2 0.2 6139 Pangola/leucaena 45 92.9 0 4.6 2.5 8133 Sabi 46 68 13.1 13.4 5.2 5743 Jarra 47 94.6 1.8 1.9 1.8 5161 Sabi / leucaena / Wynn
48 78.6 1 15.1 5.3 9013
Buffel / blue pea 49 91 0.2 5.1 3.5 13 036 Buffel/legumes 50 71.8 3 20.9 4.3 6248 Strickland / Wynn 51 72.5 4.5 20.6 2.3 7322 Arnhem / Oolloo 52 86.6 4.1 8.7 0.7 6882 Buffel 531 79.8 11 7.1 2 4548 Buffel 532 93.4 1.8 4.3 0.4 7385 Buffel / Wynn 533 81.2 0.8 14.3 3.7 7225 Buffel / leucaena 534 67.6 1.4 8.6 22.5 5870 Buffel / Oolloo 535 61.4 1.6 19.7 17.3 5924
The standout pasture yield in Paddock 49 was due to destocking for the full wet for replanting and establishment of the legume. The extra yield of 62% due to urea application can be seen in Paddock 532 compared with Paddock 531. It is difficult to get an accurate estimate of the legume component in the leucaena paddocks because of the nature of the plant. It is pleasing that Oolloo is maintaining its proportion of the pasture sward in Paddock 535.
Other observations
Cattle again performed poorly on Tully and the Nunbank buffel, both of which were very low compared with other grasses. The Jarra/Wynn outperformed the Jarra-only paddock by 15% as would be expected and both performed less well than Strickland/Wynn, which was 19.4% higher than Jarra only.
The second year of higher stocking in Paddock 39 did not seem to cause a reduction in cattle performance compared with last year’s performance in all paddocks. The difference between the two years was negligible.
Block consumption
Uramol® was provided in all paddocks from 15/7/08 to 11/11/08 (dry season), and then Phosrite® from 5/12/08 to 10/06/09 (wet season) except for Paddock 532.

ANNUAL RESEARCH REPORT 2008-09
Table 5. Block consumption (g/animal/day)
Paddock No. Variety/species Dry season: Uramol® consumption (119 days)
Wet season: Phosrite® consumption (187days)
39 Buffel / leucaena (five full length rows)
44 88
40 Nunbank buffel 57 115 41 Tully (B. humidicola) 77 59 42 Wynn cassia/Jarra 56 97 43 Signal grass 85 113 44 Pangola grass 85 33 45 Pangola/leucaena 47 17 46 Sabi grass 65 n/a * 47 Jarra grass 89 115 48 Sabi/leucaena 44 74 49 Buffel (tall variety)
Double stocking rate 51 n/a *
50 Buffel/legumes 47 74 51 Strickland/Wynn 85 77 52 Arnhem/Oolloo 94 30 531 Buffel/sabi/blocks 44 102 532 Buffel/sabi/urea 31 0.0 533 Buffel/sabi/Wynn 33 77 534 Leucaena/buffel/sabi 28 104 535 Buffel/Oolloo 32 94 MEAN All paddocks
58 82
* - both paddocks destocked for re-sowing
Uramol Phosrite Consumption 2007-08 (g/animal/day) LWG/animal (kg)
69 20.5
81 137.4
Consumption 2008-09 (g/animal/day) LWG/animal (kg) Range (LWG)
58 13.3
-5.2-+ 29.8
82 144.5
114.7-178.2 Consumption range over 10 years (g/animal/day)
69-134 72-119
LWG was again highest in the block-fed group. The annual difference in the first year was 23 kg LWG/animal in favour of the block-fed group (Paddock 531 compared to Paddock 532). In the second year, the difference was less at 10 kg LWG/animal. In the third year, the difference was 8.1 kg/animal in favour of the urea-fed group. Last year when no urea was fed, there was a 16 kg advantage in the block-fed group. This year there was a similar difference in wet season weight gain of 15 kg in favour of the block fed group. This was consistent in all cattle in the two groups.

2008-09 ANIMAL INDUSTRIES
NIRS sampling and preliminary results
A cooperative project between QDPI&F and DRDPIFR was commenced to monitor the consumption of non-grass pasture species (legumes) by Brahman cattle using NIRS technology. The results from dung samples will indicate dry matter digestibility (DMD), faecal N, crude protein (CP) and ash content. The results will help predict cattle performance, LWG, management of pastures and may lead to the planting of mixed pastures for best grass/legume mixtures.
Method:
Dung samples were collected from Paddocks 39, 45, 48, 534 and 535 every two weeks from 29 August 2007 to 23 June 2008. The samples were collected from several fresh dung pads in each paddock, mixed, dried, labelled and were sent to QDPI&F Rockhampton for NIRS analysis.
Paddock 39 consists of Gayndah buffel with 2–4 m tall leucaena rows at 12 m row spacing. Stocking rate was 2.5 animals/ha. The paddock was split in two and rotationally grazed (four weeks grazing - four weeks rest). The non-grass (leucaena) consumption ranged between 3.4% and 45%, with an average of 20.4% over the 10 months. (Table 6)
Results:
The samples collected four to five days after animals had been on new fresh growth had higher non-grass proportions compared with the samples collected prior to moving to the fresh growth, indicating cattle were favouring the fresh leucaena. The CP ranged between 5.2% and 19.3%, (mean of 13.3%) and DMD ranged between 52% and 70% (mean 61%) over the 10 months.
The lower CP was generally in line with the lower DMD, which occurred in the later half of the dry season. LWG over the 12 months was 175 kg/animal and 437 kg/ha.
Paddock 45 consists of pangola and leucaena rows 12 m apart. The leucaena, varieties Tarramba, Cunningham and Peru, was established in the eastern half in 2001. In the western half, variety Cunningham was planted in 2005. The paddock was constantly grazed at 1.5 animals/ha post establishment.
The non-grass (leucaena) consumption ranged between 7.3% and 36% with an average of 23.5% over the 10 months. The CP ranged between 6.5% to 21% (mean of 12.5%) and the DMD ranged between 55% and 74% (mean 65%) over the 10 months.
A drop in CP and DMD again occurred in the second half of the dry season. The consumption of leucaena dropped to under 10% only once in the 10 months (the last sample collected for the season). This may indicate a reasonable stocking rate and correct grass – leucaena ratio. LWG over the 12 months was 201 kg/animal and 301 kg/ha.
Paddock 48 consists of sabi grass, Wynn and leucaena rows 12 m apart. The leucaena (varieties Tarramba and Cunningham) was established in the eastern half in 2001 and Cunningham was planted in the western half in 2005. The paddock was constantly grazed at 1.5 animals/ha. The eastern end has never recovered well after one slashing several years ago.
The non-grass (leucaena) consumption ranged between 7.2% and 31% (mean of 18%) over the 10 months. The CP ranged between 5.7% to 20.3 % (mean of 12.6%) and the DMD ranged between 50% and 70% (mean of 61%) over the 10 months. The lower proportion of CP and DMD again occurred in the later half of the dry season. LWG over the 12 months was 184 kg/animal and 277 kg/ha.
ANNUAL RESEARCH REPORT 2008-09
Paddock 535 consists of Gayndah buffel grass with Oolloo (twining legume).
The paddock is constantly grazed at 1.5 animals/ha.
The non-grass (majority Oolloo) consumption was lower compared with the leucaena paddocks and ranged between 0 (some wet season collections) to 50% (in May, October and November) with a mean of 14% over the 10 months. The average CP and DMD were similar to the other grass leucaena paddocks. CP ranged between 5.7% and 21% (mean of 13%), and DMD ranged between 51% and 70%, averaging 60%. The lower proportion of CP and DMD again occurred in the later half of the dry season.
Oolloo appears to be less palatable during the growing season compared with leucaena. However, more was consumed once it started to dry off in April, May and June. Oolloo appears to be contributing reasonable amounts of N back to the grass with buffel grass looking darker green compared with that the grass-only paddocks, especially at the start of the wet season.
LWG over the 12 months was 170 kg/animal and 255 kg/ha. LWG from June 2007 to November (mid – late dry) was low and well below trial average. This was surprising as the CP, DMD and non-grass proportions were all higher than in the buffel–leucaena paddocks over the same period although nutrient analysis tests (TB 262) showed the N content in Oolloo leaf (fresh growth) was less than in leucaena (Oolloo 1.8 to 3.2% N and leucaena between 2.1 and 4.4%). The wet season and early dry season LWG were both above trial average. Although animal performance was less than in the buffel–leucaena mix pastures, the pasture mix gave a better than trial average.
Paddock 534 has Gayndah buffel with 1–2 m tall leucaena rows (half paddock only) at 8 m row spacing with some taller shade trees producing some leucaena seedlings.
The non-grass (leucaena) consumption was much lower than in Paddock 39 and 45, which ranged between 0 to 42% with an average of 13% over the 10 months. The low consumption of leucaena is not surprising as plant growth has been slow, even in the growing season, while the older rows in the eastern end were thinned out considerably.
The CP ranged between 6.8% and 23% (mean of 13%) and DMD ranged between 50% and 70% (mean of 60%) over the 10 months. Although the consumption of the legume was lower, DMD and CP were similar to the other grass/legume paddocks.
LWG over the 12 months was 180 kg/animal and 270 kg/ha.
The DMD/CP ratio was below 10 indicating correct energy/CP levels and CP did not fall below 5%.
Faecal NIRS was assessed in the 2008–09 cattle group when data was available from July to November 2008. The CP ranged between 4.8% and 11.2% over all paddocks (6.3% to 8.2% paddock averages). DMD ranged between 51% and 60% over all paddocks (54% to 56% paddock averages). The non-grass proportion ranged between 8% and 30% over the leucaena/grass paddocks and 12% to 33% in Paddock 535.
Paddocks 39, 45 and 534 gave similar LWG to November 2008 (23 to 25 kg/animal) although Paddock 39, with the higher stocking rate, gave a much better LWG/ha. Average LWG in Paddock 48 was 14 kg/animal and Paddock 535 19 kg/animal (Table 6).

2008-09 ANIMAL INDUSTRIES
Table 6. 2008 – 09 FNIRS average data and LWG July 2008 to November 2008
Paddock Mean CP (%)
Mean DMD (%)
Mean non-grass (%)
LWG (kg/animal) July to
November 2008
LWG (kg/ha)
39 7.2 54.6 20.9 23 58 45 6.3 53.6 18.9 25 38 48 8.8 55.4 19.6 14 21
534 8.0 55.8 15.3 23 34 535 8.2 55.9 22.0 19 28
The following Figures show the non-grass, crude protein and dry matter digestibility percentages for paddocks 39, 45 and 535.
Paddock 39
0.05.0
10.015.020.025.030.035.040.045.050.0
29-A
ug-07
4-Sep-0
7
12-S
ep-07
26-S
ep-07
10-O
ct-07
24-O
ct-07
7-Nov
-07
12-N
ov-07
21-N
ov-07
3-Dec
-07
17-D
ec-07
27-D
ec-07
15-Ja
n-08
6-Feb
-08
14-Feb
-08
29-Feb
-08
5-Mar-0
8
17-M
ar-08
27-M
ar-08
10-A
pr-08
23-A
pr-08
28-A
pr-08
15-M
ay-08
30-M
ay-08
13-Ju
n-08
23-Ju
n-08
Date
Legu
me
and
CP
%
0.0
10.020.0
30.040.0
50.0
60.070.0
80.0
DMD
%
CP%Legume%DMD%
Figure 1. Details of Paddock 39

ANNUAL RESEARCH REPORT 2008-09
Paddock 45
0.0
5.010.0
15.020.0
25.0
30.035.0
40.0
29-A
ug-0
7
12-S
ep-0
7
26-S
ep-0
7
10-O
ct-07
24-O
ct-07
7-Nov
-07
21-N
ov-07
3-Dec
-07
17-D
ec-07
27-D
ec-07
15-Ja
n-08
6-Feb
-08
14-Feb
-08
29-Feb
-08
17-M
ar-08
27-M
ar-08
10-A
pr-08
23-A
pr-08
15-M
ay-08
30-M
ay-08
13-Ju
n-08
23-Ju
n-08
Date
Legu
me
% a
nd C
P %
0.0
10.020.0
30.040.0
50.0
60.070.0
80.0
DMD
% CP%Legume%DMD%
Figure 2. Details of Paddock 45
Paddock 535
0.0
10.0
20.0
30.0
40.0
50.0
60.0
29-A
ug-07
12-S
ep-07
26-S
ep-07
10-O
ct-07
24-O
ct-07
7-Nov
-07
21-N
ov-07
3-Dec
-07
17-D
ec-07
27-D
ec-07
15-Ja
n-08
6-Feb
-08
14-Feb
-08
29-Feb
-08
17-M
ar-08
27-M
ar-08
10-A
pr-08
23-A
pr-08
15-M
ay-08
30-M
ay-08
13-Ju
n-08
23-Ju
n-08
Date
Legu
me
% a
nd C
P %
0.0
10.020.0
30.040.0
50.0
60.070.0
80.0D
MD
% CP%Legume%DMD%
Figure 3. Details of Paddock 535

2008-09 ANIMAL INDUSTRIES
PROJECT: Short Duration Grazing Demonstration
Project Officers: P. Shotton, P. O’Brien and DDRF Staff
Location: Katherine
Keyword(s): cattle, grazing systems, short duration grazing, Douglas Daly Research Farm
Objective:
To monitor a rotational cattle grazing system on introduced pastures to determine the benefits to soil health, plant composition and cattle performance compared with traditional grazing systems.
Background:
The basic objective of short duration grazing (SDG) is to divide the pasture grazing area into a series of smaller paddocks where cattle are rotated from paddock to paddock, spending from one to five days in each paddock. This allows cattle to continually graze quality feed, allows more even grazing distribution and allows pasture to rest before being grazed again.
Grazing evenly at high stocking rates and promoting even distribution of dung and urine, while allowing pasture adequate rest, may result in a dramatic improvement in pasture composition and soil health.
Advocates of cell grazing/SDG expect an improvement in pasture and paddock condition to increase carrying capacity. As input prices and overheads continue to rise, producers are keen to find out if SDG can help increase their returns through increased animal weight gains or carrying capacity.
Method:
Sixteen paddocks of 2, 4 and 6 hectares each were used to rotationally graze year-round. Three paddocks were used as controls and were continuously grazed.
The cattle were Brahman–Brahman/cross yearling heifers. They started grazing in December each year and remained in the demonstration for a 12-month period. Then they were replaced with another group of yearling heifers.
Paddocks 2, 5 and 17 were selected as control grazing paddocks where heifers were set-stocked at a similar rate as in the SDG paddocks.
In December and May each year, all paddocks were assessed for pasture composition and estimated pasture yield.
At the start of the trial all in December 2005, the paddocks received 50 kg/ha Generator® pasture fertiliser and were sprayed with herbicides (Amine® 24-D and/or Brush-off®) for broadleaf weeds, particularly Senna (Senna obtusifolia), Hyptis (Hyptis suaveolens), Sida spp. (Sida) and Caltrop (Tribulus terrestris). No other herbicides were applied to the trial area.
The paddocks were stocked at 1.5 animals/ha in the wet seasons and then reduced to one animal/ha in June. The set-stocked paddock differed slightly in the wet season stocking rate when Paddock 2 was

ANNUAL RESEARCH REPORT 2008-09
stocked at 1.2 animals/ha, Paddock 5 at 1.25 animals/ha and Paddock 17 at 1.5 animals/ha. The stocking rate during the dry season remained at one animal/ha.
Uramol® supplementary lick blocks were supplied ad lib to all animals during the dry seasons. Consumption was 80 to 103 g/animal/day in the cell groups and 88 to 112 g/animal/day in the control paddocks.
Data collection
Plant composition was assessed in each paddock in December and May each year to determine pasture yield and monitor changes in desirable and non-desirable plant species.
Cattle movement and grazing days per paddock and per hectare were recorded on a grazing chart. The cattle were weighed at the start of the grazing year in December and then about every eight weeks thereafter to monitor live-weight changes and animal health.
Results:
The live-weight gain (LWG) of the control and cell paddock animals differed over the length of the trial, with the cell animals gaining slightly more weight (Table 1).
The LWG and stocking days/ha in individual control paddocks ranged between 0.14 and 0.28 kg/animal/day and 980 and 1800 days, respectively. Paddock 2 had the lowest LWG and Paddock 5 the highest.
Table 1. Cattle LWG. (kg/animal/day)
Dec 05 to April
2006
April 06 to Dec 2006
Dec 2006 to May
07
May 07 to Dec 2007
Dec 07 to April
08
April 08 to Dec
08
Dec 08 to June
09
Total Average all years
Cell 0.39 0.34 0.37 0.26 0.22 0.24 0.27 0.30 Control 0.36 0.25 0.5 0.30* 0.3 0.17 0.19 0.25 Note: * = Control Paddock 17 only
In the first year, annual LWG was 125 kg/animal (0.34 kg/animal/day) in cell heifers and 90 kg/animal (0.25 kg/animal/day) in the control group. Wet season LWG was 0.39 kg/animal/day in cell heifers and 0.36 kg/animal/day in the control group. In the dry season, LWG was 0.55 kg/animal/day in cells heifers and 0.47 kg/animal/day in the control group.
In the second year, fire burnt the first seven paddocks on 06/07/2007, including Paddocks 2 and 5 of the control group, leaving only Paddock 17 in the control group for the rest of the year. Due to the fire, the stocking rate was reduced to one animal/ha. Prior to the fire, the wet season LWG in cell heifers was 0.37 kg/animal/day and 0.5 kg/animal/day in control heifers. Dry season LWG in cell heifers was 0.17 kg/animal/day, ranging from 0.006 to 0.31 kg/animal/day, and in the control group it was 0.08 kg/animal/day, ranging from 0.006 to 0.12 kg/animal/day. Annual LWG in cell heifers was 0.26 kg/animal/day, ranging from 0.06 to 0.36 kg/animal/day and in the control group (Paddock 17), 0.3 kg/animal/day, ranging from 0.21 to 0.37 kg/animal/day.

2008-09 ANIMAL INDUSTRIES
Replacement heifers had an average weight of 181 kg, ranging from 111 to 244 kg on 24/12/2007. By 18/04/2008 the average LWG in the control group was 0.30 kg/animal/day, ranging from 0.1 to 0.4 kg/animal/day and in cell heifers it was 0.22 kg/animal/day, ranging from 0.1 to 0.4 kg/animal/day. In 2008 cell heifers gained 0.27 kg/animal/day and control heifers 0.17 kg/animals/day. The average weight in 2009 of cell heifers was 178 kg, ranging from 117 to 262 kg. Between December 2008 and June 2009, they gained 0.27 kg/animal/day while the control group gained 0.17 kg/animal/day.
Plant composition and pasture yield varied between years and throughout each paddock. Total plant biomass in each paddock ranged between 3 and 11.3 tons/ha. The lower yield was due mainly to flooding of some of the lower paddocks.
Broadleaf weeds increased in all paddocks over the four years, while desirable grasses increased during the second year but decreased in most paddocks the following years. (Figure 1)
Average yield of all paddocks for Grass, Other grass, Weeds and Legumes
01000200030004000500060007000
2006 2007 2008 2009
May of each year
Biom
ass
yiel
d in
kg/
ha
GrassWeedsOther grassesLegumes
Figure 1. Average pasture yield
The yield of desirable legume pasture species (mainly Cavalcade and Verano) increased in most paddocks over the four years. The increase in legume growth was mainly due to not using herbicides.
The annual yield of ‘other grasses’ was less predictable, although the highest yield in most paddocks was recorded in 2007 when desirable grass yield was also higher (Figure 1).
The areas of Jarra grass in Paddocks 9 to 15, particularly Paddock 19 appeared to compete with broadleaf weeds better than sabi grass, although the yield of Jarra did not appear to be as good as that of sabi in Paddocks 18 and 19.
Figure 2 shows yield comparison and standard deviation in Paddocks 18 and 19 where desirable grasses and weeds were assessed.

ANNUAL RESEARCH REPORT 2008-09
Paddocks 18 and 19 comparison of Desirable grass and weed yield over time
02000400060008000
10000
06 07 08 09 06 07 08 09
18 18 18 18 19 19 19 19
Paddock and year
Plan
t yie
ld in
Kg/
ha
Desirable grassesWeeds
Figure 2. Yield comparisons
When the set-stock paddocks were compared with the rotational grazing paddocks for yield of desirable grasses and broadleaf weed invasion over time, it was noted that weeds increased every year in all paddocks while desirable grasses decreased (Figure 3).
Comparison Paddocks of Desirable grasses and weed yield over time
02000400060008000
1000012000
2 2 2 2 5 5 5 5 17 17 17 17 3 3 3 3 6 6 6 6 16 16 16 16
06 07 08 09 06 07 08 09 06 07 08 09 06 07 08 09 06 07 08 09 06 07 08 09
Set stocked pdks. Rotation pdks
Kg/ha
Desirable GrassesWeeds
Figure 3. Comparison of yield between cell and control paddocks
Statistical analysis for changes in plant composition
Three control paddocks and three rotational grazing paddocks next to them were compared.
The mean quadrat yields of four plant groups of desirable grasses: sabi and Jarra, all other grasses (mainly annuals), desirable legumes (Cavalcade and Verano) and all broadleaf weeds were analysed.
Comparisons were made using an ANOVA model to assess yields repeated in time (May values for 2006, 2007, 2008, 2009 and December values for 2006, 2007, 2008) for each group.

2008-09 ANIMAL INDUSTRIES
Comparisons involved Paddock 2 vs. Paddock 3, Paddock 5 vs. Paddock 6 and Paddock 16 vs. Paddock 17.
The plant groups used in each comparison included desirable grasses (sabi and Jarra), all other grasses (mainly annuals), desirable legumes (Cavalcade and Verano) and all broadleaf weeds.
The ANOVA and source of variation is shown for each comparison. The test assessed the overall paddock effect (paddocks averaged across all years), the overall year effect (averaged across both paddocks) and the interaction effect of paddock in each year (Year*Paddock). This is the effect of main interest. For significant interaction effects, separate individually planned comparisons are used to isolate means within each year. For all tests, there are associated P-values and if these are less than 0.05 (type I error rate) then the test indicates a significant difference between the means.
A feature of the data is the large scale of the variability in the transect means in 2008 for a number of recorded groups, where transect mean variance was clearly larger than in previous years (or relative to 2006). In many cases these were maintained for the December and May 2009 sampling periods. Where present (see wider error bars on means plots) this indicates an increasing patchiness in the distribution of pasture species recorded.
Comparison: Paddock 2 vs. Paddock 3
In desirable grasses (sabi and Jarra) by May, the paddock effect was significant (higher yields in Paddock 3, P=0.0078) but there was no significant interaction effect for paddocks across years (P=0.2004). Within 2008, there was a significant difference in mean paddock yields (planned comparison P=0.0226) but none by May 2009 (P=0.9995).
Table 2. ANOVA grasses
Effect SS df MS F P Paddock 14237713 1 14237713 15.3888 0.0078 Error(paddock) 5551193 6 925199 Year 44013388 3 14671129 15.2099 <0.0001 Year*Paddock 4952588 3 1650863 1.7115 0.2004 Error(Y*P) 17362391 18 964577

ANNUAL RESEARCH REPORT 2008-09
paddock pdk.02 paddock pdk.03May06 May07 May08 May09
YEAR
-1000
0
1000
2000
3000
4000
5000
6000
7000M
ean
Yiel
d (k
g/H
a)
Figure 4. Yield comparison (grasses) between Paddocks 2 and 3
In desirable legumes (Cavalcade and Verano) by May, both main effects were significant but there was no significant interaction effect for paddocks across years (P=0.0533). Mean yield in both paddocks increased in 2007. Paddock 3 maintained its yield in 2008 but Paddock 2 mean dropped in 2008.
Table 3. ANOVA legumes
Effect SS df MS F P Paddock 1848797 1 1848797 13.9900 0.0096 Error(Paddock) 792908 6 132151 Year 11940986 3 3980329 14.9720 <0.0001 Year*Paddock 2463538 3 821179 3.0889 0.0533 Error(Y*P) 4785324 18 265851

2008-09 ANIMAL INDUSTRIES
paddock pdk.02 paddock pdk.03May06 May07 May08 May09
YEAR
-1500
-1000
-500
0
500
1000
1500
2000
2500
3000
Mea
n Yi
eld
(kg/
Ha)
Figure 5. Yield comparisons between Paddocks 2 and 3 (legumes)
In all broadleaf weeds by May, mean yields increased across the study period and there was a highly significant interaction effect for paddocks across years (P=0.0003) with a faster rate of increase occurring in Paddock 2 during 2008 followed by a significantly increased yield in Paddock 3 in 2009. Mean yields in Paddock 3 were higher in 2009 (planned comparison effect P=0.0040).
Table 4. ANOVA broadleaf weeds
Effect SS df MS F P Paddock 462899 1 462899 0.3867 0.5569 Error(Paddock) 7181665 6 1196944 Year 268213207 3 89404402 102.8394 <0.0001 Year*Paddock 27048960 3 9016320 10.3712 0.0003 Error(Y*P) 15648474 18 869360

ANNUAL RESEARCH REPORT 2008-09
paddock pdk.02 paddock pdk.03May06 May07 May08 May09
YEAR
-2000
0
2000
4000
6000
8000
10000
12000
14000M
ean
Yiel
d (k
g/H
a)
Figure 6. Yield comparisons between Paddocks 2 and 3 (weeds)
Discussion
Some paddocks seemed to follow past trends of low grass production, such as Paddocks 4, 5, 6, 10, 12, 13, 14 and 15. This could be due to sorghum cropping practices and herbicide use for grass control in Cavalcade pastures. A similar case was found in Paddocks 7 to 13 where yields were lower than in other paddocks. These paddocks had the lowest yield and can get much wetter and partly flooded in some seasons.
No noticeable differences were observed between paddock size and the yield of grasses, legumes and weeds.
The fire in July 2007 did not appear to have affected the yield of grasses, legumes and weeds in the following seasons.
The pasture composition and yield assessments recorded in December each year depended on rainfall events during the months prior to data collection. In most years desirable grass, legume and broadleaf weed yields were similar within groups.
The comparison of cattle LWG between the set-stocked and rotationally-grazed paddocks varied slightly over the four-year trial, with no evidence of marked differences.

2008-09 ANIMAL INDUSTRIES
As no herbicides were applied since the initial application, there was a large weed burden in all paddocks. During the first two years, weeds in the set-stocked paddocks appeared taller than those in the rotationally-grazed paddocks due to the impact of cattle. The use of short-duration grazing with no herbicide treatment is not controlling broadleaf weed invasion, which may cause a decrease in desirable grass yield (Figures 7 and 8).
Wallabies influenced grazing pressure in some areas of the trial, particularly in Paddocks 1, 2 and 3.
The following figures show broadleaf invasion over time.
Figure 7. Paddock 16 in Dec 2005 at the start of the trial with minimum weed burden

ANNUAL RESEARCH REPORT 2008-09
Figure 8. Paddock 16 in March 2009, at the end of the trial, with a large amount of weeds due to not applying herbicides
PROJECT: Pasture Species Evaluation under Grazing at DDRF: Buffel/Legumes
Project Officers: P. Shotton and DDRF Staff
Location: Katherine
Keyword(s): cattle, grazing systems, grass/legume pastures, Douglas Daly Research Farm
Objective:
To monitor the value of a companion pasture legume with buffel grass in terms of nitrogen (N) availability, pasture quality, quantity and persistence of legume species.
Background:
Buffel grass is commonly used as an improved pasture in the Top End, mainly south of and including the Douglas-Daly region. As established buffel grass tends to grow in clumps, a useful legume companion species could be beneficial to help utilise the empty area between buffel plants and provide N to the grass resulting in higher quality and better yield. A legume could provide a higher protein diet for cattle and reduce potential weeds between grass clumps.

2008-09 ANIMAL INDUSTRIES
The project follows a non-grazed plot trial of 1996-1998 that evaluated the benefit of six tropical pasture legume species as companions to buffel grass (see Technote 110).
Method:
Five pasture legume species were planted in a 4-ha paddock (Paddock 50) at DDRF. The legumes were Wynn cassia (Chamaechrista rotundifolia), Verano stylo (Stylosanthes hamata), Oolloo (Centrosema brasilianum), Maldonado (Macroptilium gracile) and Milgara blue pea (Clitoria ternatea). The legumes and the control buffel (Cenchrus ciliaris)) grass were used in a randomized design and replicated four times with a plot size of 12 m x 130 m.
In December each year 50 kg/ha of Goldphos 20® or equivalent fertiliser was applied.
The area was left non-grazed in the first wet season to allow legumes to set seed. The paddock was grazed over the 12-month period by five Brahman weaner steers (1.25 animals/ha) which were weighed, condition- scored and after December, tested for fat depth (P8) every 28 days. The steers were put in at the end of June each year and were changed over every 12 months. The practice in 2004-05 and 2005-06 differed slightly by altering the breed of steers to a mixture of Brahman, composites and Droughtmaster. In 2006-07 animal numbers were increased to six (1.5 animals/ha).
The animals were supplemented with Uramol® blocks during the dry season and Phosrite® blocks during the wet season.
Prior to planting, broadleaf weeds were controlled with Starane® as a post-planting/pre-emergent herbicide in January 2000. Some hand-weeding and spot-spraying was conducted for broadleaf weeds, mainly spiny head sida (Sida acuta) flannel weed (Sida cordifolia), Hyptis (Hyptis suaveolens) and Senna (Cassia obtusifolia).
Pasture composition and yield were assessed twice each year in December and May using Botanal®.
Results:
During the first two seasons, all legumes established well. The most prolific were Milgara blue pea, Oolloo and Maldonado. Wynn cassia and Verano stylo were less prolific than the twining legumes. Verano, Wynn and blue pea seeded well while Oolloo and Maldonado seeded poorly. However, all legumes seeded well in the second year. Results from the April 2001 Botanal® harvest indicated that the greater the legume content, the higher was the overall yield, although grass yields in Oolloo were lower, indicating that Oolloo was competing with buffel grass.
Results of the 2002-03 plant composition check indicated the proportion of legumes decreased with only the Oolloo showing signs of sustaining a grass/legume mix (Figure 1). Very few legumes were present during the 2003-04 wet season. However, in the following season (2004-05) Oolloo, Verano and Wynn increased, particularly Wynn and Oolloo. In 2005-06 DDRF received 1846 mm of rain, which encouraged strong growth in the legumes. In the following two years, very few Maldonado or Milgara plants were found. Oolloo accounted for over 10% of the total biomass in the 2006–07 season. However, less than 1% remained in the following years. Wynn continued to produce reasonable amounts of legume biomass (6% to 9%) and was spreading outside the original plots. Verano production continued to decline.

ANNUAL RESEARCH REPORT 2008-09
Paddock 50 Legume % of biomass
010203040506070
2001 2002 2003 2004 2005 2006 2007 2008 2009
May each Year
% o
f Bio
mas
s MaldMilgaraOollooVeranoWynn
Figure 1. Legume production in Paddock 50
The average 12-month live-weight gain (LWG) in cattle was similar to last year, but lower compared with previous years (see Table 1). This may have been due mainly to the increased stocking rate, seasonal effects and varying legume percentages.
Table 1. Mean annual LWG/animal
Year 2001-02 2002-03 2003-04 2004-05 2005-06 2006-07 2007-08 2008-09 (kg) 208 176 190 168 203 173 170 153
Hard-seediness, climatic conditions, insect pests and palatability of legumes have long-term effects on the pasture mix. Different management techniques of the pasture, such as non-grazing to allow seed to set every second or third year, will improve sustainability of pasture legumes. A limitation of this trial was that the animals could selectively graze plants of preference, which could result in over-grazing and depletion of some legumes, allowing the less palatable to survive or dominate. The promising performance of Oolloo as a companion legume in buffel grass has led to further production monitoring in Paddock 535, where the legume was introduced in December 2002 into an existing buffel grass paddock.
The pasture composition surveys conducted in the last four years found no Milgara in any of the trial areas.
Buffel grass remains the dominant plant species, while all other grasses (annuals) total less than 3%. The introduced legumes represented 10% of the total biomass and broadleaf weeds represented just over 4%, mainly Sida acuta.

2008-09 ANIMAL INDUSTRIES
PROJECT: Genetic and Reproductive Improvements in Australian Water Buffalo
Project Officers: B. Lemcke, E Cox, J Stevens, A. Turner (NTAB) and BHF Staff
Location: Darwin
Keyword(s): buffalo, breeding, artificial insemination, genetic analysis, buffalo register, Beatrice Hill Farm
Objectives:
To develop artificial insemination (AI) synchronization to facilitate good outcomes.
To establish a database for the Australian buffalo industry.
To analyse and report swamp buffalo genetics from historical data at DRDPIFR.
Background:
The Rural Industries Research and Development Corporation (RIRDC) collects levies from the buffalo industry (and many others), to support research and development programs in those sectors. DRDPIFR conducted a four-year project (DNT 33A) starting in 2003 and ending in 2007. A final report was submitted in 2008.
Method:
As suitable stock became available, drug protocols were used to synchronize the onset of oestrus in the animals for fixed-time inseminations. Semen was available from Italy and locally for producing suitable genetic lines to promote the industry. This was necessary due to the limited number of initial imported breeding stock from the US. NT and interstate herds could participate in this project if they had suitable stock and facilities. So far BHF, the Shaw River Buffalo Dairy at Yambuk Victoria and the Australian Dairy Buffalo Company (ADBC) in Millaa Millaa north Queensland have participated in the AI project.
Arrangements were made with the Agricultural Business Research Institute (ABRI) at the University of New England to provide technical advice, genetic analysis and registry facilities for this project. Data from the current riverine and crossbreeding herd and from the BHF swamp herd held since the 1980s was analysed.
Results:
Three AI rounds were conducted during 2008 at BHF, in January, March and June. They were followed up by the use of a bull after the last round. Ultrasound testing showed that 20 out of 26 animals responded after three rounds and DNA tests showed nine out of 26 successes to round 1, (one foetus abortion), four out of 16 in round 2, and five out of 12 in round 3. The bulls were 100% successful over a three-month mating period. “Cue-Mates” and “Ovsynch” were used in the March and June rounds equally, with mixed results. The success rate was four out of eight for “Ovsynch” and zero out of eight for “Cue-Mates” in March; in June, cit was three out of six for ‘Cue-Mates’ and two out of six for ‘Ovsynch’.
Seven herd milk tests were conducted at Millaa Millaa in 2007-08.

ANNUAL RESEARCH REPORT 2008-09
A final report for the project was published by RIRDC in Nov 2008 (RIRDC Publication No. 08/189) and is accessible through the RIRDC website or in printed form.
The Buffalo Register contains information from six herds: three in Victoria, two in Queensland and one at BHF.
An initial genetic analysis for the final report was done by ABRI, but more analysis is needed.
PROJECT: Enhancing Productivity Improvements in the Water Buffalo Industry
Project Officers: B. Lemcke, E. Cox, A. Turner (NTAB), M. Humphries and BHF Staff
Location: Darwin
Keyword(s): buffalo, breeding, artificial insemination, genetic analysis, buffalo register
Objective:
To continue to provide information on buffalo production in order to facilitate local industry prosperity in the future.
Background:
The Rural Industries Research and Development Corporation (RIRDC) collects levies from the buffalo industry (and many others) to support research and development programs in those sectors. DRDPIFR conducted a four- year project (DNT 33A), which started in 2003 and ended in 2007. RIRDC has provided funding for the following four years to continue this work (RIRDC Project PRJ 000042).
Detailed objectives include to:
1. Continue to develop artificial insemination (AI) synchronisation protocols to achieve 50% conception rates.
2. Establish a benchmark tenderness values for TenderBuff of various age/weight ranges.
3. Determine the quality factors in buffalo milk that set it apart from cow’s milk in the market place.
4. Continue subsidisation of milk testing at Millaa Millaa dairy to build up dairy production data in a commercial herd.
5. Encourage registration of producer herds throughout Australia.
6. Monitor feedlot performance of crossbred river buffalo overseas compared with swamp.
7. Prepare for publication a “Best Practice Manual” for water buffalo in Australia.

2008-09 ANIMAL INDUSTRIES
Method:
As suitable females become available, drug protocols are used to synchronise the onset of oestrus for fixed time inseminations. Semen has been purchased from Italy and locally to produce suitable genetic lines to improve productivity in both meat and milk. AI is necessary due to the limited number of imported breeding stock from the US. NT and interstate herds can participate in this project if they have suitable stock and facilities.
Comparisons between crossbred and swamp feed conversion efficiency are planned for local trial and to monitor in overseas feedlots to demonstrate to our customers the value of the crossbred for meat production.
Milk testing and characterisation of buffalo milk quality will be conducted to promote marketing of buffalo dairy products.
Producers will be encouraged to participate in registration and BREEDPLAN facilities prepared for the industry
If abattoir facilities become available in the NT, further TenderBuff development will be conducted to explore meat tenderness relationships for different weight/age groups.
Results:
Three AI rounds were conducted at BHF in January, March and June, 2008. They were followed by natural insemination by a bull after the last round. Ultrasound testing showed that 20 out of 26 were successful after three rounds. The bull was successful with the last six within three months.
Eight milk tests were conducted at Millaa Millaa in 2008-09.

ANNUAL RESEARCH REPORT 2008-09
PROJECT: Riverine Buffalo and Crossbreeding
Project Officers: B. Lemcke, E. Cox, L Huth, A Turner (NTAB), G. Jayawardhana and BHF Staff
Location: Darwin
Keyword(s): buffalo, breeding
Objectives:
To determine the merits of crossbreeding and upgrading to riverine buffalo for the NT buffalo industry.
To distribute suitable progeny from the program to industry for breeding or to supply TenderBuff.
To demonstrate sustainable buffalo production systems.
Background:
It was the long-held dream of pioneer buffalo researcher, the late Dr Don Tulloch, and the vision of the NT Buffalo Industry Council to introduce riverine buffalo blood into the Australian industry. The dream became reality in 1994 when two bulls were imported, followed over the next three years by four heifers and two more bulls. Two of the heifers were purchased by a private producer and were left at BHF for mating. A crossbreeding program was started and progeny performance was monitored. Some animals are sent to supply the TenderBuff market. The number of purebred animals at BHF has now reached 75, with a steady increase in breeders and bulls. Two of the original imported bulls are still in use.
The plan is to produce purebred riverine buffalo from two directions by accelerating the process by using purebred cows to increase numbers from within the herd and by crossbreeding with swamp buffalo, then backcrossing to purebred through 3/4, 7/8 and 15/16 generations back to purebred riverine.
We expect during this project to identify all of the most suitable mixtures of the two breeds for meat production locally, the live export market and dairy production markets in Australia and overseas.
A four-year cooperative agreement was finalised in early 2007 to supply the Australian Dairy Buffalo Company in Millaa Millaa north Queensland quantitative and qualitative data on the milk producing potential of the various crosses compared with the pure riverine buffalo,. Most of that farm’s stock was derived from BHF. The dairy supplies milk to the Vanella Cheese Factory in Cairns, which produces mozzarella, fetta, buffalino, yoghurt, and other products through its own factory/shop outlet. Milk data is incorporated in the genetic database and the Buffalo BREEDPLAN.
BHF supplied animals to another dairy farmer in Maleny Queensland, in 2004, 2005 and 2008. That farm is now supplying milk to the local Maleny Cheese Factory, which sells a range of buffalo cheese and yoghurt products.

2008-09 ANIMAL INDUSTRIES
Method:
Table 1. Bulls used in the 2009 mating period
Cow group Bulls Swamp Available for sale F1 Available for sale 3/4 5861 7/8 5858 15/16 5859 Riverine Two rounds of AI in March and June 2009 All heifers 5875
Since 2007 all heifers have been mated continuously instead of entering the cow group with controlled mating. This allows for earlier calving in heifers at two years of age, instead of at three years. This was done because AI use is more difficult in heifers although they are well grown as yearlings to cope with pregnancy. If left until two years of age before mating, over-fatness may become an issue of concern at higher weights, particularly at calving.
Semen from six Italian milk breed buffalo bulls was imported for use in AI programs. Another shipment of Italian semen was imported in April 2009. Also there are now nine new bulls available. The first of the new semen shipment was used in June 2009, along with a few straws of semen from the US bull “Bill” in harder-to-inseminate cows.
Results:
Table 2. The composition of riverine, swamp and crossbred buffalo groups at BHF, June 2009
Imported bulls
Local bred bulls
Breeder cows
Yearling bulls
Yearling heifers
Male calves
Female calves
Calf deaths
Total
Purebred riverine
2 14 38 7 0 16 17 3 94
Swamp 23 23 F1 25 All sold 6 12 0 43 3/4 34 9 12 8 4 63 7/8 33 10 16 12 4 71 15/16 11 6 7 19 2 43 TOTAL 2 14 164 7 25 57 68 13 337

ANNUAL RESEARCH REPORT 2008-09
Table 3. Calving results for 2007-08 and pregnancy diagnosis (July 2008) for next season’s calves
Breeder group Calves born/cows mated = Calving rate (%) 08-09 calves
No. pregnant June 2009/ cows mated Jan 2009
Pregnancy (%) No. preg+wet cows/ total wet cows = (%) wet cows pregnant
Swamp cows 18 / 24 = 78.3% Not mated n.a. n.a. F1 cows 25/ 36 = 75.7% Not mated n.a. n.a. ¾ cows 28 / 33 = 82.4% 29 / 34 85.3% 23/28 = 82.1% 7/8 cows 22 / 28 = 78.6% 18 / 32 56.3% 14/26 = 53.8% 15/16 cows 2 / 2 = 100% 8 /11 72.7% 3/6 = 50% Riverine cows 25/26 = 96.2% Round 1 7/16
Round 2 14/26
All two year-old heifers
19/19 = 100%
Yearling heifers 24 / 29 82.8% Total 139 / 168 = 82.7% 100 / 141 70.9% 40/60 = 66.6%
Calf mortality increased this year to 9.4% from 5% last year, compared with 12.8% and 8% in the previous two years. This was mainly due to dingo predation on day 1. However, one purebred Italian calf was born deformed with two very small forelegs, and palate and scrotal malformations.
Pregnancy rates for next season have dropped slightly after the very good calving rate this year. The wet cow pregnancy rate has stayed similar to last year’s. There was a significant rise this year in purebred numbers, with additions through backcrossing.
The pure riverine breeders produced many calves this year, but this is expected to decline each year due to the number AI rounds undertaken and cleanup of stragglers.
Sales
Sales this year were limited to 11 heifers (seven 2.5 year-old pregnant or with calf F1cows and four F1 yearling heifers destined for the dairy in Maleny.
It is hoped that a buffalo dairy will be established in the Top End within six months after the first local cows were recently machine-milked in the Darwin rural area. The experience from Millaa Millaa suggests that buffalo dairying is feasible in the Top End provided there is proper feeding. The advantage of using buffalo from the Top End is their ability to produce milk without needing large quantities of concentrates and supplementary feeds.

2008-09 ANIMAL INDUSTRIES
PROJECT: TenderBuff Development and Supply
Project Officers: B. Lemcke, E. Cox, L. Huth J. Stevens and BHF Staff
Location: Darwin
Keyword(s): buffalo, TenderBuff
Objectives:
To promote and implement the TenderBuff quality assurance program in local and interstate markets.
To ensure a year-round supply of TenderBuff in the NT.
Background:
The TenderBuff program was initially started to provide higher returns to buffalo producers whose animal numbers were quite small, post-BTEC. TenderBuff was seen as a reasonable substitute for eye fillet that had been obtained from feral animals for the restaurant trade. It was also an opportunity to supply a much wider range of high quality cuts.
DRDPIFR conducted the project in cooperation with the NT Buffalo Industry Council. This included quality assurance and branding of carcases at the abattoir. Producers received $3.10/kg hot standard carcase weight (HSCW). Each carcase must meet five specifications to receive the TenderBuff strip brand.
TenderBuff has lower cholesterol and fat than beef. These two factors are used for positive marketing of the product as an alternative red meat. As riverine cross buffalo grow much faster than swamp buffalo, they can be turned-off at a much younger age and should therefore produce more tender meat.
The latest problem to affect local TenderBuff production was the closure of Litchfield abattoir in March 2007. It is hoped that the Gunbalanya Meat Supply Company in Oenpelli will be able to fill in this gap when the abattoir is refurbished later in 2009. The absence of an abattoir has forced all current production to be sent to overseas live markets at a lower price, mainly in Indonesia.
Method:
The current TenderBuff specifications are:
• 150-300 kg HSCW. • 3-12 mm fat at p8 site. • No permanent teeth. • Electrically stimulated carcase. • Muscle pH below 5.8 after 18 hours.
Results:
Five animals were slaughtered at Oenpelli during the 2009 show. The abattoir does not have sufficient rail height to hang a full side or the equipment for electrical stimulation of carcases. It is isolated during the wet

ANNUAL RESEARCH REPORT 2008-09
season as there is no road access. It is therefore unable slaughter cattle or buffalo all year round unless animals are brought in before the wet season and the meat is sent out by air. Areas for wet season grazing are also very limited.
PROJECT: Viral and Endogenous Retroviral Detection and Characterisation in Crocodiles
Project Officers: L. Melville, S. Davis, R. Weir and C. Shilton
Location: Darwin
Keyword(s): crocodiles, viruses, diseases
Objectives:
To define the best conditions for reliably producing primary cells lines from Crocodilus porosus.
To develop methods for the maintenance and cryopreservation of primary C. porosus cell lines.
To investigate the viral fauna of farmed and wild C. porosus in the Northern Territory.
To determine the feasibility and need for developing continuous cell lines from primary C. porosus cell lines.
To investigate the role of endogenous retroviruses in runting and other diseases.
Background:
This project was initiated in response to the findings of RIRDC project NAP05-16. One objective of that project was to conduct a histopathology study to determine if there were any gross histological differences or pathological reasons for runting. No evidence was found to suggest that bacterial or fungal infections were causing runtism. However, lymphoid atrophy in several tissues (particularly the thymus and tonsils) as a secondary effect of viral infection could not be eliminated. Viruses are not well characterised in crocodilians because, until recently, no crocodile cell lines had been established and no crocodilian viruses would grow on other established cell lines. The development of a crocodile-specific cell line will allow the isolation and characterisation of crocodilian viruses as well as allow antigen preparation for serological testing and, eventually, the manufacture of specific vaccines.
Furthermore, the characterisation of endogenous retroviruses (ERVs) could also provide evidence of infectious agents that have been associated with disease, pathogenesis, immune system reduction and associated disorders in other species. ERVs are copies (or remnants) of exogenous retroviruses that have integrated into a host cell genome at some stage. This study intends to characterise ERVs and assess their levels of expression, particularly in runts. ERV characterisation is important in the context of aetiology and zoonosis of animal diseases. ERV characterisation will allow potentially novel functional and non-functional retro elements to be identified, whilst gene expression will establish which ERVs are functional and potentially transmissible. This information will allow associations to be drawn regarding the possible role of crocodile ERVs in causing runtism and other diseases.

2008-09 ANIMAL INDUSTRIES
Method:
A selection of tissue was taken from six hatchling (<24hrs old) crocodiles from which to try to produce viable cell lines.
To investigate the viral fauna of farmed C. porosus in the Northern Territory, a group of 20 sentinel hatchling crocodiles were selected by Porosus Pty Ltd. The hatchlings were from different clutches and were located in different pens. A small blood sample was collected from each animal once a week. Sampling commenced on 23 April. The samples were then inoculated to cell lines suitable for isolation of arboviruses.
Samples from crocodiles with pharyngitis or conjunctivitis were inoculated into crocodile-specific cell lines.
Results:
Using standard primary cell culture techniques, it was possible to produce from the samples the following viable cell lines:
• Six cell lines from heart tissue. • Three cell lines from kidney tissue. • Four cell lines from lung tissue. • One cell line from subcutaneous tissue. • One cell line from liver tissue. • Five cell lines from tracheal tissue. • One cell line from muscle tissue.
All cell lines have had multiple passages, with the more advanced having four passage levels, while continuing with good growth characteristics.
Cell growth conditions were optimised by the following parameters:
• medium 199 + 10% foetal bovine serum + 25 ng/mL epidermal growth factor, at an incubation temperature of ~300C.
Two viruses were isolated from routine blood sampling and eight viruses from crocodiles with pharyngitis or conjunctivitis. None of the isolated viruses have been identified or characterised.

ANNUAL RESEARCH REPORT 2008-09
PROJECT: Weather Recording for Douglas River
Project Officers: P. Shotton, DDRF Staff and the Bureau of Meteorology
Location: Katherine
Keyword(s): weather recording, rainfall, temperature, Douglas Daly Research Farm
Objective:
To record and maintain daily weather information for the DDRF manual and automatic weather station.
Background:
Weather records are important for successful farming and for conducting research on research stations.
Method:
Manual meteorological observations are conducted of pan evaporation and rainfall. The automatic weather station records wind run, wind speed, gusts and direction, wet and dry bulb temperatures for humidity and dew point, minimum and maximum temperatures, rainfall amount, intensity, soil temperature and moisture, and barometric pressure.
Results:
All past DDRF weather information is available through the Bureau of Meteorology. Details are shown in Figure 1 and Table 1.
Total rainfall for the 2008-09 wet season was 1201 mm over 81 rain days. This was approximately similar to the long term mean annual rainfall (see below).
DDRF Rainfall 2008 - 09
0100200300400500
Augus
t
Septem
ber
Octobe
r
Novembe
r
Decembe
r
Janu
ary
Februa
ryMarc
hApri
l
Month
Rai
nfal
l
0510152025
Rai
nday
s Monthly average Rainfallraindays
Figure 1. Rainfall at Douglas Daly Research Farm

2008-09 ANIMAL INDUSTRIES
Table 1. Douglas River monthly historical weather data
Statistic element Jan. Feb. March April May June July Aug. Sep. Oct. Nov. Dec. Mean maximum temperature (ºC)
33.6 33.1 33.7 34.5 33.2 31.2 31.6 33.4 36.6 37.5 36.8 35
Highest temperature (ºC)
39.2 37.4 37.6 38.5 38.4 36.6 36.6 38.7 40.6 42.6 41.5 40.7
Date of highest temperature
02-Jan-03 01-Feb-07 21-Mar-68 26-Apr-02 14-May-73 03-Jun-98 08-Jul-98 25-Aug-98 28-Sep-97 20-Oct-02 03-Nov-01 27-Dec-02
Mean minimum temperature (ºC)
23.8 23.7 23 20.2 16.2 13.6 12.3 14.1 18.5 22.4 23.5 23.6
Lowest temperature 19.5 19.5 11.6 10 5.5 3.7 2 2.5 4.5 11.5 14.2 16.4 Date of lowest temperature
19-Jan-77 02-Feb-77 17-Mar-68 20-Apr-77 10-May-74 30-Jun-07 19-Jul-77 02-Aug-77 19-Sep-77 18-Oct-72 13-Nov-99 26-Dec-69
Mean rainfall (mm) 280.5 294.6 231.4 47.2 8.5 2.7 2.9 1.3 4.5 36.9 117.4 199.8 Highest rainfall (mm) 786.6 683.4 636.4 410.4 96.8 86.8 47.7 21.4 37.6 124.8 247.2 515.6 Date of highest rainfall
1998 2008 1974 2006 1990 1973 1968 2007 1986 1969 2005 2003
Lowest rainfall (mm) 106.3 77.4 63.4 0 0 0 0 0 0 0 30.4 30 Date of lowest rainfall 1970 1986 1990 2009 2008 2008 2008 2008 2004 2008 2003 1972 Highest daily rainfall (mm)
194.6 206.4 155 101 52.8 40.1 41.8 13.4 37.2 93.5 98 113
Date of highest daily rainfall
27-Jan-98 05-Feb-80 03-Mar-00 26-Apr-06 07-May-90 16-Jun-73 26-Jul-86 18-Aug-07 29-Sep-86 24-Oct-69 29-Nov-83 22-Dec-03
Mean number of days of rain
17.9 18.4 15.4 4.6 1.2 0.3 0.3 0.2 0.9 4 9.9 13.9
Mean daily solar exposure (MJ/(m*m))
21.2 20.9 23 22.7 20.8 19.5 20.5 22.4 24.1 24.7 24.4 22.6
Mean daily evaporation (mm)
5.4 5.3 5.2 5.9 6.1 6 6.3 7.2 7.7 7.5 6.6 6

ANNUAL RESEARCH REPORT 2008-09
PUBLICATIONS, CONFERENCE PAPERS AND PRESENTATIONS
Scientific Journal/Proceeding Publications
Ashley, M. R. C., Bubb, A. J., James, A. R., James, C. D. and James, C. H. (2008). 21st century pastoralism – remote management innovations for sustainability in arid rangeland pastoral production. In: ‘VIII International Rangeland Congress, Multifunctional Grasslands in a Changing World’. Volume 1, pp. 651.
Ashley, M. R. C., Bubb, A, J., James, A. R. and James, C. H. (2008), WaterSmart pastoral production – a demonstration and evaluation of innovative stock water delivery and management technologies in desert Australia. In: ‘Proceedings of the Australian Rangeland Society’. 15th Biennial Conference, Charters Towers Queensland 28 September to 2 October.
Brier, H. B., Murray, D. A. H., Wilson, L. J., Nicholas, A. H., Miles, M. M., Grundy, P. R. and McLennan, A. J. (2008). An overview of integrated pest management (IPM) in north-eastern Australian grain farming systems: past, present and future prospects. Australian Journal of Experimental Agriculture, 48 (12): 1574-1593.
Cowled, C. J., Palacios, G., Melville, L. F., Weir, R. P., Walsh, S. J., Davis, S., Gubala, A. J., Lipkin, W. I., Briese, T. and Boyle, D. B. (2009). Genetic and epidemiological characterisation of Stretch Lagoon orbivirus - a new orbivirus species isolated from culex and aedes mosquitoes in northern Australia. Journal of General Virology, 90: 1433–1439.
Crossland, M., Brown, G. P., Shilton, C. and Shine R. (2008). Mass mortality of native anuran tadpoles in tropical Australia due to the invasive cane toad (Bufo marinus). Biological Conservation, 141 (9): 2387-2394.
Dougall, A., Shilton, C., Low Choy, J., Alexander, B. and Walton, S. (2009). New reports of Australian cutaneous leishmaniasis in Northern Australian macropods. Epidemiology and Infection, 173: 1516-1520.
Graham, K. J., Hulst, F. A., Vogelnest, L., Fraser, I. S. and Shilton, C. M. (2009). Uterine adenomyosis in an orang-utan (Pongo abelii/pygmaeus). Australian Veterinary Journal, 87: 66-69.
James, C. D., Ashley, M. R. C., Bastin, G. and Bubb, A. J. (2008). Information technologies for rangeland monitoring: what is available and what will be available in the future? In:’ VIII International Rangeland Congress, Multifunctional Grasslands in a Changing World. 1: pp. 638 – 642.
Parkes, H. M., Shilton, C. M., Jerrett, I. V., Benedict, S., Spratt, B. G., Godoy, D., O’Brien, C., Krockenberger, M. B., Mayo, M., Currie, B. J. and Malik, R. (2009). Primary ocular melioidosis due to a single genotype of Burkholderia pseudomallei in two cats from Arnhem Land in the Northern Territory of Australia. Journal of Feline Medicine and Surgery, 11(10): 856-863.
Qureshi, S., Midmore, D., Syeda, S. and Reid, D. (2009). Pyriproxyfen controls silverleaf whitefly, Bemisia tabaci (Gennadius), biotype B (Homoptera: Aleyrodidae) (SLW) better than buprofezin in bitter melons Momordica charantia L. (Cucurbitaceae). Australian Journal of Entomology, 48: 60 – 64.
Qureshi, S., Midmore, D., Syeda, S. and Reid, D. (2009). A comparison of alternative plant mixes for conservation bio-control by native beneficial arthropods in vegetable cropping systems in Queensland Australia. Bulletin of Entomological Research. Cambridge University Press. In press.
Schatz T. J., Melville L. F. and Davis S. S. (2008). Pestivirus (BVDV) prevalence on Northern Territory cattle properties. Proceedings of the Australian Society of Animal Production, 27: 38.

2008-09
Other Publications/Presentations
Brown, H. (2009). Cup Moths (Doratifera spp.). DRDPIFR Fact Sheet ENT 6.
Chin, D. (2008). Mango pests, beneficials and biological control. Delivering mango technology IPM workshop, Berrimah Farm, Darwin, 4 July.
Chin, D. (2008). Monitoring and Control of Ginger Ants in Nurseries. DRDPIFR, Information Sheet No. 16.
Chin, D. (2008). Ants in the Household and Garden. DRDPIFR Fact Sheet ENT 2.
Chin, D. (2008). The effect of flower thrips and dimpling bugs on fruit quality. Delivering mango technology IPM workshop, Berrimah Farm, Darwin, 4 July.
Chin, D. (2008). Insect monitoring. Delivering mango technology IPM workshop, Berrimah Farm, Darwin, 4 July.
Chin, D. (2009). Fruit fly data compiled from the Northern Territory. Progress Report 1. Presented at Plant Health Australia’s national fruit fly strategy workshop, Canberra, 15 January.
Chin, D. (2009). Fruit fly data compiled from the Northern Territory. Progress Report 2. Presented at Plant Health Australia’s national fruit fly strategy meeting, Canberra, 18 March.
Chin, D. (2009). Fruit fly data compiled from the Northern Territory. Progress Report 3. Presented at the Department of Agriculture, Fisheries and Forestry data compilation meeting, Canberra, 20 May.
Chin, D. and Brown, H. (2008). Longicorn Borer in Fruit Trees. DRDPIFR Agnote No. (I) 29.
Chin, D. and Brown, H. (2008). Red-banded Thrips on Fruit Trees. DRDPIFR Agnote No. (I) 34.
Chin, D., Brown, H., Zhang, L., Neal, M., Thistleton, B. and Smith, E. S. C. (2008). Biology and Pest Management of the Spiralling Whitefly. DRDPIFR Fact Sheet ENT1.
Chin, D. and Brown, H. (2008). Entomology lectures for Certificate 3 in Horticulture, Charles Darwin University, 13 October.
Chin, D., Thistleton, B. and Brown, H. (2009). Swarming Bugs (Family Lygaeidae). DRDPIFR Fact Sheet ENT7.
Chin, D., Brown, H. and Thistleton, B. (2008). The effect of dimpling bugs and flower thrips on fruit quality in mango orchards in the Northern Territory. DRDPIFR Poster presented at the Fourth International Symposium on Tropical and Subtropical Fruits, Bogor, West Java, Indonesia, 3-7 November.
Coventry, J. (2008). Alternative calf weaning technique–Nose rings. Alice Springs Rural Review, 41 (12 – 13) August-September.
Coventry, J. (2008). Yard weaning with true protein supplement, Alice Springs Rural Review, 41 (12 – 13) August-September.
Coventry, J. (2008). Recollections of Gidyea coals. Alice Springs Rural Review, 41 (12 – 13) August-September.

ANNUAL RESEARCH REPORT 2008-09
Coventry J. (2008). The secret life of cattle & smart surveillance. Alice Springs Rural Review, 42 (14 - 15). November-December.
Coventry, J.(2008). Shocking exposure. Alice Springs Rural Review, 41 (14 - 15) November-December.
Coventry, J. (2009). Difference in calf growth. Alice Springs Rural Review, 42 (16) September.
Coventry, J. and Gill, B. (2009) Calf-production related to aspects of herd bulls. Poster In: ‘Proceedings of The Australian Cattle, Sheep and Reproduction Veterinarians Conference’ (Gold Coast and Darwin), pp.400-2.
Daly, A., Zainuri, Suheri, H. and Liberato, J. (2009). Evaluation of fungicides to control post-harvest diseases on mangoes in Indonesia and the NT. In: ‘Seventh Australian Mango Conference’, Cairns, 25-27 May.
DRDPIFR (2009). Cattle and Land Management Best Practices for the Katherine Region. Available on the departmental website.
Grigg, G., Beard, L., Dörges B., Heucke, J., Coventry, J., Coppock, A. and Blomberg, S. (2009). Strategic (adaptive) hypothermia in bull dromedary camels during rut; could it increase reproductive success? Biology Letters, published online before print July 15.
Hannah, E. (2008). GLM goes global. Alice Springs Rural Review, 41 (12 – 13) August-September.
Hunt, N., Campbell, D. and Hearnden, M. (2008). Handling large light trap collections. In: ’Tenth Symposium on Arbovirus Research in Australia’, Coffs Harbour, September.
Isberg, S., Shilton, C. and Thomson, P. (2008). Runtism and Survival in Captive Saltwater Crocodiles. RIRDC Report.
James, C. and Bubb, A. J. (2008). WaterSmart Pastoralism™ Handbook, Desert Knowledge CRC, Alice Springs.
Jerrett, I., Elliott, N. and Tran-Nguyen, L. (2008). Investigating the Epidemiology of Chlamydia in Farmed Crocodiles. RIRDC Report.
Josif, P., Ashley, M. R. C., and Bubb, A. J (2009). Review of Indigenous Employment and Engagement in the Northern Pastoral Industry. Meat & Livestock Australia.
Leigo, S. and Bubb, A. (2008). Breeder herd inefficiency – What is it costing you? Alice Springs Rural Review, 42 (14 - 15) November-December.
Leigo, S. and Walsh, D. (2009). Managing climate variability R & D. Alice Springs Rural Review, 42 (16) September 2009.
Lemke, B. (2008). Australian Water Buffalo; Genetic and Reproduction Improvements. RIRDC Publication No.08/189.
Lemke, B. (2008). Article in ABIC Buffalo News, 8, no. 2, August.
Lemke, B. (2009). Articles in RIRDC Research Report, 8, no. 3 and 8, no. 4.
Liberato, J. and Thistleton, B. M. (2009). Citrus Huanglongbing Disease and Psyllid. DRDPIFR Fact Sheet.

2008-09
Materne, C. (2009). More grass than cattle. Alice Springs Rural Review, 42 (16) September.
McLennan A. J., (2008). Mite management research in melons. Katherine Rural Review, 290, July-August.
Melville, L. (2009).Viruses, vets and vectors. Australian Veterinary Association Conference, Darwin, May.
Melville, L., Davis, S., Hunt, N., Weir, R., Harmsen, M. and Walsh, S. (2008). Isolation of bluetongue serotype 7 from sentinel cattle in the Northern Territory. In: ‘Tenth Symposium on Arbovirus Research in Australia’, Coffs Harbour, September.
Melville, L., Hunt, N., Bellis, G. and Harmsen, M. (2008). Improving bluetongue virus surveillance in remote areas. In: ‘Tenth Symposium on Arbovirus Research in Australia’, Coffs Harbour, September.
Melville, L., Currie, B. and Radunz, B. (2009). Territory One Medicine, One Health network and melioidosis in livestock and humans. Australian Veterinary Association Conference, Darwin, May.
Melville, L. and Hooper, P. (2009). A brief history of the Northern Territory veterinary laboratories. Australian Veterinary Association Conference, Darwin, May.
Moore, C. (2009). Implications for supply chains. In: ‘Seventh Australian Mango Conference’, Cairns, 25-27 May.
Moore, C., Conde, B. and Qureshi, S. (2009). Anthracnose Management in Mangoes. DRDPIFR Information Sheet 64.
Pritchard, L. I., Melville, L. F. and Lunt, R. A. (2008). A review of molecular epidemiology of Australasian bluetongue viruses. In: ‘Tenth Symposium on Arbovirus Research in Australia’, Coffs Harbour, September.
Ray, J. D., McTaggart, A. R., Shivas, R. G. and Liberato, J. R. (2009). Cryptosporiopsis leaf spot (Cryptosporiopsis citri). Pest and diseases image library. Available online: http://www.padil.gov.au
Schatz, T. (2008). Newry heifer R&D field day report.
Scott, K. A. (2009). Northern grazing systems project report. Workshop 1 for the Mitchell grasslands of the Barkly Tableland.
Scott, K. A. (2009). Good rainfall ushers in a happy new year on the Barkly. Barkly Beef, April.
Scott, K. A. (2009). Northern grazing systems project: First workshop a great success! Barkly Beef, June.
Scott, K. A. (2009). A good wet season on the Barkly prompts an extension to pasture growth monitoring. Barkly Beef, June.
Scott, K. A. (2009). Sinkholes on the Barkly – what’s going on? Barkly Beef, June.
Scott, K. A. (2009). Workshop a success for grazing project. Tennant and District Times.
Shilton, C. (2009). Reptile and amphibian pathology with focus on zoonotic and emerging diseases. Australian Veterinary Association Conference, Darwin, May.
Smith, E. S. C. (updated by Chin, D.) (2008). Fruit Flies in the Home Garden. DRDPIFR Agnote (A) 20.
ANNUAL RESEARCH REPORT 2008-09
Smith, S. H. (2008). The Environmental Impacts of Plant Industries on Inland Water in the Northern Territory. DRDPIFR Technical Bulletin No. 330.
Thistleton, B. M. (2008). Insect biology and life cycles. Delivering mango technology IPM workshop, Berrimah Farm, Darwin, 4 July.
Thistleton, B. M. (2008). Principles of integrated pest management. Delivering mango technology IPM workshop, Berrimah Farm, Darwin, 4 July.
Thistleton, B. M. (2008). Pesticides. Delivering mango technology IPM workshop, Berrimah Farm, Darwin, 4 July.
Thistleton, B. M. (2008). Biology and control of Mastotermes darwiniensis in horticultural crops in the NT. First keynote address at the Northern Exposure Conference of Pest Managers, Townsville, 10 October.
Thistleton, B. M. (2008). Mastotermes darwiniensis in Papua New Guinea. Second keynote address at the Northern Exposure Conference of Pest Managers, Townsville, 10 October.
Thistleton, B. M. (2009). Developing pest lists for mangoes in ASEAN countries to facilitate international trade. In: International Symposium on Tropical and Subtropical Fruits, Bogor, West Java, Indonesia, 3-7 November.
Thistleton, B. M. and Neal, M. (2008). Control of Mastotermes darwiniensis and other termites in horticultural crops in the NT. Australian Environmental Pest Managers Association, national conference, 11 July.
Thistleton, B. M. and Neal, M. (2008). Mastotermes darwiniensis in Papua New Guinea. Australian Environmental Pest Managers Association, national conference, 11 July.
Thistleton, B. M. and Neal, M. (2008). Biology of dry wood termites (Cryptotermes spp.) Australian Environmental Pest Managers Association, national conference, 11 July.
Thistleton, B., Stephens, P., Liberato, J., Conde, B., Rahayu, I. M., Suheri, H., Mursal, Hidayah, N., Yunus, M., Wahyuni, Y., Nurachman, Z., Soraya, I., Fitrotin, U., Cakra, I. I. P., Suhardi and Utama, M. H. (2009). Quality management to enhance effective supply chains for mangoes and rambutan in Nusa Tenggara Barat, Indonesia and Australia. Assessment Institute for Agricultural Technology, Nusa Tenggara Barat; University of Mataram; Dinas Pertanian Provinsi, Nusa Tenggara Barat, poster. In: Fourth International Symposium on Tropical and Subtropical Fruits, Bogor, West Java, Indonesia, 3-7 November.
Thistleton, B. M., Daly, A., Baker, I., MacLennan, A., Zainuri, Suheri, H., Rahayu, M., and Mursal. (2009). Factors affecting mango fruit quality in Lombok, Indonesia. In: Seventh Australian Mango Conference, Cairns, 25-27 May.
Tran-Nguyen, L. (2008). Looking at termite DNA. Australian Environmental Pest Managers Association national conference, 11 July.
Walsh, D. (2009). Northern Grazing Systems Project: Victoria River District and East Kimberley Region. Workshop Report One Katherine Research Station, April.
Walsh, D. (2009). What are the optimal utilisation rates for NT pasture types? Barkly Beef 9, June.
Zhang, L. (2008). Stored Product Pest – Cigarette Beetle. DRDPIFR Fact Sheet ENT3, September.

2008-09
Zhang, L. (2008). Biology and Pest Management of Spider Mites. DRDPIFR Fact Sheet ENT4, September.
Zhang, L. (2008). Mites of Horticultural Crops. DRDPIFR Fact Sheet ENT 5, September.

ANNUAL RESEARCH REPORT 2008-09
INDEXES
The indexes are divided into two parts for easy access of information.
You can find projects by:
• Project Location – NT, Darwin, Katherine, Barkly or Alice Springs. Any project covering two or more regions can be found under NT.
• Keyword(s) – various keywords for a project.
PROJECT LOCATION INDEX
NT -10
PROJECT: Quality Management to Enhance Effective Supply Chains for Mangoes and Rambutan in Nusa Tenggara Barat, Indonesia and Australia..................................................................16
PROJECT: Mango Flower Insects and their Effect on Fruit Quality..........................................................18 PROJECT: The Northern Territory Economic Insect Reference Collection and the Australian Plant
Pest Database ........................................................................................................................21 PROJECT: Strategy and Progress of a Tree Improvement Program for African Mahogany (Khaya
senegalensis) in the Northern Territory ..................................................................................27 PROJECT: Developing Sustainable Carrying Capacities in the NT..........................................................41 PROJECT: Enhancing the Adoption of Improved Grazing and Fire Management Practices in
Northern Australia: Synthesis of Research and Identification of Best Bet Management Guidelines (also known as the Northern Grazing Systems Project).......................................43
PROJECT: Safe Utilisation Rates for NT Land Types ..............................................................................45 PROJECT: Northern Australian Beef Fertility Project – Cash Cow...........................................................52 PROJECT: Industry Initiatives to Improve Heifer Performance in the NT.................................................56 PROJECT: Live-weight Gain in Cattle in the NT ......................................................................................78
Darwin -9
PROJECT: Delivering Mango Technology – Two Research Trials in Darwin...........................................15 PROJECT: Best Practice IPM Strategies for the Control of Major Soil-borne Diseases of
Vegetable Crops in Australia –Fusarium Wilt in Snake Beans in the NT...............................24 PROJECT: Environmental Impacts of Agriculture – a Literature Review..................................................30 PROJECT: Pasture Species Evaluation under Grazing at DDRF.............................................................82 PROJECT: Genetic and Reproductive Improvements in Australian Water Buffalo ................................104 PROJECT: Enhancing Productivity Improvements in the Water Buffalo Industry...................................105 PROJECT: Riverine Buffalo and Crossbreeding.....................................................................................107 PROJECT: TenderBuff Development and Supply...................................................................................110 PROJECT: Viral and Endogenous Retroviral Detection and Characterisation in Crocodiles .................111

2008-09
Katherine -13
PROJECT: Potential Perennial Bio-fuel Crops for the NT...........................................................................7 PROJECT: Evaluation of Maize Cultivars in the 2008 Dry Season.............................................................9 PROJECT: Demonstrate and Evaluate Mulch Management Techniques in a Legume–Cereal(s)
Rotation.................................................................................................................................. 11 PROJECT: Understanding and Improving Heifer Fertility in the NT......................................................... 58 PROJECT: Senepol Crossbreeding Project ............................................................................................. 60 PROJECT: Shruburn – Rangeland Burning Trial ..................................................................................... 64 PROJECT: Breeding to Suit Future Market Opportunities: Tuli X Brahman, F1 Belmont Red X
Brahman and Brahman Cattle ............................................................................................... 66 PROJECT: Productivity Consequences of Incorporating Tropically-adapted Bos Taurus Breeds
into a Breeding Herd in the Victoria River District.................................................................. 69 PROJECT: Selected Brahmans - Improvement of the Fertility of the Brahman through the Use of
BREEDPLAN EBVs and Selection........................................................................................ 71 PROJECT: Improving Herd Profitability .................................................................................................... 75 PROJECT: Short Duration Grazing Demonstration.................................................................................. 92 PROJECT: Pasture Species Evaluation under Grazing at DDRF: Buffel/Legumes............................... 101 PROJECT: Weather Recording for Douglas River ................................................................................. 113
Barkly -4
PROJECT: Seasonal Burning of Mitchell Grassland on the Barkly Tableland ........................................ 35 PROJECT: Developing Sustainable Carrying Capacities in the NT – Tennant Creek............................. 47 PROJECT: Newcastle Waters Cell Grazing Trial..................................................................................... 49 PROJECT: Using Alternate Water Points as a Means of Increasing Pasture Utilisation......................... 50
Alice Springs -3
PROJECT: A Preliminary Investigation into Commercial-scale Production of Solanum centrale (Bush Tomatoes) - the Role of Irrigation and Weed Competition on Yield 12
PROJECT: 21st Century Pastoralism 32 PROJECT: Rangeland Grazing Strategies for Improved Economic and Resource Sustainability 33

ANNUAL RESEARCH REPORT 2008-09
KEYWORD INDEX
Aboriginal, 32 agriculture, 30 Alice Springs, 41, 45 Arid Zone Research Institute, 12 artificial insemination, 104, 105 Australian plant pest database, 21 Barkly, 41, 43, 45, 52, 78 Beatrice Hill Farm, 104 beef cattle, 78 Belmont Red, 66, 69 bio-fuel, 7 Blain soils, 9 Brahman, 60, 66, 69, 71 breeder herd performance, 52 breeder herd productivity, 75 breeding, 104, 105, 107 breeding herd efficiency, 69 BREEDPLAN, 71 buffalo, 104, 105, 107, 110 buffalo register, 104, 105 bull ratio, 75 bush tomatoes, 12 calf mortality, 52 carrying capacity, 41, 45, 47 cassava, 7 caterpillars, 18 cattle, 56, 58, 60, 92, 101 cattle grazing, 82 cell grazing, 49 clone, 27 collection, 21 commercial properties, 56 crocodiles, 111 crop rotation, 11 crossbreed, 66, 69 crossbreeding, 60 Darwin, 16, 18, 27, 52 days to calving, 71 desert pastoral, 32 dimpling bugs, 18 disease management, 24 diseases, 16, 24, 111 Douglas Daly Research Farm, 58, 60, 71, 92, 101,
113 EBVs fertility, 71 environment, 30
estimated breeding values, 71 evenness, 50 feed conversion, 66 feedlot, 66 fertility, 58 fire, 64 flower panicle, 18 forestry, 27 fruit flies, 18 fruit quality, 16, 18 fruit spotting bugs, 18 Fusarium oxysporum f.sp. tracheiphilum, 24 Fusarium wilt, 24 genetic analysis, 104, 105 genetic selection, 27 grafting, 24 GRASP, 47 grass/legume pastures, 101 grazing strategies, 33 grazing systems, 92, 101 green tree ants, 18 heifer, 58 heifer fertility, 56 improved pastures, 82 indigenous, 32 Indonesia, 16 infrastructure development, 43 insects, 16, 18, 21 irrigation, 12 Katherine, 9, 11, 16, 18, 27, 43, 45, 52, 78 Katherine Research Station, 7, 66, 71 leucaena, 82 live-weight, 66 live-weight gain, 78 mahogany, 27 maize, 9 management, 75 mango, 15, 16, 18 mature size, 66 meat quality, 60 millet, 11 Mitchell grassland, 35 mulch management, 11 Newcastle Waters, 49 nitrogen, 15 nutrition, 15

2008-09
P8 fat, 66 pasture, 64 pasture grasses, 82 pasture growth model, 47 pasture legumes, 82 pasture spelling, 43 pasture utilisation, 45, 49 plant hoppers, 18 pongamia, 7 prescribed fire, 43 rainfall, 113 rambutan, 16 rangeland management, 35 rangelands, 64 reproduction, 52 Rockhampton Downs, 50 rotation grazing, 33 rotational grazing, 49, 50 safflower, 7 scrotal circumference, 71 seasonal burning, 35 Senepol, 60 short duration grazing, 92 snake beans, 24
socio-economic analysis, 16 soil, 30 Solanum centrale, 12 spelling, 33, 50 stocking rates, 43, 49 strategic supplement, 75 Sturt Plateau, 41 sunflower, 7 supply chain analysis, 16 sustainable pastoral management, 43 sustainable pastoralism, 45 SWIFTSYND, 47 temperature, 113 TenderBuff, 110 thrips, 18 Tuli, 66, 69 Victoria River Research Station, 58, 60, 64, 69, 71 Vigna unguiculata sesquipedalis, 24 viruses, 111 water, 30 water points, 50 weather recording, 113 weed competition, 12 woody thickening, 64