north london waste authority north london heat...
TRANSCRIPT
NORTH LONDON WASTE AUTHORITY
NORTH LONDON HEAT AND POWER PROJECT
The Planning Act 2008 The Infrastructure Planning (Applications: Prescribed Forms and Procedure) Regulations 2009 Regulation 5 (2) (q)
October 2015Revision 0Arup
COMBINED HEAT AND POWER (CHP) DEVELOPMENT STRATEGY
AD05.06

This report takes into account the particular instructions and requirements of our client. It is not intended for and should not be relied upon by any third party and no responsibility is undertaken to any third party.

North London Waste Authority North London Heat and Power ProjectCombined Heat and Power (CHP) Development Strategy
AD05.06 | Issue | October 2015 | Arup
Contents
Page
Executive summary 1
1 Introduction 4
1.2 Purpose of this document 4
1.3 Document structure 4
1.4 The Applicant 5
1.5 The Application Site 5
1.6 Surrounding area 6
1.7 The Project 7
1.8 Stages of development 8
2 Background and current status 9
2.1 What is Combined Heat and Power? 9
2.2 Development of heat networks in the local area 9
2.3 Current status of heat connections to the Edmonton EcoPark 13
3 Policy and guidance 15
3.2 National policy and guidance 15
3.3 Regional and local policy and guidance 16
3.4 Summary of key policy requirements 19
4 Evaluation of CHP potential 20
4.2 Stakeholder consultation 20
4.3 Method of analysis 20
4.4 Heat supply assessment 21
4.5 Description of different operational modes 22
4.6 Heat demand assessment 23
4.7 Potential for additional heat demand 23
4.8 Summary of CHP potential 25
5 Approach to CHP development 26
5.2 Facility design 26
5.3 Existing heat infrastructure on the Application Site 26
5.4 Connection to heat networks 27
5.5 Connection to future heat loads 29
5.6 Summary of CHP Development Strategy 29
North London Waste Authority North London Heat and Power ProjectCombined Heat and Power (CHP) Development Strategy
AD05.06 | Issue | October 2015 | Arup
Tables Table 4.1: Heat output vs electrical output
Table A.1: Summary of consultation with public bodies
Table A.2: Heat customer consultation summary
Figures Figure 2.1: North London Strategic Alliance Upper Lea Valley Centralised Energy
Networks
Figure 2.2: Lee Valley Heat Network vision map
Figure 2.3: Lee Valley Heat Network District Heating Energy Centre and safeguarded heat export routes
Figure 4.1: ERF performance with increasing heat output
Figure 4.2: Heat supply vs heat demand
Figure 5.1: Safeguarded heat export routes from ERF via the north and south of the Edmonton EcoPark
Appendices
Appendix A – Stakeholder Consultation A.1
A1 Public Body Consultation A.1
A2 Private Body Consultation A.1
A3 Potential customer consultation response A.3
A3.1 LB Enfield A.3
A3.2 Greater London Authority A.4
A3.3 Thames Water Utilities Ltd A.5
Appendix B – ERF Heat Off-take space allowance illustration B.1
Appendix C – WRATE and Carbon Intensity Floor Modelling: Technical Report C.1
Appendix D – District Heating Route Feasibility Study D.1
Glossary See Project Glossary (AD01.05)
North London Waste Authority North London Heat and Power ProjectCombined Heat and Power (CHP) Development Strategy
Page 1 AD05.06 | Issue | October 2015 | Arup
Executive summary
i.i.i This report describes the Combined Heat and Power (CHP) development strategy for the proposed Energy Recovery Facility (ERF), which forms part of the North London Heat and Power Project. This document has been prepared to support the North London Waste Authority’s (the Applicant’s) application (the Application) for a Development Consent Order (DCO) made pursuant to the Planning Act 2008 (as amended). The purpose of this document is to demonstrate the CHP opportunity and how it is planned to be implemented. This report responds to Overarching National Policy Statement for Energy EN-1 1(NPS EN-1) which requires applications for thermal generating stations, such as the proposed ERF, to consider CHP as a minimum.
i.i.ii CHP operation is a term given to a thermal generating plant which can provide useful energy in the form of electrical power and heat for use in space heating and hot water applications in buildings, industrial processes, and other uses. The benefits of CHP are twofold: the first is that the overall ERF efficiency improves, such that more energy is recovered from the fuel processed; the second is that fossil fuels which would otherwise be used are displaced. In this way, CHP operation provides carbon emissions savings.
i.i.iii An important aspect to this strategy is to review existing published work that documents the opportunity for the development of large scale heat networks in the Upper Lee Valley area. In 2011, recognising the importance of the opportunity, the North London Strategic Alliance (NLSA) commissioned a pre-feasibility study for a decentralised energy network (NLSA Study 2 ); it demonstrated the opportunity for a large scale commercially sustainable heat network centred around a low carbon heat supply from the Edmonton EcoPark. Then in 2012, London Borough of Enfield (LB Enfield) led the formation of LVHN Ltd with the purpose of developing and operating the Lee Valley Heat Network (LVHN), which would serve as the catalyst to the wider strategic heat network. As part of the pre-feasibility study and work carried out to realise the LVHN, extensive stakeholder engagement was carried out with public authorities, housing associations, private developers and large heat customers.
i.i.iv In order to frame the CHP potential of the ERF and Edmonton EcoPark, LVHN Ltd undertook an assessment of the heat supply available from the existing Energy from Waste (EfW) facility and of the heat demand available in the area.
i.i.v The Applicant’s technical adviser, Ramboll, provided provisional technical design parameters. This showed that the ERF could be designed to support up to 160MWth heat supply. However, heat supply impacts power generation and with 160MWth of heat supply, gross electrical output diminishes to 15MWe. This is from a power only gross electricity generation
1 Department of Energy and Climate Change, Overarching National Policy Statement for Energy (EN-1), July 2011. 2 North London Strategic Alliance, Parsons Brinckerhoff, Upper Lee Valley Decentralised Energy Network Pre-feasibility Study, 2011.
North London Waste Authority North London Heat and Power ProjectCombined Heat and Power (CHP) Development Strategy
Page 2 AD05.06 | Issue | October 2015 | Arup
capacity of over 70MWe. The ERF steam turbine would be designed to suit the expected heat supply requirements. The likely heat demand is expected to be 35MWth peak output. Gross electrical output would then be 63MWe. Additional heat export may be provided subject to commercial viability and a heat demand materialising.
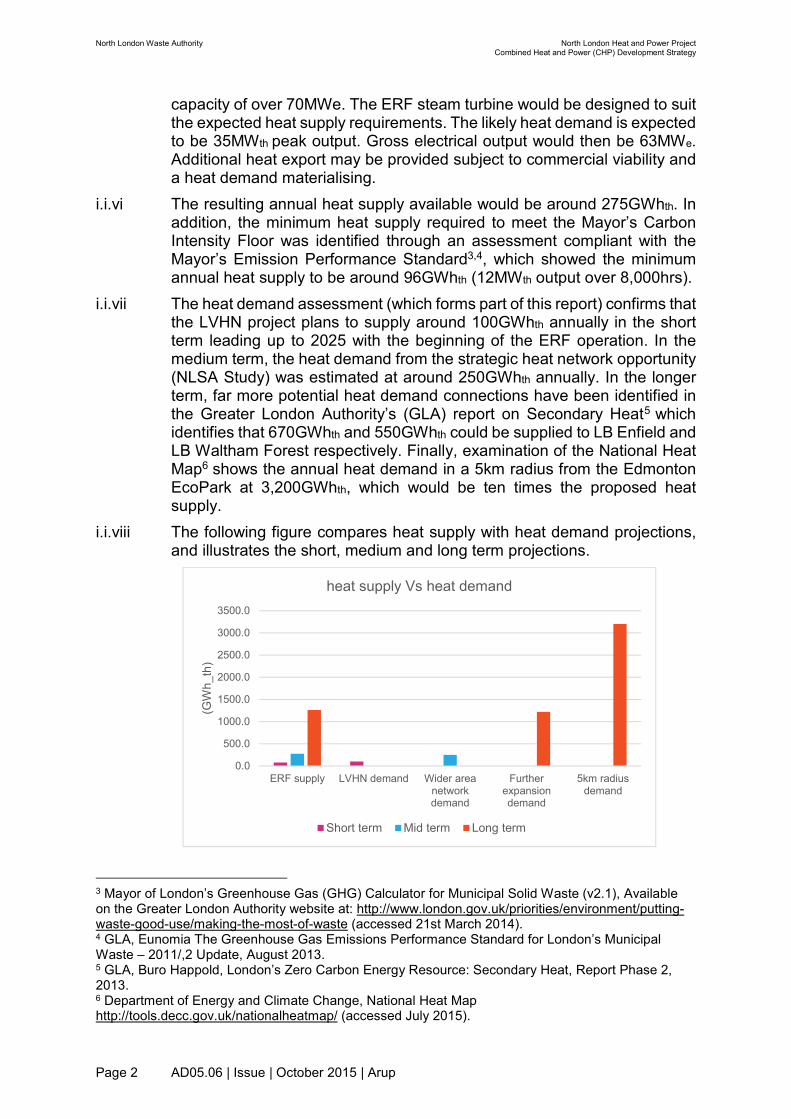
i.i.vi The resulting annual heat supply available would be around 275GWhth. In addition, the minimum heat supply required to meet the Mayor’s Carbon Intensity Floor was identified through an assessment compliant with the Mayor’s Emission Performance Standard3,4, which showed the minimum annual heat supply to be around 96GWhth (12MWth output over 8,000hrs).
i.i.vii The heat demand assessment (which forms part of this report) confirms that the LVHN project plans to supply around 100GWhth annually in the short term leading up to 2025 with the beginning of the ERF operation. In the medium term, the heat demand from the strategic heat network opportunity (NLSA Study) was estimated at around 250GWhth annually. In the longer term, far more potential heat demand connections have been identified in the Greater London Authority’s (GLA) report on Secondary Heat5 which identifies that 670GWhth and 550GWhth could be supplied to LB Enfield and LB Waltham Forest respectively. Finally, examination of the National Heat Map6 shows the annual heat demand in a 5km radius from the Edmonton EcoPark at 3,200GWhth, which would be ten times the proposed heat supply.
i.i.viii The following figure compares heat supply with heat demand projections, and illustrates the short, medium and long term projections.
3 Mayor of London’s Greenhouse Gas (GHG) Calculator for Municipal Solid Waste (v2.1), Available on the Greater London Authority website at: http://www.london.gov.uk/priorities/environment/putting-waste-good-use/making-the-most-of-waste (accessed 21st March 2014). 4 GLA, Eunomia The Greenhouse Gas Emissions Performance Standard for London’s Municipal Waste – 2011/,2 Update, August 2013. 5 GLA, Buro Happold, London’s Zero Carbon Energy Resource: Secondary Heat, Report Phase 2, 2013. 6 Department of Energy and Climate Change, National Heat Map http://tools.decc.gov.uk/nationalheatmap/ (accessed July 2015).
0.0
500.0
1000.0
1500.0
2000.0
2500.0
3000.0
3500.0
ERF supply LVHN demand Wider areanetworkdemand
Furtherexpansiondemand
5km radiusdemand
(GW
h_th
)
heat supply Vs heat demand
Short term Mid term Long term

North London Waste Authority North London Heat and Power ProjectCombined Heat and Power (CHP) Development Strategy
Page 3 AD05.06 | Issue | October 2015 | Arup
i.i.ix This report also describes how the approach to developing the CHP opportunity has been assessed. It reviews the ERF design, existing heat infrastructure on-site, and potential connections to heat networks in the short- and long-term.
i.i.x The proposed ERF would supply a heat range of between 10-160MWth (peak) corresponding to 80 to 1,260GWhth annually. Space allowances are included in the design for the required heat off-take equipment and to route the heat pipework out of the building.
i.i.xi A routing feasibility study was commissioned by the Applicant to assess and safeguard a route for district heating pipework between the ERF and the north and south boundaries of the Edmonton EcoPark. The southward safeguarded route would supply heat to the LVHN Ltd’s proposed District Heating Energy Centre (DHEC) in the south of the Edmonton EcoPark, and the northward route could supply heat out of the north of the Edmonton EcoPark, should the southern route fail for any reason, or if the heat export capacity were to be expanded through a heat network created to the north of the Edmonton EcoPark.
i.i.xii The principles required to realise the CHP potential at the Edmonton EcoPark have been established between LVHN Ltd. and the Applicant and are subject to detailed design and agreement on commercial terms. The plans would facilitate the supply of heat from the existing EfW facility to the LVHN DHEC until the proposed ERF is commissioned and takes over the heat supply around 2025. The heat offtake from the existing EfW facility has been deemed as feasible by a Decentralised Energy Project Delivery Unit report for the GLA and the Applicant.
i.i.xiii In conclusion, the opportunity for CHP development from the Edmonton EcoPark, using the proposed ERF as the source of low carbon heat, is backed by the following:
a. the heat demand in the area is greater than the potential heat supply from existing and planned future centralised heat sources;
b. a large portion of the heat demand has been shown to be feasible for connection via heat networks in the short and long-term, initially materialising through LVHN’s plans; and
c. the proposed ERF has been designed to allow for heat off-take and routes to the edge of the Edmonton EcoPark for future heat network connections have been safeguarded.

North London Waste Authority North London Heat and Power ProjectCombined Heat and Power (CHP) Development Strategy
Page 4 AD05.06 | Issue | October 2015 | Arup
1 Introduction
1.1.1 This Combined Heat and Power (CHP) Development Strategy has been prepared to support North London Waste Authority’s (the Applicant’s) application (the Application) to the Secretary of State for Energy and Climate Change for a Development Consent Order (DCO) made pursuant to the Planning Act 2008 (as amended).
1.1.2 The Application is for the North London Heat and Power Project (the Project) comprising the construction, operation and maintenance of an Energy Recovery Facility (ERF) capable of an electrical output of around 70 megawatts (MWe) at the Edmonton EcoPark in north London with associated development, including a Resource Recovery Facility (RRF). The proposed ERF would replace the existing Energy from Waste (EfW) facility at the Edmonton EcoPark.
1.1.3 The Project is a Nationally Significant Infrastructure Project for the purposes of Section 14(1)(a) and section 15 in Part 3 of the Planning Act 2008 (as amended) because it involves the construction of a generating station that would have a capacity of more than 50MWe.
1.2 Purpose of this document
1.2.1 The purpose of this document is to demonstrate the CHP opportunity associated with the Project and how it is planned to be implemented. This report responds to Overarching National Policy Statement for Energy (NPS EN-1)7 which requires applications for thermal generating stations, such as the proposed ERF, to consider CHP as a minimum. It has been prepared to support the Applicant’s application for a DCO made pursuant to the Planning Act 2008 (as amended).
1.2.2 This Strategy forms part of a suite of documents accompanying the Application submitted in accordance with the requirements set out in section 55 of the Planning Act and Regulations 5, 6 and 7 of the Infrastructure Planning (Applications: Prescribed Forms and Procedures) Regulations 2009 (APFP Regulations 2009), and should be read alongside those documents (see Project Navigation Document AD01.02).
1.3 Document structure
1.3.1 The structure of this report presents the assessment of the CHP development strategy, as follows:
a. Section 2 covers the background to the Application including a summary of previous work to document the opportunity and to develop local heat networks in the area;
b. Section 3 sets out policy and guidance relevant to the assessment as well as key requirements;
c. Section 4 evaluates the CHP potential of the Application Site; and
7 Department of Energy and Climate Change, Overarching National Policy Statement for Energy (EN-1), July 2011.

North London Waste Authority North London Heat and Power ProjectCombined Heat and Power (CHP) Development Strategy
Page 5 AD05.06 | Issue | October 2015 | Arup
d. Section 5 sets out the approach to CHP development from a technical perspective. This section, along with Section 6, compiles the range of work done to prove the heat supply potential, the heat demand of the surrounding area, and the practical measures which are planned to enable technical extraction of heat and connection to heat networks.
1.4 The Applicant
1.4.1 Established in 1986, the Applicant is a statutory authority whose principal responsibility is the disposal of waste collected by the seven north London boroughs of Barnet, Camden, Enfield, Hackney, Haringey, Islington and Waltham Forest (the Constituent Boroughs).
1.4.2 The Applicant is the UK’s second largest waste disposal authority, handling approximately 3 per cent of the total national Local Authority Collected Waste (LACW) stream. Since 1994 the Applicant has managed its waste arisings predominantly through its waste management contract with LondonWaste Limited (LWL) and the use of the EfW facility at the existing Edmonton EcoPark and landfill outside of London.
1.5 The Application Site
1.5.1 The Application Site, as shown on the Site Location Plans (A_0001 and A_0002 in the Book of Plans (AD02.01)), extends to approximately 22 hectares and is located wholly within the London Borough of Enfield (LB Enfield). The Application Site comprises the existing waste management site known as the Edmonton EcoPark where the permanent facilities would be located, part of Ardra Road, land around the existing water pumping station at Ardra Road, Deephams Farm Road, part of Lee Park Way and land to the west of the River Lee Navigation, and land to the north of Advent Way and east of the River Lee Navigation (part of which would form the Temporary Laydown Area and new Lee Park Way access road). The post code for the Edmonton EcoPark is N18 3AG and the grid reference is TQ 35750 92860.
1.5.2 The Application Site includes all land required to deliver the Project. This includes land that would be required temporarily to facilitate the development.
1.5.3 Both the Application Site and the Edmonton EcoPark (existing and proposed) are shown on Plan A_0003 and A_0004 contained within the Book of Plans (AD02.01). Throughout this report references to the Application Site refer to the proposed extent of the Project works, and Edmonton EcoPark refers to the operational site. Upon completion of the Project the operational site would consist of the Edmonton EcoPark and additional land required to provide new access arrangements and for a water pumping station adjacent to the Deephams Sewage Treatment Works outflow channel.
Edmonton EcoPark
1.5.4 The Edmonton EcoPark is an existing waste management complex of around 16 hectares, with an EfW facility which treats circa 540,000 tonnes

North London Waste Authority North London Heat and Power ProjectCombined Heat and Power (CHP) Development Strategy
Page 6 AD05.06 | Issue | October 2015 | Arup
per annum (tpa) of residual waste and generates around 40MWe (gross) of electricity; an In-Vessel Composting (IVC) facility; a Bulky Waste Recycling Facility (BWRF) and Fuel Preparation Plant (FPP); an Incinerator Bottom Ash (IBA) Recycling Facility; a fleet management and maintenance facility; associated offices, car parking and plant required to operate the facility; and a former wharf and single storey building utilised by the Edmonton Sea Cadets under a lease.
1.5.5 In order to construct the proposed ERF, the existing BWRF and FPP activities would be relocated within the Application Site; the IVC facility would be decommissioned and the IBA recycling would take place off-site.
Temporary Laydown Area and eastern access
1.5.6 The proposed Temporary Laydown Area is an area of open scrubland located to the east of the River Lee Navigation and north of Advent Way. There is no public access to this area. The Temporary Laydown Area would be reinstated after construction and would not form part of the ongoing operational site.
1.5.7 In addition to the Temporary Laydown Area the Application Site includes land to the east of the existing Edmonton EcoPark which would be used for the new Lee Park Way entrance and landscaping along the eastern boundary.
Northern access
1.5.8 The Application Site also includes Deephams Farm Road and part of Ardra Road with land currently occupied by the EfW facility water pumping station between the junction of A1005 Meridian Way and Deephams Farm Road.
1.6 Surrounding area
1.6.1 The Application Site is located to the north of the A406 North Circular Road in an area that is predominantly industrial. The Lee Valley Regional Park (LVRP) is located to the east of the Edmonton EcoPark.
1.6.2 Land to the north and west of the Application Site is predominantly industrial in nature. Immediately to the north of the Edmonton EcoPark is an existing Materials Recovery Facility (MRF), which is operated by a commercial waste management company, alongside other industrial buildings. Further north is Deephams Sewage Treatment Works. Beyond the industrial area to the north-west is a residential area with Badma Close being the nearest residential street to the Application Site (approximately 60m from the nearest part of the boundary) and Zambezie Drive the nearest to the Edmonton EcoPark at approximately 125m west.
1.6.3 Eley Industrial Estate, located to the west of the Application Site, comprises a mixture of retail, industrial and warehouse units.
1.6.4 Advent Way is located to the south of the Application Site adjacent to the A406 North Circular Road. Beyond the A406 North Circular Road are retail and trading estates; this area is identified for future redevelopment to provide a housing-led mixed use development known as Meridian Water.

North London Waste Authority North London Heat and Power ProjectCombined Heat and Power (CHP) Development Strategy
Page 7 AD05.06 | Issue | October 2015 | Arup
1.6.5 The LVRP and River Lee Navigation are immediately adjacent to the eastern boundary of the Edmonton EcoPark, and Lee Park Way, a private road which also forms part of National Cycle Network (NCN) Route 1, runs alongside the River Lee Navigation. To the east of the River Lee Navigation is the William Girling Reservoir along with an area currently occupied by Camden Plant Ltd. which is used for the crushing, screening and stockpiling of waste concrete, soil and other recyclable materials from construction and demolition. The nearest residential areas to the east of the Application Site and LVRP are located at Lower Hall Lane, approximately 550m from the Edmonton EcoPark and 150m from the eastern edge of the Application Site.
1.7 The Project
1.7.1 The Project would replace the existing EfW facility at Edmonton EcoPark, which is expected to cease operations in around 2025, with a new and more efficient ERF which would produce energy from residual waste, and associated development, including temporary works required to facilitate construction, demolition and commissioning. The proposed ERF would surpass the requirement under the Waste Framework Directive (Directive 2008/98/EC) to achieve an efficiency rating in excess of the prescribed level, and would therefore be classified as a waste recovery operation rather than disposal.
1.7.2 The main features of the Project once the proposed ERF and permanent associated works are constructed and the existing EfW facility is demolished are set out in the Book of Plans (AD02.01) and comprise:
a. a northern area of the Edmonton EcoPark accommodating the proposed ERF;
b. a southern area of the Edmonton EcoPark accommodating the RRF and a visitor, community and education centre with offices and a base for the Edmonton Sea Cadets (‘EcoPark House’);
c. a central space, where the existing EfW facility is currently located, which would be available for future waste-related development;
d. a new landscape area along the edge with the River Lee Navigation; and
e. new northern and eastern Edmonton EcoPark access points.
1.7.3 During construction there is a need to accommodate a Temporary Laydown Area outside of the future operational site because of space constraints. This would be used to provide parking and accommodation for temporary staff (offices, staff welfare facilities), storage and fabrication areas, and associated access and utilities.
1.7.4 Schedule 1 of the draft DCO (AD03.01) sets out the authorised development and the works are shown in the Book of Plans (AD02.01), supplemented by Illustrative Plans (included in the Design Code Principles, AD02.02) that set out the indicative form and location of buildings, structures, plant and equipment, in line with the limits of deviation established by the draft DCO (AD03.01).

North London Waste Authority North London Heat and Power ProjectCombined Heat and Power (CHP) Development Strategy
Page 8 AD05.06 | Issue | October 2015 | Arup
1.8 Stages of development
1.8.1 The proposed ERF is intended to be operational before the end of 2025, but with the precise timing of the replacement to be determined. In order to do this, the following key steps are required:
a. obtain a DCO for the new facility and associated developments;
b. obtain relevant environmental permit(s) and other licences, consents and permits needed;
c. identify a suitable technology supplier;
d. agree and arrange source(s) of funding;
e. enter into contract(s) for design, build and operation of new facility and associated development;
f. move to operation of new facility; and
g. decommission and demolish the existing EfW facility.
1.8.2 Site preparation and construction would be undertaken over a number of years and it is expected that the earliest construction would commence is 2019/20, although this may be later. Construction would be implemented in stages to ensure that essential waste management operations remain functioning throughout. This is especially relevant for the existing EfW facility and associated support facilities.
1.8.3 The stages of the Project are as follows:
a. Stage 1a: site preparation and enabling works;
b. Stage 1b: construction of RRF, EcoPark House and commencement of use of Temporary Laydown Area;
c. Stage 1c: operation of RRF, EcoPark House and demolition/clearance of northern area;
d. Stage 1d: construction of ERF;
e. Stage 2: commissioning of ERF alongside operation of EfW facility, i.e. transition period;
f. Stage 3: operation of ERF, RRF and EcoPark House, demolition of EfW facility; and
g. Stage 4: operation of ERF, RRF and EcoPark House, i.e. final operational situation.

North London Waste Authority North London Heat and Power ProjectCombined Heat and Power (CHP) Development Strategy
Page 9 AD05.06 | Issue | October 2015 | Arup
2 Background and current status
2.1 What is Combined Heat and Power?
2.1.1 CHP refers to a system which delivers useful energy in two forms; electric power and heat. It enables higher system efficiencies than conventional electrical generation through the capture and use of lower temperature heat that is less useful for power generation.
2.1.2 The proposed ERF could achieve, in power-only mode, an overall efficiency of around 29 per cent (gross); however, with the ERF in CHP mode, the overall efficiency could improve to around 40 per cent8 with a 35MWth heat supply.
2.1.3 For the ERF to run in CHP mode, the heat must be transmitted to heat users. Heat users could typically include industrial facilities requiring heat for processes, or developments requiring heat for hot water or space heating. Heat is transmitted in the form of hot water (or steam) pumped through a network of insulated pipes that form part of a heat network, otherwise known as district heating.
2.1.4 Operation of the ERF in CHP mode saves carbon through two mechanisms:
a. the first occurs at the ERF and is introduced through the increased energy recovery; and
b. the second comes from the displacement of other forms of fossil fuel consumption for heating. For example, a new heat network customer would be supplied by low carbon heat from the ERF, therefore gas or other higher carbon heating fuels would not be used to supply the heat demand.
2.2 Development of heat networks in the local area
2.2.1 The area around the Application Site currently does not have any district heating networks installed and operational, nor does the existing EfW facility operate in CHP mode. Nevertheless, considerable effort has been made by a number of local organisations to design and implement a large scale heat network to serve the Upper Lee Valley (ULV) including the immediate environs of the Edmonton EcoPark. This section reviews the history and current status of these efforts.
2.2.2 The ULV Opportunity Area Planning Framework9 describes the planning mechanism put in place and the key value drivers:
“Following the recommendation from the Draft Energy Strategy 2010, an Upper Lee Valley masterplanning steering group has been established to maximise the opportunities for developing a decentralised energy network within the opportunity area. This group comprises the North London Strategic Alliance, the London boroughs of Enfield, Haringey and Waltham
8 Total system efficiency is quoted here and is the result of the ratio of total energy out (heat and electricity) over total energy in (that contained in the waste entering the ERF). 40 per cent efficiency includes for a 35MWth heat offtake. System parameters as supplied by designer Ramboll. 9 Greater London Authority, Upper Lee Valley Opportunity Area Planning Framework, July 2013.

North London Waste Authority North London Heat and Power ProjectCombined Heat and Power (CHP) Development Strategy
Page 10 AD05.06 | Issue | October 2015 | Arup
Forest and the Greater London Authority, with a wider stakeholder group comprising the Lee Valley Regional Park and the North London Waste Authority. Together the stakeholders have identified the following drivers for a decentralised energy network:
• Ability to generate inward investment;
• Reduction in fuel poverty;
• Reduction in carbon emissions across the Upper Lee Valley; and
• Return on investment: social, economic and environmental”.
2.2.3 In 2011, the North London Strategic Alliance (NLSA) commissioned a Pre-feasibility Study for a Decentralised Energy Network (NLSA Study10). This study demonstrated that there is a feasible and viable opportunity to deliver a commercially sustainable heat network in the area.
2.2.4 The London Borough of Enfield’s (LB Enfield) Edmonton EcoPark Planning Brief Supplementary Planning Document 11 (Edmonton EcoPark SPD) states the main benefits perceived from the strategic heat network:
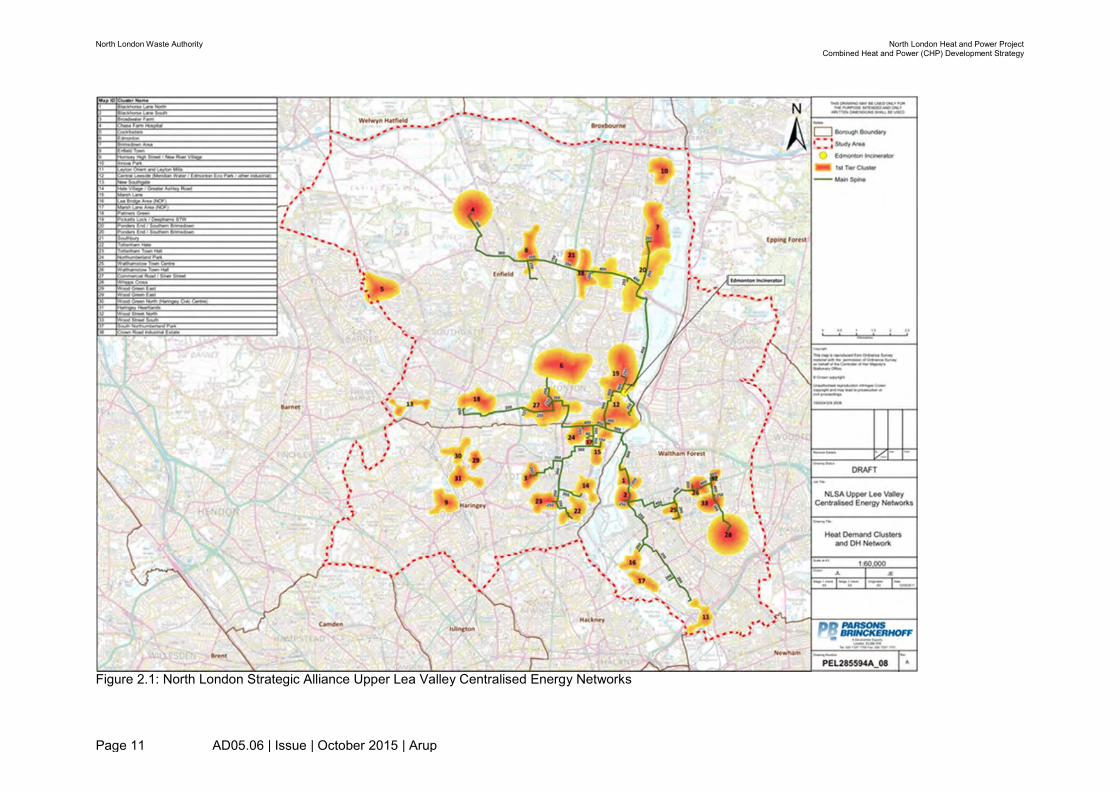
2.2.5 “Enfield Council in partnership with Haringey and Waltham Forest Councils, the North London Strategic Alliance (NLSA) and Greater London Authority (GLA) are working together to facilitate the delivery of the strategic heat network, which would provide low carbon, low cost energy to 10,000 homes and more than 150 businesses. The scheme would cut carbon dioxide emissions by 41,000 tonnes per annum, the equivalent of 9,750 homes’ annual carbon dioxide production but could have wider economic and social benefits, including job creation”.Figure 2.1 illustrates the potential district heating scheme identified by the NLSA Study. The Figure illustrates the key energy supply assets, the main heat customers and the main interconnecting pipelines. The figure also illustrates a connection to the Olympic Park network, to realise the larger benefits of interconnection, such as the ability to share low carbon heat from the Edmonton EcoPark.
2.2.6 The NLSA Study identified two potential sources of heat to serve the planned heat network:
a. the existing EfW facility at the Edmonton EcoPark. The study assumed that the existing EfW facility would supply heat until 2025, by which point the EfW facility would be decommissioned, with the expectation of a new EfW facility taking over the heat supply; and,
b. the React Energy (formerly Kedco) biomass gasification project at Gibbs Road (Edmonton), which is under construction.
10 North London Strategic Alliance, Parsons Brinckerhoff, Upper Lee Valley Decentralised Energy Network Pre-feasibility Study, 2011. 11 LB Enfield, Edmonton EcoPark Planning Brief, Supplementary Planning Document to the Local
Plan, 2013.
North London Waste Authority North London Heat and Power ProjectCombined Heat and Power (CHP) Development Strategy
Page 11 AD05.06 | Issue | October 2015 | Arup
Figure 2.1: North London Strategic Alliance Upper Lea Valley Centralised Energy Networks

North London Waste Authority North London Heat and Power ProjectCombined Heat and Power (CHP) Development Strategy
Page 12 AD05.06 | Issue | October 2015 | Arup
Figure 2.2: Lee Valley Heat Network vision map12
12 LB Enfield website http://www.enfield.gov.uk/lvhn/ (accessed April 2015).
North London Waste Authority North London Heat and Power ProjectCombined Heat and Power (CHP) Development Strategy
Page 13 AD05.06 | Issue | October 2015 | Arup
2.2.7 The Lee Valley Heat Network (LVHN) project is the initial phase of delivering the strategic scheme outlined in the NLSA Study. LVHN aims to deliver a network to supply heat from the Edmonton EcoPark to around 5,000 homes and 200,000m2 of commercial space initially.
2.2.8 In 2012, LB Enfield led the formation of a special purpose vehicle, called LVHN Ltd, with the express purpose of developing and operating a heat network. It is now consolidated and in final negotiations with heat suppliers prior to appointing various contracts that would secure the design, build, operation, maintenance, and customer services required to realise the LVHN. The Design, Build, Operate contract tender provides an estimated contract start date of 1 September 201513.
2.2.9 The strategic scheme is catalysed through the development of satellite heat networks around the London Borough of Waltham Forest (LB Waltham Forest), and the CHP schemes at Ladderswood, Alma Estate and New Avenue, which are planned to connect into the wider scheme as part of a future phase14,15.
2.2.10 Figure 2.2 illustrates the LVHN vision map.
2.2.11 The GLA’s London’s Zero Carbon Energy Resource16 report also identifies both the existing EfW facility and the proposed ERF as key low carbon heat sources which could supply an area wide heat network.
2.3 Current status of heat connections to the Edmonton EcoPark
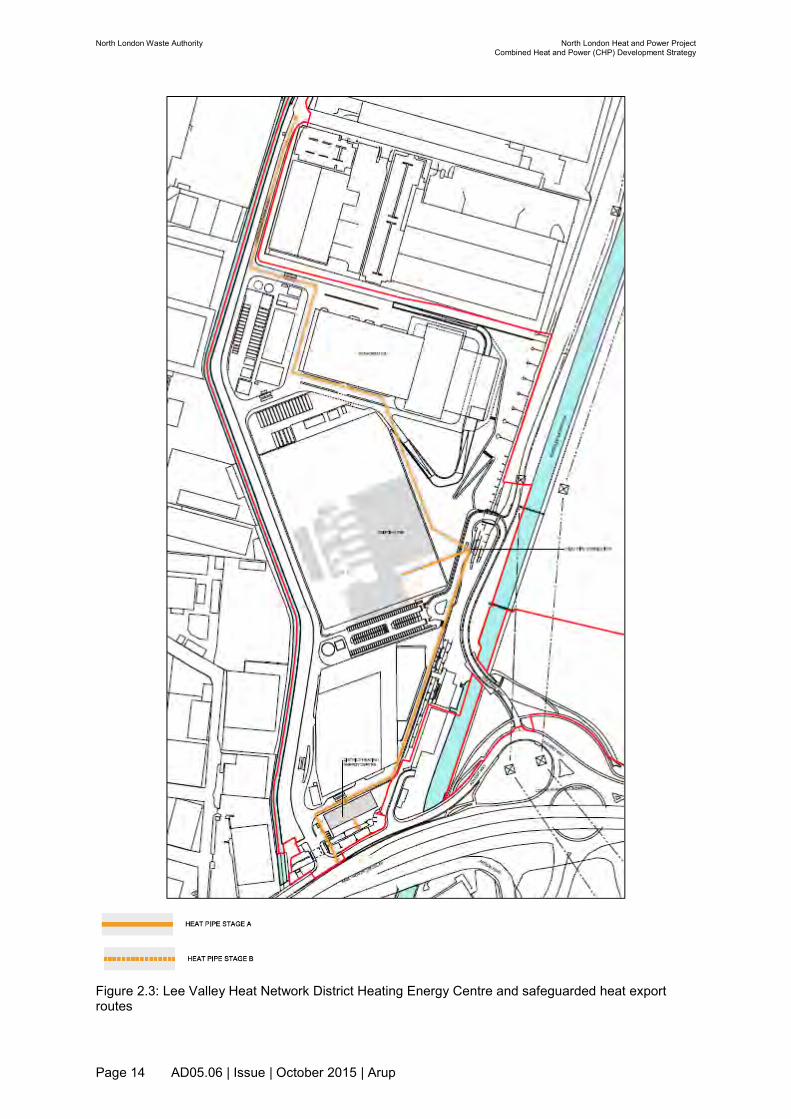
2.3.1 The Applicant is working with LB Enfield on the planning of an initial heat connection to be implemented from the existing EfW facility to supply the LVHN District Heating Energy Centre (DHEC). The Decentralised Energy Project Delivery Unit (DEPDU)17 study undertaken for the NLWA identifies that connection to the existing EfW facility could supply around 20MWth of low carbon heat to the network.
2.3.2 The LVHN DHEC is planned to be located on the southern part of the Edmonton EcoPark, and a heat connection route is being safeguarded between the existing EfW facility and the DHEC, as well as from the DHEC to the main pipeline of the LVHN network as illustrated on Figure 2.3.
2.3.3 The figure shows the pipe routing as two stages; Stage A covers the route from the existing EfW facility to the DHEC and the southern edge of the Edmonton EcoPark, while Stage B covers the extension of the route to the ERF and the northern edge of the Edmonton EcoPark.
13 Energy For London Website, as accessed on 9th April 2015, http://www.energyforlondon.org/north-london-heat-and-power-project/ 14 Enfield LVHN website, as accessed 9th April 2015, http://www.enfield.gov.uk/lvhn/info/2/section_one 15 North London Strategic Alliance, Parsons Brinckerhoff, ULV Decentralised Energy Network, Waltham Forest Satellite Schemes, 2012. 16 GLA, Buro Happold, London’s Zero Carbon Energy Resource: Secondary Heat, Report Phase 2, 2013. 17 NLWA, funded by the European Investment Bank through the GLA Decentralised Energy Project Delivery Unit (DEPDU) EfW heat offtake study, 2014.
North London Waste Authority North London Heat and Power ProjectCombined Heat and Power (CHP) Development Strategy
Page 14 AD05.06 | Issue | October 2015 | Arup
Figure 2.3: Lee Valley Heat Network District Heating Energy Centre and safeguarded heat export routes

North London Waste Authority North London Heat and Power ProjectCombined Heat and Power (CHP) Development Strategy
Page 15 AD05.06 | Issue | October 2015 | Arup
3 Policy and guidance
3.1.1 This section provides a summary of key policies related to the provision of CHP.
3.2 National policy and guidance
3.2.1 Overarching National Policy Statement for Energy EN-1 (NPS EN-1) 18 states that:
a. as outlined in Department of Energy and Climate Change (DECC) 2006 guidelines, a development application for a thermal generating station is required to include CHP, or at least the consideration of CHP;
b. applicants should consult with a number of stakeholders, including: potential heat customers, the Homes and Communities Agency, Local Enterprise Partnerships and Local Authorities to obtain advice on the opportunity for CHP; and
c. the applicant should demonstrate that the equipment required to produce a CHP enabled generating station should not impinge on the ability to be Carbon Capture Ready.
3.2.2 National Policy Statement for Renewable Energy Infrastructure EN-3 (NPS EN-3)19 states that new development should consider CHP as part of its application, or show that CHP has been considered. NPS EN-3 states that the Planning Inspectorate will seek further information should this not be provided, and development consent will not be given until the Planning Inspectorate is satisfied that sufficient evidence about CHP is provided.
3.2.3 The National Waste Strategy20 states that:
a. the National Planning Policy for Waste sets out the government’s key planning objectives for sustainable waste management, requirements for waste plan-making authorities and the approach for the determination of planning applications. The policies set out in this document may be material to decisions for individual planning applications;
b. the National Planning Policy for Waste supersedes National Planning Policy Statement 10 (2011); and
c. the key relevant objective is the delivery of sustainable development and resource efficiency, including provision of modern infrastructure, local employment opportunities and wider climate change benefits.
18 Department of Energy and Climate Change, Overarching National Policy Statement for Energy (EN-1), July 2011. 19 Department of Energy and Climate Change, National Policy Statement for Renewable Energy Infrastructure (EN-3), July 2011, 20 Department for Communities and Local Government, National Planning Policy for Waste, October 2014.

North London Waste Authority North London Heat and Power ProjectCombined Heat and Power (CHP) Development Strategy
Page 16 AD05.06 | Issue | October 2015 | Arup
3.2.4 The National Planning Policy Framework (NPPF)21 states that:
a. the NPPF does not contain specific waste policies, since national waste planning policy will be published as part of the National Waste Management Plan for England. However, local authorities preparing waste plans and taking decisions on waste applications should have regard to policies in the NPPF so far as relevant;
b. to help increase the use and supply of renewable and low carbon energy, local planning authorities should recognise the responsibility on all communities to contribute to energy generation from renewable or low carbon sources;
c. when determining planning applications, local planning authorities should not require applicants for energy development to demonstrate the overall need for renewable or low carbon and approve the application if its impacts are (or can be made) acceptable; and
d. local plans should take account of climate change over the longer term, including factors such as flood risk, coastal change, water supply and changes to biodiversity and landscape. New development should be planned to avoid increased vulnerability to the range of impacts arising from climate change. When new development is brought forward in areas which are vulnerable, care should be taken to ensure that risks can be managed through suitable adaptation measures, including through the planning of green infrastructure.
3.2.5 DECC’s Future of Heating Strategy reports:22, 23
a. introduced DECC’s strategy for decarbonising heating in the UK; the 2012 report outlined the options, with the 2013 report proposing implementation pathways;
b. proposes increasing rollout of district heating networks, which from 2020 should be expanded to wider strategic networks serving larger areas, as well as being adapted to use sources of lower carbon heat such as energy from waste; and
c. in terms of current policies encouraging CHP enabled energy from waste generation, under the Renewables Obligation some types of renewable (including EfW) CHP are eligible for a higher level of support per MWhe electrical output than power-only plant. In general, renewable CHP schemes accredited up until 31 March 2015 are eligible to apply for this support.
3.3 Regional and local policy and guidance
3.3.1 The London Plan 24 includes a number of policies of relevance to the Application as set out below.
21 Department for Communities and Local Government, National Planning Policy Framework, March 2012 22 DECC, The Future of Heating: A strategic framework for low carbon heat in the UK, 2012. 23 DECC, The Future of Heating: Meeting the Challenge, 2013. 24 Mayor of London, The London Plan, March 2015.
North London Waste Authority North London Heat and Power ProjectCombined Heat and Power (CHP) Development Strategy
Page 17 AD05.06 | Issue | October 2015 | Arup
3.3.2 Policy 5.2 Minimising Carbon Dioxide Emissions:
a. requires that development proposals contribute to reducing carbon dioxide emissions by adhering to the energy hierarchy: Be lean (use less energy); Be clean (supply energy efficiently); and Be green (use renewable energy); and
b. an energy assessment must be submitted with all new major developments to provide a detailed energy assessment which shows their commitments to reducing greenhouse gas emissions. This energy assessment should include calculation of the proposed demand for energy, and resultant carbon dioxide emissions; any proposals to decrease or mitigate these emissions on-site; any off-site mitigation strategies; and any proposals to supply decentralised energy through district heating, and cooling and CHP.
3.3.3 Policy 5.5 Decentralised Energy Networks:
a. sets out a target of 25 per cent of London’s heat and power to be generated by localised decentralised energy systems by 2025; and
b. commits to promoting the provision of decentralised heating and cooling networks, at the area-level and site-specific scale.
3.3.4 Policy 5.6 Decentralised Energy In Development Proposals:
a. requires the evaluation of the possibility of providing CHP systems for all developments. Where a new CHP system is appropriate, development applications must assess opportunities to extend the system beyond the boundary of the Edmonton EcoPark;
b. sets out the following hierarchy of energy systems which should be followed for all major development proposals:
c. connection to existing heating or cooling networks;
d. site wide CHP network;
e. communal heating and cooling.
f. where future network opportunities have been previously identified, proposals should be designed to connect to these networks.
3.3.5 Policy 5.17 Waste Capacity:
a. wherever possible, proposals for waste management developments should take the opportunity to provide CHP and Combined Cooling, Heating and Power (CCHP).
3.3.6 The adopted Enfield Core Strategy25 states that:
a. the outputs of waste facilities (for example materials or heat and electricity) can be used in other industrial processes (e.g. manufacturing) or in district CHP schemes. Locating facilities in close proximity to each other reduces the need to transport materials and is essential for the efficiency of district CHP, all of which aids the creation of more sustainable communities; and
25 The Enfield Plan, Core Strategy 2010-2025, November 2010.
North London Waste Authority North London Heat and Power ProjectCombined Heat and Power (CHP) Development Strategy
Page 18 AD05.06 | Issue | October 2015 | Arup
b. in order to drive waste management up the waste hierarchy, it is necessary to ensure that there is sufficient infrastructure in place to support more sustainable waste management options. Ensuring ease, efficiency and convenience of the storage and collection of waste must form part of this Strategy. In larger developments, on-site treatment of waste may be the most sustainable option, for example, through a CHP facility.
3.3.7 The Enfield Development Management Document (DMD)26 includes Policy DMD 52 Decentralised Energy Networks which:
a. requires proposals for major developments which produce heat and/or energy to contribute to the supply of decentralised energy (DE) networks, unless it can be demonstrated that this is not economically viable or technically feasible; and
b. states that all major developments should connect to or contribute towards existing or planned decentralised energy networks supplied by low or zero carbon energy. Where no connection is available to a decentralised energy network and no DE network is planned within range, on-site CHP or CCHP will be expected where demand makes it feasible. Where on-site CHP or CCHP is not financially viable or technically feasible, developments will be required to be designed to connect to a DEN or contribute to a DEN or other carbon reduction measures in the borough in the future.
3.3.8 The Lee Valley Heat Network within Enfield’s Central Leeside Proposed Submission Area Action Plan (CLAAP)27 includes Policy CL30. This states that the Council supports the development of the LVHN and that all major developments should connect to or contribute towards the LVHN in accordance with DMD Policy 52. Where the development is expected to be completed before the LVHN is able to supply heat and there are no firm plans for extension of the LVHN within a feasible and viable range of the development, provision of on-site CHP will be expected where demand for heating makes this feasible.
3.3.9 The Edmonton EcoPark SPD does not detail specific policy, but does give detailed, site specific guidance on how to achieve the objectives set out in the Enfield Local Plan, particularly the adopted Core Strategy and CLAAP. Chapter 1 of Edmonton EcoPark SPD references London Plan Policy 5.17 which states that wherever possible, opportunities should be taken to provide CHP and CCHP. The Edmonton EcoPark SPD also recognises the significant opportunity for development at the Edmonton EcoPark to generate additional community benefits through the provision of heat. One of the objectives for the Edmonton EcoPark is to play a key role in providing affordable, secure, low carbon energy to Central Leeside as part of a wider decentralised energy network in the Lee Valley area. The SPD states that “to facilitate the delivery of the LVHN, proposals for the EcoPark site must incorporate space for an energy centre, a connection from sources of
26 LB Enfield, Draft Development Management Document, ‘Planning a better Enfield with you’, May 2012. 27 LB Enfield, Enfield’s Local Plan, Central Leeside Area Action Plan, Sustainability Appraisal Scoping Report, July 2014.

North London Waste Authority North London Heat and Power ProjectCombined Heat and Power (CHP) Development Strategy
Page 19 AD05.06 | Issue | October 2015 | Arup
energy/heat into the energy centre, and both steam and LTHW [Low Temperature Hot Water] pipe network leaving the site, having regard to meeting the technical specification for the LVHN including the minimum allowances for energy/heat output, and the requirement for operational and ancillary plant equipment”.
3.4 Summary of key policy requirements
3.4.1 The NPS EN-1 and NPS EN-3 set out the requirement for this document to be prepared and submitted in support of the Application. The NPSs require the contents of this report to provide clear evidence that the scheme would be CHP enabled and that heat demands required and the heat networks envisioned to supply the heat are either existing, under development or consideration. The NPSs also require an audit trail with the relevant stakeholders including prospective heat customers.
3.4.2 Regional and local policy, as contained in the London Plan, Enfield Core Strategy, Enfield DMD and CLAAP all support the treatment of waste at the Edmonton EcoPark and that facilities should accommodate CHP. The Enfield DMD and CLAAP state that developments should, where possible, connect or contribute to a District Energy Network (DEN). Where this is not possible on-site CHP or CCHP is expected where this is feasible. The Edmonton EcoPark SPD sets an expectation that development at the Edmonton EcoPark would supply the LVHN.

North London Waste Authority North London Heat and Power ProjectCombined Heat and Power (CHP) Development Strategy
Page 20 AD05.06 | Issue | October 2015 | Arup
4 Evaluation of CHP potential
4.1.1 This section presents evidence of the CHP potential of the Edmonton EcoPark including the potential for heat supply and how it matches with the potential heat demand.
4.2 Stakeholder consultation
4.2.1 NPS EN-1 states that applications must either include CHP or contain evidence that it has been considered, noting that the evidence “should be through an audit trail of dialogue between the applicant and prospective customers” (para. 4.6.6). Applicants should also obtain advice on opportunities for CHP from bodies such as:
a. Homes and Communities Agency (HCA);
b. Local Enterprise Partnerships (LEPs); and
c. Local Authorities.
4.2.2 The Applicant has consulted with the following public bodies as recommended by NPS EN-1:
a. GLA (as the equivalent body to the HCA for London);
b. London Enterprise Panel;
c. LB Enfield;
d. LB Haringey; and
e. LB Waltham Forest.
4.2.3 The Applicant has also consulted with the following prospective heat customers:
a. LVHN Ltd;
b. Meridian Water major development site (through LB Enfield);
c. Blackhorse Lane development site (through LB Waltham Forest);
d. Thames Water Utilities Ltd (TWUL) – Deephams Farm Sewage Treatment Works;
e. Coca-Cola Enterprises;
f. SEGRO Navigation Park;
g. Ravenside Retail Park; and
h. North Middlesex University Hospital.
4.2.4 Details of the consultation which have informed the CHP strategy within the scheme are set out at Appendix A.
4.3 Method of analysis
4.3.1 The analysis is based on the following:
a. a heat supply assessment, to determine the potential for heat supply from the ERF;

North London Waste Authority North London Heat and Power ProjectCombined Heat and Power (CHP) Development Strategy
Page 21 AD05.06 | Issue | October 2015 | Arup
b. a description of operational modes, to determine the different heat to power ranges available and the interaction with the associated carbon emissions;
c. a heat demand assessment, to review the heat demands in the area as identified by various sources, and reinforced by relevant stakeholder engagement;
d. a review of the longer term heat demand potential; and
e. a summary of the above to determine the match between the available heat and the potential for heat supply in order to consolidate the evidence supporting the ability of the Edmonton EcoPark to operate in CHP mode.
4.4 Heat supply assessment
4.4.1 The ERF is intended to employ an extraction condensing steam turbine to facilitate heat supply.
4.4.2 The ERF would have a gross power generation capacity of circa 70MWe in power only mode, processing 44 t/hr of waste per process line with a net calorific value of 10 MJ/kg. Other key modelling assumptions for this estimate are as follows. These factors would be decided upon at the detailed design stage of the ERF:
a. Air Cooled Condenser (ACC) cooling with 0.1bara back pressure;
b. 50bara, 425°C steam parameters at boiler outlet;
c. single steam turbine generator unit;
d. flue gas temperature at boiler exit - 170°C;
e. excess air ratio of 1.5; and
f. Selective Catalytic Reduction (SCR) nitrogen dioxide (NOx) abatement.
4.4.3 The ERF can be designed to supply up to 160MWth of heat. Heat supply would impact power generation. Gross power generation would reduce to circa 15MWe with 160MWth of heat of heat supply.
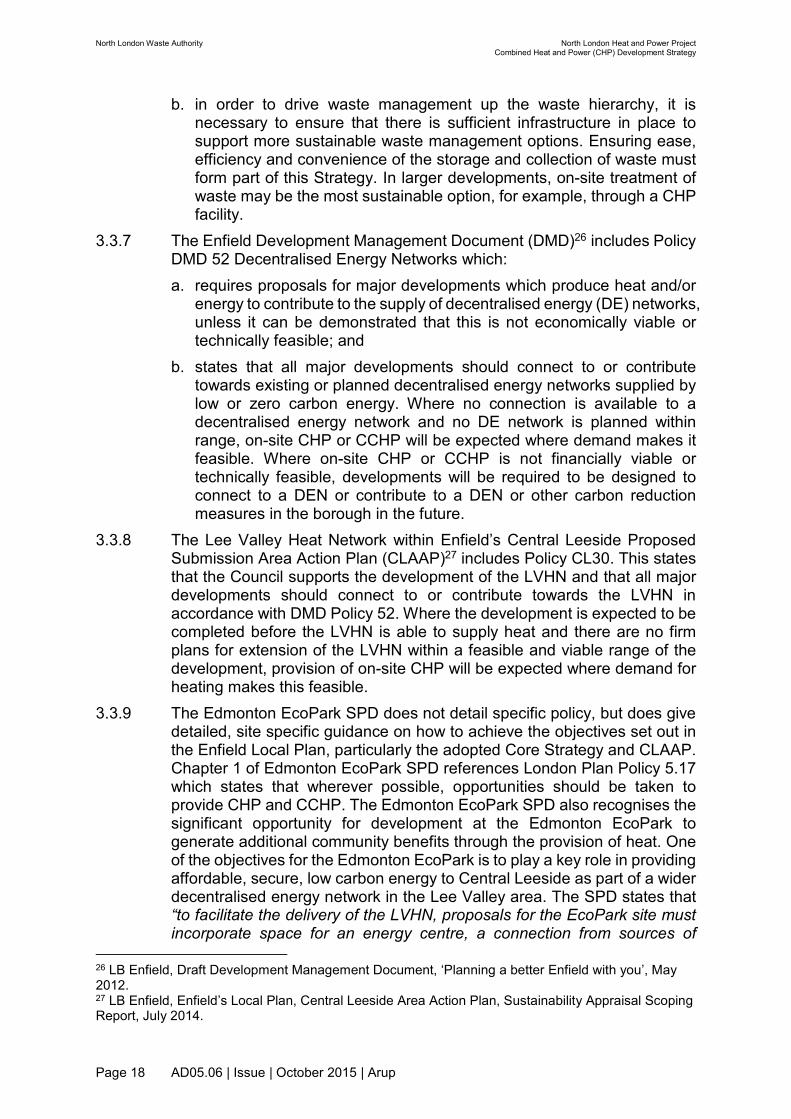
4.4.4 The total efficiency of the ERF improves with increasing heat supply as indicated by the chart shown in Figure 4.1. As a consequence, the carbon emissions associated with the supply of heat reduce with increasing heat supply.
North London Waste Authority North London Heat and Power ProjectCombined Heat and Power (CHP) Development Strategy
Page 22 AD05.06 | Issue | October 2015 | Arup
Figure 4.1: ERF performance with increasing heat output
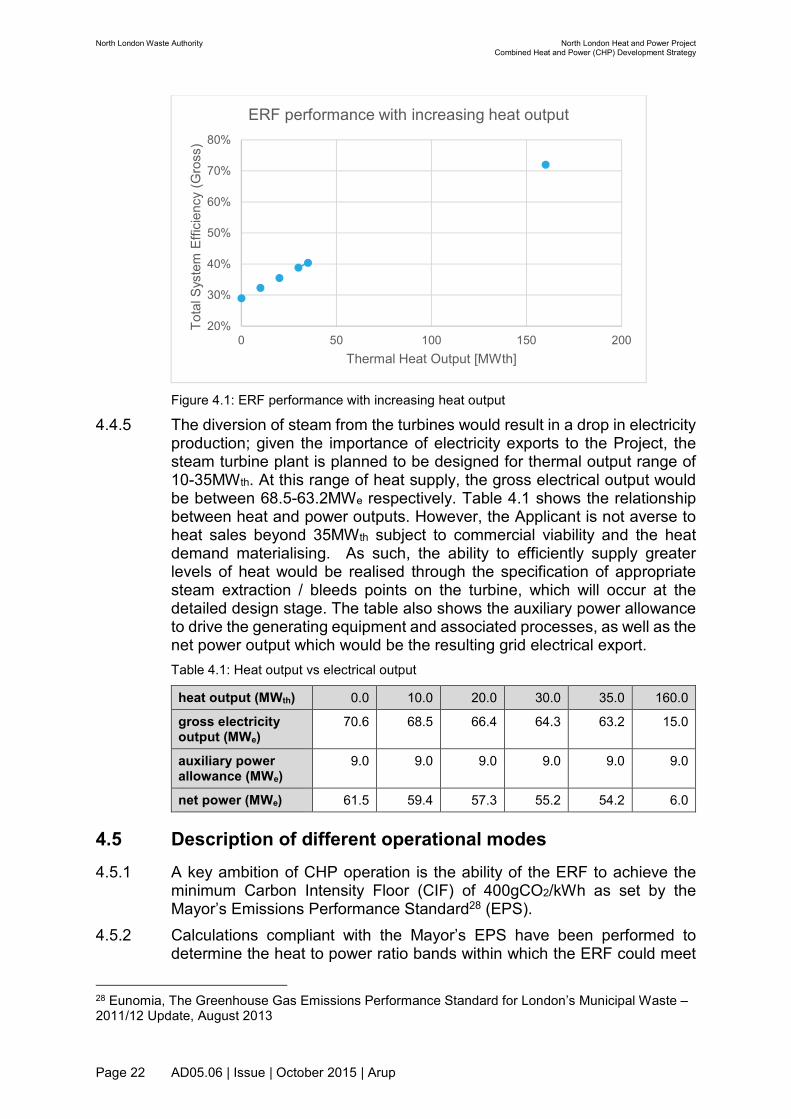
4.4.5 The diversion of steam from the turbines would result in a drop in electricity production; given the importance of electricity exports to the Project, the steam turbine plant is planned to be designed for thermal output range of 10-35MWth. At this range of heat supply, the gross electrical output would be between 68.5-63.2MWe respectively. Table 4.1 shows the relationship between heat and power outputs. However, the Applicant is not averse to heat sales beyond 35MWth subject to commercial viability and the heat demand materialising. As such, the ability to efficiently supply greater levels of heat would be realised through the specification of appropriate steam extraction / bleeds points on the turbine, which will occur at the detailed design stage. The table also shows the auxiliary power allowance to drive the generating equipment and associated processes, as well as the net power output which would be the resulting grid electrical export.
Table 4.1: Heat output vs electrical output
heat output (MWth) 0.0 10.0 20.0 30.0 35.0 160.0
gross electricity output (MWe)
70.6 68.5 66.4 64.3 63.2 15.0
auxiliary power allowance (MWe)
9.0 9.0 9.0 9.0 9.0 9.0
net power (MWe) 61.5 59.4 57.3 55.2 54.2 6.0
4.5 Description of different operational modes
4.5.1 A key ambition of CHP operation is the ability of the ERF to achieve the minimum Carbon Intensity Floor (CIF) of 400gCO2/kWh as set by the Mayor’s Emissions Performance Standard28 (EPS).
4.5.2 Calculations compliant with the Mayor’s EPS have been performed to determine the heat to power ratio bands within which the ERF could meet
28 Eunomia, The Greenhouse Gas Emissions Performance Standard for London’s Municipal Waste – 2011/12 Update, August 2013
20%
30%
40%
50%
60%
70%
80%
0 50 100 150 200
Tota
l S
yste
m E
ffic
iency (
Gro
ss)
Thermal Heat Output [MWth]
ERF performance with increasing heat output
North London Waste Authority North London Heat and Power ProjectCombined Heat and Power (CHP) Development Strategy
Page 23 AD05.06 | Issue | October 2015 | Arup
the minimum CIF. The report detailing the analysis is included in – WRATE and Carbon Intensity Floor Modelling: Technical Report.
4.5.3 The minimum heat to power ratio required to meet the CIF is around 12MWth/68MWe
29. However, the planned design point is 35MWth/63.2MWe which could represent an improvement on the ERF CIF bringing it to circa 300gCO2/kWh30.
4.5.4 The actual annual heat supply range available for export could be between 80-1,260GWhth depending on heat demand. The ERF would be able to modulate the heat and power balance on a continuous basis to provide heat on demand to the heat network up to the maximum peak of 160MWth.
4.5.5 All annual heat supply estimates take into account ERF availability of 90 per cent, which means that the ERF would be operational for 90 per cent of the year (i.e. 8,000 hours per year). This assumption takes account of expected down time and other issues which would reduce the ERF heat and power outputs from the rated design capacity. The annual heat supply figures quoted above are correspondingly lower than the theoretical energy output from operating the ERF continuously.
4.6 Heat demand assessment
Existing and planned development
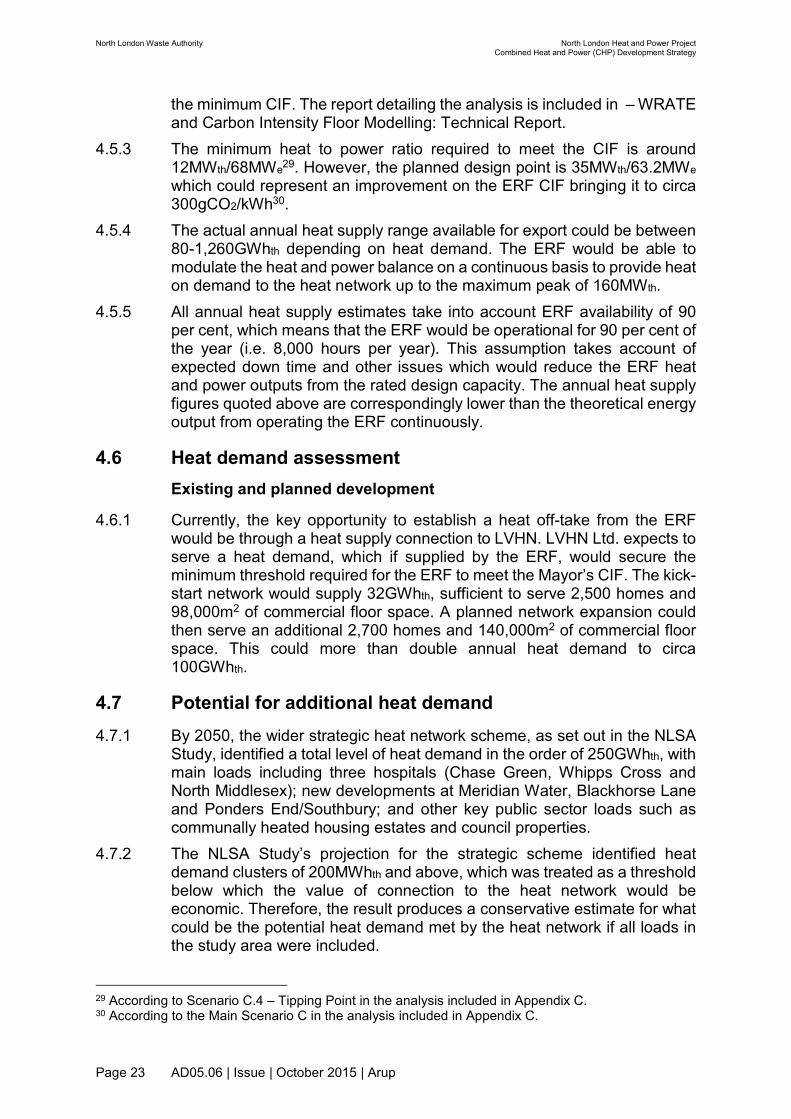
4.6.1 Currently, the key opportunity to establish a heat off-take from the ERF would be through a heat supply connection to LVHN. LVHN Ltd. expects to serve a heat demand, which if supplied by the ERF, would secure the minimum threshold required for the ERF to meet the Mayor’s CIF. The kick-start network would supply 32GWhth, sufficient to serve 2,500 homes and 98,000m2 of commercial floor space. A planned network expansion could then serve an additional 2,700 homes and 140,000m2 of commercial floor space. This could more than double annual heat demand to circa 100GWhth.
4.7 Potential for additional heat demand
4.7.1 By 2050, the wider strategic heat network scheme, as set out in the NLSA Study, identified a total level of heat demand in the order of 250GWhth, with main loads including three hospitals (Chase Green, Whipps Cross and North Middlesex); new developments at Meridian Water, Blackhorse Lane and Ponders End/Southbury; and other key public sector loads such as communally heated housing estates and council properties.
4.7.2 The NLSA Study’s projection for the strategic scheme identified heat demand clusters of 200MWhth and above, which was treated as a threshold below which the value of connection to the heat network would be economic. Therefore, the result produces a conservative estimate for what could be the potential heat demand met by the heat network if all loads in the study area were included.
29 According to Scenario C.4 – Tipping Point in the analysis included in Appendix C. 30 According to the Main Scenario C in the analysis included in Appendix C.

North London Waste Authority North London Heat and Power ProjectCombined Heat and Power (CHP) Development Strategy
Page 24 AD05.06 | Issue | October 2015 | Arup
4.7.3 The future projection for secondary heat supplies to the area has been identified by the GLA Report on secondary heat (GLA Report31). It shows the proportion of the heat demand which could be met by secondary heat sources, by borough, in the long term as follows; the Edmonton EcoPark being mentioned as a main source of low carbon heat for this projection:
a. LB Enfield: 675GWhth, equivalent to 30 per cent; and
b. LB Waltham Forest: 550GWhth, equivalent to 35 per cent.
4.7.4 Examination of the National Heat Map 32shows that a three kilometre radius around the Application Site would theoretically exhaust 1,050GWhth of heat available from the ERF per annum. However, with a practical approach, not all heat customers would be feasible for connection due to a wide range of socio-economic, technical and commercial reasons. However in a five kilometre radius, there is projected to exist three times the heat demand at 3,200GWhth.
4.7.5 With the proposed ERF providing its design point of a 35MWth peak heat supply, the annual heat supply would reach around 275GWhth, which would provide around 10 per cent of the heat demand in a 5km radius surrounding the Edmonton EcoPark. Figure 4.2 compares heat supply with heat demand projections, and shows the short (2025), medium (2035) and long term (2050) projections.
Figure 4.2: Heat supply vs heat demand
31 GLA report by Buro Happold, London’s Zero Carbon Energy Resource: Secondary Heat, Report
Phase 1, 2013. 32 Department of Energy and Climate Change, National Heat Map http://tools.decc.gov.uk/nationalheatmap/ (accessed July 2015).
0.0
500.0
1000.0
1500.0
2000.0
2500.0
3000.0
3500.0
ERF supply LVHNdemand
Wider areanetworkdemand
Furtherexpansiondemand
5km radiusdemand
(GW
h_th
)
Heat supply vs heat demand
Short term Mid term Long term

North London Waste Authority North London Heat and Power ProjectCombined Heat and Power (CHP) Development Strategy
Page 25 AD05.06 | Issue | October 2015 | Arup
4.8 Summary of CHP potential
4.8.1 The heat supply and demand requirements for the Project to realise its CHP potential are documented in numerous feasibility studies and are planned for realisation in the short-term coinciding with the ERF beginning operations in 2025.
4.8.2 In the short-term (2025), the LVHN could provide a heat demand in excess of the 96GWhth threshold to ensure the Mayor’s EPS Carbon Intensity Floor of 400gCO2/kWh is met.
4.8.3 Further improvement on the carbon intensity of the heat and power produced by the ERF could be achieved as the wider strategic heat network is expanded to a heat demand of around 250GWhth of heat demand, providing the opportunity for additional heat supply by the ERF.

North London Waste Authority North London Heat and Power ProjectCombined Heat and Power (CHP) Development Strategy
Page 26 AD05.06 | Issue | October 2015 | Arup
5 Approach to CHP development
5.1.1 Based on the key policy requirements and consideration of the current status of heat network development in the local area, this section identifies the approach to the development of the Project to deliver heat as well as power.
5.2 Facility design
5.2.1 The Project includes a CHP enabled ERF that could supply up 160MWth of heat. For this, the ERF would employ an extraction condensing steam turbine with a controlled extraction point. The Project includes provision for the supply of heat in the form of hot water or steam to the boundary of the Edmonton EcoPark for connection to a DHEC for heat distribution to heat customers by LVHN.
5.2.2 The ERF combustion process is used to heat water in a boiler. This turns to steam, which then drives a turbine to produce electricity. The steam can be bled from the turbine to heat water which can be piped as part of a district heating scheme, but there is an associated reduction in electricity output.
5.2.3 Based upon the projected heat demand, maintaining electricity production between 60 and 70MWe (gross) is the planned design point that supports the wider context of the Project. Electrical generation would reduce to 63.2MWe (gross) with 35MWth of heat supply, representing a 10 per cent drop in electrical output compared with the maximum electrical output in power-only mode.
5.2.4 The ERF preliminary design incorporates space allowances for the heat offtake equipment and pipework which would enable the ERF for CHP operation. The relevant sketches are included in Appendix B for information, noting that the internal space design is subject to refinement as the design progresses.
5.3 Existing heat infrastructure on the Application Site
5.3.1 For the ERF to be CHP enabled, there is a need for infrastructure on the Edmonton EcoPark to transport heat from the ERF and deliver it to a heat network. This is allowed for in the draft DCO.
5.3.2 There is currently no heat infrastructure on the Edmonton EcoPark; however, the existing EfW facility is planned for upgrade to become CHP enabled to become a low carbon heat source to proposed local heat networks development.
5.3.3 The Applicant is engaged in negotiations with LVHN Ltd. to undertake enabling works which would allow the existing EfW facility to supply heat to the proposed DHEC. The current timetable is for the connection and network works to go ahead by end of 2017. The EfW facility would supply heat until the new ERF is commissioned, subject to any final agreements between parties.

North London Waste Authority North London Heat and Power ProjectCombined Heat and Power (CHP) Development Strategy
Page 27 AD05.06 | Issue | October 2015 | Arup
5.4 Connection to heat networks
5.4.1 The Application safeguards district heating pipework routes leading from the ERF to the edge of the Edmonton EcoPark. One export route is planned via the south of the Edmonton EcoPark, with a second route safeguarded for future export to the north of the Edmonton EcoPark.
5.4.2 The Authority commissioned Arup to produce a District Heating Routing Feasibility Study (the Routing Study) to understand the main constraints surrounding the proposed routes for district heating pipework routing within the Edmonton EcoPark. The Routing Study, provided in Appendix D, covers likely phasing, two options for export (via the north and south), and main engineering constraints involved with other existing and proposed utilities within the Edmonton EcoPark.
5.4.3 Figure 5.1, developed on the basis of the Routing Study, shows the safeguarded routes to the north and south of the Edmonton EcoPark, which could hold future pipework in coordination with other proposed utilities.
5.4.4 The current plans for LVHN include a DHEC building which ‘in principle’ would be located on the south of the Edmonton EcoPark as indicated by Figure 5.1. It would incorporate all equipment required for the successful supply of heat to the heat network, including:
a. thermal storage vessels;
b. backup and top-up gas boilers;
c. distribution pumping equipment;
d. pressurisation and expansion equipment;
e. water treatment and filtration equipment; and
f. controls and electrical equipment and other ancillaries.
5.4.5 The DHEC proposal does not form part of the Application. The proposals for the DHEC would be brought forward by the promoters of that scheme as a standalone planning application.

North London Waste Authority North London Heat and Power ProjectCombined Heat and Power (CHP) Development Strategy
Page 28 AD05.06 | Issue | October 2015 | Arup
Figure 5.1: Safeguarded heat export routes from ERF via the north and south of the Edmonton EcoPark
Southern Export Route
Northern Export Route

North London Waste Authority North London Heat and Power ProjectCombined Heat and Power (CHP) Development Strategy
Page 29 AD05.06 | Issue | October 2015 | Arup
5.5 Connection to future heat loads
5.5.1 As set out in the Routing Study (Appendix D), a second heat export route has been safeguarded to the northern boundary of the Edmonton EcoPark to enable an alternative or additional route for heat export towards the Eley Estate, Deephams Sewage Treatment Works and any other customers arising in this direction.
5.5.2 LVHN is considered a catalyst project which would initiate the development of the strategic heat network identified by the NLSA Study. The development plans for LVHN are set out in two stages. As LVHN expands, the peak heat requirement could increase to 80MWth on completion of the second phase. The capacity for exporting heat via the south of the Edmonton EcoPark would initially be limited to this; therefore, the second export route to the north of the Edmonton EcoPark would accommodate a further 80MWth which could eventually maximise the heat output potential of the ERF.
5.6 Summary of CHP Development Strategy
5.6.1 The Project includes a CHP enabled ERF that could supply between 10-160MWth of heat if the demand materialises.
5.6.2 The proposed ERF design is based on 35MWth peak heat export for the steam turbine design point but does not preclude the efficient supply of greater levels of heat. This would produce a drop of around 10 per cent in electrical production (to around 63MWe) but would provide up to 275GWhth of low carbon heat supply. This heat to power ratio is considered a favourable combination in terms of maintaining a high electrical power generation capacity whilst serving a heat demand which is likely to materialise in the medium and long term leading up to 2050.
5.6.3 Heat off-take equipment space allowances have been made in the ERF preliminary building design, and district heating pipework routes have been safeguarded to link the ERF to the northern and southern edges of the Edmonton EcoPark, enabling heat export. The routing has been detailed by means of a Routing Study.
5.6.4 The planned heat network opportunity which would enable immediate heat export for the ERF is the LVHN scheme. LVHN Ltd. intends initially to use heat supplied by the existing EfW facility until the ERF is operational. If greater levels of heat demand come forward, these could be catered for through the specification of steam extraction/bleed points on the turbine which would occur at the detailed design stage.

North London Waste Authority North London Heat and Power ProjectCombined Heat and Power (CHP) Development Strategy
Page A.1 AD05.06 | Issue | October 2015 | Arup
Appendix A – Stakeholder Consultation
A1 Public Body Consultation A1.1.1 The Applicant has consulted with the public bodies as summarised in
Table A.1. Table A.1: Summary of consultation with public bodies
Entity Relevant body Summary of outcome Document reference
Homes and Communities Agency (HCA)
HCA The HCA has not been contacted in this case given that the GLA undertake HCA responsibilities with Greater London.
n/a
Local Enterprise Partnerships (LEPs)
London Enterprise Panel
Please refer to engagement with the GLA.
n/a
Local Authorities LB Enfield Heat demand for LVHN confirmed.
A.3.1
LB Haringey No response and on-going discussions with relevant parties
n/a
LB Waltham Forest No response and on-going discussions with relevant parties
n/a
Greater London Authority
Response provided that supports the maximum provision of heat to local heat customer opportunities.
A.3.2
A2 Private Body Consultation A2.1.1 The Applicant has also consulted with prospective heat customers as
summarised in Table A.2. Table A.2: Heat customer consultation summary
Name of potential customer
Nature of organisation
Summary of outcome Document reference
LVHN Ltd. Municipal ESCo established by LB Enfield, which is actively developing district heating network opportunities in the borough.
Extensive discussions have been held between the applicant and LVHN. No formal commercial agreement is in place, but discussions are positive and ongoing in respect of a future heat off-take from the ERF.
Through LB Enfield A.3.1
Meridian Water major development site.
A masterplan being promoted by LB Enfield.
Discussions have been held with LB Enfield on the potential for the ERF to supply heat to Meridian Water. LB Enfield’s
Through LB Enfield A.3.1

North London Waste Authority North London Heat and Power ProjectCombined Heat and Power (CHP) Development Strategy
Page A.2 AD05.06 | Issue | October 2015 | Arup
preferred route is through LVHN.
Blackhorse Lane Development
Current masterplan being promoted by LB Waltham Forest – details in the Local Area Action Plan.
No response n/a
Thames Water Utilities Ltd, Deephams Sewage Treatment Works
Sewage Treatment Works undergoing upgrade beginning 2015. Currently includes CHP on a self-sufficient basis.
Confirmed self-sufficiency and ability to export own heat.
A.3.3
Coca-Cola Enterprises
Coca-Cola Edmonton factory in Eley Estate. Address: Unit 10-10A, Nobel Rd, London N18 3DJ.
No response. n/a
SEGRO Navigation Park
Navigation Park is also prospective and is further north.
No response. n/a
Ravenside Retail Park
retail park including, Mothercare, Next, Wickes, Curries and Argos
No response. n/a
North Middlesex University Hospital
Potentially large heat customer approximately 2.5km from EcoPark west along the A406.
No response. n/a

Page A.3 AD05.06 | Issue | October 2015 | Arup
A3 Potential customer consultation response
A3.1 LB Enfield


Page A.4 AD05.06 | Issue | October 2015 | Arup
A3.2 Greater London Authority


Page A.5 AD05.06 | Issue | October 2015 | Arup
A3.3 Thames Water Utilities Ltd

From:
Sent: 24 August 2015 15:19 To: POST
Cc: Subject: FW: IR 1013130940 - NLWA enquiry
Dear NLWA,
In response to your letter I can confirm that Thames Water has already included the provision,
secured within the s106 agreement for the Deephams Sewage Works (STW) Upgrade project, for the
future potential connection of flow and return pipes by incorporating appropriate flange plates in
the heat rejection system for each Sewage Works CHP engine, and the safeguarding of a pipe route
to the boundary of the STW site. At this time its unlikely we will need excess heat from the NLWA
ERF plant, but instead we could potentially provide excessive heat to the network ourselves from the
STW.
I trust this is helpful.
Cheers
Thames Water
Did you know you can manage your account online? Pay a bill, set up a Direct Debit, change
your details or even register a change of address at the click of a button, 24 hours a day.
Please visit www.thameswater.co.uk.
Thames Water Limited (company number 2366623) and Thames Water Utilities Limited
(company number 2366661) are companies registered in England and Wales each with their
registered office at Clearwater Court, Vastern Road, Reading, Berkshire RG1 8DB. This
email is confidential and intended solely for the use of the individual to whom it is addressed.
Any views or opinions presented are solely those of the author and do not necessarily
represent those of Thames Water Limited or its subsidiaries. If you are not the intended
recipient of this email you may not copy, use, forward or disclose its contents to any other
person; please notify our Computer Service Desk on +44 (0) 203 577 8888 and destroy and
delete the message and any attachments from your system.
We provide the essential service that's at the heart of daily life.

Page B.1 AD05.06 | Issue | October 2015 | Arup
Appendix B – ERF Heat Off-take space allowance illustration

Grate
L
i
m
e
s
i
l
o
Free space for super
heater exchange
Free space for super
heater exchange
Tu
rb
in
e
ha
ll cra
ne
LV room
Turbine
+12.5
+20.5
Service
opening
Turbine hall
+20.5
A
c
t
.
C
a
r
b
o
n
C
a
O
L
i
m
e
s
i
l
o
Passage
Make up w
ater
room
Ventilation / B
uilding
+20.5
ID
fan
Trafo / LV
room
treatment and
pumps
Waste water
treatment and
pumps
Ventilation / B
uilding
water
treatment
Ventilation / B
uilding
installations
C
a
(
O
H
)
₂s
i
l
o
Waste
water
treatment
Space allowance for
Heat offtake
equipment
Turbine Hall LevelERF Heat Off-take Space AllowanceSketch
Not for construction - Internal layout of ERFsubject to amendment at detailed design.

35
00
0
Stores
Pumps /
Steam headers
/ Aux
Bottom ash
basement
+12.5
+2.5
Service crane
area
6000
Service crane
area
124000 40000
A
c
t
.
C
a
r
b
o
n
C
a
O
L
i
m
e
s
i
l
o
MV
/ LV
T
ransform
ers
Passage
Emergency
diesel
room
FGT auxiliaries
MV
/ LV
T
ransform
ers
Consum
ables unloading
Consum
ables unloading
C
a
(
O
H
)
₂s
i
l
o
Space allowance for
Heat offtake
equipment
DH transmission pipe
routing to/from ERF
beneath ground level
Ground Level ERF Heat Off-take Space AllowanceSketch
Not for construction - Internal layout of ERFsubject to amendment at detailed design.
Page C.1 AD05.06 | Issue | October 2015 | Arup
Appendix C – WRATE and Carbon Intensity Floor Modelling: Technical Report

North London Waste Authority North London Heat and Power Project WRATE and Carbon Intensity Floor Modelling: Technical Report
AD05.06 Appendix C
The Planning Act 2008 The Infrastructure Planning (Applications: Prescribed Forms and Procedure) Regulations 2009 Regulation 5 (2) (q)
Issue | October 2015
Arup
This report takes into account the particular instructions and requirements of our client. It is not intended for and should not be relied upon by any third party and no responsibility is undertaken to any third party.

North London Waste Authority North London Heat and Power ProjectWRATE and Carbon Intensity Floor Modelling: Technical Report
AD05.06 Appendix C | Issue | October 2015 | Arup
Contents
Page
Executive summary 4
1 Introduction 8
2 Discussion 9 2.1 Approach 1: WRATE environmental indicators 9 2.2 Electricity generation mix sensitivity analysis 10 2.3 Approach 2: Mayor of London GHG Calculator 11
3 Assumptions and limitations 12
4 Methodology 13 4.1 Overview 13 4.2 Approach 1: WRATE 18 4.3 Approach 2: Mayor of London GHG Calculator 25
5 Modelling results 26 5.1 Overview 26 5.2 Environmental indicators (Approach 1) 26 5.3 Performance against Carbon Intensity Floor (Approaches 1 & 2) 37
6 Conclusions and recommendations 39 Tables Table 4.1: Summary description of the main analysis and all sensitivity analyses Table 4.2: Summary of normalised WRATE results for analyses performed
(Approach 1) Table 4.3: Summary of performance against the CIF in gCO2e/kWh (Approach 2) Table 4.4: Proportion and transport of waste to landfill Table 4.5: Modelling parameters for landfill Table 4.6: Waste process outputs from the current EfW
Table 5.1: Normalised environmental indicators for Scenarios A to D (Eur.Person.Eq) (Year=2025)
Table 5.2: Normalised environmental indicators for Scenarios A.1, B.1, C.1 and D.1 (Eur.Person.Eq) (Year=2025)
Table 5.3: Normalised environmental indicators for Scenarios A.2, B.2, C.2 and D.2 (Eur.Person.Eq) (Year=2030)
Table 5.4: Normalised environmental indicators for Scenarios A.3, B.3, C.3 and D.3 (Eur.Person.Eq) (Year=2035)
North London Waste Authority North London Heat and Power ProjectWRATE and Carbon Intensity Floor Modelling: Technical Report
AD05.06 Appendix C | Issue | October 2015 | Arup
Table 5.5: Normalised environmental indicators for Scenarios A.4, B.4, C.4 and D.4 (Eur.Person.Eq) (Year=2025)
Table 5.6: Normalised environmental indicators for Scenarios A.5, B.5, C.5 and D.5 (Eur.Person.Eq) (Year=2025)
Table 5.7: Normalised environmental indicators for Scenarios A.6, B.6, C.6 and D.6 (Eur.Person.Eq) (Year=2030)
Table 5.8: Normalised environmental indicators for Scenarios A.7, B.7, C.7 and D.7 (Eur.Person.Eq) (Year=2035)
Table 5.9: Normalised environmental indicators for Scenarios A.8, B.8, C.8 and D.8 (Eur.Person.Eq) (Year=2025)
Table 5.10: Normalised environmental indicators for Scenarios A.9, B.9, C.9, D.9 (Eur.Person.Eq) (Year=2030)
Table 5.11: Normalised environmental indicators for Scenarios A.10, B.10, C.10 and D.10
Table 5.12: Normalised environmental indicators for Scenario D.11 (Eur.Person.Eq) Table 6.1: NLWA residual waste composition (2009) Table 6.2: NCV data used to model Scenarios under Approach 2 Table 6.3: Modelling parameters and energy/mass balance for main analysis
Scenario and Sensitivity Analysis 1 Table 6.4: Modelling parameters and energy/mass balance for Sensitivity Analyses
2, 3 and 4 Table 6.5: Modelling parameters and energy/mass balance for Sensitivity Analyses
5, 6 and 7 Table 6.6: Modelling parameters and energy/mass balance for Sensitivity Analyses
8, 9 and 10 Table 6.7: Modelling parameters and energy/mass balance for Sensitivity Analysis
11 Table 6.8: 2025 UK default electricity mix from WRATE
Table 6.9: 2030 UK default electricity mix from WRATE
Table 6.10: 2035 UK default electricity mix from WRATE
Table 6.11: 2012 Netherlands default electricity mix from WRATE
Table 6.12: 2025 DECC electricity mix Table 6.13: 2030 DECC electricity mix Table 6.14: 2035 DECC electricity mix Table 6.15: 2025 National Grid electricity mix Table 6.16: 2030 National Grid electricity mix Table 6.17: 2035 National Grid electricity mix Table 6.18: Modelling results for the main analysis and Sensitivity Analysis 1 Table 6.19: Modelling results for Sensitivity Analyses 2, 3 and 4 Table 6.20: Modelling results for Sensitivity Analyses 5, 6 and 7 Table 6.21: Modelling results for Sensitivity Analyses 8, 9 and 10 Table 6.22: Modelling results for Sensitivity Analysis 11
North London Waste Authority North London Heat and Power ProjectWRATE and Carbon Intensity Floor Modelling: Technical Report
AD05.06 Appendix C | Issue | October 2015 | Arup
Figures Figure 4.1: Schematic of Scenario A
Figure 4.2: Schematic of Scenario B
Figure 4.3: Schematic of Scenario C
Figure 4.4: Schematic of Scenario D
Figure 5.1: Normalised environmental indicators for scenarios A to D (main analysis) Figure 5.2: Normalised global warming potential indicator for scenarios A to D (main
analysis) Figure 5.3: Summary of performance against the CIF Appendices
Appendix A A.41
A1 Appendix 1: FRM peer review report A.41
A2 Appendix 2: Waste composition and NCV data A.42
A3 Appendix 3: Modelling parameters and energy/mass balance A.47
A4 Appendix 4: Default WRATE electricity mix (UK: 2025, 2030 and 2035, and the Netherlands: 2012) A.53
A5 Appendix 5: DECC electricity mix (2025, 2030 and 2035) A.56
A6 Appendix 6: National Grid electricity mix (2025, 2030 and 2035) A.58
A7 Appendix 7: Modelling results A.60 Glossary See Project Glossary (AD01.05)

North London Waste Authority North London Heat and Power ProjectWRATE and Carbon Intensity Floor Modelling: Technical Report
Page 4 AD05.06 Appendix C | Issue | October 2015 | Arup
Executive summary
This report describes the life-cycle analysis (LCA) modelling work undertaken to assess the likely environmental performance of a new Energy Recovery Facility (ERF) at Edmonton EcoPark, which forms part of the North London Heat and Power Project (the Project).
The LCA modelling includes a comparison of four waste management scenarios for the residual waste collected by the seven north London boroughs (Constituent Boroughs), for the assessment year of 2025/26 (the expected first year of full operation for the new ERF). These scenarios are briefly defined as follows (more detail is given in Section 4.2 of this report): a. sending all waste to landfill for disposal (Scenario A: Landfill
comparator); b. continuing with the current operation of waste incineration (Scenario B:
current operations in 2025/26); c. a new ERF operating in combined heat and power (CHP) (Scenario C:
future operations); and d. sending half of the waste abroad (in the form of Refuse Derived Fuel) to
Amsterdam and the other half to landfill in the UK (Scenario D: alternative future operations).
Scenarios A to D are referred to as the ‘main analysis’ throughout this report.
This report also describes modelling work undertaken to assess whether Scenarios A to D would meet the Carbon Intensity Floor (CIF) of less than or equal to 400gCO2e/kWh defined by the Greater London Authority (GLA). The CIF is a measure of the carbon impact of generating energy from waste.1 It is calculated by dividing the direct emissions associated with energy generating waste treatment technologies by the gross electricity and heat generated by the said technologies. Waste authorities that are considering options for generating energy from waste need to demonstrate the CIF can be met.
Environmental performance is defined in this context by the use of six environmental indicators, defined briefly here (more detail is given in Section 2.1.4 of this report): a. global warming potential: the environmental impact from anthropogenic
Greenhouse Gas (GHG) emissions. b. acidification potential: the environmental impact from anthropogenic
emissions of acidifying compounds that can damage ecosystems. c. eutrophication potential: the environmental impact from anthropogenic
emissions of nitrogenous compounds and phosphates that can cause increased plant growth and oxygen depredation in aquatic ecosystems.
1 SLR (June 2011). Appendix 4b Determining the Costs of Meeting the EPS and Carbon Intensity Floor, Revision 2 (accessed 21st March 2014).
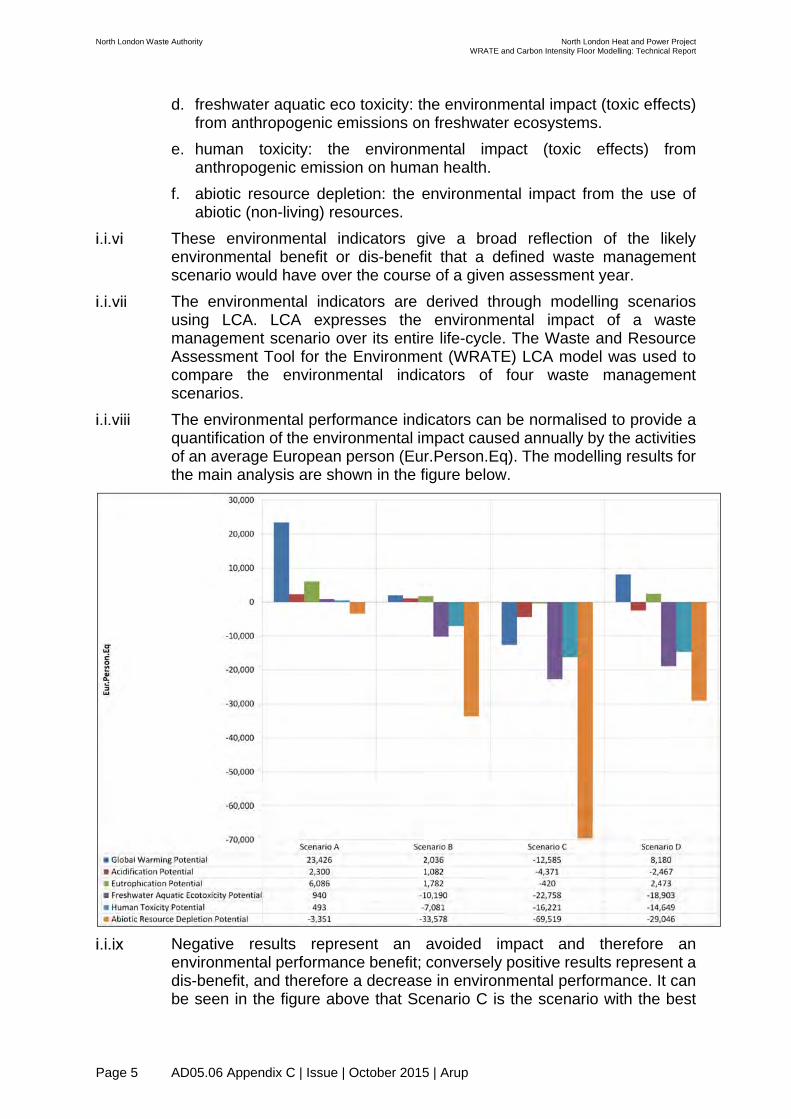
North London Waste Authority North London Heat and Power ProjectWRATE and Carbon Intensity Floor Modelling: Technical Report
Page 5 AD05.06 Appendix C | Issue | October 2015 | Arup
d. freshwater aquatic eco toxicity: the environmental impact (toxic effects) from anthropogenic emissions on freshwater ecosystems.
e. human toxicity: the environmental impact (toxic effects) from anthropogenic emission on human health.
f. abiotic resource depletion: the environmental impact from the use of abiotic (non-living) resources.
These environmental indicators give a broad reflection of the likely environmental benefit or dis-benefit that a defined waste management scenario would have over the course of a given assessment year.
The environmental indicators are derived through modelling scenarios using LCA. LCA expresses the environmental impact of a waste management scenario over its entire life-cycle. The Waste and Resource Assessment Tool for the Environment (WRATE) LCA model was used to compare the environmental indicators of four waste management scenarios.
The environmental performance indicators can be normalised to provide a quantification of the environmental impact caused annually by the activities of an average European person (Eur.Person.Eq). The modelling results for the main analysis are shown in the figure below.
Negative results represent an avoided impact and therefore an
environmental performance benefit; conversely positive results represent a dis-benefit, and therefore a decrease in environmental performance. It can be seen in the figure above that Scenario C is the scenario with the best
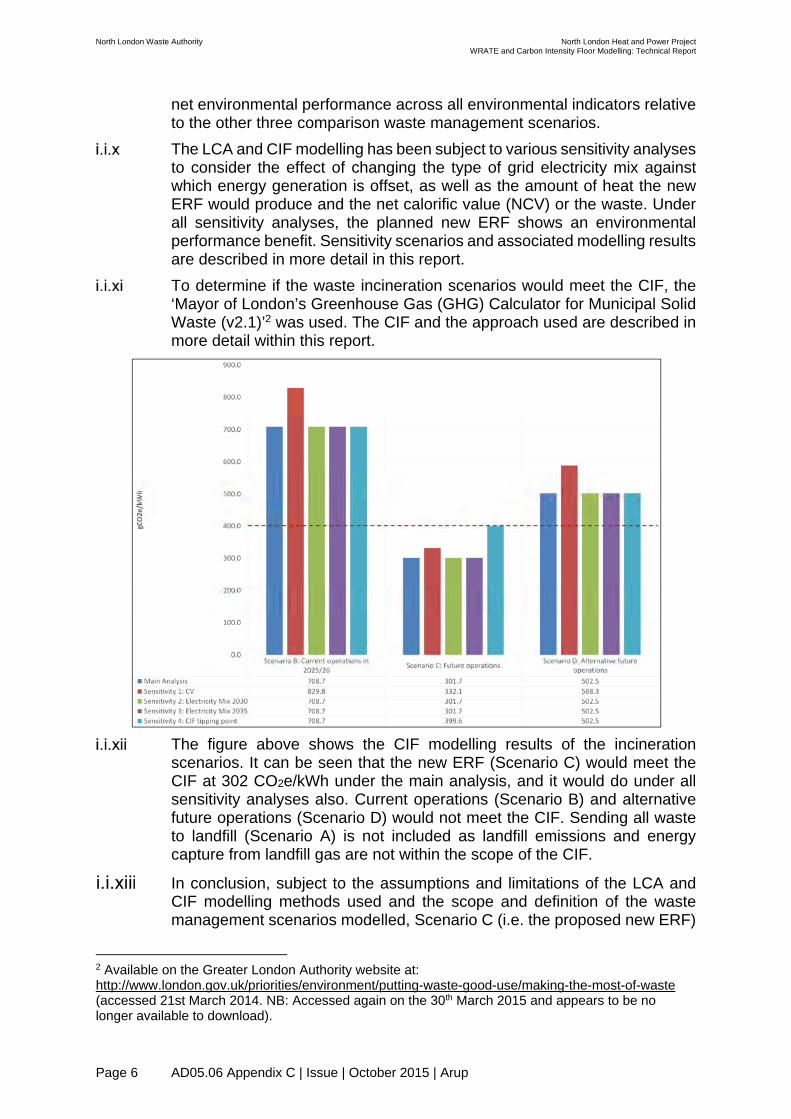
North London Waste Authority North London Heat and Power ProjectWRATE and Carbon Intensity Floor Modelling: Technical Report
Page 6 AD05.06 Appendix C | Issue | October 2015 | Arup
net environmental performance across all environmental indicators relative to the other three comparison waste management scenarios.
The LCA and CIF modelling has been subject to various sensitivity analyses to consider the effect of changing the type of grid electricity mix against which energy generation is offset, as well as the amount of heat the new ERF would produce and the net calorific value (NCV) or the waste. Under all sensitivity analyses, the planned new ERF shows an environmental performance benefit. Sensitivity scenarios and associated modelling results are described in more detail in this report.
To determine if the waste incineration scenarios would meet the CIF, the ‘Mayor of London’s Greenhouse Gas (GHG) Calculator for Municipal Solid Waste (v2.1)’2 was used. The CIF and the approach used are described in more detail within this report.
The figure above shows the CIF modelling results of the incineration
scenarios. It can be seen that the new ERF (Scenario C) would meet the CIF at 302 CO2e/kWh under the main analysis, and it would do under all sensitivity analyses also. Current operations (Scenario B) and alternative future operations (Scenario D) would not meet the CIF. Sending all waste to landfill (Scenario A) is not included as landfill emissions and energy capture from landfill gas are not within the scope of the CIF.
In conclusion, subject to the assumptions and limitations of the LCA and CIF modelling methods used and the scope and definition of the waste management scenarios modelled, Scenario C (i.e. the proposed new ERF)
2 Available on the Greater London Authority website at: http://www.london.gov.uk/priorities/environment/putting-waste-good-use/making-the-most-of-waste (accessed 21st March 2014. NB: Accessed again on the 30th March 2015 and appears to be no longer available to download).

North London Waste Authority North London Heat and Power ProjectWRATE and Carbon Intensity Floor Modelling: Technical Report
Page 7 AD05.06 Appendix C | Issue | October 2015 | Arup
demonstrates the best environmental performance compared to the other three waste management scenarios and would meet the CIF.
North London Waste Authority North London Heat and Power ProjectWRATE and Carbon Intensity Floor Modelling: Technical Report
Page 8 AD05.06 Appendix C | Issue | October 2015 | Arup
1 Introduction
1.1.1 This report has been prepared to support of the North London Waste Authority’s (the Applicant’s) application (the Application) for a Development Consent Order (DCO) for the development of a new Energy Recovery Facility (ERF) to treat residual waste at the Edmonton EcoPark. The Applicant has commissioned Ove Arup & Partners Ltd (Arup) to undertake waste management life-cycle modelling. There are two objectives of this modelling, as follows: a. Objective 1: To assess the likely environmental performance of a new
ERF, relative to current operation as well as sending all waste to landfill. b. Objective 2: To assess under what scenarios an ERF would not meet
the Carbon Intensity Floor (CIF) of less than or equal to 400gCO2e/kWh defined by the Greater London Authority (GLA). This builds on earlier modelling work undertaken by Arup in April and August of 2014 (‘the previous work’).
1.1.2 Objective 1 makes use of the Waste and Resource Assessment Tool for the Environment (WRATE) (Approach 1). Objective 2 primarily makes use of the Mayor of London Green House Gas (GHG) tool (Approach 2), with WRATE used as a sense check for the CIF modelling results.

North London Waste Authority North London Heat and Power ProjectWRATE and Carbon Intensity Floor Modelling: Technical Report
Page 9 AD05.06 Appendix C | Issue | October 2015 | Arup
2 Discussion
2.1 Approach 1: WRATE environmental indicators 2.1.1 WRATE is a life-cycle analysis (LCA) tool which assesses the potential
environmental impacts associated with specific integrated waste management scenarios, and is currently the foremost life-cycle assessment tool for waste management in the UK.
2.1.2 Four waste management scenarios were modelled within WRATE (‘the main analysis’) for the year of 2025: a. Scenario A: Landfill comparator; b. Scenario B: Current operations in 2025/26; c. Scenario C: Future operations; and d. Scenario D: Alternative future operations.
2.1.3 Four sensitivity analyses were also modelled; changing the electricity mix to the year 2030 and 2035, and changing the heat-off take for Scenario C to the CIF tipping point where it would no longer be met. All scenarios are defined in more detail in Section 4.2.
2.1.4 Approach 1 provides quantitative information on these impacts in the form of six default environmental indicators3 described as follows: a. global warming potential (GWP100a): this represents the environmental
impact from anthropogenic GHG emissions, such as carbon dioxide and methane, contributing to global warming over a period of 100 years.
b. acidification potential: this represents the environmental impact from anthropogenic emissions to air, water and land of acidifying compounds such as sulphur dioxide and nitrogen oxides which can contribute to destructive impacts on ecosystems.
c. eutrophication potential: this represents the environmental impact from emission of nitrogenous compounds and phosphates which can stimulate increased plant growth to nutrient poor ecosystems as well as oxygen deprivation in water based ecosystems.
d. freshwater aquatic ecotoxicity: this represents the toxic effects from emissions/effluents on freshwater ecosystems.
e. human toxicity: this represents the toxic effects from emissions/effluents on human health.
f. abiotic resource depletion: this represents the use of abiotic (i.e. non-living) resources such as metals, minerals and fossil fuels.
2.1.5 The results from the WRATE modelling can be normalised so that they are comparable using the European Person Equivalent (Eur.Person.Eq)
3 GWP100a, resource depletion and toxicity (human and freshwater aquatic) have the highest degree of certainty as environmental indicators, whereas acidification and eutrophication have a lesser degree of certainty. This should be borne in mind when interpreting results.

North London Waste Authority North London Heat and Power ProjectWRATE and Carbon Intensity Floor Modelling: Technical Report
Page 10 AD05.06 Appendix C | Issue | October 2015 | Arup
approach. This is a quantification of the environmental impact caused annually by the activities of an average European person.
2.1.6 Negative WRATE modelling results represent an avoided (or displaced) impact, whereas positive results represent an adverse impact (see Table 4.2). Therefore negative results represent a net improved environmental performance, and positive results represent a net reduced environmental performance.
2.1.7 The outcomes of the WRATE analysis should be used to inform the decision making process and not used as the sole basis for waste management scenario selection.
2.1.8 The WRATE model for this analysis has been independently peer reviewed by Frith Resource Management Ltd (FRM). FRM consider the WRATE model and all the User Defined Processes (UDPs) within the model to contain reasonable assumptions given the level of detail available for the model, and they state it has been undertaken with due care and diligence. The full peer review report is included in Appendix A.
2.2 Electricity generation mix sensitivity analysis 2.2.1 A further six analyses were modelled under Approach 1 to reflect alternative
projections for the future UK electricity generation mix, based on the Department of Energy and Climate Change (DECC)4 ‘reference scenario’ and the National Grid (NG)5 ‘gone green’ projection. The DECC reference scenario was used as this is thought to represent the most likely outlook for the future UK electricity generation mix. The National Grid ‘gone green’ electricity generation mix was used as this represents an optimistic outlook for renewable electricity generation in the future, and therefore results in less of an environmental performance benefit for the energy offset for the new ERF. This was undertaken in addition to the default UK electricity generation mix projections within WRATE, which represent a more carbon intensive energy mix in future years6. These are discussed in more detail in Sections 4.1 and 4.2.
2.2.2 In addition, a further analysis was modelled under Approach 1 to reflect the electricity generation mix in the Netherlands, as the Energy from Waste (EfW) process included within Scenario D is located in Amsterdam.
4 DECC Updated energy and emissions projections for 2014, available at: https://www.gov.uk/government/publications/updated-energy-and-emissions-projections-2014 (Accessed 5th May 2015). 5 Part of the National Grid 2014 Future Energy Scenarios, available at: http://www2.nationalgrid.com/UK/Industry-information/Future-of-Energy/Future-Energy-Scenarios/ (Accessed 5th May 2015). 6 This may be due to the categorisation of electricity generation sources. WRATE does not have electricity generation from coal with carbon capture storage (CCS) or gas with CCS category defined in its electricity mix. Therefore the increase in coal within the default WRATE UK electricity mix from 2025 to 2035 could be reflecting the increase in coal with CCS. However, the rationale behind the default WRATE electricity mix is not known.

North London Waste Authority North London Heat and Power ProjectWRATE and Carbon Intensity Floor Modelling: Technical Report
Page 11 AD05.06 Appendix C | Issue | October 2015 | Arup
2.3 Approach 2: Mayor of London GHG Calculator 2.3.1 The CIF is a measure of the carbon impact of generating energy from
waste.7 It is calculated by dividing the direct emissions associated with energy generating treatment technologies by the gross electricity and heat generated by the said technologies. It includes the parasitic load of the EfW facility; the benefits of heat production and subsequent use when operating in combined heat and power (CHP) mode; and fossil carbon emissions. However, the CIF excludes the following: a. carbon dioxide (CO2) benefits of materials capture and subsequent
reprocessing; b. emissions from any reject streams sent to landfill including associated
transport; c. parasitic load of fuel preparation facilities; d. direct emissions from fuel preparation facilities; e. capital burdens (i.e. construction material impacts from primary
infrastructure); and f. biogenic carbon emissions.
7 SLR (June 2011). Appendix 4b Determining the Costs of Meeting the EPS and Carbon Intensity Floor, Revision 2 (accessed 21st March 2014).
North London Waste Authority North London Heat and Power ProjectWRATE and Carbon Intensity Floor Modelling: Technical Report
Page 12 AD05.06 Appendix C | Issue | October 2015 | Arup
3 Assumptions and limitations
3.1.1 The following key assumptions have been made in undertaking the modelling work under both Approaches 1 and 2 (for all input assumptions and parameters please see Appendix A3, Table 6.3 to Table 6.7. a. the waste composition is as provided by the Applicant for residual
municipal waste (presented in Table 6.1 in Appendix A2)8, as per the previous work. As the default waste composition categories used in both Approaches are slightly different to the composition provided by the Applicant, it was assumed that ‘misc combustibles’ includes wood and absorbent hygiene products;
b. a net calorific value (NCV) of residual waste of 10 gigajoules per tonne has been specified by the Applicant. In addition, 8.54 gigajoules per tonne has also been modelled as a sensitivity analysis (this is the default NCV WRATE calculates for the given waste composition as it is not possible to edit the calorific value and NCV values within WRATE);
c. a total gross tonnage of residual waste of 572,856 tonnes per annum (tpa)9,10;
d. a plant availability of 91.3 per cent (8,000 hours per annum); e. a thermal efficiency of 90 per cent; f. a ‘Z’ ratio for hot water of 611; g. waste collection (both infrastructure and transport) from the seven north
London boroughs of Barnet, Camden, Enfield, Hackney, Haringey, Islington and Waltham Forest (the Constituent Boroughs) is out of scope of the modelling;
h. recycling is out of scope of the modelling as it is collected by the Constituent Boroughs;
i. heat network infrastructure (for the heat output from the future ERF) is out of scope of the modelling; and
j. assessment year of 2025/26, as this is the expected first year of full operation for the future ERF.
8 Note that the tonnage of 514,527 tonnes in Table 15 is for 2009 and therefore will not correspond to the tonnages used for modelling in this report. 9 As presented in the Eunomia NLWA WFM v8 ‘central recycling scenario’ for 2025/26. 10 Corresponding to a biogenic carbon content of 15.81 per cent (Approach 1) and 15.71 per cent (Approach 2). 11 Corresponding to hot water at 3 bar/134 degrees Celsius as in: CHPQA (2007). The Determination of Z Ratio, CHPQA Guide Note 28. Available at: https://www.chpqa.com/guidance_notes/GUIDANCE_NOTE_28.pdf (accessed 21st March 2014).
North London Waste Authority North London Heat and Power ProjectWRATE and Carbon Intensity Floor Modelling: Technical Report
Page 13 AD05.06 Appendix C | Issue | October 2015 | Arup
4 Methodology
4.1 Overview 4.1.1 The main analysis comprises of four main waste management scenarios,
all based on the assessment year of 2025/26 as follows: a. Scenario A: landfill comparator. This models sending all residual waste
collected by Constituent Boroughs to landfill, and represents a worst case scenario relative to the waste hierarchy in terms of management of the waste stream that the Applicant is responsible for.
b. Scenario B: current operations in 2025/26. This models sending residual waste collected by the Constituent Boroughs to the current EfW facility (540,000 tonnes or 94.26 per cent) as well as landfill (32,856 tonnes or 5.74 per cent), as per current operations but for the year 2025/26. Incinerator bottom ash (IBA) (including metals) from the EfW facility is recycled on-site and air pollution control residue (APCr) is stabilised before disposal in non-hazardous landfill.
c. Scenario C: future operations. This models sending all residual waste collected by the Constituent Boroughs to the new ERF, which would be operating in CHP mode with hot water being used as heat for a local heat distribution network. IBA (including metals) from the ERF would be recycled off-site, and APCr is stabilised before disposal in non-hazardous landfill.
d. Scenario D: alternative future operations. This models sending 50 per cent of residual waste (i.e. 286,428tpa) to landfill, and the other 50 per cent (i.e. 268,428tpa) of residual waste collected by the Constituent Boroughs to a materials recovery facility (MRF). It is assumed that the MRF extracts 90 per cent of ferrous and non-ferrous metals then shreds and bails the remaining 278,245 tonnes of waste into a low-density refuse derived fuel (RDF). This RDF is then exported to the Netherlands, where it is burnt for heat and power at the AEB EfW plant. The AEB EfW plant was selected as it is one of the largest merchant EfW plants in Europe, and it is an existing destination for RDF exported from the UK.
4.1.2 Scenarios A to D are outlined in Table 6.3 in Appendix A3. Four additional sensitivity analyses (1 to 4) for the main analysis were undertaken considering the effect of changing the following key modelling parameters: a. Sensitivity Analysis 1: changing the NCV. b. Sensitivity Analyses 2 and 3: changing the grid electricity mix to 2030
and 2035 respectively (against which energy generation in the scenario is offset).
c. Sensitivity Analysis 4: changing the amount of heat off-take from CHP for Scenario C to the CIF ‘tipping point’ (i.e. 12MWth).
4.1.3 Seven additional sensitivity analyses (5 to 11) for the main analysis were prepared considering the effect of changing the grid electricity mix. WRATE uses a baseline mix (against which electricity use for waste treatment e.g. the ERF is offset) and a marginal electricity mix (against which electricity

North London Waste Authority North London Heat and Power ProjectWRATE and Carbon Intensity Floor Modelling: Technical Report
Page 14 AD05.06 Appendix C | Issue | October 2015 | Arup
production from waste treatment e.g. the ERF or landfill is offset). Both the baseline and marginal electricity mix were amended as follows: a. Sensitivity Analyses 5, 6 and 7: changing the grid electricity mix to reflect
the DECC reference scenario for 2025, 2030 and 2035 respectively. b. Sensitivity Analyses 8, 9 and 10: changing the grid electricity mix to
reflect the National Grid ‘gone green’ scenario for 2025, 2030 and 2035 respectively.
c. Sensitivity Analysis 11: changing the electricity mix to reflect the default WRATE electricity mix for Netherlands generation in 2012.
4.1.4 All sensitivity analyses are summarised in Table 4.1. Table 4.1: Summary description of the main analysis and all sensitivity analyses
sensitivity description
Main Analysis The main analysis including waste management Scenarios A to D
Sensitivity 1: NCV NCV of the residual waste was reverted back to the WRATE default for the given NLWA waste composition, which is 8.54MJ/kg
Sensitivity 2: electricity mix 2030 Changing the grid electricity mix to 2030 (WRATE default) for the UK
Sensitivity 3: electricity mix 2035 Changing the grid electricity mix to 2035 (WRATE default) for the UK
Sensitivity 4: CIF tipping point Changing the amount of heat off-take from CHP for Scenario C to the CIF ‘tipping point’ (i.e. 12MWth)
Sensitivity 5: DECC electricity mix 2025 Changing the grid electricity mix to reflect the DECC reference scenario for 2025
Sensitivity 6: DECC electricity mix 2030 Changing the grid electricity mix to reflect the DECC reference scenario for 2030
Sensitivity 7: DECC electricity mix 2035 Changing the grid electricity mix to reflect the DECC reference scenario for 2035
Sensitivity 8: NG electricity mix 2025 Changing the grid electricity mix to reflect the National Grid ‘gone green’ scenario for 2025
Sensitivity 9: NG electricity mix 2030 Changing the grid electricity mix to reflect the National Grid ‘gone green’ scenario for 2030
Sensitivity 10: NG electricity mix 2035 Changing the grid electricity mix to reflect the National Grid ‘gone green’ scenario for 2035
Sensitivity 11: Netherlands electricity mix 2012 Changing the grid electricity mix to reflect the Netherlands (WRATE default) for 2012
4.1.5 All scenarios are described in more detail in Section 4.2 and modelling results are summarised in Table 4.2 and Table 4.3.
4.1.6 As stated above, the results in Table 4.2 are normalised using Eur.Person.Eq12. The WRATE modelling results shaded in red indicate the highest value for that indicator whereas results shaded in green indicate the lowest values. Lower values (including negative numbers) indicate a better net environmental performance. It can be seen that the future operations (Scenario C) of the proposed new ERF would have a significantly better
12 Characterised results are also presented in Appendix A7. Characterised results are calculated for each environmental indicator with findings presented in an appropriate common unit (i.e. through use of a reference substance such as kgCO2e for Global Warming Potential).
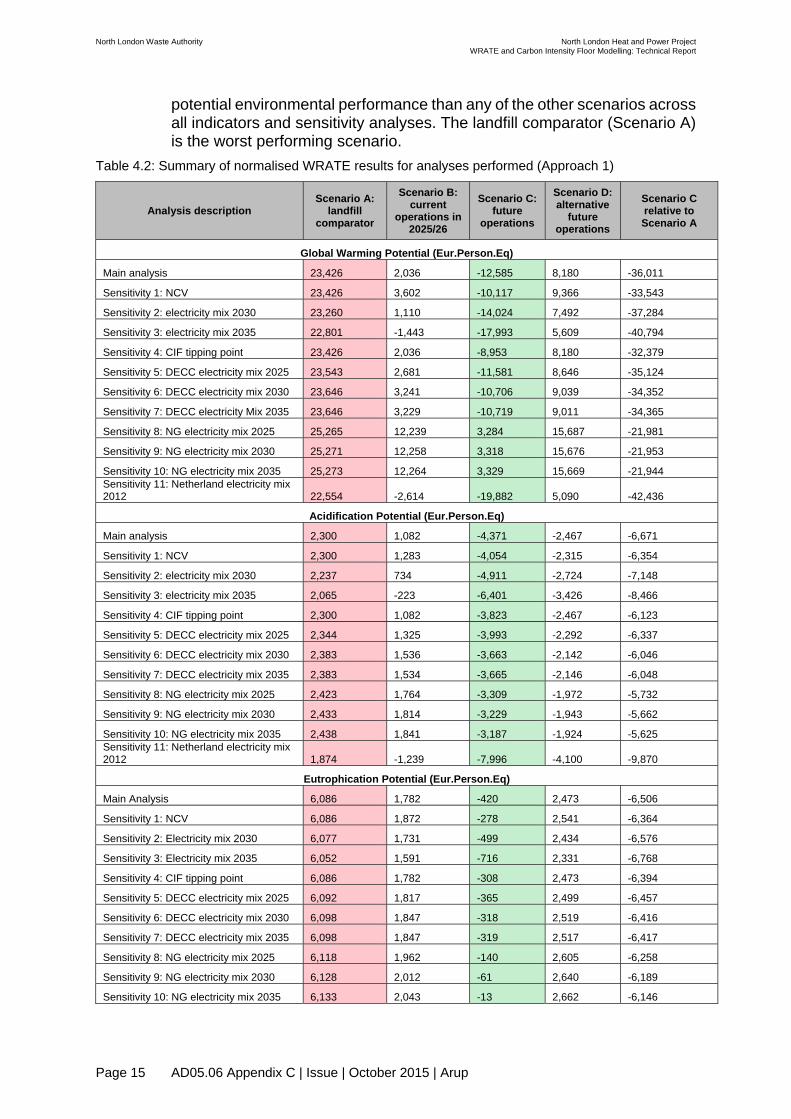
North London Waste Authority North London Heat and Power ProjectWRATE and Carbon Intensity Floor Modelling: Technical Report
Page 15 AD05.06 Appendix C | Issue | October 2015 | Arup
potential environmental performance than any of the other scenarios across all indicators and sensitivity analyses. The landfill comparator (Scenario A) is the worst performing scenario.
Table 4.2: Summary of normalised WRATE results for analyses performed (Approach 1)
Analysis description Scenario A:
landfill comparator
Scenario B: current
operations in 2025/26
Scenario C: future
operations
Scenario D: alternative
future operations
Scenario C relative to Scenario A
Global Warming Potential (Eur.Person.Eq)
Main analysis 23,426 2,036 -12,585 8,180 -36,011
Sensitivity 1: NCV 23,426 3,602 -10,117 9,366 -33,543
Sensitivity 2: electricity mix 2030 23,260 1,110 -14,024 7,492 -37,284
Sensitivity 3: electricity mix 2035 22,801 -1,443 -17,993 5,609 -40,794
Sensitivity 4: CIF tipping point 23,426 2,036 -8,953 8,180 -32,379
Sensitivity 5: DECC electricity mix 2025 23,543 2,681 -11,581 8,646 -35,124
Sensitivity 6: DECC electricity mix 2030 23,646 3,241 -10,706 9,039 -34,352
Sensitivity 7: DECC electricity Mix 2035 23,646 3,229 -10,719 9,011 -34,365
Sensitivity 8: NG electricity mix 2025 25,265 12,239 3,284 15,687 -21,981
Sensitivity 9: NG electricity mix 2030 25,271 12,258 3,318 15,676 -21,953
Sensitivity 10: NG electricity mix 2035 25,273 12,264 3,329 15,669 -21,944 Sensitivity 11: Netherland electricity mix 2012 22,554 -2,614 -19,882 5,090 -42,436
Acidification Potential (Eur.Person.Eq)
Main analysis 2,300 1,082 -4,371 -2,467 -6,671
Sensitivity 1: NCV 2,300 1,283 -4,054 -2,315 -6,354
Sensitivity 2: electricity mix 2030 2,237 734 -4,911 -2,724 -7,148
Sensitivity 3: electricity mix 2035 2,065 -223 -6,401 -3,426 -8,466
Sensitivity 4: CIF tipping point 2,300 1,082 -3,823 -2,467 -6,123
Sensitivity 5: DECC electricity mix 2025 2,344 1,325 -3,993 -2,292 -6,337
Sensitivity 6: DECC electricity mix 2030 2,383 1,536 -3,663 -2,142 -6,046
Sensitivity 7: DECC electricity mix 2035 2,383 1,534 -3,665 -2,146 -6,048
Sensitivity 8: NG electricity mix 2025 2,423 1,764 -3,309 -1,972 -5,732
Sensitivity 9: NG electricity mix 2030 2,433 1,814 -3,229 -1,943 -5,662
Sensitivity 10: NG electricity mix 2035 2,438 1,841 -3,187 -1,924 -5,625 Sensitivity 11: Netherland electricity mix 2012 1,874 -1,239 -7,996 -4,100 -9,870
Eutrophication Potential (Eur.Person.Eq)
Main Analysis 6,086 1,782 -420 2,473 -6,506
Sensitivity 1: NCV 6,086 1,872 -278 2,541 -6,364
Sensitivity 2: Electricity mix 2030 6,077 1,731 -499 2,434 -6,576
Sensitivity 3: Electricity mix 2035 6,052 1,591 -716 2,331 -6,768
Sensitivity 4: CIF tipping point 6,086 1,782 -308 2,473 -6,394
Sensitivity 5: DECC electricity mix 2025 6,092 1,817 -365 2,499 -6,457
Sensitivity 6: DECC electricity mix 2030 6,098 1,847 -318 2,519 -6,416
Sensitivity 7: DECC electricity mix 2035 6,098 1,847 -319 2,517 -6,417
Sensitivity 8: NG electricity mix 2025 6,118 1,962 -140 2,605 -6,258
Sensitivity 9: NG electricity mix 2030 6,128 2,012 -61 2,640 -6,189
Sensitivity 10: NG electricity mix 2035 6,133 2,043 -13 2,662 -6,146
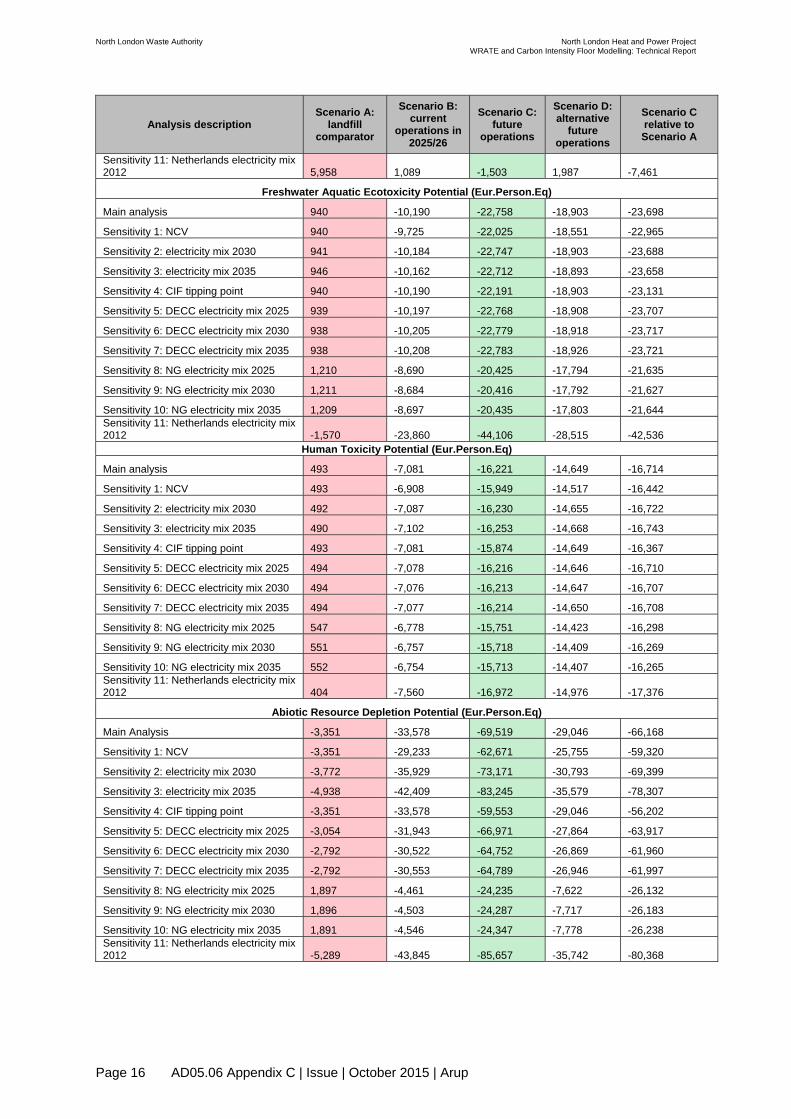
North London Waste Authority North London Heat and Power ProjectWRATE and Carbon Intensity Floor Modelling: Technical Report
Page 16 AD05.06 Appendix C | Issue | October 2015 | Arup
Analysis description Scenario A:
landfill comparator
Scenario B: current
operations in 2025/26
Scenario C: future
operations
Scenario D: alternative
future operations
Scenario C relative to Scenario A
Sensitivity 11: Netherlands electricity mix 2012 5,958 1,089 -1,503 1,987 -7,461
Freshwater Aquatic Ecotoxicity Potential (Eur.Person.Eq)
Main analysis 940 -10,190 -22,758 -18,903 -23,698
Sensitivity 1: NCV 940 -9,725 -22,025 -18,551 -22,965
Sensitivity 2: electricity mix 2030 941 -10,184 -22,747 -18,903 -23,688
Sensitivity 3: electricity mix 2035 946 -10,162 -22,712 -18,893 -23,658
Sensitivity 4: CIF tipping point 940 -10,190 -22,191 -18,903 -23,131
Sensitivity 5: DECC electricity mix 2025 939 -10,197 -22,768 -18,908 -23,707
Sensitivity 6: DECC electricity mix 2030 938 -10,205 -22,779 -18,918 -23,717
Sensitivity 7: DECC electricity mix 2035 938 -10,208 -22,783 -18,926 -23,721
Sensitivity 8: NG electricity mix 2025 1,210 -8,690 -20,425 -17,794 -21,635
Sensitivity 9: NG electricity mix 2030 1,211 -8,684 -20,416 -17,792 -21,627
Sensitivity 10: NG electricity mix 2035 1,209 -8,697 -20,435 -17,803 -21,644 Sensitivity 11: Netherlands electricity mix 2012 -1,570 -23,860 -44,106 -28,515 -42,536
Human Toxicity Potential (Eur.Person.Eq)
Main analysis 493 -7,081 -16,221 -14,649 -16,714
Sensitivity 1: NCV 493 -6,908 -15,949 -14,517 -16,442
Sensitivity 2: electricity mix 2030 492 -7,087 -16,230 -14,655 -16,722
Sensitivity 3: electricity mix 2035 490 -7,102 -16,253 -14,668 -16,743
Sensitivity 4: CIF tipping point 493 -7,081 -15,874 -14,649 -16,367
Sensitivity 5: DECC electricity mix 2025 494 -7,078 -16,216 -14,646 -16,710
Sensitivity 6: DECC electricity mix 2030 494 -7,076 -16,213 -14,647 -16,707
Sensitivity 7: DECC electricity mix 2035 494 -7,077 -16,214 -14,650 -16,708
Sensitivity 8: NG electricity mix 2025 547 -6,778 -15,751 -14,423 -16,298
Sensitivity 9: NG electricity mix 2030 551 -6,757 -15,718 -14,409 -16,269
Sensitivity 10: NG electricity mix 2035 552 -6,754 -15,713 -14,407 -16,265 Sensitivity 11: Netherlands electricity mix 2012 404 -7,560 -16,972 -14,976 -17,376
Abiotic Resource Depletion Potential (Eur.Person.Eq)
Main Analysis -3,351 -33,578 -69,519 -29,046 -66,168
Sensitivity 1: NCV -3,351 -29,233 -62,671 -25,755 -59,320
Sensitivity 2: electricity mix 2030 -3,772 -35,929 -73,171 -30,793 -69,399
Sensitivity 3: electricity mix 2035 -4,938 -42,409 -83,245 -35,579 -78,307
Sensitivity 4: CIF tipping point -3,351 -33,578 -59,553 -29,046 -56,202
Sensitivity 5: DECC electricity mix 2025 -3,054 -31,943 -66,971 -27,864 -63,917
Sensitivity 6: DECC electricity mix 2030 -2,792 -30,522 -64,752 -26,869 -61,960
Sensitivity 7: DECC electricity mix 2035 -2,792 -30,553 -64,789 -26,946 -61,997
Sensitivity 8: NG electricity mix 2025 1,897 -4,461 -24,235 -7,622 -26,132
Sensitivity 9: NG electricity mix 2030 1,896 -4,503 -24,287 -7,717 -26,183
Sensitivity 10: NG electricity mix 2035 1,891 -4,546 -24,347 -7,778 -26,238 Sensitivity 11: Netherlands electricity mix 2012 -5,289 -43,845 -85,657 -35,742 -80,368

North London Waste Authority North London Heat and Power ProjectWRATE and Carbon Intensity Floor Modelling: Technical Report
Page 17 AD05.06 Appendix C | Issue | October 2015 | Arup
4.1.7 In Table 4.3, CIF modelling results shaded in red indicate that the CIF (400gCO2e/kWh upper limit) has been exceeded and results shaded in green indicate that the CIF is being met. It can be seen that the new ERF (Scenario C) would meet the CIF under all sensitivity analyses. Scenario D does not meet the CIF, which is due to the relatively low heat and power output of the AEB EfW plant in the Netherlands. It is also important to note that the CIF excludes the impact of sending waste to landfill in Scenario D. Current operations (Scenario B) would fail to meet the CIF in 2025/26. Sensitivity Analyses 5 to 11 (i.e. modelling alternative DECC, NG and the Netherlands electricity generation mixes) have not been modelled under Approach 2 as they would give the same results as Analyses 2 and 3. This is because the CIF does not take into account energy offset.
Table 4.3: Summary of performance against the CIF in gCO2e/kWh (Approach 2)
Analyses description
Scenario A: landfill comparator
Scenario B: current operations in 2025/26
Scenario C: future operations
Scenario D: alternative future operations
Main analysis n/a 708.7 301.7 502.5
Sensitivity 1: NCV n/a 829.8 332.1 588.3
Sensitivity 2: electricity mix 2030 n/a 708.7 301.7 502.5
Sensitivity 3: electricity mix 2035 n/a 708.7 301.7 502.5
Sensitivity 4: CIF tipping point n/a 708.7 399.6 502.5

North London Waste Authority North London Heat and Power ProjectWRATE and Carbon Intensity Floor Modelling: Technical Report
Page 18 AD05.06 Appendix C | Issue | October 2015 | Arup
4.2 Approach 1: WRATE Scenario A: landfill comparator
4.2.1 Scenario A (see Figure 4.1) is a worst case scenario where 100 per cent of the 572,856 tonnes of residual waste is sent to landfill, using the proportions, transport processes and distances in Table 4.4 that reflect the same arrangement as residual waste sent to landfill under current operation (Scenario B).
Figure 4.1: Schematic of Scenario A
4.2.2 In reality, residual waste is sent to a total of six different landfills via various routes, however for simplicity only the three main routes (and two landfills) were modelled as this accounts for over 97 per cent of waste to landfill (by weight) under current operation.
Table 4.4: Proportion and transport of waste to landfill
Origin Tonnes (% of total)
Transport process (process ID)
A to B transport distance
Road split Destination
From Hornsey Street
60,379 tonnes (10.54%)
Intermodal road transport v3 (ID#12026)
128km Urban:33%, Rural: 33%, Motorway: 34%
Cranford Landfill
From Edmonton EcoPark BWRF
122,649 tonnes (21.41%)
Intermodal road transport v3 (ID#12026)
130km Urban:33%, Rural: 33%, Motorway: 34%
Cranford Landfill
From Hendon 389,829 tonnes (68.05%)
Rail transport (ID#12072)
96km N/A Brackley Lane Landfill

North London Waste Authority North London Heat and Power ProjectWRATE and Carbon Intensity Floor Modelling: Technical Report
Page 19 AD05.06 Appendix C | Issue | October 2015 | Arup
4.2.3 Table 4.5 shows the modelling parameters used for the two landfills. It is
unknown what the landfill gas (LFG) collection efficiency is at each site, therefore 50 per cent has been assumed as a reasonably conservative collection efficiency.
Table 4.5: Modelling parameters for landfill
Landfill Process Liner and cap type Energy recovery
Cranford Landfill Flexible landfill 5,000,000 tonnes (ID#11256)
Liner: Clay, Cap: HDPE (High Density Polyethylene)
Energy recovery from LFG at 50% gas collection efficiency
Brackley Lane Landfill Flexible landfill 5,000,000 tonnes (ID#11256)
Liner: Clay, Cap: Clay
Energy recovery from LFG at 50% gas collection efficiency
Scenario B: Current operations in 2025/26
4.2.4 Scenario B (Figure 4.2) represents the current operation of the existing EfW facility at the Edmonton EcoPark in the year 2025/26. A total of 540,000 tonnes of waste is sent to the current EfW facility, with the remainder (i.e. 32,856 tonnes) sent to landfill. The landfill and associated transport is the same as per Scenario A, with the same proportions of waste. The current EfW facility is modelled using a user defined process (UDP) based on the default ‘Flexible Energy from Waste Process V3’ (ID#21849). The gross power efficiency has been set at 19.5 per cent (as a midpoint between the typical operating range of 19 to 20 per cent) resulting in a net power output of around 33MWe. The flue gas cleaning system has been modelled as dry (the best fit for the ‘semi-dry’ system in use) and the reduction type as selective non-catalytic reduction.
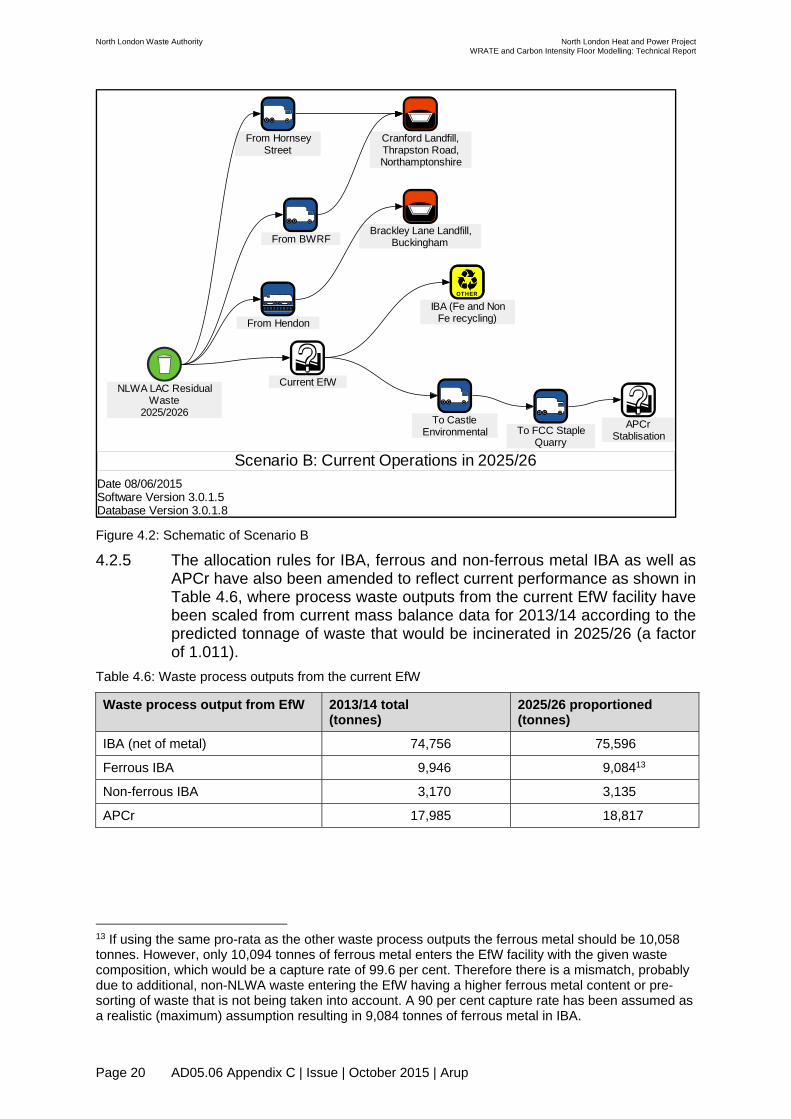
North London Waste Authority North London Heat and Power ProjectWRATE and Carbon Intensity Floor Modelling: Technical Report
Page 20 AD05.06 Appendix C | Issue | October 2015 | Arup
Figure 4.2: Schematic of Scenario B
4.2.5 The allocation rules for IBA, ferrous and non-ferrous metal IBA as well as APCr have also been amended to reflect current performance as shown in Table 4.6, where process waste outputs from the current EfW facility have been scaled from current mass balance data for 2013/14 according to the predicted tonnage of waste that would be incinerated in 2025/26 (a factor of 1.011).
Table 4.6: Waste process outputs from the current EfW
Waste process output from EfW 2013/14 total (tonnes)
2025/26 proportioned (tonnes)
IBA (net of metal) 74,756 75,596
Ferrous IBA 9,946 9,08413
Non-ferrous IBA 3,170 3,135
APCr 17,985 18,817
13 If using the same pro-rata as the other waste process outputs the ferrous metal should be 10,058 tonnes. However, only 10,094 tonnes of ferrous metal enters the EfW facility with the given waste composition, which would be a capture rate of 99.6 per cent. Therefore there is a mismatch, probably due to additional, non-NLWA waste entering the EfW having a higher ferrous metal content or pre-sorting of waste that is not being taken into account. A 90 per cent capture rate has been assumed as a realistic (maximum) assumption resulting in 9,084 tonnes of ferrous metal in IBA.
Scenario B: Current Operations in 2025/26
Brackley Lane Landfill,Buckingham
OTHEROTHER
IBA (Fe and NonFe recycling)
Cranford Landfill,Thrapston Road,Northamptonshire
From Hendon
From HornseyStreet
From BWRF
To CastleEnvironmental To FCC Staple
Quarry
APCrStablisation
Current EfWNLWA LAC ResidualWaste
2025/2026
Date 08/06/2015 Software Version 3.0.1.5 Database Version 3.0.1.8

North London Waste Authority North London Heat and Power ProjectWRATE and Carbon Intensity Floor Modelling: Technical Report
Page 21 AD05.06 Appendix C | Issue | October 2015 | Arup
4.2.6 As the current EfW facility does not collect any metal at the grate, all ferrous and non-ferrous metal capture is assumed to be via IBA processing.
4.2.7 All other EfW process parameters reflect the default WRATE process. 4.2.8 As there is no default WRATE process that models APCr
recycling/stabilisation, APCr stabilisation is modelled using a UDP based on a ‘waste minimisation’ process, where the restriction on sending APCr to such a process has been removed. This process essentially removes the APCr from the model without any associated impact. Therefore the only impacts associated with the APCr stabilisation are the transport impacts to Castle Environmental and FCC Staple Quarry. This is a reasonable assumption as the alternative would be to send all APCr to hazardous landfill, which would result in a reduced environmental performance14. The transport is modelled ‘before’ the APCr stabilisation as WRATE does not allow onward transport from a waste minimisation process.
4.2.9 Refer to Table 6.3 to Table 6.7 in Appendix A3 for more information on the parameters used as well as the mass and energy balance.
Scenario C: Future operations
4.2.10 Scenario C (Figure 4.3) reflects future operations where all residual waste would be treated at the new ERF. The new ERF is modelled using a UDP based on the ‘Flexible Energy from Waste Process v3’. Net heat and power efficiencies have been amended to 17.09 per cent and 25.71 per cent respectively. Under this scenario, 34MWth would be provided to a local domestic heat distribution network with a corresponding 57MWe of power output. Nitrous Oxide (NOx) emissions have been amended to reflect a proposed environmental permit limit of 80mg/Nm3. All other emissions to air reflect the default process data and allocation when selective catalytic reduction and a wet flue gas treatment system is in place.
14 A check was modelled in WRATE, and APCr sent to landfill does not result in any change in environmental performance with regards to global warming potential. However APCr sent to landfill within WRATE does result in a small reduction in environmental performance in relation to eutrophication potential, freshwater aquatic ecotoxicity potential and human toxicity potential. As WRATE models APCr as hazardous by default, and the APCr is stabilised to be non-hazardous in Scenario B and C before disposal to non-hazardous landfill, it is reasonable to model APCr via waste minimisation.
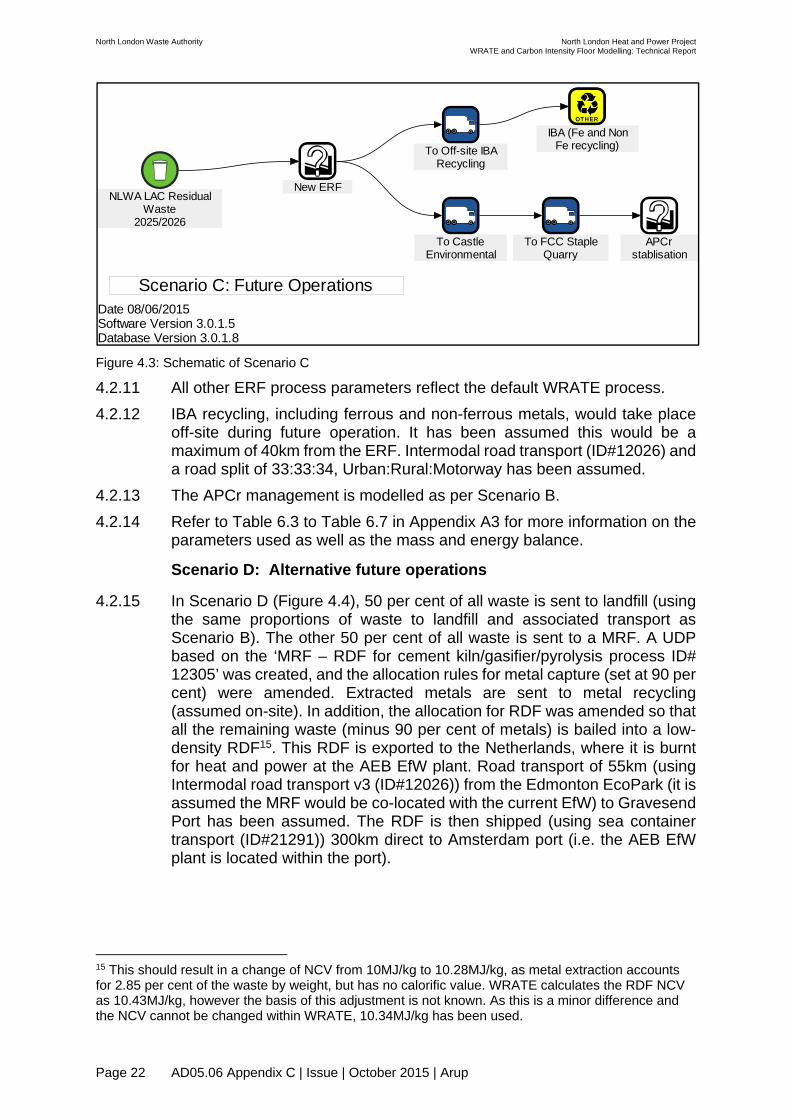
North London Waste Authority North London Heat and Power ProjectWRATE and Carbon Intensity Floor Modelling: Technical Report
Page 22 AD05.06 Appendix C | Issue | October 2015 | Arup
Figure 4.3: Schematic of Scenario C
4.2.11 All other ERF process parameters reflect the default WRATE process. 4.2.12 IBA recycling, including ferrous and non-ferrous metals, would take place
off-site during future operation. It has been assumed this would be a maximum of 40km from the ERF. Intermodal road transport (ID#12026) and a road split of 33:33:34, Urban:Rural:Motorway has been assumed.
4.2.13 The APCr management is modelled as per Scenario B. 4.2.14 Refer to Table 6.3 to Table 6.7 in Appendix A3 for more information on the
parameters used as well as the mass and energy balance.
Scenario D: Alternative future operations
4.2.15 In Scenario D (Figure 4.4), 50 per cent of all waste is sent to landfill (using the same proportions of waste to landfill and associated transport as Scenario B). The other 50 per cent of all waste is sent to a MRF. A UDP based on the ‘MRF – RDF for cement kiln/gasifier/pyrolysis process ID# 12305’ was created, and the allocation rules for metal capture (set at 90 per cent) were amended. Extracted metals are sent to metal recycling (assumed on-site). In addition, the allocation for RDF was amended so that all the remaining waste (minus 90 per cent of metals) is bailed into a low-density RDF15. This RDF is exported to the Netherlands, where it is burnt for heat and power at the AEB EfW plant. Road transport of 55km (using Intermodal road transport v3 (ID#12026)) from the Edmonton EcoPark (it is assumed the MRF would be co-located with the current EfW) to Gravesend Port has been assumed. The RDF is then shipped (using sea container transport (ID#21291)) 300km direct to Amsterdam port (i.e. the AEB EfW plant is located within the port).
15 This should result in a change of NCV from 10MJ/kg to 10.28MJ/kg, as metal extraction accounts for 2.85 per cent of the waste by weight, but has no calorific value. WRATE calculates the RDF NCV as 10.43MJ/kg, however the basis of this adjustment is not known. As this is a minor difference and the NCV cannot be changed within WRATE, 10.34MJ/kg has been used.
Scenario C: Future Operations
OTHEROTHER
IBA (Fe and NonFe recycling)
New ERF
To CastleEnvironmental
To FCC StapleQuarry
APCrstablisation
To Off-site IBARecycling
NLWA LAC ResidualWaste
2025/2026
Date 08/06/2015 Software Version 3.0.1.5 Database Version 3.0.1.8
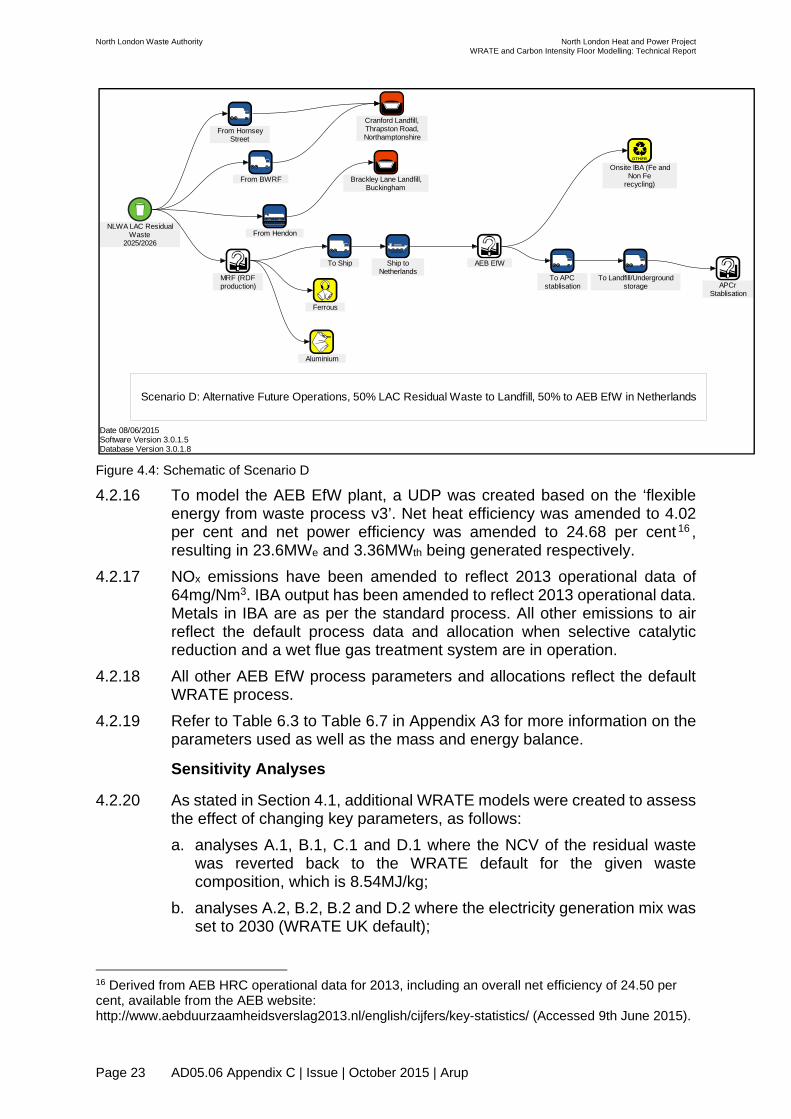
North London Waste Authority North London Heat and Power ProjectWRATE and Carbon Intensity Floor Modelling: Technical Report
Page 23 AD05.06 Appendix C | Issue | October 2015 | Arup
Figure 4.4: Schematic of Scenario D
4.2.16 To model the AEB EfW plant, a UDP was created based on the ‘flexible energy from waste process v3’. Net heat efficiency was amended to 4.02 per cent and net power efficiency was amended to 24.68 per cent 16 , resulting in 23.6MWe and 3.36MWth being generated respectively.
4.2.17 NOx emissions have been amended to reflect 2013 operational data of 64mg/Nm3. IBA output has been amended to reflect 2013 operational data. Metals in IBA are as per the standard process. All other emissions to air reflect the default process data and allocation when selective catalytic reduction and a wet flue gas treatment system are in operation.
4.2.18 All other AEB EfW process parameters and allocations reflect the default WRATE process.
4.2.19 Refer to Table 6.3 to Table 6.7 in Appendix A3 for more information on the parameters used as well as the mass and energy balance.
Sensitivity Analyses
4.2.20 As stated in Section 4.1, additional WRATE models were created to assess the effect of changing key parameters, as follows: a. analyses A.1, B.1, C.1 and D.1 where the NCV of the residual waste
was reverted back to the WRATE default for the given waste composition, which is 8.54MJ/kg;
b. analyses A.2, B.2, B.2 and D.2 where the electricity generation mix was set to 2030 (WRATE UK default);
16 Derived from AEB HRC operational data for 2013, including an overall net efficiency of 24.50 per cent, available from the AEB website: http://www.aebduurzaamheidsverslag2013.nl/english/cijfers/key-statistics/ (Accessed 9th June 2015).
Scenario D: Alternative Future Operations, 50% LAC Residual Waste to Landfill, 50% to AEB EfW in Netherlands
Cranford Landfill,Thrapston Road,Northamptonshire
OTHEROTHER
Onsite IBA (Fe andNon Fe
recycling)
From HornseyStreet
From Hendon
From BWRF Brackley Lane Landfill,Buckingham
To APCstablisation
To Landfill/Undergroundstorage APCr
Stablisation
AEB EfWTo Ship
Ferrous
Aluminium
Ship toNetherlands
MRF (RDFproduction)
NLWA LAC ResidualWaste
2025/2026
Date 08/06/2015 Software Version 3.0.1.5 Database Version 3.0.1.8

North London Waste Authority North London Heat and Power ProjectWRATE and Carbon Intensity Floor Modelling: Technical Report
Page 24 AD05.06 Appendix C | Issue | October 2015 | Arup
c. analyses A.3, B.3, C.3 and D.3 where the electricity generation mix was set to 203517 (WRATE UK default); and
d. analyses A.4, B.4, C.4 and D.4 where the heat output was changed to 12MWth18 as the ‘tipping point’ where Scenario C would no longer meet the CIF with any less heat output.
4.2.21 Refer to Table 6.3 to Table 6.7 in Appendix A3 for more information on the parameters used as well as the mass and energy balance. Refer to Appendix A4 for the default UK WRATE electricity mixes.
Electricity generation mix sensitivity analyses
4.2.22 Six additional electricity generation mix sensitivity analyses were also modelled to assess how this may affect the environmental performance. a. Analyses A.5 to A.7, B.5 to B.7, C.5 to C.7 and D.5 to D.7 where the
baseline and marginal electricity mix were changed to reflect the DECC reference scenario. Due to differences in the WRATE and DECC electricity source categorisation, it has been assumed that coal and gas with carbon capture and storage (CCS) as well as natural gas in the DECC projection is equivalent to combined cycle gas turbine (CCGT) electricity generation in WRATE. The relative proportion of types of renewable electricity generation was kept the same as the WRATE default, but the overall percentage of renewables was amended to reflect the DECC scenario. The DECC projection was modelled in order to represent a less carbon intensive future projection (i.e. less electricity generation from coal compared to the default WRATE electricity mix).
b. Analyses A.8 to A.10, B.8 to B.10, C.8 to C.10 and D.8 to D.10 where the baseline electricity mix was changed to reflect the National Grid ‘gone green’ scenario. Due to differences in the WRATE and NG electricity source categorisation, it has been assumed that coal and gas with CCS and natural gas is equivalent to CCGT electricity generation in WRATE. The marginal mix was changed to reflect the proportions of renewables in the ‘gone green’ scenario. The NG projection was modelled as it is thought to represent the most optimistic scenario in terms of renewable energy for the future electricity generation mix, and would therefore represent the smallest carbon offset relative to the new ERF, which is a conservative assumption.
c. Analyses A.11, B.11, C.11 and D.11 where the baseline and marginal mix were changed to the default WRATE mix for the Netherlands in 2012 (the most recent year available), as the AEB EfW plant is located in Amsterdam and would therefore offset against a Netherlands grid electricity mix.
4.2.23 Refer to Table 6.3 to Table 6.7 in Appendix A3 for more information on the parameters used as well as the mass and energy balance. Refer to
17 2035 is the furthest year into the future that WRATE includes a projected electricity mix for. At the time of writing and as far as Arup are aware, there are no published projections for electricity mix past the year 2035 available from any other established sources (e.g. DECC). 18 This has decreased from the previously identified ‘tipping point’ of 17MWth in the previous work as the modelling parameters (e.g. tonnage decrease) have changed.

North London Waste Authority North London Heat and Power ProjectWRATE and Carbon Intensity Floor Modelling: Technical Report
Page 25 AD05.06 Appendix C | Issue | October 2015 | Arup
Appendices A4, A5 and A6 for the Netherlands, DECC and NG energy mixes.
4.3 Approach 2: Mayor of London GHG Calculator 4.3.1 The second modelling approach used the Mayor of London’s GHG
Calculator for municipal solid waste (v2.1)19 to model all the Scenarios outlined in Section 2.2, with the exception of Scenario A (as landfill and transport emissions are not included in the CIF calculation so benchmarking against the CIF is not applicable. Also the CIF does not take into account any offset for energy generation, therefore sensitivity analyses 2, 3 and 5 to 11 have the same results as the main analysis. The GHG Calculator is a MS Excel spreadsheet tool that has been developed to assist London local authorities in assessing GHG emissions when procuring new waste services. Using this tool on the Applicants behalf, all the scenarios were modelled by inputting waste tonnage, waste composition, and gross efficiencies for electricity and heat generation (see Table 6.3 to Table 6.7 in Appendix A3) under the ‘incineration process’. NCV was user defined, based on Table 6.1 in Appendix A2.
19 Available on the Greater London Authority website at: http://www.london.gov.uk/priorities/environment/putting-waste-good-use/making-the-most-of-waste (accessed 21st March 2014).

North London Waste Authority North London Heat and Power ProjectWRATE and Carbon Intensity Floor Modelling: Technical Report
Page 26 AD05.06 Appendix C | Issue | October 2015 | Arup
5 Modelling results
5.1 Overview 5.1.1 All modelling results from Approaches 1 and 2 are provided in Table 6.18
to in Appendix A7, discussed in Sections 5.2 and 5.3.
5.2 Environmental indicators (Approach 1) Main analysis (Approach 1)
5.2.1 The six default environmental indicators are described in Section 2.1.4. 5.2.2 As stated in Section 2.1, negative results represent an avoided (or
displaced) impact, and therefore a benefit, whereas positive results represent a created impact, and therefore a dis-benefit. Therefore negative results represent a net improved environmental performance, and positive results represent a net reduced environmental performance. Figure 5.1 shows the environmental indicators for the main analysis Scenarios (A to D), normalised so that they all represent the same unit of a European Person Equivalent (the functional unit being the impact one ‘European Person’ would have over the course of a year) and therefore compared to each other. The environmental indicators are also in their characterised form (e.g. kgCO2e for GWP) in Appendix A7.

North London Waste Authority North London Heat and Power ProjectWRATE and Carbon Intensity Floor Modelling: Technical Report
Page 27 AD05.06 Appendix C | Issue | October 2015 | Arup
5.2.3 It can be seen from Figure 5.1 that the future operations (Scenario C) has the best potential environmental performance across all six environmental indicators when compared with the other three scenarios (a negative result indicates a lower potential environmental impact from its operation).
Figure 5.1: Normalised environmental indicators for scenarios A to D (main analysis)
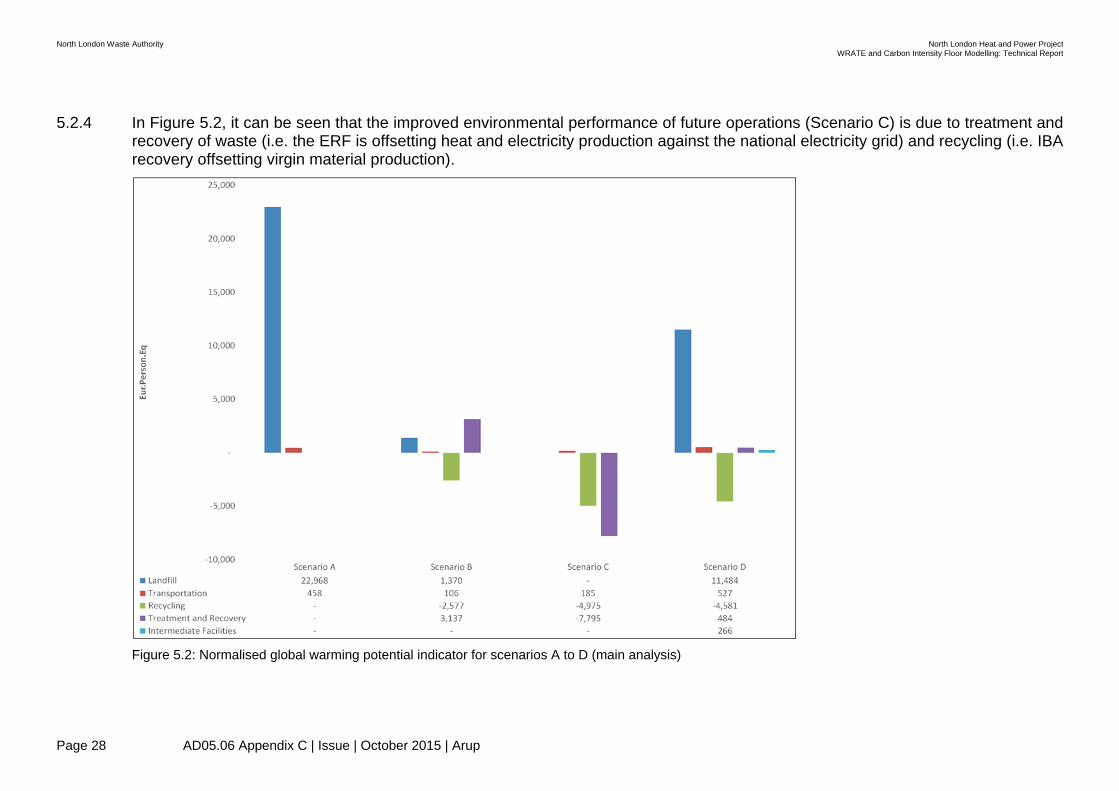
North London Waste Authority North London Heat and Power ProjectWRATE and Carbon Intensity Floor Modelling: Technical Report
Page 28 AD05.06 Appendix C | Issue | October 2015 | Arup
5.2.4 In Figure 5.2, it can be seen that the improved environmental performance of future operations (Scenario C) is due to treatment and recovery of waste (i.e. the ERF is offsetting heat and electricity production against the national electricity grid) and recycling (i.e. IBA recovery offsetting virgin material production).
Figure 5.2: Normalised global warming potential indicator for scenarios A to D (main analysis)
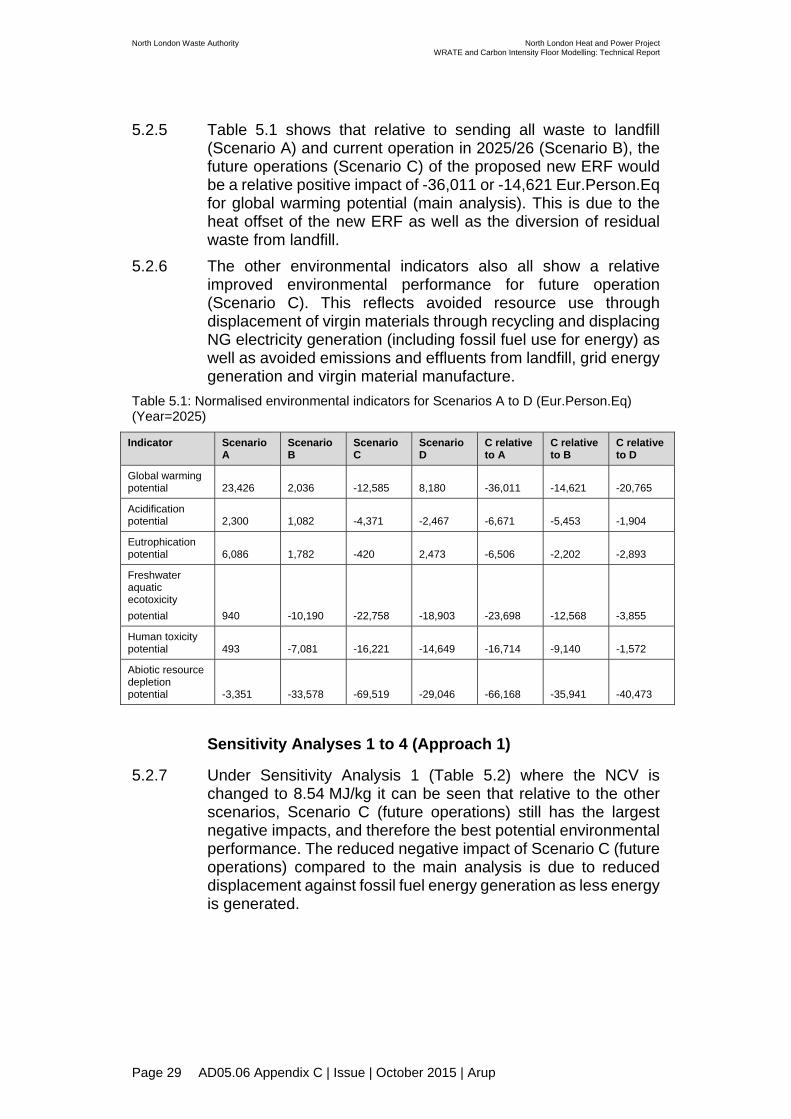
North London Waste Authority North London Heat and Power ProjectWRATE and Carbon Intensity Floor Modelling: Technical Report
Page 29 AD05.06 Appendix C | Issue | October 2015 | Arup
5.2.5 Table 5.1 shows that relative to sending all waste to landfill (Scenario A) and current operation in 2025/26 (Scenario B), the future operations (Scenario C) of the proposed new ERF would be a relative positive impact of -36,011 or -14,621 Eur.Person.Eq for global warming potential (main analysis). This is due to the heat offset of the new ERF as well as the diversion of residual waste from landfill.
5.2.6 The other environmental indicators also all show a relative improved environmental performance for future operation (Scenario C). This reflects avoided resource use through displacement of virgin materials through recycling and displacing NG electricity generation (including fossil fuel use for energy) as well as avoided emissions and effluents from landfill, grid energy generation and virgin material manufacture.
Table 5.1: Normalised environmental indicators for Scenarios A to D (Eur.Person.Eq) (Year=2025)
Indicator Scenario A
Scenario B
Scenario C
Scenario D
C relative to A
C relative to B
C relative to D
Global warming potential 23,426 2,036 -12,585 8,180 -36,011 -14,621 -20,765
Acidification potential 2,300 1,082 -4,371 -2,467 -6,671 -5,453 -1,904
Eutrophication potential 6,086 1,782 -420 2,473 -6,506 -2,202 -2,893
Freshwater aquatic ecotoxicity potential 940 -10,190 -22,758 -18,903 -23,698 -12,568 -3,855
Human toxicity potential 493 -7,081 -16,221 -14,649 -16,714 -9,140 -1,572
Abiotic resource depletion potential -3,351 -33,578 -69,519 -29,046 -66,168 -35,941 -40,473
Sensitivity Analyses 1 to 4 (Approach 1)
5.2.7 Under Sensitivity Analysis 1 (Table 5.2) where the NCV is changed to 8.54 MJ/kg it can be seen that relative to the other scenarios, Scenario C (future operations) still has the largest negative impacts, and therefore the best potential environmental performance. The reduced negative impact of Scenario C (future operations) compared to the main analysis is due to reduced displacement against fossil fuel energy generation as less energy is generated.
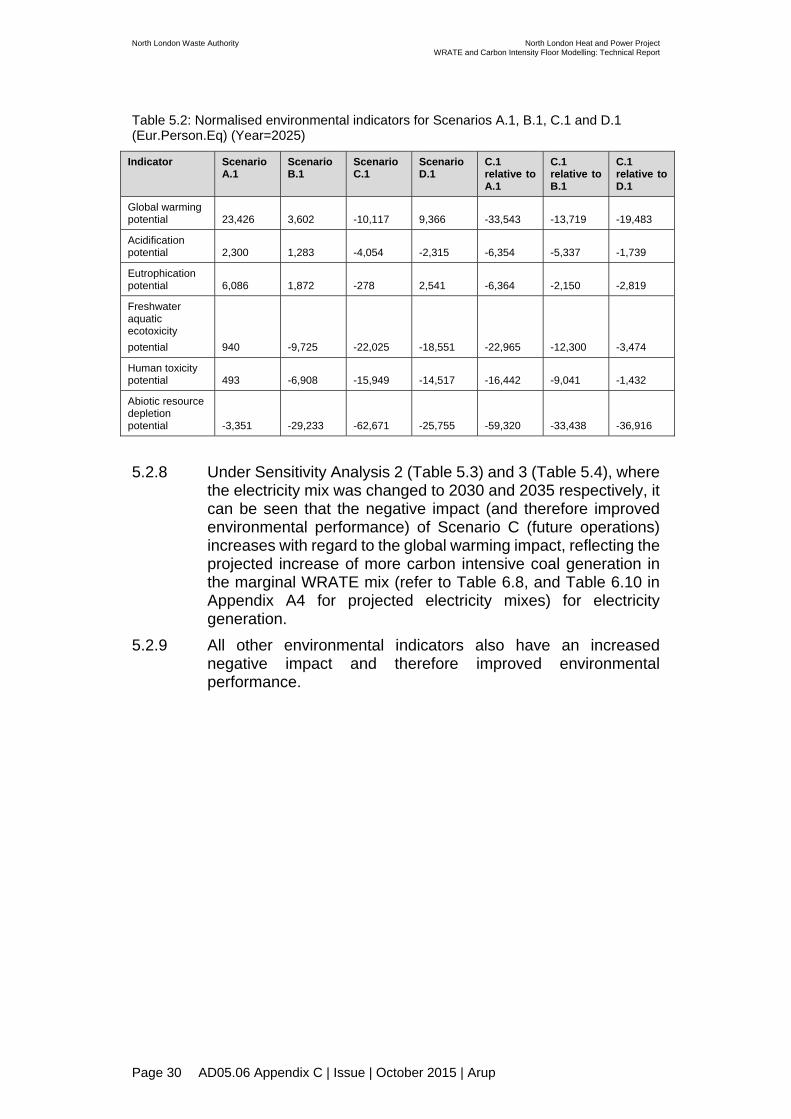
North London Waste Authority North London Heat and Power ProjectWRATE and Carbon Intensity Floor Modelling: Technical Report
Page 30 AD05.06 Appendix C | Issue | October 2015 | Arup
Table 5.2: Normalised environmental indicators for Scenarios A.1, B.1, C.1 and D.1 (Eur.Person.Eq) (Year=2025)
Indicator Scenario A.1
Scenario B.1
Scenario C.1
Scenario D.1
C.1 relative to A.1
C.1 relative to B.1
C.1 relative to D.1
Global warming potential 23,426 3,602 -10,117 9,366 -33,543 -13,719 -19,483
Acidification potential 2,300 1,283 -4,054 -2,315 -6,354 -5,337 -1,739
Eutrophication potential 6,086 1,872 -278 2,541 -6,364 -2,150 -2,819
Freshwater aquatic ecotoxicity potential 940 -9,725 -22,025 -18,551 -22,965 -12,300 -3,474
Human toxicity potential 493 -6,908 -15,949 -14,517 -16,442 -9,041 -1,432
Abiotic resource depletion potential -3,351 -29,233 -62,671 -25,755 -59,320 -33,438 -36,916
5.2.8 Under Sensitivity Analysis 2 (Table 5.3) and 3 (Table 5.4), where
the electricity mix was changed to 2030 and 2035 respectively, it can be seen that the negative impact (and therefore improved environmental performance) of Scenario C (future operations) increases with regard to the global warming impact, reflecting the projected increase of more carbon intensive coal generation in the marginal WRATE mix (refer to Table 6.8, and Table 6.10 in Appendix A4 for projected electricity mixes) for electricity generation.
5.2.9 All other environmental indicators also have an increased negative impact and therefore improved environmental performance.

North London Waste Authority North London Heat and Power ProjectWRATE and Carbon Intensity Floor Modelling: Technical Report
Page 31 AD05.06 Appendix C | Issue | October 2015 | Arup
Table 5.3: Normalised environmental indicators for Scenarios A.2, B.2, C.2 and D.2 (Eur.Person.Eq) (Year=2030)
Indicator Scenario A.2
Scenario B.2
Scenario C.2
Scenario D.2
C.2 relative to A.2
C.2 relative to B.2
C.2 relative to D.2
Global warming potential 23,260 1,110 -14,024 7,492 -37,284 -15,134 -21,516
Acidification potential 2,237 734 -4,911 -2,724 -7,148 -5,645 -2,187
Eutrophication potential 6,077 1,731 -499 2,434 -6,576 -2,230 -2,933
Freshwater aquatic ecotoxicity potential 941 -10,184 -22,747 -18,903 -23,688 -12,563 -3,844
Human toxicity potential 492 -7,087 -16,230 -14,655 -16,722 -9,143 -1,575
Abiotic resource depletion potential -3,772 -35,929 -73,171 -30,793 -69,399 -37,242 -42,378
Table 5.4: Normalised environmental indicators for Scenarios A.3, B.3, C.3 and D.3 (Eur.Person.Eq) (Year=2035)
Indicator Scenario A.3
Scenario B.3
Scenario C.3
Scenario D.3
C.3 relative to A.3
C.3 relative to B.3
C.3 relative to D.3
Global warming potential 22,801 -1,443 -17,993 5,609 -40,794 -16,550 -23,602
Acidification potential 2,065 -223 -6,401 -3,426 -8,466 -6,178 -2,975
Eutrophication potential 6,052 1,591 -716 2,331 -6,768 -2,307 -3,047
Freshwater aquatic ecotoxicity potential 946 -10,162 -22,712 -18,893 -23,658 -12,550 -3,819
Human toxicity potential 490 -7,102 -16,253 -14,668 -16,743 -9,151 -1,585
Abiotic resource depletion potential -4,938 -42,409 -83,245 -35,579 -78,307 -40,836 -47,666
5.2.10 Under Sensitivity Analysis 4 (i.e. a reduction of heat output to the
CIF tipping point of 12MWth) in Table 5.5, it can be seen that relative to the landfill comparator (Scenario A) and current operations (Scenario B), the magnitude of the negative impact of the future operations (Scenario C) decreases relative to the main analysis, although it still has an environmental performance benefit across all environmental indicators. This reflects the decreased heat displacement against grid energy generation.
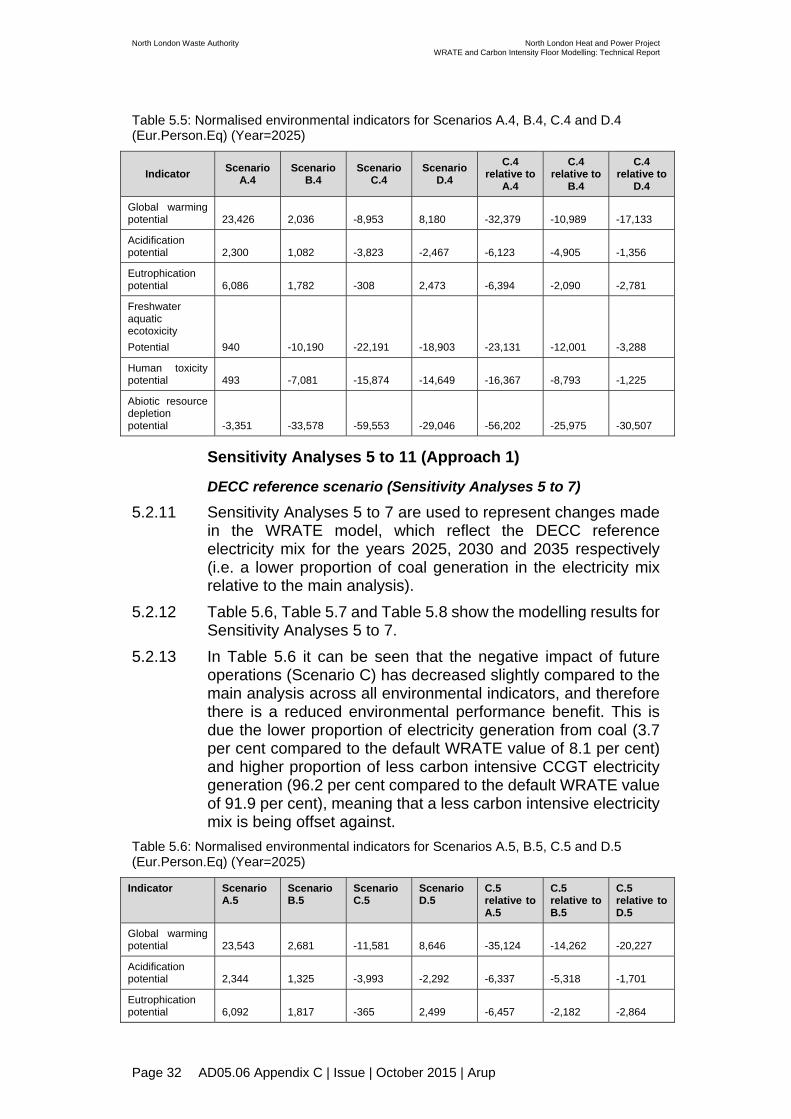
North London Waste Authority North London Heat and Power ProjectWRATE and Carbon Intensity Floor Modelling: Technical Report
Page 32 AD05.06 Appendix C | Issue | October 2015 | Arup
Table 5.5: Normalised environmental indicators for Scenarios A.4, B.4, C.4 and D.4 (Eur.Person.Eq) (Year=2025)
Indicator Scenario A.4
Scenario B.4
Scenario C.4
Scenario D.4
C.4 relative to
A.4
C.4 relative to
B.4
C.4 relative to
D.4
Global warming potential 23,426 2,036 -8,953 8,180 -32,379 -10,989 -17,133
Acidification potential 2,300 1,082 -3,823 -2,467 -6,123 -4,905 -1,356
Eutrophication potential 6,086 1,782 -308 2,473 -6,394 -2,090 -2,781
Freshwater aquatic ecotoxicity Potential 940 -10,190 -22,191 -18,903 -23,131 -12,001 -3,288
Human toxicity potential 493 -7,081 -15,874 -14,649 -16,367 -8,793 -1,225
Abiotic resource depletion potential -3,351 -33,578 -59,553 -29,046 -56,202 -25,975 -30,507
Sensitivity Analyses 5 to 11 (Approach 1)
DECC reference scenario (Sensitivity Analyses 5 to 7)
5.2.11 Sensitivity Analyses 5 to 7 are used to represent changes made in the WRATE model, which reflect the DECC reference electricity mix for the years 2025, 2030 and 2035 respectively (i.e. a lower proportion of coal generation in the electricity mix relative to the main analysis).
5.2.12 Table 5.6, Table 5.7 and Table 5.8 show the modelling results for Sensitivity Analyses 5 to 7.
5.2.13 In Table 5.6 it can be seen that the negative impact of future operations (Scenario C) has decreased slightly compared to the main analysis across all environmental indicators, and therefore there is a reduced environmental performance benefit. This is due the lower proportion of electricity generation from coal (3.7 per cent compared to the default WRATE value of 8.1 per cent) and higher proportion of less carbon intensive CCGT electricity generation (96.2 per cent compared to the default WRATE value of 91.9 per cent), meaning that a less carbon intensive electricity mix is being offset against.
Table 5.6: Normalised environmental indicators for Scenarios A.5, B.5, C.5 and D.5 (Eur.Person.Eq) (Year=2025)
Indicator Scenario A.5
Scenario B.5
Scenario C.5
Scenario D.5
C.5 relative to A.5
C.5 relative to B.5
C.5 relative to D.5
Global warming potential 23,543 2,681 -11,581 8,646 -35,124 -14,262 -20,227
Acidification potential 2,344 1,325 -3,993 -2,292 -6,337 -5,318 -1,701
Eutrophication potential 6,092 1,817 -365 2,499 -6,457 -2,182 -2,864

North London Waste Authority North London Heat and Power ProjectWRATE and Carbon Intensity Floor Modelling: Technical Report
Page 33 AD05.06 Appendix C | Issue | October 2015 | Arup
Indicator Scenario A.5
Scenario B.5
Scenario C.5
Scenario D.5
C.5 relative to A.5
C.5 relative to B.5
C.5 relative to D.5
Freshwater aquatic ecotoxicity potential 939 -10,197 -22,768 -18,908 -23,707 -12,571 -3,860
Human toxicity potential 494 -7,078 -16,216 -14,646 -16,710 -9,138 -1,570
Abiotic resource depletion potential -3,054 -31,943 -66,971 -27,864 -63,917 -35,028 -39,107
5.2.14 Table 5.7 shows that the negative impact of global warming potential, and
therefore the environmental performance benefit, has decreased relative to the 2025 DECC electricity mix in Table 5.6. This reflects the marginal mix becoming less carbon intensive, with an increase in electricity generation using CCGT, and a decrease in electricity generation using coal. Table 5.7: Normalised environmental indicators for Scenarios A.6, B.6, C.6 and D.6 (Eur.Person.Eq) (Year=2030)
Indicator Scenario A.6
Scenario B.6
Scenario C.6
Scenario D.6
C.6 relative to A.6
C.6 relative to B.6
C.6 relative to D.6
Global warming potential 23,646 3,241 -10,706 9,039 -34,352 -13,947 -19,745
Acidification potential 2,383 1,536 -3,663 -2,142 -6,046 -5,199 -1,521
Eutrophication potential 6,098 1,847 -318 2,519 -6,416 -2,165 -2,837
Freshwater aquatic ecotoxicity potential 938 -10,205 -22,779 -18,918 -23,717 -12,574 -3,861
Human toxicity potential 494 -7,076 -16,213 -14,647 -16,707 -9,137 -1,566
Abiotic resource depletion potential -2,792 -30,522 -64,752 -26,869 -61,960 -34,230 -37,883
5.2.15 Table 5.8 shows an increased positive impact of the global warming indicator for future operations (Scenario C), and therefore a slightly reduced environmental performance benefit. This is likely to be due to changes in the baseline mix, as the marginal electricity mix is the same (100 per cent CCGT electricity generation) as 2030.

North London Waste Authority North London Heat and Power ProjectWRATE and Carbon Intensity Floor Modelling: Technical Report
Page 34 AD05.06 Appendix C | Issue | October 2015 | Arup
Table 5.8: Normalised environmental indicators for Scenarios A.7, B.7, C.7 and D.7 (Eur.Person.Eq) (Year=2035)
Indicator Scenario A.7
Scenario B.7
Scenario C.7
Scenario D.7
C.7 relative to A.7
C.7 relative to B.7
C.7 relative to D.7
Global Warming Potential 23,646 3,229 -10,719 9,011 -34,365 -13,948 -19,730
Acidification Potential 2,383 1,534 -3,665 -2,146 -6,048 -5,199 -1,519
Eutrophication Potential 6,098 1,847 -319 2,517 -6,417 -2,166 -2,836
Freshwater Aquatic Ecotoxicity Potential 938 -10,208 -22,783 -18,926 -23,721 -12,575 -3,857
Human Toxicity Potential 494 -7,077 -16,214 -14,650 -16,708 -9,137 -1,564
Abiotic Resource Depletion Potential -2,792 -30,553 -64,789 -26,946 -61,997 -34,236 -37,843
National Grid ‘gone green’ scenario (Sensitivity Analyses 8 to 10)
5.2.16 Sensitivity Analyses 8 to 10 are used to represent changes made in the WRATE model, which reflect the National Grid ‘gone green’ electricity mix projection for the years 2025, 2030 and 2035 respectively (i.e. offsetting against only renewable sources of electricity in the marginal electricity mix).
5.2.17 Table 5.9, Table 5.10 and Table 5.11 show the modelling results for Sensitivity Analyses 8 to 10.
5.2.18 In Table 5.9, it can be seen that the positive impact of future operations has increased compared to the main analysis across all environmental indicators, which shows that the environmental performance benefit has decreased. This reflects the less carbon intensive, optimistic ‘greener’ renewable energy mix that is being offset against. However, relative to landfill (Scenario A), future operations (Scenario C) still has an environmental performance benefit across all environmental indicators.
Table 5.9: Normalised environmental indicators for Scenarios A.8, B.8, C.8 and D.8 (Eur.Person.Eq) (Year=2025)
Indicator Scenario A.8
Scenario B.8
Scenario C.8
Scenario D.8
C.8 relative to A.8
C.8 relative to B.8
C.8 relative to D.8
Global Warming Potential 25,265 12,239 3,284 15,687 -21,981 -8,955 -12,403
Acidification potential 2,423 1,764 -3,309 -1,972 -5,732 -5,073 -1,337
Eutrophication potential 6,118 1,962 -140 2,605 -6,258 -2,102 -2,745
Freshwater aquatic ecotoxicity 1,210 -8,690 -20,425 -17,794 -21,635 -11,735 -2,631
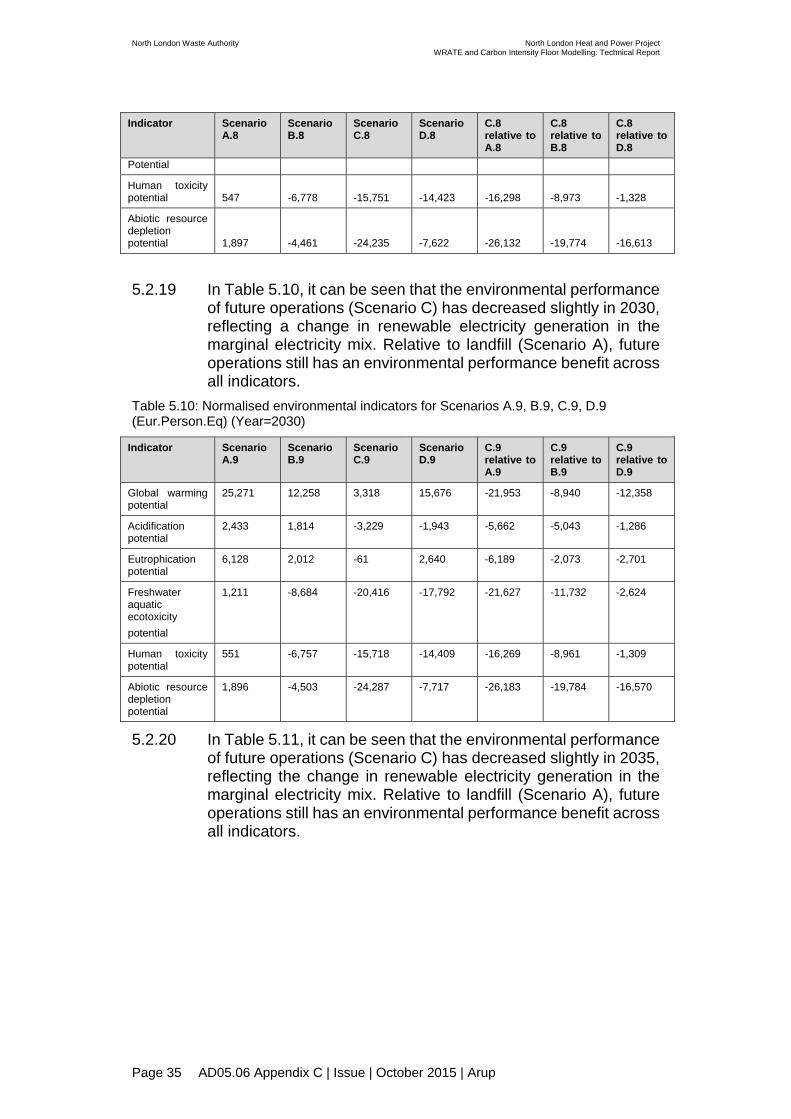
North London Waste Authority North London Heat and Power ProjectWRATE and Carbon Intensity Floor Modelling: Technical Report
Page 35 AD05.06 Appendix C | Issue | October 2015 | Arup
Indicator Scenario A.8
Scenario B.8
Scenario C.8
Scenario D.8
C.8 relative to A.8
C.8 relative to B.8
C.8 relative to D.8
Potential
Human toxicity potential 547 -6,778 -15,751 -14,423 -16,298 -8,973 -1,328
Abiotic resource depletion potential 1,897 -4,461 -24,235 -7,622 -26,132 -19,774 -16,613
5.2.19 In Table 5.10, it can be seen that the environmental performance
of future operations (Scenario C) has decreased slightly in 2030, reflecting a change in renewable electricity generation in the marginal electricity mix. Relative to landfill (Scenario A), future operations still has an environmental performance benefit across all indicators.
Table 5.10: Normalised environmental indicators for Scenarios A.9, B.9, C.9, D.9 (Eur.Person.Eq) (Year=2030)
Indicator Scenario A.9
Scenario B.9
Scenario C.9
Scenario D.9
C.9 relative to A.9
C.9 relative to B.9
C.9 relative to D.9
Global warming potential
25,271 12,258 3,318 15,676 -21,953 -8,940 -12,358
Acidification potential
2,433 1,814 -3,229 -1,943 -5,662 -5,043 -1,286
Eutrophication potential
6,128 2,012 -61 2,640 -6,189 -2,073 -2,701
Freshwater aquatic ecotoxicity potential
1,211 -8,684 -20,416 -17,792 -21,627 -11,732 -2,624
Human toxicity potential
551 -6,757 -15,718 -14,409 -16,269 -8,961 -1,309
Abiotic resource depletion potential
1,896 -4,503 -24,287 -7,717 -26,183 -19,784 -16,570
5.2.20 In Table 5.11, it can be seen that the environmental performance of future operations (Scenario C) has decreased slightly in 2035, reflecting the change in renewable electricity generation in the marginal electricity mix. Relative to landfill (Scenario A), future operations still has an environmental performance benefit across all indicators.
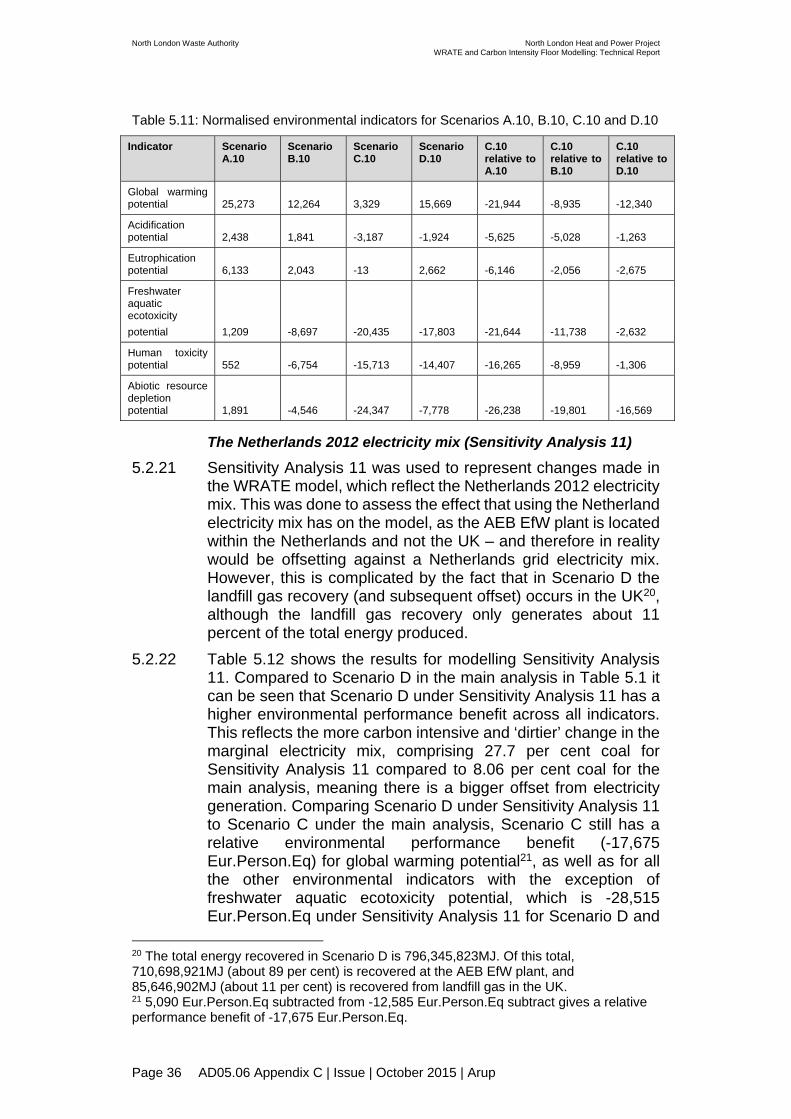
North London Waste Authority North London Heat and Power ProjectWRATE and Carbon Intensity Floor Modelling: Technical Report
Page 36 AD05.06 Appendix C | Issue | October 2015 | Arup
Table 5.11: Normalised environmental indicators for Scenarios A.10, B.10, C.10 and D.10
Indicator Scenario A.10
Scenario B.10
Scenario C.10
Scenario D.10
C.10 relative to A.10
C.10 relative to B.10
C.10 relative to D.10
Global warming potential 25,273 12,264 3,329 15,669 -21,944 -8,935 -12,340
Acidification potential 2,438 1,841 -3,187 -1,924 -5,625 -5,028 -1,263
Eutrophication potential 6,133 2,043 -13 2,662 -6,146 -2,056 -2,675
Freshwater aquatic ecotoxicity potential 1,209 -8,697 -20,435 -17,803 -21,644 -11,738 -2,632
Human toxicity potential 552 -6,754 -15,713 -14,407 -16,265 -8,959 -1,306
Abiotic resource depletion potential 1,891 -4,546 -24,347 -7,778 -26,238 -19,801 -16,569
The Netherlands 2012 electricity mix (Sensitivity Analysis 11)
5.2.21 Sensitivity Analysis 11 was used to represent changes made in the WRATE model, which reflect the Netherlands 2012 electricity mix. This was done to assess the effect that using the Netherland electricity mix has on the model, as the AEB EfW plant is located within the Netherlands and not the UK – and therefore in reality would be offsetting against a Netherlands grid electricity mix. However, this is complicated by the fact that in Scenario D the landfill gas recovery (and subsequent offset) occurs in the UK20, although the landfill gas recovery only generates about 11 percent of the total energy produced.
5.2.22 Table 5.12 shows the results for modelling Sensitivity Analysis 11. Compared to Scenario D in the main analysis in Table 5.1 it can be seen that Scenario D under Sensitivity Analysis 11 has a higher environmental performance benefit across all indicators. This reflects the more carbon intensive and ‘dirtier’ change in the marginal electricity mix, comprising 27.7 per cent coal for Sensitivity Analysis 11 compared to 8.06 per cent coal for the main analysis, meaning there is a bigger offset from electricity generation. Comparing Scenario D under Sensitivity Analysis 11 to Scenario C under the main analysis, Scenario C still has a relative environmental performance benefit (-17,675 Eur.Person.Eq) for global warming potential21, as well as for all the other environmental indicators with the exception of freshwater aquatic ecotoxicity potential, which is -28,515 Eur.Person.Eq under Sensitivity Analysis 11 for Scenario D and
20 The total energy recovered in Scenario D is 796,345,823MJ. Of this total, 710,698,921MJ (about 89 per cent) is recovered at the AEB EfW plant, and 85,646,902MJ (about 11 per cent) is recovered from landfill gas in the UK. 21 5,090 Eur.Person.Eq subtracted from -12,585 Eur.Person.Eq subtract gives a relative performance benefit of -17,675 Eur.Person.Eq.
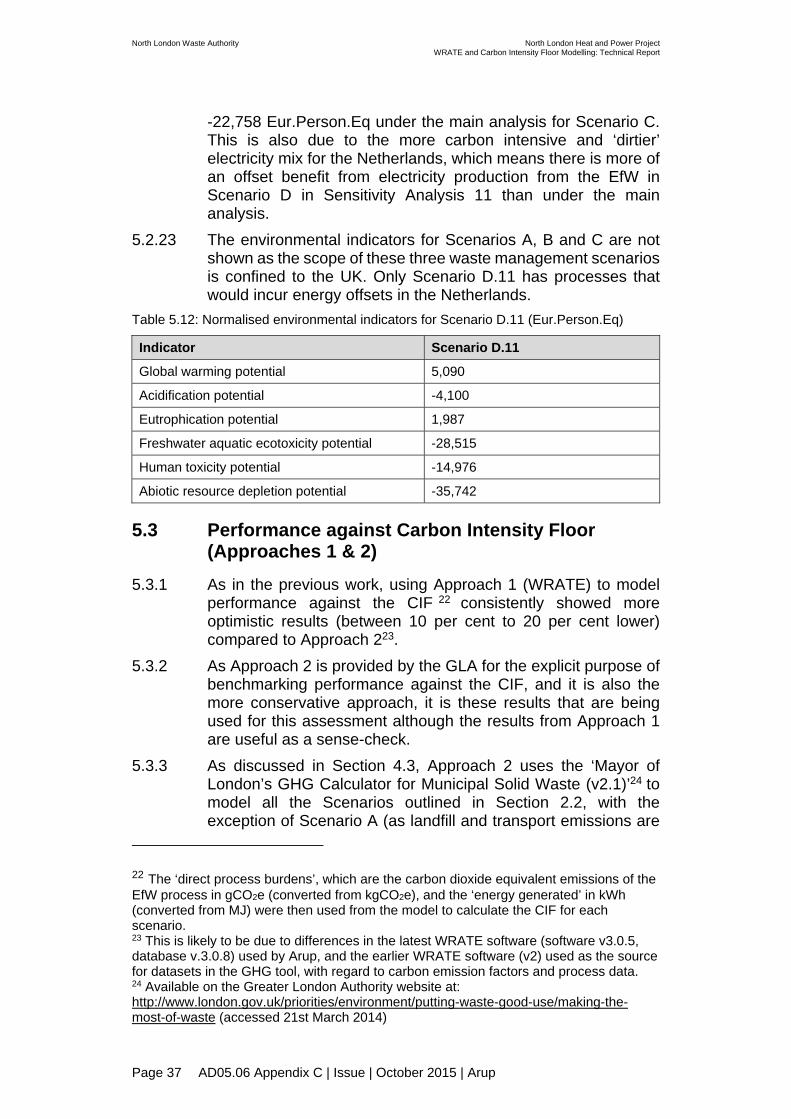
North London Waste Authority North London Heat and Power ProjectWRATE and Carbon Intensity Floor Modelling: Technical Report
Page 37 AD05.06 Appendix C | Issue | October 2015 | Arup
-22,758 Eur.Person.Eq under the main analysis for Scenario C. This is also due to the more carbon intensive and ‘dirtier’ electricity mix for the Netherlands, which means there is more of an offset benefit from electricity production from the EfW in Scenario D in Sensitivity Analysis 11 than under the main analysis.
5.2.23 The environmental indicators for Scenarios A, B and C are not shown as the scope of these three waste management scenarios is confined to the UK. Only Scenario D.11 has processes that would incur energy offsets in the Netherlands.
Table 5.12: Normalised environmental indicators for Scenario D.11 (Eur.Person.Eq)
Indicator Scenario D.11
Global warming potential 5,090
Acidification potential -4,100
Eutrophication potential 1,987
Freshwater aquatic ecotoxicity potential -28,515
Human toxicity potential -14,976
Abiotic resource depletion potential -35,742
5.3 Performance against Carbon Intensity Floor (Approaches 1 & 2)
5.3.1 As in the previous work, using Approach 1 (WRATE) to model performance against the CIF 22 consistently showed more optimistic results (between 10 per cent to 20 per cent lower) compared to Approach 223.
5.3.2 As Approach 2 is provided by the GLA for the explicit purpose of benchmarking performance against the CIF, and it is also the more conservative approach, it is these results that are being used for this assessment although the results from Approach 1 are useful as a sense-check.
5.3.3 As discussed in Section 4.3, Approach 2 uses the ‘Mayor of London’s GHG Calculator for Municipal Solid Waste (v2.1)’24 to model all the Scenarios outlined in Section 2.2, with the exception of Scenario A (as landfill and transport emissions are
22 The ‘direct process burdens’, which are the carbon dioxide equivalent emissions of the EfW process in gCO2e (converted from kgCO2e), and the ‘energy generated’ in kWh (converted from MJ) were then used from the model to calculate the CIF for each scenario. 23 This is likely to be due to differences in the latest WRATE software (software v3.0.5, database v.3.0.8) used by Arup, and the earlier WRATE software (v2) used as the source for datasets in the GHG tool, with regard to carbon emission factors and process data. 24 Available on the Greater London Authority website at: http://www.london.gov.uk/priorities/environment/putting-waste-good-use/making-the-most-of-waste (accessed 21st March 2014)
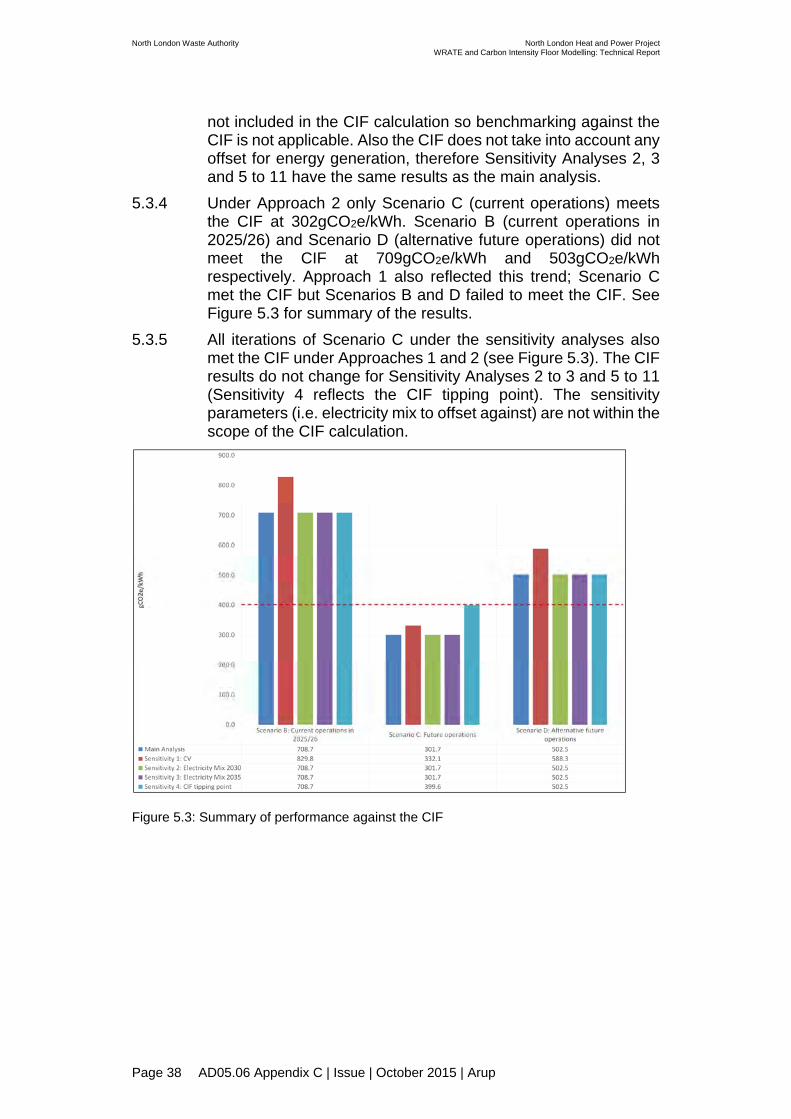
North London Waste Authority North London Heat and Power ProjectWRATE and Carbon Intensity Floor Modelling: Technical Report
Page 38 AD05.06 Appendix C | Issue | October 2015 | Arup
not included in the CIF calculation so benchmarking against the CIF is not applicable. Also the CIF does not take into account any offset for energy generation, therefore Sensitivity Analyses 2, 3 and 5 to 11 have the same results as the main analysis.
5.3.4 Under Approach 2 only Scenario C (current operations) meets the CIF at 302gCO2e/kWh. Scenario B (current operations in 2025/26) and Scenario D (alternative future operations) did not meet the CIF at 709gCO2e/kWh and 503gCO2e/kWh respectively. Approach 1 also reflected this trend; Scenario C met the CIF but Scenarios B and D failed to meet the CIF. See Figure 5.3 for summary of the results.
5.3.5 All iterations of Scenario C under the sensitivity analyses also met the CIF under Approaches 1 and 2 (see Figure 5.3). The CIF results do not change for Sensitivity Analyses 2 to 3 and 5 to 11 (Sensitivity 4 reflects the CIF tipping point). The sensitivity parameters (i.e. electricity mix to offset against) are not within the scope of the CIF calculation.
Figure 5.3: Summary of performance against the CIF
North London Waste Authority North London Heat and Power ProjectWRATE and Carbon Intensity Floor Modelling: Technical Report
Page 39 AD05.06 Appendix C | Issue | October 2015 | Arup
6 Conclusions and recommendations
6.1.1 In summary, the future operations (Scenario C) of the proposed ERF, when operating in CHP mode producing around 34MWth of heat output (in the form of hot water) would have a better environmental performance than all other scenarios modelled, with the largest environmental benefit being relative to the landfill comparator (Scenario A) of sending all waste to landfill.
6.1.2 In order to assess the effect of a less carbon intensive electricity mix, which the electricity generation of Scenario C is offset against in the future, the WRATE model was amended to reflect the DECC reference scenario and the National Grid ‘gone green’ scenario as discussed in Sections 2.2 and 4.1. Depending on the electricity generation mix assumed, the environmental performance benefit relative to Scenario A would result in a global warming potential offset of: -35,124 Eur.Person.Eq (DECC electricity mix) to -21,981
Eur.Person.Eq (National Grid electricity mix) in 2025; -34,352 Eur.Person.Eq (DECC electricity mix) and -21,953
Eur.Person.Eq (National Grid electricity mix) for 2030; and -34,365 Eur.Person.Eq (DECC electricity mix) and -21,944
Eur.Person.Eq (National Grid electricity mix). 6.1.3 When applying the NG ‘gone green’ electricity mix to Scenarios
A to D, the results show a lower environmental performance benefit for all four waste management scenarios as the ‘gone green’ electricity mix assumes an optimistic 100 per cent renewable marginal electricity mix. This means that the benefit from burning waste to produce electricity is reduced. In the case of Sensitivity Analyses 8 to 10 where the ‘gone green’ electricity mix is used, this results in a reduced environmental performance relative to grid electricity mix for Scenario C. However, relative to the other three scenarios (i.e. Scenarios A, B and D), Scenario C still shows an environmental performance benefit, and is the best performing waste management scenario overall.
6.1.4 All other environmental indicators (i.e. acidification potential, eutrophication potential, freshwater aquatic ecotoxicity potential, human toxicity potential and abiotic resource potential) show environmental performance benefits for Scenario C compared to landfill and the other waste management scenarios for all modelled sensitivity analyses, as shown in Table 4.1.
6.1.5 When comparing Scenario C for the main analysis to the alternative future operations (Scenario D) under Sensitivity Analysis 11 (where the Netherlands electricity mix is used), Scenario C still has a relative environmental performance benefit of -17,675 Eur.Person.Eq for global warming potential, and all other environmental indicators show a higher environmental

North London Waste Authority North London Heat and Power ProjectWRATE and Carbon Intensity Floor Modelling: Technical Report
Page 40 AD05.06 Appendix C | Issue | October 2015 | Arup
performance benefit than Scenario D with the exception of fresh water aquatic ecotoxicity potential.
6.1.6 For current operation 2025/26 (Scenario B) there is still an environmental performance benefit across all environmental indicators when compared with Scenario A.
6.1.7 Scenario C would meet the CIF, and would continue to do so as long as a minimum of 12MWth of heat is being used.
6.1.8 It is recommended that once more detailed design and operational data is available for Scenario C, the modelling is refined and updated. This data would primarily relate to the ERF process including construction and maintenance material requirements, fuel inputs, water requirements and emission and effluent concentrations.

North London Waste Authority North London Heat and Power ProjectWRATE and Carbon Intensity Floor Modelling: Technical Report
Page A.41 AD05.06 Appendix C | Issue | October 2015 | Arup
Appendix A
A1 Appendix 1: FRM peer review report

North London Waste Authority: New Edmonton ERF Peer review of WRATE Life Cycle AssessmentProject: ARU001 Final report
North London Waste Authority: New Edmonton ERF
ARUP WRATE Life Cycle Assessment
Independent Peer Review of WRATE Model and Processes
8th June 2015
Paul Frith
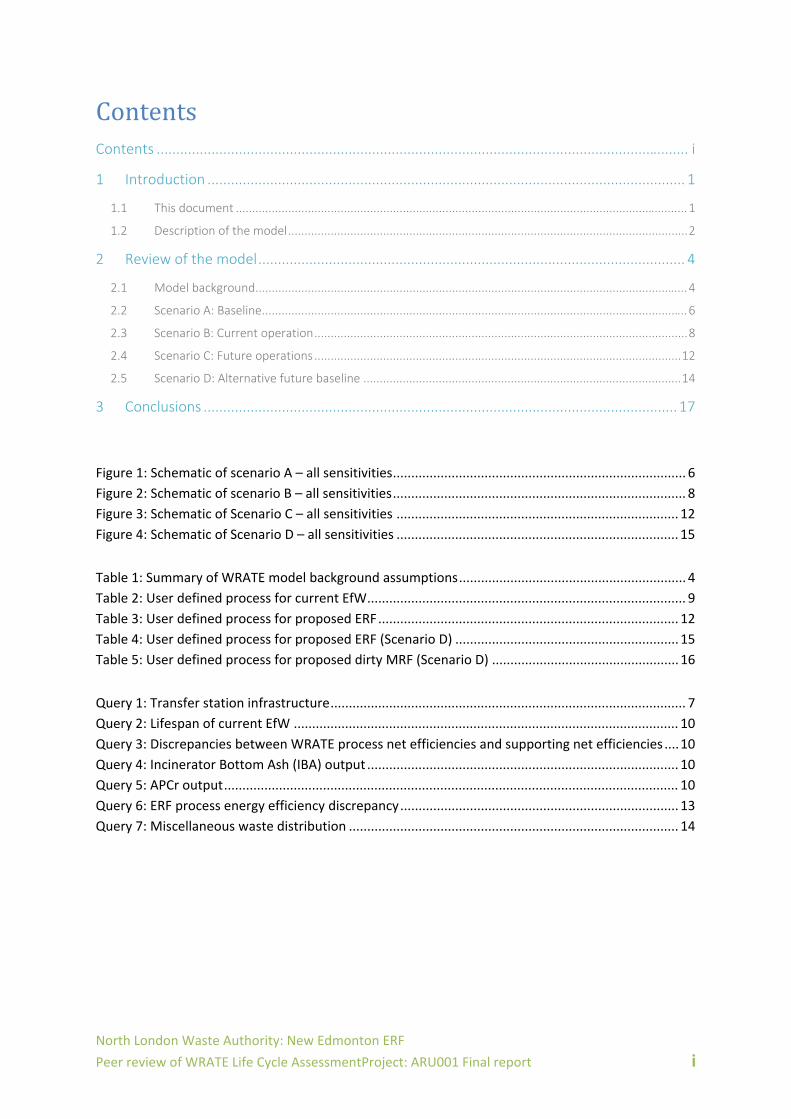
North London Waste Authority: New Edmonton ERF
Peer review of WRATE Life Cycle AssessmentProject: ARU001 Final report i
ContentsContents ........................................................................................................................................ i
1 Introduction .......................................................................................................................... 1
1.1 This document .......................................................................................................................................... 1
1.2 Description of the model .......................................................................................................................... 2
2 Review of the model ............................................................................................................. 4
2.1 Model background .................................................................................................................................... 4
2.2 Scenario A: Baseline .................................................................................................................................. 6
2.3 Scenario B: Current operation .................................................................................................................. 8
2.4 Scenario C: Future operations ................................................................................................................ 12
2.5 Scenario D: Alternative future baseline ................................................................................................. 14
3 Conclusions ......................................................................................................................... 17
Figure 1: Schematic of scenario A – all sensitivities ................................................................................ 6
Figure 2: Schematic of scenario B – all sensitivities ................................................................................ 8
Figure 3: Schematic of Scenario C – all sensitivities ............................................................................. 12
Figure 4: Schematic of Scenario D – all sensitivities ............................................................................. 15
Table 1: Summary of WRATE model background assumptions .............................................................. 4
Table 2: User defined process for current EfW ....................................................................................... 9
Table 3: User defined process for proposed ERF .................................................................................. 12
Table 4: User defined process for proposed ERF (Scenario D) ............................................................. 15
Table 5: User defined process for proposed dirty MRF (Scenario D) ................................................... 16
Query 1: Transfer station infrastructure ................................................................................................. 7
Query 2: Lifespan of current EfW ......................................................................................................... 10
Query 3: Discrepancies between WRATE process net efficiencies and supporting net efficiencies .... 10
Query 4: Incinerator Bottom Ash (IBA) output ..................................................................................... 10
Query 5: APCr output ............................................................................................................................ 10
Query 6: ERF process energy efficiency discrepancy ............................................................................ 13
Query 7: Miscellaneous waste distribution .......................................................................................... 14

North London Waste Authority: New Edmonton ERF
Peer review of WRATE Life Cycle AssessmentProject: ARU001 Final report 1
1 Introduction
1.1 Thisdocument
Frith Resource Management (FRM) were approached by Arup (herein referred to as ‘the client’) to
perform a peer‐review of their WRATE (Waste and Resources Assessment Tool for the Environment)
model including user‐defined processes. WRATE is a life cycle assessment tool designed to support
the analysis of waste management systems and technologies.
This project concerns the proposed development of a new Energy from Waste (EfW) plant, termed
an Energy Recovery Facility (ERF) in this instance. The facility is modelled to process Local Authority
Collected (LAC) waste. The project is proposed in Edmonton which is under the North London Waste
Authority (NLWA) jurisdiction.
FRM has been informed that as this stage of the proposed development most of the detailed design
parameters are still to be confirmed. Therefore waste treatment process data mainly uses the
default values and allocation rules found within the template processes within WRATE. There are
also elements of waste management infrastructure, such as waste transfer stations, that are
currently assumed out of scope. This external peer review is undertaken in that light, and the
comments should be seen in that context.
Paul Frith (PF) conducted this peer‐review of the ERF solution. Paul is experienced and trained using
the most recent WRATE software (version 3.0.1.5, with database update 3.0.1.8) at an ‘expert’ level.
A number of parameters were reviewed, including, but not limited to:
• The WRATE model as a whole, four central scenarios plus the eleven sensitivity
variations of each scenario, meaning a total of twenty eight scenarios were reviewed.
• Background spreadsheet containing the calculations for the NOx emission amendment
on the proposed ERF.
• Background spreadsheet containing the calculations for the NOx emission amendment
on the Netherlands ERF in scenario D.
• Background spreadsheet containing a summary of the proposed amendments to the ERF
technology.
• Correspondence with Arup w/c 23rd March 2015 – w/c 1st June 2015.
• Review of the allocation tables for all user defined processes.
• Evaluation against comparator default WRATE processes where appropriate.
• Correspondence with Arup w/c 27th April 2015.
All data entry aspects were checked across each of the scenarios.
North London Waste Authority: New Edmonton ERF
Peer review of WRATE Life Cycle AssessmentProject: ARU001 Final report 2
In terms of the process an external review report was issued by FRM to Arup on 30/03/2015. This
contained seven queries and the supporting comment as included in this document. Arup responded
to the queries and made the changes indicated in this report, reissuing the model in the process on
31/03/2015. Further modifications have been made to the WRATE model culminating in a second
issue of the report. Further modelling has been conducted by Arup to address issues in the
background electricity mix of WRATE. A further six scenarios have been modelled for two alternative
electricity mixes for three projected years. A variation to the Scenario D was added to include a dirty
MRF preparing an RDF fraction for export to an Energy from Waste facility in the Netherlands. This
MRF has been user defined and was also checked in the latest iteration of the modelling (w/c 1st
June). FRM have checked the changes and additions made and this report concludes the peer review
process.
1.2 Descriptionofthemodel
The ERF solution proposes to process the project waste streams (composition and tonnage) as
identified by NLWA for the period 2025/26. NLWA’s waste flow assumptions, based on the
composition as identified differ from WRATE defaults in terms of the calorific value of the waste. As
a consequence, the central WRATE model is altered to reflect the energy output derived from the
NLWA calorific value (CV) estimate and the energy recovery performance of the ERF has been
amended accordingly to match this CV. A calculation table has been provided by Arup to
demonstrate the energy balance and the corresponding impact on the ERF efficiency. There is a
sensitivity analysis (Sensitivity 1) that considers the impact of processing a lower CV waste feedstock
(the default WRATE composition).
There is no default method to adjust background CV values within WRATE and therefore an
alternative method is required in order to approximate and model the 10MJ/kg net CV as requested
by NLWA. This has been done by increasing the net heat and net power efficiencies of the treatment
technologies by a factor of 1.17 to account for the difference in net CVs; the default net CV in
WRATE is 8.54MJ/kg when using the NLWA waste composition. The degree of energy recovery
within the model is one of the most significant aspects influencing the global warming potential
(GWP) environmental indicator in WRATE, and therefore the approach by the client of amending
energy outputs (by amending net efficiencies) to match the energy balance predicted through the
ERF solution is appropriate. In recognition of the point that this method of approximating GWP only
considers the energy output calculation, the client has also included Sensitivity 1 which uses the
default WRATE CV (of 8.54MJ/kg) for the given waste composition. This sensitivity should be applied
in circumstances where the WRATE model is compared against other life cycle assessments
undertaken in WRATE to ensure comparability. The method applied by Arup for correcting efficiency
to match the NLWA CV has been applied correctly based on the reported CV of 10GJ/tonne (or
10MJ/kg) and the net energy recovery efficiency reported by the technology provider.
The WRATE model for this project was provided by the client to FRM – alongside some background
data including outline process / scenario and sensitivity descriptions and justifications – to undertake
this peer‐review.
Sensitivity analyses two and three apply different background energy mixes to reflect default WRATE
estimates in the years 2030 and 2035 respectively.

North London Waste Authority: New Edmonton ERF
Peer review of WRATE Life Cycle AssessmentProject: ARU001 Final report 3
Sensitivity analysis four considers the future scenarios (C – 100% ERF treatment, and D – 50% ERF
treatment in the Netherlands, 50% landfill disposal) only, with regard to the degree of energy
recovery they would be required to undertake to meet the requirements of the Carbon Intensity
Floor (CIF)1 in 2025/26. This is calculated through a separate model to WRATE which has not been
provided (the GLA Greenhouse Gas Calculator). By adopting the same methodology using the
WRATE scenarios provided the Scenario C appears to fall below the target of 400gCO2e/kWh of
energy generated, however this applies a different dataset in terms of marginal energy mix, CV and a
more recent Life Cycle Inventory than the Greenhouse Gas Calculator. Therefore FRM have not been
able to assess this part of the model within this peer review.
Sensitivities 5, 6 and 7 are a variation on the baseline model whereby the background electricity mix
has been altered to reflect latest DECC projections for 2025, 2030 and 2035 respectively. This has
been done due to the default WRATE electricity mixes showing an increase in coal use over time,
which is contrary to DECC projections and energy policy. Arup have approached the WRATE helpdesk
for clarification behind this reasoning; however have not been provided with an explanation.
Sensitivities 8, 9 and 10 have been conducted for the same years using the National Grid’s ‘Gone
Green’ energy projections to inform the background electricity mixes. Sensitivity 11 uses the
Netherland’s 2012 (most recent available in WRATE) energy mix to reflect differences in marginal
energy mix between the UK and the Netherlands, and the subsequent difference in environmental
impact of energy recovery technology in the two countries.
This peer‐review report considers the whole of each scenario but provides particular attention to the
user‐defined processes within the WRATE model, as these are the elements for which changes have
been made from the peer reviewed default processes in WRATE. The user defined processes are
therefore the ERF (and variations thereof), the Materials Recovery Facility (in Scenario D) and the Air
Pollution Control residue (APCr) processing facility. The following sections will discuss any
observations and queries that were raised as part of this process.
1 A Greater London Authority energy recovery requirement of ≤400gCO2e/kwh.

North London Waste Authority: New Edmonton ERF
Peer review of WRATE Life Cycle AssessmentProject: ARU001 Final report 4
2 Reviewofthemodel
2.1 Modelbackground
The model background information has been programmed as displayed in Table 1.
Table 1: Summary of WRATE model background assumptions
Parameter
Main M
odel
Sensitivity 1
Sensitivity 2
Sensitivity 3
Sensitivity 4
Sensitivities
5, 6
& 7
Sensitivities
8, 9
& 10
Sensitivity 11
Studied Year 2025 2025 2030 2035 2025 ‐ ‐ 2012
Population 0
No of Persons per Household
0
Electricity Mix UK 2025
UK 2025
UK 2030
UK 2035
UK 2025
DECC 2025 / 30 / 35
N Grid 2025 / 30 / 35
Netherlands 2012
Waste Tonnage
572856 tonnes
Waste Composition
As modelled in waste projections. Same for all sensitivities.
The year studied in for the NLWA proposal is 2025. This is a fair assumption. In each case the
electricity mix selected is UK, with the exception of the user defined energy mixes used in
sensitivities 5 ‐ 10 (user defined) and 11 (Netherlands, 2012). This is a fair assumption. The
electricity mix year corresponds with the studied year in each sensitivity.
A population and number of persons per household of nil have been selected in the model and all
sensitivities. This is an appropriate assumption because collection activities (collection methods and
transportation) are outside the scope of this model. This is the case in all scenarios and sensitivities
meaning each is a comparable and fair assessment.
Waste tonnages and compositions are derived from waste projections conducted by NLWA. These
are unaltered between scenarios and sensitivities meaning each is a comparable and fair
assessment. There are four scenarios (A‐D) as described in Sections 2.2 – 2.5, following, and in
addition eleven sensitivity analyses have been performed, where one variable has been changed to
determine the effect on each scenario.

North London Waste Authority: New Edmonton ERF
Peer review of WRATE Life Cycle AssessmentProject: ARU001 Final report 5
Sensitivity 1 accounts for use energy outputs when using standard WRATE calorific values (CVs)
rather than projected NLWA waste CVs, as discussed in section 1.2. Sensitivities 2 and 3 are simple
modifications of the modelled year. These do not impact the direct process burdens of the scenarios
(compared with the main model) however have an impact when compared with the offset emissions
of cleaner energy mixes in the later years. Sensitivity 4 explores the required energy recovery levels
to meet the Greater London Authority’s Carbon Intensity Floor, for reasons noted in section 1.2 this
sensitivity could not be fully explored.
Sensitivities 5, 6 and 7 explore the effect of using DECCs energy mix projections, and 8, 9 and 10 of
using the national grid energy mix projections for 2025, 2030 and 2035 respectively in each case. For
sensitivities 5, 6 and 7 the (updated) DECC energy projections published in September 2014 have
been used. Arup have maintained the WRATE default energy generation efficiencies, however have
updated the baseline and marginal fuel mix figures for CCGT and coal to reflect the DECC
projections. These changes have been applied correctly for each of the three sensitivities, with
workings provided to demonstrate the calculations used.
A similar exercise has been undertaken for sensitivities 8, 9 and 10 using the national grid’s ‘Gone
Green’ UK energy projections (2014). In this instance the energy generation efficiencies have been
maintained with the baseline fuel mix changed (for all parameters) to reflect the national grid
projections. The marginal fuel mix, used by WRATE to calculate emissions associated with the source
of displaced energy, is changed in this case to a worst case scenario whereby only renewable energy
is displaced. This has been done in the ration of projected renewable energy sources. These changes
have been applied correctly for each of the three sensitivities, with workings provided to
demonstrate the calculations used. As noted by Arup, the makeup of the marginal fuel mix in these
sensitivities means these models are rightly marked as a worst case scenario as it is probable that
the energy source displaced by the development will be ‘dirtier’ in composition.
There is an additional sensitivity concerning scenario D (where 50% of the waste is exported for
energy recovery in the Netherlands), in this sensitivity (no. 11D) the background energy mix was
changed to reflect the Netherlands energy mix from WRATE. In this instance WRATE only has
electricity mixes available for 2002 and 2012; therefore 2012 has been selected as the closest
relevant electricity mix.

North London Waste Authority: New Edmonton ERF
Peer review of WRATE Life Cycle AssessmentProject: ARU001 Final report 6
2.2 ScenarioA:Baseline
Scenario A assumes that all project waste is disposed to landfill. This scenario is identical for all
sensitivities, notwithstanding alterations to the project background information as discussed
previously. Waste is distributed in a ratio of 10.54%, 21.41% and 68.05% from Hornsey Street (road
transfer station), BWRF (road transfer station) and Hendon (rail transfer station) respectively.
Transfer stations are not modelled in this scenario. This is a consistent approach with all other
scenarios and sensitivities. Query 1, as detailed below, concerns the appropriateness of this
approach.
Figure 1: Schematic of scenario A – all sensitivities
Hornsey Street transport is modelled using the standard WRATE process ‘Intermodal road transport
v3 (12026)’ with a trip distance of 128km and a urban:rural:motorway mix of 33:33:34. The selected
WRATE default process is the most appropriate transport method for waste from a transfer station
to a disposal site and therefore is modelled suitably. The trip distance has been verified using google
mapping software. A road mix of 33:33:34 is appropriate for a high level assessment2 such as this.
Alterations to this road mix would have small impacts on the climate change and NOx impacts of the
model; these are not substantial in comparison to process emissions and offsets from landfill/EfW
processes.
BWRF transport is modelled using the standard WRATE process ‘Intermodal road transport v3
(12026)’ with a trip distance of 130km and a urban:rural:motorway mix of 33:33:34. The selected
WRATE default process is the most appropriate transport method for waste from a transfer station
to a disposal site and therefore is modelled suitably. The trip distance has been verified using google
mapping software. A road mix of 33%, 33% and % 343 (rural, urban and motorway respectively) is
appropriate for a high level assessment such as this. Alterations to this road mix would have small
2 See note in section 1.1 3 All further road transport processes for all scenarios and sensitivities use default WRATE road mixes. As stated this are suitable for a high level model such as this, and therefore are not refereed to separately in each instance in this report.
NLWA LAC ResidualWaste
2025/2026
NLWA LAC ResidualWaste
2025/2026
Scenario A: Future Baseline, 100% LAC Residual Waste to Landfill
Cranford Landfill,Thrapston Road,Northamptonshire
Cranford Landfill,Thrapston Road,Northamptonshire
From Hornseystreet
From Hornseystreet
From HendonFrom Hendon
From BWRFFrom BWRF
Brackley Lane,Buckingham
Brackley Lane,Buckingham

North London Waste Authority: New Edmonton ERF
Peer review of WRATE Life Cycle AssessmentProject: ARU001 Final report 7
impacts on the climate change and NOx impacts of the model; however these are not substantial in
comparison to process emissions / offsets from landfill/EfW processes.
Hendon transport is modelled using the standard WRATE process ‘Rail transport v3 (12072)’ with a
trip distance of 96km. The selected WRATE default process is the most appropriate transport
method for waste from a rail transfer station to a disposal site and therefore is modelled suitably.
The trip distance has been verified using google mapping software.
Query 1: Transfer station infrastructure
FRM Query The inclusion of transfer station processes in the model will allow the model to assess the difference in burdens between use of rail and road transport transfer facilities. The high burdens associated with infrastructure at rail transfer stations will have a greater impact on some scenarios compared with others. Consider including transfer facilities in the scope of assessment.
ARUP Response The client has confirmed that transfer station infrastructure is out of scope at this stage. Transfer transport processes have not been included.
FRM Comment This response and approach is acceptable for a high level assessment. If more detailed life cycle assessment is required at a later stage transfer facility burdens should be included within the scope of an assessment.
Waste disposal is modelled through two landfill sites at Cranford (Northamptonshire) for waste
transported by road from Hornsey Street and BWRF, and Brackley Lane (Buckinghamshire) for waste
from Hendon transported by rail. Both facilities use the WRATE default process ‘Flexible landfill
5000000 tonnes (11256)’ with an assumed landfill gas efficiency of 50% in the absence of provided
data. The recovered gas is used for energy recovery purposes. This is an appropriate assumption for
a moderately performing landfill, and for the purposes of a high level assessment is a sufficient
assumption. Both facilities are appropriately scaled to incoming waste. In both cases it has been
assumed that a clay liner is used at the landfill sites. This is a conservative assumption as plastic
liners and caps will improve landfill performance. At Brackley Lane a clay cap has been assumed,
again as a conservative estimate. For Cranford Landfill a HDPE cap has been used as a proxy for LDPE
cap. This is an appropriate assumption and most closely reflects the landfill operation and burdens.
This approach has been applied consistently and for the purposes of a high level assessment is an
appropriate assumption.
Each of the ten sensitivities for the baseline scenario has been tested to ensure that no changes
have been made. This assessment has highlighted no alterations and therefore the sensitivities are
comparable on a like for like basis.
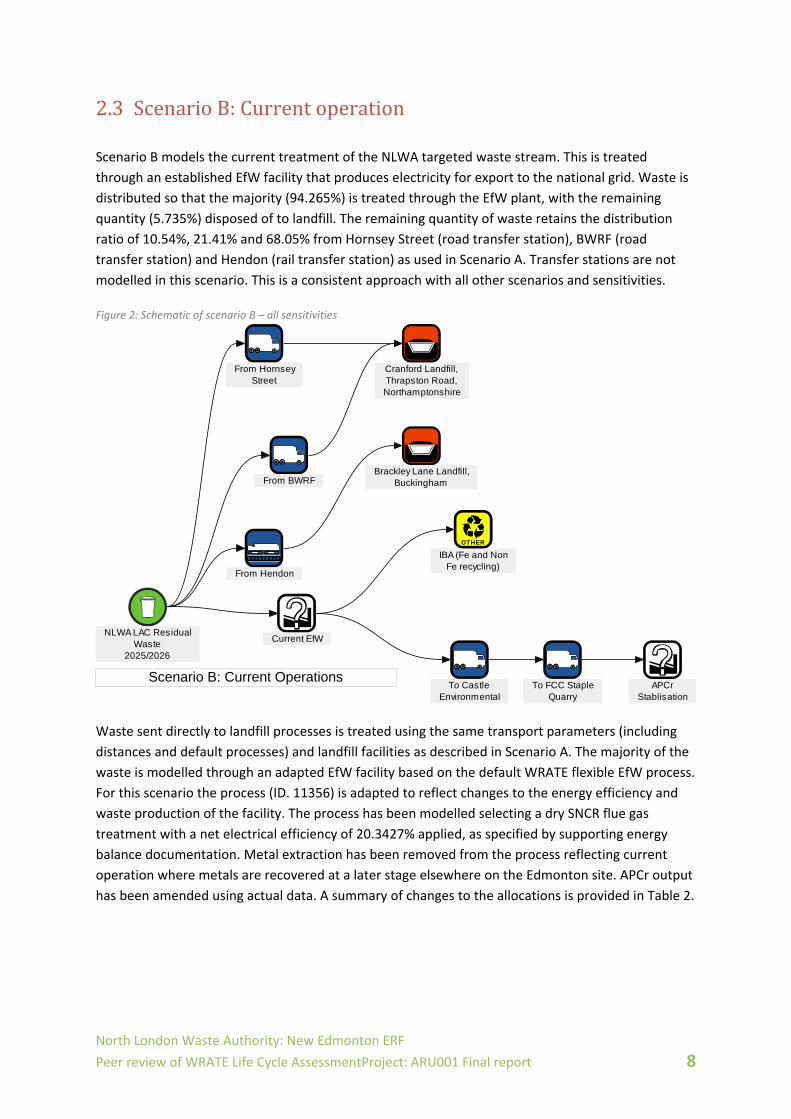
North London Waste Authority: New Edmonton ERF
Peer review of WRATE Life Cycle AssessmentProject: ARU001 Final report 8
2.3 ScenarioB:Currentoperation
Scenario B models the current treatment of the NLWA targeted waste stream. This is treated
through an established EfW facility that produces electricity for export to the national grid. Waste is
distributed so that the majority (94.265%) is treated through the EfW plant, with the remaining
quantity (5.735%) disposed of to landfill. The remaining quantity of waste retains the distribution
ratio of 10.54%, 21.41% and 68.05% from Hornsey Street (road transfer station), BWRF (road
transfer station) and Hendon (rail transfer station) as used in Scenario A. Transfer stations are not
modelled in this scenario. This is a consistent approach with all other scenarios and sensitivities.
Figure 2: Schematic of scenario B – all sensitivities
Waste sent directly to landfill processes is treated using the same transport parameters (including
distances and default processes) and landfill facilities as described in Scenario A. The majority of the
waste is modelled through an adapted EfW facility based on the default WRATE flexible EfW process.
For this scenario the process (ID. 11356) is adapted to reflect changes to the energy efficiency and
waste production of the facility. The process has been modelled selecting a dry SNCR flue gas
treatment with a net electrical efficiency of 20.3427% applied, as specified by supporting energy
balance documentation. Metal extraction has been removed from the process reflecting current
operation where metals are recovered at a later stage elsewhere on the Edmonton site. APCr output
has been amended using actual data. A summary of changes to the allocations is provided in Table 2.
NLWA LAC ResidualWaste
2025/2026
NLWA LAC ResidualWaste
2025/2026
Scenario B: Current Operations
Brackley Lane Landfill,Buckingham
Brackley Lane Landfill,Buckingham
OTHEROTHER
IBA (Fe and NonFe recycling)
IBA (Fe and NonFe recycling)
Cranford Landfill,Thrapston Road,Northamptonshire
Cranford Landfill,Thrapston Road,Northamptonshire
From HendonFrom Hendon
From HornseyStreet
From HornseyStreet
From BWRFFrom BWRF
To CastleEnvironmental
To CastleEnvironmental
To FCC StapleQuarry
To FCC StapleQuarry
APCrStablisation
APCrStablisation
Current EfWCurrent EfW

North London Waste Authority: New Edmonton ERF
Peer review of WRATE Life Cycle AssessmentProject: ARU001 Final report 9
Table 2: User defined process for current EfW
Parameter User Defined WRATE process
Default WRATE process Comment
Lifespan 55 years 25 years See Query 2.
Energy Recovered
=[USER_TOTAL.NET_CV]*0.203427
User defined variable (front screen) Changed to reflect reported actual energy outputs. Source ARUP Energy Balance.
Process Output > Non Ferrous Metals
0 User defined variable (front screen) Changed to reflect later removal at IBA treatment facility.
Process Output > Ferrous Metals
0 User defined variable (front screen) Changed to reflect later removal at IBA treatment facility.
Electricity to Grid
=[USER_TOTAL.NET_CV]*0.203189
User defined variable (front screen) Slight discrepancies in factors used, see Query 3.
Process Waste Output > Bottom Ash (IBA)
=[USER_WASTE_FRACTIONS_TOTAL]*0.13999
=([USER_TOTAL.ASH]*0.91+([USER_WASTE_FRACTIONS.NON_FERROUS]+[USER_WASTE_FRACTIONS.RDF_1_12])*0.05+0.2*((([USER_WASTE_FRACTIONS.FERROUS_METAL]+[USER_WASTE_FRACTIONS.RDF_1_11])*(1‐[USER_PROCESS_PARAM.FE_RECOVERY]))+([USER_TOTAL.ASH]*0.91)+(([USER_WASTE_FRACTIONS.NON_FERROUS]+[USER_WASTE_FRACTIONS.RDF_1_12])*(1‐[USER_PROCESS_PARAM.NON_FE_RECOVERY]))))
See Query 4.
Process Waste Output > Bottom Ash Ferrous
=[USER_WASTE_FRACTIONS.FERROUS_METAL]*0.90
User defined variable (front screen) Within acceptable industry practice range. Mass flow provided by NLWA would require factor of 1.0; 0.9 used as realistic maximum.
Process Waste Output > Bottom Ash Non Ferrous
=[USER_WASTE_FRACTIONS.NON_FERROUS]*0.0.31137
User defined variable (front screen) Within acceptable industry practice range.
Process Waste Output > Air
=[USER_WASTE_FRACTIONS_T
=ifequal([USER_PROCESS_PARAM.SCRUBBER_TYPE],[SCRUBBER_TYPE.DRY],(
See Query 5.

North London Waste Authority: New Edmonton ERF
Peer review of WRATE Life Cycle AssessmentProject: ARU001 Final report 10
Pollution Control
OTAL]*.03368 [USER_TOTAL.ASH]*0.09)+([USER_WASTE_FRACTIONS_TOTAL]*0.02875),([USER_TOTAL.ASH]*0.09)+([USER_WASTE_FRACTIONS_TOTAL]*0.025))
Query 2: Lifespan of current EfW
FRM Query The extended life of the facility to 55 years will reduce the annualised impact of construction burdens. The current facility will have been refurbished during its current lifespan and would therefore have required major reconstruction works, and therefore it is suggested to revert back to the default 25 year lifespan.
ARUP Response Agreed. This has been changed back to 25 years to provide a fairer like for like comparison.
FRM Comment This response is noted and the amended approach is appropriate.
Query 3: Discrepancies between WRATE process net efficiencies and supporting net efficiencies
FRM Query The electrical efficiency modelled in WRATE for the headline energy output indicator is 20.3427% which differs from the electricity to grid factor of 20.3189%. Consider updating ‘electricity to grid’ factor to match energy output in order to correctly measure carbon equivalent impacts of offset energy use.
ARUP Response Amended to match 20.3427%.
FRM Comment This response and the amended approach are acceptable.
Query 4: Incinerator Bottom Ash (IBA) output
FRM Query The calculated IBA output (non‐metals) is lower than the default WRATE process. We would expect an IBA output (total including metals) of between 20 and 30% of input material. In this scenario a return of 13.999% is achieved. We would suggest that the output of non‐metal IBA is increased in line with the default WRATE flexible EfW process.
ARUP Response Agreed that bottom ash seems low compared to typical values for similar facilities. However 13.999% of input material reflects the mass balance data for 2013/14 as provided by NLWA for the current EfW facility.
FRM Comment This response is acceptable as the IBA from the current EfW is measured rather than estimated in the 2013/14 data. Therefore FRM agree that, although lower than standard EfW performance, this is an acceptable approach to modelling in WRATE having been provided with evidenced mass balance data.
Query 5: APCr output
FRM Query The calculated APC residues output is lower than the default WRATE process. We would expect an APCr output of between 3.5 and 4.5% of input material depending on the abatement control method selected. In this scenario a return of 3.368% is achieved. We would suggest that the output APCr is increased in line with the default WRATE flexible EfW process.
ARUP Response Mass of APCr (info as provided by NLWA) for 2013/14 from current EfW is
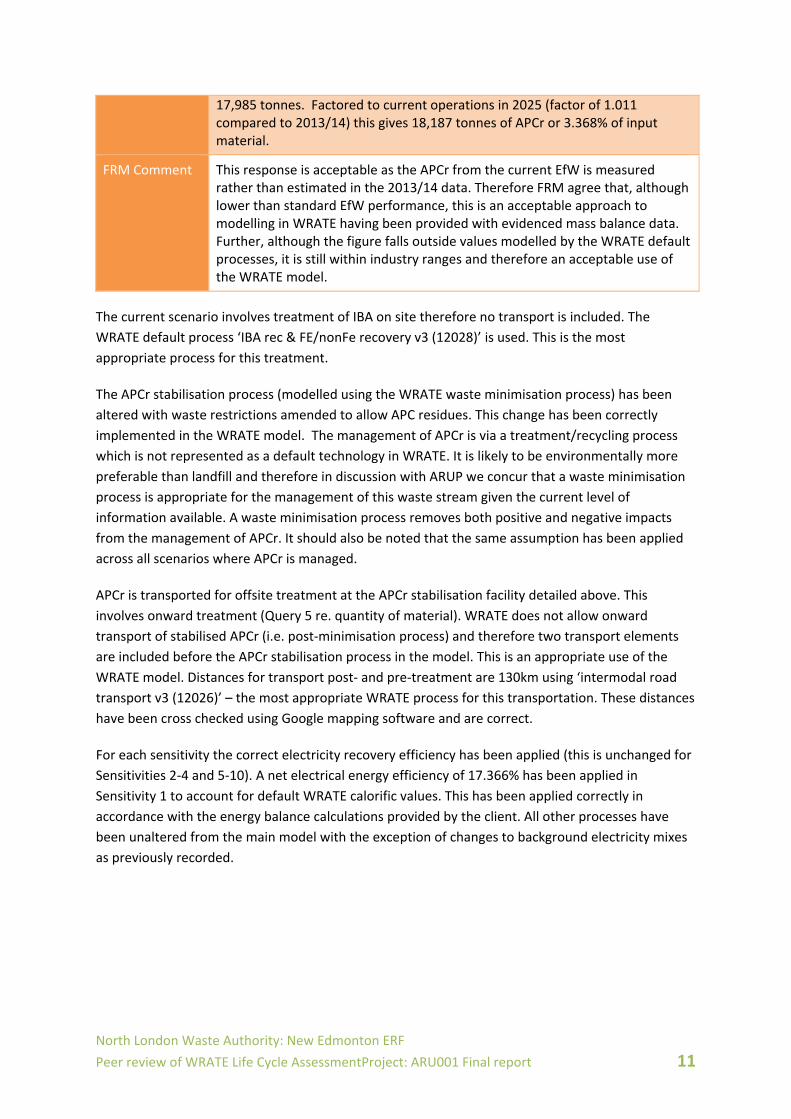
North London Waste Authority: New Edmonton ERF
Peer review of WRATE Life Cycle AssessmentProject: ARU001 Final report 11
17,985 tonnes. Factored to current operations in 2025 (factor of 1.011 compared to 2013/14) this gives 18,187 tonnes of APCr or 3.368% of input material.
FRM Comment This response is acceptable as the APCr from the current EfW is measured rather than estimated in the 2013/14 data. Therefore FRM agree that, although lower than standard EfW performance, this is an acceptable approach to modelling in WRATE having been provided with evidenced mass balance data. Further, although the figure falls outside values modelled by the WRATE default processes, it is still within industry ranges and therefore an acceptable use of the WRATE model.
The current scenario involves treatment of IBA on site therefore no transport is included. The
WRATE default process ‘IBA rec & FE/nonFe recovery v3 (12028)’ is used. This is the most
appropriate process for this treatment.
The APCr stabilisation process (modelled using the WRATE waste minimisation process) has been
altered with waste restrictions amended to allow APC residues. This change has been correctly
implemented in the WRATE model. The management of APCr is via a treatment/recycling process
which is not represented as a default technology in WRATE. It is likely to be environmentally more
preferable than landfill and therefore in discussion with ARUP we concur that a waste minimisation
process is appropriate for the management of this waste stream given the current level of
information available. A waste minimisation process removes both positive and negative impacts
from the management of APCr. It should also be noted that the same assumption has been applied
across all scenarios where APCr is managed.
APCr is transported for offsite treatment at the APCr stabilisation facility detailed above. This
involves onward treatment (Query 5 re. quantity of material). WRATE does not allow onward
transport of stabilised APCr (i.e. post‐minimisation process) and therefore two transport elements
are included before the APCr stabilisation process in the model. This is an appropriate use of the
WRATE model. Distances for transport post‐ and pre‐treatment are 130km using ‘intermodal road
transport v3 (12026)’ – the most appropriate WRATE process for this transportation. These distances
have been cross checked using Google mapping software and are correct.
For each sensitivity the correct electricity recovery efficiency has been applied (this is unchanged for
Sensitivities 2‐4 and 5‐10). A net electrical energy efficiency of 17.366% has been applied in
Sensitivity 1 to account for default WRATE calorific values. This has been applied correctly in
accordance with the energy balance calculations provided by the client. All other processes have
been unaltered from the main model with the exception of changes to background electricity mixes
as previously recorded.

North London Waste Authority: New Edmonton ERF
Peer review of WRATE Life Cycle AssessmentProject: ARU001 Final report 12
2.4 ScenarioC:Futureoperations
Scenario C models the future treatment of the NLWA targeted waste stream exclusively through a
new ERF. The proposed ERF recovers both electrical and thermal energy for export. This is a
consistent approach with all other sensitivities of the future operation.
Figure 3: Schematic of Scenario C – all sensitivities
The waste is modelled through an adapted ERF technology based on the default WRATE flexible EfW
process. For this scenario the ‘Flexible EfW v3 process (ID. 11362)’ is adapted to reflect changes to
the energy efficiency and waste production of the facility. The process has been modelled selecting a
wet SCR flue gas treatment system. The ERF has a net electrical efficiency of 30.083% and net
thermal efficiency of 20% applied (with the exception of sensitivities 1 and 4). This would represent
best practice levels of performance (in terms of electrical efficiency). These efficiencies differ slightly
from the specified values presented in the supplied energy balance documentation (see query 6
below). Metal extraction has been removed from the process reflecting expected operation where
metals are recovered at a later stage rather than at the grate. A summary of changes to the
allocations is provided in Table 3.
Table 3: User defined process for proposed ERF
Parameter User Defined WRATE process
Default WRATE process Comment
Energy Recovered
=([USER_TOTAL.NET_CV]*0.30083)+([USER_TOTAL.NET_CV]*0.2)
User defined variable (front screen)
Changed to reflect reported actual energy outputs. Source ARUP Energy Balance. Slight discrepancy, see Query 6.
External Heat =[USER_TOTAL.NET_CV]*0.2000
User defined variable (front screen)
See Query 6 below.
Electricity to the Grid
=[USER_TOTAL.NET_CV]*0.30083
User defined variable (front screen)
See Query 6 below.
Process Emissions > Nitrogen Oxides to Air
259782 kg Calculated See text below.
NLWA LAC ResidualWaste
2025/2026
NLWA LAC ResidualWaste
2025/2026
Scenario C: Future Operations
OTHEROTHER
IBA (Fe and NonFe recycling)
IBA (Fe and NonFe recycling)
New ERFNew ERF
To CastleEnvironmental
To CastleEnvironmental
To FCC StapleQuarry
To FCC StapleQuarry
APCrstablisation
APCrstablisation
To Off-site IBARecycling
To Off-site IBARecycling
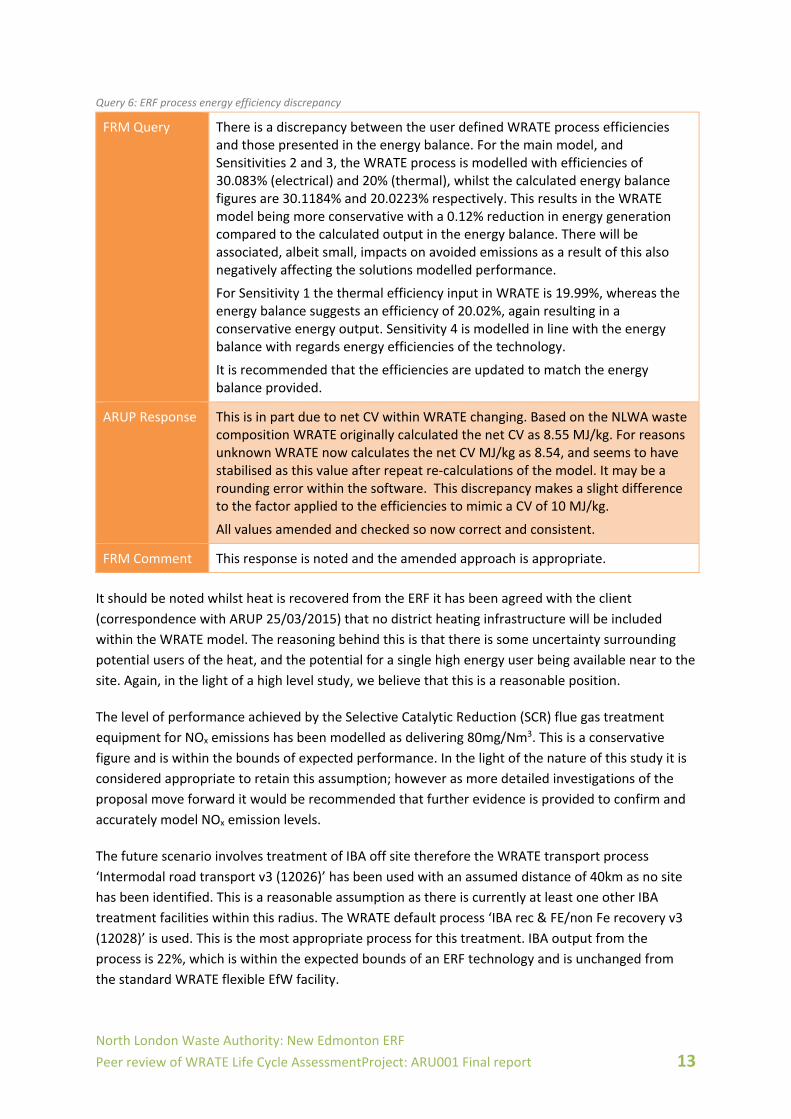
North London Waste Authority: New Edmonton ERF
Peer review of WRATE Life Cycle AssessmentProject: ARU001 Final report 13
Query 6: ERF process energy efficiency discrepancy
FRM Query There is a discrepancy between the user defined WRATE process efficiencies and those presented in the energy balance. For the main model, and Sensitivities 2 and 3, the WRATE process is modelled with efficiencies of 30.083% (electrical) and 20% (thermal), whilst the calculated energy balance figures are 30.1184% and 20.0223% respectively. This results in the WRATE model being more conservative with a 0.12% reduction in energy generation compared to the calculated output in the energy balance. There will be associated, albeit small, impacts on avoided emissions as a result of this also negatively affecting the solutions modelled performance.
For Sensitivity 1 the thermal efficiency input in WRATE is 19.99%, whereas the energy balance suggests an efficiency of 20.02%, again resulting in a conservative energy output. Sensitivity 4 is modelled in line with the energy balance with regards energy efficiencies of the technology.
It is recommended that the efficiencies are updated to match the energy balance provided.
ARUP Response This is in part due to net CV within WRATE changing. Based on the NLWA waste composition WRATE originally calculated the net CV as 8.55 MJ/kg. For reasons unknown WRATE now calculates the net CV MJ/kg as 8.54, and seems to have stabilised as this value after repeat re‐calculations of the model. It may be a rounding error within the software. This discrepancy makes a slight difference to the factor applied to the efficiencies to mimic a CV of 10 MJ/kg.
All values amended and checked so now correct and consistent.
FRM Comment This response is noted and the amended approach is appropriate.
It should be noted whilst heat is recovered from the ERF it has been agreed with the client
(correspondence with ARUP 25/03/2015) that no district heating infrastructure will be included
within the WRATE model. The reasoning behind this is that there is some uncertainty surrounding
potential users of the heat, and the potential for a single high energy user being available near to the
site. Again, in the light of a high level study, we believe that this is a reasonable position.
The level of performance achieved by the Selective Catalytic Reduction (SCR) flue gas treatment
equipment for NOx emissions has been modelled as delivering 80mg/Nm3. This is a conservative
figure and is within the bounds of expected performance. In the light of the nature of this study it is
considered appropriate to retain this assumption; however as more detailed investigations of the
proposal move forward it would be recommended that further evidence is provided to confirm and
accurately model NOx emission levels.
The future scenario involves treatment of IBA off site therefore the WRATE transport process
‘Intermodal road transport v3 (12026)’ has been used with an assumed distance of 40km as no site
has been identified. This is a reasonable assumption as there is currently at least one other IBA
treatment facilities within this radius. The WRATE default process ‘IBA rec & FE/non Fe recovery v3
(12028)’ is used. This is the most appropriate process for this treatment. IBA output from the
process is 22%, which is within the expected bounds of an ERF technology and is unchanged from
the standard WRATE flexible EfW facility.
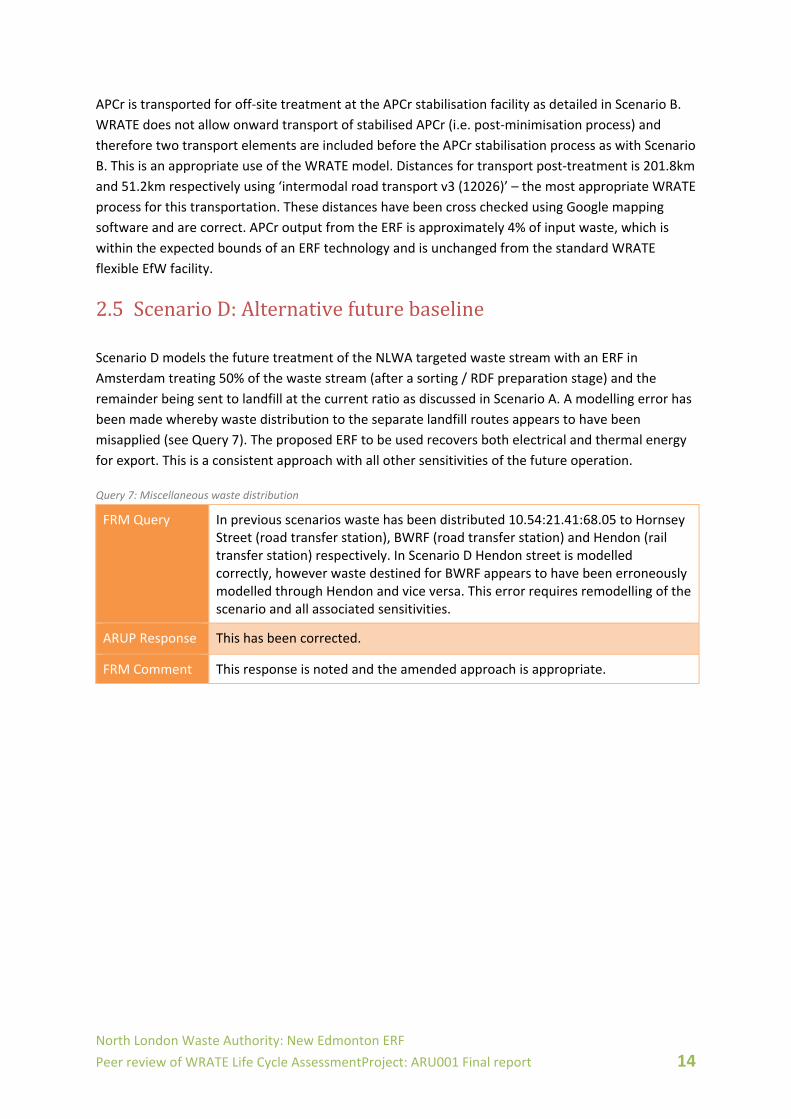
North London Waste Authority: New Edmonton ERF
Peer review of WRATE Life Cycle AssessmentProject: ARU001 Final report 14
APCr is transported for off‐site treatment at the APCr stabilisation facility as detailed in Scenario B.
WRATE does not allow onward transport of stabilised APCr (i.e. post‐minimisation process) and
therefore two transport elements are included before the APCr stabilisation process as with Scenario
B. This is an appropriate use of the WRATE model. Distances for transport post‐treatment is 201.8km
and 51.2km respectively using ‘intermodal road transport v3 (12026)’ – the most appropriate WRATE
process for this transportation. These distances have been cross checked using Google mapping
software and are correct. APCr output from the ERF is approximately 4% of input waste, which is
within the expected bounds of an ERF technology and is unchanged from the standard WRATE
flexible EfW facility.
2.5 ScenarioD:Alternativefuturebaseline
Scenario D models the future treatment of the NLWA targeted waste stream with an ERF in
Amsterdam treating 50% of the waste stream (after a sorting / RDF preparation stage) and the
remainder being sent to landfill at the current ratio as discussed in Scenario A. A modelling error has
been made whereby waste distribution to the separate landfill routes appears to have been
misapplied (see Query 7). The proposed ERF to be used recovers both electrical and thermal energy
for export. This is a consistent approach with all other sensitivities of the future operation.
Query 7: Miscellaneous waste distribution
FRM Query In previous scenarios waste has been distributed 10.54:21.41:68.05 to Hornsey Street (road transfer station), BWRF (road transfer station) and Hendon (rail transfer station) respectively. In Scenario D Hendon street is modelled correctly, however waste destined for BWRF appears to have been erroneously modelled through Hendon and vice versa. This error requires remodelling of the scenario and all associated sensitivities.
ARUP Response This has been corrected.
FRM Comment This response is noted and the amended approach is appropriate.

North London Waste Authority: New Edmonton ERF
Peer review of WRATE Life Cycle AssessmentProject: ARU001 Final report 15
Figure 4: Schematic of Scenario D – all sensitivities
This scenario has been amended from a previous version, to include a dirty MRF to extract metals
and form a crude RDF for export to the AEB Energy from Waste plant in Amsterdam. The energy
balance has been changed to reflect the AEB plant, handling 50% of the contract waste. The
remodelled ERF process has WRATE ID 11381, and is detailed in
The MRF process has WRATE ID 11388, is based on the default WRATE process MRF (for cement kiln/gasifier/pyrolysis) v3,
and is amended as detailed in
Table 5.
Table 4: User defined process for proposed ERF (Scenario D)
Parameter User Defined WRATE process
Default WRATE process Comment
Energy Recovered
=([USER_TOTAL.NET_CV]*0.29894)+([USER_TOTAL.NET_CV]*0.4)
User defined variable (front screen)
Changed to reflect reported actual energy outputs. Source ARUP Energy Balance.
Electricity to Grid
=[USER_TOTAL.NET_CV]*0.29894
User defined variable (front screen)
External Heat =[USER_TOTAL.NET_CV]*0.4000
User defined variable (front screen)
Process Emissions > Nitrogen Oxides to Air
129891 kg Calculated See comments re. Scenario C NOx.
Scenario D: Alternative Future Operations, 50% LAC Residual Waste to Landfill, 50% to AEB EfW in Netherlands
Cranford Landfill,Thrapston Road,Northamptonshire
Cranford Landfill,Thrapston Road,Northamptonshire
OTHEROTHER
Onsite IBA (Fe andNon Fe
recycling)
Onsite IBA (Fe andNon Fe
recycling)
From HornseyStreet
From HornseyStreet
From HendonFrom Hendon
From BWRFFrom BWRF Brackley Lane Landfill,Buckingham
Brackley Lane Landfill,Buckingham
To APCstablisation
To APCstablisation
To Landfill/Undergroundstorage
To Landfill/Undergroundstorage APCr
StablisationAPCr
Stablisation
AEB EfWAEB EfWTo ShipTo Ship
FerrousFerrous
AluminiumAluminium
Ship toNetherlands
Ship toNetherlands
MRF (RDFproduction)MRF (RDFproduction)
NLWA LAC ResidualWaste
2025/2026
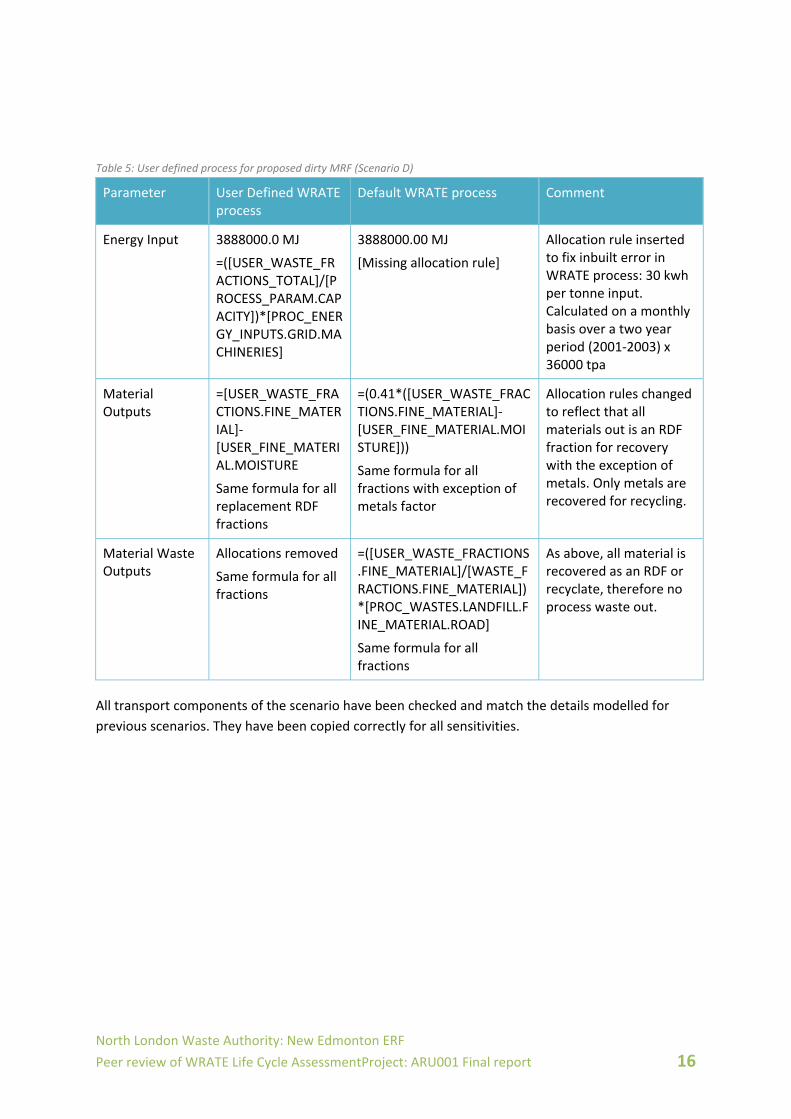
North London Waste Authority: New Edmonton ERF
Peer review of WRATE Life Cycle AssessmentProject: ARU001 Final report 16
Table 5: User defined process for proposed dirty MRF (Scenario D)
Parameter User Defined WRATE process
Default WRATE process Comment
Energy Input 3888000.0 MJ
=([USER_WASTE_FRACTIONS_TOTAL]/[PROCESS_PARAM.CAPACITY])*[PROC_ENERGY_INPUTS.GRID.MACHINERIES]
3888000.00 MJ
[Missing allocation rule]
Allocation rule inserted to fix inbuilt error in WRATE process: 30 kwh per tonne input. Calculated on a monthly basis over a two year period (2001‐2003) x 36000 tpa
Material Outputs
=[USER_WASTE_FRACTIONS.FINE_MATERIAL]‐[USER_FINE_MATERIAL.MOISTURE
Same formula for all replacement RDF fractions
=(0.41*([USER_WASTE_FRACTIONS.FINE_MATERIAL]‐[USER_FINE_MATERIAL.MOISTURE]))
Same formula for all fractions with exception of metals factor
Allocation rules changed to reflect that all materials out is an RDF fraction for recovery with the exception of metals. Only metals are recovered for recycling.
Material Waste Outputs
Allocations removed
Same formula for all fractions
=([USER_WASTE_FRACTIONS.FINE_MATERIAL]/[WASTE_FRACTIONS.FINE_MATERIAL])*[PROC_WASTES.LANDFILL.FINE_MATERIAL.ROAD]
Same formula for all fractions
As above, all material is recovered as an RDF or recyclate, therefore no process waste out.
All transport components of the scenario have been checked and match the details modelled for
previous scenarios. They have been copied correctly for all sensitivities.

North London Waste Authority: New Edmonton ERF
Peer review of WRATE Life Cycle AssessmentProject: ARU001 Final report 17
3 Conclusions
FRM has conducted a peer review of the Arup WRATE model (and sensitivities) and find that the
methodology and construction of the model have been appropriately applied.
The review has been undertaken in the light that this is a high level model to facilitate comparison
between options (with a degree of sensitivity analysis). It is recommended that a more thorough
modelling exercise, including a greater degree of technical substantiation, is provided for any more
detailed assessment e.g. as part of a procurement exercise or to support a funding application.
We note that there is a discrepancy between the WRATE default calorific value for the given waste
composition and the NLWA reported calorific value for the same waste composition. This
discrepancy has been addressed by Arup through modelling both the NLWA and default CVs (the
main WRATE project file and Sensitivity 1 respectively).
We could only partially review Sensitivity 4 (carbon intensity floor calculation) as this a policy driven
factor that is calculated using the GLA Greenhouse Gas Calculator rather than WRATE. We are
informed that this calculator will be submitted in parallel with the WRATE report. We have,
however, undertaken a check of the direct process burdens of the ERF for the amount of energy
recovered in this sensitivity and WRATE reports that it is below the maximum CIF threshold of
400gCO2e/kWh.
Overall FRM consider that the model and choice of sensitivities are appropriate and has been
conducted using reasonable assumptions and due care and diligence.
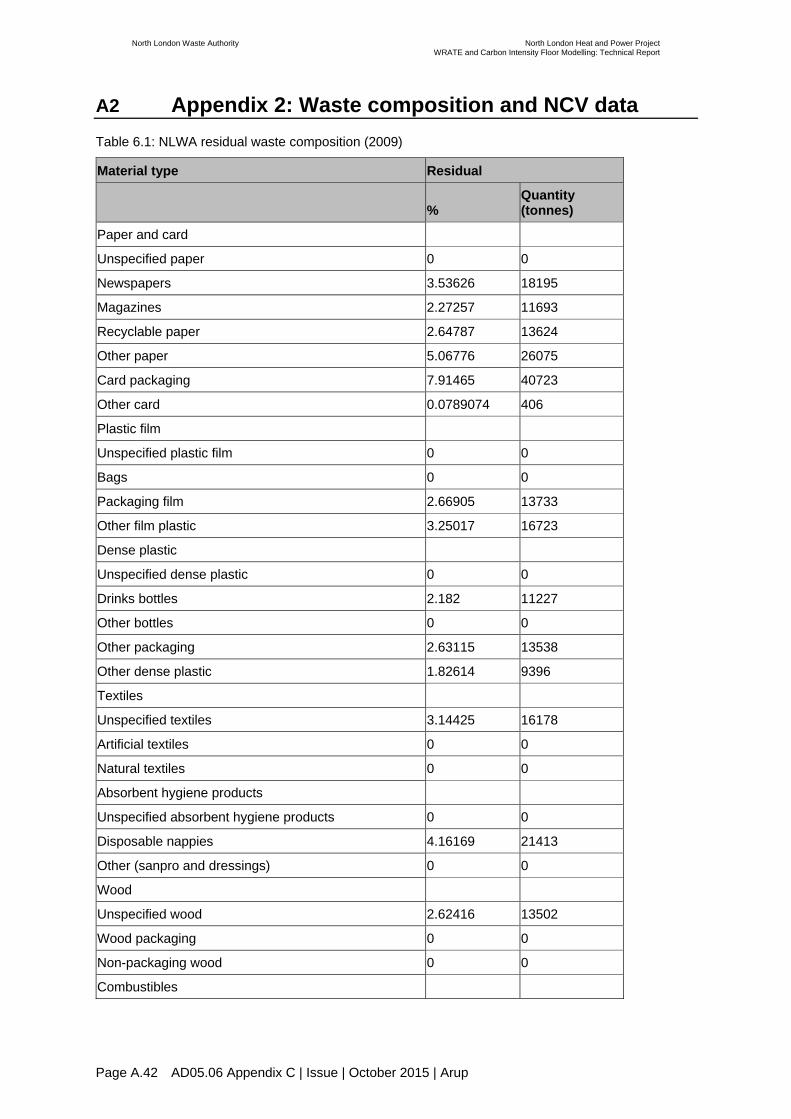
North London Waste Authority North London Heat and Power ProjectWRATE and Carbon Intensity Floor Modelling: Technical Report
Page A.42 AD05.06 Appendix C | Issue | October 2015 | Arup
A2 Appendix 2: Waste composition and NCV data Table 6.1: NLWA residual waste composition (2009)
Material type Residual
% Quantity (tonnes)
Paper and card
Unspecified paper 0 0
Newspapers 3.53626 18195
Magazines 2.27257 11693
Recyclable paper 2.64787 13624
Other paper 5.06776 26075
Card packaging 7.91465 40723
Other card 0.0789074 406
Plastic film
Unspecified plastic film 0 0
Bags 0 0
Packaging film 2.66905 13733
Other film plastic 3.25017 16723
Dense plastic
Unspecified dense plastic 0 0
Drinks bottles 2.182 11227
Other bottles 0 0
Other packaging 2.63115 13538
Other dense plastic 1.82614 9396
Textiles
Unspecified textiles 3.14425 16178
Artificial textiles 0 0
Natural textiles 0 0
Absorbent hygiene products
Unspecified absorbent hygiene products 0 0
Disposable nappies 4.16169 21413
Other (sanpro and dressings) 0 0
Wood
Unspecified wood 2.62416 13502
Wood packaging 0 0
Non-packaging wood 0 0
Combustibles
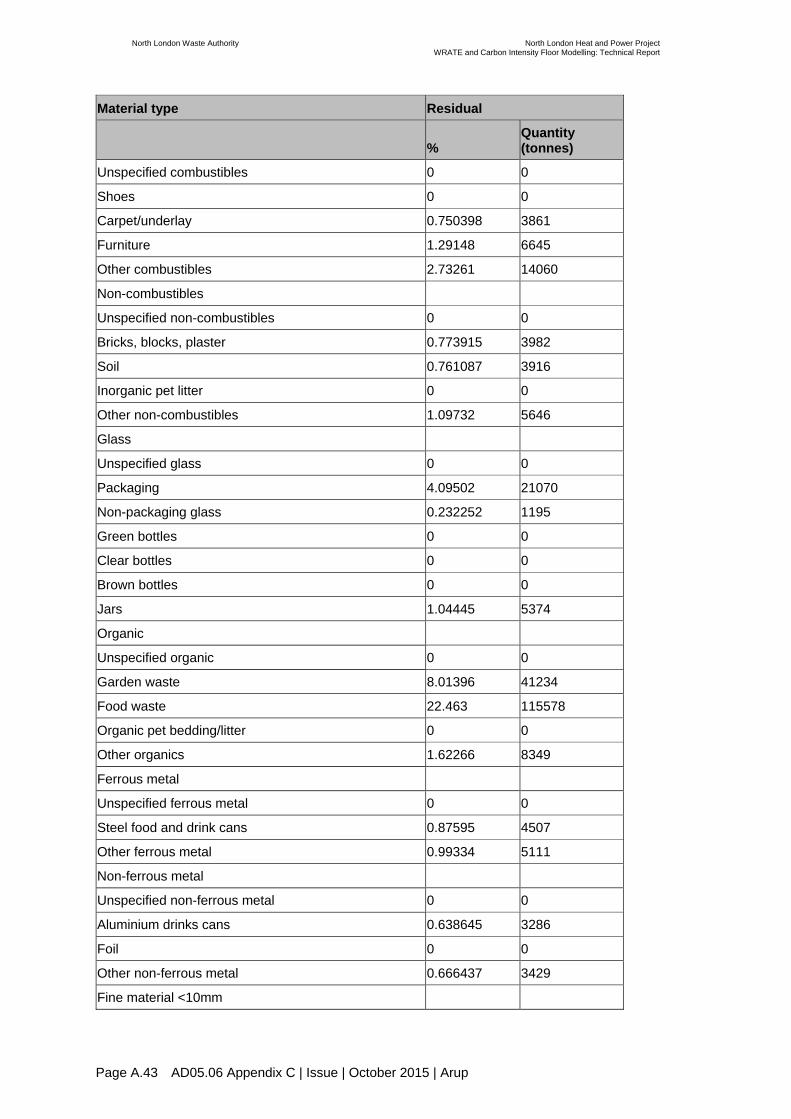
North London Waste Authority North London Heat and Power ProjectWRATE and Carbon Intensity Floor Modelling: Technical Report
Page A.43 AD05.06 Appendix C | Issue | October 2015 | Arup
Material type Residual
% Quantity (tonnes)
Unspecified combustibles 0 0
Shoes 0 0
Carpet/underlay 0.750398 3861
Furniture 1.29148 6645
Other combustibles 2.73261 14060
Non-combustibles
Unspecified non-combustibles 0 0
Bricks, blocks, plaster 0.773915 3982
Soil 0.761087 3916
Inorganic pet litter 0 0
Other non-combustibles 1.09732 5646
Glass
Unspecified glass 0 0
Packaging 4.09502 21070
Non-packaging glass 0.232252 1195
Green bottles 0 0
Clear bottles 0 0
Brown bottles 0 0
Jars 1.04445 5374
Organic
Unspecified organic 0 0
Garden waste 8.01396 41234
Food waste 22.463 115578
Organic pet bedding/litter 0 0
Other organics 1.62266 8349
Ferrous metal
Unspecified ferrous metal 0 0
Steel food and drink cans 0.87595 4507
Other ferrous metal 0.99334 5111
Non-ferrous metal
Unspecified non-ferrous metal 0 0
Aluminium drinks cans 0.638645 3286
Foil 0 0
Other non-ferrous metal 0.666437 3429
Fine material <10mm
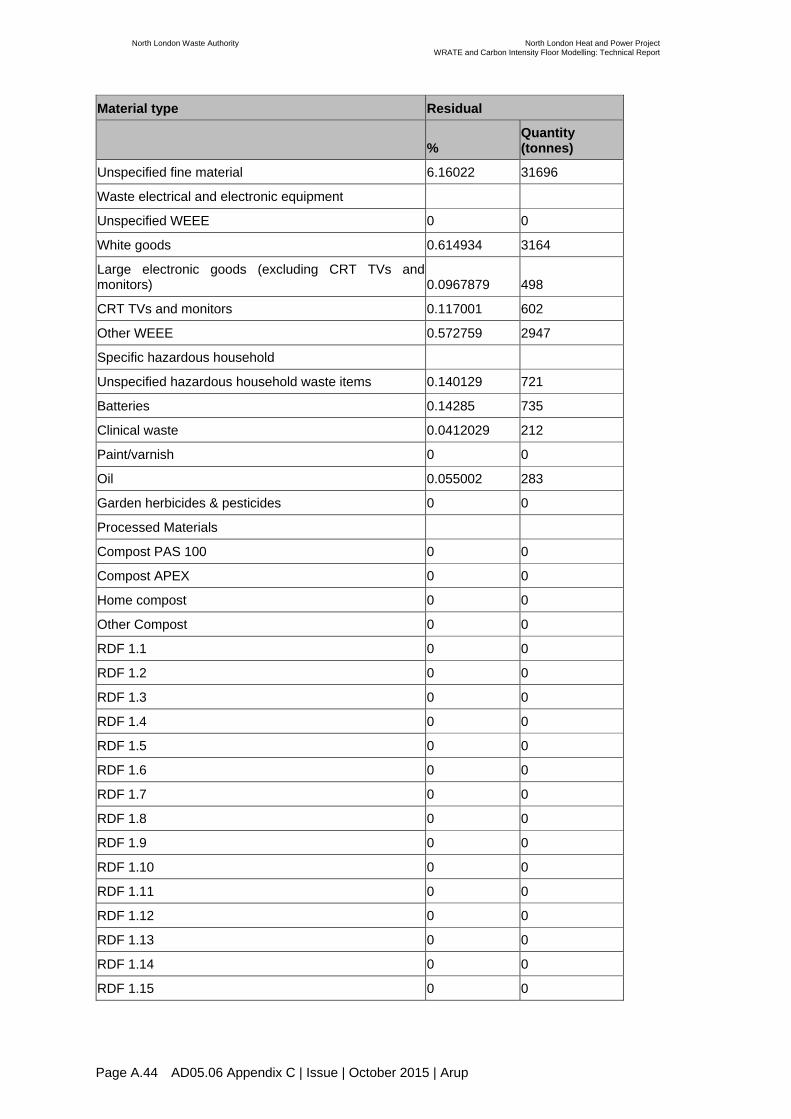
North London Waste Authority North London Heat and Power ProjectWRATE and Carbon Intensity Floor Modelling: Technical Report
Page A.44 AD05.06 Appendix C | Issue | October 2015 | Arup
Material type Residual
% Quantity (tonnes)
Unspecified fine material 6.16022 31696
Waste electrical and electronic equipment
Unspecified WEEE 0 0
White goods 0.614934 3164
Large electronic goods (excluding CRT TVs and monitors) 0.0967879 498
CRT TVs and monitors 0.117001 602
Other WEEE 0.572759 2947
Specific hazardous household
Unspecified hazardous household waste items 0.140129 721
Batteries 0.14285 735
Clinical waste 0.0412029 212
Paint/varnish 0 0
Oil 0.055002 283
Garden herbicides & pesticides 0 0
Processed Materials
Compost PAS 100 0 0
Compost APEX 0 0
Home compost 0 0
Other Compost 0 0
RDF 1.1 0 0
RDF 1.2 0 0
RDF 1.3 0 0
RDF 1.4 0 0
RDF 1.5 0 0
RDF 1.6 0 0
RDF 1.7 0 0
RDF 1.8 0 0
RDF 1.9 0 0
RDF 1.10 0 0
RDF 1.11 0 0
RDF 1.12 0 0
RDF 1.13 0 0
RDF 1.14 0 0
RDF 1.15 0 0

North London Waste Authority North London Heat and Power ProjectWRATE and Carbon Intensity Floor Modelling: Technical Report
Page A.45 AD05.06 Appendix C | Issue | October 2015 | Arup
Material type Residual
% Quantity (tonnes)
RDF 1.16 0 0
Fiber 1.1 0 0
Fiber 1.2 0 0
Fiber 1.3 0 0
Fiber 1.4 0 0
Fiber 1.5 0 0
Fiber 1.6 0 0
Fiber 1.7 0 0
Fiber 1.8 0 0
Fiber 1.9 0 0
Fiber 1.10 0 0
Fiber 1.11 0 0
Fiber 1.12 0 0
Fiber 1.13 0 0
Fiber 1.14 0 0
Fiber 1.15 0 0
Fiber 1.16 0 0
Stabilite S1 0 0
Stabilite S2 0 0
Stabilite S3 0 0
Stabilite S4 0 0
Stabilite S5 0 0
Stabilite S6 0 0
Stabilite S7 0 0
Stabilite S8 0 0
Stabilite S9 0 0
Stabilite S10 0 0
Stabilite S11 0 0
Stabilite S12 0 0
Stabilite S13 0 0
Stabilite S14 0 0
Stabilite S15 0 0
IBA 0 0
IBA ferrous 0 0
IBA non-ferrous 0 0

North London Waste Authority North London Heat and Power ProjectWRATE and Carbon Intensity Floor Modelling: Technical Report
Page A.46 AD05.06 Appendix C | Issue | October 2015 | Arup
Material type Residual
% Quantity (tonnes)
APCr APC 1 0 0
APCr APC 2 0 0
APCr APC 3 0 0
Non-municipal solid waste
Sewage sludge (dry basis) 0 0
Waste oils 0 0
Tyres 0 0
Wheat straw 0 0
Meat and bone meal 0 0
AWDF (rendered hoofs, horns, blood etc) 0 0
Untreated willow 0 0
Total 100 514,527 Table 6.2: NCV data used to model Scenarios under Approach 2
Waste fraction NCV (MJ/kg) NCV prorated for 10MJ/kg
Paper/card 10.21 11.96
Non-recyclable paper 9.24 10.82
Dense plastic 23.44 27.45
Plastic film 20.21 23.67
Textiles 13.61 15.94
Misc. combustibles 13.88 16.25
Misc. non-combustibles 2.44 2.86
Glass 1.34 1.57
Ferrous metal 0.00 0.00
Non-ferrous metal 0.00 0.00
Kitchen organics 3.29 3.85
Garden organics 4.00 4.68
Electrical/electronic equipment 6.71 7.85
Potentially hazardous 0.00 0.00
Fines 3.31 3.87
NCV of municipal solid waste 8.54 10.00

North London Waste Authority North London Heat and Power ProjectWRATE and Carbon Intensity Floor Modelling: Technical Report
Page A.47 AD05.06 Appendix C | Issue | October 2015 | Arup
A3 Appendix 3: Modelling parameters and energy/mass balance

North London Waste Authority North London Heat and Power ProjectWRATE and Carbon Intensity Floor Modelling: Technical Report
Page A.48 AD05.06 Appendix C | Issue | October 2015 | Arup
Table 6.3: Modelling parameters and energy/mass balance for main analysis Scenario and Sensitivity Analysis 1

North London Waste Authority North London Heat and Power ProjectWRATE and Carbon Intensity Floor Modelling: Technical Report
Page A.49 AD05.06 Appendix C | Issue | October 2015 | Arup
Table 6.4: Modelling parameters and energy/mass balance for Sensitivity Analyses 2, 3 and 4

North London Waste Authority North London Heat and Power ProjectWRATE and Carbon Intensity Floor Modelling: Technical Report
Page A.50 AD05.06 Appendix C | Issue | October 2015 | Arup
Table 6.5: Modelling parameters and energy/mass balance for Sensitivity Analyses 5, 6 and 7

North London Waste Authority North London Heat and Power ProjectWRATE and Carbon Intensity Floor Modelling: Technical Report
Page A.51 AD05.06 Appendix C | Issue | October 2015 | Arup
Table 6.6: Modelling parameters and energy/mass balance for Sensitivity Analyses 8, 9 and 10
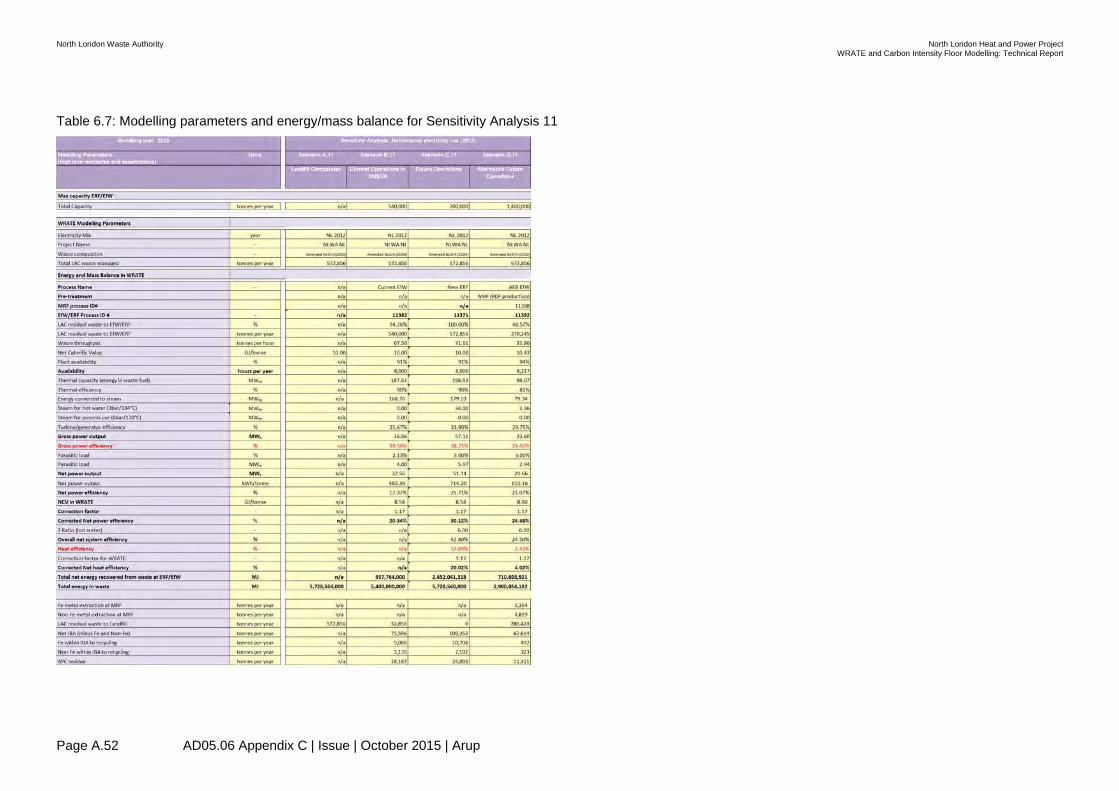
North London Waste Authority North London Heat and Power ProjectWRATE and Carbon Intensity Floor Modelling: Technical Report
Page A.52 AD05.06 Appendix C | Issue | October 2015 | Arup
Table 6.7: Modelling parameters and energy/mass balance for Sensitivity Analysis 11

North London Waste Authority North London Heat and Power ProjectWRATE and Carbon Intensity Floor Modelling: Technical Report
Page A.53 AD05.06 Appendix C | Issue | October 2015 | Arup
A4 Appendix 4: Default WRATE electricity mix (UK: 2025, 2030 and 2035, and the Netherlands: 2012)
A4.1.1 Note: Transmission losses are the same for all three UK
electricity mixes: a. high voltage, 1.81 per cent; b. medium voltage, 4.74 per cent; and c. low voltage, 7.68 per cent.
A4.1.2 For the Netherlands electricity mix, transmission losses are: a. high voltage, 0.26 per cent; b. medium voltage, 0.75 per cent; and c. low voltage, 3.75 per cent.
Table 6.8: 2025 UK default electricity mix from WRATE
Energy source Baseline fuel mix (%)
Generating efficiencies (%)
Marginal fuel mix (%)
Coal 2.86 33.92 8.06
Oil 0.40 26.49 0.00
Gas 1.90 41.19 0.00
Gas CCGT 28.05 46.84 91.94
Nuclear 21.43 35.71 0.00
Waste 0.00 19.38 0.00
Thermal other 0.55 22.64 0.00
Renewables thermal 7.47 27.47
0.00
Solar PV 0.00 15.52 0.00
Wind 26.80 25.00 0.00
Tidal 7.03 82.00 0.00
Wave 0.00 82.00 0.00
Hydro 2.21 82.00 0.00
Geothermal 0.00 82.00 0.00
Renewable other 1.29 82.00 0.00
Total 100.00 N/A 100.00

North London Waste Authority North London Heat and Power ProjectWRATE and Carbon Intensity Floor Modelling: Technical Report
Page A.54 AD05.06 Appendix C | Issue | October 2015 | Arup
Table 6.9: 2030 UK default electricity mix from WRATE
Energy source Baseline fuel mix (%)
Generating efficiencies (%)
Marginal fuel mix (%)
Coal 4.43 33.92 14.15
Oil 0.31 26.49 0.00
Gas 1.56 41.19 0.00
Gas CCGT 22.92 46.84 85.85
Nuclear 28.85 35.71 0.00
Waste 0.00 19.38 0.00
Thermal other 0.49 22.64 0.00
Renewables thermal 6.59 27.47
0.00
Solar PV 0.00 15.52 0.00
Wind 24.97 25.00 0.00
Tidal 6.81 82.00 0.00
Wave 0.00 82.00 0.00
Hydro 1.88 82.00 0.00
Geothermal 0.00 82.00 0.00
Renewable other 1.19 82.00 0.00
Total 100.00 N/A 100.00 Table 6.10: 2035 UK default electricity mix from WRATE
Energy source Baseline fuel mix (%)
Generating efficiencies (%)
Marginal fuel mix (%)
Coal 7.54 33.92 30.98
Oil 0.27 26.49 0.00
Gas 0.95 41.19 0.00
Gas CCGT 14.00 46.84 69.02
Nuclear 38.11 35.71 0.00
Waste 0.00 19.38 0.00
Thermal other 0.44 22.64 0.00
Renewables thermal 6.15 27.47
0.00
Solar PV 0.00 15.52 0.00
Wind 23.24 25.00 0.00
Tidal 6.47 82.00 0.00
Wave 0.00 82.00 0.00
Hydro 1.74 82.00 0.00
Geothermal 0.00 82.00 0.00
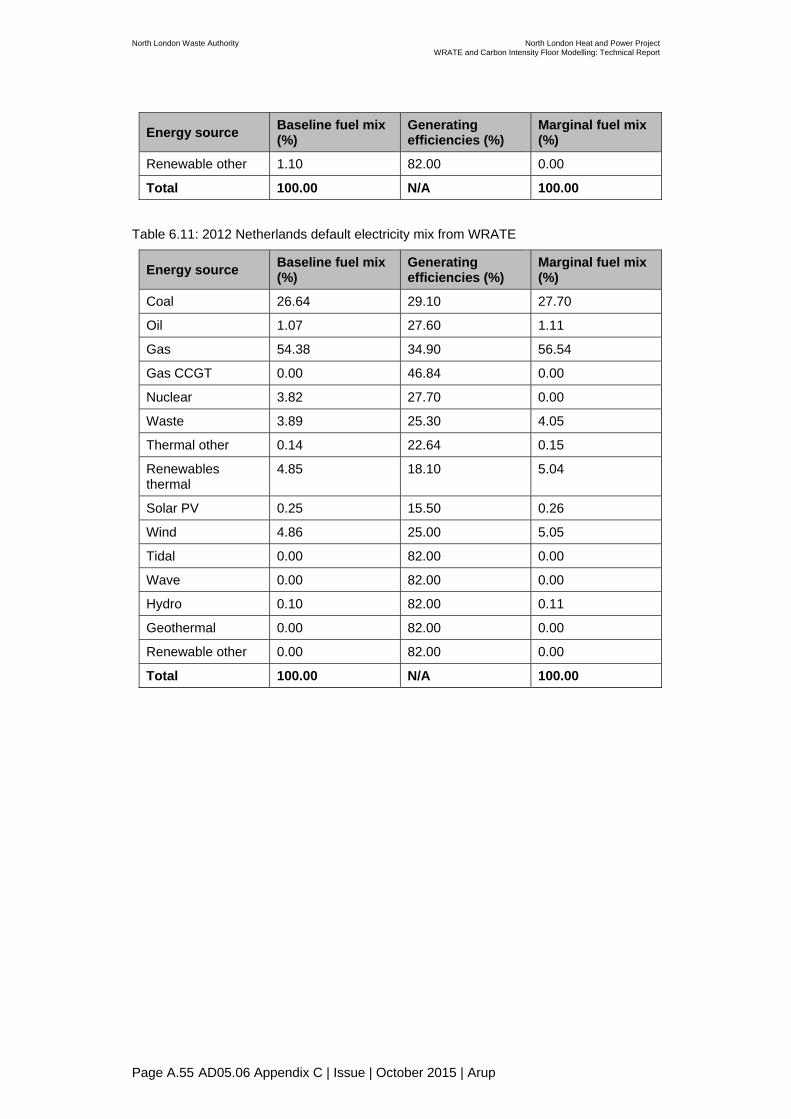
North London Waste Authority North London Heat and Power ProjectWRATE and Carbon Intensity Floor Modelling: Technical Report
Page A.55 AD05.06 Appendix C | Issue | October 2015 | Arup
Energy source Baseline fuel mix (%)
Generating efficiencies (%)
Marginal fuel mix (%)
Renewable other 1.10 82.00 0.00
Total 100.00 N/A 100.00 Table 6.11: 2012 Netherlands default electricity mix from WRATE
Energy source Baseline fuel mix (%)
Generating efficiencies (%)
Marginal fuel mix (%)
Coal 26.64 29.10 27.70
Oil 1.07 27.60 1.11
Gas 54.38 34.90 56.54
Gas CCGT 0.00 46.84 0.00
Nuclear 3.82 27.70 0.00
Waste 3.89 25.30 4.05
Thermal other 0.14 22.64 0.15
Renewables thermal
4.85 18.10 5.04
Solar PV 0.25 15.50 0.26
Wind 4.86 25.00 5.05
Tidal 0.00 82.00 0.00
Wave 0.00 82.00 0.00
Hydro 0.10 82.00 0.11
Geothermal 0.00 82.00 0.00
Renewable other 0.00 82.00 0.00
Total 100.00 N/A 100.00
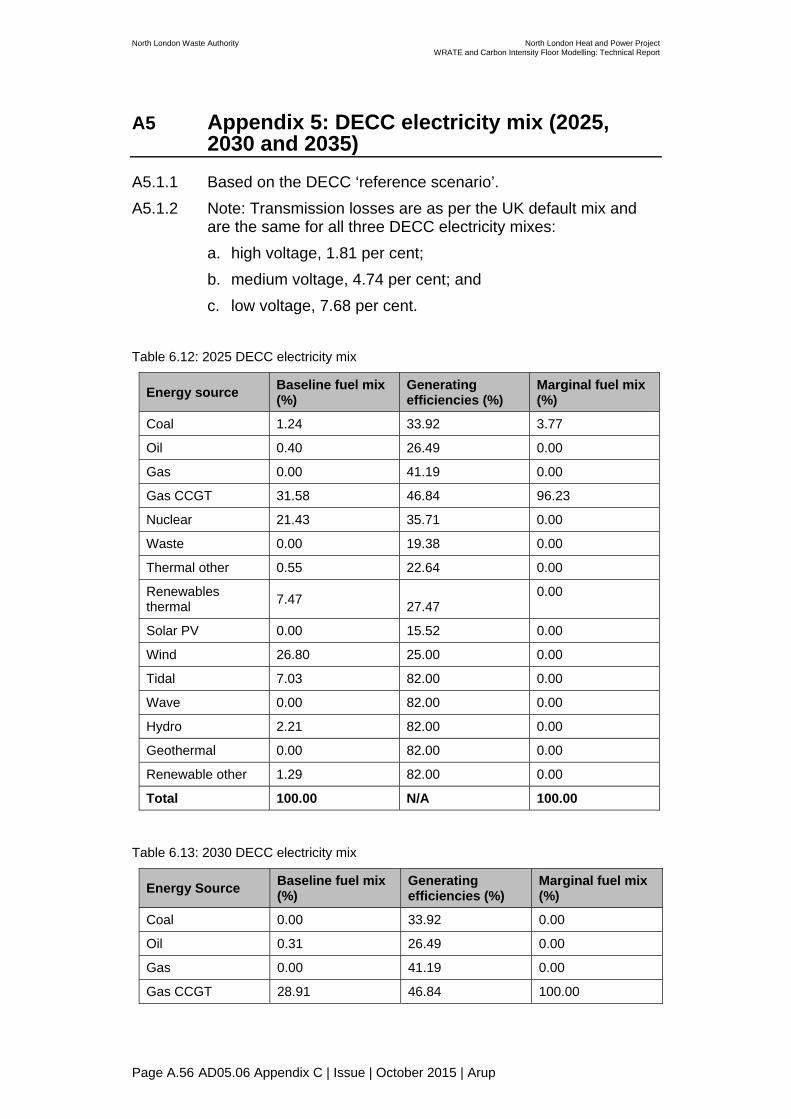
North London Waste Authority North London Heat and Power ProjectWRATE and Carbon Intensity Floor Modelling: Technical Report
Page A.56 AD05.06 Appendix C | Issue | October 2015 | Arup
A5 Appendix 5: DECC electricity mix (2025, 2030 and 2035)
A5.1.1 Based on the DECC ‘reference scenario’. A5.1.2 Note: Transmission losses are as per the UK default mix and
are the same for all three DECC electricity mixes: a. high voltage, 1.81 per cent; b. medium voltage, 4.74 per cent; and c. low voltage, 7.68 per cent.
Table 6.12: 2025 DECC electricity mix
Energy source Baseline fuel mix (%)
Generating efficiencies (%)
Marginal fuel mix (%)
Coal 1.24 33.92 3.77
Oil 0.40 26.49 0.00
Gas 0.00 41.19 0.00
Gas CCGT 31.58 46.84 96.23
Nuclear 21.43 35.71 0.00
Waste 0.00 19.38 0.00
Thermal other 0.55 22.64 0.00
Renewables thermal 7.47 27.47
0.00
Solar PV 0.00 15.52 0.00
Wind 26.80 25.00 0.00
Tidal 7.03 82.00 0.00
Wave 0.00 82.00 0.00
Hydro 2.21 82.00 0.00
Geothermal 0.00 82.00 0.00
Renewable other 1.29 82.00 0.00
Total 100.00 N/A 100.00
Table 6.13: 2030 DECC electricity mix
Energy Source Baseline fuel mix (%)
Generating efficiencies (%)
Marginal fuel mix (%)
Coal 0.00 33.92 0.00
Oil 0.31 26.49 0.00
Gas 0.00 41.19 0.00
Gas CCGT 28.91 46.84 100.00

North London Waste Authority North London Heat and Power ProjectWRATE and Carbon Intensity Floor Modelling: Technical Report
Page A.57 AD05.06 Appendix C | Issue | October 2015 | Arup
Energy Source Baseline fuel mix (%)
Generating efficiencies (%)
Marginal fuel mix (%)
Nuclear 28.85 35.71 0.00
Waste 0.00 19.38 0.00
Thermal other 0.49 22.64 0.00
Renewables thermal 6.59 27.47
0.00
Solar PV 0.00 15.52 0.00
Wind 24.97 25.00 0.00
Tidal 6.81 82.00 0.00
Wave 0.00 82.00 0.00
Hydro 1.88 82.00 0.00
Geothermal 0.00 82.00 0.00
Renewable other 1.19 82.00 0.00
Total 100.00 N/A 100.00
Table 6.14: 2035 DECC electricity mix
Energy Source Baseline fuel mix (%)
Generating efficiencies (%)
Marginal fuel mix (%)
Coal 0.00 33.92 0.00
Oil 0.27 26.49 0.00
Gas 0.00 41.19 0.00
Gas CCGT 22.49 46.84 100.00
Nuclear 38.11 35.71 0.00
Waste 0.00 19.38 0.00
Thermal other 0.44 22.64 0.00
Renewables thermal 6.15 27.47
0.00
Solar PV 0.00 15.52 0.00
Wind 23.24 25.00 0.00
Tidal 6.47 82.00 0.00
Wave 0.00 82.00 0.00
Hydro 1.74 82.00 0.00
Geothermal 0.00 82.00 0.00
Renewable other 1.10 82.00 0.00
Total 100.00 N/A 100.00

North London Waste Authority North London Heat and Power ProjectWRATE and Carbon Intensity Floor Modelling: Technical Report
Page A.58 AD05.06 Appendix C | Issue | October 2015 | Arup
A6 Appendix 6: National Grid electricity mix (2025, 2030 and 2035)
A6.1.1 Based on the NG ‘gone green’ projection. A6.1.2 Note: transmission losses are as per the UK default mix and are
the same for all three National Grid electricity mixes: a. high voltage, 1.81 per cent; b. medium voltage, 4.74 per cent; and c. low voltage, 7.68 per cent.
Table 6.15: 2025 National Grid electricity mix
Energy source Baseline fuel mix (%)
Generating efficiencies (%)
Marginal fuel mix (%)
Coal 3.86 33.92 0.00
Oil 0.02 26.49 0.00
Gas 0.00 41.19 0.00
Gas CCGT 30.18 46.84 0.00
Nuclear 12.16 35.71 0.00
Waste 0.00 19.38 0.00
Thermal other 0.00 22.64 0.00
Renewables thermal 7.17 27.47 13.33
Solar PV 2.55 15.52 4.74
Wind 38.87 25.00 72.26
Tidal 0.00 82.00 0.00
Wave 0.00 82.00 0.00
Hydro 2.64 82.00 4.91
Geothermal 0.00 82.00 0.00
Renewable other 2.55 82.00 4.75
Total 100.00 N/A 100.00
Table 6.16: 2030 National Grid electricity mix
Energy source Baseline fuel mix (%)
Generating efficiencies (%)
Marginal fuel mix (%)
Coal 0.46 33.92 0.00
Oil 0.01 26.49 0.00
Gas 0.00 41.19 0.00
Gas CCGT 30.61 46.84 0.00

North London Waste Authority North London Heat and Power ProjectWRATE and Carbon Intensity Floor Modelling: Technical Report
Page A.59 AD05.06 Appendix C | Issue | October 2015 | Arup
Energy source Baseline fuel mix (%)
Generating efficiencies (%)
Marginal fuel mix (%)
Nuclear 14.70 35.71 0.00
Waste 0.00 19.38 0.00
Thermal other 0.00 22.64 0.00
Renewables thermal 6.18 27.47 11.39
Solar PV 3.00 15.52 5.54
Wind 38.94 25.00 71.83
Tidal 0.00 82.00 0.00
Wave 0.00 82.00 0.00
Hydro 3.40 82.00 6.27
Geothermal 0.00 82.00 0.00
Renewable other 2.69 82.00 4.97
Total 100.00 N/A 100.00
Table 6.17: 2035 National Grid electricity mix
Energy source Baseline fuel mix (%)
Generating efficiencies (%)
Marginal fuel mix (%)
Coal 0.44 33.92 0.00
Oil 0.01 26.49 0.00
Gas 0.00 41.19 0.00
Gas CCGT 26.86 46.84 0.00
Nuclear 16.52 35.71 0.00
Waste 0.00 19.38 0.00
Thermal other 0.00 22.64 0.00
Renewables thermal 5.69 27.47 10.13
Solar PV 3.69 15.52 6.57
Wind 40.20 25.00 71.56
Tidal 0.00 82.00 0.00
Wave 0.00 82.00 0.00
Hydro 3.56 82.00 6.33
Geothermal 0.00 82.00 0.00
Renewable other 3.04 82.00 5.41
Total 100.00 N/A 100.00

North London Waste Authority North London Heat and Power ProjectWRATE and Carbon Intensity Floor Modelling: Technical Report
Page A.60 AD05.06 Appendix C | Issue | October 2015 | Arup
A7 Appendix 7: Modelling results Table 6.18: Modelling results for the main analysis and Sensitivity Analysis 1
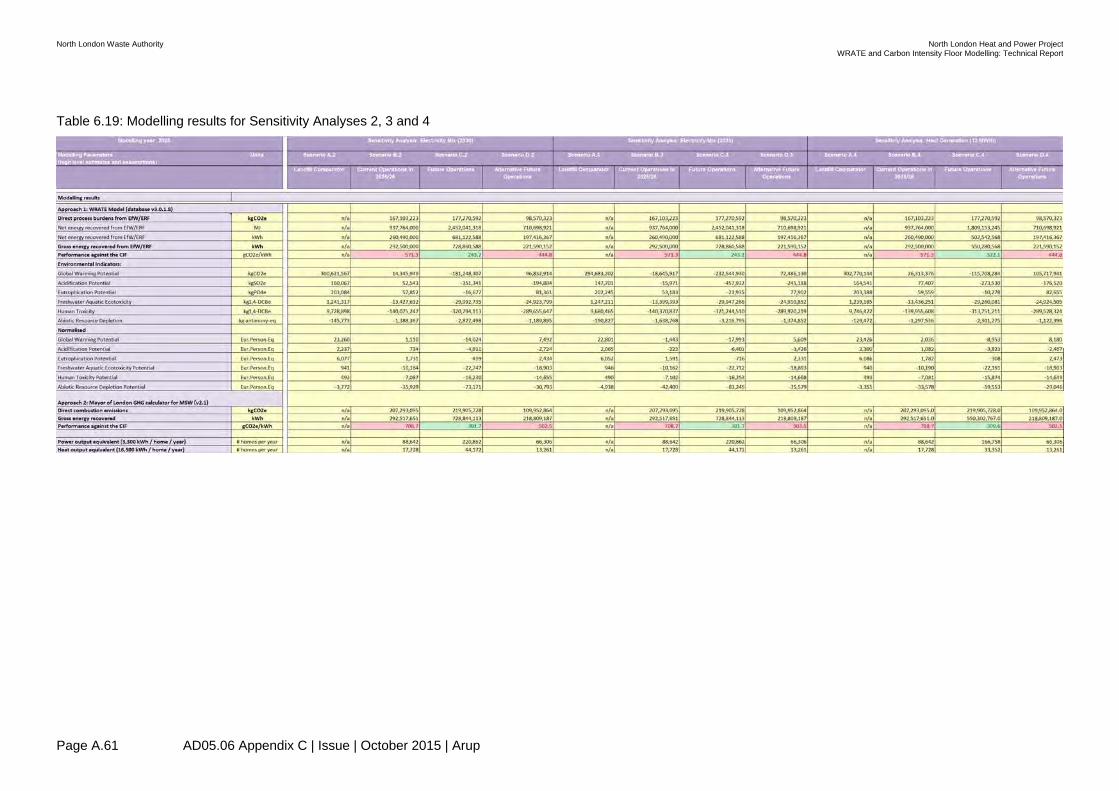
North London Waste Authority North London Heat and Power ProjectWRATE and Carbon Intensity Floor Modelling: Technical Report
Page A.61 AD05.06 Appendix C | Issue | October 2015 | Arup
Table 6.19: Modelling results for Sensitivity Analyses 2, 3 and 4
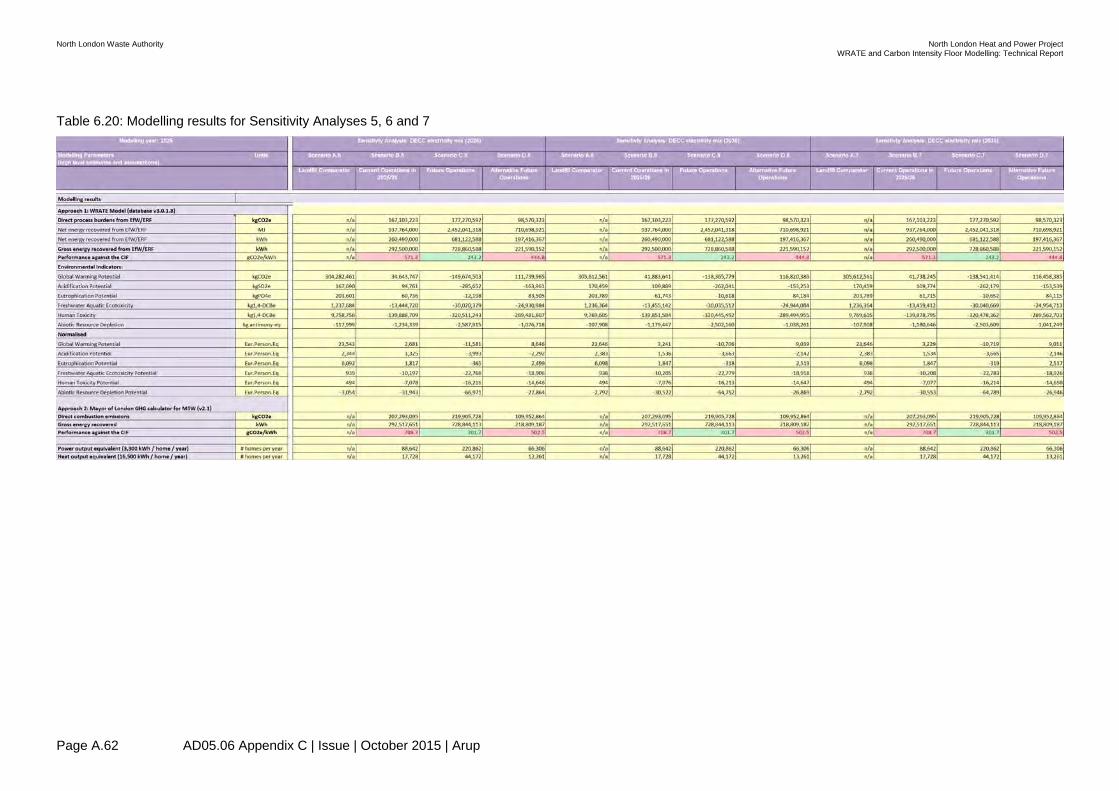
North London Waste Authority North London Heat and Power ProjectWRATE and Carbon Intensity Floor Modelling: Technical Report
Page A.62 AD05.06 Appendix C | Issue | October 2015 | Arup
Table 6.20: Modelling results for Sensitivity Analyses 5, 6 and 7

North London Waste Authority North London Heat and Power ProjectWRATE and Carbon Intensity Floor Modelling: Technical Report
Page A.63 AD05.06 Appendix C | Issue | October 2015 | Arup
Table 6.21: Modelling results for Sensitivity Analyses 8, 9 and 10
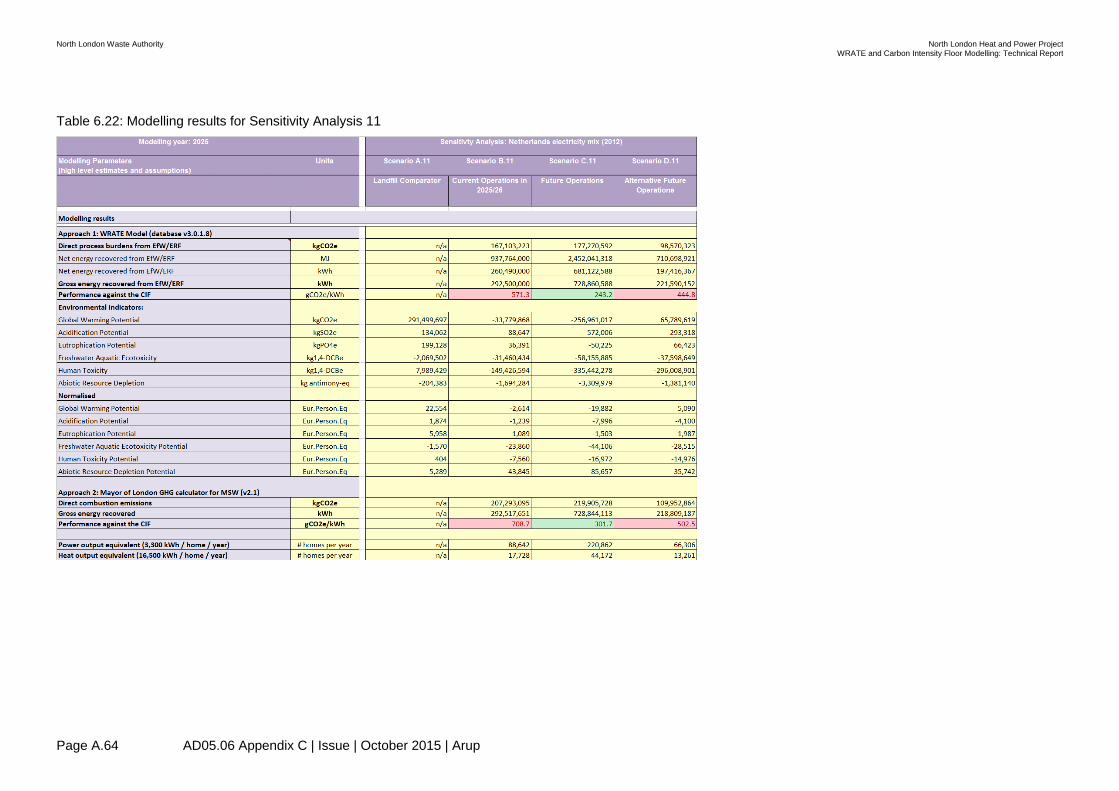
North London Waste Authority North London Heat and Power ProjectWRATE and Carbon Intensity Floor Modelling: Technical Report
Page A.64 AD05.06 Appendix C | Issue | October 2015 | Arup
Table 6.22: Modelling results for Sensitivity Analysis 11
Page D.1 AD05.06 | Issue | October 2015 | Arup
Appendix D – District Heating Route Feasibility Study

North London Waste Authority North London Heat and Power Project District Heating Routing Feasibility Study
AD05.06 Appendix D
Issue | August 2015
Arup
This report takes into account the particular instructions and requirements of our client. It is not intended for and should not be relied upon by any third party and no responsibility is undertaken to any third party.

Page 1 AD05.06 Appendix D | Issue | August 2015 | Arup
Contents
Page
1 Overview 3 1.2 Baseline information 3 1.3 Core study area 5
2 Pipe route assumptions 6
3 The Route 9 3.1 Phase 01 – Route from the DHEC to existing EfW facility 9 3.2 Phase 02 – Extension of the district heating pipes to the proposed
ERF 11 3.3 Contingency route – route from the ERF facility to Deephams
Farm Road 11
4 Key engineering constraints 13 Phase 01 13
5 Phase 01 route with consideration to the developed site 16 Phase 02 18
6 Summary and next steps 20 6.1 Summary 20 6.2 Key next steps 21
Tables Table 1: Table of design parameters Table 2: Phase 01 key engineering constraints (constraint numbers refer to Figure 8) Table 3: Phase 01 key engineering constraints with consideration to the developed
site (constraint numbers referring to Figure 9) Table 4: Phase 02 key engineering constraints Figures Figure 1: Edmonton EcoPark Figure 2: Discussed wayleaves between LVHN and NLWA, August 2014 Figure 3: Assumed DH pipe trench. Source: Example Specification for DH
Connection, Cofely, 2014 Figure 4: DHEC DH pipe in/out location Figure 5: Route for the LVHN pipework leaving the Edmonton EcoPark from the
DHEC

Page 2 AD05.06 Appendix D | Issue | August 2015 | Arup
Figure 6: ERF DH pipe in/out location Figure 7: Coordination of DH pipes within access roads (indicative, not to scale) Figure 8: Phase 01 constraints plan (numbers as per Section 0) Figure 9: Phase 01 route with consideration to the developed site (numbers as per
Section 5) Figure 10: Phase 02 constraints plan (numbers as per Section 0)
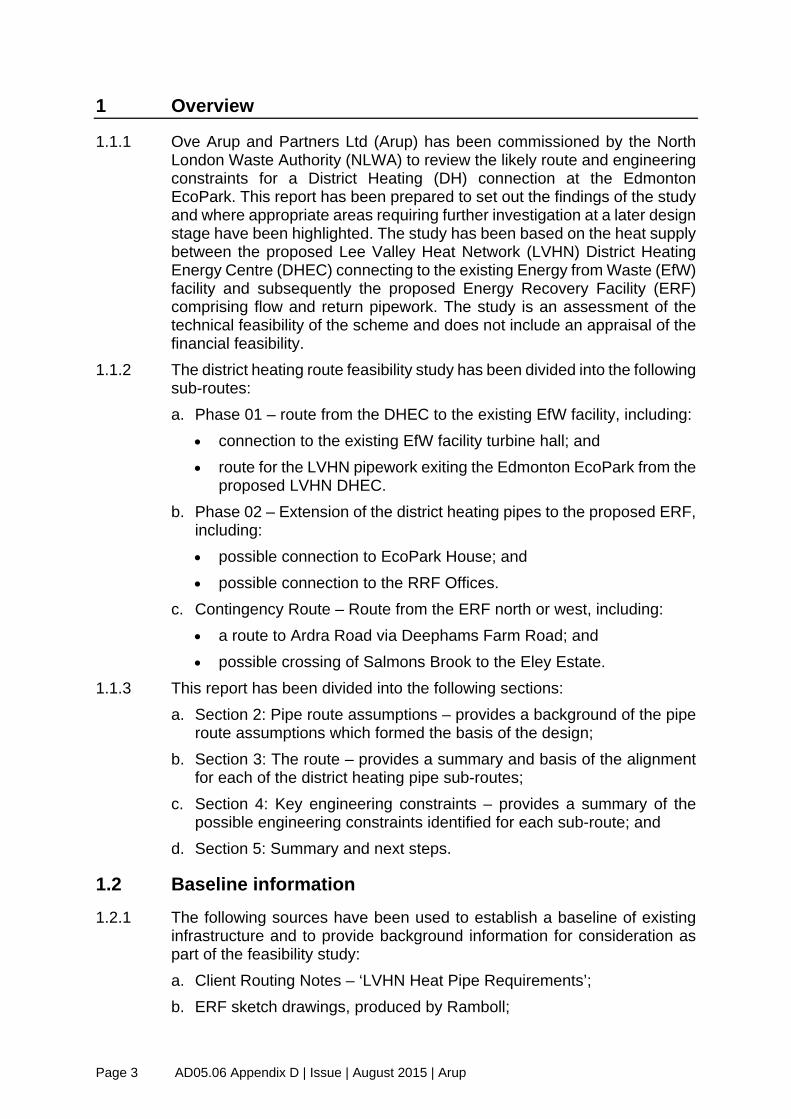
Page 3 AD05.06 Appendix D | Issue | August 2015 | Arup
1 Overview
1.1.1 Ove Arup and Partners Ltd (Arup) has been commissioned by the North London Waste Authority (NLWA) to review the likely route and engineering constraints for a District Heating (DH) connection at the Edmonton EcoPark. This report has been prepared to set out the findings of the study and where appropriate areas requiring further investigation at a later design stage have been highlighted. The study has been based on the heat supply between the proposed Lee Valley Heat Network (LVHN) District Heating Energy Centre (DHEC) connecting to the existing Energy from Waste (EfW) facility and subsequently the proposed Energy Recovery Facility (ERF) comprising flow and return pipework. The study is an assessment of the technical feasibility of the scheme and does not include an appraisal of the financial feasibility.
1.1.2 The district heating route feasibility study has been divided into the following sub-routes: a. Phase 01 – route from the DHEC to the existing EfW facility, including:
connection to the existing EfW facility turbine hall; and route for the LVHN pipework exiting the Edmonton EcoPark from the
proposed LVHN DHEC. b. Phase 02 – Extension of the district heating pipes to the proposed ERF,
including: possible connection to EcoPark House; and possible connection to the RRF Offices.
c. Contingency Route – Route from the ERF north or west, including: a route to Ardra Road via Deephams Farm Road; and possible crossing of Salmons Brook to the Eley Estate.
1.1.3 This report has been divided into the following sections: a. Section 2: Pipe route assumptions – provides a background of the pipe
route assumptions which formed the basis of the design; b. Section 3: The route – provides a summary and basis of the alignment
for each of the district heating pipe sub-routes; c. Section 4: Key engineering constraints – provides a summary of the
possible engineering constraints identified for each sub-route; and d. Section 5: Summary and next steps.
1.2 Baseline information 1.2.1 The following sources have been used to establish a baseline of existing
infrastructure and to provide background information for consideration as part of the feasibility study: a. Client Routing Notes – ‘LVHN Heat Pipe Requirements’; b. ERF sketch drawings, produced by Ramboll;
Page 4 AD05.06 Appendix D | Issue | August 2015 | Arup
c. LVHN markup plans; d. Grimshaw sketch route plans, dated 06.03.15 , ref:
‘14047_GAL_00_0016’ and ‘14047_GAL_00_0402’; e. Wayleave sketch drawing illustrating discussed wayleaves between
LVHN & NLWA, dated August 2014; f. NLWA ‘Southern Access Bridge – Optioneering Report’, produced by
Amec Foster Wheeler, dated May 2015; and, g. Amec existing and proposed services drawings, including:
35180_LON_CVD_002_C; 35180_LON_CVD_003_E; 35180_LON_CVD_004_D; 35180_LON_CVD_005_X; 35180_LON_CVD_006_X; 35180_LON_CVD_010_C; 35180_LON_CVD_012_E; 35180_LON_CVD_013_C; and 35180_LON_CVD_014_B;

Page 5 AD05.06 Appendix D | Issue | August 2015 | Arup
1.3 Core study area 1.3.1 The study area used for this assessment is illustrated on Figure 1. This
study covers the extent of the Edmonton EcoPark and is therefore a smaller area than the DCO Application Site area boundary.
Figure 1: Edmonton EcoPark

Page 6 AD05.06 Appendix D | Issue | August 2015 | Arup
2 Pipe route assumptions
2.1.1 The following key parameters have been adopted as part of this Routing Study, summarised by the bulleted points below, Table 1, and Figures 2 and 3: a. flow and return pipework with same diameters; b. the pipes require a minimum separation of 600mm from other utilities
and ideally not adjacent to water or electricity, source: ‘Client Routing Notes – LVHN Heat Pipe Requirements’;
c. the pipes would have a general depth of 750mm from the top of the pipe to the finished road/surface, source: ‘Client Routing Notes – LVHN Heat Pipe Requirements’;
d. pipes are assumed to route below ground except where ditch crossings are required;
e. two pipe sizes have been identified for the primary pipe route. Case 1 (800mmID) represents the assumed pipe size required for a maximum heat export case, while Case 2 (500mmID) represents the assumed pipe size for the 35MWth heat export connection to the DHEC. For the purposes of this study, the maximum heat scenario (Case 1) has been adopted;
f. a secondary pipe size is chosen for the connection of the EfW facility to supply 12MWth in accordance with the Decentralised Energy Project Delivery Unit (DEPDU) heat-off take study;
g. pipe sizes were calculated based on heat export capacity for water filled pipes with a temperature differential of 40 Kelvin between flow and return pipework and linear pressure drops of below 250Pa/m. Pipe sizes would vary based on detailed design parameters or if steam pipes were adopted; and
h. the adopted wayleaves are illustrated on Figure 2. A 1.5m zone of influence is shown either side of the pipes which precludes any services being buried within that zone. An additional 3.5m clear zone is shown to one side which allows for a clear space above ground for mechanical plant to access the pipes. It is assumed that other buried services are permitted within the mechanical plant access zone.

Page 7 AD05.06 Appendix D | Issue | August 2015 | Arup
Table 1: Table of design parameters
Pipe network Primary (Case 1) Primary (Case 2) Secondary (EfW)
Pipe size (mm) (ID) 450 350 200
Pipe size (mm) (OD) - assumed 600 500 350
Pipe cover (mm) 750 750 750
Trench width (mm) - assumed 1750 1550 1250
Trench depth (mm) - assumed 1450 1350 1200
Easement width (mm) - assumed 8250 8050 7750
Heat export capacity 80MWth 35MWth 12MWth
Figure 2: Discussed wayleaves between LVHN and NLWA, August 2014
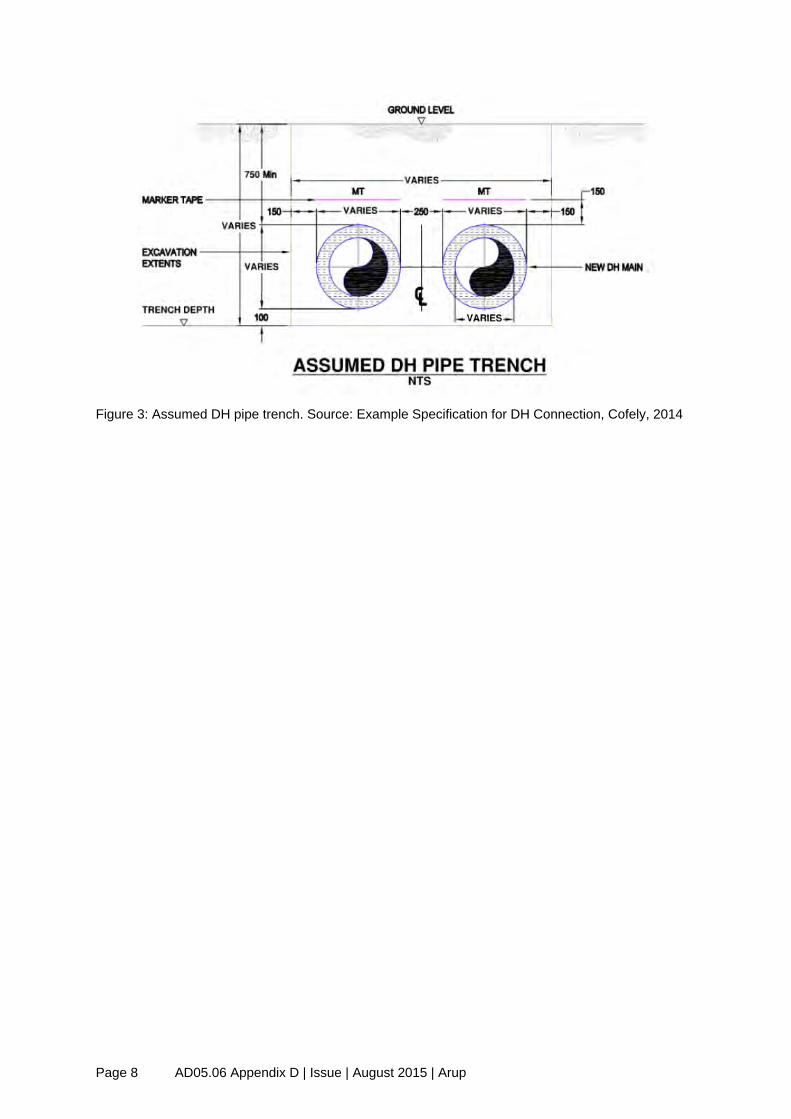
Page 8 AD05.06 Appendix D | Issue | August 2015 | Arup
Figure 3: Assumed DH pipe trench. Source: Example Specification for DH Connection, Cofely, 2014

Page 9 AD05.06 Appendix D | Issue | August 2015 | Arup
3 The Route 3.1 Phase 01 – Route from the DHEC to existing EfW facility 3.1.1 The first phase route forms the connection from the DHEC to the existing
EfW facility. The pipes are proposed to exit the DHEC from the eastern extents of the building as indicated on Figure 4. It is then proposed to route the pipes below ground along the eastern boundary of the Edmonton EcoPark following the existing access road. Previous studies have indicated that the western boundary is heavily congested with utility connections, particularly along the bank of Salmons Brook, which limits any available space to route the DH pipes.
Figure 4: DHEC DH pipe in/out location
Source – LVHN – NLWA discussions 2014
Connection to EfW facility turbines
3.1.2 The DH pipes are proposed to connect to the turbine hall located within the EfW facility. Two options have been identified to make this connection: Option 1 – Enter the turbine hall via the eastern façade which may
require a continuation of the DH pipes within the building to reach the south-west corner of the turbine hall. The feasibility of routing the DH pipes within the turbine hall requires confirmation; and
Option 2 – Route the DH pipes below ground adjacent to the southern façade of the turbine hall and enter the building at the south-west corner.
3.1.3 An illustration of the abovementioned routes is shown on Figure 8.
Route for the proposed LVHN pipework leaving the Edmonton EcoPark from the DHEC
3.1.4 As part of the Phase 01 route, it is proposed the LVHN Main would route from the DHEC and exit the southern boundary of the Edmonton EcoPark where it would continue west along Angel Road. The Main would be required to cross Enfield Ditch which presents a number of options to make the crossing. These include:
N

Page 10 AD05.06 Appendix D | Issue | August 2015 | Arup
a. incorporate the pipes internally in the southern access bridge; b. attach the pipes to the outer southern access bridge structure which
could consider a number of options including feeding the pipes in ducts which are attached to the bridge by hangers or attaching an I-beam to the bridge structure to support the pipes;
c. provide a standalone pipe bridge adjacent to the southern access bridge; or
d. immerse the pipes below Enfield Ditch river bed level. 3.1.5 For each option, a number of considerations are required to be made, which
broadly include: a. accessibility if the pipes are incorporated in the southern access bridge
or immersed below Enfield Ditch river bed level; b. spatial requirements of the pipes if they were incorporated in the
southern access bridge and whether the bridge deck could accommodate the pipes cover requirements;
c. coordination against other utilities, including other existing pipe crossings located adjacent to the bridge;
d. approvals, e.g. Environmental Agency (EA) requirements for specified flood levels;
e. protection measures if the pipes are exposed; and f. phasing for any future works planned in the area.
3.1.6 Reference to the NLWA ‘Southern Access Bridge – Optioneering Report’, produced by Amec Foster Wheeler, outlines proposals to widen the southern access bridge. This proposal could present opportunities to incorporate the LVHN Main within the widened bridge structure. Further to the above mentioned considerations, a key factor which could affect the feasibility of utilising the southern access bridge is the timing of the bridge widening which would need to coincide with the installation of the LVHN Main.
3.1.7 Figure 5 illustrates the subject area.
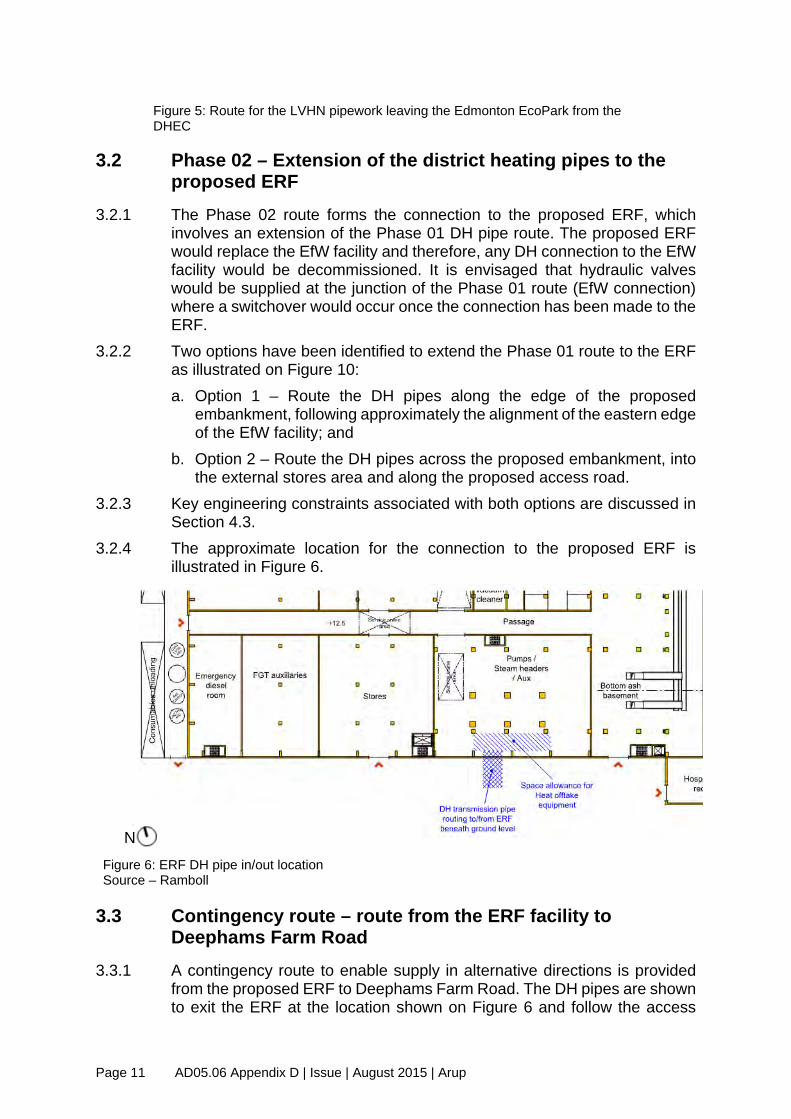
Page 11 AD05.06 Appendix D | Issue | August 2015 | Arup
Figure 5: Route for the LVHN pipework leaving the Edmonton EcoPark from the DHEC
3.2 Phase 02 – Extension of the district heating pipes to the proposed ERF
3.2.1 The Phase 02 route forms the connection to the proposed ERF, which involves an extension of the Phase 01 DH pipe route. The proposed ERF would replace the EfW facility and therefore, any DH connection to the EfW facility would be decommissioned. It is envisaged that hydraulic valves would be supplied at the junction of the Phase 01 route (EfW connection) where a switchover would occur once the connection has been made to the ERF.
3.2.2 Two options have been identified to extend the Phase 01 route to the ERF as illustrated on Figure 10: a. Option 1 – Route the DH pipes along the edge of the proposed
embankment, following approximately the alignment of the eastern edge of the EfW facility; and
b. Option 2 – Route the DH pipes across the proposed embankment, into the external stores area and along the proposed access road.
3.2.3 Key engineering constraints associated with both options are discussed in Section 4.3.
3.2.4 The approximate location for the connection to the proposed ERF is illustrated in Figure 6.
Figure 6: ERF DH pipe in/out location Source – Ramboll
3.3 Contingency route – route from the ERF facility to Deephams Farm Road
3.3.1 A contingency route to enable supply in alternative directions is provided from the proposed ERF to Deephams Farm Road. The DH pipes are shown to exit the ERF at the location shown on Figure 6 and follow the access
N
Page 12 AD05.06 Appendix D | Issue | August 2015 | Arup
roads adjacent to the ERF and leading to Deephams Farm Road. In addition, a possible crossing over Salmons Brook is shown to connect to the Eley Estate. An illustration of the abovementioned routes are shown on Figure 10.

Page 13 AD05.06 Appendix D | Issue | August 2015 | Arup
4 Key engineering constraints
4.1.1 A review of possible engineering constraints based on the completed Project for the abovementioned routes has been undertaken and are delineated with a number on Figure 8, Figure 9 and Figure 10: a. Figure 8 shows the existing Edmonton EcoPark and engineering
constraints associated with the Phase 01 DH pipe route; b. Figure 9 shows the Phase 01 route with consideration to the developed
Edmonton EcoPark; and c. Figure 10 shows the redeveloped Edmonton EcoPark and engineering
constraints associated with the Phase 02 DH pipe route. 4.1.2 Where DH pipe routes are shown, the lines relate to corridors to represent
the assumed trench width +1.5m zone of influence, and 3.5m additional mechanical plant access zone as detailed in Table 2 and illustrated on Figure 2. The main thick line represents the total width of the trench and zone of influence where the outer dashed line represents the 3.5m additional mechanical plant access zone.
4.1.3 A description of the key engineering constraints corresponding to the numbered labels on the figures are as follows:
Phase 01
4.1.4 Refer to Figure 8 for the corresponding location of the numbered key engineering constraints listed in Table 2 below.
Figure 7: Coordination of DH pipes within access roads (indicative, not to scale)
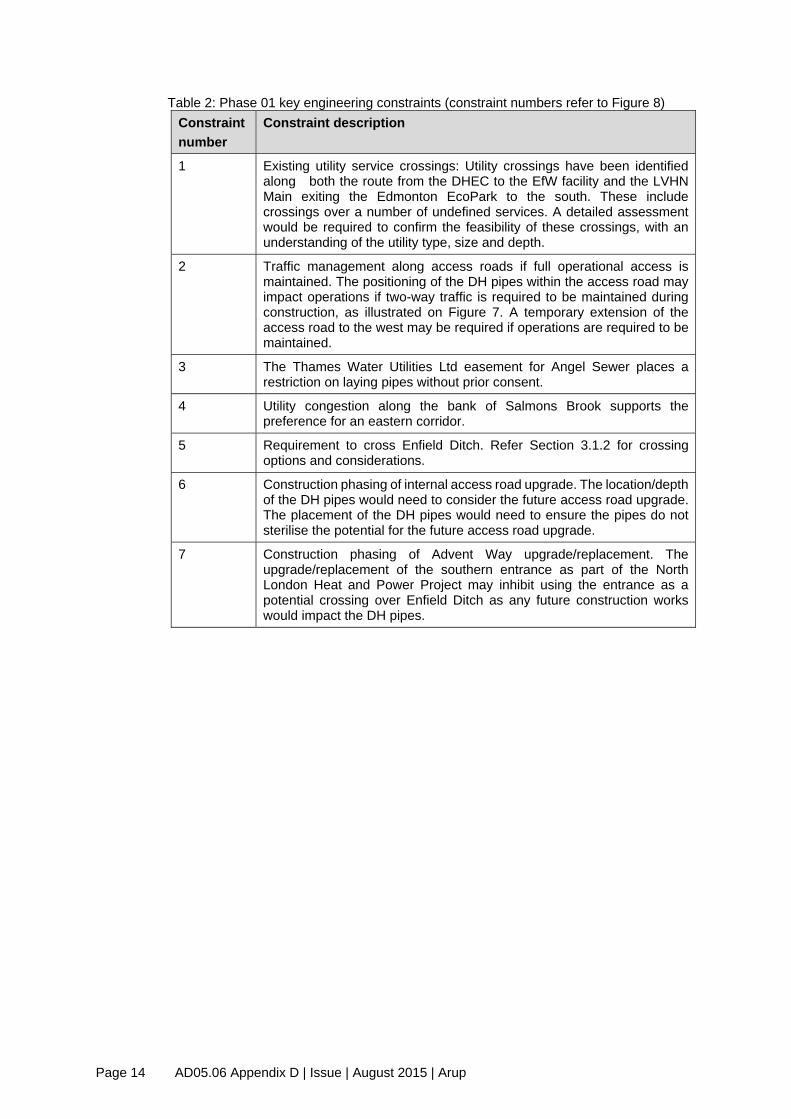
Page 14 AD05.06 Appendix D | Issue | August 2015 | Arup
Table 2: Phase 01 key engineering constraints (constraint numbers refer to Figure 8) Constraint number
Constraint description
1 Existing utility service crossings: Utility crossings have been identified along both the route from the DHEC to the EfW facility and the LVHN Main exiting the Edmonton EcoPark to the south. These include crossings over a number of undefined services. A detailed assessment would be required to confirm the feasibility of these crossings, with an understanding of the utility type, size and depth.
2 Traffic management along access roads if full operational access is maintained. The positioning of the DH pipes within the access road may impact operations if two-way traffic is required to be maintained during construction, as illustrated on Figure 7. A temporary extension of the access road to the west may be required if operations are required to be maintained.
3 The Thames Water Utilities Ltd easement for Angel Sewer places a restriction on laying pipes without prior consent.
4 Utility congestion along the bank of Salmons Brook supports the preference for an eastern corridor.
5 Requirement to cross Enfield Ditch. Refer Section 3.1.2 for crossing options and considerations.
6 Construction phasing of internal access road upgrade. The location/depth of the DH pipes would need to consider the future access road upgrade. The placement of the DH pipes would need to ensure the pipes do not sterilise the potential for the future access road upgrade.
7 Construction phasing of Advent Way upgrade/replacement. The upgrade/replacement of the southern entrance as part of the North London Heat and Power Project may inhibit using the entrance as a potential crossing over Enfield Ditch as any future construction works would impact the DH pipes.

Page 15 AD05.06 Appendix D | Issue | August 2015 | Arup
Figure 8: Phase 01 constraints plan (numbers as per Section 0)

Page 16 AD05.06 Appendix D | Issue | August 2015 | Arup
5 Phase 01 route with consideration to the developed site
5.1.1 Refer to Figure 9 for the corresponding location of the numbered key engineering constraints listed in Table 3 below. Table 3: Phase 01 key engineering constraints with consideration to the developed site (constraint numbers referring to Figure 9)
Constraintnumber
Constraint description
8 Construction coordination for internal access road upgrade and RRF foundation excavation. Temporary protection measures may be required to ensure the DH pipes are not impacted during the internal access road upgrade and RRF foundation excavation construction. Furthermore, the placement of the DH pipes would need to ensure the pipes do not sterilise the future construction of the RRF. The depths of the DH pipes are expected to be sufficient to not encroach on future pavement works, however, a temporary cover slab may be required to ensure construction traffic loadings do not impact the pipes.
9 Construction coordination for proposed car park. Similarly, temporary protection measures may be required to ensure the DH pipes are not impacted during the car park construction.
19 Consultation required with Thames Water Utilities Ltd to obtain a build over agreement for the DHEC building over Angel Sewer.
20 DHEC building to consider the diversion of Angel Sewer and associated wayleaves around the diversion area.
21 Proposed location of the new Angel Sewer access manhole. The proposed location would need to coordinate against the planned location of the LVHN pipework exiting the DHEC.

Page 17 AD05.06 Appendix D | Issue | August 2015 | Arup
Figure 9: Phase 01 route with consideration to the developed site (numbers as per Section 5)

Page 18 AD05.06 Appendix D | Issue | August 2015 | Arup
Phase 02
5.1.2 Refer to Figure 10 for the corresponding location of the numbered key engineering constraints listed in Table 4 below. Table 4: Phase 02 key engineering constraints
Constraint number
Constraint description
10 Option 1 route along the edge of the embankment - Phasing issues with respect to the EfW demolition as the DH pipes are required to be installed at an earlier stage. The positioning of the DH pipes should be coordinated such that the subsequent demolition of the EfW facility does not impact the DH pipes.
11 Option 2 route through the embankment – Access and loading issues. The DH pipes would follow at grade from the toe of the embankment, passing below the out ramp retaining wall and into the external stores area. Along the length of the embankment, access to the DH pipes would not be achievable due to the depth of cover over the pipes which is proposed to be in excess of 5.0m at the top the embankment based on current masterplan levels. This also presents loading issues where the DH pipes may require some form of protection such as a pipe tunnel or cover slab. Access along the length of the external stores area is expected to be achievable as items stored would be of a semi-temporary nature, however, consideration is required for weight loading over the pipes if heavy structures (e.g. 2-storey portacabins) are placed.
12 Existing services to be retained are required to be confirmed along proposed routes. The extent of retained services is currently under development by Amec. Current proposed utilities are shown on the western boundary of the Edmonton EcoPark only. A detailed assessment would be required for any existing service crossings along the DH pipe route to confirm the feasibility of these crossings, with an understanding of the utility type, size and depth.
13 The Thames Water Utilities Ltd easement for Angel Sewer places a restriction on laying pipes without prior consent.
14 Utility congestion along the bank of Salmons Brook.
15 The need to construct a pipe bridge crossing over Salmons Brook for the possible connection to the Eley Estate. The level of the soffit of the pipe bridge would need to consider any clearance requirements for the waterway.
16 Pipe bridge crossing over Enfield Ditch for the possible connection of EcoPark House to the network. The level of the soffit of the pipe bridge would need to consider any clearance requirements for the waterway.
17 Utility coordination. The DH pipe route is shown to run parallel with the proposed raw water main and other existing retained utilities, i.e. Ø200mm Thames Water main and data cables. In addition, a cooling water main pipe may be proposed in the vicinity. The placement of the DH pipes should be coordinated such that minimum clearances and clear zones to the DH pipes are provided against other utilities.
18 Structural coordination for any foundations associated with the RRF Offices to avoid any clash with the possible district heating connection.

Page 19 AD05.06 Appendix D | Issue | August 2015 | Arup
Figure 10: Phase 02 constraints plan (numbers as per Section 0)

Page 20 AD05.06 Appendix D | Issue | August 2015 | Arup
6 Summary and next steps
6.1 Summary 6.1.1 A key engineering constraint associated with the Phase 01 route connecting
from the DHEC to the existing EfW facility would be the coordination of existing services and confirmation of the feasibility of these crossings with an understanding of the utility type, size and depth. Additionally, the positioning of the DH pipes along the internal access road would need to consider traffic management during construction and whether two-way traffic is required to be maintained during construction.
6.1.2 Two options have been identified to make the connection to the turbine hall located within the EfW facility. The first proposes to enter the turbine hall via the eastern façade. The route to the eastern façade crosses various existing services where the feasibility of these crossings are required to be confirmed. The second option proposes to route the DH pipes adjacent to the southern façade entering the building at the south-west corner. Similarly, this involves a series of existing service crossings which may prove to be problematic as some of the services are shown to run parallel to the DH pipes which is likely to cause spatial issues for the required clear zone widths.
6.1.3 Phase 01 also includes a southern route for the LVHN Main from the DHEC. The Main is required to cross Enfield Ditch which could consider a number of options to make the crossing. The location of the pipe crossing would need to consider the future widening of the southern access bridge and in particular the timing of the bridge widening.
6.1.4 Phase 02 involves the extension of the DH pipes to connect to the proposed ERF. Two options have been identified to make the connection. The first proposes to route the DH pipes along the edge of the proposed embankment which requires coordination to ensure the subsequent demolition of the EfW facility does not impact the DH pipes. The second option proposes to route the DH pipes across the embankment which presents access and loading issues along the length of the embankment where the depth of cover over the pipes exceeds 5.0m at the top of the embankment.
6.1.5 A contingency route is shown leading from the ERF to Deephams Farm Road which also includes a possible crossing to Eley Estate. As the proposed utilities layout including existing services to be retained are under development, an assessment is required along the proposed routes to confirm the feasibility of any service crossings.
6.1.6 Implementation of the pipework routing outlined in this study is subject to further feasibility and cost benefit analysis. For instance, connections would only be made should an agreement be reached between the NLWA and a district heating provider, or other heat customer, for the supply of heat from the existing EfW facility initially and then from the proposed ERF. The intent of the NLWA is to safeguard a pipework route to enable heat export off-site.

Page 21 AD05.06 Appendix D | Issue | August 2015 | Arup
6.2 Key next steps a. Detailed design of the district heating pipes to confirm pipe sizes; b. Agreement of the preferred route; c. Constraints and challenges associated with the selected route to be
reviewed in more detail, developing preliminary solutions to address these issues;
d. Site investigation to be undertaken along the preferred route including: a. Survey work along the extent of the preferred route including Ground
Penetration Radar survey for existing service coordination and trial pits in targeted locations; and
b. Geotechnical and contamination desk studies to be completed. e. Detailed design development of the preferred route.

document series 05
NORTH LONDON WASTE AUTHORITY
1b Berol House, 25 Ashley Road Tottenham Hale
N17 9LJ
Telephone: 020 8489 5730 Fax: 020 8365 0254
Email: [email protected]
Series 05 Technical Documents